Embed Size (px)
Citation preview

William Kessler and the TAO groupNOAA / Pacific Marine Environmental Laboratory
El Niño: How it works, how we observe it
• The normal situation in the tropical Pacific: a coupled ocean-atmosphere system
• How El Niño works
• How El Niño anomalies are communicated around the world
• How we observe and predict El Niño and its consequences
Presentation available in pdf: http://www.pmel.noaa.gov/~kessler Ÿ Latest talk
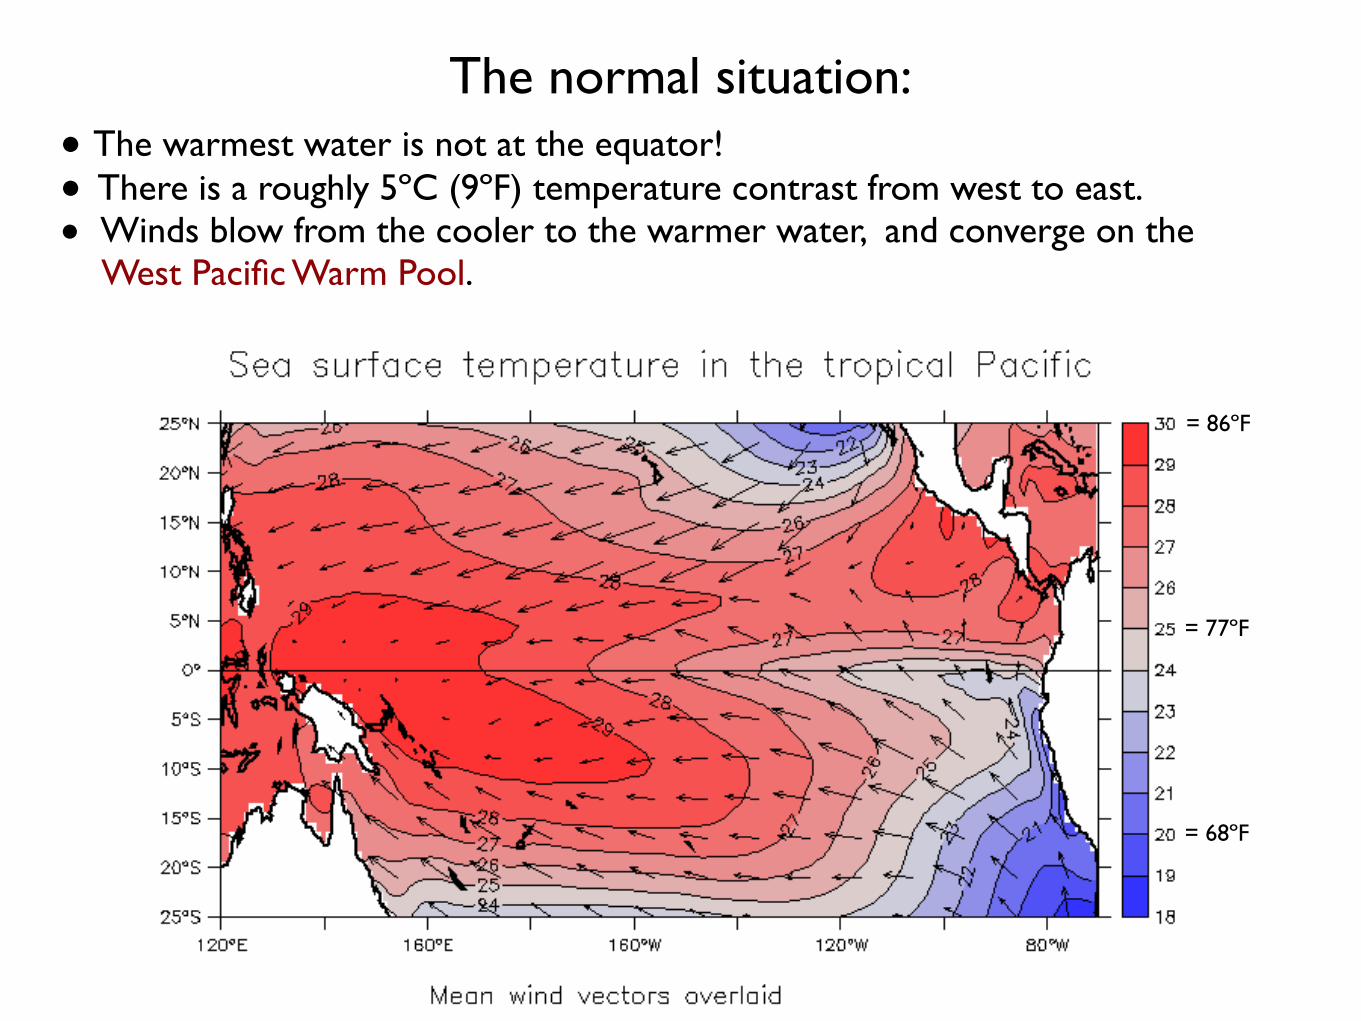
The normal situation:
● The warmest water is not at the equator! ● There is a roughly 5ºC (9ºF) temperature contrast from west to east.● Winds blow from the cooler to the warmer water, and converge on the West Pacific Warm Pool.
= 86ºF
= 77ºF
= 68ºF
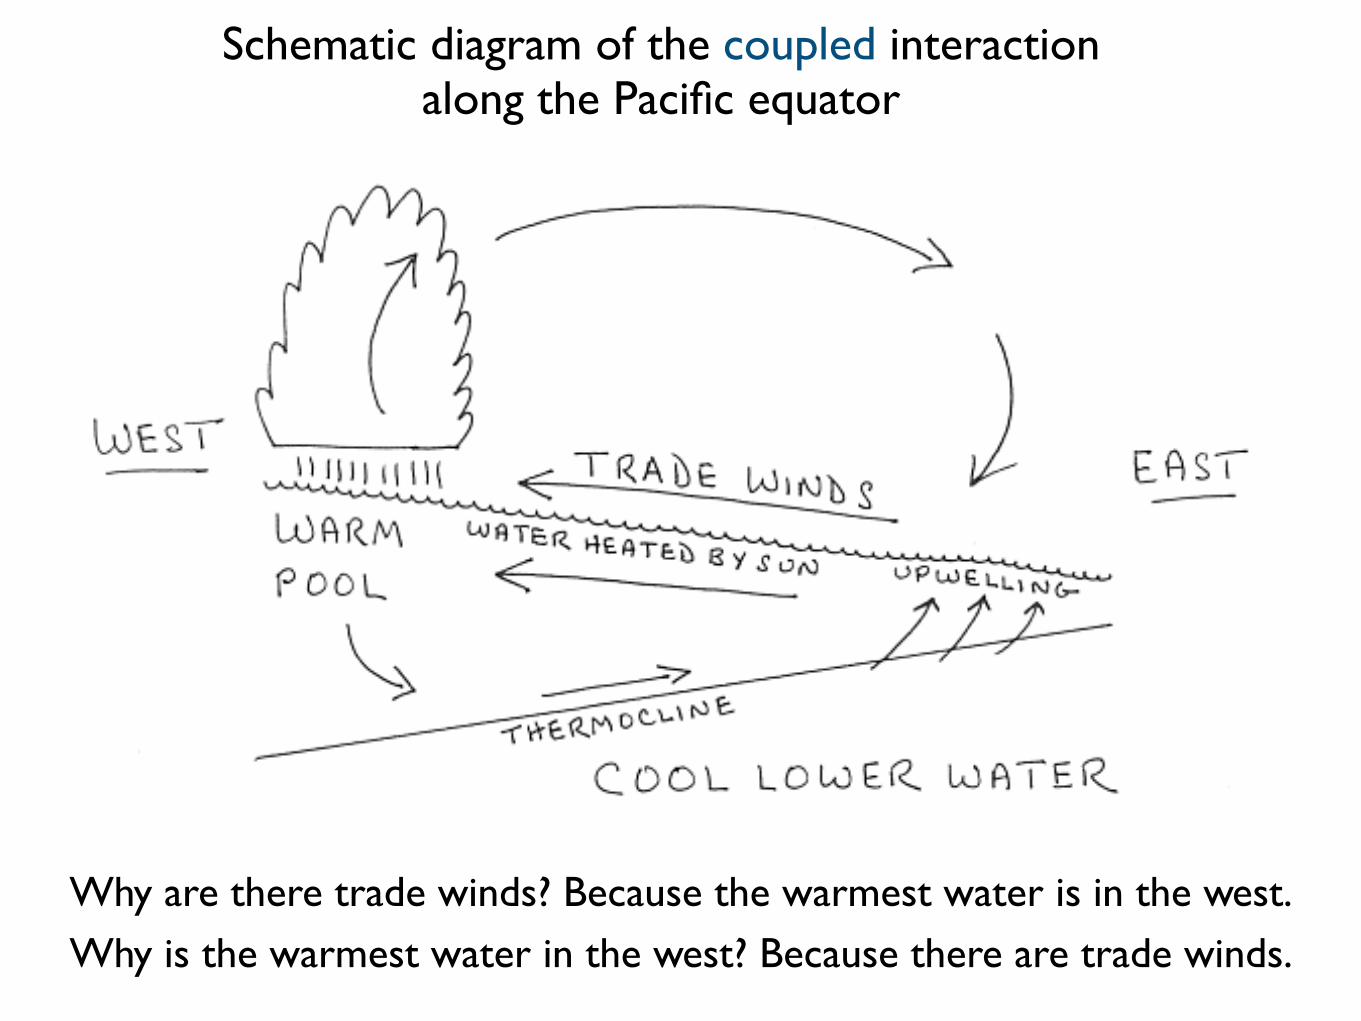
Schematic diagram of the coupled interaction along the Pacific equator
Why are there trade winds? Because the warmest water is in the west.
Why is the warmest water in the west? Because there are trade winds.
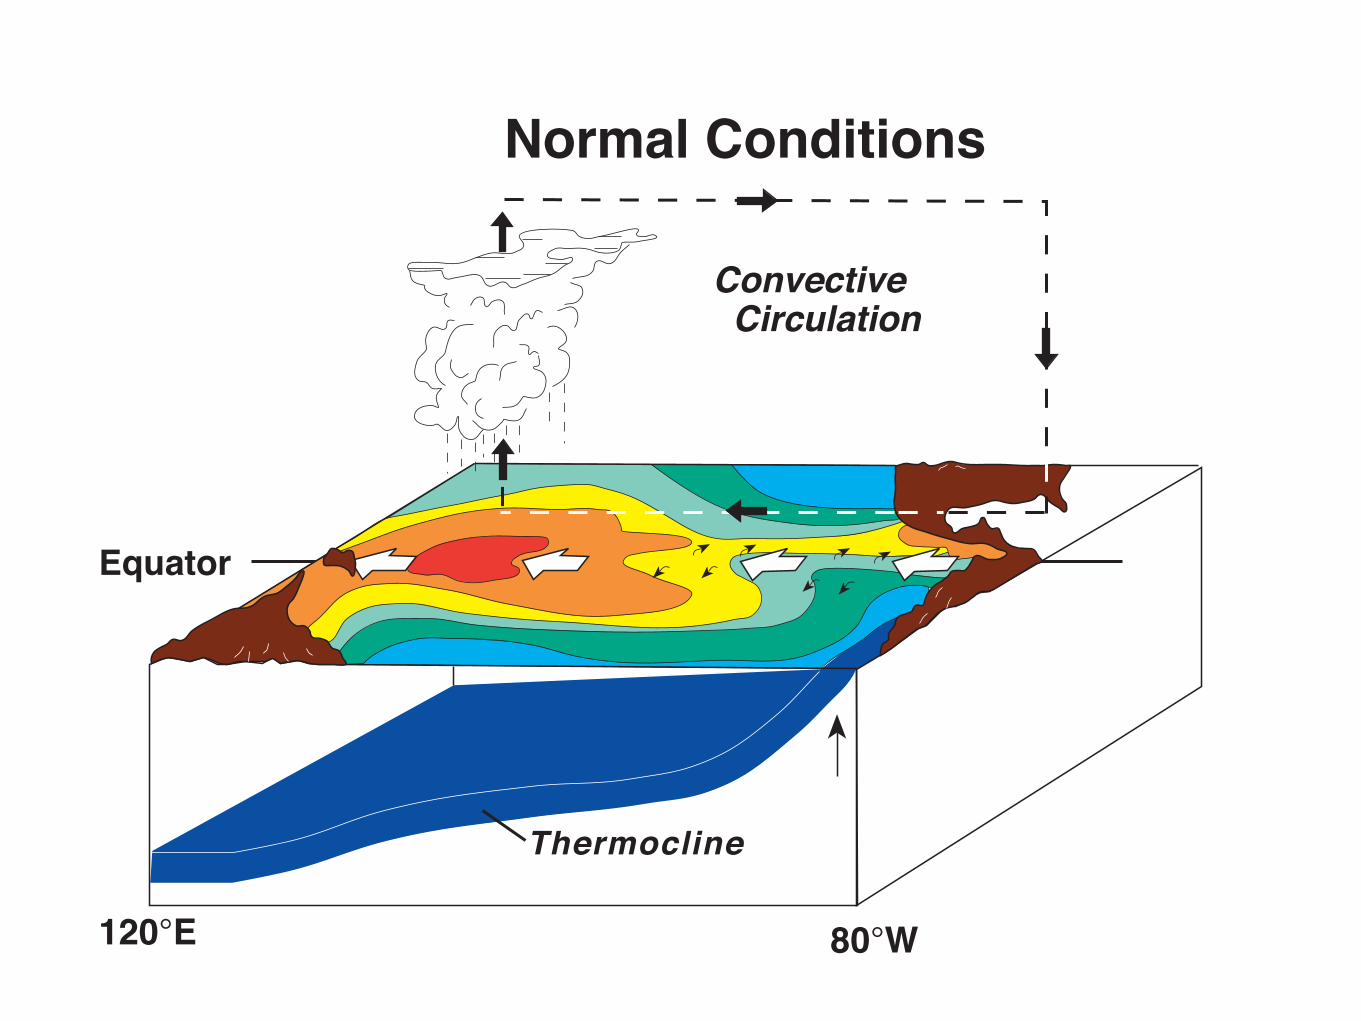
Equator
80°W
Normal Conditions
Thermocline
120°E
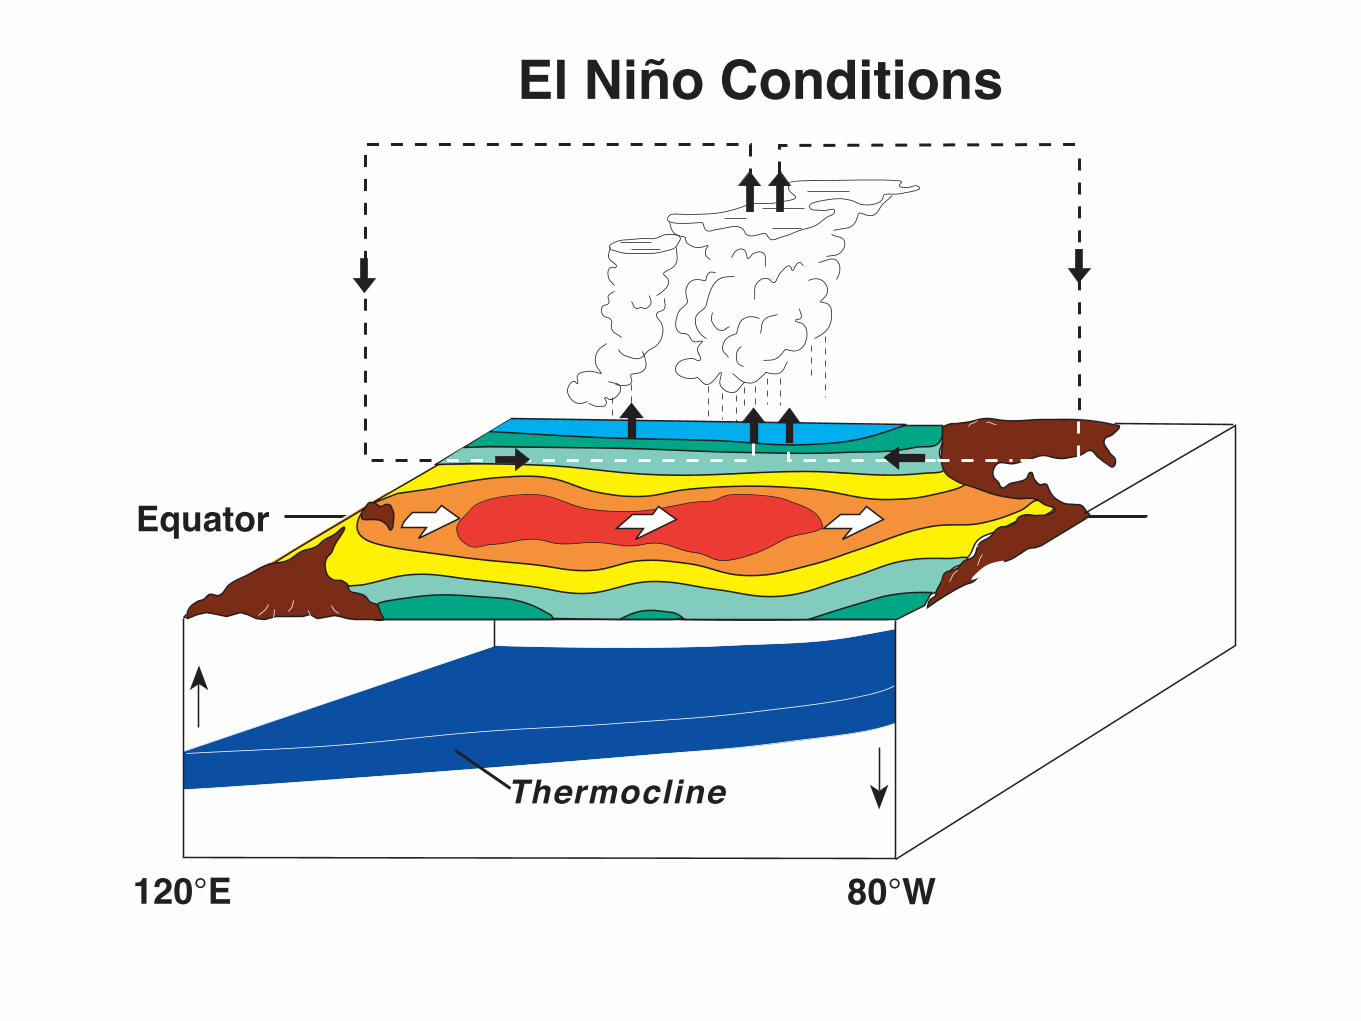
El Niño Conditions
Equator
120°E 80°W
Thermocline
Convective Circulation
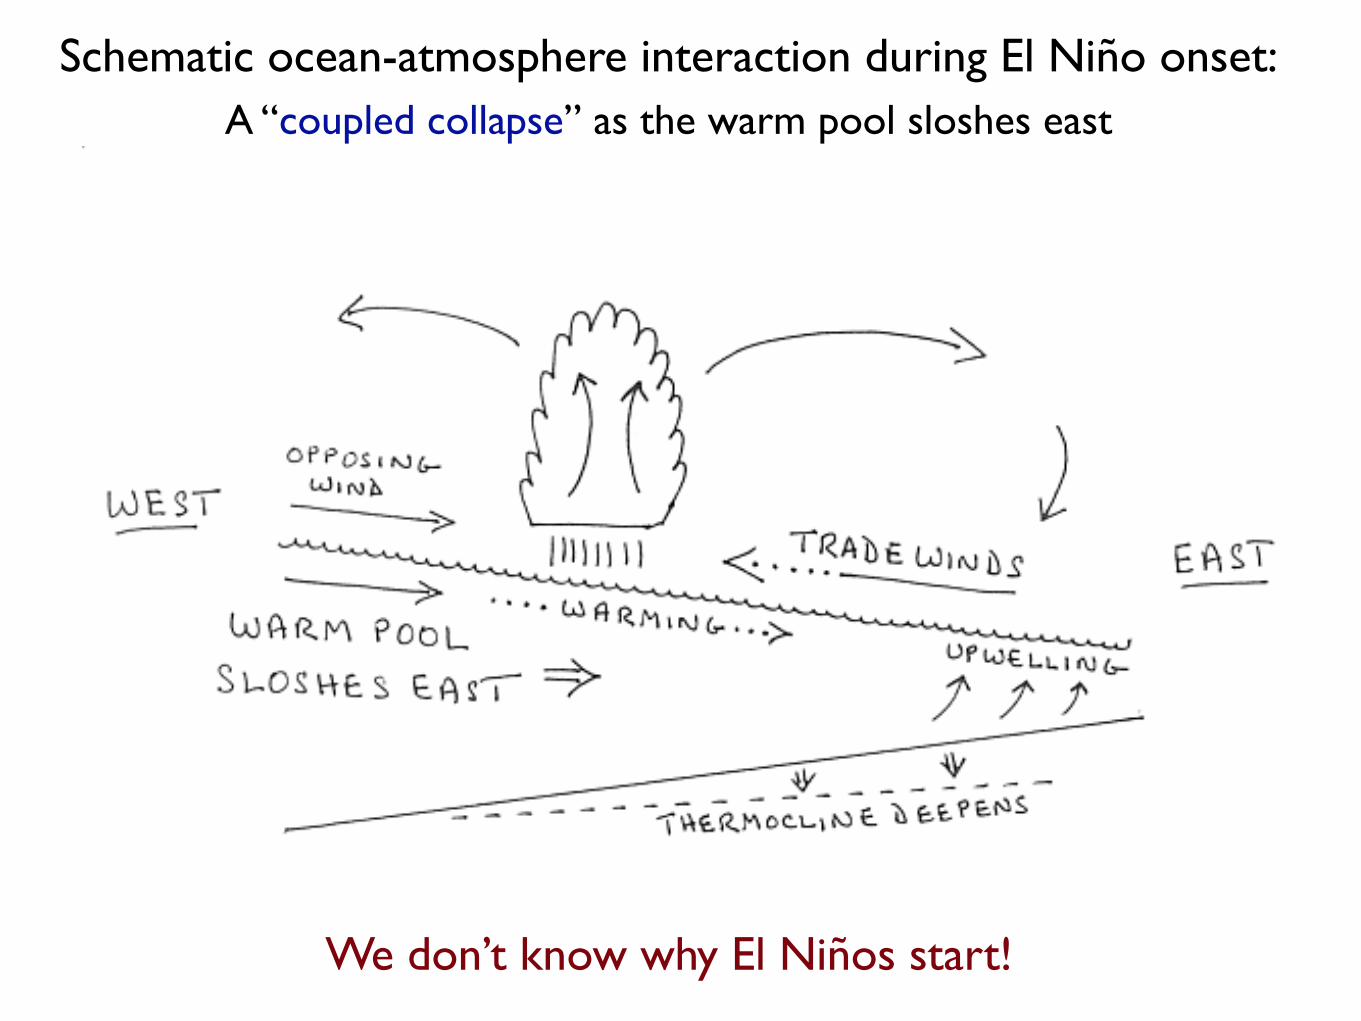
Schematic ocean-atmosphere interaction during El Niño onset:
A “coupled collapse” as the warm pool sloshes east
We don’t know why El Niños start!
Equator
80°W
Normal Conditions
Thermocline
120°E
El Niño Conditions
Equator
120°E 80°W
Thermocline
Convective Circulation
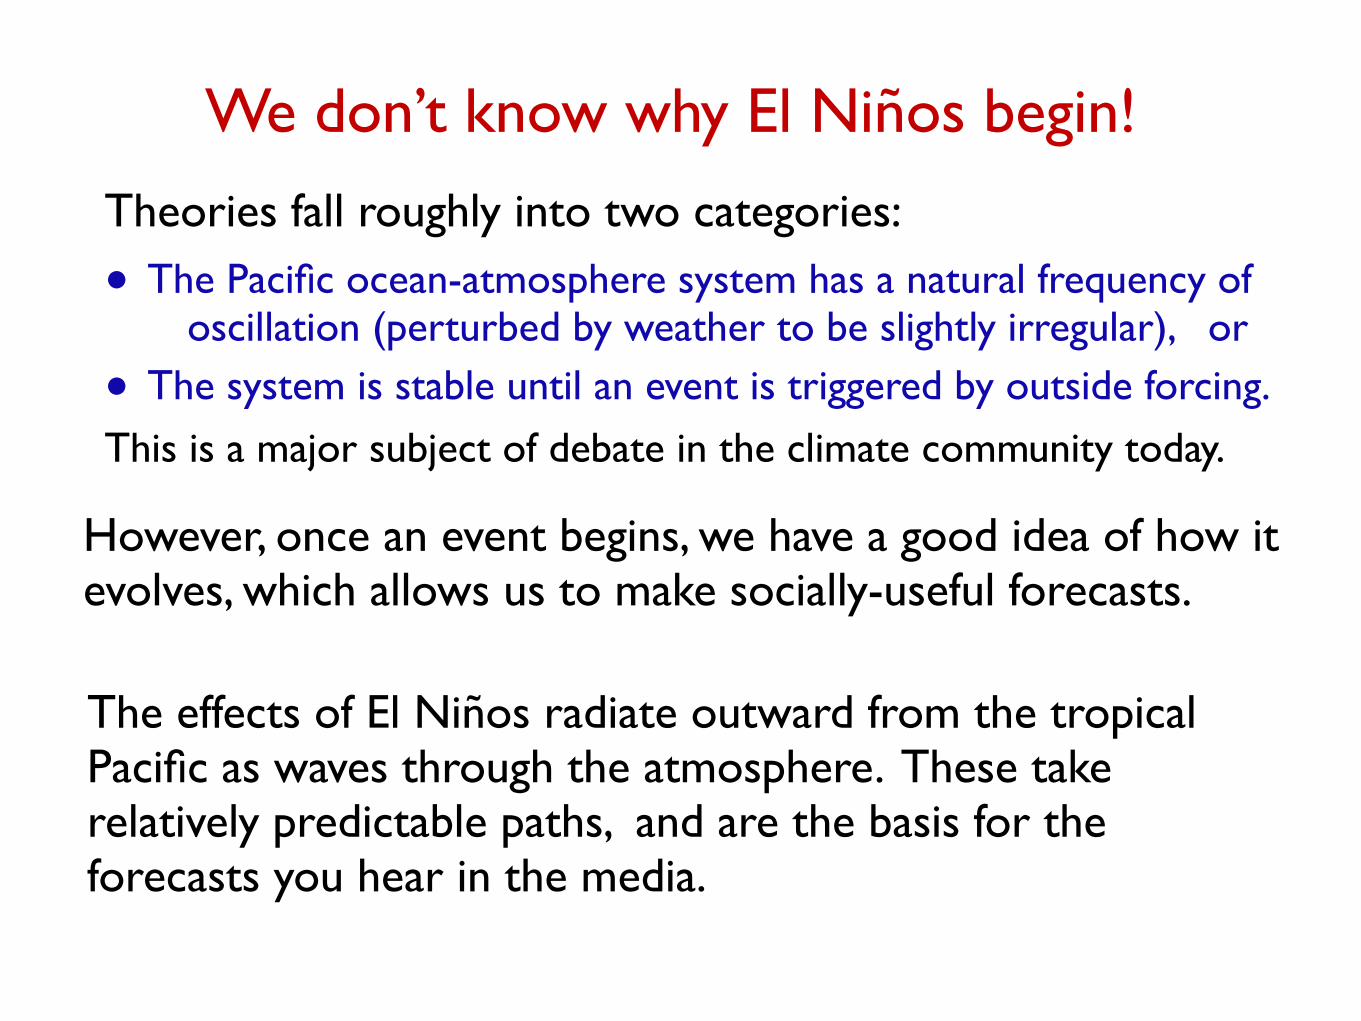
We don’t know why El Niños begin!
Theories fall roughly into two categories:
● The Pacific ocean-atmosphere system has a natural frequency of oscillation (perturbed by weather to be slightly irregular), or
● The system is stable until an event is triggered by outside forcing.
This is a major subject of debate in the climate community today.
However, once an event begins, we have a good idea of how it evolves, which allows us to make socially-useful forecasts.
The effects of El Niños radiate outward from the tropical Pacific as waves through the atmosphere. These take relatively predictable paths, and are the basis for the forecasts you hear in the media.
Why do El Niños end? Can the warm state just persist?
An El Niño event contains the seeds of its own demise. Once the warm upper layer water has sloshed east, it spreads out, poleward along the American coast and also into the off-equatorial interior ocean. (One might say that the climate “function” of El Niño events is to drain excess heat from the west Pacific warm pool.) As the equatorial upper layer drains and thins, the thermocline comes closer to the surface and begins to cool the SST again.Cool SST reestablishes the trade winds, restoring the normal pattern. Because the amount of warm water in the warm pool is limited, El Niños have a finite duration (9-12 months).
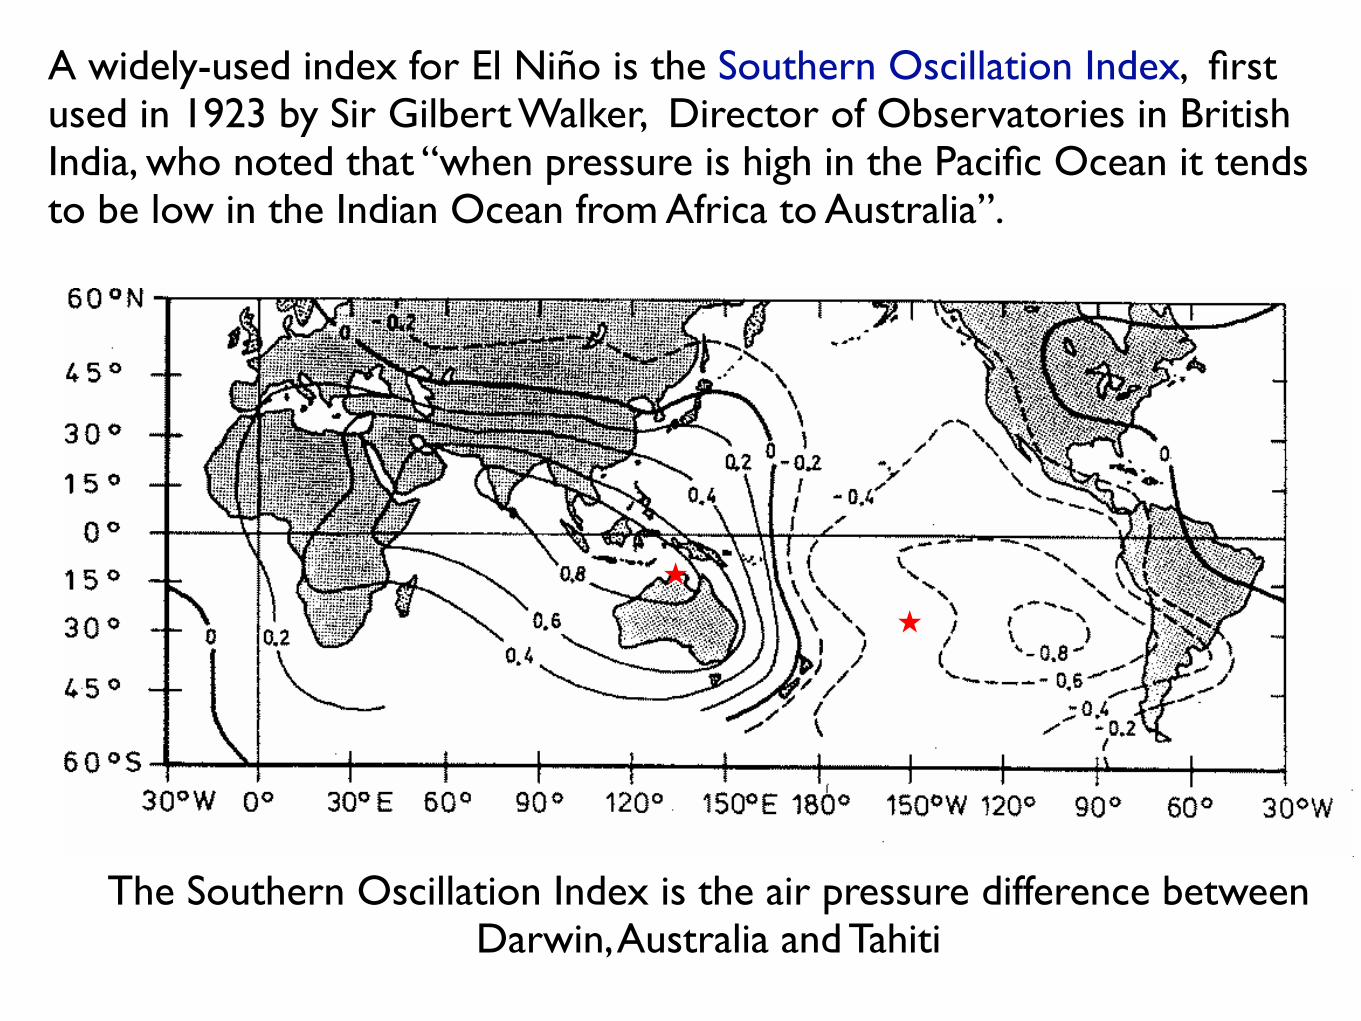
A widely-used index for El Niño is the Southern Oscillation Index, first used in 1923 by Sir Gilbert Walker, Director of Observatories in British India, who noted that “when pressure is high in the Pacific Ocean it tends to be low in the Indian Ocean from Africa to Australia”.
The Southern Oscillation Index is the air pressure difference between Darwin, Australia and Tahiti
★★
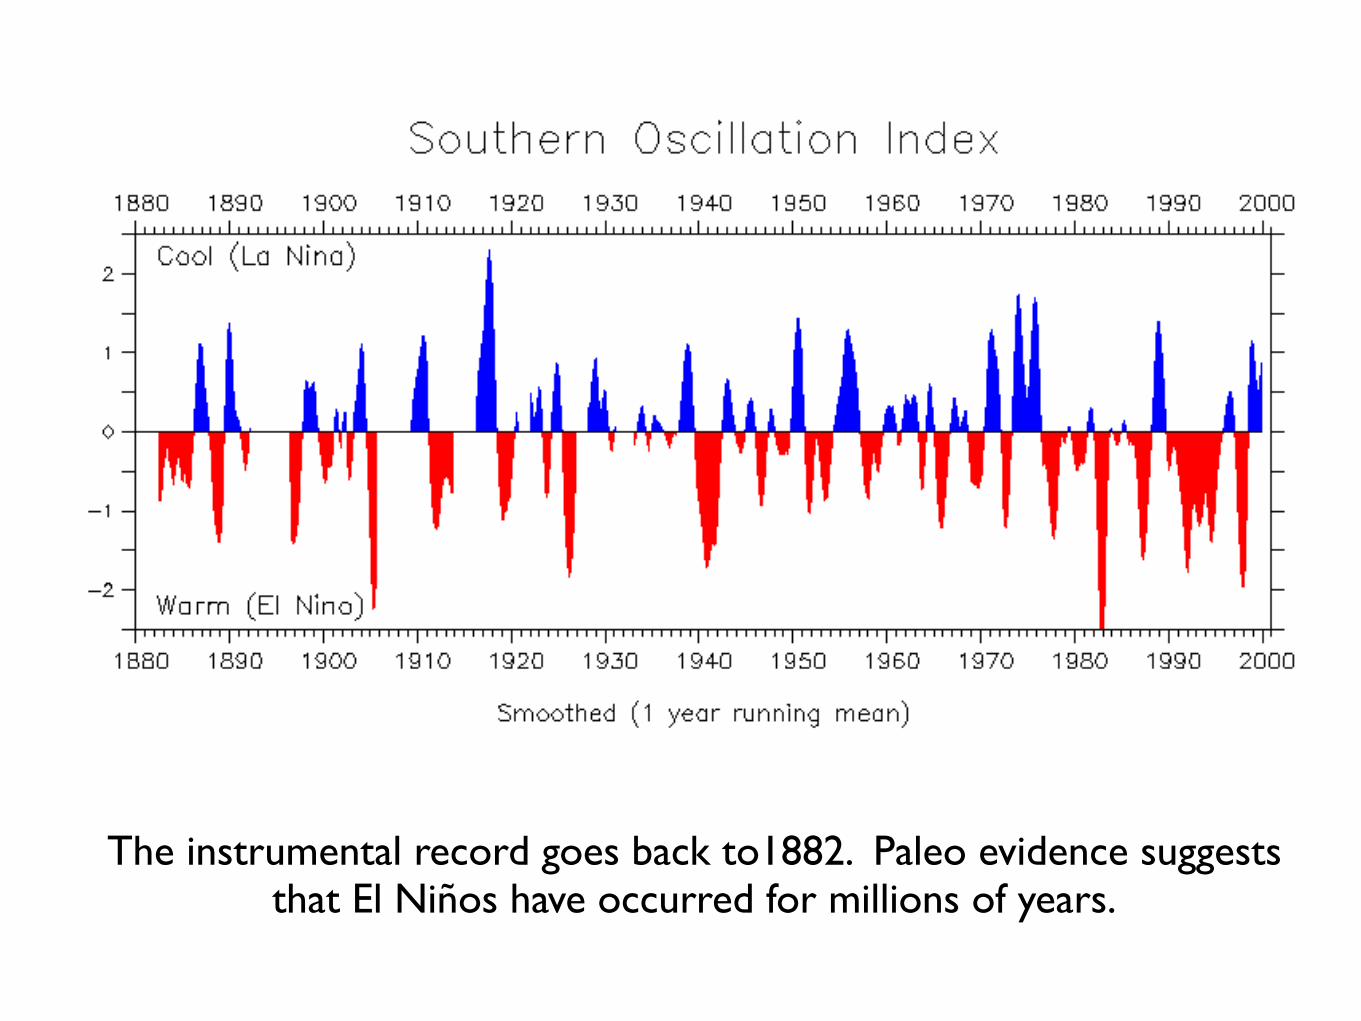
The instrumental record goes back to1882. Paleo evidence suggests that El Niños have occurred for millions of years.
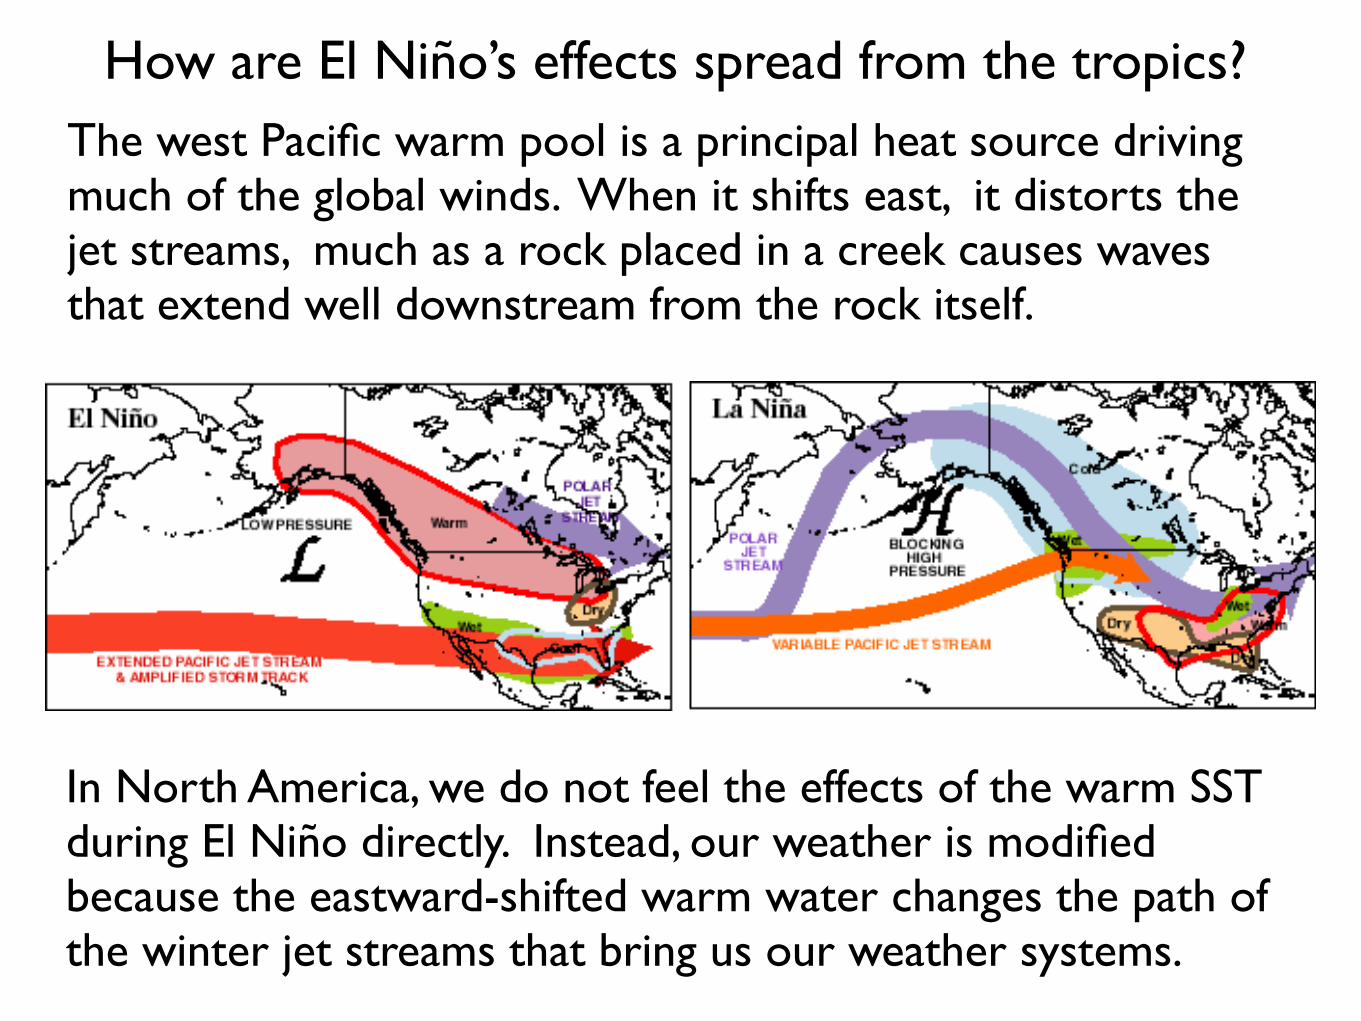
In North America, we do not feel the effects of the warm SST during El Niño directly. Instead, our weather is modified because the eastward-shifted warm water changes the path of the winter jet streams that bring us our weather systems.
The west Pacific warm pool is a principal heat source driving much of the global winds. When it shifts east, it distorts the jet streams, much as a rock placed in a creek causes waves that extend well downstream from the rock itself.
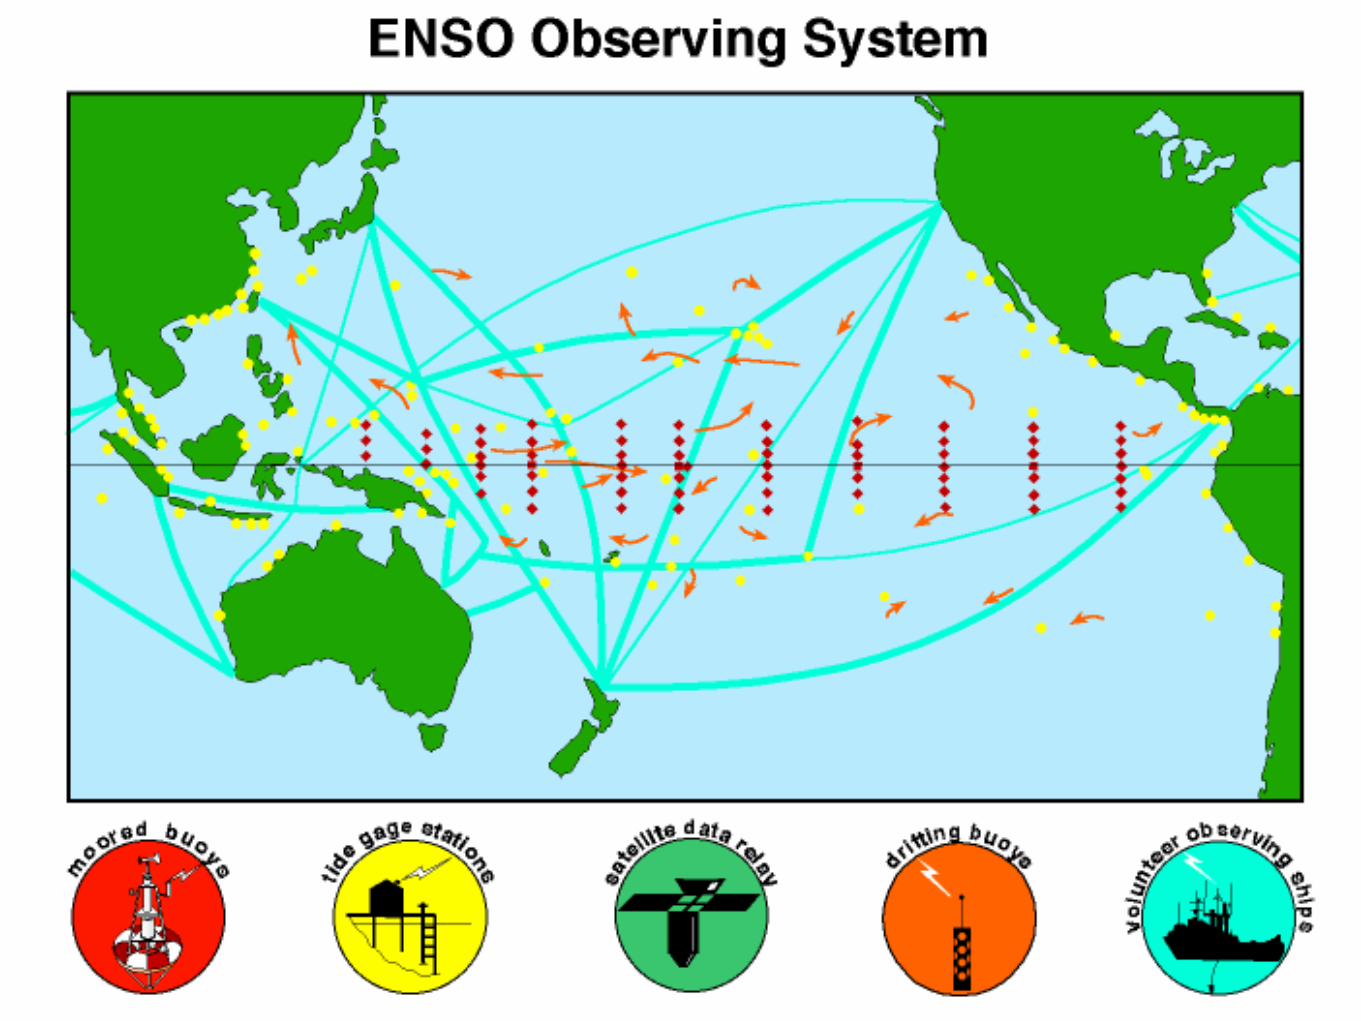
How are El Niño’s effects spread from the tropics?
ENSO Forecasting
There are two steps in forecasting the effects of El Niño:
1. Predicting SST anomalies in the tropical Pacific2. Using those SSTs to predict the effects on distant weather
Step 1 is based on having high-quality data coverage of the tropical Pacific to initialize models of the ocean-atmosphere system. To a large extent these models rely on projecting waves into the future. Such forecasts can be made for 6-9 months.
Step 2 uses ordinary weather forecast models, initialized with the predicted tropical SSTs.
Since weather is highly chaotic, a large ensemble of model runs must be made to understand the results.
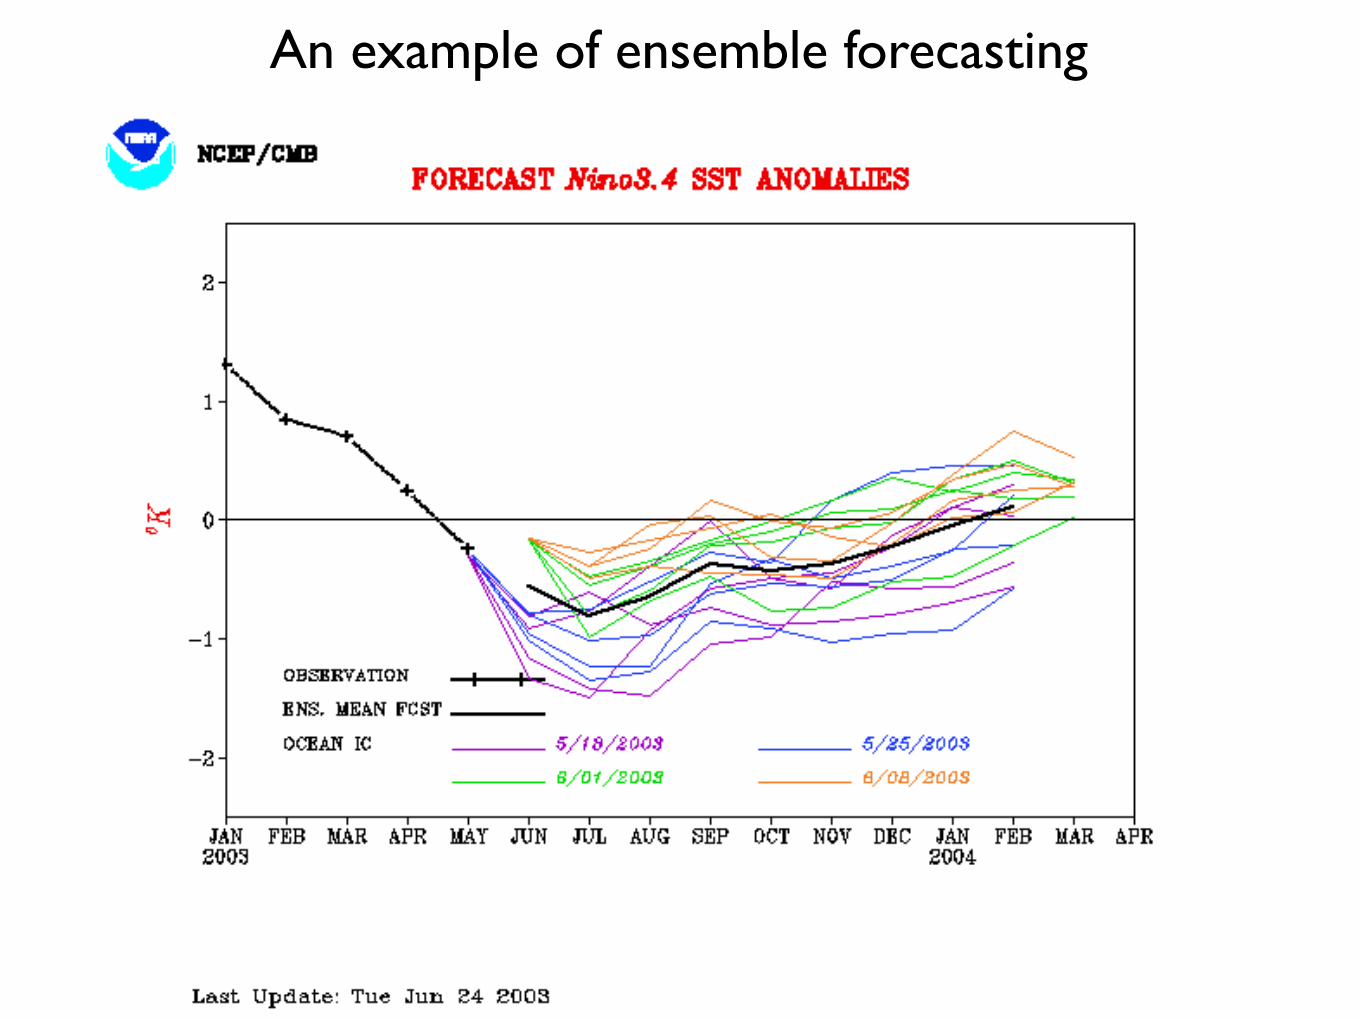
An example of ensemble forecasting
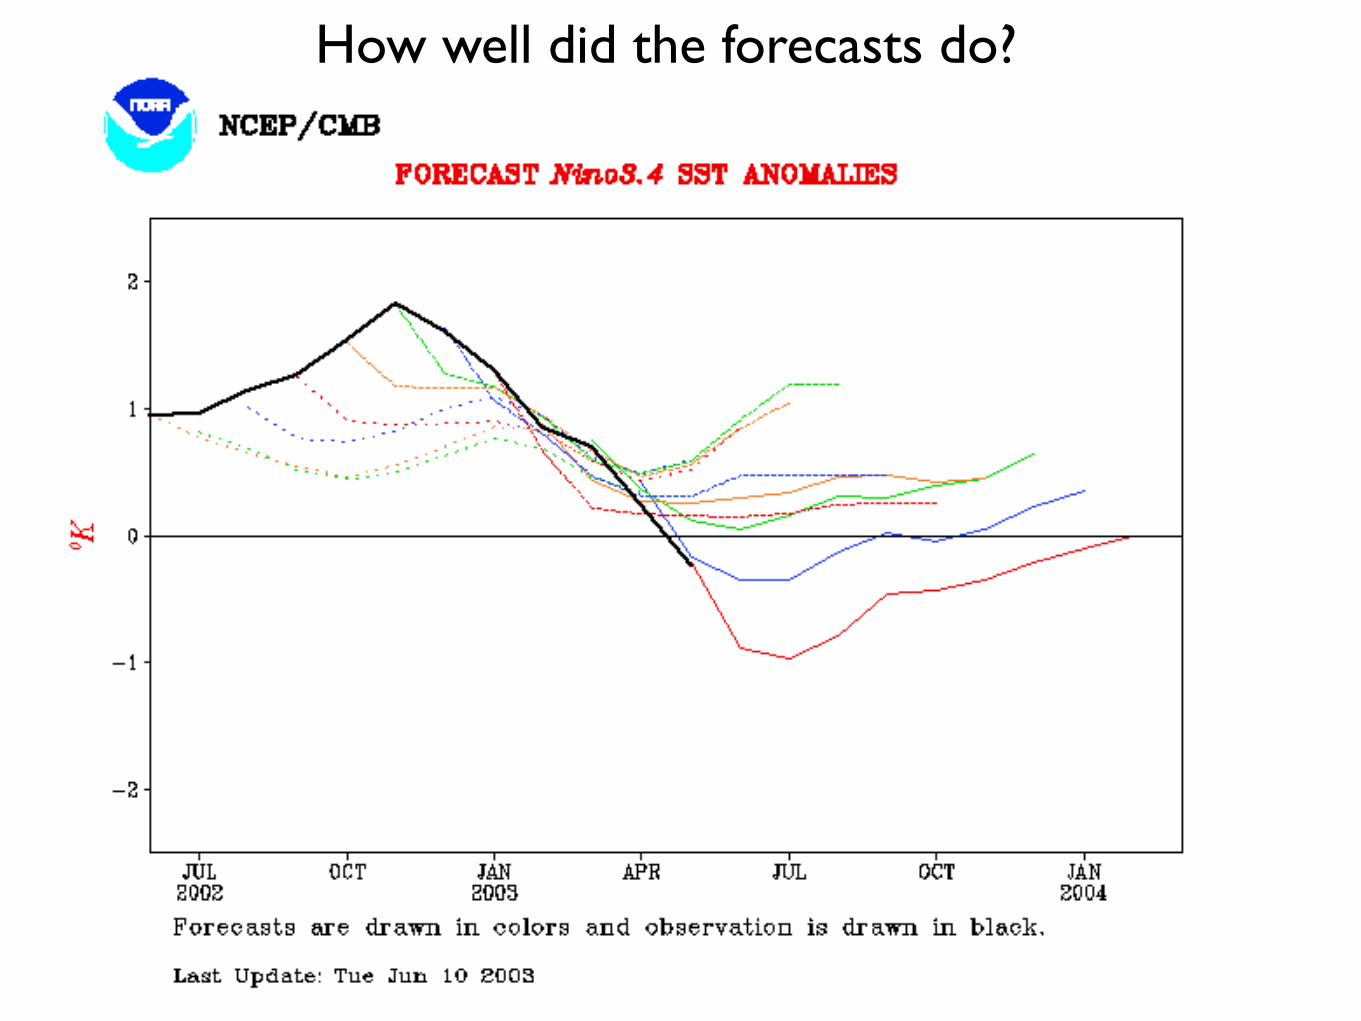
How well did the forecasts do?
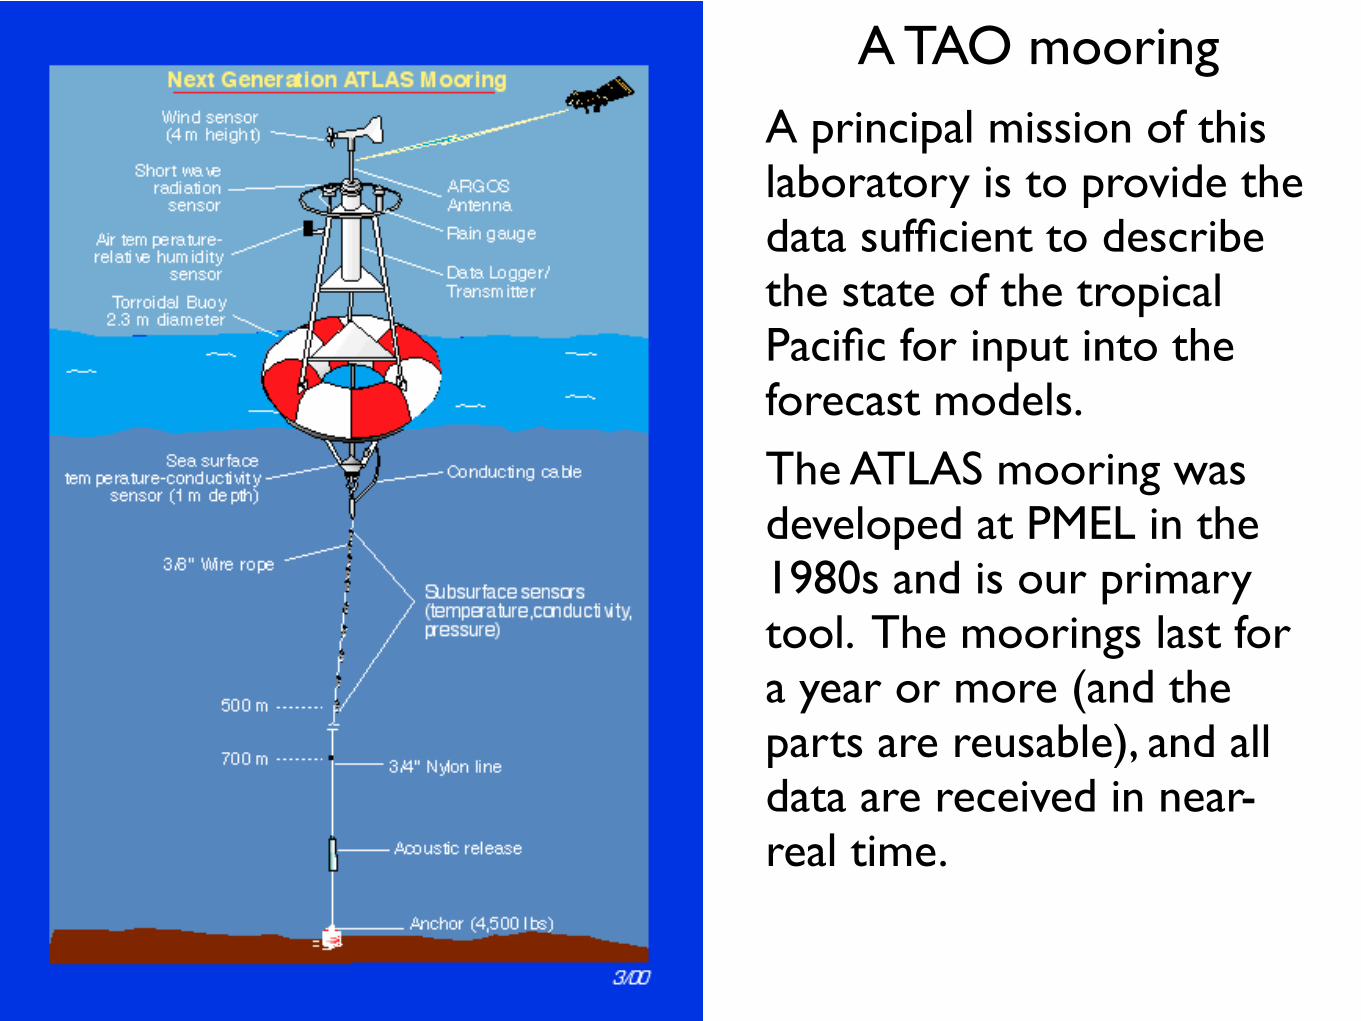
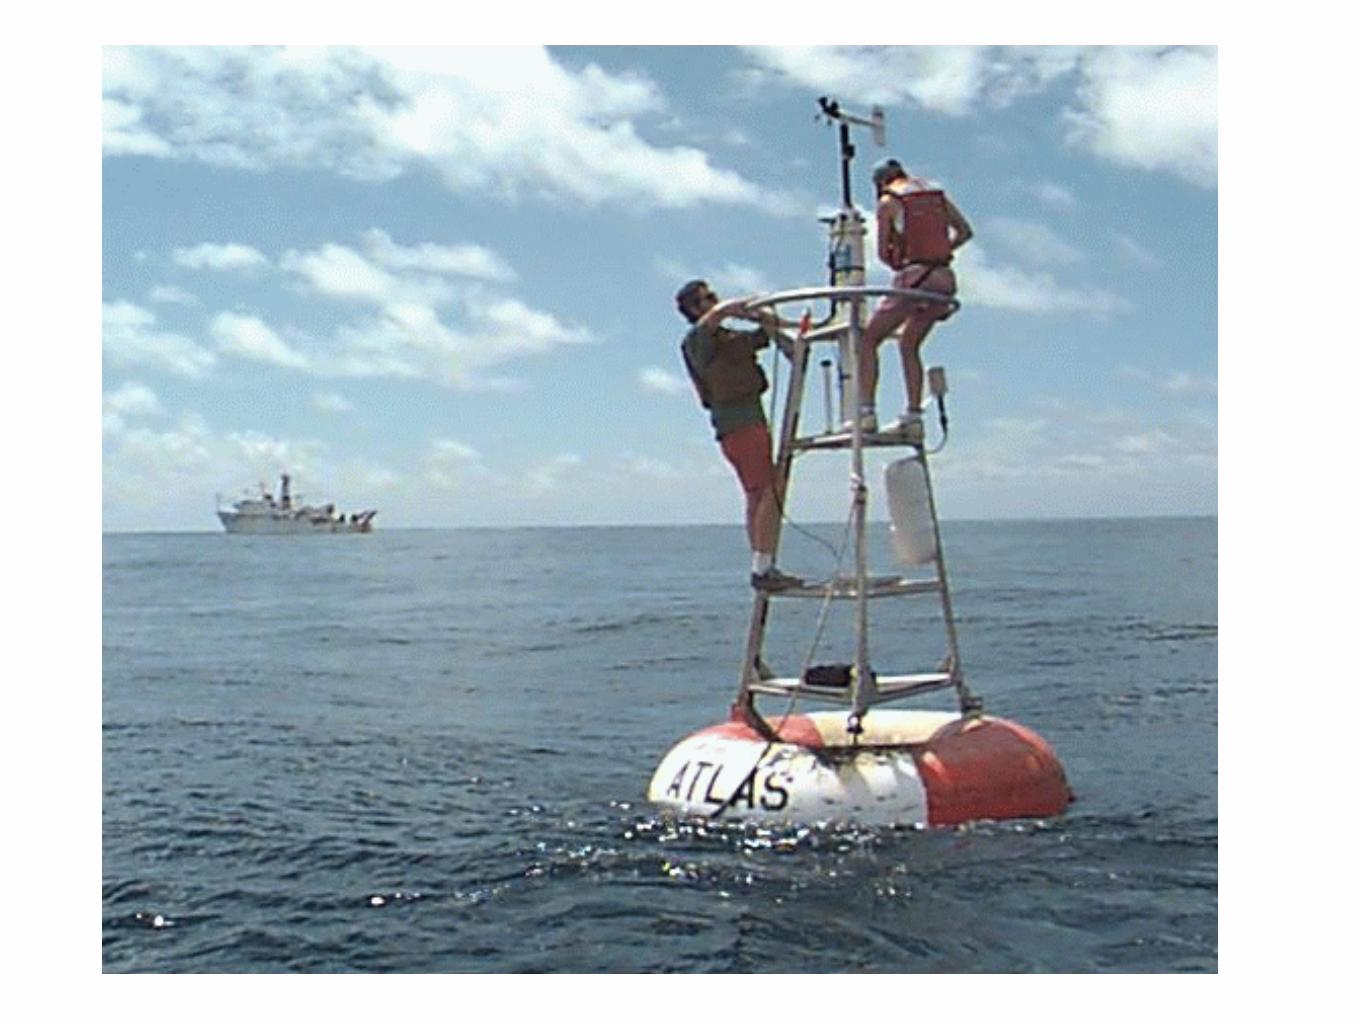
A TAO mooringA principal mission of this laboratory is to provide the data sufficient to describe the state of the tropical Pacific for input into the forecast models.
The ATLAS mooring was developed at PMEL in the 1980s and is our primary tool. The moorings last for a year or more (and the parts are reusable), and all data are received in near-real time.
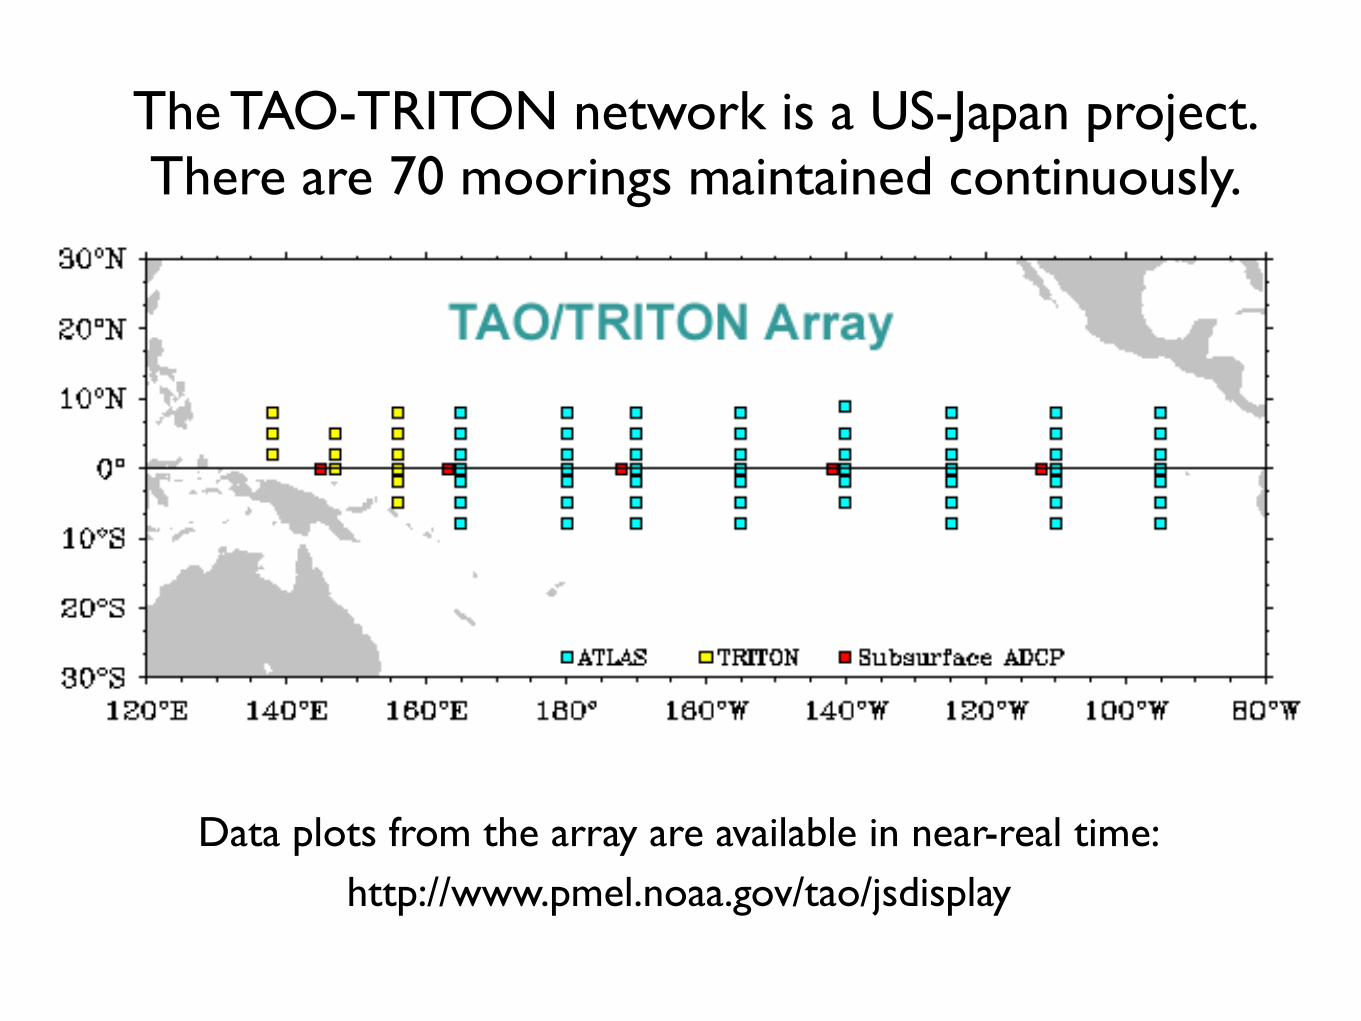
The TAO-TRITON network is a US-Japan project.There are 70 moorings maintained continuously.
Data plots from the array are available in near-real time:
http://www.pmel.noaa.gov/tao/jsdisplay
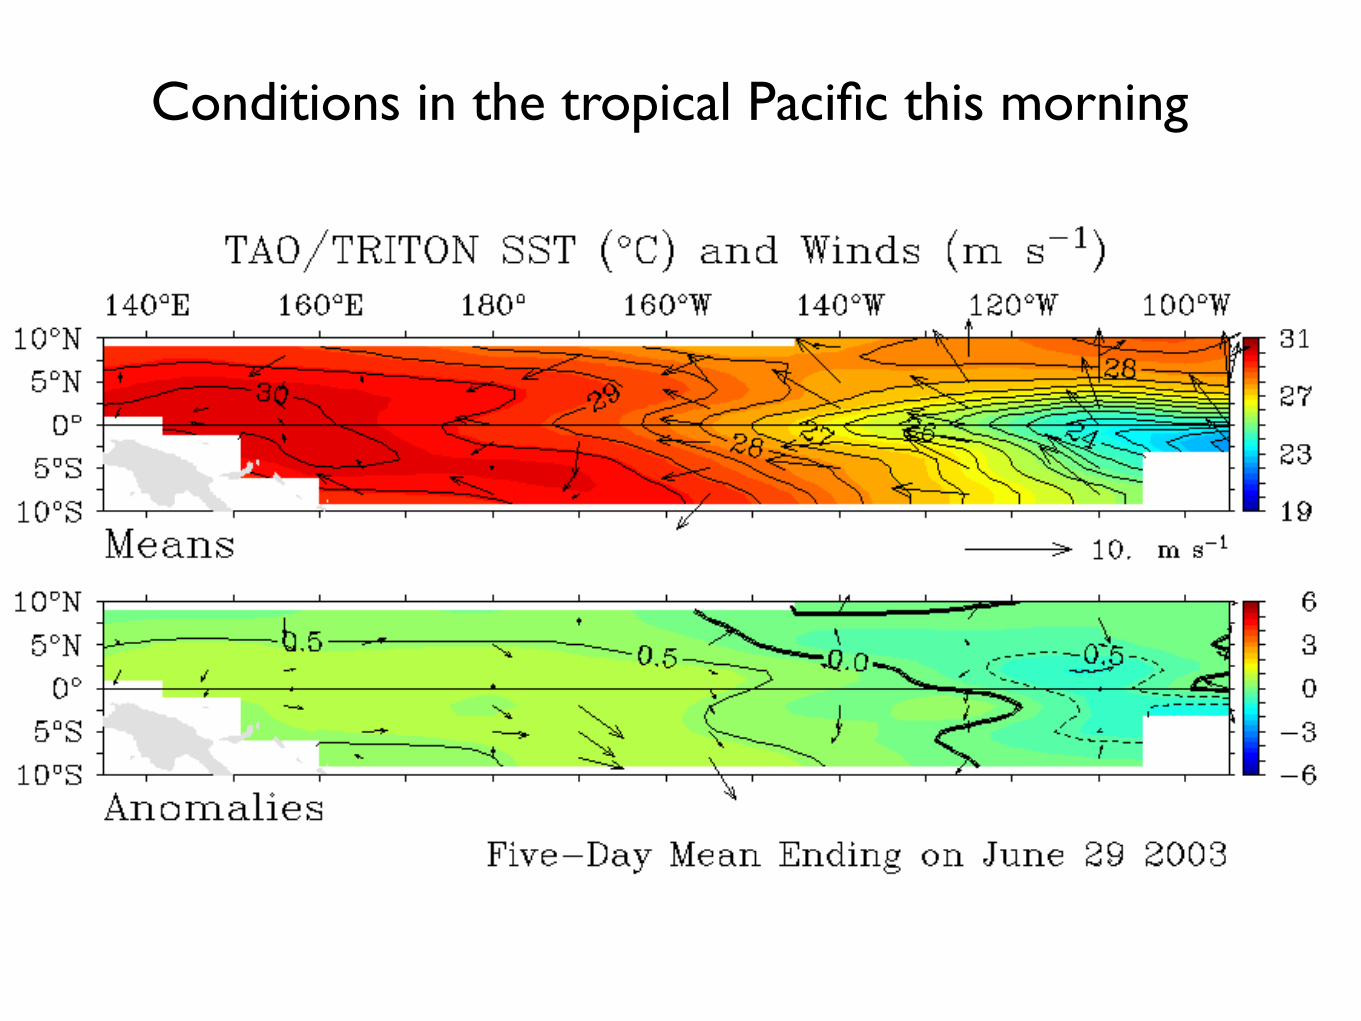
Conditions in the tropical Pacific this morning
Conclusion
• The ocean-atmosphere system is coupled.
• We don’t yet know what initiates an El Niño.
• Once an event begins, we have a good idea of how it evolves. The key to a useful forecast is recognizing the onset early.
• We have developed an array of instruments that provides early warning.
Presentation available in pdf: http://www.pmel.noaa.gov/~kessler Ÿ Latest talk