Embed Size (px)
Citation preview
ELEC 1908 - Electronics LabFibre Optics & Communication
April 5th, 2013
1
1 Part A
1.1 Audio Link
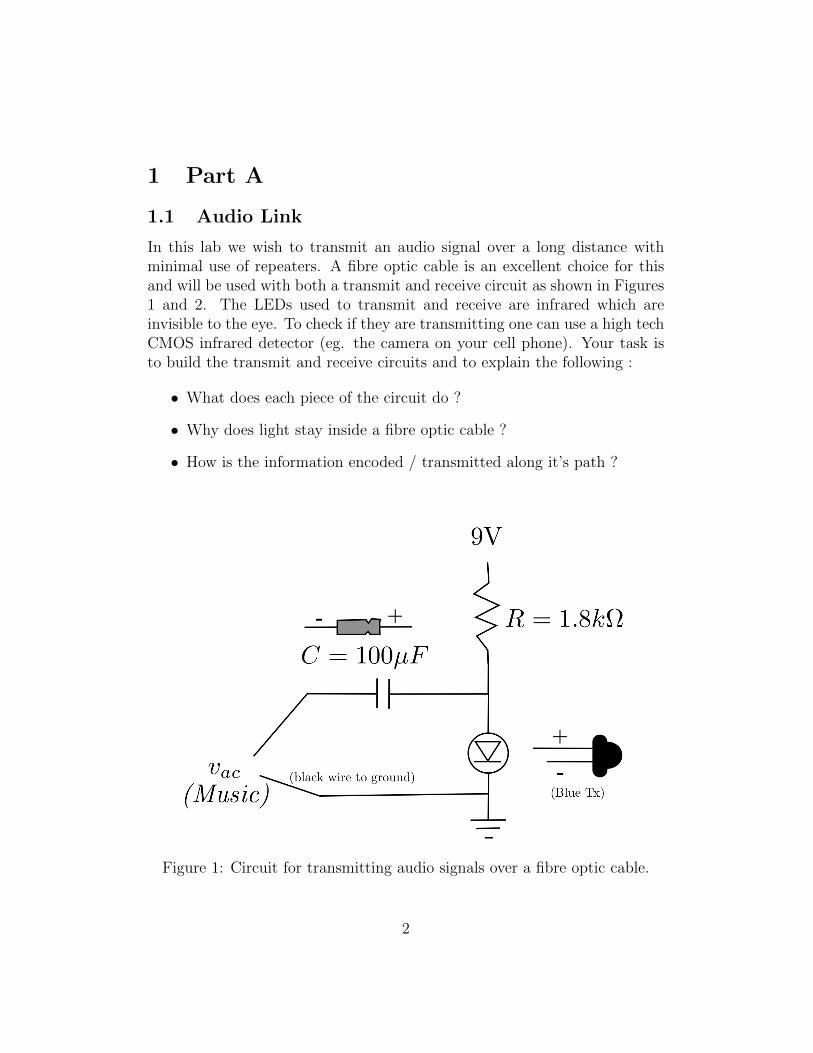
In this lab we wish to transmit an audio signal over a long distance withminimal use of repeaters. A fibre optic cable is an excellent choice for thisand will be used with both a transmit and receive circuit as shown in Figures1 and 2. The LEDs used to transmit and receive are infrared which areinvisible to the eye. To check if they are transmitting one can use a high techCMOS infrared detector (eg. the camera on your cell phone). Your task isto build the transmit and receive circuits and to explain the following :
• What does each piece of the circuit do ?
• Why does light stay inside a fibre optic cable ?
• How is the information encoded / transmitted along it’s path ?
Figure 1: Circuit for transmitting audio signals over a fibre optic cable.
2
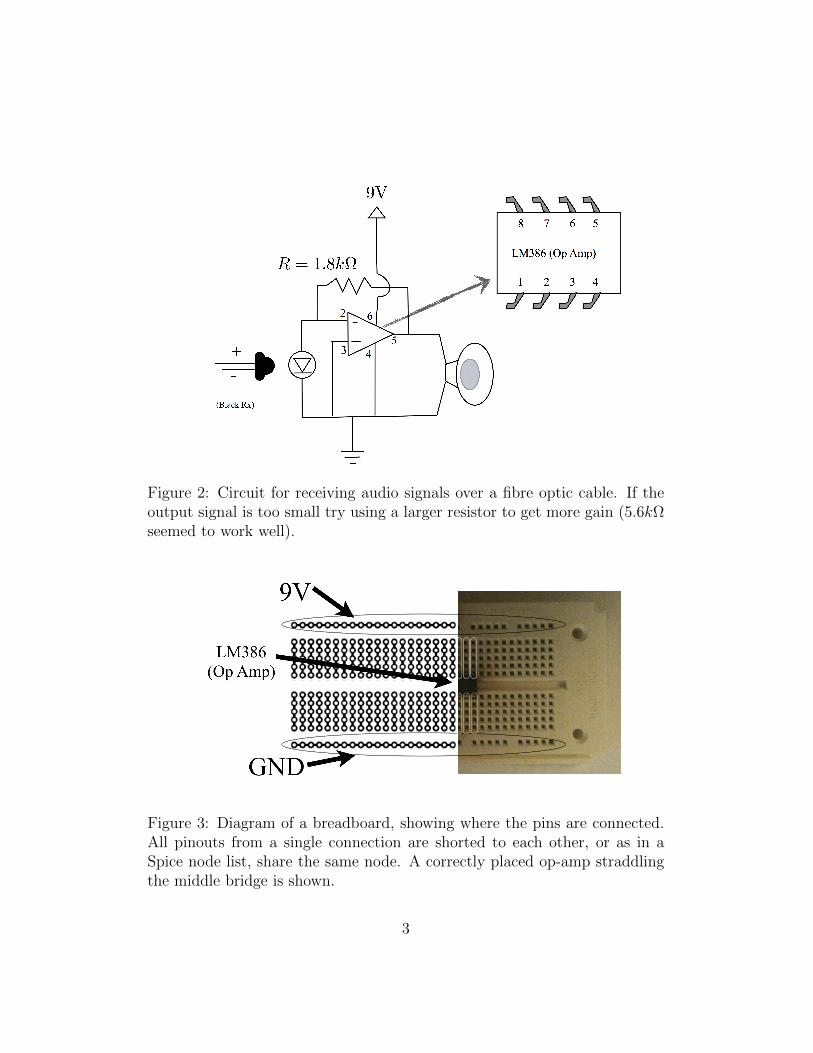
Figure 2: Circuit for receiving audio signals over a fibre optic cable. If theoutput signal is too small try using a larger resistor to get more gain (5.6kΩseemed to work well).
Figure 3: Diagram of a breadboard, showing where the pins are connected.All pinouts from a single connection are shorted to each other, or as in aSpice node list, share the same node. A correctly placed op-amp straddlingthe middle bridge is shown.
3
2 Part B
2.1 Multiplexer
We have now successfully transmitted a signal using infrared light. A thoughtoccurs to you that you might attempt to send multiple signals along a singlefibre optic cable. Examine the multiplexer and use the lamp to see whatcolours come out of the ends depending on the input cable. Create a copy ofthe following table, 1 and describe a) how a device similar to this may aidin our new task, and b) how might this device work (ie. physically, how arethe signals split / combined).
Table 1: Example table for the mutliplexer, be sure to replace ‘colour 1’ withthe colour of the cable, and record the colour of light which is emitted
in \ out Colour 1 Colour 2 Colour 3Colour 1 −−−−−−−Colour 2 −−−−−−−Colour 3 −−−−−−−
4
3 Part C
3.1 Signal Attenuation
With an optical signal Tx/Rx system, and a method for sending multiplesignals, we must now determine how far these signals can be transmitted.This is described as the loss of the cables, and its value can vary dependingon the colour of light being transmitted. The signal strength at a distancefrom the source can be described in the following equation :
I(x) = I0e−αx (1)
With I being the intensity of the light, which is also proportional tothe signal power and recorded voltage. This means that a signal is reducedto approx 37% or e−1 of its original power after 1/α meters. We will nowdetermine the attenuation constant for three different wavelengths. Usingthree different coloured LEDs and at least three different cable lengths recordthe receive voltages across the different cable lengths. Having measuredreceive voltages for different cable lengths, one can extract the attenuationconstant of the light.
• Why must the send and receive LEDs be the same colour for propertransmission ?
• Why must one not change the transmit voltage during all the measure-ments for that same colour ?
• What is the attenuation constant for each colour ?
• Using an approximate wavelength for each colour, make a plot of at-tenuation constant vs. wavelength
• What are other loss factors affecting this setup ?
5
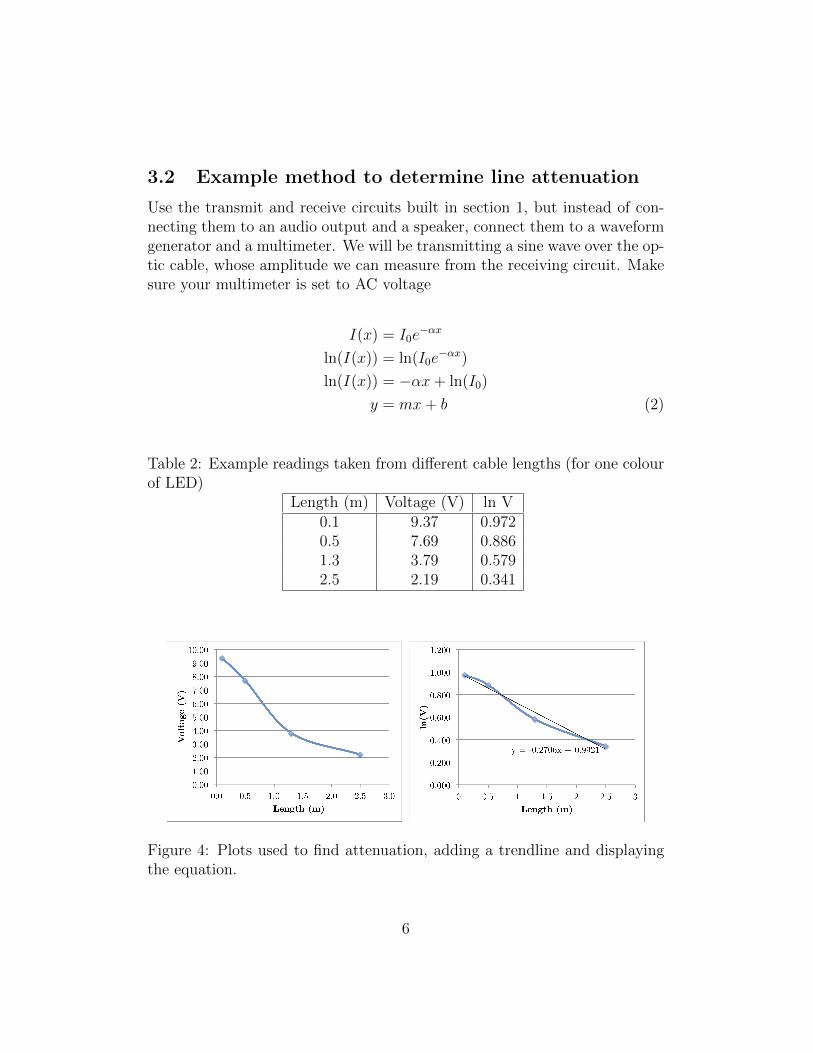
3.2 Example method to determine line attenuation
Use the transmit and receive circuits built in section 1, but instead of con-necting them to an audio output and a speaker, connect them to a waveformgenerator and a multimeter. We will be transmitting a sine wave over the op-tic cable, whose amplitude we can measure from the receiving circuit. Makesure your multimeter is set to AC voltage
I(x) = I0e−αx
ln(I(x)) = ln(I0e−αx)
ln(I(x)) = −αx+ ln(I0)
y = mx+ b (2)
Table 2: Example readings taken from different cable lengths (for one colourof LED)
Length (m) Voltage (V) ln V0.1 9.37 0.9720.5 7.69 0.8861.3 3.79 0.5792.5 2.19 0.341
Figure 4: Plots used to find attenuation, adding a trendline and displayingthe equation.
6
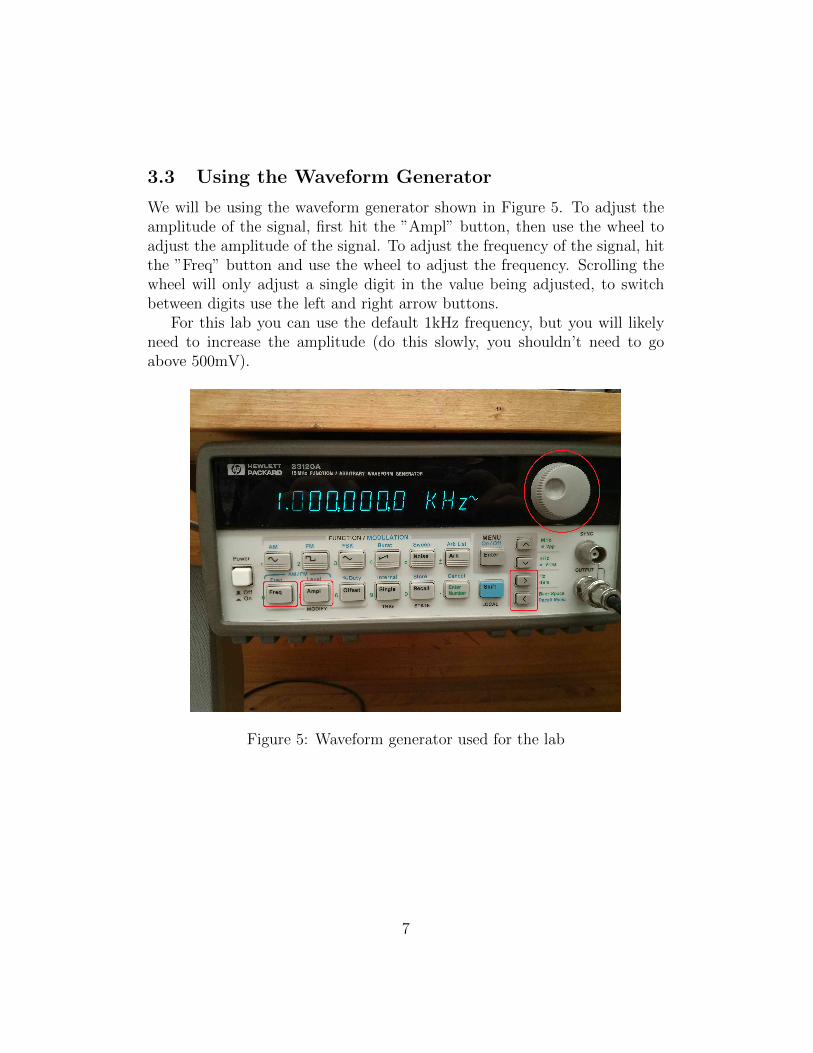
3.3 Using the Waveform Generator
We will be using the waveform generator shown in Figure 5. To adjust theamplitude of the signal, first hit the ”Ampl” button, then use the wheel toadjust the amplitude of the signal. To adjust the frequency of the signal, hitthe ”Freq” button and use the wheel to adjust the frequency. Scrolling thewheel will only adjust a single digit in the value being adjusted, to switchbetween digits use the left and right arrow buttons.
For this lab you can use the default 1kHz frequency, but you will likelyneed to increase the amplitude (do this slowly, you shouldn’t need to goabove 500mV).
Figure 5: Waveform generator used for the lab
7


![ACT NO. V OF 1908 [21st March 1908] PRELIMINARYma-law.org.pk/pdflaw/CODE OF CIVIL PROCEDURE 1908.pdf · Code of Civil Procedure, 1908. ACT NO. V OF 1908 [21st March 1908] An Act to](https://img.pdfslide.net/doc/110x75/5a703e007f8b9abb538bc596/act-no-v-of-1908-21st-march-1908-preliminaryma-laworgpkpdflawcode-of-civil.jpg)
![1ACT NO. IX OF 1908 - Sindh Judicial Academy - …sja.gos.pk/assets/BareActs/LIMITATION ACT.1908.pdf1 LIMITATION ACT, 1908 1ACT NO. IX OF 1908 [7th August, 1908] An Act to consolidate](https://img.pdfslide.net/doc/110x75/5cb91d7888c993ed4a8be6b6/1act-no-ix-of-1908-sindh-judicial-academy-sjagospkassetsbareactslimitation.jpg)
![THE REGISTRATION ACT, 1908 - U.Pcomtax.up.nic.in/Miscellaneous Act/the-registration-act-1908.pdf · THE REGISTRATION ACT, 1908 (16 OF 1908) [18th December, 1908] An Act to consolidate](https://img.pdfslide.net/doc/110x75/5acb37ad7f8b9aad468b4a7a/the-registration-act-1908-u-actthe-registration-act-1908pdfthe-registration.jpg)
![THE REGISTRATION ACT, 1908 - Tripurarevenue.tripura.gov.in/sites/default/files/Registration_Act.pdf · THE REGISTRATION ACT, 1908 (16 OF 1908) [18th December, 1908] An Act to consolidate](https://img.pdfslide.net/doc/110x75/5aa329097f8b9a1f6d8e32f7/the-registration-act-1908-registration-act-1908-16-of-1908-18th-december.jpg)