Embed Size (px)
Citation preview
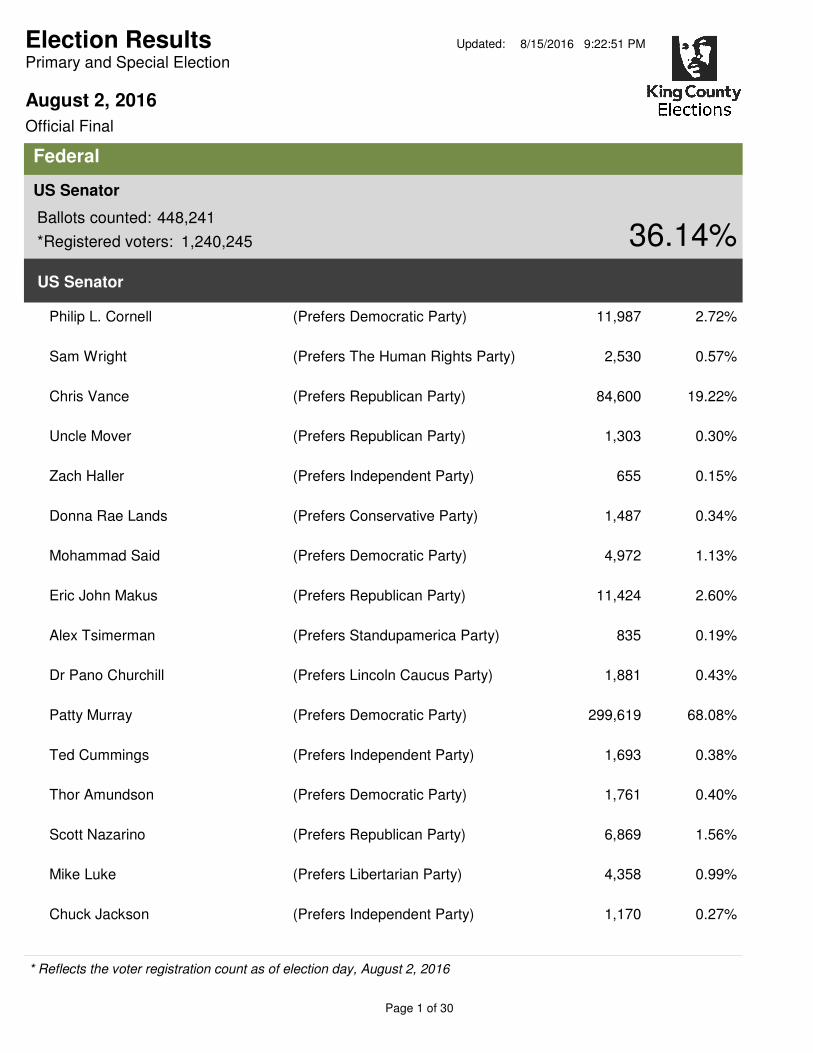
August 2, 2016
Primary and Special Election
Official Final
Election Results Updated: 8/15/2016 9:22:51 PM
Federal
Ballots counted: 448,241
1,240,245 36.14%
US Senator
*Registered voters:
US Senator
Philip L. Cornell (Prefers Democratic Party) 11,987 2.72%
Sam Wright (Prefers The Human Rights Party) 2,530 0.57%
Chris Vance (Prefers Republican Party) 84,600 19.22%
Uncle Mover (Prefers Republican Party) 1,303 0.30%
Zach Haller (Prefers Independent Party) 655 0.15%
Donna Rae Lands (Prefers Conservative Party) 1,487 0.34%
Mohammad Said (Prefers Democratic Party) 4,972 1.13%
Eric John Makus (Prefers Republican Party) 11,424 2.60%
Alex Tsimerman (Prefers Standupamerica Party) 835 0.19%
Dr Pano Churchill (Prefers Lincoln Caucus Party) 1,881 0.43%
Patty Murray (Prefers Democratic Party) 299,619 68.08%
Ted Cummings (Prefers Independent Party) 1,693 0.38%
Thor Amundson (Prefers Democratic Party) 1,761 0.40%
Scott Nazarino (Prefers Republican Party) 6,869 1.56%
Mike Luke (Prefers Libertarian Party) 4,358 0.99%
Chuck Jackson (Prefers Independent Party) 1,170 0.27%
* Reflects the voter registration count as of election day, August 2, 2016
Page 1 of 30
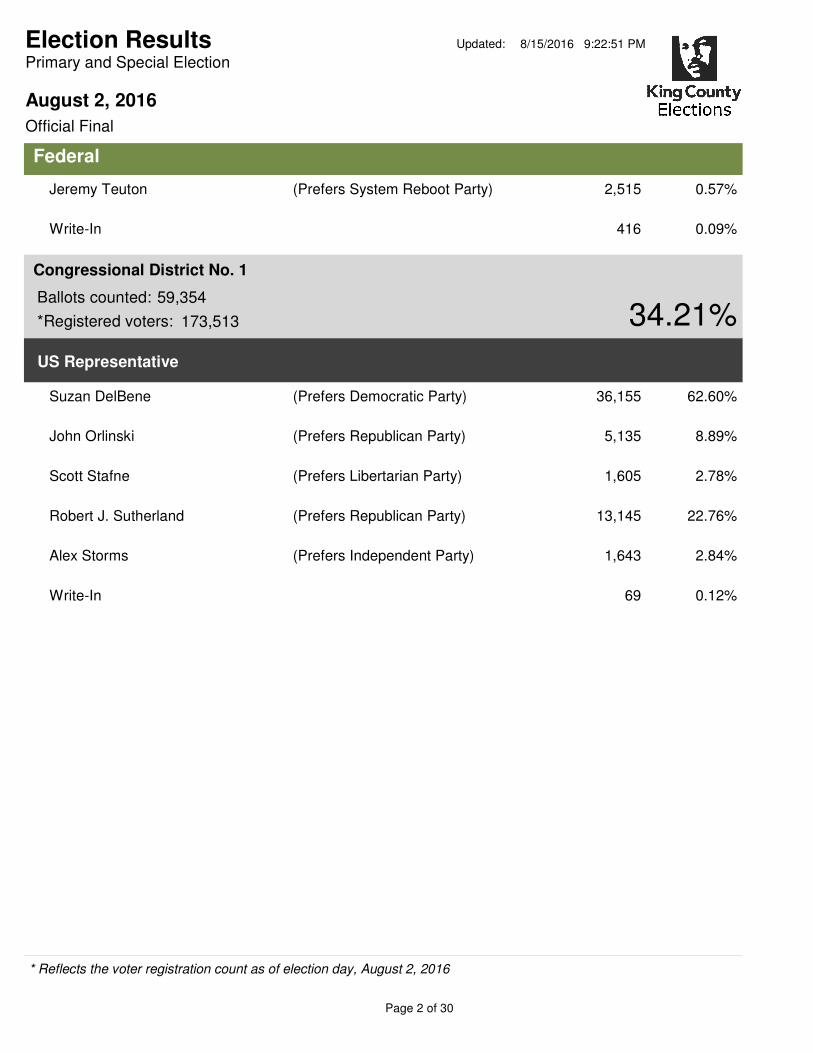
August 2, 2016
Primary and Special Election
Official Final
Election Results Updated: 8/15/2016 9:22:51 PM
Federal
Jeremy Teuton (Prefers System Reboot Party) 2,515 0.57%
Write-In 416 0.09%
Ballots counted: 59,354
173,513 34.21%
Congressional District No. 1
*Registered voters:
US Representative
Suzan DelBene (Prefers Democratic Party) 36,155 62.60%
John Orlinski (Prefers Republican Party) 5,135 8.89%
Scott Stafne (Prefers Libertarian Party) 1,605 2.78%
Robert J. Sutherland (Prefers Republican Party) 13,145 22.76%
Alex Storms (Prefers Independent Party) 1,643 2.84%
Write-In 69 0.12%
* Reflects the voter registration count as of election day, August 2, 2016
Page 2 of 30
August 2, 2016
Primary and Special Election
Official Final
Election Results Updated: 8/15/2016 9:22:51 PM
Federal
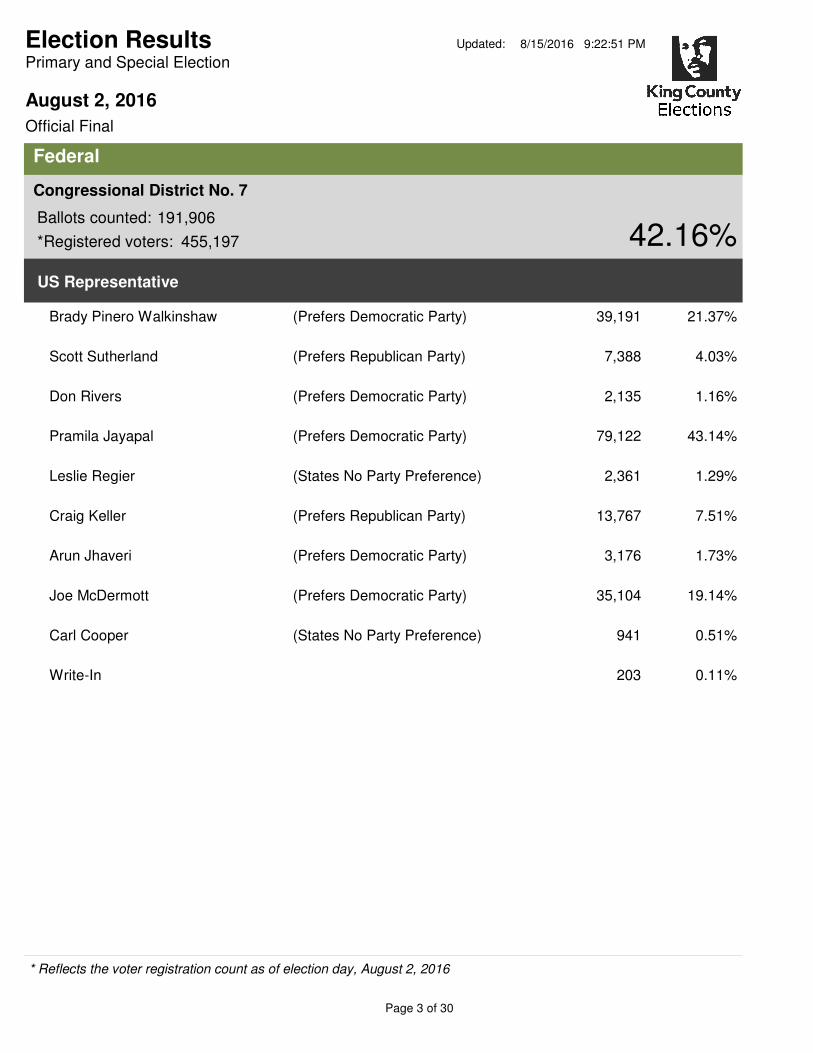
Ballots counted: 191,906
455,197 42.16%
Congressional District No. 7
*Registered voters:
US Representative
Brady Pinero Walkinshaw (Prefers Democratic Party) 39,191 21.37%
Scott Sutherland (Prefers Republican Party) 7,388 4.03%
Don Rivers (Prefers Democratic Party) 2,135 1.16%
Pramila Jayapal (Prefers Democratic Party) 79,122 43.14%
Leslie Regier (States No Party Preference) 2,361 1.29%
Craig Keller (Prefers Republican Party) 13,767 7.51%
Arun Jhaveri (Prefers Democratic Party) 3,176 1.73%
Joe McDermott (Prefers Democratic Party) 35,104 19.14%
Carl Cooper (States No Party Preference) 941 0.51%
Write-In 203 0.11%
* Reflects the voter registration count as of election day, August 2, 2016
Page 3 of 30
August 2, 2016
Primary and Special Election
Official Final
Election Results Updated: 8/15/2016 9:22:51 PM
Federal
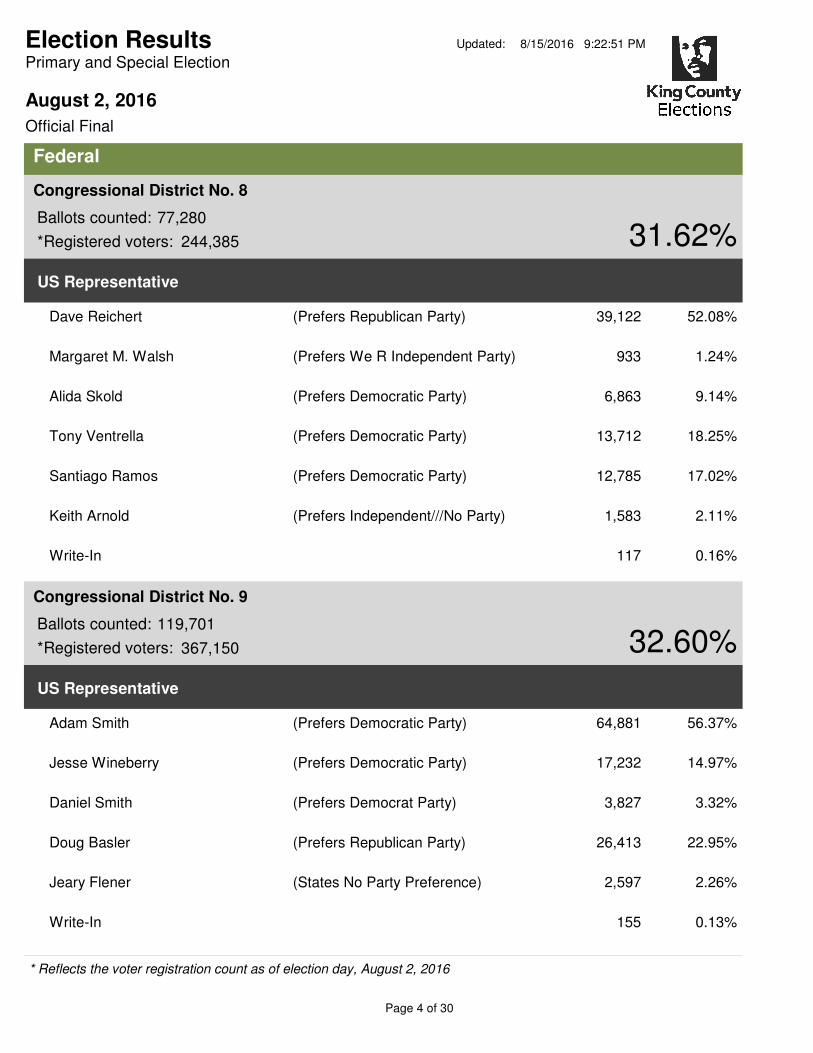
Ballots counted: 77,280
244,385 31.62%
Congressional District No. 8
*Registered voters:
US Representative
Dave Reichert (Prefers Republican Party) 39,122 52.08%
Margaret M. Walsh (Prefers We R Independent Party) 933 1.24%
Alida Skold (Prefers Democratic Party) 6,863 9.14%
Tony Ventrella (Prefers Democratic Party) 13,712 18.25%
Santiago Ramos (Prefers Democratic Party) 12,785 17.02%
Keith Arnold (Prefers Independent///No Party) 1,583 2.11%
Write-In 117 0.16%
Ballots counted: 119,701
367,150 32.60%
Congressional District No. 9
*Registered voters:
US Representative
Adam Smith (Prefers Democratic Party) 64,881 56.37%
Jesse Wineberry (Prefers Democratic Party) 17,232 14.97%
Daniel Smith (Prefers Democrat Party) 3,827 3.32%
Doug Basler (Prefers Republican Party) 26,413 22.95%
Jeary Flener (States No Party Preference) 2,597 2.26%
Write-In 155 0.13%
* Reflects the voter registration count as of election day, August 2, 2016
Page 4 of 30
August 2, 2016
Primary and Special Election
Official Final
Election Results Updated: 8/15/2016 9:22:51 PM
State
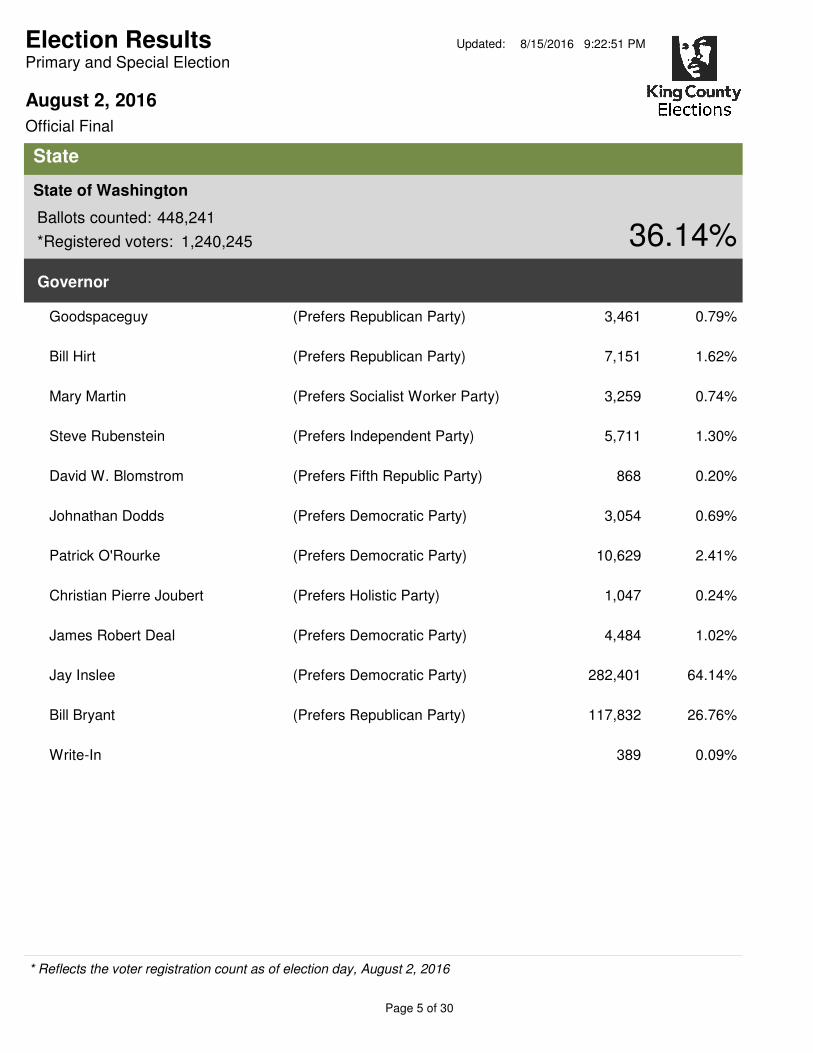
Ballots counted: 448,241
1,240,245 36.14%
State of Washington
*Registered voters:
Governor
Goodspaceguy (Prefers Republican Party) 3,461 0.79%
Bill Hirt (Prefers Republican Party) 7,151 1.62%
Mary Martin (Prefers Socialist Worker Party) 3,259 0.74%
Steve Rubenstein (Prefers Independent Party) 5,711 1.30%
David W. Blomstrom (Prefers Fifth Republic Party) 868 0.20%
Johnathan Dodds (Prefers Democratic Party) 3,054 0.69%
Patrick O'Rourke (Prefers Democratic Party) 10,629 2.41%
Christian Pierre Joubert (Prefers Holistic Party) 1,047 0.24%
James Robert Deal (Prefers Democratic Party) 4,484 1.02%
Jay Inslee (Prefers Democratic Party) 282,401 64.14%
Bill Bryant (Prefers Republican Party) 117,832 26.76%
Write-In 389 0.09%
* Reflects the voter registration count as of election day, August 2, 2016
Page 5 of 30
August 2, 2016
Primary and Special Election
Official Final
Election Results Updated: 8/15/2016 9:22:51 PM
State
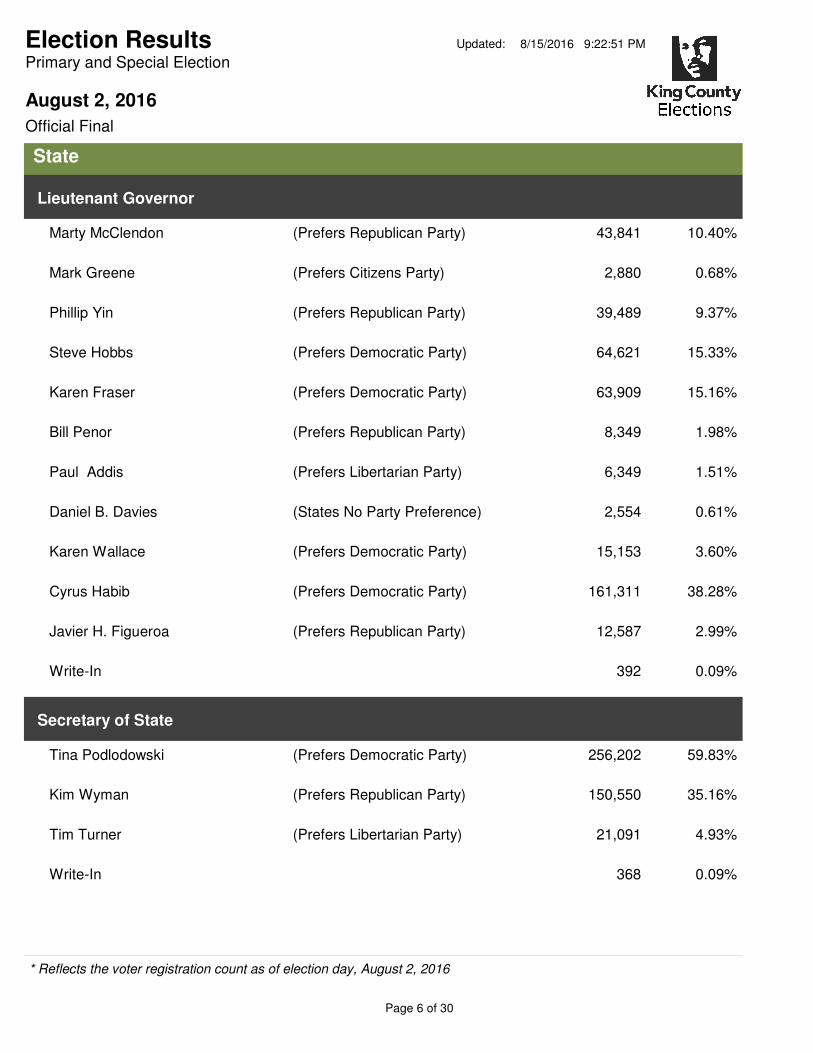
Lieutenant Governor
Marty McClendon (Prefers Republican Party) 43,841 10.40%
Mark Greene (Prefers Citizens Party) 2,880 0.68%
Phillip Yin (Prefers Republican Party) 39,489 9.37%
Steve Hobbs (Prefers Democratic Party) 64,621 15.33%
Karen Fraser (Prefers Democratic Party) 63,909 15.16%
Bill Penor (Prefers Republican Party) 8,349 1.98%
Paul Addis (Prefers Libertarian Party) 6,349 1.51%
Daniel B. Davies (States No Party Preference) 2,554 0.61%
Karen Wallace (Prefers Democratic Party) 15,153 3.60%
Cyrus Habib (Prefers Democratic Party) 161,311 38.28%
Javier H. Figueroa (Prefers Republican Party) 12,587 2.99%
Write-In 392 0.09%
Secretary of State
Tina Podlodowski (Prefers Democratic Party) 256,202 59.83%
Kim Wyman (Prefers Republican Party) 150,550 35.16%
Tim Turner (Prefers Libertarian Party) 21,091 4.93%
Write-In 368 0.09%
* Reflects the voter registration count as of election day, August 2, 2016
Page 6 of 30
August 2, 2016
Primary and Special Election
Official Final
Election Results Updated: 8/15/2016 9:22:51 PM
State
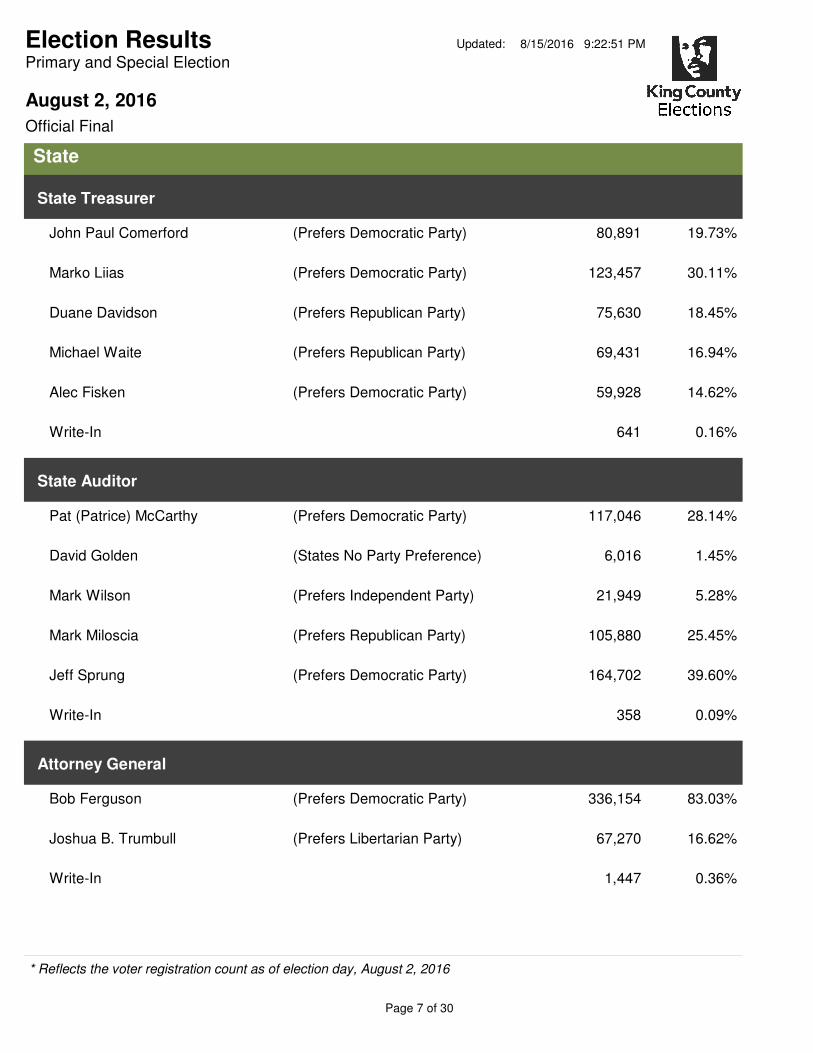
State Treasurer
John Paul Comerford (Prefers Democratic Party) 80,891 19.73%
Marko Liias (Prefers Democratic Party) 123,457 30.11%
Duane Davidson (Prefers Republican Party) 75,630 18.45%
Michael Waite (Prefers Republican Party) 69,431 16.94%
Alec Fisken (Prefers Democratic Party) 59,928 14.62%
Write-In 641 0.16%
State Auditor
Pat (Patrice) McCarthy (Prefers Democratic Party) 117,046 28.14%
David Golden (States No Party Preference) 6,016 1.45%
Mark Wilson (Prefers Independent Party) 21,949 5.28%
Mark Miloscia (Prefers Republican Party) 105,880 25.45%
Jeff Sprung (Prefers Democratic Party) 164,702 39.60%
Write-In 358 0.09%
Attorney General
Bob Ferguson (Prefers Democratic Party) 336,154 83.03%
Joshua B. Trumbull (Prefers Libertarian Party) 67,270 16.62%
Write-In 1,447 0.36%
* Reflects the voter registration count as of election day, August 2, 2016
Page 7 of 30
August 2, 2016
Primary and Special Election
Official Final
Election Results Updated: 8/15/2016 9:22:51 PM
State
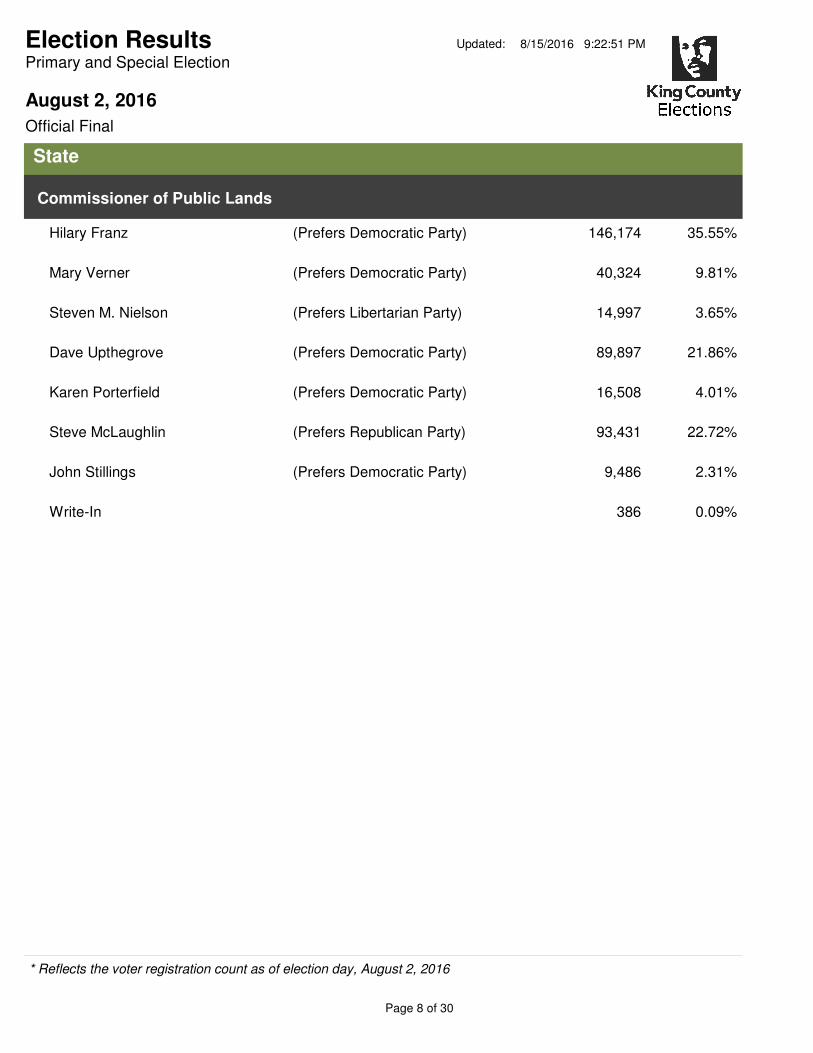
Commissioner of Public Lands
Hilary Franz (Prefers Democratic Party) 146,174 35.55%
Mary Verner (Prefers Democratic Party) 40,324 9.81%
Steven M. Nielson (Prefers Libertarian Party) 14,997 3.65%
Dave Upthegrove (Prefers Democratic Party) 89,897 21.86%
Karen Porterfield (Prefers Democratic Party) 16,508 4.01%
Steve McLaughlin (Prefers Republican Party) 93,431 22.72%
John Stillings (Prefers Democratic Party) 9,486 2.31%
Write-In 386 0.09%
* Reflects the voter registration count as of election day, August 2, 2016
Page 8 of 30
August 2, 2016
Primary and Special Election
Official Final
Election Results Updated: 8/15/2016 9:22:51 PM
State
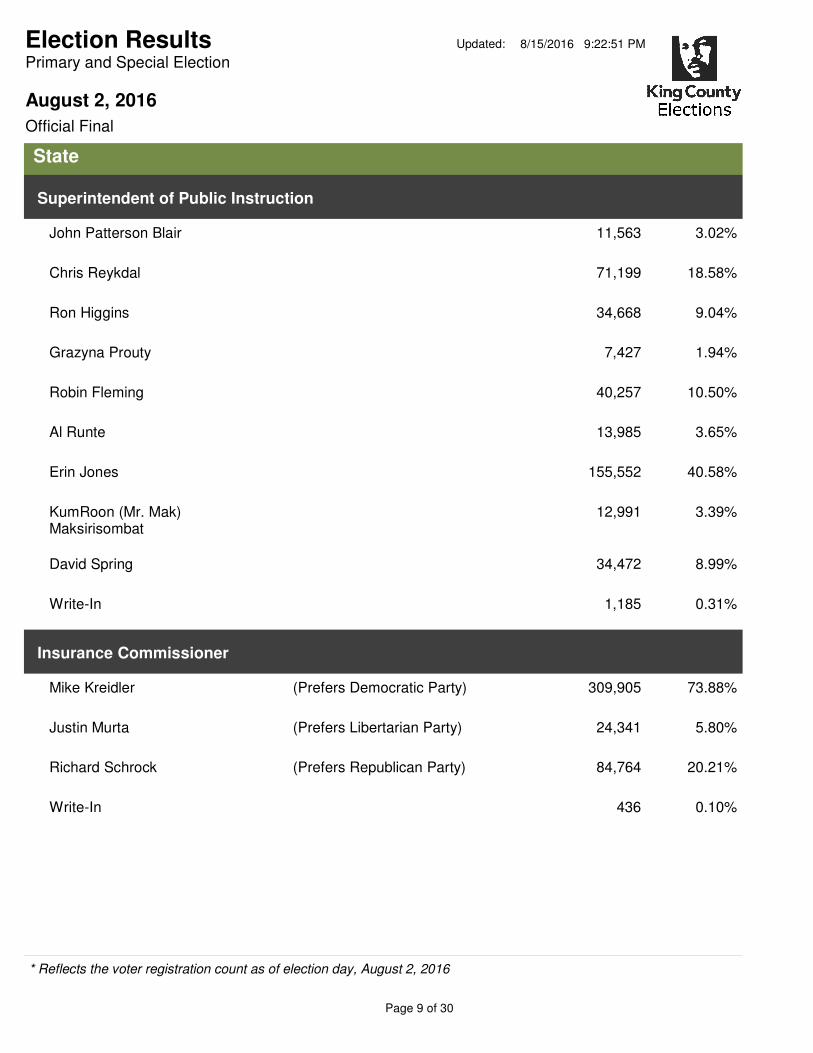
Superintendent of Public Instruction
John Patterson Blair 11,563 3.02%
Chris Reykdal 71,199 18.58%
Ron Higgins 34,668 9.04%
Grazyna Prouty 7,427 1.94%
Robin Fleming 40,257 10.50%
Al Runte 13,985 3.65%
Erin Jones 155,552 40.58%
KumRoon (Mr. Mak) Maksirisombat
12,991 3.39%
David Spring 34,472 8.99%
Write-In 1,185 0.31%
Insurance Commissioner
Mike Kreidler (Prefers Democratic Party) 309,905 73.88%
Justin Murta (Prefers Libertarian Party) 24,341 5.80%
Richard Schrock (Prefers Republican Party) 84,764 20.21%
Write-In 436 0.10%
* Reflects the voter registration count as of election day, August 2, 2016
Page 9 of 30
August 2, 2016
Primary and Special Election
Official Final
Election Results Updated: 8/15/2016 9:22:51 PM
State
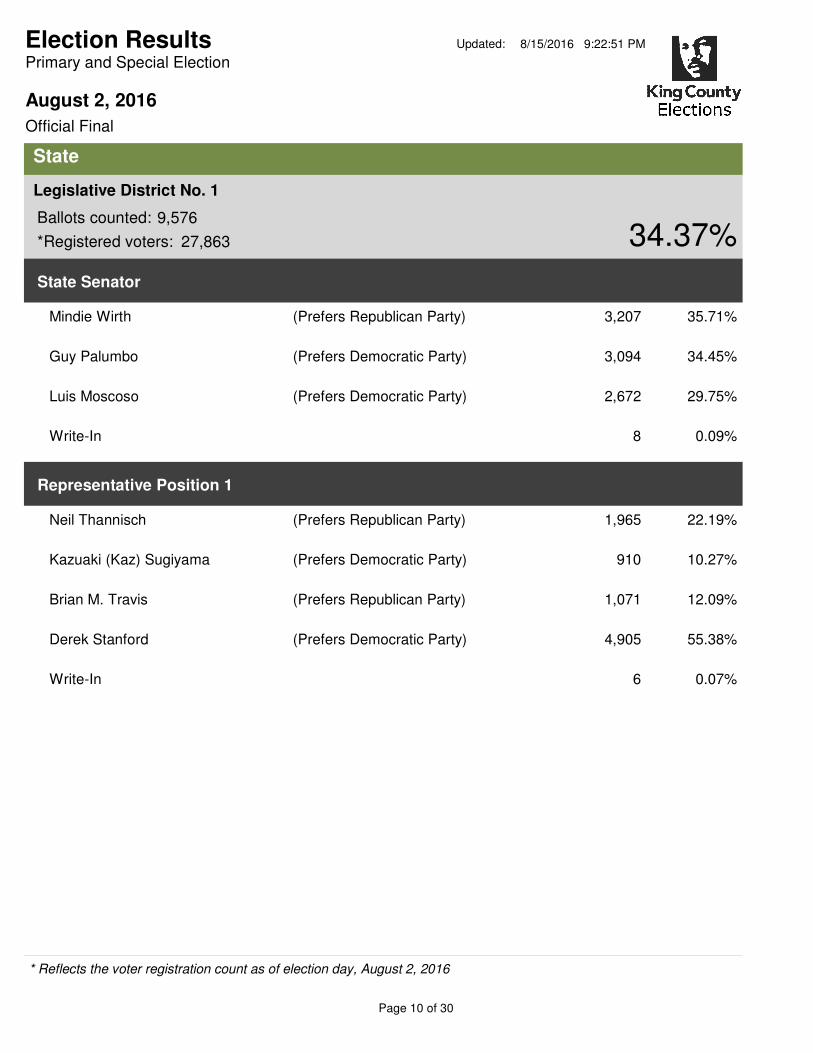
Ballots counted: 9,576
27,863 34.37%
Legislative District No. 1
*Registered voters:
State Senator
Mindie Wirth (Prefers Republican Party) 3,207 35.71%
Guy Palumbo (Prefers Democratic Party) 3,094 34.45%
Luis Moscoso (Prefers Democratic Party) 2,672 29.75%
Write-In 8 0.09%
Representative Position 1
Neil Thannisch (Prefers Republican Party) 1,965 22.19%
Kazuaki (Kaz) Sugiyama (Prefers Democratic Party) 910 10.27%
Brian M. Travis (Prefers Republican Party) 1,071 12.09%
Derek Stanford (Prefers Democratic Party) 4,905 55.38%
Write-In 6 0.07%
* Reflects the voter registration count as of election day, August 2, 2016
Page 10 of 30
August 2, 2016
Primary and Special Election
Official Final
Election Results Updated: 8/15/2016 9:22:51 PM
State
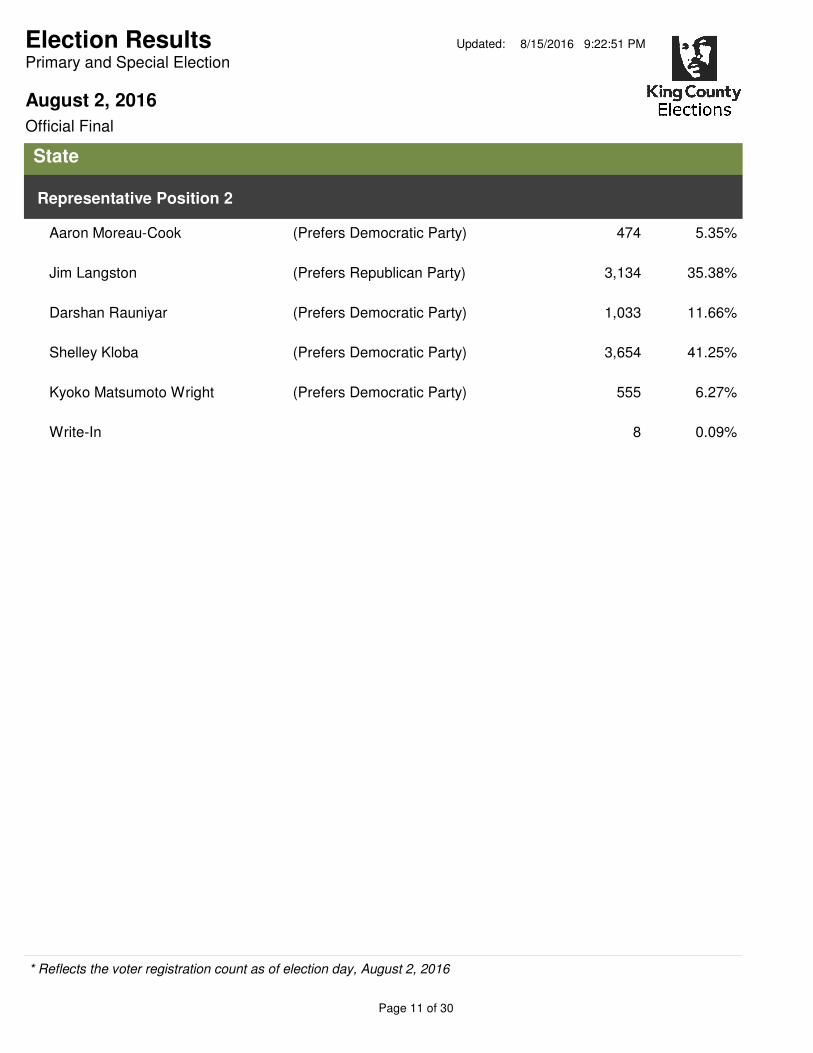
Representative Position 2
Aaron Moreau-Cook (Prefers Democratic Party) 474 5.35%
Jim Langston (Prefers Republican Party) 3,134 35.38%
Darshan Rauniyar (Prefers Democratic Party) 1,033 11.66%
Shelley Kloba (Prefers Democratic Party) 3,654 41.25%
Kyoko Matsumoto Wright (Prefers Democratic Party) 555 6.27%
Write-In 8 0.09%
* Reflects the voter registration count as of election day, August 2, 2016
Page 11 of 30
August 2, 2016
Primary and Special Election
Official Final
Election Results Updated: 8/15/2016 9:22:51 PM
State
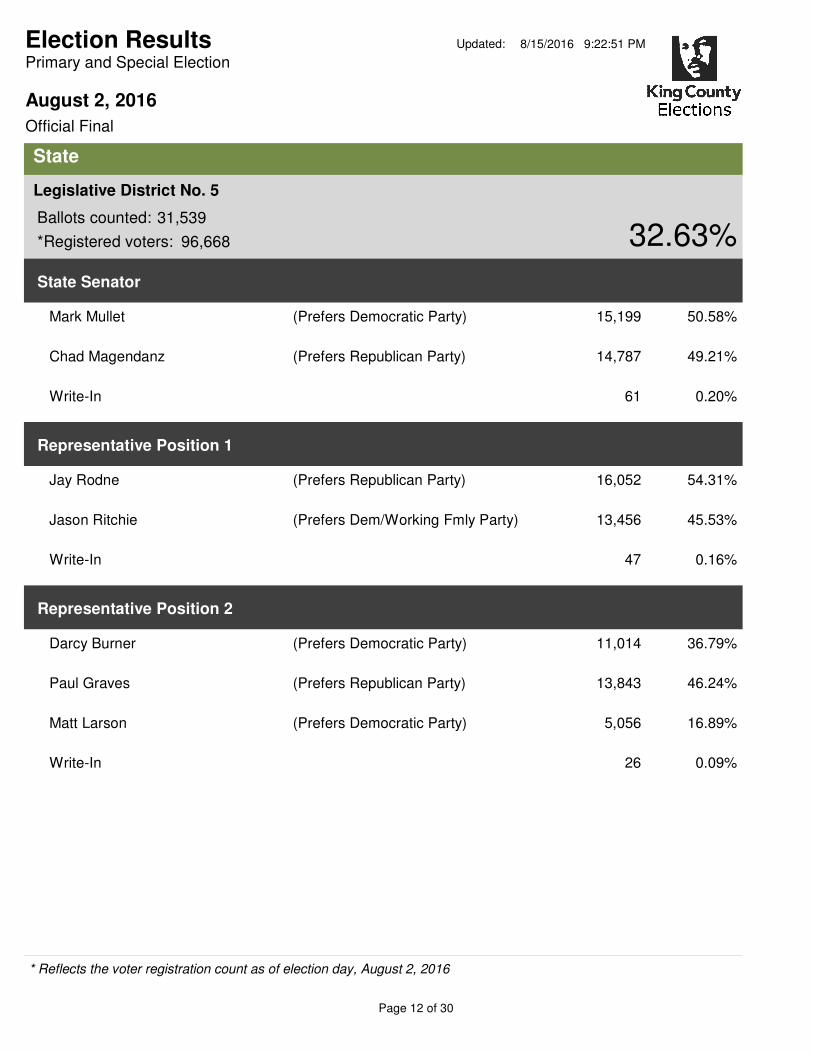
Ballots counted: 31,539
96,668 32.63%
Legislative District No. 5
*Registered voters:
State Senator
Mark Mullet (Prefers Democratic Party) 15,199 50.58%
Chad Magendanz (Prefers Republican Party) 14,787 49.21%
Write-In 61 0.20%
Representative Position 1
Jay Rodne (Prefers Republican Party) 16,052 54.31%
Jason Ritchie (Prefers Dem/Working Fmly Party) 13,456 45.53%
Write-In 47 0.16%
Representative Position 2
Darcy Burner (Prefers Democratic Party) 11,014 36.79%
Paul Graves (Prefers Republican Party) 13,843 46.24%
Matt Larson (Prefers Democratic Party) 5,056 16.89%
Write-In 26 0.09%
* Reflects the voter registration count as of election day, August 2, 2016
Page 12 of 30
August 2, 2016
Primary and Special Election
Official Final
Election Results Updated: 8/15/2016 9:22:51 PM
State
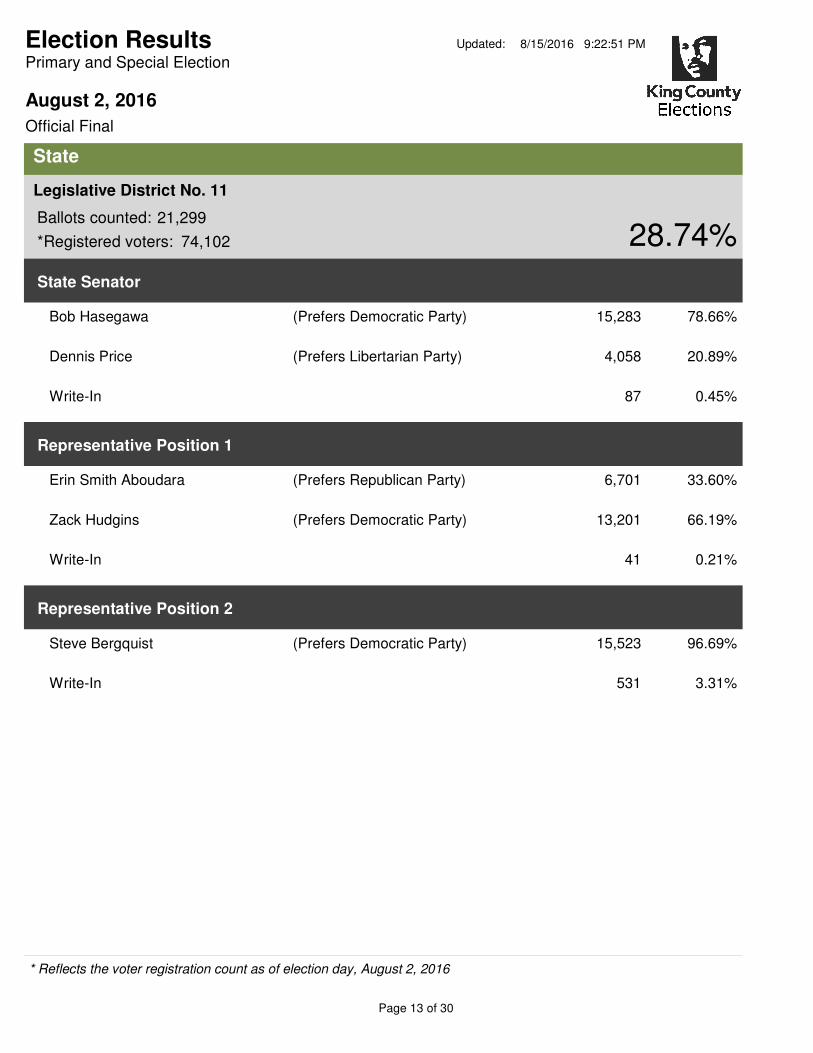
Ballots counted: 21,299
74,102 28.74%
Legislative District No. 11
*Registered voters:
State Senator
Bob Hasegawa (Prefers Democratic Party) 15,283 78.66%
Dennis Price (Prefers Libertarian Party) 4,058 20.89%
Write-In 87 0.45%
Representative Position 1
Erin Smith Aboudara (Prefers Republican Party) 6,701 33.60%
Zack Hudgins (Prefers Democratic Party) 13,201 66.19%
Write-In 41 0.21%
Representative Position 2
Steve Bergquist (Prefers Democratic Party) 15,523 96.69%
Write-In 531 3.31%
* Reflects the voter registration count as of election day, August 2, 2016
Page 13 of 30
August 2, 2016
Primary and Special Election
Official Final
Election Results Updated: 8/15/2016 9:22:51 PM
State
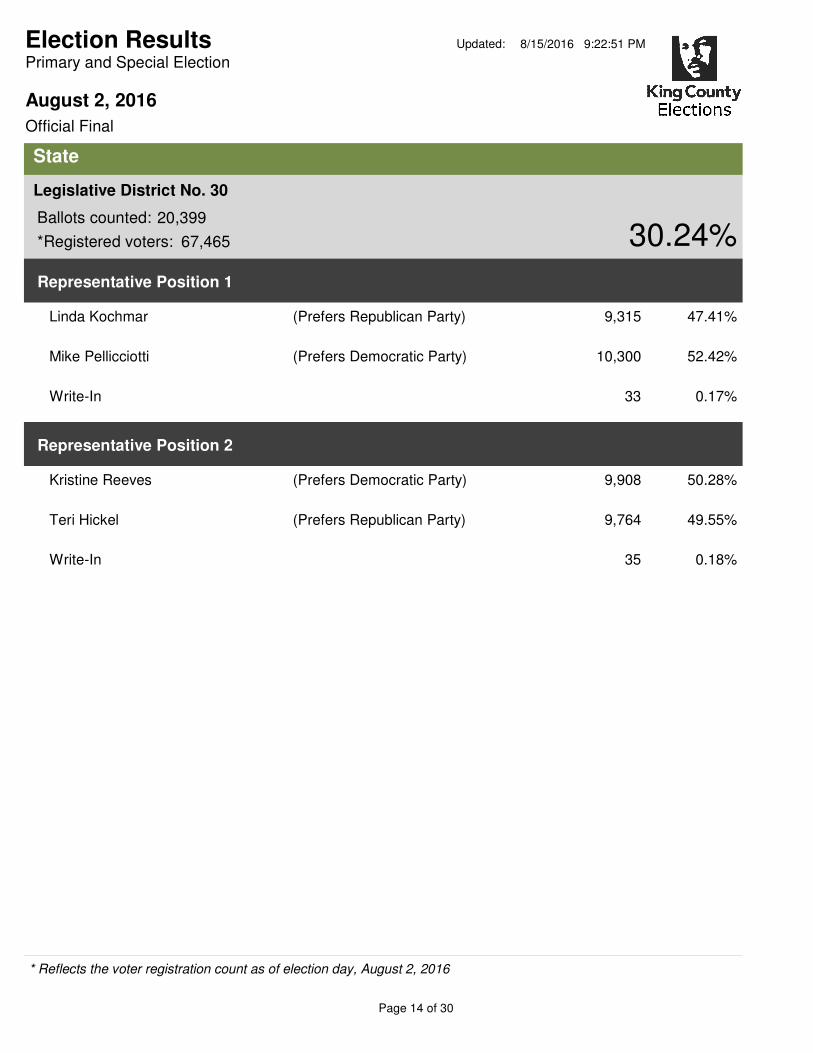
Ballots counted: 20,399
67,465 30.24%
Legislative District No. 30
*Registered voters:
Representative Position 1
Linda Kochmar (Prefers Republican Party) 9,315 47.41%
Mike Pellicciotti (Prefers Democratic Party) 10,300 52.42%
Write-In 33 0.17%
Representative Position 2
Kristine Reeves (Prefers Democratic Party) 9,908 50.28%
Teri Hickel (Prefers Republican Party) 9,764 49.55%
Write-In 35 0.18%
* Reflects the voter registration count as of election day, August 2, 2016
Page 14 of 30
August 2, 2016
Primary and Special Election
Official Final
Election Results Updated: 8/15/2016 9:22:51 PM
State
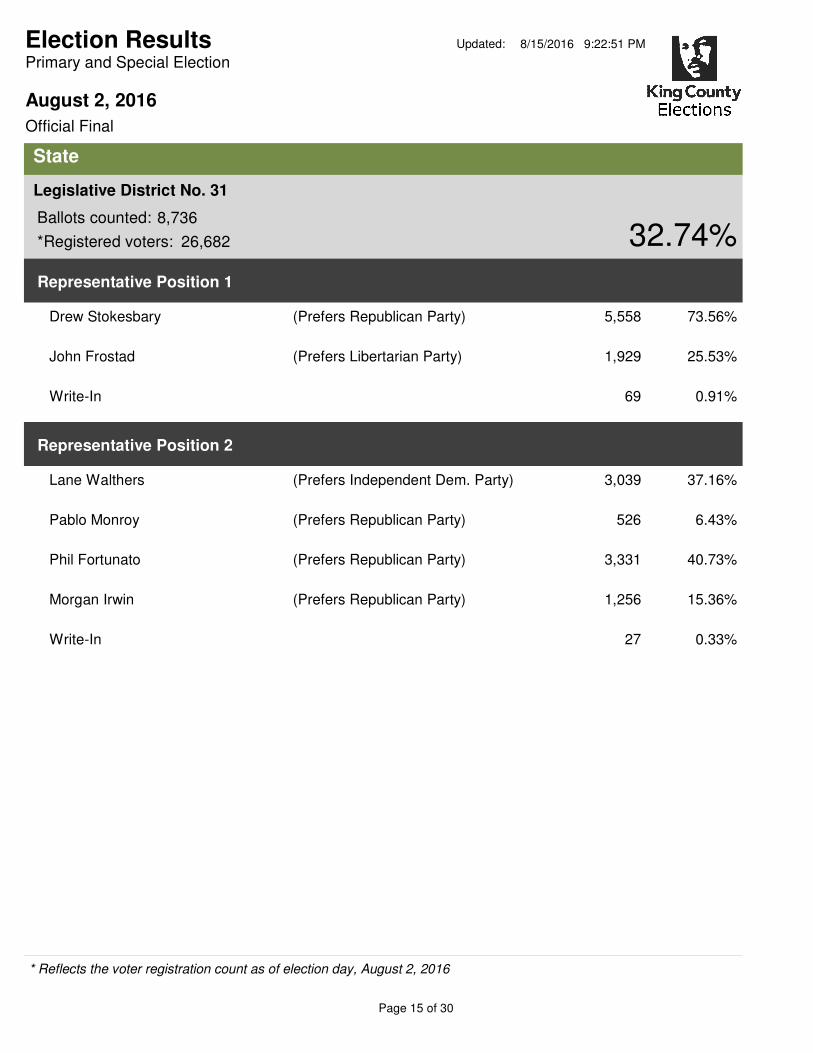
Ballots counted: 8,736
26,682 32.74%
Legislative District No. 31
*Registered voters:
Representative Position 1
Drew Stokesbary (Prefers Republican Party) 5,558 73.56%
John Frostad (Prefers Libertarian Party) 1,929 25.53%
Write-In 69 0.91%
Representative Position 2
Lane Walthers (Prefers Independent Dem. Party) 3,039 37.16%
Pablo Monroy (Prefers Republican Party) 526 6.43%
Phil Fortunato (Prefers Republican Party) 3,331 40.73%
Morgan Irwin (Prefers Republican Party) 1,256 15.36%
Write-In 27 0.33%
* Reflects the voter registration count as of election day, August 2, 2016
Page 15 of 30
August 2, 2016
Primary and Special Election
Official Final
Election Results Updated: 8/15/2016 9:22:51 PM
State
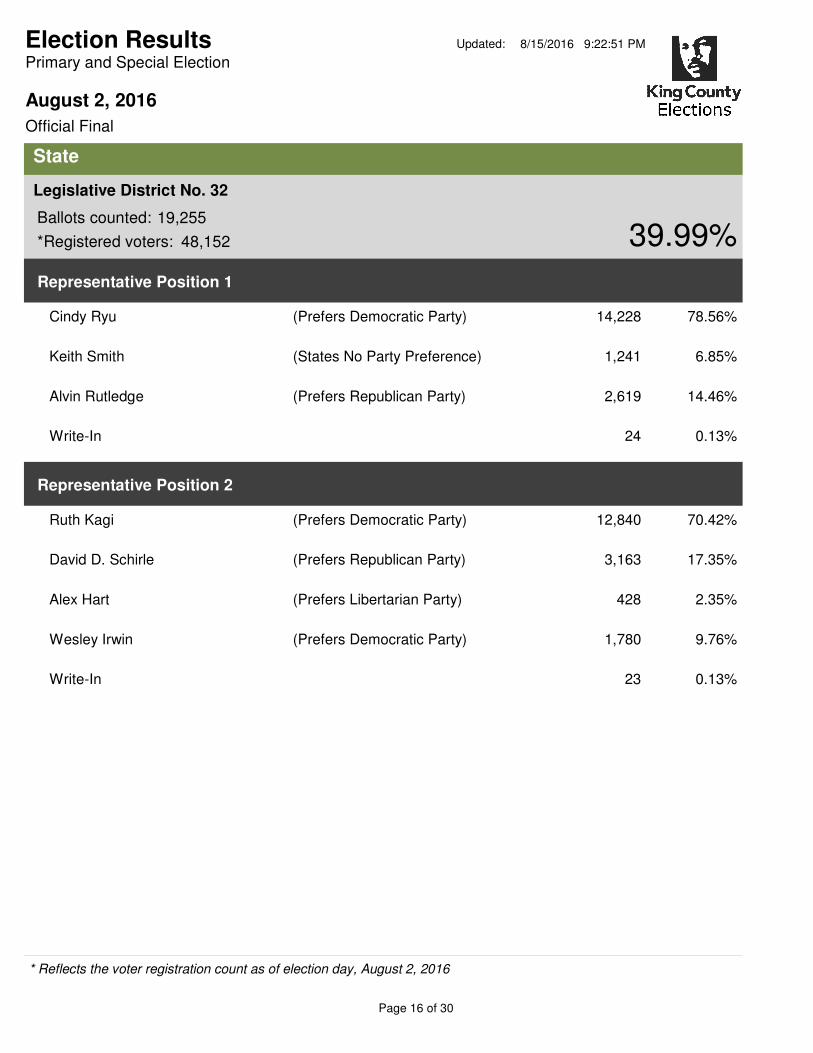
Ballots counted: 19,255
48,152 39.99%
Legislative District No. 32
*Registered voters:
Representative Position 1
Cindy Ryu (Prefers Democratic Party) 14,228 78.56%
Keith Smith (States No Party Preference) 1,241 6.85%
Alvin Rutledge (Prefers Republican Party) 2,619 14.46%
Write-In 24 0.13%
Representative Position 2
Ruth Kagi (Prefers Democratic Party) 12,840 70.42%
David D. Schirle (Prefers Republican Party) 3,163 17.35%
Alex Hart (Prefers Libertarian Party) 428 2.35%
Wesley Irwin (Prefers Democratic Party) 1,780 9.76%
Write-In 23 0.13%
* Reflects the voter registration count as of election day, August 2, 2016
Page 16 of 30
August 2, 2016
Primary and Special Election
Official Final
Election Results Updated: 8/15/2016 9:22:51 PM
State
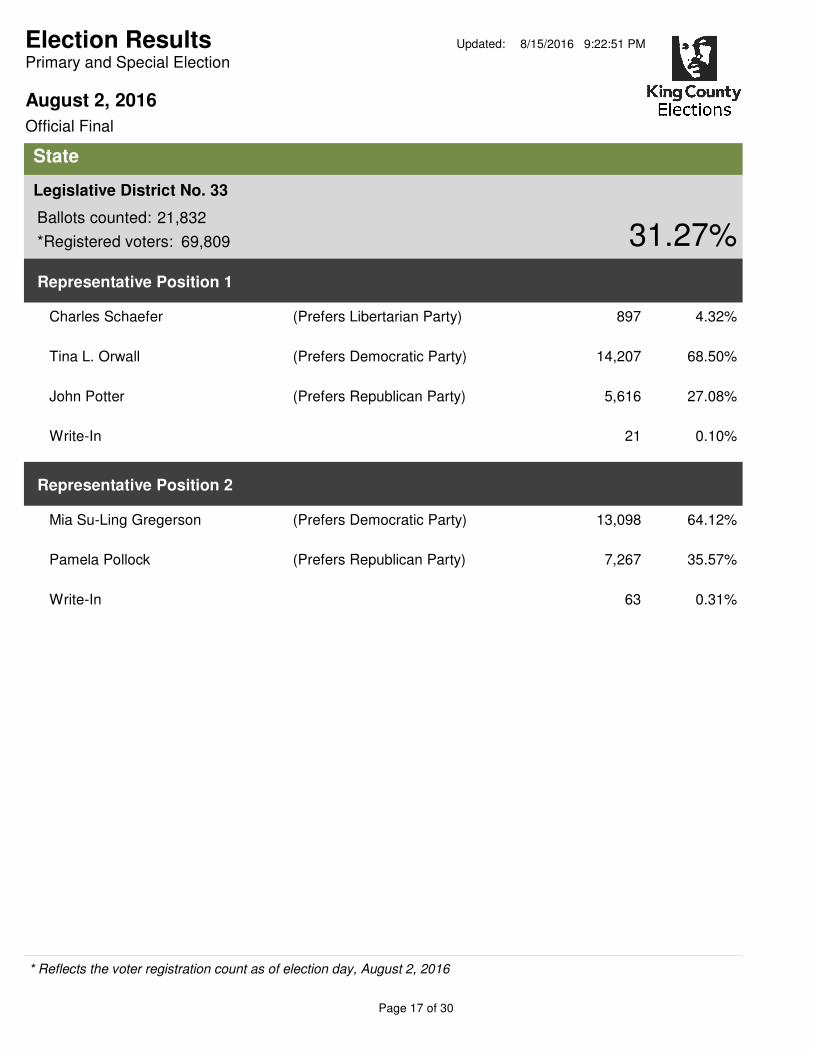
Ballots counted: 21,832
69,809 31.27%
Legislative District No. 33
*Registered voters:
Representative Position 1
Charles Schaefer (Prefers Libertarian Party) 897 4.32%
Tina L. Orwall (Prefers Democratic Party) 14,207 68.50%
John Potter (Prefers Republican Party) 5,616 27.08%
Write-In 21 0.10%
Representative Position 2
Mia Su-Ling Gregerson (Prefers Democratic Party) 13,098 64.12%
Pamela Pollock (Prefers Republican Party) 7,267 35.57%
Write-In 63 0.31%
* Reflects the voter registration count as of election day, August 2, 2016
Page 17 of 30
August 2, 2016
Primary and Special Election
Official Final
Election Results Updated: 8/15/2016 9:22:51 PM
State
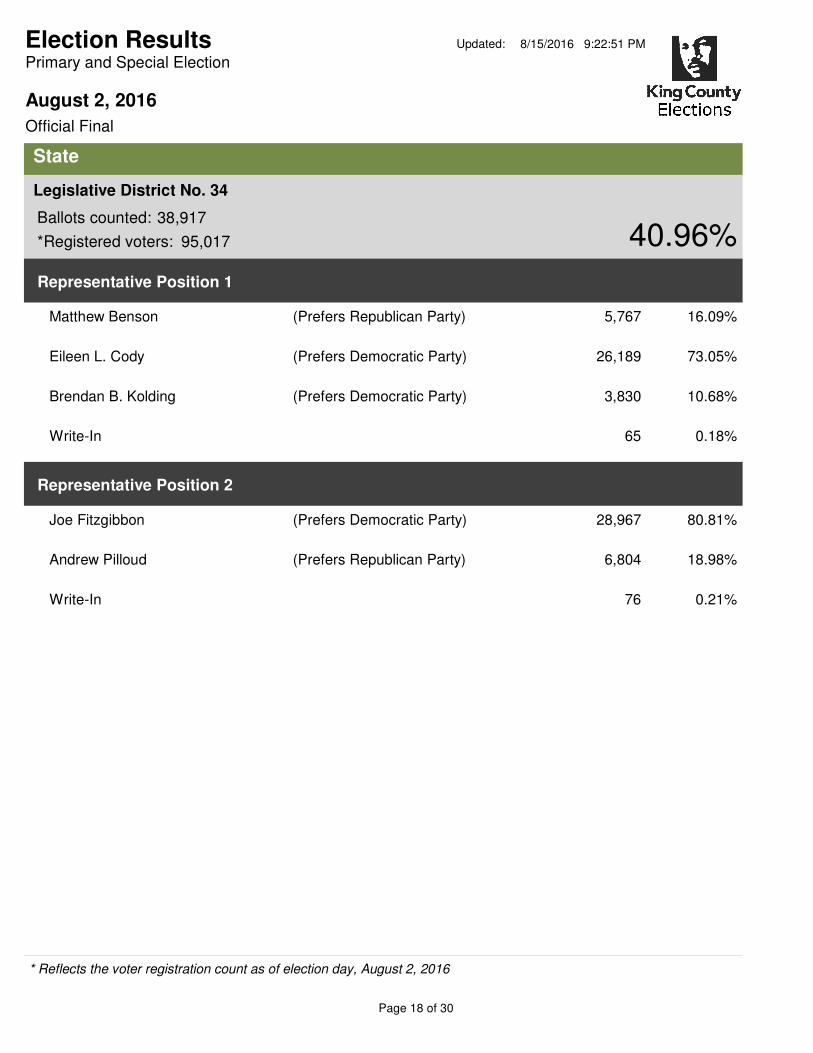
Ballots counted: 38,917
95,017 40.96%
Legislative District No. 34
*Registered voters:
Representative Position 1
Matthew Benson (Prefers Republican Party) 5,767 16.09%
Eileen L. Cody (Prefers Democratic Party) 26,189 73.05%
Brendan B. Kolding (Prefers Democratic Party) 3,830 10.68%
Write-In 65 0.18%
Representative Position 2
Joe Fitzgibbon (Prefers Democratic Party) 28,967 80.81%
Andrew Pilloud (Prefers Republican Party) 6,804 18.98%
Write-In 76 0.21%
* Reflects the voter registration count as of election day, August 2, 2016
Page 18 of 30
August 2, 2016
Primary and Special Election
Official Final
Election Results Updated: 8/15/2016 9:22:51 PM
State
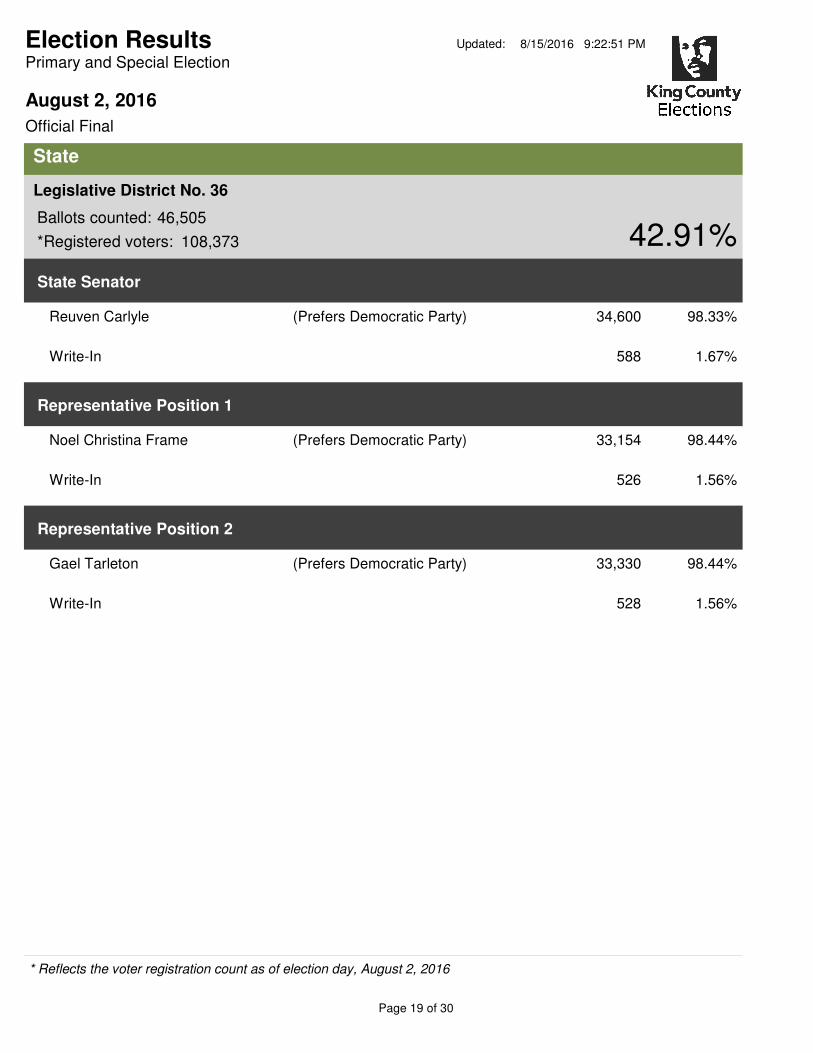
Ballots counted: 46,505
108,373 42.91%
Legislative District No. 36
*Registered voters:
State Senator
Reuven Carlyle (Prefers Democratic Party) 34,600 98.33%
Write-In 588 1.67%
Representative Position 1
Noel Christina Frame (Prefers Democratic Party) 33,154 98.44%
Write-In 526 1.56%
Representative Position 2
Gael Tarleton (Prefers Democratic Party) 33,330 98.44%
Write-In 528 1.56%
* Reflects the voter registration count as of election day, August 2, 2016
Page 19 of 30

August 2, 2016
Primary and Special Election
Official Final
Election Results Updated: 8/15/2016 9:22:51 PM
State
Ballots counted: 32,283
86,615 37.27%
Legislative District No. 37
*Registered voters:
Representative Position 1
Sharon Tomiko Santos (Prefers Democratic Party) 27,183 92.59%
John Dickinson (States No Party Preference) 1,999 6.81%
Write-In 177 0.60%
Representative Position 2
Eric Pettigrew (Prefers Democratic Party) 26,097 88.88%
Tamra Smilanich (Prefers Non-Partisan Party) 3,125 10.64%
Write-In 139 0.47%
* Reflects the voter registration count as of election day, August 2, 2016
Page 20 of 30
August 2, 2016
Primary and Special Election
Official Final
Election Results Updated: 8/15/2016 9:22:51 PM
State
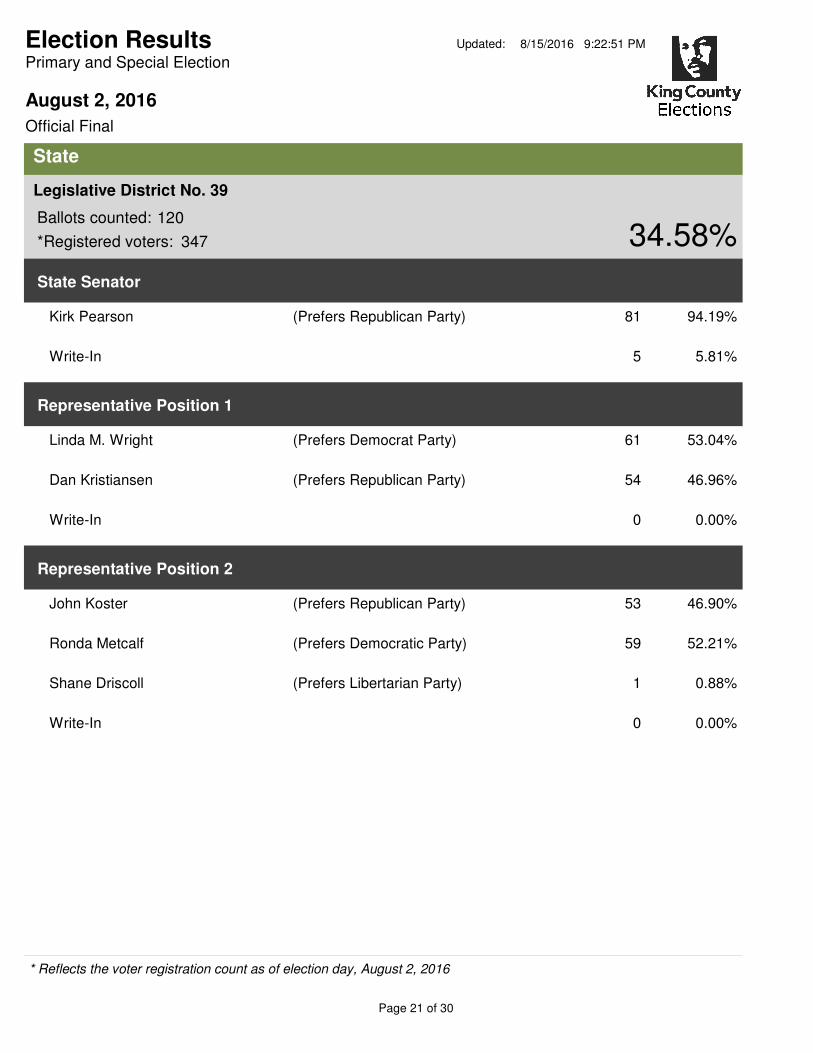
Ballots counted: 120
347 34.58%
Legislative District No. 39
*Registered voters:
State Senator
Kirk Pearson (Prefers Republican Party) 81 94.19%
Write-In 5 5.81%
Representative Position 1
Linda M. Wright (Prefers Democrat Party) 61 53.04%
Dan Kristiansen (Prefers Republican Party) 54 46.96%
Write-In 0 0.00%
Representative Position 2
John Koster (Prefers Republican Party) 53 46.90%
Ronda Metcalf (Prefers Democratic Party) 59 52.21%
Shane Driscoll (Prefers Libertarian Party) 1 0.88%
Write-In 0 0.00%
* Reflects the voter registration count as of election day, August 2, 2016
Page 21 of 30
August 2, 2016
Primary and Special Election
Official Final
Election Results Updated: 8/15/2016 9:22:51 PM
State
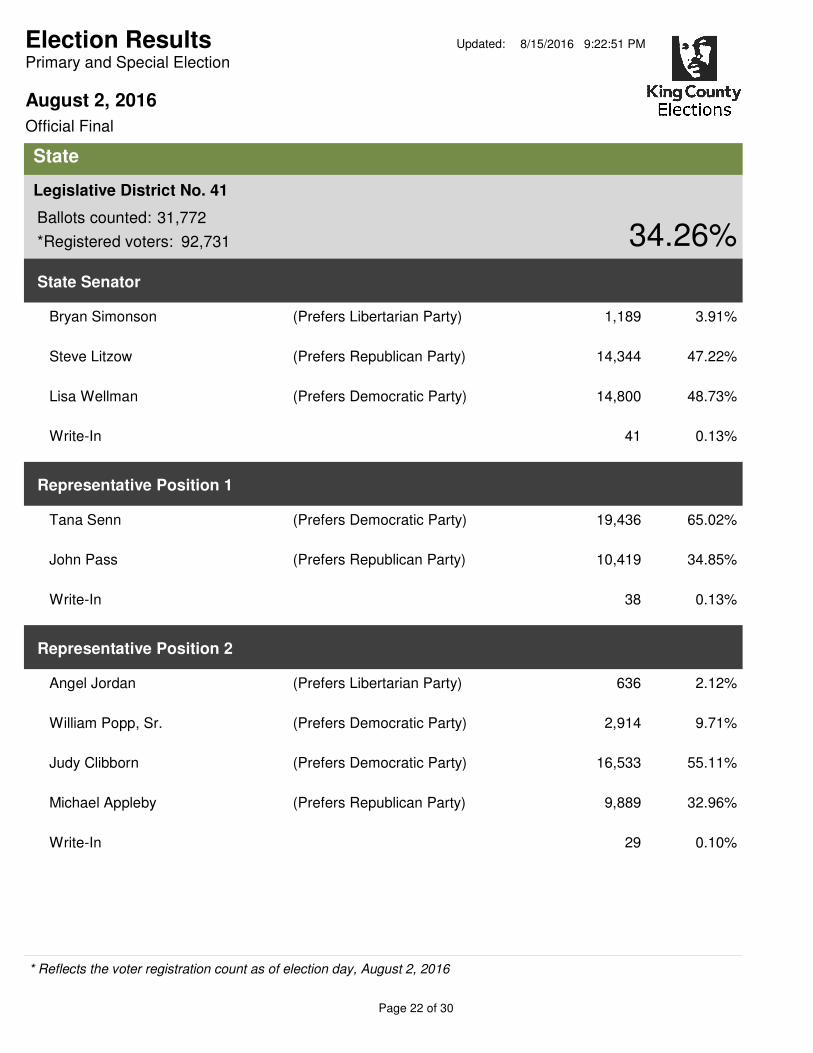
Ballots counted: 31,772
92,731 34.26%
Legislative District No. 41
*Registered voters:
State Senator
Bryan Simonson (Prefers Libertarian Party) 1,189 3.91%
Steve Litzow (Prefers Republican Party) 14,344 47.22%
Lisa Wellman (Prefers Democratic Party) 14,800 48.73%
Write-In 41 0.13%
Representative Position 1
Tana Senn (Prefers Democratic Party) 19,436 65.02%
John Pass (Prefers Republican Party) 10,419 34.85%
Write-In 38 0.13%
Representative Position 2
Angel Jordan (Prefers Libertarian Party) 636 2.12%
William Popp, Sr. (Prefers Democratic Party) 2,914 9.71%
Judy Clibborn (Prefers Democratic Party) 16,533 55.11%
Michael Appleby (Prefers Republican Party) 9,889 32.96%
Write-In 29 0.10%
* Reflects the voter registration count as of election day, August 2, 2016
Page 22 of 30
August 2, 2016
Primary and Special Election
Official Final
Election Results Updated: 8/15/2016 9:22:51 PM
State
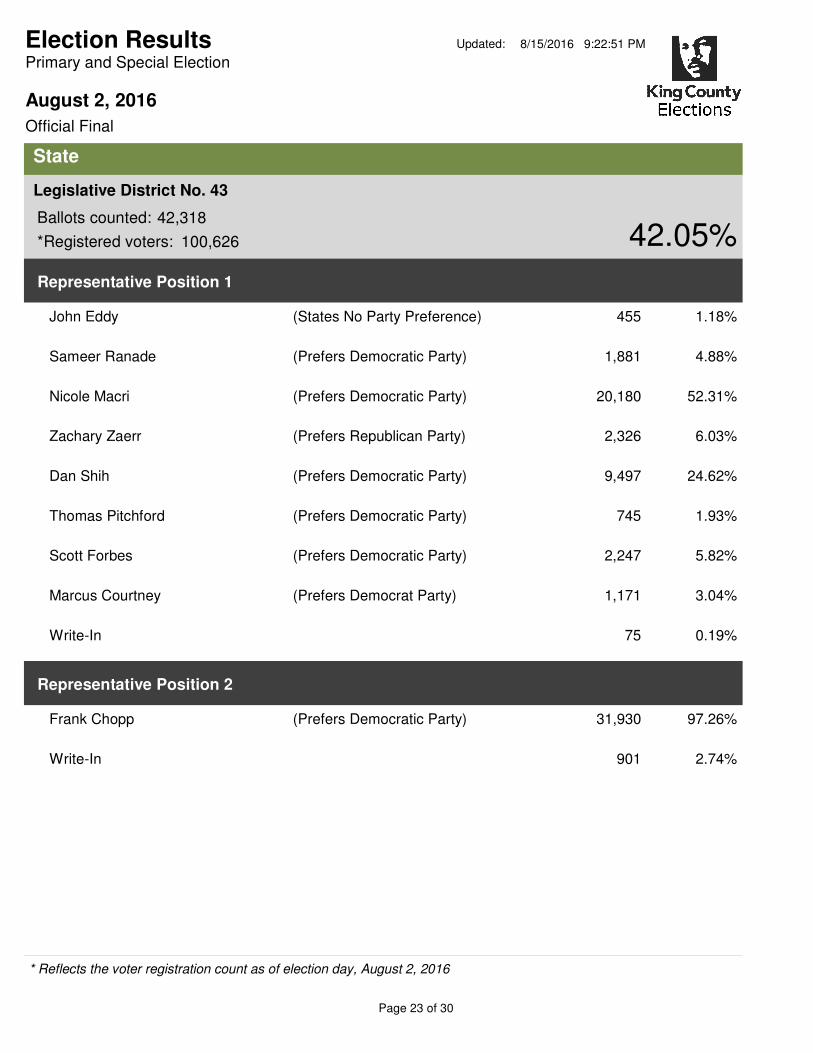
Ballots counted: 42,318
100,626 42.05%
Legislative District No. 43
*Registered voters:
Representative Position 1
John Eddy (States No Party Preference) 455 1.18%
Sameer Ranade (Prefers Democratic Party) 1,881 4.88%
Nicole Macri (Prefers Democratic Party) 20,180 52.31%
Zachary Zaerr (Prefers Republican Party) 2,326 6.03%
Dan Shih (Prefers Democratic Party) 9,497 24.62%
Thomas Pitchford (Prefers Democratic Party) 745 1.93%
Scott Forbes (Prefers Democratic Party) 2,247 5.82%
Marcus Courtney (Prefers Democrat Party) 1,171 3.04%
Write-In 75 0.19%
Representative Position 2
Frank Chopp (Prefers Democratic Party) 31,930 97.26%
Write-In 901 2.74%
* Reflects the voter registration count as of election day, August 2, 2016
Page 23 of 30
August 2, 2016
Primary and Special Election
Official Final
Election Results Updated: 8/15/2016 9:22:51 PM
State
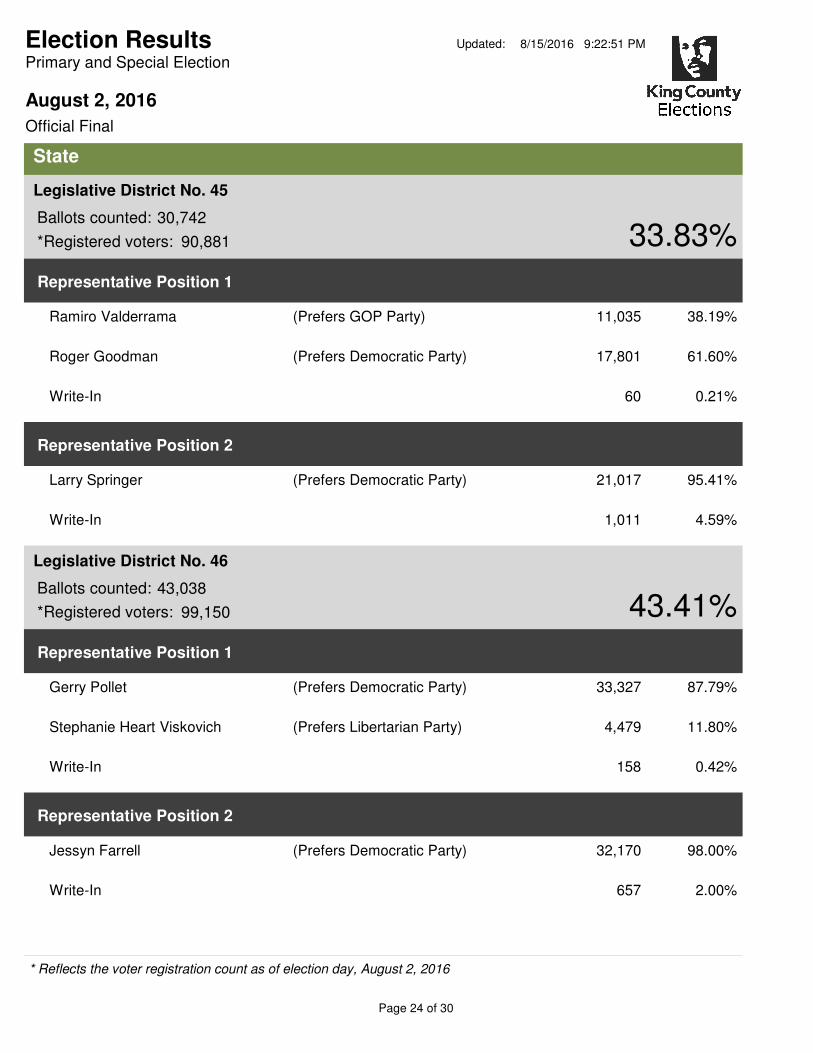
Ballots counted: 30,742
90,881 33.83%
Legislative District No. 45
*Registered voters:
Representative Position 1
Ramiro Valderrama (Prefers GOP Party) 11,035 38.19%
Roger Goodman (Prefers Democratic Party) 17,801 61.60%
Write-In 60 0.21%
Representative Position 2
Larry Springer (Prefers Democratic Party) 21,017 95.41%
Write-In 1,011 4.59%
Ballots counted: 43,038
99,150 43.41%
Legislative District No. 46
*Registered voters:
Representative Position 1
Gerry Pollet (Prefers Democratic Party) 33,327 87.79%
Stephanie Heart Viskovich (Prefers Libertarian Party) 4,479 11.80%
Write-In 158 0.42%
Representative Position 2
Jessyn Farrell (Prefers Democratic Party) 32,170 98.00%
Write-In 657 2.00%
* Reflects the voter registration count as of election day, August 2, 2016
Page 24 of 30
August 2, 2016
Primary and Special Election
Official Final
Election Results Updated: 8/15/2016 9:22:51 PM
State
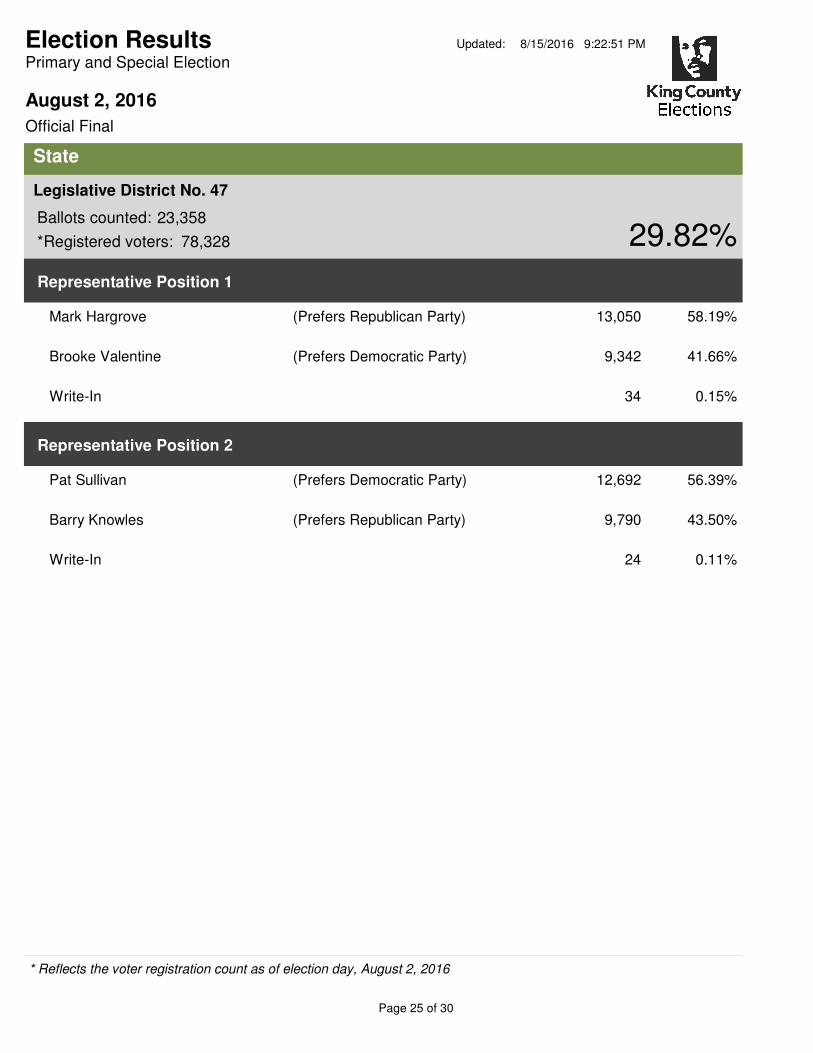
Ballots counted: 23,358
78,328 29.82%
Legislative District No. 47
*Registered voters:
Representative Position 1
Mark Hargrove (Prefers Republican Party) 13,050 58.19%
Brooke Valentine (Prefers Democratic Party) 9,342 41.66%
Write-In 34 0.15%
Representative Position 2
Pat Sullivan (Prefers Democratic Party) 12,692 56.39%
Barry Knowles (Prefers Republican Party) 9,790 43.50%
Write-In 24 0.11%
* Reflects the voter registration count as of election day, August 2, 2016
Page 25 of 30
August 2, 2016
Primary and Special Election
Official Final
Election Results Updated: 8/15/2016 9:22:51 PM
State
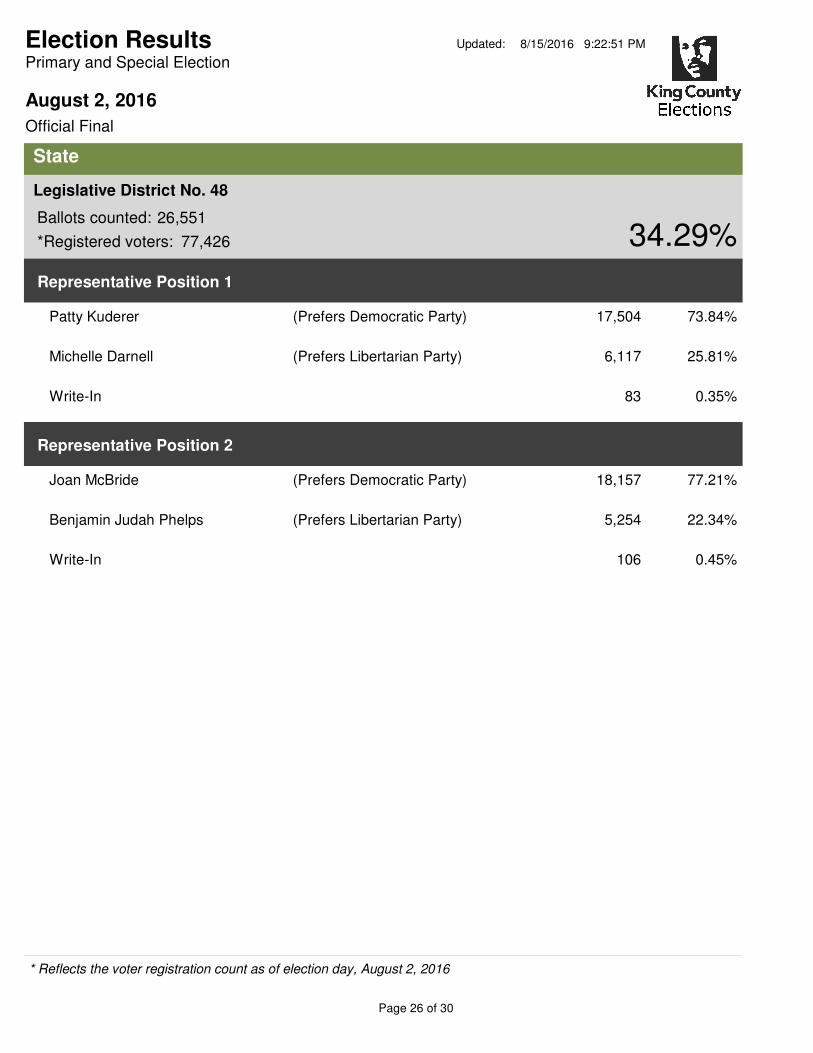
Ballots counted: 26,551
77,426 34.29%
Legislative District No. 48
*Registered voters:
Representative Position 1
Patty Kuderer (Prefers Democratic Party) 17,504 73.84%
Michelle Darnell (Prefers Libertarian Party) 6,117 25.81%
Write-In 83 0.35%
Representative Position 2
Joan McBride (Prefers Democratic Party) 18,157 77.21%
Benjamin Judah Phelps (Prefers Libertarian Party) 5,254 22.34%
Write-In 106 0.45%
* Reflects the voter registration count as of election day, August 2, 2016
Page 26 of 30
August 2, 2016
Primary and Special Election
Official Final
Election Results Updated: 8/15/2016 9:22:51 PM
State Supreme Court
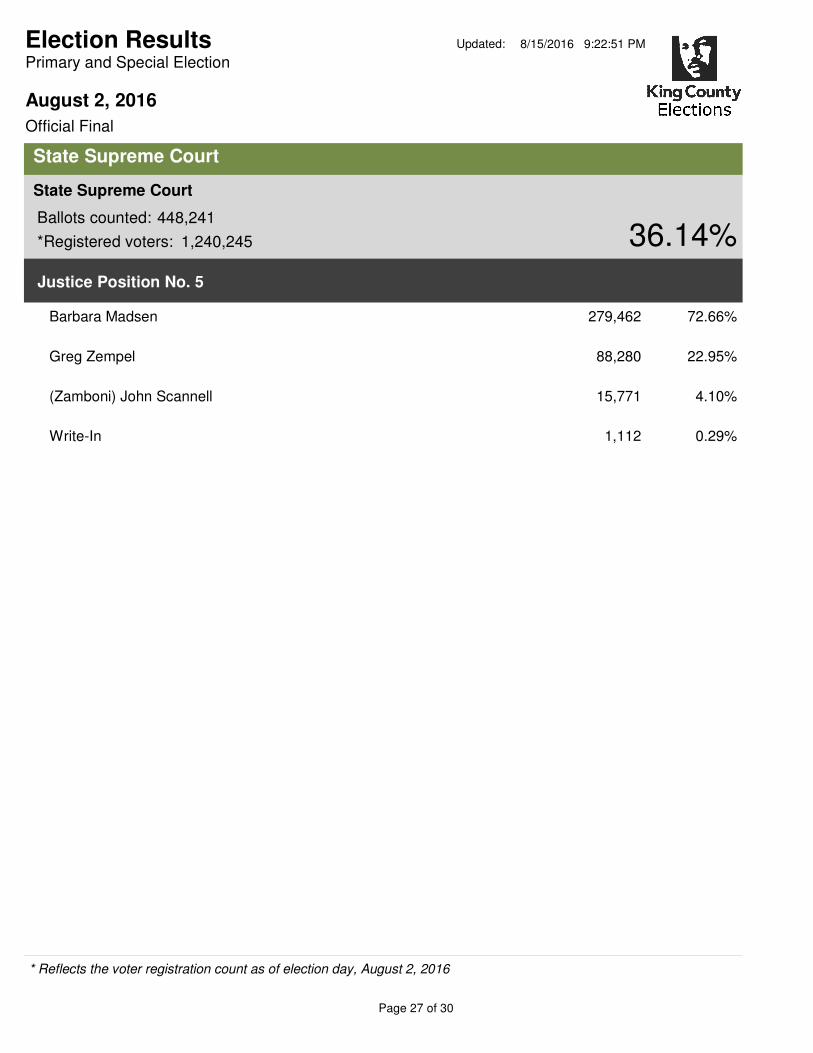
Ballots counted: 448,241
1,240,245 36.14%
State Supreme Court
*Registered voters:
Justice Position No. 5
Barbara Madsen 279,462 72.66%
Greg Zempel 88,280 22.95%
(Zamboni) John Scannell 15,771 4.10%
Write-In 1,112 0.29%
* Reflects the voter registration count as of election day, August 2, 2016
Page 27 of 30
August 2, 2016
Primary and Special Election
Official Final
Election Results Updated: 8/15/2016 9:22:51 PM
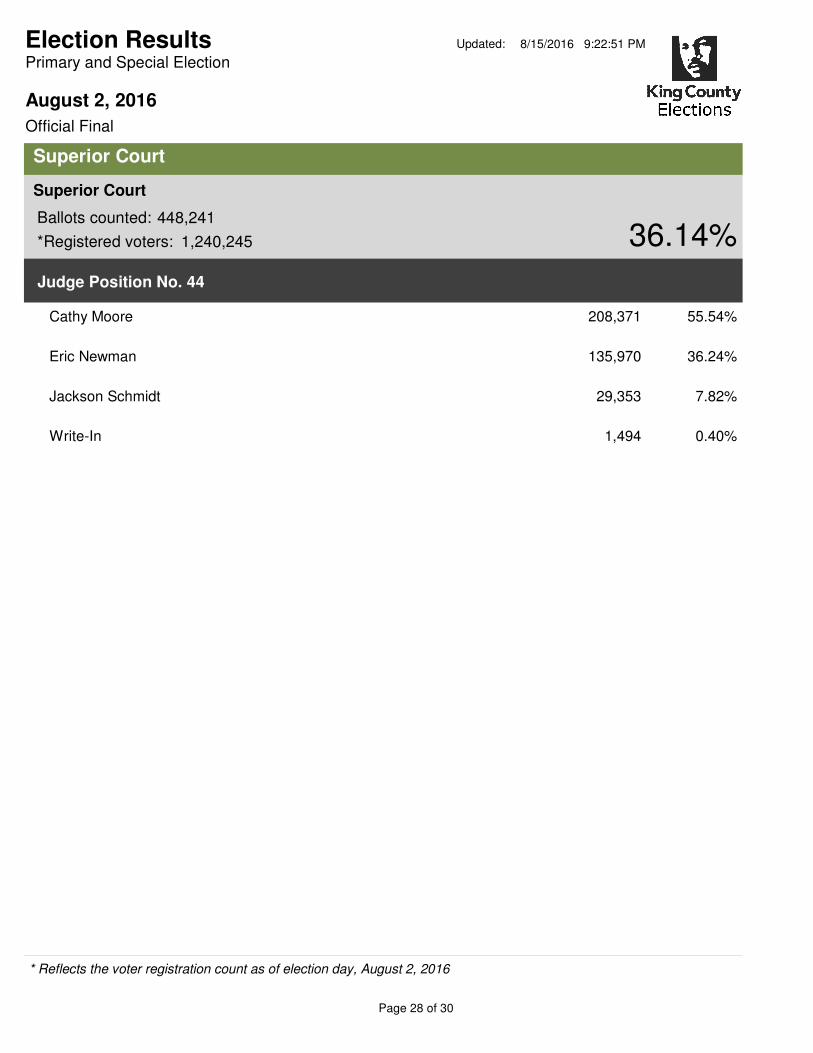
Superior Court
Ballots counted: 448,241
1,240,245 36.14%
Superior Court
*Registered voters:
Judge Position No. 44
Cathy Moore 208,371 55.54%
Eric Newman 135,970 36.24%
Jackson Schmidt 29,353 7.82%
Write-In 1,494 0.40%
* Reflects the voter registration count as of election day, August 2, 2016
Page 28 of 30
August 2, 2016
Primary and Special Election
Official Final
Election Results Updated: 8/15/2016 9:22:51 PM
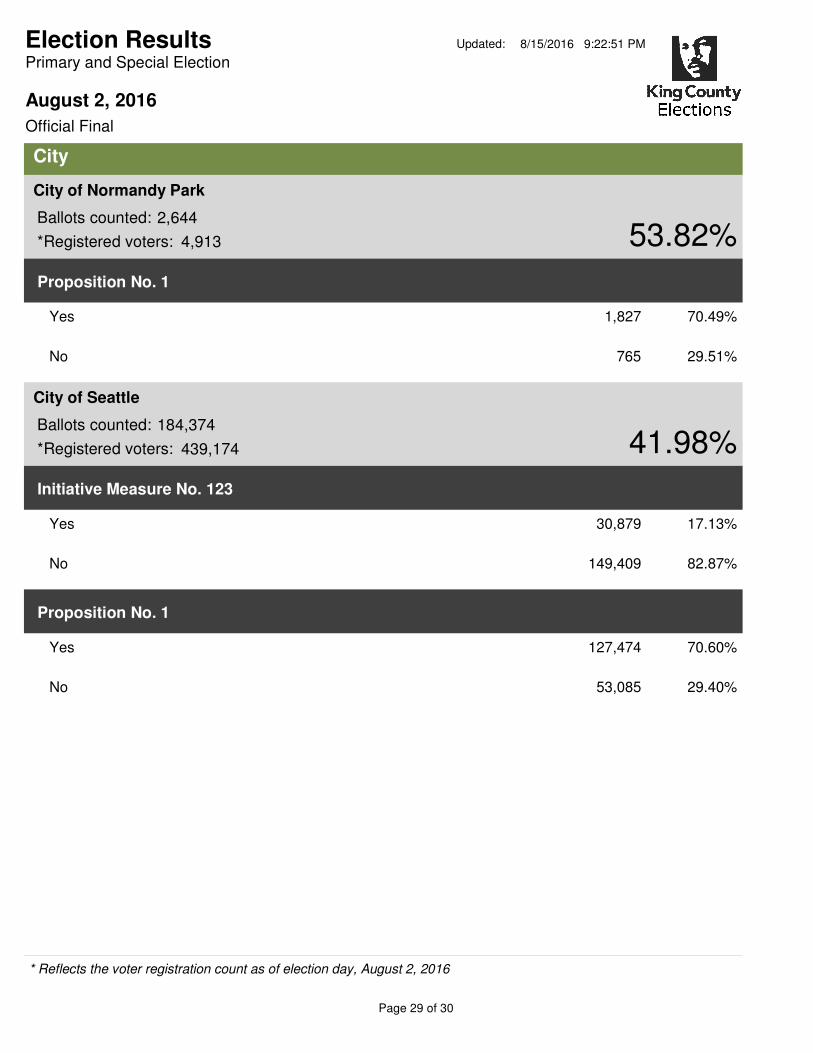
City
Ballots counted: 2,644
4,913 53.82%
City of Normandy Park
*Registered voters:
Proposition No. 1
Yes 1,827 70.49%
No 765 29.51%
Ballots counted: 184,374
439,174 41.98%
City of Seattle
*Registered voters:
Initiative Measure No. 123
Yes 30,879 17.13%
No 149,409 82.87%
Proposition No. 1
Yes 127,474 70.60%
No 53,085 29.40%
* Reflects the voter registration count as of election day, August 2, 2016
Page 29 of 30
August 2, 2016
Primary and Special Election
Official Final
Election Results Updated: 8/15/2016 9:22:51 PM
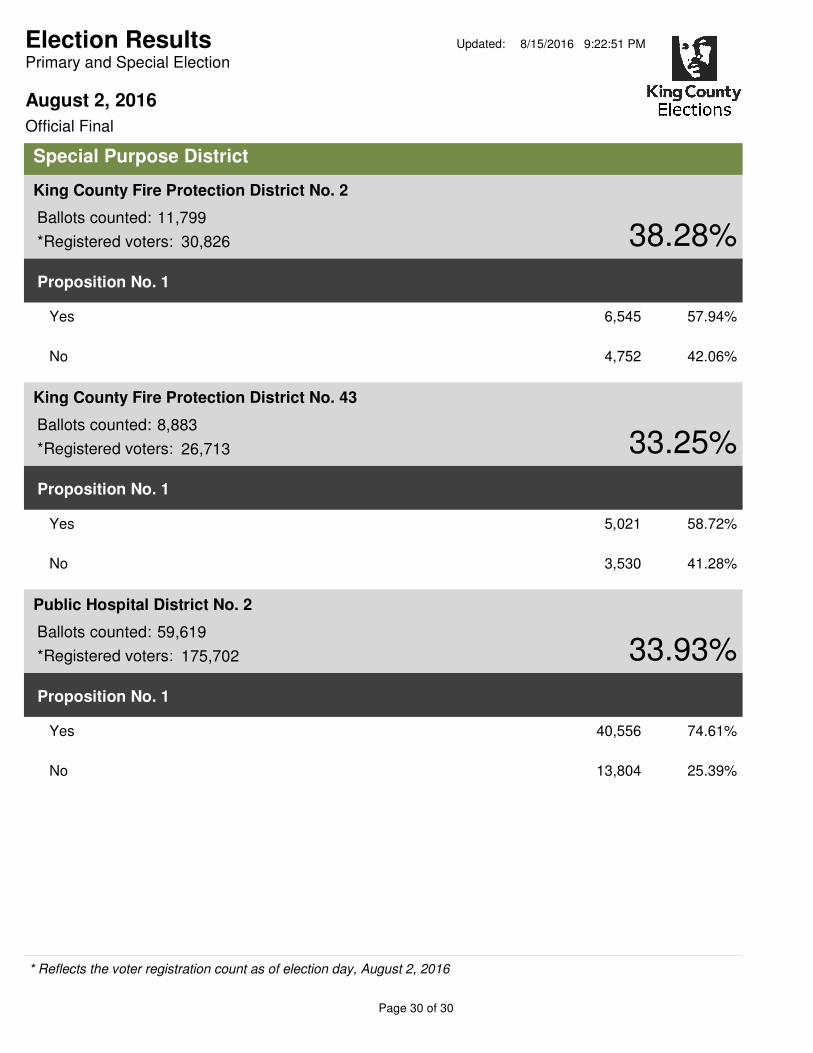
Special Purpose District
Ballots counted: 11,799
30,826 38.28%
King County Fire Protection District No. 2
*Registered voters:
Proposition No. 1
Yes 6,545 57.94%
No 4,752 42.06%
Ballots counted: 8,883
26,713 33.25%
King County Fire Protection District No. 43
*Registered voters:
Proposition No. 1
Yes 5,021 58.72%
No 3,530 41.28%
Ballots counted: 59,619
175,702 33.93%
Public Hospital District No. 2
*Registered voters:
Proposition No. 1
Yes 40,556 74.61%
No 13,804 25.39%
* Reflects the voter registration count as of election day, August 2, 2016
Page 30 of 30
![[XLS]2006 Canadian Election Final Results - SFU.ca - Simon ...aheard/elections/2006-final-results.xls · Web view2006 Election Final Results 2006 Canadian Election - Official Results](https://img.pdfslide.net/doc/110x75/5b1b856c7f8b9a23258ead47/xls2006-canadian-election-final-results-sfuca-simon-aheardelections2006-final-.jpg)