Embed Size (px)
Citation preview

Policy Research Working Paper 6782
Electoral Accountability and Local Government Spending in Indonesia
Emmanuel SkoufiasAmbar NarayanBasab Dasgupta
Kai Kaiser
The World BankPoverty Reduction and Economic Management NetworkPoverty Reduction and Equity UnitFebruary 2014
WPS6782P
ublic
Dis
clos
ure
Aut
horiz
edP
ublic
Dis
clos
ure
Aut
horiz
edP
ublic
Dis
clos
ure
Aut
horiz
edP
ublic
Dis
clos
ure
Aut
horiz
ed

Produced by the Research Support Team
Abstract
The Policy Research Working Paper Series disseminates the findings of work in progress to encourage the exchange of ideas about development issues. An objective of the series is to get the findings out quickly, even if the presentations are less than fully polished. The papers carry the names of the authors and should be cited accordingly. The findings, interpretations, and conclusions expressed in this paper are entirely those of the authors. They do not necessarily represent the views of the International Bank for Reconstruction and Development/World Bank and its affiliated organizations, or those of the Executive Directors of the World Bank or the governments they represent.
Policy Research Working Paper 6782
This paper takes advantage of the exogenous phasing of direct elections in districts and applies the double-difference estimator to measure impacts on (i) human development outcomes and (ii) the pattern of public spending and revenue generation at the district level. The analysis reveals that four years after the switch to direct elections, there have been no significant effects on human development outcomes. However, the estimates of the impact of Pilkada on health expenditures at the district level suggest that directly elected district officials may
This paper is a product of the Poverty Reduction and Equity Unit, Poverty Reduction and Economic Management Network. It is part of a larger effort by the World Bank to provide open access to its research and make a contribution to development policy discussions around the world. Policy Research Working Papers are also posted on the Web at http://econ.worldbank.org. The authors may be contacted at [email protected].
have become more responsive to local needs at least in the area of health. The composition of district expenditures changes considerably during the year and sometimes the year before the elections, shifting toward expenditure categories that allow incumbent district heads running as candidates in the direct elections to “buy” voter support. Electoral reforms did not lead to higher revenue generation from own sources and had no effect on the budget surplus of districts with directly elected heads.

ELECTORAL ACCOUNTABILITY AND LOCAL GOVERNMENT SPENDING IN INDONESIA1
Emmanuel Skoufias*
Ambar Narayan Basab Dasgupta
Kai Kaiser
THE WORLD BANK
JEL Classification Codes: D7, H7,O2, R5 Key Words: Decentralization, District Budget and Expenditures, Direct Elections, Indonesia.
1 This paper represents a revised and updated version of an earlier paper by the same authors titled “Electoral Accountability, Fiscal Decentralization, and Service Delivery in Indonesia,” available as World Bank Policy Research Working Paper No. 5614, March 2011, http://go.worldbank.org/BWBRP91A50. This version takes advantage of recently released district level revenue and expenditure data for the years 2001 to 2009, and as a consequence, the findings and conclusions differ from those in the earlier version based on only one year of post-election data. *Corresponding Author: Emmanuel Skoufias, The World Bank, Mail Stop MC I4-405, 1818 H Street NW, Washington, DC 20433, USA. tel: (202)458-7539. fax: (202)522-3134. E-mail: [email protected] Acknowledgements: The authors are grateful to Sukmawah Yuningsih, Indira Maulani Hapsari, and Laura Maratou-Kolias for excellent research assistance, and to Wolfgang Fengler, William Wallace, Shubham Chaudhuri, Daan Pattinasarany, Bastian Zaini, and Cut Dian Agustina for supporting this work over the years. Stuti Khemani, Philip Keefer, and Benjamin Olken provided very useful comments in earlier versions of this paper. The findings, interpretations, and conclusions in this paper are entirely those of the authors and do not reflect the views of the World Bank.

2
1. Introduction
The relationship between institutions of political accountability and government
performance remains a perennial concern for analysts and practitioners of public policy design.
Both developed and developing countries continue to confront the challenge of how best to
promote better basic service delivery with the objective of poverty reduction and the attainment of
the Millennium Development Goals (MDGs). The manner in which citizens can hold their service
providers accountable has increasingly been recognized as being critical to this equation (World
Bank, 2004). A confluence of these concerns can be found around two major ongoing policy
debates. First is the concern with the impacts of devolution, or the claims that bringing government
closer to the people has the potential to make government both more responsive and efficient.
Second is the debate on the impacts of the extent and nature of electoral accountability, at national
or sub-national levels. Our paper is concerned with the intersection of fiscal decentralization and
local governance, and in particular with the question of how institutional design for political
incentives and electoral accountability affects public revenue and expenditure choices.
Fiscal decentralization is generally considered as a more efficient system of resource
allocation primarily because of the informational advantages that local authorities may have over
central authorities (Hayek, 1948). However, the theoretical literature has recognized that fiscal
decentralization may be neither a necessary nor a sufficient condition for a more efficient allocation
of resources unless serious consideration is given to the role of political systems and the incentives
of local authorities. Political institutions shape incentives, and fiscal decentralization requires
political institutions that not only balance accountability and representation at the local level but
also contribute to political centralization, i.e., aligning local political incentives with national
interests (Blanchard and Shleifer, 2001; Enikolopov and Zhuravskaya, 2007).
The political economy literature identifies two main political institutions: Parliamentarism
and Presidentialism (e.g., Persson and Tabellini, 2004a). In a parliamentary regime, an elected
parliament appoints the top executive (indirect elections). In a presidential regime, instead, the
citizens directly elect the executive (direct elections). Both systems have checks and balances of
different strength, though, in general, presidentialism is believed to be associated with stronger
accountability than parliamentarism. In a presidential regime, voters can punish or reward
politicians through re-election which is conducive to good behavior. Thus, directly elected officials
are likely to feel accountable to the preferences of the population of their own jurisdiction, which

3
increases the informational advantage of fiscal decentralization.2 To a large extent, similar
incentives and disciplining mechanisms are at work in a parliamentary democracy where the
indirectly elected (or parliament appointed) executive can be removed from the office by a no-
confidence vote by the legislature. 3
Depending on the degree to which these two forms of government are associated with more
exclusive consideration of local interests, the misalignment of local political incentives with
national interests may also become an important factor in the nexus between fiscal decentralization
and political systems. In this regard, strong national parties may help align political incentives of
local politicians with national objectives by affecting career concerns of local politicians (Riker,
1964).4 Local politicians may have the incentive to internalize the externalities of their policies
aiming to benefit citizens in their jurisdiction (i.e. start taking into consideration the preferences of
the populations in other jurisdictions) in the hope of getting recognition, promotion, and political
support from their national party which, in principle, cares about national level performance.
The evidence on the preferred political institution to complement fiscal decentralization is
rather mixed.5 A fundamental challenge for the empirical literature has been to establish a more
robust causal link between political institutions and fiscal or service delivery outcomes, given the
reliance on cross-country time-series data, the prevalence of endogeneity, and likely unobserved
country differences explaining public sector behavior and outcomes (e.g., Persson and Tabellini,
2004b). However, two papers are directly relevant to the objectives of this study. The first is Baqir
(2002), who compares public spending in U.S. municipalities differing in their form of government.
In some US municipalities the mayor is directly elected (presidentialism), whereas in others the
chief executive is indirectly elected (i.e., appointed by the municipal council) as in parliamentarism.
Baqir finds that the prediction of Persson et al. (2000) about the size of government spending being
lower in a presidential regime is confirmed by the fact that government spending is lower in the
municipalities where the mayor is directly elected compared to the municipalities where the mayor
2 Recently, however, the literature has also noted that the advantage of decentralizing delivery mechanisms to directly elected local authorities may be undermined by greater elite capture (Bardhan and Mookherjee, 2000, Ahmad, et al., 2005; Devarajan, et al., 2009). 3 Persson, Roland, and Tabellini (2000), predict that presidential regimes have lower spending and taxation than parliamentary regimes for reasons related to the absence of risk of no-confidence vote and the separation of powers under a presidential regime. In addition, they predict that presidential regimes should be associated with more targeted programs at the expense of broad spending programs. 4 An alternative system is administrative subordination, whereby central authorities appoint local governments rather than having them being elected (Riker, 1964; Blanchard and Shleifer, 2001; Martinez-Bravo, 2013). Enikolopov and Zhuravskaya (2007), confirm Riker’s hypothesis that appointing local politicians rather than electing them does not improve the results of fiscal decentralization. 5 For a recent survey of the literature of decentralization and local participation see Mansuri and Rao (2012).

4
is accountable to a municipal legislature. The second is Valsecchi (2013), who estimates the impact
on corruption of the switch from parliamentarism to presidentialism in Indonesia, and finds that
the switch to direct elections increases the number of corruption crimes by about half the pre-
election average.6
Indonesia’s dual political transition to democratization and greater devolution from the late
1990s (Hofman and Kaiser, 2004, 2006) provides a unique opportunity to empirically assess the
impact of reforms in political institutions on local government behavior, in a fiscally decentralized
setting. The reforms assigned several hundred local governments across Indonesia with wide-
ranging responsibilities over basic service delivery for education, health, infrastructure and general
public administration; and introduced changes, in a phased manner, in the way local executive
leaders (i.e., district heads) were selected. Although fiscal decentralization was implemented in a
“Big Bang” in 2001, local heads of districts were initially indirectly selected by the local legislatures.
Starting in 2005, district heads were selected through direct elections among citizens – following a
more “presidential” rather than “parliamentary” system. The unique feature of this reform, crucial
to our identification strategy, was that the change in political selection occurred in a staggered
manner, with the timing of the change depending on when the term of the previous head had ended
in a district, which appears to be exogenously determined. Given that the timing of the first ever
direct election of the district head in each district was determined by whether the head selected by
the previous system had served their full tenure, direct elections had been held in a little more than
one-third of all (434 in 2005) districts in June 2005. The remaining districts continued to be under
the existing regime until the tenure of each of their indirectly elected heads was over. By 2007,
around 62 percent of districts had undergone direct elections.
Against this background, this paper contributes mainly in three ways. First, the paper
provides some of the first robust causal evidence on the impacts on accountability and fiscal
outcomes of the switch from parliamentarism to presidentialism in Indonesia. The paper also
provides a more convincing strategy to identify empirically the effect of an electoral reform – taking
advantage of the phased and exogenous timing of districts switching to direct elections to identify
the causal effect of directly elected district heads on district-level human development outcomes,
spending and revenue. This is possible due to the rare opportunity afforded by the implementation
of electoral reform in Indonesia, which approximates a “natural experiment”. Reforms related to
6 Faguet (2004), also uses municipality-level panel data from Bolivia to find that the switch to decentralized governance in Bolivia improved policy responsiveness to citizen needs, based on an analysis of sector-specific spending trends. But given that decentralization occurred countrywide, Faguet’s analysis is limited to “before and after” comparisons without considering explicitly the role of political institutions.

5
decentralization and democratization on a national scale, due to their political nature, are not at all
amenable to randomized intervention designs that would require differential treatment to be
socially engineered across sub-national governments. In most countries where such political
reform has occurred, the timing has provided no scope for constructing separate “treatment” and
comparison groups (e.g. Faguet, 2004).
Second, the paper adds to the stock of growing empirical evidence on the merits and
demerits of local direct elections for development outcomes and the quality of public policy within
developing countries. A number of recent studies have found that local (or village-level) elections
improve public good provision in different countries such as India (Foster and Rosenzweig, 2004)
and China (Martinez-Bravo et al. 2011).7 De Janvry et al. (2012) also demonstrate that electoral
incentives affect the performance of a major decentralized conditional cash transfer program in
Brazil.8 Our paper complements these studies by providing new evidence on the extent to which the
switch from indirect to direct elections affects policy choices regarding district-level spending and
revenue, in a setting where fiscal decentralization is already in place.
Finally, the paper contributes to the literature on political business cycles that suggests that
incumbent politicians are likely to manipulate government expenditures to enhance their
probability of reelection (Alesina et al. 1997; Drazen, 2000; Suharnoko et al. 2013). Taking
advantage of the fact that the majority (53.4 percent) of the directly elected district heads were
incumbents in the districts where direct elections were held between 2005 and 2007, our paper
compares district level expenditures during the election year, or the year before, against
expenditures in the same years in districts where elections were held later (in 2008 or later).9 The
significant changes in the pattern of district spending in these election years in the set of districts
where direct elections were held thus provides a lower bound estimate of the extent to which
district spending is influenced by the election cycle in the districts where incumbents (both
successful and unsuccessful) ran for direct election.
The paper is structured as follows: Section 2 summarizes the transitions in sub-national
political accountability mechanisms and decentralization before and after Indonesia’s ‘New Order’
regime. Section 3 discusses the data and empirical methodology we use to test whether political
7 The impacts of the introduction of local elections to some of China’s villages are also analyzed by Zhang et. al. (2004) who find that the introduction of electoral accountability does not increase the level of revenue mobilization, but shifts it from individuals to enterprises. 8 First-term mayors adopted program implementation practices that were not only more transparent but also associated with better program outcomes, which increased the likelihood of their re-election. 9 This is in contrast to Suharnoko et al. (2013) or Besley and Case (1995), who compare the differences in expenditures among governors who are eligible for reelection compared to those who are ineligible to stand for reelection.

6
reform had an impact on outcomes or public expenditure patterns across Indonesian districts.
Section 4 presents the results from the empirical exercise of evaluating impacts on the main human
development outcomes. In section 5 the analysis focuses on the impacts of the electoral reforms on
district spending by sector and economic classification and on revenue and budget surplus. Section
6 concludes the paper.
2. Background on the Accountability of Local Governments in Indonesia
For over three decades (1965-1998), Indonesia’s ‘New Order’ government under President
Soeharto could be characterized as a highly centralized and autocratic political regime. The East
Asia economic crisis of 1997/98 disrupted what had been overall a highly successful development
trajectory until then and highlighted a number of institutional weaknesses of the prevailing political
regime (Temple, 2001). The pressures culminated in the downfall of President Suharto in 1998 and
significant demands for political reform.
Despite its highly centralized rule, the regime did allow some space for local political
representation and local government. The 1974 Law on Local Government (Law No. 5/74)
provided some degree of bottom-up accountability, including through elections, even if these were
highly stage-managed. Local governments in Indonesia were comprised of a regional head,
executive agencies, and the local assembly (DPRD). Prior to 1999, regional legislators were drawn
from a closed list of candidates and all political appointments were dictated by the Ministry of
Home Affairs (MoHA), frequently from military backgrounds. Moreover, local governments were
highly dependent on earmarks and discretionary transfers, as well as limited own source revenues
(Malley, 2003). The bulk of basic service delivery at the local level was in the hands of
deconcentrated central offices. Even in sectors where they had notional primary responsibility,
local governments were in effect the poor cousins of central government presence. But as de facto
representatives of the central government, local heads already enjoyed a significant degree of
convening power.
Throughout the 1990s, economic progress and demand for greater political autonomy saw
growing pressures for greater democratization and decentralization. In June 1999, Indonesia’s first
relatively free and fair elections in 44 years were held, sweeping in a new batch of more assertive

7
local legislatures (DPRD).10 In August 1999, two ground breaking decentralization laws were
passed. These in effect transferred the bulk of basic service delivery to 300+ district governments
(as opposed to provinces and governors), folded the deconcentrated structures into these local
government structures and provided them with a significant block grant as well as natural resource
revenue sharing (World Bank, 2003).
Although it was not until 2001 that local legislatures had general oversight of a larger
consolidated local budget (APBD), the newly empowered legislatures had greater control over
selecting new local heads (replacing heads whose five year terms were coming to an end), more
open lists, and more limited edits by the Ministry of Home Affairs (Decree No. 22/1999). The 1999
DPRD also had the right to impeach local heads, thereby prematurely ending their terms. The
timing of the five-year cycle differs across local governments, while deviations from the cycle can
only occur due to death, illness, a no-confidence vote, or the creation of a new district. As local
heads of the executive, mayors in urban areas and regents in rural areas have significant powers to
set the priorities in the budget (including overall levels and types of spending) as well as its
execution. In popular terms they have often been described as raya kecil, or little kings, although
incumbents are subject to a maximum of two terms.
The political powers of the local legislatures to select, control, and potentially even dismiss
local heads of government soon raised a number of concerns. First, there was a sense of DPRD
over-reaching their powers, blurring an effective balance of governance between executive and
legislative agencies. Among the central and sub-national executive and civil service, there was a
growing recognition of the need to re-balance this relationship. Second, local politics centered on
DPRD were seen as becoming increasingly vulnerable to money politics.11 Since legislators
themselves had short time horizons and limited programmatic party discipline, they may have had
limited incentives to hold local executives to account for greater public good provision.
The concerns about indirect political accountability triggered the second wave of local
government electoral reform toward direct elections (Pilkada Langsung) under Law No. 32/2004
(Erb and Sulistiyanto, 2009; Schiller, 2009). This reform made the local head more directly
accountable to the people by stipulating that (s)he would be directly elected by citizens, and
provided a clearer definition of the head’s political functioning. The law stipulated that the head 10 Power was transferred from Soeharto to his vice-president Habibie in May 1998, while 48 parties then took part in the June 1999 elections. 11 To secure or maintain the office of head of local government, especially in the wake of larger central government block transfers, regional heads reportedly found it easier to pay off the balance of two dozen legislators or so (Mietzner, 1997). A targeted reward, equivalent to the price of a car, to swing legislators, could virtually guarantee staying in office or getting an election vote (Malley, 2003:110).

8
should: (i) administer the jurisdiction as per the guidelines laid down by DPRD, (ii) implement local
laws, including budget, (iii) present accountability reports to the DPRD and central government,
and (iv) provide information to citizens on the government’s performance. 12
Based on the new Pilkada amendment, the government decided to conduct the first batch of
direct elections in June 2005 in the districts where the tenure of the indirectly elected (by DPRD)
district heads were ending. The first batch of direct elections concerned all the regional head
positions that had opened between December 2004 and April 2005. If the tenure of any DPRD head
was due to end in the first few months of 2005, the government extended their terms up to the
direct elections. In some districts, a caretaker government had been appointed prior to the
December 2004 law, who were allowed to serve till the elections. By June 2005, 155 districts had
directly elected heads.
An important fact to note is the concurrent creation of new districts. From 2001 to 2007,
the number of districts increased from just over three hundred to 434; and new district head
positions opened up in the newly created child districts.13 Given that it is difficult to compare the
spending structure and levels of districts affected by splits, our analysis covers only those districts
that are unaffected by splits.14 By 2007, 304 out of a total of 434 districts – including “undivided”
and split districts – had held direct elections (Figure 1a). Among the 238 districts that remained
undivided between 2005 and 2009, 163 districts had held direct elections for district heads by
2007, including 101districts that did so in 2005 (Figure 1b). All districts had direct elections by
2010.15
[Figures 1a & 1b about here]
12 The democratic reform was intended to make the district heads more accountable to their constituencies (Kaiser, et al., 2006). But some degree of political centralization (Blanchard and Shleifer, 2001) was maintained by the requirement that candidates must be selected and endorsed by one of the major political parties or a coalition of small political parties with a minimum of 15 percent of the votes/seats on the local assemblies (Schiller, 2009). 13 These district splits were more pronounced outside of Java, in larger areas, as well as those that had significant resource endowments (Fitrani, et al., 2005). Among the original 336 districts in 2001, 238 districts did not split during 2001-09 period. 14 Combining the newly split districts with each other would make them comparable in terms of geography and population with the “old” district. However, governments of split districts are unlikely to behave the same way as the government of the old district would have if it had not been split. Furthermore, in many cases the parent districts continued with their existing government while the newly formed districts held direct elections. Combining the split districts may therefore lead to a mixing of different electoral regimes for the same district in the same time period, which would distort those very effects this study intends to measure. 15 The districts were also different in terms of which of the previous systems they were transitioning from. Some districts moved to direct election from a weaker version of democracy where the district head was indirectly elected, while others moved directly from the older ‘New Order’ (the system of appointing as opposed to electing district heads) system to direct election (see Table 1). Efforts to empirically exploit differences in the channel of transition to direct elections did not yield any significant differences.

9
As noted earlier, the timing of a direct election for undivided local governments depended
on when the five year term of the previous head had come to an end.16 Due to historical differences
in the year of establishment of the regional governments in Indonesia since its independence,
regions have different election dates (Pratikno, 2009). Table 1 below provides the year by year
breakdown of the mode of selection of district heads for the undivided as well as the districts that
split. The table demonstrates clearly that even during the New Order period (pre-1999), the
appointments of district heads were made at different times, a feature that led to the phasing of the
direct elections beginning in 2005.
[Table 1 about here]
3. Data and Empirical Methodology
Data
To conduct the analysis, we assemble a large dataset, compiled from multiple sources all
linked at the district level. The district level data on electoral information contains information for
the period 1999 to 2007 on how the current district head was selected (e.g. by pre-1999 DPRD,
indirect elections by post-1999 DPRD, direct elections, or whether (s)he is a caretaker head
appointed by the central government until the next elections), the name of the elected district head,
whether (s)he was preceded by a caretaker district head, whether the incumbent governor won or
ran in the elections, the reason for the incumbent governor not contending, the share of votes won,
the number of candidates , the political party, the date the term began and ends, some key personal
characteristics such as gender, and whether (s)he is in the military.17
The key outcome measures at the district level are constructed from the annual national
socioeconomic surveys of households in Indonesia (SUSENAS) which are representative at the
district level since 2000. District budget data for 2001 to 2009 (Fiscal Year of January-December
every year), was derived from the Regional Financial Information System (Sistem Informasi
16 The timing of the election for the “parent” district of all divided districts (not included in our sample for analysis) also depended on when the tenure of the previous head ended. 17 This was compiled by the Jakarta World Bank team with the collaboration of the Ministry of Home Affairs (MoHA) and a number of local institutions, including NDI Indonesia, and the Asia Foundation.

10
Keuangan Daerah, SIKD) of the Ministry of Finance.18 District expenditures are available for 12
different sectors/functions (such as agriculture, health, education, etc.) and for four economic
classifications (personnel, goods and services, capital, and other). District revenues are available
from seven different sources, such as the General Allocation Fund (DAU), and the Special Allocation
Fund (DAK), revenues from the balancing fund, shared taxes, and shared natural resources, and
revenues from own sources, such as revenues from hotel and restaurant taxes, and motor
vehicles.19 All expenditure and revenue categories are expressed in per-capita terms by dividing by
the district population size in the relevant year, and adjusted for spatial cost of living differences
among districts and by the national consumer price index for changes in prices over time (base year
2007).20
Methodology
We first establish that the timing of direct elections in the districts since the 2004 reform is
a good “natural experiment” in the sense that it provides an “exogenous source of variation in the
explanatory variables that determine treatment assignment”, thus allowing causal inferences
(Meyer, 1995; Robinson et al. 2009). Our argument for exogeneity of treatment rests on two
features: that direct elections in 2005 and later were held in the districts where the terms of the
previous district heads were coming to full term; and that the cross-district variation in when the
previous district head’s term ended was due to historical differences in the timing of election
(indirectly by DPRD) or appointment (under the New Order system) of that individual. To find
evidence in favor of this argument, we would need to show that the timing of not only the direct
election, but also the appointments of indirectly elected district heads, depends on the timing of the
end of the previous head’s term. If this were true, and considering that the timing of district head
appointments has varied across districts historically (see Table 1), it would support our claim that
the timing of direct elections was exogenous.
As evidence, we first present estimates from a probit model of whether a district has had
direct elections between 2005 and 2007 (as per Law 34/2004). The electoral reform of 2004 18 SIKD is a facility provided by the Ministry of Finance (MoF) to collect, validate, process, and analyze regional financial information. Regional governments have the legal obligation to report the data to MoF in a timely manner. Given that the budget format has changed at least twice during the 2001 to 2009 period, we use the district expenditure data from the Policy and Economic Research (DAPOER) data base, created painstakingly by the World Bank team in Jakarta. This data base contains district expenditures by sector and economic classifications that are consistent and comparable over time. 19 The expenditure data for 2001 to 2009 either by function or by classification are data on "realized" or actual expenditures as reported by the district governments. The revenue data for 2001 to 2009 are also "realized" revenues. 20 In the absence of a national spatial cost of living index, the ratio of the district specific poverty line in 2007 to the average poverty line in the 6 districts in the Jakarta metropolitan area (DKI) in 2007 is used.

11
continued the same practice of holding direct elections in the districts where the term of the
existing district head was due to end. The explanatory variables include characteristics related to
the district economy (per capita GDP in 2005, and unemployment rate in 2004), the proportion of
the district population that is urban in 2005, whether the district is classified administratively as a
rural district, the share of mining and the share of electricity to total district GDP in 2005, the
distance of the district from the provincial capital, and regional fixed effects. In the probit model of
whether a district had direct election between 2005 and 2007, the variable indicating whether the
last government served full term before the direct election is able to predict perfectly whether a
direct election was carried out and thus dropped from the probit model, whereas all other district
level characteristics are insignificant (see Table 2a).
[Tables 2a and 2b about here]
In Table 2b we present analogous estimates from a probit model of whether a district has
had an indirectly appointed district head in 2000, as this was the year with the highest proportion
(36 percent) of district heads appointed indirectly by the local district parliaments (DPRD) after the
passing of the law (Law No. 22/1999). The explanatory variables include characteristics related to
the district economy in the year 2000 (per capita GDP, and unemployment rate), urbanization, and
regional fixed effects. The estimates in Table 2b also confirm that whether a district had an indirect
election in 2000 was also determined by whether the tenure of the existing district head was due to
end, and not by other district characteristics. These results support the claim that whether a district
had direct elections or not is exogenous for the purpose of our analysis, i.e. it is independent of
district characteristics that can potentially influence public investment and outcomes.21
4. The Impact of Direct Elections on Outcomes
Next, we establish that the shift to direct elections for the district government (Pilkada) in
Indonesia had no significant effects on the human development outcomes in the four years after the
elections. We use a difference-in-difference (DiD) approach to measure the impact, utilizing the 21 We have also carried out t-tests of the extent to which the sample of treatment and control districts is balanced by testing the equality in the means of the district levels variables used as explanatory variables in the probit models in Table 2. Except for the variable identifying whether the last district head served full term, the null hypothesis of identical means could not be rejected, thus confirming a balanced sample.
12
“natural experiment” element of how direct elections were implemented. We focus on the post
fiscal decentralization period – between 2001 and 2009 – considering the impacts of direct
elections for local government (Law No. 34/2004) in an undivided district as the “treatment” group.
The outcome and fiscal variables on which we expect to see an impact are from the years 2006-
2009; the first round of direct elections in 67 undivided districts took place in June 2005 and 34
more had elections in the successive quarters in 2005. In the first part of analysis on the impacts of
electoral reforms on human development outcomes, we choose the end of 2005 as the switching
point between “pre” and “post” Pilkada periods, which implies that our dataset includes
observations from both pre- and post-direct election periods. We define those districts as
“treatment” where direct election had occurred in 2005 (101 districts), while the control districts
are those that did not have direct elections until 2008 or later (82 districts). Districts that had direct
elections in 2006 or 2007 (62 districts) are omitted from the regressions involving outcomes. In
the remainder of the paper, focusing on the impact of the electoral reform on district level spending
and revenues, we adopt a more flexible specification that includes the 62 districts that had direct
election in 2006 or 2007 as separate treatment groups in the regressions, and also allow for the
possibility that district spending might change in the year of the election and/or before elections.
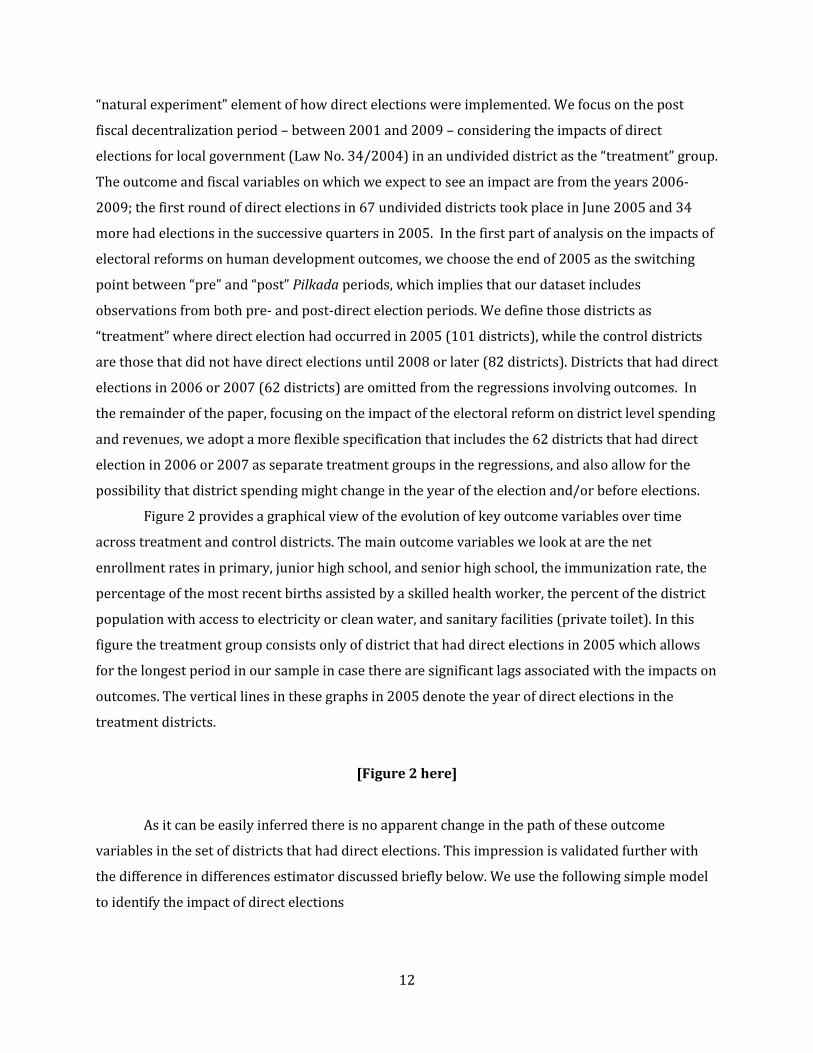
Figure 2 provides a graphical view of the evolution of key outcome variables over time
across treatment and control districts. The main outcome variables we look at are the net
enrollment rates in primary, junior high school, and senior high school, the immunization rate, the
percentage of the most recent births assisted by a skilled health worker, the percent of the district
population with access to electricity or clean water, and sanitary facilities (private toilet). In this
figure the treatment group consists only of district that had direct elections in 2005 which allows
for the longest period in our sample in case there are significant lags associated with the impacts on
outcomes. The vertical lines in these graphs in 2005 denote the year of direct elections in the
treatment districts.
[Figure 2 here]
As it can be easily inferred there is no apparent change in the path of these outcome
variables in the set of districts that had direct elections. This impression is validated further with
the difference in differences estimator discussed briefly below. We use the following simple model
to identify the impact of direct elections

13
𝑌𝑚𝑡 = 𝛼0 + 𝛽𝐷𝐸05 + γ(DE05 ∗ YR0609) + δYR0609 + 𝜇𝑚 + 𝜀𝑚𝑡 (1)
The dependent variable 𝑌𝑚𝑡represents the outcome variable of interest for district m at
time t (2001 to 2009). By construction, the binary variable 𝐷𝐸05 takes the value 1 if district m is in
the treatment group (i.e. direct elections were held in the district between June and December
2005) and equal to 0 otherwise. The binary variable 𝑌𝑅0609 takes the value 1 if t corresponds to
the post-direct election years 2006 to 2009, and 0 for the pre-direct election reform years 2001 to
2005, while 𝜇𝑚 denotes the district fixed-effect summarizing the role of all observable and
unobservable variables at the district level that do not vary over time. The disturbance term 𝜀𝑚𝑡
summarizes the influence of all other unobserved variables that vary across districts and over time,
assumed to be uncorrelated with the variables in the regression, though it is allowed to be
correlated over time.
The parameter 𝛽 then identifies the effect of any systemic difference between the treatment
and control groups of districts on the dependent variable in the pre-Pilkada years (i.e., 2001-2005)
while the parameter 𝛿 identifies the “year effect” on the dependent variable, namely the effect of
any systemic changes that affected all districts in the post-Pilkada years. Our parameter of interest
is 𝛾 since it provides estimates of the difference-in-differences (or DiD) of the impact of direct
election in the years after Pilkada took place (i.e. 2006 to 2009) on the dependent variable.22
Specifically, the DiD estimate of the impact of Pilkada in the years after direct elections, i.e.,
2006 to 2009, provides an estimate of the average change in the outcome variable 𝑌 in the treated
group from pre-Pilkada (denoted by the subscript preE) to post-Pilkada years (denoted by the
subscript postE) relative to changes in outcome variable in the control group over the same period
of time, i.e.,
𝛾 = �𝑌�𝑝𝑜𝑠𝑡𝐸 − 𝑌�𝑝𝑟𝑒𝐸|𝐷𝐸05 = 1� − �𝑌�𝑝𝑜𝑠𝑡𝐸 − 𝑌�𝑝𝑟𝑒𝐸|𝐷𝐸05 = 0�. (2)
Importantly, a maintained assumption is that the integrity of the control group, i.e. districts
that held direct election in 2008 or later, is not compromised by the possibility of the forthcoming
22 We have also estimated the specification that with a more flexible specification of the year effects with a binary variable for each year and interaction of these year effects since 1996 with the binary variable identifying the "treatment" districts that held direct election in 2005, i.e., 𝑌𝑚𝑡 = 𝛼0 + 𝛽𝐷𝐸05 + ∑ δtt=2009
t=2001 YRt + ∑ γtt=2009t=2006 (𝐷𝐸05 ∗ 𝑌𝑅𝑡) + 𝜇𝑚 + 𝜀𝑚𝑡. This
specification allows one to explore the sustainability of any potential impacts on the dependent variable of interest. Given the absence of any significant impacts, these estimates are not reported here but are available from the authors upon request.

14
elections.23 Keeping this caveat in mind, the DiD estimates in Table 3 confirm that in the four years
after direct elections there is no statistically significant impact on the outcome variables that can be
attributed to the shift towards direct elections in Indonesia.
[Table 3 here]
5. The Impact of Direct Elections on District Spending, Revenues, and Budget
Surplus
Recognizing that that outcomes sometimes change with considerable lags, we now look at
potential impacts of direct elections on district-level spending. Higher expenditures on basic public
services, on the average, are likely to be an early indicator for a better performing or more
responsive local government. While higher expenditures are no guarantee for actual improvements
in public services, improving availability and quality of services more often than not requires
additional investment.24 Expenditures are likely to indicate better performance among local
governments in the Indonesian context, where the recent fiscal decentralization is likely to have
increased the amount of resources at the disposal of local governments. Higher spending on public
services is therefore likely to indicate more readiness on the part of a directly elected local
government to utilize the available resources.
Local government financing is characterized by a limited own-source revenue base, which
represents on average less than a tenth of total revenues. Local governments are highly dependent
on central transfers, notably a block grant (DAU), which is the largest source of revenue for most
districts; 25 natural resource revenue sharing, which is particularly important for a number of
districts outside of Java; revenue sharing from income and property taxes – a source of revenue
23 The possibility of district expenditures changing during or even before the year of direct elections is examined in more detail in section 5. 24 However, one should bear in mind that there is also evidence that corruption in developing countries makes spending a poor proxy for service delivery both because funds are diverted and because corruption might bias spending in types of spending that easier to steal (Olken 2007; Ferraz and Finan, 2011). Delavallade (2006) suggests that higher country corruption appears to distort spending away from social sectors (health, education, social protection) toward other public services, fuel, and energy. De la Croix and Delavallade (2009) also develop a model and an empirical test to show that more predatory/rent-seeking governments invest more in housing and physical capital than in health and education. 25 The DAU block grant is the largest source of revenue for most districts, and its allocation is based on a formula aiming to address disparities between local expenditures needs and local own fiscal potential (Agustina et al. 2012). In 2003, for example, DAU accounted for an average of 64 percent of total revenues in the control districts and just under 70 percent in the treatment districts (see Table A.1 in Annex).

15
particularly important for urban districts; and other sources of revenue.26 Local governments are
able to engage in some borrowing, and also build up cash reserves (Lewis, 2005, 2007). Aggregate
spending decisions are therefore contingent on own-source revenue base and effort, central
transfer allocations, and savings/borrowing decisions.
Including revenue generation from own sources in the analysis allows us to investigate the
relationship between democratic reforms and own revenue generation. Some of the literature on
the subject appears to suggest an inverse relationship. A priori, the impacts of democratic reforms
on own-source revenue generation would be expected to be ambiguous, given not only the
pressures to increase expenditures but also the political pain of increasing taxes on the local
population – since the median voter is usually poor in a developing country, the government would
like to commit to low levels of future taxation.
Budget surplus of the district is defined as the simple difference between total expenditures
and total revenue of the district. Total revenue is defined as the sum of revenues from own sources,
revenue from tax sharing with the center, revenue from of non-tax (i.e. natural resource) revenue
sharing with center, the block grants (DAU and DAK) and revenue from other sources.
[Figure 3 here]
Figure 3 provides a graphical summary of the evolution of selected fiscal variables over time
and across treatment and control districts for the 101 districts that had direct election in 2005. 27 A
key identifying assumption for the application of the DiD estimator is that the time trend is identical
between the treatment and control groups in the years prior to the elections. The graphs in figure 3
suggest that the assumption of common trends prior to the elections (2001-2005) is valid. Overall,
figure 3 displays no visible changes in the pattern of total expenditures for the treatment districts,
suggesting that direct elections have no impact on the level of total district expenditures.28 Direct
elections also appear to have no visible impact on the level of education and health expenditures in
the treatment districts after 2005. Lastly, the two graphs at the bottom suggest that direct elections
could be associated with a small positive increase in the revenue from own sources (PAD), though 26 A specific grant (DAK) is also established in the intergovernmental fiscal system, but its role has been limited to-date. 27Note the analysis of district expenditures and revenues does not include the 6 districts in the metropolitan Jakarta area (DKI Jakarta) as these districts are not autonomous from the Jakarta province budget managed by the province governor. 28 Table A.1 in the Annex presents the means and t-tests of the equality in the means of the expenditure and revenue variables between treatment and control districts in 2003 (prior to the 2005 shift to direct elections). The means and t-test are based on the sample of undivided districts that had direct election between 2005 and 2007 (163 treatment districts ) and the 82 control districts that had election in 2008 or later. The t-test results also confirm a balanced sample between treatment and control districts.

16
there are no apparent differences in the fiscal surplus of districts with direct elections in 2005
compared to those that had direct elections in 2008 or later. 29
The literature suggests that increased democratic accountability and the direct election of
regional heads could have a number of implications for policy choices by local governments. First, a
shift to direct elections holds the promise to increase political accountability to the broader
electorate. This would make governments more responsive to local needs, which could lead to
directly elected heads spending more on aggregate to deliver more or better services, either by
reducing savings or increasing borrowing. Second, the shift to direct elections may trigger shifts in
the policy choices and spending of incumbent district heads who were indirectly appointed in this
position and who have ambitions to get reelected in office (by direct elections) through spending
that is directed to better or more services.
There are potential complications associated with the use of fiscal expenditure variables in
evaluating the impacts of direct elections. An important one is that district expenditures may
change not only after the elections but before or during the election year, especially if the
incumbent district heads are candidates in the elections. The political business cycle literature
suggests that incumbent politicians are likely to manipulate government expenditures to enhance
their probability of reelection (Besley and Case, 1995; Alesina et al. 1997; Drazen, 2000). In
parallel, however, some authors argue that manipulation of expenditures and policies for the
purposes of election or re-election is more likely to occur after direct elections at the local level
have been in place for a while (e.g. Khemani, 2004). To the extent there are changes in expenditure
patterns prior to elections, then simple expenditure comparisons before and after the election year
are likely to yield estimates of the impacts of Pilkada on district spending that are biased
downward.
In Indonesia, district heads that were indirectly appointed by the local parliaments prior to
2004 were allowed to run for re-election with many of the incumbents getting elected to continue
in office. Even if the switch to the direct election regime is considered to be an “unexpected shock”
at its first instance, it is still conceivable that incumbents changed their expenditure patterns and
policy choices to increase their chances of election in 2005. In fact, Suharnoko et al. (2013) provide
evidence that in districts in which the incumbent is running for election, the increase in spending
29 Average revenue per capita increased from 2005 to 2006 for both treatment and control groups alike, in contrast to the smaller increase in expenditures from 2005 to 2006. This is due to two reasons: (i) in 2006 the formula used to allocate the DAU block grant to districts, which makes up the bulk of the district revenues, was revised substantially leading to substantial increases in district revenues; and (ii) in 2006 higher oil prices resulted in an increase the level of the overall pool of DAU funds (Agustina et al., 2012, pp. 374-376).

17
during the election year is 20 percent higher than in districts in which the incumbent is not seeking
election. The election data at our disposal does not contain information on whether the incumbent
district heads ran for election in the year of direct elections or not, but only on whether the newly
elected district head was an incumbent or not (i.e. the successful incumbents only). In the 163
districts where direct elections were held between 2005 and 2007, slightly more than half (53
percent) had incumbents who were successful in getting elected. 30 The remaining 47 percent of
districts likely included a sizeable number of districts where the incumbent did not contest the
election.
Thus on the one hand, incumbents are more likely to increase their spending when they are
contesting elections (Suharnoko et al., 2013) and on the other hand, some of the direct elections did
not have incumbents contesting. Given this, any evidence from our data in favor of active
manipulation of district spending in districts where direct elections were held, in the year of (or
prior to) elections, is likely to provide only a lower bound estimate of the extent to which district
spending changed in the districts where incumbents (both successful and unsuccessful) ran for
direct election.
To allow for the possibility of district spending changing in the year of election or the year
before elections, we re-estimate an amended specification of equation (1), i.e.
𝑌𝑚𝑡 = 𝛼0 + 𝛽05𝐷𝐸05 + 𝛽06𝐷𝐸06 + 𝛽07𝐷𝐸07 + ∑ δtYRtt=2009t=2001 +
+ ∑ γ05,t
t=2009t=2004 (DE05 ∗ 𝑌𝑅𝑡) +
+ ∑ γ06,tt=2009t=2005 (DE06 ∗ 𝑌𝑅𝑡)+
+ ∑ γ07,tt=2009t=2006 (DE07 ∗ 𝑌𝑅𝑡) + 𝜇𝑚 + 𝜀𝑚𝑡, (2)
where 𝜇𝑚 denotes the district fixed-effects as before, and 𝜀𝑚𝑡 is an error term summarizing the
influence of all other unobserved variables that vary across districts and over time. The set of
comparison districts used is identical to that used in the earlier regressions, i.e. the districts that did
not have direct elections until 2008 and later. 31 The main differences between the specification
above and equation (1) are the following: (i) there are three different treatment groups of districts
30 Specifically, among the 101 districts where direct elections were held in 2005, 55 of the newly elected district heads were incumbents. Among the 45 (17) districts where direct elections were held in 2006 (2007), 24 (8) of the newly elected district heads were incumbents. 31 It should be noted that our control group may also be less questionable than the one used by Suharnoko et al. (2013), i.e., the set of districts where the incumbents were not seeking reelection.

18
depending on the year in which direct elections were held, i.e. DE05=1 if elections were held in
2005, 0 otherwise, DE06=1 if elections were held in 2006, 0 otherwise, and DE07=1 if elections
were held in 2007, 0 otherwise; (ii) the DiD effect is estimated for each treatment group separately
for each year beginning with the year prior to the election year as opposed to the specification in
equation (1) where the DiD is estimated for all the years before and the years after the election year
of 2005 (i.e. 2006 to 2009 vs. 2001 to 2005). To the extent that there is a purposeful manipulation
of the level and pattern of district expenditures during election years, then one would expect that
there is a significant effect of Pilkada in the years that elections were held, i.e., and 𝛾0𝑡,𝑡 ≠ 0, where
t= 2005, 2006, and 2007. Moreover, it should be the case that 𝛾05,2004 = 0, since the law regarding
the direct elections was not approved by the parliament until late in 2004 thus not leaving much
room for the manipulation of expenditures for re-election in 2004.
The fiscal variables used as dependent variables in regression equation (2) consist of three
groups of variables: (i) expenditures by sector, such as health, education, agriculture, etc.; (ii)
expenditure by economic classification; and (iii) revenue from own sources and budget surplus.
Table A.2 in the Annex provides a detailed description of the components of expenditures in each
sector.
Tables 4, 5, and 6 below present the estimates obtained from estimating regression
equation (2) for each of the three sets of expenditure and revenue variables. Robust standard
errors takings into account the potential serial correlation in the error term 𝜀𝑚𝑡 are estimated by
clustering by district (Bertrand et al., 2004).
[Table 4 here]
The estimates of the impacts of Pilkada on district spending in the first round of elections in
2005 or the year before are consistent with prior expectations. The absence of any significant
impacts on the majority of expenditures in specific sectors in 2004 and 2005 is consistent with the
interpretation that the passage of the law in late 2004 did not leave much time for adjustments in
the expenditures of specific sectors or at least that there was not much to gained from increasing
expenditures in specific sectors during the election year (see estimates in shaded rows of Tables 4).
Direct elections also appear to have no significant impacts on total expenditures per capita
before, during, and after elections in the set of districts that had direct elections in 2005 and in
2006. One of the theoretical predictions derived by Persson, Roland, and Tabellini (2000), is that
presidential regimes have lower spending and taxation than parliamentary regimes for reasons

19
related to the absence of risk of no-confidence vote and the separation of powers under a
presidential regime.32 Our findings do not confirm this prediction.
There is, however, an increase, albeit sporadic, in the number of cases of significant impacts
of Pilkada on district spending in specific sectors during election years and in sometimes in the pre-
election year in the districts that had direct elections later (i.e., in 2006 and 2007). For example,
expenditures in social protection increase significantly in 2005 and 2006 (between 45 and 52
percent) accompanied by large compensatory reductions in expenditures in environment and
infrastructure over the same years so that total expenditures remain unaffected over the same
years. After elections, the increases in social protection wither away. Similarly, expenditures on
health increase significantly in the year of election and before in the set of districts that had direct
elections in 2007. 33
In contrast to the pattern observed in the districts that had elections earlier, the increase in
district spending in specific sectors during the election year is not accompanied by compensating
reductions in the spending in other sectors in the 2007 election year, thus resulting in an increase
in total district expenditures in that year. The increase in total expenditures, however, is not
sufficiently high to be associated with a significant decline in the budget surplus (see shaded rows
of Table 6).
Table 5 reports the estimates for regression equation (2) using the alternative classification
of district expenditures in both levels (in log) and as a share of total expenditures. Expenditures by
economic classification include total expenditures aggregated across the different sectors on: (i)
capital, defined as expenditures on assets with durability of more than 12 months, (ii) goods and
services, defined as expenditures on services and assets with durability of less than 12 months, (iii)
personnel, which includes the salary of civil servants in each of the sectors, and (iv) “other”, which
consist of expenditures (not necessarily in order of significance) on subsidies, interest payments,
shared revenues with and support grants to subdistricts related primarily to increasing their fiscal
capacity, unforeseeable spending related to natural disasters, and social assistance spending aiming
to increase people’s welfare. The expenditures on personnel as well as those on “other” may be
considered as especially amenable to “buying” political support around election time. Suharnoko et
32 Based on cross-country and time-series data, Persson and Tabelinni (2004a and 2004b) estimate that a constitutional reform that switched the form of government from parliamentary to presidential in a country drawn at random from their sample of 83 democracies in the 1990s would reduce the total size of government spending by about 5 percent of GDP in the long run. 33 This may be in part explained by increased spending on the local health insurance scheme (Jamkesda), which left considerable discretion to local governments. Jamkesda is discussed in more detail later in the paper.

20
al. (2013) argue that “other” expenditures are directly under the control of the district governor
such as funding of small village projects, supporting of sport clubs or mosques, etc.
[Table 5 here]
The estimates in Table 5 reinforce the results of Table 4. During the year and sometimes in
the year before the election, the level and/or the share of expenditures on capital and on goods and
services decreases while expenditures on “other” and on personnel increase. Moreover, these
expenditure patterns are prevalent during the election year or before, while they disappear in the
years after the elections. All in all, the estimates in Tables 4 and 5, and particularly in Table 5, reveal
a strong pattern consistent with efforts to "buy" political support around election time. In most
cases these patterns disappear after elections have taken place.
Regarding the post-election impacts of direct elections on district spending in different
sectors, the estimates in Table 4 reveal that there is a significant post-election increase in health
expenditures soon after elections among all the districts that had direct elections in 2005, 2006, or
2007.34 Interestingly, the increase in district spending in health is accompanied by a significant
decrease in “other” spending (see Table 5) so as to finance these increases in health spending
without increasing the district budget deficit (see Table 6).
Since data on disaggregated health expenditures of the district government are not
available for most years, we can only speculate about the categories of expenditure that could have
driven the increase. 35 District spending in health includes expenditures on family planning
programs, the procurement of medical and health equipment, the food and medicine monitoring
program, the prevention of infectious disease program, and the variety of health insurance schemes
for the poor provided by the districts (summarized by the name Jaminan Kesehatan Daerah or
Jamkesda). There is some reason to believe that the increase in district health spending is linked to,
at least in part, higher spending on Jamkesda.36 As discussed in more detail in Harimurti et al.
34 There are also significant increases in the expenditures on the environment which includes expenditures on programs related to natural resource conservation and protection, and forest rehabilitation. However, these increases are only prevalent in the group of districts that had direct elections in 2005 and not among the districts that had elections later. 35 More detailed evidence on the positive relation between the expenditures in health and the expenditures in district-provided Jamkesda-type programs in the districts that had direct elections is extremely difficult to produce. First, the program-specific data that are required for this exercise are available only for 2008 and 2009. Second, districts do not necessarily follow the codes and guidelines provided by the MoHA, and use different names for the variety of the locally provided health insurance programs. 36 The program-specific data aggregated across all districts in these two years separately, suggest that expenditures in the Partnership on Health Service Improvement Program (or Program Kemitraan Peningkatan Pelayanan Kesehatan) an easily identified Jamkesda program, have tripled between 2008 and 2009. In addition, in 2008, the mean expenditures on

21
(2013), Jamkesda is the district level complement to the central government financed health
coverage program called Jamkesmas, whose target group includes all poor and near-poor
households in the country. Since the target group of Jamkesda is identified by a combination of
means testing and local government eligibility criteria, there is a significant discretionary
component in the implementation of the local health insurance scheme. A district government can,
for example, use Jamkesda to cover the poor and near poor in the district who were not covered by
the budget allocation by the central program.37
[Table 6 here]
Finally, the estimates in table 6 reveal that direct elections had no significantly positive
impact on own revenue or budget surplus. If anything, the level and the share of revenue from own
sources decreased significantly during the years of direct elections.
6. Concluding Remarks
Given the sequencing of reforms in Indonesia, our findings shed light on the effects of
political decentralization in a setting where the legal and institutional framework of fiscal
decentralization is already in place. By isolating the impact of political decentralization in the form
of electoral reforms from other aspects of decentralization, our analysis complements the literature
on the impact of decentralization on the investments and responsiveness of local governments.
Our results suggest that electoral reforms that promote grassroots democracy did make
some difference in the way local governments function in Indonesia. The reforms, which introduced
direct elections to elect district government heads in a phased manner, did nothing to raise the
district governments’ performance in terms of human development outcomes. Perhaps the analysis
of human development outcomes is premature, due to the relatively short time horizon and the the same program in the undivided districts were higher in the districts that had direct elections in 2006, than the districts that had direct elections in 2008 or later. These latter results shed some light on the factors behind the significant effects of Pilkada on health expenditures in Table 4. 37 In 2005, Indonesia’s national statistics agency, Badan Pusat Statistik (BPS), conducted a National Poverty Census Survey that was then used to construct a proxy means test with 14 asset indicators for the purpose of identifying eligible households for Jamkesmas, and producing a list of quotas for the poor and near-poor for each district in the country. Districts validated and verified data from BPS using various methods depending on their preference. For example, some districts conducted their own surveys, while other districts used the list from BPS that only identifies the head of household. If the number of poor and near-poor was greater than the BPS district allocation number, these individuals were encouraged to enroll in the local health insurance scheme (Jamkesda), if available.

22
small number of health and education indicators we measure the impact on. Tracking a more
expanded set of outcome or service delivery indicators over a longer period of time is therefore an
important area for follow-up work.
However, the composition of district expenditures appear to change considerably during
the year and sometimes the year before the elections, towards expenditure categories that likely
allow the incumbent district heads running as candidates in the direct elections to "buy" political
support and votes. Specifically, expenditures in personnel and “other” discretionary categories
increase significantly in the year of election and fall back to normal levels in a year or so after the
elections.
Our analysis also suggests that direct elections may have increased the responsiveness of
district governments to local needs at least in the area of health. After direct elections, there has
been a significant increase in district expenditures in health – an increase that may be in part due to
district heads using their discretion to provide local health insurance for a segment of the target
group (the poor and near-poor) who were not covered by the budget allocation by the central
program Jamkesmas. This finding constitutes some of the first, albeit indirect, evidence that political
decentralization, following fiscal decentralization, provides incentives for local governments to
become more accountable to their poor citizens.
Our analysis also suggests that electoral reforms did not lead to higher revenue generation
from own sources and had no effect on the budget surplus of districts with directly elected heads. A
priori, we were ambiguous about the direction of the impact of direct elections on own source
revenue generation, due to the competing effects of the need to increase expenditures on the one
hand and the political difficulty of increasing local taxes on the other. The results, along with the
findings of no significant impacts on budget surplus, suggest that the increased electoral
accountability for local governments was accompanied by a generally prudent approach to fiscal
balances. This conclusion is reinforced further by the finding that the increase in district spending
in health was financed by a significant decrease in “other” discretionary spending that kept the
district fiscal balance unchanged.
At least a couple of important questions emerge from our analysis that merit exploration in
future work. One key question is whether the observed increases in district spending on health
(and the possible underlying policy reforms) are sustained over time. The increased spending on
health after the first round of direct elections may well reflect the incentive of district heads to win
popular support for their reelection in office for a second term. However, once reelected for a
second term, the incentive of local districts heads to continue supporting an expansion of health

23
programs may weaken in the presence of term limits. There is a potential countervailing force as
well: rising party loyalty of district heads in Indonesia and the continued reputation of political
parties with district voters may eventually become sufficiently strong forces that manage to
counteract the pursuit of individual interests of district heads in their second term. However, the
empirical evidence available to date, at least from the US, suggests that political parties are a weak
counteracting force against the interests of individual governors facing term limits (Besley and
Case, 1995). Moreover, the prevailing perception in Indonesia about the weakness of party
ideology, lack of loyalty among district heads to political parties, and general voter mistrust of
parties suggest that the role of national political parties as a disciplining device for district heads, in
terms of aligning local political incentives with national interests and sustaining policy changes
over a longer time horizon, may take a long time to materialize (Pratikno, 2009).
Second, the finding that increased expenditures in personnel and “other” discretionary
categories increase significantly in the year of election and drop back to normal levels within a year
or so after the elections implies that electoral reform has the effect of inducing spending cycles
aligned with the district-specific electoral cycle. Although these district-specific spending cycles
may not be concurrent due to the differences in the timing of direct elections across districts in the
country, the large number of districts in the country (477 as of 2010) implies that in the aggregate,
the inefficiencies associated with such spending cycles may be high.

24
References Agustina, Cut Dian, Wolfgang Fengler, and Gunther G. Schulze, 2012 "The Regional Effects of
Indonesia's Oil and Gas Policy: Options for Reform," Bulletin of Indonesian Economic
Studies, 48(3), 369-97.
Ahmad, Ehtisham, Giorgio Brosio, 2009. Does Decentralization Enhance Service Delivery and
Poverty Reduction? (Studies in Fiscal Federalism and State-Local Finance), Edward Elgar
Publishing Ltd., MA.
Ahmad, Junaid, Shanta Devarajan, Stuti Khemani, Shekhar Shah, 2005. "Decentralization and Service
Delivery," Policy Research Working Paper No. 3603, The World Bank, Washington, DC.
Alesina,A., Roubini, N., and Cohen, G.D. 1997. Political Cycles and the Macrcoeconomy. MIT Press,
Cambridge and London.
Baqir, Reza, 2002. "Districting and Government Overspending." Journal of Political Economy, Vol.
110, No. 6, pp. 1318-1354.
Bardhan, Pranab and Dilip Mookherjee 2000. “Capture and Governance at Local and National
Levels.” American Economic Review, 90, 135–139.
Bardhan, P., D. Mookherjee, 2006. "Decentralization and Accountability in Infrastructure Delivery in
Developing Countries." Economic Journal 116, 101-127.
Bertrand, Marianne, Esther Duflo, and Sendhil Mullainathan, 2004 "How Much Should we Trust
Differences in Differences Estimates?" The Quarterly Journal of Economics, (February), , pp.
249-275.
Besley, Timothy, and Anne Case , 1995. "Does Electoral Accountability Affect Economic Policy
Choices? Evidence from Gubernatorial Terms Limits," The Quarterly Journal of Economics,
(August), , pp. 769-798
Besley, Timothy, and Stephen Coate, 2003. “Elected Versus Appointed Regulators: Theory and
Evidence,” Journal of the European Economic Association, 1 (5), 1176–1206.
Besley, Timothy, Rohini Pande, Lupin Rahman & Vijayendra Rao, 2004 "The Politics of Public Good
Provision: Evidence from Indian Local Governments" Journal of the European Economic
Association, April–May 2004 2(2–3):416 – 426
Blanchard, Olivier, and Andrei Shleifer, 2001 "Federalism With and Without Political Centralization:
China versus Russia" IMF Staff Papers, 48(4). 171-179.
Delavallade, Clara, 2006. "Corruption and Distribution of Public Spending in Developing Countries."
Journal of Economics and Finance 30 (2): 222-239.

25
de la Croix, David, and Clara Delavallade, 2009 “Growth, Public Investment and Corruption with
Failing Institutions”, Economics of Governance. 10 (3): 187-219
Devarajan, Shanta, Stuti Khemani, Shekar Shah, 2009. "The Politics of Partial Decentralization." In:
Ahmad, Ehtisham, Giorgio Brosio, (Eds.), Does Decentralization Enhance Service Delivery
and Poverty Reduction? Edward Elgar, Cheltenham ; Northampton, pp. 79-101.
Drazen, A. 2000. The Political Business Cycle After 25 Years. NBER Macroeconomic Annual. MIT
Press, Cambridge, MA
Enikolopov, Ruben, and Ekaterina Zhuravskaya, 2007 "Decentralization and Political Institutions"
Journal of Public Economics ,91: 2261–2290
Erb, Maribeth, Priyambudi Sulistiyanto, 2009. Deepening Democracy in Indonesia? Direct Elections
for Local Leaders (Pilkada). Institute for South East Asian Studies, Signapore.
Faguet, Jean-Paul, 2004. "Does Decentralization Increase Government Responsiveness to Local
Needs? Evidence from Bolivia". Journal of Public Economics 88, 867-893.
Ferraz, Claudio, and Frederico Finan 2011 "Electoral Accountability and Corruption: Evidence form
Audits of Local Governments," American Economic Review 101, 1274-1311.
Fitrani, Fitria, Bert Hofman, Kai Kaiser, 2005. "Unity in Diversity? The Creation of New Regions in a
Decentralizing Indonesia" Bulletin of Indonesian Economic Studies 41, 57-79.
Foster, Andrew, and Mark Rosenzweig, 2004. “Democratization and the Distribution of Local Public
Goods in a Poor Rural Economy,” Economics Department, Brown University
Hayek, Friedrich A., 1948. Individualism and Economic Order. University of Chicago Press, Chicago
Harimurti, P., E. Pambudi, A. Pigazzini, and A. Tandon, (2013) "The Nuts & Bolts of Jamkesmas
Indonesia’s Government-Financed Health Coverage Program" UNICO Study Series 8.The
World Bank, Washington D.C.
Hofman, Bert, Kai Kaiser, 2004. "The Making of the Big Bang and its Aftermath: A Political Economy
Perspective", in Alm J., J. Martinez-Vazquez and Sri Mulyani Indrawati (eds.) Reforming
Intergovernmental Fiscal Relations and the Rebuilding of Indonesia : the "Big Bang"
Program and its Economic Consequences. (Studies in Fiscal Federalism and State-Local
Finance Series) Edward Elgar Publishing Ltd., MA.
Hofman, Bert, Kai Kaiser, 2006. "Decentralization, Democratic Transition, and Local Governance in
Indonesia." In: Bardhan, Pranab, Dilip Mookherjee, (Eds.), Decentralization and Local
Governance in Developing Countries: A Comparative Perspective. MIT Press, Cambridge,
MA.

26
Hofman, Bert, Kadjatmiko, Kai Kaiser, and Bambang Suharnoko Sjahrir 2006. "Evaluating Fiscal
Equalization in Indonesia" Policy Research Working Paper no. 3911, (May) World Bank,
Washington, DC.
Kaiser, Kai, Daan Pattinasarany, Günther G. Schulze, 2006. "Decentralization, Governance and Public
Services in Indonesia". In Paul Smoke, Eduardo J. Gómez, and Goerge E. Peterson (Eds.),
Decentralization in Latin America and Asia: Towards a Comparative Inter-Disciplinary
Perspective (Studies in Fiscal Federalism and State-Local Finance Series) Edward Elgar
Publishing Ltd., MA
Khemani, Stuti, 2004. "Political Cycles in a Developing Economy: Effect of Elections in the Indian
States," Journal of Development Economics, 73, 125-154.
Lewis, Blane, 2005. "Indonesia Local Government Spending, Taxing and Saving: An Explanation of
Pre- and Post-Decentralization Fiscal Outcomes". Asian Economic Journal 19, 291-317.
Lewis, Blane, 2007. "On-Lending in Indonesia: Past Performance and Future Prospects". Bulletin of
Indonesia Economic Studies 43, 35-57.
Malley, Michael, 2003. "New Rules, Old Structures and the Limits of Democratic Decentralization"
In: Aspinall, Edward, Greg Fealy, (Eds.), Local Power and Politics in Indonesia:
Decentralization & Democratisation. Indonesia Update Series, Research School of Pacific
and Asian Studies, The Australian National University, Jakarta, pp. 102-118.
Mansuri, Ghazala, and Vijayendra Rao, 2012, Localizing Development: Does Participation Work?
Washington, DC: World Bank.
Martinez-Bravo, Monica. 2013. "The Role of Local Officials in New Democracies: Evidence from
Indonesia." American Economic Review, forthcoming.
Martinez-Bravo, Monica, Gerard Padró i Miquel, Nancy Qian, Yang Yao, 2011 "Do Local Elections in
non-Democracies Increase Accountability? Evidence from Rural China," National Bureau of
Economic Research Working Paper No. 16948.
Meyer, D. Bruce, 1995 "Natural and Quasi-Experiments in Economics" Journal of Business &
Economics Statistics , 13(2): 151-161.
Mietzner, Marcus, 1997. "Party Financing in Post Soeharto Indonesia: Between State Subsidies and
Political Corruption." Contemporary Southeast Asia 29, 238-263.
Olken, Benjamin, 2007. "Monitoring Corruption: Evidence from a Field Experiment in Indonesia,"
Journal of Political Economy, 1115 (2), 1-50.
Persson, Torsten, Gerard Roland, and Guido Tabellini, 2000. "Comparative Politics and Public
Finance." Journal of Political Economy, Vol. 108, No. 6, pp. 1121-61.

27
Persson, Torsten, Guido Tabellini, 2004a "Constitutions and Economic Policy", Journal of Economic
Perspectives, Vol. 18, No. 1, (Winter). pp. 75-98.
_____________________2004b "Constitutional Rules and Fiscal Policy Outcomes", American Economic
Review, Vol. 94, No. 1, (March). pp. 25-45.
Pratikno, 2009 "Political Parties in Pilkada: Some problems for Democratic Consolidstion, chapter 3
in Erb, M. and P. Sulistiyanto, (eds.) Deepening Democracy in Indonesia? Direct Elections for
Local Leaders (Pilkada). Institute for South East Asian Studies, Singapore.
Riker, W., 1964. Federalism: Origins, Operation, Significance. Little, Brown and Co, Boston, MA.
Robinson, Gregory, John . McNulty, and Jonatahan S. Krasno, 2009 "Observing the Counterfactual?
The Search for Political Experiments in Nature" Political Analysis, 17:341-357
Schiller, Jim 2009. "Electing District Heads in Indonesia: Democratic Deepening or Elite
Entrenchment?" chapter 7 in Erb, M. and P. Sulistiyanto, (eds.) Deepening Democracy in
Indonesia? Direct Elections for Local Leaders (Pilkada). Institute for South East Asian
Studies, Singapore.
Suharnoko Sjahrir B., K. Kis-Katos, G. G. Schulze (2013) "Political Business Cycles in Local
Indonesia" Economics Letters, 120 (2): 342-345.
Temple, Jonathan, 2001. "Growing into trouble: Indonesia after 1966". University of Bristol, Bristol.
Valsecchi, Michele. 2013. "Local Elections and Corruption during Democratization: Evidence from
Indonesia." Unpublished paper, University of Gothenburg.
World Bank, 2003. "Decentralizing Indonesia: A Regional Public Expenditure Overview Report" The
World Bank, Washington D.C.
World Bank, 2007. "Spending for Development: Making the Most of Indonesia's New Opportunities.
Indonesia Public Expenditure Review 2007". The World Bank, Washington D.C. .
World Bank, 2004. World Development Report 2004 -- Making Services Work for Poor People. The
World Bank, Washington, D.C.
Zhang, X., S. Fan, L. Zhang, J. Huang, 2004. "Local Governance and Public Goods Provision in Rural
China." Journal of Public Economics 88, 2857-2871.

28
Figure 1a: Timing of direct elections of district heads in all 304 districts by 2007
Figure 1b: Timing of direct elections of district heads in the 163 undivided
districts by 2007
Note: 304 districts out of 434 had a directly elected district head by 2007
Note: 163 out of 238 undivided districts had a directly elected district head by 2007
155
36
12 1622
9
27
2 4 714
0
20
40
60
80
100
120
140
160
180
2005
_Q2
2005
_Q3
2005
_Q4
2006
_Q1
2006
_Q2
2006
_Q3
2006
_Q4
2007
_Q1
2007
_Q2
2007
_Q3
2007
_Q4
All 304 districts by 2007 out of 434 total
67
25
913
20
5 72 4 4
7
0
10
20
30
40
50
60
70
80
2005
_Q2
2005
_Q3
2005
_Q4
2006
_Q1
2006
_Q2
2006
_Q3
2006
_Q4
2007
_Q1
2007
_Q2
2007
_Q3
2007
_Q4
Undivided districts between 2001-2009

29
Table 1: The Evolution of the Mode of Selection of District Heads in Indonesia
Year of appointment
Number of District Heads appointed during the New
Order Era
Number of District Heads appointed by local DPRD
(Indirectly Elected)
Number of Care Taker District Heads
Number of District Heads Directly Elected
In
Districts that Split
Undivided Districts 2001-09
All Districts
In
Districts that Split
Undivided Districts 2001-09
All Districts
In Districts
that Split
Undivided Districts 2001-09
All Districts
In
Districts that Split
Undivided Districts 2001-09
All Districts
1994 0 1 1 1995 10 37 47 1996 12 20 32 1997 6 11 17 1998 16 58 74 1999 23 58 81 2000 13 45 58 2001 7 18 25 2002 20 59 79 2003 15 21 36 20 59 79 2004 43 101 144 15 21 36 2005 43 101 144 2006 20 45 65 2007 3 17 20
67 185 252 98 244 342 35 80 115 66 163 229

30
Table 2a: Probit Analysis of the Determinants of Direct Elections in Districts in Indonesia Dependent Variable: T=1 if District Had a DIRECT election between 2005 and 2007, T=0 otherwise
All Districts Undivided Districts
Last District Head Served full Term (a) n.a. n.a. n.a. n.a. n.a. n.a. Unemployment Rate in 2004 -0.795 -0.550 -0.152 -1.483 -0.932 -0.567 [1.828] [1.870] [1.936] [2.260] [2.322] [2.359] Ln per capita Real GDP, 2005 -0.034 -0.119 -0.040 -0.090 -0.163 -0.081 [0.129] [0.175] [0.185] [0.147] [0.197] [0.208] Share of electricity to total GRDP, 2005 -6.428 -6.150 -3.613 -5.316 -5.686 -4.971 [9.027] [9.546] [9.969] [10.233] [10.886] [11.118] Distance district to Province's Capital 0.001 0.001 0.001 0.000 0.000 0.000 [0.001] [0.001] [0.001] [0.001] [0.001] [0.001] (1=Kota, 0= Kabupaten) 0.081 0.351 0.939** 0.017 0.286 0.807 [0.235] [0.272] [0.436] [0.270] [0.312] [0.513] Dummy Sumatera Island 0.442** 0.341 0.174 0.714*** 0.593** 0.449 [0.212] [0.220] [0.241] [0.262] [0.275] [0.298] Dummy Kalimantan Island 0.122 0.035 -0.157 0.236 0.110 -0.027 [0.276] [0.289] [0.306] [0.341] [0.372] [0.389] Dummy Sulawesi Island -0.083 -0.189 -0.366 -0.091 -0.217 -0.364 [0.246] [0.251] [0.274] [0.294] [0.300] [0.322] Dummy Nusa Tenggara & Maluku Island -0.290 -0.459 -0.578* -0.140 -0.338 -0.417 [0.295] [0.308] [0.317] [0.367] [0.385] [0.392] Dummy Papua Island -0.555 -0.667 -0.931* 0.195 -0.105 -0.165 [0.473] [0.481] [0.508] [0.934] [0.956] [0.970] Share of mining to total GRDP, 2005 0.498 0.556 0.529 0.329 [0.637] [0.666] [0.832] [0.851] Urbanization (portion of population that is urban), Susenas 2005 -0.987 -0.905
[0.613] [0.707]
Constant 0.978 2.267 1.340 1.940 3.023 2.064 [1.926] [2.624] [2.737] [2.215] [2.960] [3.059] Observations 336 320 317 238 222 222 Pseudo R2 0.0327 0.0345 0.0449 0.0453 0.0436 0.0496 Log likelhood -203.4 -190.3 -186.5 -141.6 -129.2 -128.4 Prob > chi2 0.185 0.255 0.131 0.200 0.380 0.340 Standard errors in brackets *** p<0.01, ** p<0.05, * p<0.1 (a) Variable and/or associated observations dropped by probit for perfectly predicting success in the dependent variable

31
Table 2b: Probit Analysis of the Determinants of Indirect Elections in Districts in Indonesia Dependent Variable: T=1 if District Had was Indirectly Appointed in 2000, T=0 otherwise
All Districts Undivided Districts
Last District Head Served full Term (a) n.a. n.a. n.a. n.a. n.a. n.a. Share of electricity to total GRDP, 2000 14.723 6.866 5.719 12.866 4.437 3.181 [10.226] [12.192] [12.242] [12.419] [15.873] [15.924] Distance district to Province's Capital 0.001 0.000 0.000 -0.001 -0.001 -0.001 [0.001] [0.001] [0.001] [0.001] [0.002] [0.002] (1=Kota, 0= Kabupaten) -0.038 0.118 0.051 -0.018 0.017 -0.067 [0.218] [0.325] [0.335] [0.256] [0.384] [0.399] Dummy Sumatera Island 0.030 0.108 0.076 -0.038 0.328 0.337 [0.203] [0.233] [0.234] [0.243] [0.305] [0.305] Dummy Kalimantan Island -0.169 -0.437 -0.559* -0.424 -0.789* -0.884* [0.270] [0.325] [0.337] [0.350] [0.465] [0.470] Dummy Sulawesi Island -0.463* -0.323 -0.293 -0.560* -0.389 -0.363 [0.266] [0.278] [0.280] [0.327] [0.337] [0.341] Dummy Nusa Tenggara & Maluku Island -0.106 -0.160 -0.093 -0.049 -0.183 -0.130 [0.299] [0.340] [0.350] [0.381] [0.438] [0.453] Dummy Papua Island -0.362 0.182 [0.506] [0.936] Unemployment rate in 1999 -4.653 -5.136 -4.770 -5.250 [3.263] [3.319] [3.558] [3.638] Ln per capita Real GDP, 2000 0.241 0.247 [0.183] [0.217] Constant -0.388** -0.011 -3.629 -0.216 0.149 -3.579 [0.180] [0.258] [2.747] [0.204] [0.322] [3.266] Observations 304 235 234 217 175 174 Pseudo R2 0.0196 0.0231 0.0288 0.0343 0.0442 0.0496 Log likelhood -199.9 -154.5 -153.1 -138.9 -112.6 -111.4 Prob > chi2 0.433 0.502 0.429 0.275 0.237 0.235 Standard errors in brackets *** p<0.01, ** p<0.05, * p<0.1 (a) Variable and/or associated observations dropped by probit for perfectly predicting success in the dependent variable

32
Figure 2: Changes in selected outcomes at district-level over time
Note: 1) The solid lines represent the treatment group (i.e. the 101 undivided districts that had direct elections in 2005) and the dashed lines the control group (i.e. the 87 undivided districts that had direct elections in 2008 or later) 2) Vertical line at 2005 denotes the year of direct elections in the districts in the sample

33
Table 3: The impact of Local Elections (PILKADA) on Selected Outcomes; DiD estimates with district fixed effects;
Treatment: T =1 if district held direct election in 2005; T = 0 if district had direct election in 2008 or later
Variable Coeffi-cient
Net Enrollment rate in Primary
School
Net Enrollment
rate in Junior High School
Net Enrollment rate in High
School
Immunization Rates
% of last births
assisted by skilled health worker
% of population with access to electricity
% o f population
with access to clean water
% of population
with access to sanitation
(private toilet)
Poverty rate (head count)
Full sample: Treatment vs. Comparison Districts DE05* YR0609
𝛾 -0.138 -1.183 -0.345 0.172 -1.092 0.493 -0.315 0.334 -0.438
(0.263) (0.972) (0.918) (0.574) (0.887) (0.968) (0.910) (0.731) (0.281) # obs 1,583 1,583 1,583 1,056 1,583 1,407 1,583 1,583 880 # districts 176 176 176 176 176 176 176 176 176 Notes: *: 10% level of significance; **: 5% level of significance; ***: 1% level of significance Robust standard errors in parentheses estimated based on clustering by district (Bertrand et al., 2004) Districts that held direct elections during 2006 and 2007 are dropped from the sample used in the regressions

34
Figure 3: Changes in selected fiscal variables at district-level over time
Note: 1) The solid lines represent the treatment group (i.e. the 101 undivided districts that had direct elections in 2005) and the dashed lines the control group (i.e., the 87 undivided districts that had direct elections in 2008 or later) 2) Vertical line at 2005 denotes the year of direct elections in the districts in the sample 2) Vertical axes represent per capita real expenditure and revenue in ‘000 rupiah (2007=100)

35
Table 4: The impact of Local Elections (PILKADA) on District Expenditures by Sector;
DiD estimates with district fixed effects; Treatment Groups: Districts that held direct election in 2005, 2006 and 2007;
T = 0 if district had direct elections in 2008 or later Dependent variable: Log of Real Expenditures per capita:
Variable Coeffi-cient
Administration
Social Protection Health Education Agriculture Environment Housing Infra-
structure Total
(all sectors) 𝐷𝐸05∗ 𝑌𝑅2004 𝛾05,2004 0.0397 0.0816 0.000445 0.0193 0.0311 0.292* -0.200 0.00294 0.0264
(0.0419) (0.150) (0.0396) (0.0500) (0.0505) (0.174) (0.304) (0.125) (0.0208) 𝐷𝐸05∗ 𝑌𝑅2005 𝛾05,2005 0.00944 -0.177 0.0382 0.0668 -0.00362 0.101 0.0860 -0.398*** -0.00832
(0.0491) (0.160) (0.0398) (0.0585) (0.0552) (0.192) (0.366) (0.117) (0.0191) 𝐷𝐸05∗ 𝑌𝑅2006 𝛾05,2006 0.0355 -0.169 0.0676 0.0708 0.0523 0.0696 -0.175 -0.223* 0.00139
(0.0606) (0.168) (0.0416) (0.0614) (0.0603) (0.196) (0.396) (0.132) (0.0224)
𝐷𝐸05∗ 𝑌𝑅2007 𝛾05,2007 0.0650 -0.230 0.0992* 0.208 0.104 0.447*** 0.0910 0.134 0.0679
(0.0816) (0.163) (0.0534) (0.145) (0.0969) (0.171) (0.448) (0.127) (0.0600) 𝐷𝐸05∗ 𝑌𝑅2008 𝛾05,2008 -0.0462 -0.133 0.150** 0.0453 -0.0440 0.343** -0.152 0.169 0.0570
(0.0659) (0.164) (0.0635) (0.0757) (0.0975) (0.160) (0.456) (0.105) (0.0416)
𝐷𝐸05∗ 𝑌𝑅2009 𝛾05,2009 0.0519 -0.0588 0.0995 0.0515 0.0820 0.0919 0.0518 0.00596 0.0438
(0.0564) (0.169) (0.0668) (0.0682) (0.0739) (0.158) (0.416) (0.106) (0.0423)
𝐷𝐸06∗ 𝑌𝑅2005 𝛾06,2005 -0.156*** 0.451* 0.0488 0.140* 0.0825 -0.427* -0.326 -0.234 -0.0387
(0.0530) (0.231) (0.0429) (0.0741) (0.0594) (0.222) (0.438) (0.156) (0.0255) 𝐷𝐸06∗ 𝑌𝑅2006 𝛾06,2006 -0.106 0.521** -0.00384 0.126 0.00873 -0.348* -0.540 -0.330* -0.0845
(0.0816) (0.227) (0.0567) (0.0931) (0.0718) (0.204) (0.438) (0.193) (0.0618) 𝐷𝐸06∗ 𝑌𝑅2007 𝛾06,2007 0.0763 0.346 0.145 0.410** 0.130 -0.143 0.587 0.0990 0.138*
(0.0905) (0.232) (0.0980) (0.167) (0.108) (0.231) (0.628) (0.189) (0.0713)

36
𝐷𝐸06∗ 𝑌𝑅2008 𝛾06,2008 -0.0906 0.166 0.177** 0.0659 -0.0216 0.0180 -0.312 0.112 0.0290
(0.0656) (0.218) (0.0810) (0.136) (0.0859) (0.195) (0.591) (0.155) (0.0604) 𝐷𝐸06∗ 𝑌𝑅2009 𝛾06,2009 -0.0128 -0.00904 0.0641 0.183** 0.0295 -0.0796 -0.0564 -0.220 -0.0483
(0.0618) (0.300) (0.0781) (0.0848) (0.0894) (0.223) (0.577) (0.152) (0.0544)
𝐷𝐸07∗ 𝑌𝑅2006 𝛾07,2006 0.180 0.175 0.107* 0.159 0.118 -0.299 0.797* -0.154 0.0533
(0.124) (0.253) (0.0625) (0.101) (0.113) (0.315) (0.440) (0.249) (0.0364) 𝐷𝐸07∗ 𝑌𝑅2007 𝛾07,2007 0.244*** -0.00714 0.171*** 0.228 0.195* 0.0840 -0.187 0.428** 0.194***
(0.0936) (0.191) (0.0519) (0.140) (0.103) (0.225) (0.652) (0.191) (0.0559) 𝐷𝐸07∗ 𝑌𝑅2008 𝛾07,2008 -0.0486 0.178 0.121 -0.00342 0.0377 -0.0226 0.0909 0.240 0.0256
(0.182) (0.197) (0.0892) (0.123) (0.107) (0.151) (0.607) (0.157) (0.0869) 𝐷𝐸07∗ 𝑌𝑅2009 𝛾07,2009 0.144* 0.373* 0.165** 0.111 0.141 0.233 -0.501 0.322 0.134**
(0.0764) (0.201) (0.0794) (0.110) (0.117) (0.243) (0.663) (0.203) (0.0592)
# obs 1,902 1,576 1,865 1,869 1,855 1,729 1,114 1,866 1,907
# districts 238 238 238 238 238 238 238 238 238 Notes: *: 10% level of significance; **: 5% level of significance; ***: 1% level of significance Robust standard errors in parentheses estimated based on clustering by district (Bertrand, et al, 2004)

37
Table 5: The impact of Local Elections (PILKADA) on District Administrative Expenditures;
DiD estimates with district fixed effects; Treatment Groups: Districts that held direct election in 2005, 2006 and 2007;
T = 0 if district had direct elections in 2008 or later Log of Real Expenditures per capita: As share of Total Expenditures per capita
Variable Coeffi-cient Capital Goods &
Services Other Personnel Capital Goods & Services Other Personnel
𝐷𝐸05∗ 𝑌𝑅2004 𝛾05,2004 0.0229 -0.0438 -0.0678 0.0327 -0.000485 -0.0120* -0.000116 0.00860
(0.0773) (0.0384) (0.0949) (0.0257) (0.00887) (0.00659) (0.00641) (0.00973) 𝐷𝐸05∗ 𝑌𝑅2005 𝛾05,2005 -0.233*** -0.0903** 0.153 0.0434** -0.0367*** -0.0129* 0.0183*** 0.0274***
(0.0729) (0.0430) (0.127) (0.0220) (0.00927) (0.00749) (0.00683) (0.00955) 𝐷𝐸05∗ 𝑌𝑅2006 𝛾05,2006 -0.130** -0.0342 0.0777 0.0357 -0.0307*** -0.00488 0.0183* 0.0181*
(0.0632) (0.0570) (0.112) (0.0226) (0.00976) (0.00914) (0.0108) (0.0108) 𝐷𝐸05∗ 𝑌𝑅2007 𝛾05,2007 0.0303 0.00102 0.133 0.0510 -0.00498 -0.00407 0.0133 -0.0218
(0.112) (0.0657) (0.172) (0.0927) (0.0175) (0.0112) (0.0105) (0.0287) 𝐷𝐸05∗ 𝑌𝑅2008 𝛾05,2008 0.110 -0.0314 -0.363*** -0.0372 0.0316* -0.00726 -0.0177* -0.0163
(0.0808) (0.0555) (0.126) (0.0736) (0.0162) (0.00782) (0.00925) (0.0162) 𝐷𝐸05∗ 𝑌𝑅2009 𝛾05,2009 -0.0706 -0.0207 -0.00297 0.0388 -0.0149 -0.00258 0.00421 0.00133
(0.0930) (0.0559) (0.115) (0.0426) (0.0162) (0.00857) (0.00939) (0.0166) 𝐷𝐸06∗ 𝑌𝑅2005 𝛾06,2005 -0.0682 -0.129** -0.0918 0.0330 0.00273 -0.0207* -0.00358 0.0240**
(0.0896) (0.0570) (0.137) (0.0228) (0.0144) (0.0108) (0.00815) (0.0109) 𝐷𝐸06∗ 𝑌𝑅2006 𝛾06,2006 -0.218** -0.153** 0.0936 0.0579** -0.00891 -0.0280** 0.00778 0.0438***
(0.0854) (0.0712) (0.149) (0.0289) (0.0201) (0.0125) (0.0108) (0.0140) 𝐷𝐸06∗ 𝑌𝑅2007 𝛾06,2007 0.0984 -0.0543 0.130 0.190 0.0134 -0.0296** -0.0134 -0.00256
(0.110) (0.0752) (0.167) (0.116) (0.0217) (0.0138) (0.0123) (0.0303) 𝐷𝐸06∗ 𝑌𝑅2008 𝛾06,2008 0.0440 -0.0750 -0.237* 0.0401 0.0260 -0.0153 -0.0162 0.00353

38
(0.110) (0.0617) (0.141) (0.0853) (0.0211) (0.0142) (0.0151) (0.0234) 𝐷𝐸06∗ 𝑌𝑅2009 𝛾06,2009 -0.337*** -0.0876 -0.154 0.104** -0.0385** -0.00938 -0.0161 0.0586***
(0.102) (0.0752) (0.149) (0.0504) (0.0186) (0.0105) (0.0144) (0.0194) 𝐷𝐸07∗ 𝑌𝑅2006 𝛾07,2006 0.0232 0.0229 0.164 0.0323 0.00193 -0.00562 0.0148 -0.00973
(0.0873) (0.0744) (0.130) (0.0488) (0.0144) (0.0129) (0.0116) (0.0163) 𝐷𝐸07∗ 𝑌𝑅2007 𝛾07,2007 0.171 0.151 0.556*** 0.0915 0.0116 0.00297 0.0218** -0.0740***
(0.106) (0.0958) (0.175) (0.0741) (0.0195) (0.0156) (0.00924) (0.0258) 𝐷𝐸07∗ 𝑌𝑅2008 𝛾07,2008 0.0257 0.0409 -0.220 -0.162 0.0455 0.0129 -0.0138 -0.0501*
(0.112) (0.115) (0.175) (0.168) (0.0306) (0.0131) (0.0131) (0.0258) 𝐷𝐸07∗ 𝑌𝑅2009 𝛾07,2009 0.0226 0.184** 0.0640 0.0720 0.00633 0.0165 0.000353 -0.0324
(0.144) (0.0819) (0.158) (0.0570) (0.0285) (0.0122) (0.0125) (0.0210)
# obs 1,881 1,884 1,852 1,896 1,881 1,884 1,852 1,896
# districts 238 238 238 238 238 238 238 238
Notes: *: 10% level of significance; **: 5% level of significance; ***: 1% level of significance Robust standard errors in parentheses estimated based on clustering by district (Bertrand, et al, 2004)
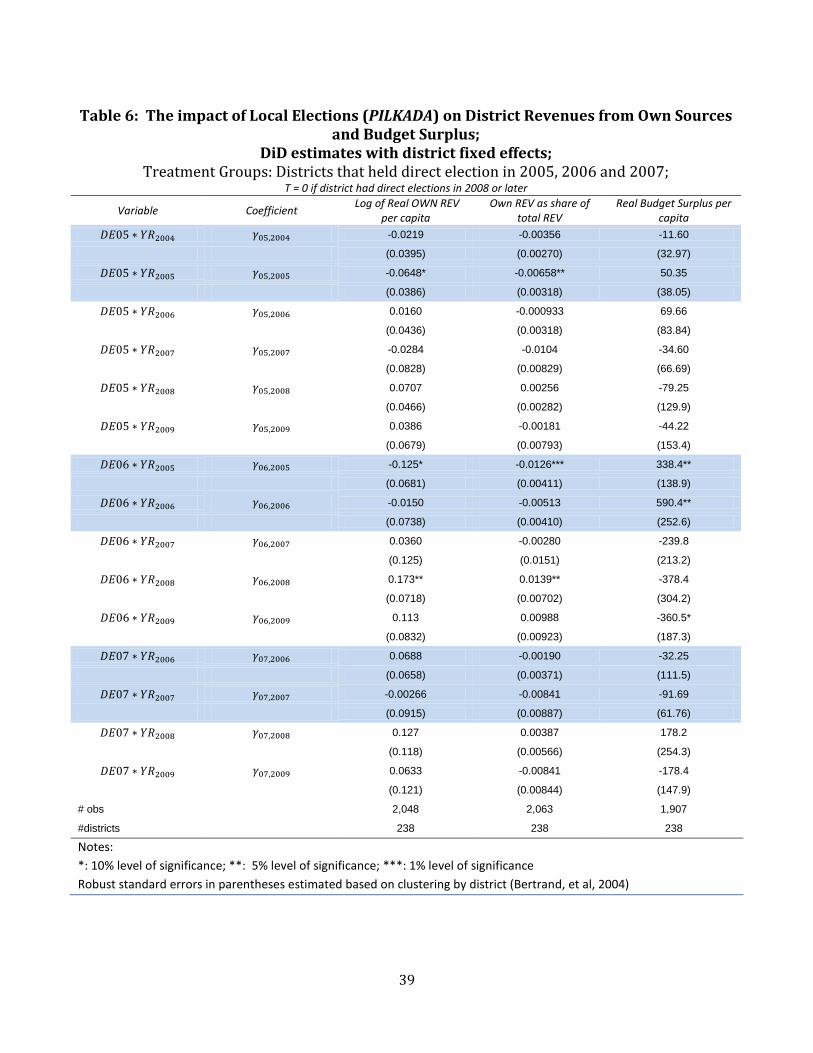
39
Table 6: The impact of Local Elections (PILKADA) on District Revenues from Own Sources
and Budget Surplus; DiD estimates with district fixed effects;
Treatment Groups: Districts that held direct election in 2005, 2006 and 2007; T = 0 if district had direct elections in 2008 or later
Variable Coefficient Log of Real OWN REV per capita
Own REV as share of total REV
Real Budget Surplus per capita
𝐷𝐸05 ∗ 𝑌𝑅2004 𝛾05,2004 -0.0219 -0.00356 -11.60
(0.0395) (0.00270) (32.97)
𝐷𝐸05 ∗ 𝑌𝑅2005 𝛾05,2005 -0.0648* -0.00658** 50.35
(0.0386) (0.00318) (38.05)
𝐷𝐸05 ∗ 𝑌𝑅2006 𝛾05,2006 0.0160 -0.000933 69.66
(0.0436) (0.00318) (83.84)
𝐷𝐸05 ∗ 𝑌𝑅2007 𝛾05,2007 -0.0284 -0.0104 -34.60
(0.0828) (0.00829) (66.69)
𝐷𝐸05 ∗ 𝑌𝑅2008 𝛾05,2008 0.0707 0.00256 -79.25
(0.0466) (0.00282) (129.9)
𝐷𝐸05 ∗ 𝑌𝑅2009 𝛾05,2009 0.0386 -0.00181 -44.22
(0.0679) (0.00793) (153.4)
𝐷𝐸06 ∗ 𝑌𝑅2005 𝛾06,2005 -0.125* -0.0126*** 338.4**
(0.0681) (0.00411) (138.9)
𝐷𝐸06 ∗ 𝑌𝑅2006 𝛾06,2006 -0.0150 -0.00513 590.4**
(0.0738) (0.00410) (252.6)
𝐷𝐸06 ∗ 𝑌𝑅2007 𝛾06,2007 0.0360 -0.00280 -239.8
(0.125) (0.0151) (213.2)
𝐷𝐸06 ∗ 𝑌𝑅2008 𝛾06,2008 0.173** 0.0139** -378.4
(0.0718) (0.00702) (304.2)
𝐷𝐸06 ∗ 𝑌𝑅2009 𝛾06,2009 0.113 0.00988 -360.5*
(0.0832) (0.00923) (187.3)
𝐷𝐸07 ∗ 𝑌𝑅2006 𝛾07,2006 0.0688 -0.00190 -32.25
(0.0658) (0.00371) (111.5)
𝐷𝐸07 ∗ 𝑌𝑅2007 𝛾07,2007 -0.00266 -0.00841 -91.69
(0.0915) (0.00887) (61.76)
𝐷𝐸07 ∗ 𝑌𝑅2008 𝛾07,2008 0.127 0.00387 178.2
(0.118) (0.00566) (254.3)
𝐷𝐸07 ∗ 𝑌𝑅2009 𝛾07,2009 0.0633 -0.00841 -178.4
(0.121) (0.00844) (147.9)
# obs 2,048 2,063 1,907
#districts 238 238 238
Notes: *: 10% level of significance; **: 5% level of significance; ***: 1% level of significance Robust standard errors in parentheses estimated based on clustering by district (Bertrand, et al, 2004)

ANNEX
40
Electoral Accountability and Local Government Spending in Indonesia
(ONLINE ANNEX)
In table A.1 we report the means and t-tests of the equality in the means of the expenditure and revenue variables between treatment and control districts in 2003 (prior to the 2005 shift to direct elections). The means and t-test are based on the sample of undivided districts that had direct election between 2005 and 2007 (163 treatment districts ) and the 82 control districts that had elections in 2008 or later. All expenditure and revenue categories are expressed in per-capita terms by dividing by the district population size in the relevant year, and adjusted for spatial cost of living differences among districts and by the national consumer price index for changes in prices over time (base year 2007). In the absence of a national spatial cost of living index, the ratio of the district specific poverty line in 2007 to the average poverty line in the 6 districts in the Jakarta metropolitan area (DKI) in 2007 is used. In all cases the null hypothesis of identical means could not be rejected, thus confirming a balanced sample.
Table A.1: Means and Differences in Means in Expenditures and Revenues between Treatment and Control Districts in 2003
(1) (2) (3) VARIABLES
T=0
T=1
Difference (2)-(1)
Agriculture 46.52 62.48 15.96 (7.400) (9.598) (12.12) Economic Affairs 65.73 94.51 28.78 (14.98) (20.83) (25.66) Education 543.5 494.0 -49.47 (76.27) (33.03) (83.12) Environment 24.85 29.14 4.287 (10.93) (8.317) (13.73) General Administration 518.0 757.2 239.2 (101.6) (191.5) (216.7) Health 124.3 116.9 -7.318 (17.34) (10.75) (20.40) Housing 83.68 125.3 41.64 (19.87) (24.71) (31.70) Infrastructure 265.4 405.1 139.7 (61.92) (79.16) (100.5) Public Order and Security 9.177 23.76 14.59 (1.365) (12.82) (12.89) Religious Affairs 17.02 24.31 7.284 (4.578) (8.528) (9.679) Social Protection 12.17 11.02 -1.156 (3.410) (1.854) (3.881) Tourism and Culture 13.52 15.13 1.613 (3.602) (4.644) (5.877) Total Expenditures 1,724 2,159 435.0 (263.7) (339.5) (429.9) Expenditures by Economic Classification Capital 396.0 602.3 206.3 (92.60) (118.7) (150.6)
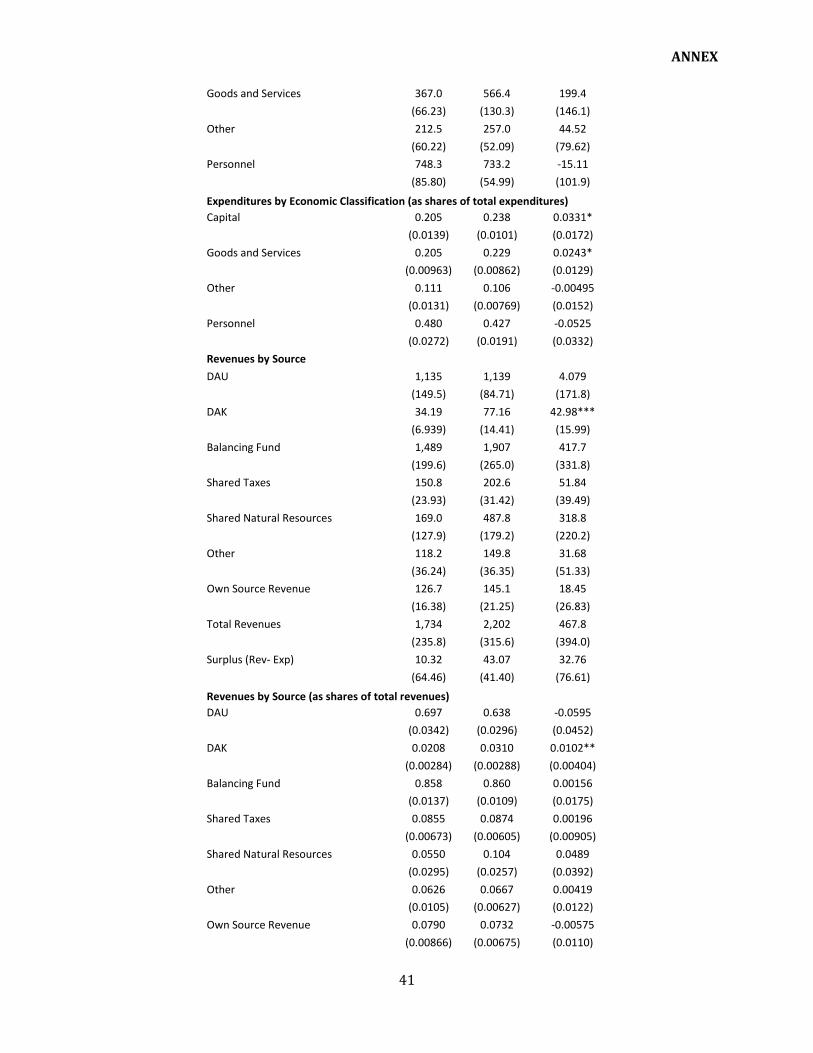
ANNEX
41
Goods and Services 367.0 566.4 199.4 (66.23) (130.3) (146.1) Other 212.5 257.0 44.52 (60.22) (52.09) (79.62) Personnel 748.3 733.2 -15.11 (85.80) (54.99) (101.9)
Expenditures by Economic Classification (as shares of total expenditures) Capital 0.205 0.238 0.0331* (0.0139) (0.0101) (0.0172) Goods and Services 0.205 0.229 0.0243* (0.00963) (0.00862) (0.0129) Other 0.111 0.106 -0.00495 (0.0131) (0.00769) (0.0152) Personnel 0.480 0.427 -0.0525 (0.0272) (0.0191) (0.0332) Revenues by Source DAU 1,135 1,139 4.079 (149.5) (84.71) (171.8) DAK 34.19 77.16 42.98*** (6.939) (14.41) (15.99) Balancing Fund 1,489 1,907 417.7 (199.6) (265.0) (331.8) Shared Taxes 150.8 202.6 51.84 (23.93) (31.42) (39.49) Shared Natural Resources 169.0 487.8 318.8 (127.9) (179.2) (220.2) Other 118.2 149.8 31.68 (36.24) (36.35) (51.33) Own Source Revenue 126.7 145.1 18.45 (16.38) (21.25) (26.83) Total Revenues 1,734 2,202 467.8 (235.8) (315.6) (394.0) Surplus (Rev- Exp) 10.32 43.07 32.76 (64.46) (41.40) (76.61)
Revenues by Source (as shares of total revenues) DAU 0.697 0.638 -0.0595 (0.0342) (0.0296) (0.0452) DAK 0.0208 0.0310 0.0102** (0.00284) (0.00288) (0.00404) Balancing Fund 0.858 0.860 0.00156 (0.0137) (0.0109) (0.0175) Shared Taxes 0.0855 0.0874 0.00196 (0.00673) (0.00605) (0.00905) Shared Natural Resources 0.0550 0.104 0.0489 (0.0295) (0.0257) (0.0392) Other 0.0626 0.0667 0.00419 (0.0105) (0.00627) (0.0122) Own Source Revenue 0.0790 0.0732 -0.00575 (0.00866) (0.00675) (0.0110)

ANNEX
42
Table A.2
Sectoral Decomposition of District-Level Expenditures
Sector/Function Sub-sector/Task
Agriculture
Food Security Agriculture Forestry Marine and Fishery
Public Order & Security National Unity and Domestic Politics
Economic Affairs
Labor SMEs Investment Energy and Mineral Resources Trade Industry
Education Education Youth and Sports Library
Environment Spatial Planning Environment Land
General Administration
Development Planning Population and Civil Administration General Governance and Public Administration Apparatus Village and Community Empowerment Statistics Archive Communication and Information Transmigration
Health Health Family Planning
Infrastructure Public Works Transportation
Public Housing and Facilities Housing
Social Protection Women Empowerment Social
Tourism & Culture Culture Tourism