Embed Size (px)
Citation preview
Electoral registration in 2011 A study conducted by the Electoral Commission, Office for National Statistics and National Records of Scotland July 2014

2
Translations and other formats For information on obtaining this publication in another language or in a large-print or Braille version please contact the Electoral Commission: Tel: 020 7271 0500 Email: [email protected]
We are an independent body set up by the UK Parliament. We regulate party and election finance and set standards for well-run elections. We work to support a healthy democracy, where elections and referendums are based on our principles of trust, participation, and no undue influence.

3
Contents Executive summary 8 1 Introduction 18 2 Research into the quality of the electoral registers: approach 25 3 Completeness 31 3A Headline figures and summary of findings 33 3B Geographical estimates 37 3C Demographic characteristics 42 3D Economic and social conditions 56 3E Electoral registration practices 65 4 Analysis of the findings 67 5 Accuracy 74 6 Conclusions 85 Appendices Appendix A: Methodology 88 Appendix B: Full datasets 95 Appendix C: Regression analysis 115 Appendix D: Summaries of previous electoral registration
research 123
4
List of tables and figures Chapter 1: Introduction 1.1 Franchise for citizenship and elections 23 Chapter 2: Research into the quality of the electoral registers: approach
2.1 Timing of compilation of electoral registers and 2011 Census 28 Chapter 3: Completeness of the registers 3A. Headline findings Fig. 1 Completeness of the electoral registers in Great Britain –
December 2010 (England and Wales), April 2011 (England, Wales and Scotland).
34
3A.1 Key variables related to the completeness of the electoral registers in Great Britain – April 2011 local government registers
35
3B. Geographical estimates 3B.1 Completeness estimates by English regions and in Wales 38 3B.2 Completeness estimates by Valuation Joint Board in Scotland
– April 2011 local government registers 39
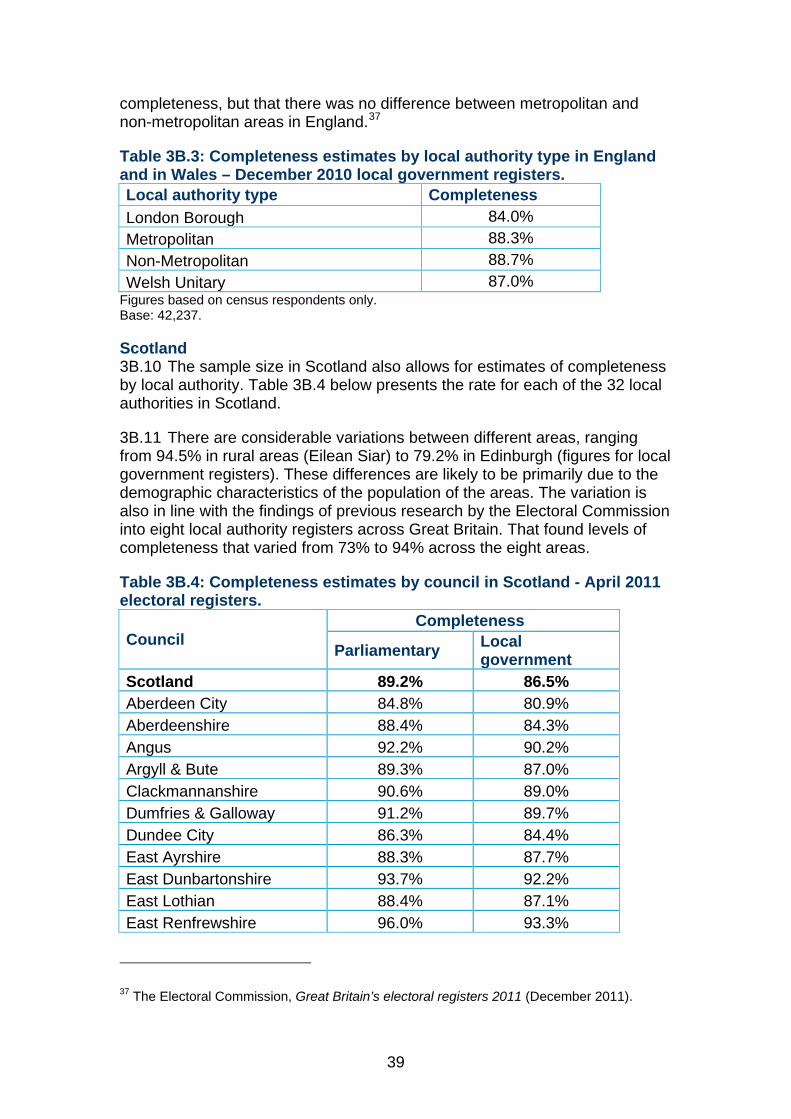
3B.3 Completeness estimates by local authority type in England & in Wales – December 2010 local government registers
39
3B.4 Completeness estimates by council in Scotland - April 2011 local government electoral registers
39
3B.5 Completeness estimates by population density in England & in Wales – December 2010 local government registers
40
3B.6 Completeness estimates by Urban/Rural classification in Scotland – April 2011 local government registers
41
3C. Demographic characteristics 3C.1 Completeness estimates by age bands in England and in
Wales – Local government registers 42
Fig. 2 Completeness estimates of the December 2010 local government registers in England and in Wales by age
43
3C.2 Completeness estimates by age bands in Scotland – April 2011 local government registers
43
Fig. 3 Completeness estimates of the April 2011 local government registers in Scotland by age.
44
3C.3 Completeness estimates by gender in England and in Wales – Local government registers
44
3C.4 Completeness estimates by marital status in England & in Wales - Local government registers
45
3C.5 Completeness estimates by marital status in Scotland – April 2011 local government registers
45
3C.6 Completeness estimates by relationship to person one in England & in Wales - local government register
46
3C.7 Completeness estimates by relationship to person one in 47
5
Scotland - April 2011 local government register 3C.8 Completeness estimates by country of birth in England & in
Wales – Local government registers. 47
3C.9 Completeness estimated by fluency in English in England and in Wales - Local government registers
48
3C.10 Completeness estimates by country of birth in Scotland – April 2011 local government registers
48
3C.11 Completeness estimated by fluency in English in Scotland- April 2011local government registers
49
3C.12 Completeness estimates by national identity in England and in Wales – Local government registers
49
3C.13 Completeness estimates by national identity (English or Welsh) in England and in Wales – December 2010 local government registers
50
3C.14 Completeness estimates by national identity in Scotland – April 2011 local government registers
50
3C.15 Completeness estimates by ethnic group in England and in Wales – Local government registers
51
3C.16 Completeness estimates by ethnic group in Scotland – April 2011 local government registers
52
3C.17 Completeness estimates by length of residence (in the UK) in England and in Wales – Local government registers
52
3C.18 Completeness estimates for those who moved and did not move in England and in Wales – Local government registers
53
3C.19 Completeness estimates for those who moved and did not move in Scotland – April 2011 local government registers
54
3C.20 Completeness estimates by religion in England and in Wales –Local government registers
54
3C.21 Estimated completeness rate by nationality and religion in England and in Wales - December 2010 local government registers
55
3C.22 Completeness estimates by religion in Scotland – April 2011 local government registers
55
3D. Economic and social conditions 3D.1 Completeness estimates by economic status in England and
in Wales – Local government registers 56
3D.2 Completeness estimates by economic status in Scotland – April 2011 Local government registers
57
3D.3 Completeness estimates by highest qualification in England and in Wales – Local government registers
57
3D.4 Estimated electoral registration rate for young people by highest qualification in England and in Wales – December 2010 registers
58
3D.5 Completeness estimates by highest qualification in Scotland – April 2011 local government registers
58
3D.6 Completeness estimates by occupation in England and in Wales – Local government registers
60
3D.7 Completeness estimates by occupation in Scotland – April 2011 Local government registers
60
3D.8 Completeness estimates by quartile of the 2010 Index of 61

6
Multiple Deprivation in England – December 2010 local government registers
Fig. 4 Completeness by level of deprivation (SIMD vigintiles) – April 2011 local government registers in Scotland
62
3D.9 Completeness estimates by tenure in England and in Wales – Local government registers
62
3D.10 Completeness estimates by tenure in Scotland – April 2011 local government registers
63
3D.11 Completeness estimates for individuals in rented accommodation in Scotland – April 2011 local government registers
63
3E. Electoral registration practices 3E.1 Estimated electoral registration rate by publicity type used 65 Chapter 4: Analysis of the findings Fig. 5 Population (16+), electoral register entries and registration
rate in Great Britain – 1991-2011. 67
4.1 Range of odds rations for each factor and characteristics which lead to highest and lowest level of registration
68
4.2 Comparison of factors most highly associated with non-registration with their equivalent from the 2000 study
70
4.3 Comparison of non-registration between 2010 and 2000 for the most prevalent factors by covariate in the 2010 non-registration model
71
Chapter 5: Accuracy of the registers Fig. 6 Accuracy of the April 2011 local government registers 75 5.1 Estimated level of residency, eligibility and duplication of the
local government registers in England and in Wales 76
5.2 Overall accuracy estimates in England and in Wales – Local government registers
77
5.3 Accuracy estimates by region in England and in Wales – Local government registers
80
5.4 Duplications by age in England and in Wales – December 2010 local government registers
81
5,5 Accuracy estimates by tenure in England and in Wales based on eligibility and duplications – December 2010 local government registers
81
5,6 Accuracy estimates by council in Scotland – April 2011 local government registers
82
Chapter 6: Conclusions 6.1 Findings on the quality of the April 2011 electoral registers in
Great Britain – census and National survey 85

7
Acknowledgement The Electoral Commission would like to thank colleagues at the Office for National Statistics and in particular Neil Hopper, Kieran Martin, Louisa Blackwell, Andrew Charlesworth, Marie Cruddas and David Fallows.
We are also grateful to Neil Bowie at the National Records for Scotland for all his work on this project.
The Commission would also like to thank all the Electoral Registration Officers and their staff for providing their electoral registers.
8
Executive Summary Background The 2011 Census provides the opportunity to assess the quality of the December 2010 and April 2011 electoral registers in Great Britain and to continue the series of decennial reports on the registers using census data. The first study on the electoral registers using census data was published in 1967, by the Home Office, and focused on the registers in 1950 and 1966. Subsequent reports, for 1981 and 1991 which focused on the 1980 and 1990 registers, were published by the Office for Population Censuses and Surveys (OPCS), the predecessor of the Office for National Statistics (ONS).
This study has been conducted for the Electoral Commission by ONS and the National Records of Scotland (NRS).
The Commission also published findings on the 2011 registers in its report ‘Great Britain’s electoral registers 2011’. The findings from the census analysis, which uses a different methodology, corroborates this earlier research, whilst also providing greater detail on estimated levels of completeness for specific demographic and socio-economic groups.
Definitions of accuracy and completeness Our approach to assessing the quality of the electoral registers is based on two measures: accuracy and completeness.
The Commission defines accuracy and completeness as follows:
By completeness we mean that ‘every person who is entitled to have an entry in an electoral register is registered’.
The completeness of the electoral registers therefore refers to the percentage of eligible people who are registered at their current address. The proportion of eligible people who are not included on the register at their current address constitutes the rate of under-registration.
By accuracy we mean that ‘there are no false entries on the electoral registers’.
The accuracy of the electoral registers is therefore a measure of the percentage of entries on the registers which relate to verified and eligible voters who are resident at that address. Inaccurate register entries may relate to entries which have become redundant (for example, due to home movement), which are ineligible and have been included unintentionally, or which are fraudulent.
9
Methodology The estimates have been produced by ONS for England and Wales and by NRS for Scotland, using two different but similar methodologies. A separate project was required for Scotland as the census data is held by NRS and could not be shared with ONS.
The estimates have been produced for two points in time for England and Wales, and one in Scotland:
• England and Wales: 1 December 2010 (registers published immediately following the 2010 annual canvass) and 1 April 2011 (registers published within a week of the census date).
• Scotland: 1 April 2011 (registers published within a week of the census date).
The December and April registers were chosen because the former are the registers published immediately following the canvass, while the latter more closely coincided with the data of the census. Previous studies have indicated how electoral registers are their most complete and accurate immediately following the annual canvass (usually December registers).
England and Wales To produce the estimates in this report, ONS matched a sample of the electoral registers against a sample of census data drawn from areas covered by the Census Coverage Survey (CCS).1 This allowed data from the CCS to be used, through a system referred to as Dual System Estimation (DSE), to adjust some estimates in order to compensate for non-response to the census.
An important issue the methodology needed to address was that the census data and the registers data do not refer to the same point in time. For the April 2011 registers this difference was minor – the registers were in force from 1 April 2011, based on residency at the property at which you were registered on 15 March 2011. The census took place on 27 March 2011.
However, the 1 December 2010 electoral registers were compiled based on a qualifying date in October 2010 - six months before census day. The only indication of residency for October 2010 that the census provides is from the question which asked whether an individual lived at a different address a year before the census. But while it asks for details of the previous address, it does not ask when the respondent moved house. From our sample, it is estimated that 7.9% of census responders said they lived at a different address one year before the census and so must have moved some time between March 2010 and March 2011. 1 The CCS is a survey carried out separately to the census in order to assess coverage, to estimate the population missed by the census, and to allow for adjustments to the census results based on those who did not respond.
10
The approach adopted was to assume that all electoral register entries that matched to an address one year before the census were the result of moves that occurred after October 2010 (i.e. that the failure to match a census address to a December register entry was not because the individual had moved before the canvass and failed to register).
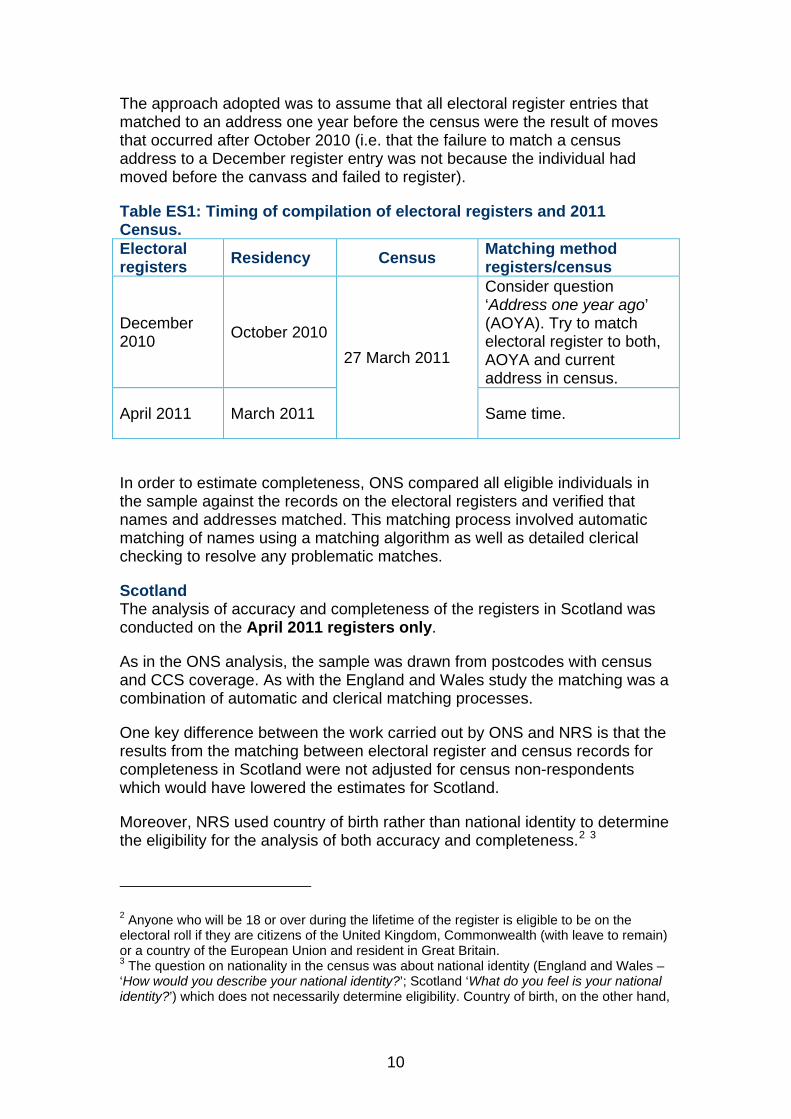
Table ES1: Timing of compilation of electoral registers and 2011 Census. Electoral registers Residency Census Matching method
registers/census
December 2010 October 2010
27 March 2011
Consider question ‘Address one year ago’ (AOYA). Try to match electoral register to both, AOYA and current address in census.
April 2011 March 2011 Same time.
In order to estimate completeness, ONS compared all eligible individuals in the sample against the records on the electoral registers and verified that names and addresses matched. This matching process involved automatic matching of names using a matching algorithm as well as detailed clerical checking to resolve any problematic matches.
Scotland The analysis of accuracy and completeness of the registers in Scotland was conducted on the April 2011 registers only.
As in the ONS analysis, the sample was drawn from postcodes with census and CCS coverage. As with the England and Wales study the matching was a combination of automatic and clerical matching processes.
One key difference between the work carried out by ONS and NRS is that the results from the matching between electoral register and census records for completeness in Scotland were not adjusted for census non-respondents which would have lowered the estimates for Scotland.
Moreover, NRS used country of birth rather than national identity to determine the eligibility for the analysis of both accuracy and completeness.2 3
2 Anyone who will be 18 or over during the lifetime of the register is eligible to be on the electoral roll if they are citizens of the United Kingdom, Commonwealth (with leave to remain) or a country of the European Union and resident in Great Britain. 3 The question on nationality in the census was about national identity (England and Wales – ‘How would you describe your national identity?’; Scotland ‘What do you feel is your national identity?’) which does not necessarily determine eligibility. Country of birth, on the other hand,
11
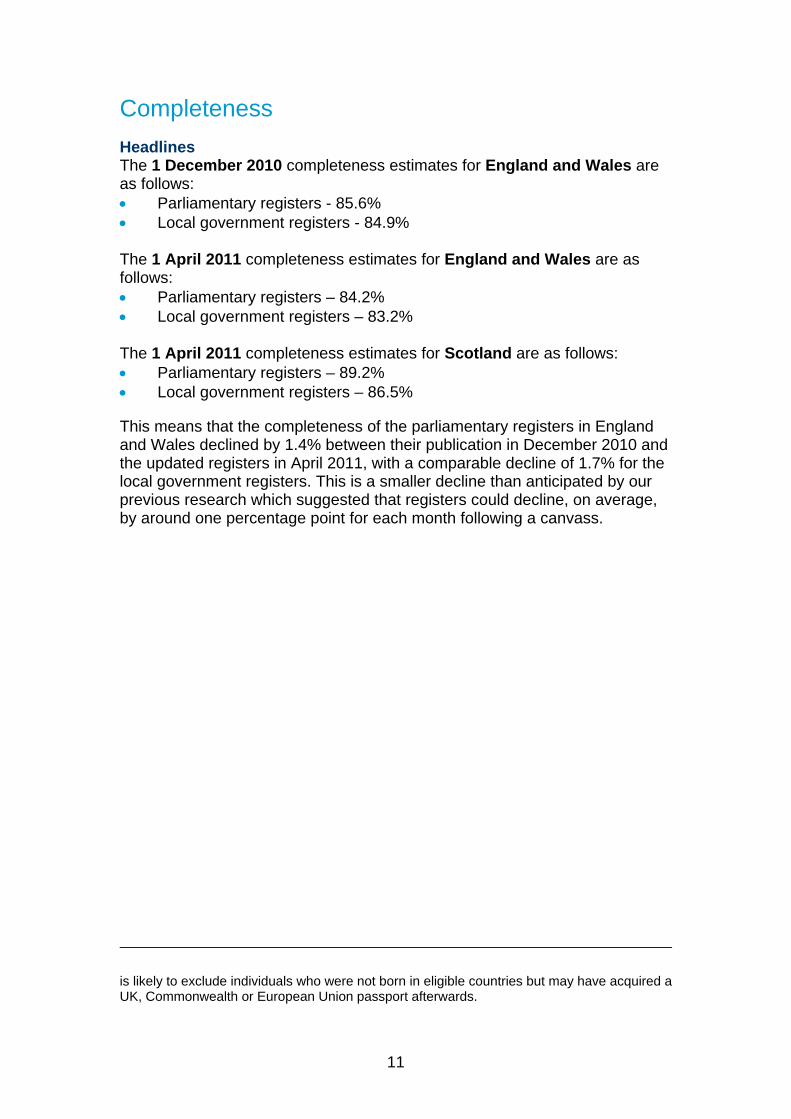
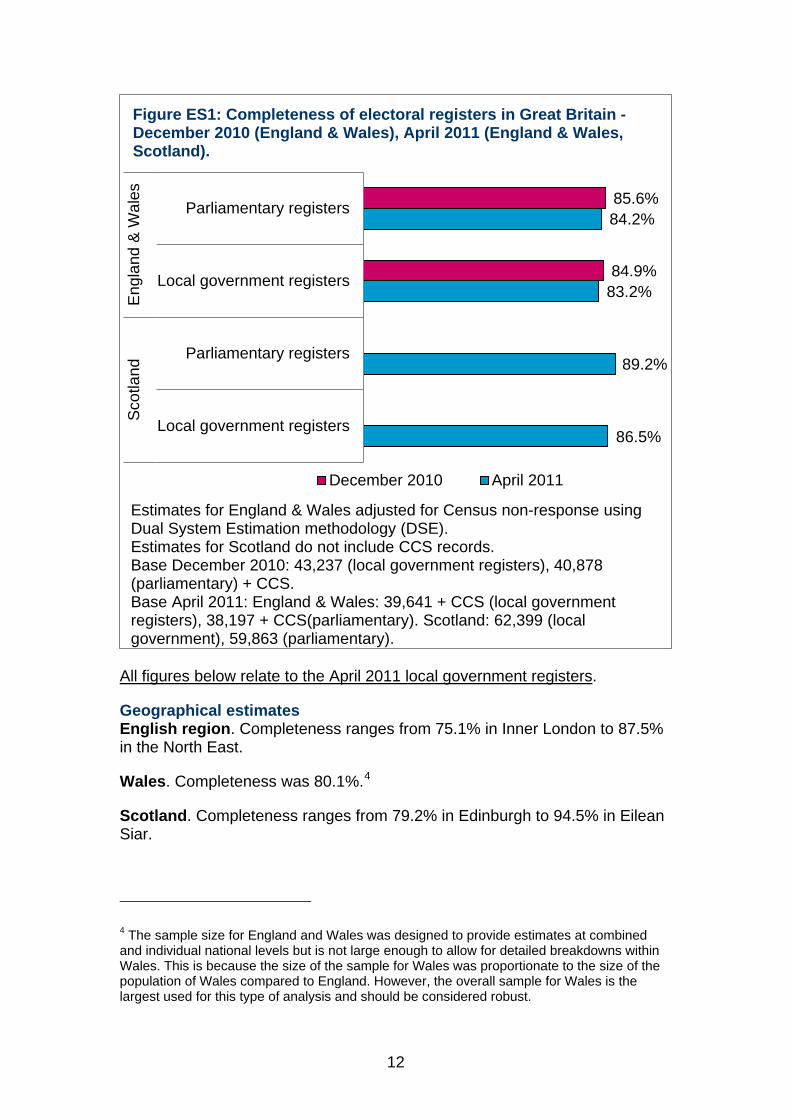
Completeness Headlines The 1 December 2010 completeness estimates for England and Wales are as follows: • Parliamentary registers - 85.6% • Local government registers - 84.9% The 1 April 2011 completeness estimates for England and Wales are as follows: • Parliamentary registers – 84.2% • Local government registers – 83.2% The 1 April 2011 completeness estimates for Scotland are as follows: • Parliamentary registers – 89.2% • Local government registers – 86.5%
This means that the completeness of the parliamentary registers in England and Wales declined by 1.4% between their publication in December 2010 and the updated registers in April 2011, with a comparable decline of 1.7% for the local government registers. This is a smaller decline than anticipated by our previous research which suggested that registers could decline, on average, by around one percentage point for each month following a canvass.
is likely to exclude individuals who were not born in eligible countries but may have acquired a UK, Commonwealth or European Union passport afterwards.
12
All figures below relate to the April 2011 local government registers.
Geographical estimates English region. Completeness ranges from 75.1% in Inner London to 87.5% in the North East.
Wales. Completeness was 80.1%.4
Scotland. Completeness ranges from 79.2% in Edinburgh to 94.5% in Eilean Siar.
4 The sample size for England and Wales was designed to provide estimates at combined and individual national levels but is not large enough to allow for detailed breakdowns within Wales. This is because the size of the sample for Wales was proportionate to the size of the population of Wales compared to England. However, the overall sample for Wales is the largest used for this type of analysis and should be considered robust.
85.6%
84.9%
84.2%
83.2%
89.2%
86.5%
Parliamentary registers
Local government registers
Parliamentary registers
Local government registers
Engl
and
& W
ales
Scot
land
December 2010 April 2011
Estimates for England & Wales adjusted for Census non-response using Dual System Estimation methodology (DSE). Estimates for Scotland do not include CCS records. Base December 2010: 43,237 (local government registers), 40,878 (parliamentary) + CCS. Base April 2011: England & Wales: 39,641 + CCS (local government registers), 38,197 + CCS(parliamentary). Scotland: 62,399 (local government), 59,863 (parliamentary).
Figure ES1: Completeness of electoral registers in Great Britain - December 2010 (England & Wales), April 2011 (England & Wales, Scotland).
13
The analysis of completeness by geography shows that urban areas and areas with high population density have a lower level of completeness than rural areas.
The analysis by type of local authority (Metropolitan, Non-Metropolitan and London Borough, Welsh Unitary) shows that London has a considerably lower level of completeness than other metropolitan areas while there is no significant difference between Metropolitan and Non-Metropolitan areas (outside London).
However, further analysis shows that while London was found to have significantly lower completeness rates than other metropolitan areas, this is due to demographic factors (see below). When these variables are controlled for, regression analysis suggests that being from Inner London increases the likelihood that someone will be on the electoral register more than any other region with the exception of the East Midlands. This is likely to be because EROs in London are aware of the scale of the challenge involved in maintaining their registers and are therefore taking effective steps to attempt to compensate for particular factors such as the high levels of population mobility.
Demographic characteristics Age. The likelihood of being on the registers generally increases with age. Younger people are less likely to be registered than older people and also more likely to drop off the register between December and April.
• England and Wales - 57.1% for 16-17 year old (attainers) to 91.4% for the 65+
• Scotland – 52.9% for 17 year old to 96.4% for those aged 65+.
Ethnicity. Completeness was also found to vary by ethnicity, with the highest levels of completeness among the White population.
• England and Wales – 87.1% for White to 73.3% for Black Africans • Scotland – 88.9% for White to 41.6% for ‘other Asian’ ethnicities
Marital status. Married people and widowed people are more likely to be registered than those who are single or separated.
• England and Wales – 92% for married people to 76.7% for single people and 76.1% for separated people
• Scotland – 93.7% for married people to 75% for single people
Country of birth. EU citizens are considerably less likely to register than UK and Commonwealth citizens.
• England and Wales – 88% for people born in the UK to 61.1% for people born in the EU
• Scotland – 88.8% for people born in the UK to 59.2% for people born in the EU
14
Length of residence. There is a strong positive relation between increasing length of residence in the UK and completeness.
• England and Wales – 18.3% for those resident for less than one year, 56.2% for those resident between two and five years and 87.8% for those resident for over 10 years
• Scotland – analysis not conducted
Household structure. The closer the relationship each member of the household has with the person who completed the census form, the more likely they are to be on the registers.5
• England and Wales – 89.1% for the person filling out the census form, 82.2% for their child and 50.8% for people unrelated to them
• Scotland – 88.8% for the person filling out the census form, 81.7% for their child and 39.7% for people unrelated to them.
Religion. For those who answered the census question on religion (92% of all respondents in the sample), Christians were most likely to be on the registers with those who are Muslim being least likely.6
• England and Wales – 88.6% for Christians to 78.1% for Muslims • Scotland – 90.1% for Christians to 74.5% for Muslims
Economic and social conditions Economic activity. Those who are unemployed are less likely to be registered than those in employment.
• England and Wales – 86% for those who are employed, 81.3% for the long term sick or disabled and 72.1% for the unemployed
• Scotland – 86.6% for those who are employed, 85.4% for the long term sick or disabled and 68.1% for the unemployed
The highest levels of completeness by economic status are for those who are retired: 93.6% in England and Wales; 96.9% in Scotland.
Qualifications. There are no significant differences found in levels of completeness by different levels of qualification. However, when qualification is looked at for younger age groups in England and Wales, those with no qualification are significantly less likely to be registered: 63.3% were found to be on the register compared to 74-80% of those with qualifications.
Students. The completeness for students was 71.7% in England and Wales and 64% in Scotland.
5 The system of electoral registration is now changing from one of household registration to individual registration. 6 This excludes religions with a small base.
15
Occupation. Those who work in administrative occupations are most likely to be on the register.
• England and Wales – 91.6% for administrative occupations to 83.4% for Caring and Leisure occupations
• Scotland – 92.6% for administrative occupations to 82.1% for those in elementary occupations
Deprivation. People living in areas with the highest level of deprivation are significantly less likely to be registered.
• England and Wales – 91.9% for those in the least deprived quartile to 83% for those in the most deprived (figures for December 2010 local government registers)
• Scotland – 92.4% for those in the least deprived areas and 77.7% for those in the most deprived
Tenure. There is a strong association with levels of completeness. Those living in communal establishments and private renters are significantly less likely to be registered than those who own their own home.
• England and Wales – 93.2% for owner occupiers to 63.1% for private renters and 45.5% for those living in communal establishments
• Scotland – 95.7% for owner occupiers to 52.4% for private renters
Accuracy Headlines The accuracy estimates for local government registers in England and Wales are as follows: • 1 December 2010 – 89-92% • 1 April 2011 – 88–90%
The 1 April 2011 local government accuracy estimate for Scotland is 90%.
The main component of inaccuracy relates to people who no longer live at the address shown on the registers and a significantly smaller proportion of inaccuracies relate to ineligible people on the registers. The findings shows that, in England and in Wales, 9 - 11% of register entries were inaccurate because the person named on the register no longer lives there. Of those that are still resident, 99% are found to be eligible. This supports findings from the Commission’s previous research into the accuracy of the registers.
Additional analysis in England and Wales suggests that approximately 15% of people who move home, and register at their new address, remained on the register at their previous address. Note that this is not an overall measure of duplication on the registers as it only relates to those who moved home in the six months preceding the census (between the canvass qualifying date in October 2010 and 27 March 2011).
16
Geographical variation Accuracy does not vary significantly between the English regions and Wales with the exception of Inner London.
Accuracy by local authority area in Scotland ranged from 81% (Glasgow) to 97% (Falkirk).7
Analysis Context Previous research has set out how the completeness of the registers has changed over time. The highest recorded levels of completeness were produced in the 1950s and 1960s. At this time, registers were found to be 96% complete at the end of the canvass period (1950 and 1966).
There was then a substantial gap in the publication of national estimates of completeness, with the next estimate produced using the 1981 Census (based on the 1980 registers). This found that 93.5% of people were registered at the end of the canvass period. This showed that completeness started to decline by the early 1980s and to stabilise at around 91-93% during the 1990s (1991 Census) and 91-92% in 2001 (2001 Census).
However, the Electoral Commission’s 2011 study of Great Britain’s registers and the estimates presented in this report show that in the last ten years there had been a substantial increase in non-registration rates: from 8-9% in 2001 to 14-15% in 2011.
Explaining the decline ONS conducted additional regression analysis on the findings for England and Wales in order to identify the key factors associated with non-registration and to assess which have the most significant impact on registration rates.
Although the lowest level of completeness is seen for those with a short period of residence in the UK and immigration from EU countries has increased significantly since 2004, the overall drop of completeness cannot be due mainly to migration of people born in the EU. Only 2% of the census respondents in the sample were born in the EU and resident for less than 5 years. Their registration rate is low at 43%, but this can only account for a drop in registration rates of about 1%. Similarly, low registration of migrants from non-EU countries can only have a small effect upon registration rates as they represent just 2% of the census respondents in the sample.
More significantly, the level of completeness of people born in the UK has decreased by 5% since 2001 – this has a greater impact on the overall completeness rate.
7 Local authority level assessments are available for Scotland due to the size of the sample selected by NRS and because there are only 32 authority areas. This level of detail is not available in England or in Wales.
17
There is generally a drop in registration rates of 5-6% for all personal characteristics assessed in the regression analysis compared to 2000. The most significant change, in terms of impact on overall rate, is in younger age groups. Those aged 18 to 34 show a drop of between 7 - 9%. In contrast, those aged over 45 show a drop in registration of less than 4%.
The largest impact on overall levels of completeness is therefore the fall in levels of registration for people born in the UK, particularly the under 35s, with an additional effect coming from the low registration rates of migrants who have been resident in the UK for less than 5 years.
Additional regression findings Regression analysis considers specific characteristics, e.g. housing tenure while controlling for other characteristics, e.g. age. The analysis generally confirms what has been presented in the main findings but it also shows that once other factors are controlled for, the story is different for two key variables.
The regression analysis suggests that living in Inner London increases the likelihood that someone will be on the electoral register more than any other region with the exception of the East Midlands. This is in contrast to the results when no modelling is done, where living in London is associated with a low registration rate. This suggests that the lower registration rate observed in inner London is a result of demographic factors (and there is not something inherent about living in London which results in lower levels of registration).
On country of birth, when the other factors in the model are controlled for, an individual born in the Commonwealth has a higher predicted registration rate than an individual born in the UK. This seems in contrast with the finding showing that completeness for UK born people was significantly higher than for people born in the Commonwealth. However, this additional analysis indicates that this is because people born in the UK are more likely to have characteristics that associate with higher registration rates than people born in the Commonwealth – and that being born in the Commonwealth is not itself a reason for lower levels of registration.
Other factors have a different effect in the regression analysis than in the main findings. These are marital status, highest qualification and religion. For example, the high registration rate seen amongst widows is likely to be due to other correlated factors, e.g. age.
However, one finding which is notably confirmed by the analysis is that when other factors are controlled for in the model, the predicted registration rate for people identifying as Muslims remains significantly lower than for those identifying as Christians.
18
1 Introduction The 2011 Census provides the opportunity to assess the quality of the 1.1
December 2010 and April 2011 electoral registers in Great Britain and to verify the findings of a previous study conducted by the Electoral Commission using a different methodology.
This study has been conducted by the Electoral Commission, the Office 1.2for National Statistics (ONS) - for England and for Wales - and the National Records of Scotland (NRS). It is based on a comparison between the electoral registers in force in Great Britain at two separate points (December 2010 and April 2011) and data collected through the 2011 Census (on 27 March 2011). The registers and the census data do not relate to the same point in time and the project methodology was developed to address this issue (see Chapter 2 for more details).
The findings are presented in this report together with detailed 1.3information on the methodology used.
The first study on the electoral registers using census data was 1.4published in 1967, by the Home Office, and focused on the registers in 1950 and 1966 (using the 1951 and 1966 Censuses).8 Subsequent reports, which focused on the 1980 and 1990 registers (and used the 1981 and 1991 censuses), were published by the Office for Population Censuses and Surveys (OPCS), the predecessor of the Office for National Statistics (ONS). The Electoral Commission funded the most recent study which focused on the 2001 registers (using findings from the 2001 Census) and published a report in 2005, Understanding electoral registration.9
We have repeated that research using data from the 2011 Census. The 1.5coverage of this research differs from the 2005 research by reporting on the accuracy (see 1.18-1.19 for our definition of accuracy) of the registers (this was not included in the previous analysis but was in the 1981 and 1991 studies) and providing estimates for the registers in force on 1 April 2011 – around the time the census was conducted – in addition to the registers published immediately following the annual canvass. It also includes estimates for accuracy and completeness for Scotland which was not covered in our 2005 study.
8 The 1966 census is, to date, the only five-yearly census in the UK following on from the 1961 census and preceding the 1971 census. 9 The Electoral Commission, Understanding electoral registration: The extent and nature of non-registration in Great Britain (September 2005). However, the research set out in this report is based on a different methodology from that used in 2005. In the 2005 research, a composite population sample was created based upon the address sample of a large social survey, the Labour Force Survey. Also there was no nationality question on the 2001 census questionnaire (unlike in 2011).
19
The analysis conducted by ONS used a sample designed to provide 1.6reliable figures across England and Wales. It did not include a large enough sample in Wales to provide demographic breakdown for Wales alone. Findings on demographic and socio economic breakdowns are therefore presented as England and Wales combined figures.10
The Commission last reported on the quality of Great Britain’s registers 1.7in 2011 (December 2010 and April 2011 electoral registers).11 That study used a different methodology (a nationally representative house-to-house survey) and the findings in this census-based report allow us to confirm the results from the previous study and assess the robustness of its methodology.
In addition, this analysis, based on census data, also provides greater 1.8detail, than the 2011 study, on national and regional rates of registration and allows for more in-depth reporting of social and demographic factors. It provides insight into how registration varies according to area-type and which factors are more likely to be instrumental in understanding whether or not people will be either missing from the registers or inaccurately registered.
This will be the final study on the current household electoral registration 1.9system as this will change, during 2014-16, to one of individual electoral registration (IER). In addition, the nature of the census is also likely to change with the current recommendation for an internet-based census in 2021.12 When full details of the final approach to the census are available the Commission will decide if future research of this type can be conducted in a way which meets our requirements.
Our research programme Since 2004, we have become the principal body in the United Kingdom 1.10
undertaking research into the electoral registers. Following the publication of our 2005 report, Understanding electoral registration,13 much of this work has been focused on the piloting and testing of new techniques for assessing accuracy and completeness. This concern with developing new methods has arisen from the limited scope to produce reliable estimates using existing approaches in the periods between the census of population, which takes place every 10 years.
Our research programme into electoral registers is designed to: 1.11
• provide an overview of the accuracy and completeness of Great Britain’s electoral registers
10 To include a sample which would have allowed for a full breakdown of data in Wales alone would have made the project more costly. 11 The Electoral Commission, Great Britain’s electoral registers 2011 (December 2011). 12 http://www.ons.gov.uk/ons/about-ons/who-ons-are/programmes-and-projects/beyond-2011/beyond-2011-report-on-autumn-2013-consultation--and-recommendations/index.html 13 The Electoral Commission, Understanding electoral registration: the extent and nature of non-registration in Britain (August 2005).

20
• provide up-to-date information on those groups that are more likely to be under-registered and thereby inform our guidance to EROs and our approach to public awareness activity
• provide ongoing tracking of how electoral registers change in response to legislative developments, administrative change or population change and use this tracking to inform our role in scrutinising proposals and policies to revise the registration system.
Our main research studies into the quality of the registers are: 1.12
• Accuracy and completeness of the 2014 electoral registers, July 2014 • Continuous electoral registration in Northern Ireland, November 2012 • Great Britain’s electoral registers, December 2011 • The completeness and accuracy of electoral registers in Great Britain,
March 2010 • Electoral registration in Northern Ireland: accuracy and
comprehensiveness, September 2008 • Understanding electoral registration, September 2005.
All these reports are available on our website.14 1.13
The quality of the electoral registers: accuracy and completeness
Our approach to measuring the quality of the electoral registers is based 1.14on two measures: accuracy and completeness.
The Commission defines accuracy and completeness as follows: 1.15
By completeness we mean that ‘every person who is entitled to have an 1.16entry in an electoral register is registered’.
The completeness of the electoral registers therefore refers to the 1.17percentage of eligible people who are registered at their current address. The proportion of eligible people who are not included on the register at their current address constitutes the rate of under-registration.
By accuracy we mean that ‘there are no false entries on the electoral 1.18registers’.15
The accuracy of the electoral registers is therefore a measure of the 1.19percentage of entries on the registers which relate to verified and eligible voters who are resident at that address. Inaccurate register entries may relate 14 http://www.electoralcommission.org.uk/our-work/our-research/electoral-registration-research 15 Our definition of accuracy excludes minor errors - such as the misspelling of an elector’s name, - from the headline measure as they would not prevent an eligible elector from being able to cast a vote.
21
to entries which have become redundant (for example, due to home movement), which are ineligible and have been included unintentionally, or which are fraudulent.
The system of electoral registration EROs are responsible for maintaining their electoral registers and there 1.20
are separate registers for every local authority in Great Britain.
Understanding the accuracy and completeness of the electoral registers 1.21is also particularly relevant at this time because the way that the electoral registers are created is in the process of change -moving from a system of household registration to one of individual electoral registration (IER).
The Electoral Commission supports the introduction of IER as an 1.22important improvement in how people register to vote.16
The Commission has been calling for IER to be implemented in Great 1.23Britain since 2003, principally because the previous household registration system was vulnerable to fraud as there was no requirement to provide any evidence of an individual’s identity to register to vote. Moreover Great Britain’s system of electoral registration had remained largely the same since the Victorian period, and was therefore one of the few systems in the world not based on registration by individuals.
In June 2014 the transition to the new system of IER began in England 1.24and Wales. Due to the referendum on independence for Scotland, the transition does not begin in Scotland until September 2014. Under this new system each elector is responsible for registering to vote, rather than one member of the household registering all those who live at a property. Electors will also be required to provide personal identifiers when registering to vote (date of birth and National Insurance number under the new proposals) in order to help make the registers more secure.
Transition to individual electoral registration The transition to IER began with the matching of existing electors’ details 1.25
against the Department for Work and Pensions database in order to verify their identity. This process is known as confirmation and is already underway in England and Wales (it will take place in September/October 2014 in Scotland). Electoral Registration Officers (EROs) have also been able to use locally held data in order to confirm the identity of existing electors.
Existing electors whose details are matched on to the DWP database or 1.26via local data sources will be confirmed directly onto the first IER registers – they will not need to take any action.
16 More information on the Individual Electoral Registration system can be found on our website: www.electoralcommission.org.uk.
22
Those electors whose entries are not confirmed, as well as those who 1.27have moved house and any new elector will be asked to (re)register by providing unique identifying information: their National Insurance number and date of birth. This process of writing out to unconfirmed and new electors began in England and Wales in early July 2014.
EROs will still have a duty to take all necessary steps to maintain their 1.28electoral registers and will therefore be required to follow up with non-responding electors by sending reminders through the post or, if required, via door-to-door canvassing.17
Any elector with an absent vote (postal or proxy voters) will need to be 1.29confirmed or re-register by providing their personal identifiers before the revised electoral registers are published by 1 December 2014 (2 March 2015 in Scotland) in order to retain their absent vote.
Electors on the pre-confirmation registers who cannot be confirmed will 1.30not automatically be removed immediately, but if they do not re-register by providing personal identifiers by December 2016 they will be deleted from the registers. Whilst the legislation says that the transition to IER will be completed in December 2016, Ministers can lay an order before the UK Parliament to provide for the transition to be completed by December 2015 and the Government has made it clear that its intent is to complete the transition in 2015.
Therefore, while there is uncertainty as to whether the removal of 1.31electors that have not provided personal identifiers will occur in 2016 or 2015, we have advised EROs to plan on the basis that they will have to be ready for the point of removal to be 2015.
The franchise for parliamentary and local government registers
The move to IER will not affect the existing criteria for registration. Not 1.32every resident in the Great Britain can register to vote. The entitlement to vote differs according to the type of election. This means that EROs are required to keep two registers: the parliamentary registers and the local government registers (see Table 1.1).
To be on either of the registers, a resident is required to have British, 1.33Irish, Commonwealth or European Union (EU) citizenship. Since 1999, EU citizens have been eligible to vote at local, devolved and European Parliamentary elections and are therefore entitled to be on the local government registers (they must then complete an additional form to be registered to vote in the European Parliament elections in the UK rather than their home country). However, as they are not eligible to vote at UK
17 Section 9A of the Representation of the People Act 1983 sets out this duty.
23
parliamentary elections they are not entitled to be on the parliamentary registers.
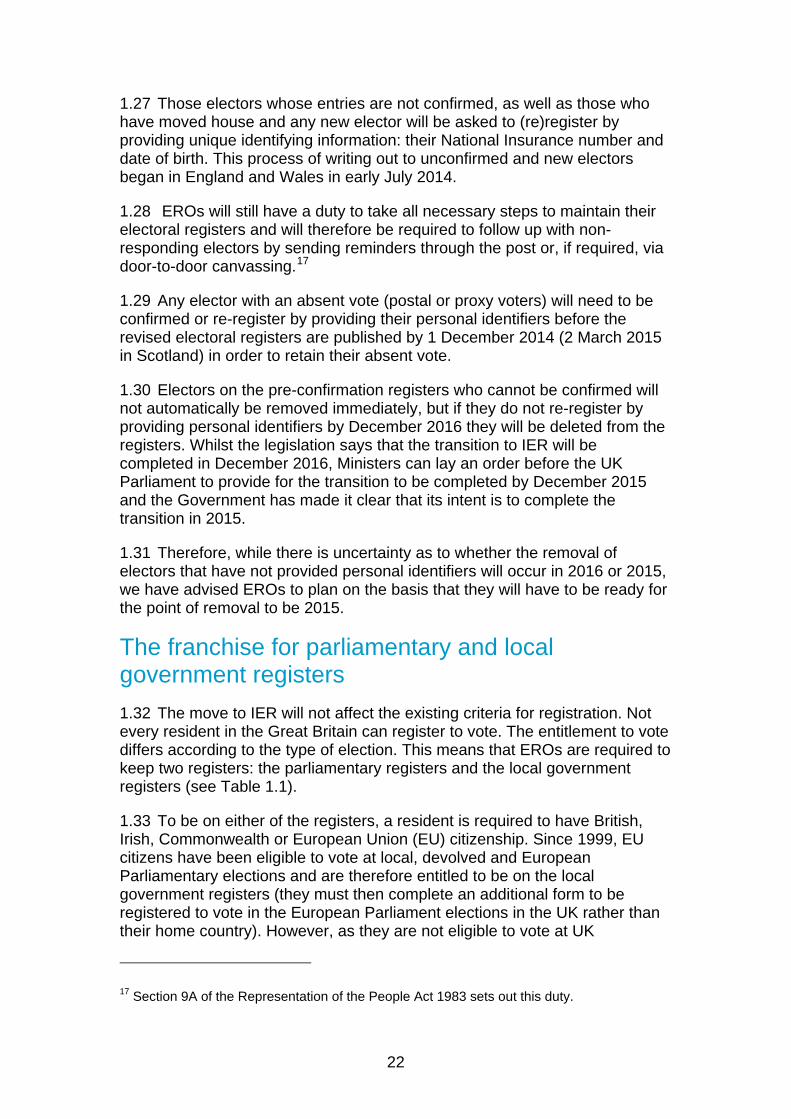
Table 1.1 sets out the entitlement to vote by citizenship. Those not listed 1.34here are not eligible to be on either the parliamentary or the local government registers.
Table 1.1: Franchise for citizenship and elections.
Citizenship UK Parliament
EU Parliament
Local Government Register
British √ √ √ Parliamentary and Local government
Commonwealth* √ √ √ Irish* √ √ √ European Union* × √ √ Local
government Notes: * Citizens resident in the UK who either have leave to remain or do not require such leave.
For most electoral events in the UK, the age at which citizens become 1.35entitled to vote is 18.18 However, the electoral registers also include records of ‘Attainers’ – 16- and 17-year olds who turns 18 by the end of the twelve months following the 1 December after the ‘relevant date’ (with ‘relevant date’ defined as 15 October for canvass returns, and the date the application was made in all other cases).
There are also a small number of specific exceptions to these general 1.36rules. For instance, all convicted prisoners currently lose their right to vote while they are imprisoned. Anyone convicted of electoral offences will also be disqualified from voting for a specific period.
The uses of the electoral registers Electoral registers underpin elections by providing the list of those who 1.37
are eligible to vote. Those not included on the registers cannot take part in elections. However, the registers are also used for other public purposes. For example, the various Boundary Commissions use the registers to calculate electoral quotas when they review parliamentary and local government boundaries.
The registers are also used as the basis for selecting people to 1.38undertake jury service and for certain law enforcement and crime prevention purposes. Credit reference agencies are also able to purchase complete copies of the registers, which they use to confirm addresses supplied by applicants for bank accounts, credit cards, personal loans and mortgages.
18 The voting age for the Scottish Independence Referendum (September 2014) is 16.
24
This report This report is based on a comparison of a sample of data held on the 1.39
electoral registers in December 2010 and April 2011 and the information collected for the 2011 Census in England and Wales. The analysis in Scotland was conducted only on the April 2011 registers.19
A further project, using equivalent census data, is planned for Northern 1.40Ireland. We are working with the Northern Ireland Statistics and Research Agency to develop this work.
The remainder of this report is divided into the following chapters: 1.41
• Chapter two sets out the approach taken to the research and various methodologies to study the quality of the electoral registers.
• Chapter three sets out the completeness rate by geographic, demographic, socio-economic characteristics and it also includes an analysis of electoral registration practices.
• Chapter four provides an analysis of the trend of electoral registration, using regression analysis and other data.
• Chapter five sets out the findings on the accuracy of the registers. • The final chapter summarises the key findings and an assessment of
the methodologies used to study the quality of the registers.
19 This was due to the available capacity at NRS to conduct the research.
25
2 Research into the quality of the electoral registers: approach
This chapter presents the methodology used to conduct this study. It 2.1also examines the various methodologies that can be used for reporting on the accuracy and completeness of the electoral registers, including the approaches taken for recent Electoral Commission reports on the quality of the registers.
Further information on the methodology used by the Office for National 2.2Statistics (ONS) and the National Records of Scotland (NRS) is set out in Appendix A.
Producing estimates There are a limited number of reliable methods that can be used to 2.3
assess the quality of the electoral registers which differ mainly by the frequency with which they can be used and the reliability of the results. The main approaches are:
• Using large-scale house-to-house surveys: Large-scale, representative or random social surveys can be used to produce reliable estimates of the accuracy and completeness of the registers. This approach generally uses the postcode address file as a sampling frame and interviewers collect information on everyone living in the households in the sample which is then cross-checked against actual entries on the electoral register. This approach was used in the Commission’s 2010 and 2011 studies.20
• Matching census records against the electoral registers: A sample of census returns (and data from the Census Coverage Survey) can be cross-matched against the electoral registers to derive estimates of accuracy and completeness. The census is the most complete source of information on the population and variants of this approach were used in relation to the 1966, 1981, 1991 and 2001 Censuses.21 However, this approach can only be repeated every ten years after the publication of census data.
20 The Electoral Commission, The completeness and accuracy of electoral registers in Great Britain (March 2010), The Electoral Commission, Great Britain’s electoral registers 2011 (December 2011). 21 The 1966 census is, to date, the only five-yearly census in the UK following on from the 1961 census and preceding the 1971 census.
26
• Comparing electoral statistics (number of entries on the registers) with mid-year population estimates: these two datasets can be used to produce relatively crude estimates of the annual registration rates at national and subnational levels, although they cannot be used to report on the accuracy of the registers. The registration rate is calculated by using data on the total entries on the electoral registers as the numerator and dividing this by the estimates for the population aged 16 and above as the denominator. While this method is currently the only means of providing annual estimates for individual local authorities or Parliamentary constituencies and can be used between census periods, it has many limitations.22
Details on the previous projects which utilised the two main methods - 2.4large scale surveys and census data – including their headline results are presented in Appendix D.
2011 Census check: methodology The findings in this report are based on the accuracy and completeness 2.5
of the parliamentary and local government electoral registers. The estimates have been produced by ONS for England and Wales and by NRS for Scotland, using two different but similar methodologies.
The estimates have been produced for two points in time for England 2.6and Wales, and one in Scotland:
• England and Wales: 1 December 2010 (the registers published immediately following the 2010 annual canvass) and 1 April 2011 (registers published within a week of the census date).
• Scotland: 1 April 2011 (registers published within a week of the census date).
The December and April registers were chosen because the former are 2.7the registers published immediately following the canvass, while the latter more closely coincided with the data of the census. Previous studies have indicated how electoral registers are their most complete and accurate immediately following the annual canvass (usually December registers).23
The report considers the accuracy and completeness of the registers by 2.8social, demographic and geographical characteristics, including an analysis of
22 This approach does not allow deriving a figure from population estimates for the proportion of the population whose nationality means they would be ineligible to vote; the accuracy of population estimates is likely to decline each year after the census on which they are based. The electoral statistics represent entries on the electoral registers, not individual electors. It is therefore not possible to quantify the number of entries which are duplicates or which are illegitimate using this approach. This means that the figures are likely to over-state the number of correctly registered electors. 23 The Electoral Commission, Great Britain’s electoral registers 2011 (December 2011).
27
the registration practices used by a sample of local authorities. It is important to note that, variables used for the analysis are not the same across England, Wales and Scotland.24 However, the analysis conducted by ONS used a sample designed to provide reliable figures across England and Wales. It did not include a large enough sample in Wales to provide demographic breakdown for Wales alone. Findings on demographic and socio economic breakdowns are therefore presented as England and Wales combined figures.
Analysis of the findings on accuracy by region and some demographics 2.9is also available. Limited analysis can be conducted on inaccurate entries as these refer to individuals for which census data are not available (more information is available in Chapter 5).
For England, Wales and Scotland it was necessary to collect electoral 2.10registers (or their constituent monthly updates) from as many EROs as possible in order to build as robust a sample as possible. Further specific methodological details are provided below and in the Appendix.
Methodology: England and Wales To produce the estimates in this report, ONS matched a sample of the 2.11
electoral registers against a sample of census data drawn from areas covered by the Census Coverage Survey (CCS).25 This allowed data from the CCS to be used, through a system referred to as Dual System Estimation (DSE), to adjust some estimates of completeness in order to compensate for non-response to the census.
An important issue the methodology needed to address was that the 2.12census data and the registers data do not refer to the same point in time. For the April 2011 registers this difference was minor – the registers were in force from 1 April 2011, based on residence at the property at which you registered on 15 March 2011. The census took place on 27 March 2011.
However, the 1 December 2010 electoral registers were compiled based 2.13on a qualifying date in October 2010 - six months before census day. The only indication of residency for October 2010 that the census provides is from the question which asked whether an individual lived at a different address a year before the census. But while it asks for details of the previous address, it does not ask when the respondent moved house. From our sample, it is estimated that 7.9% of census responders provided a different address one year ago and so must have moved between March 2010 and March 2011. However, it is worth noting that the full data on home movement in the previous year has
24 This is due to differences between the England & Wales and Scotland questionnaire, the approach to the analysis and the availability of certain data. 25 The CCS is a survey carried out separately to the census in order to assess coverage, to estimate the population missed by the census, and to allow for adjustments to the census results based on those who did not respond.
28
not been released yet and this figure may be an under-estimate – it is lower than the equivalent figures recorded in recent censuses.
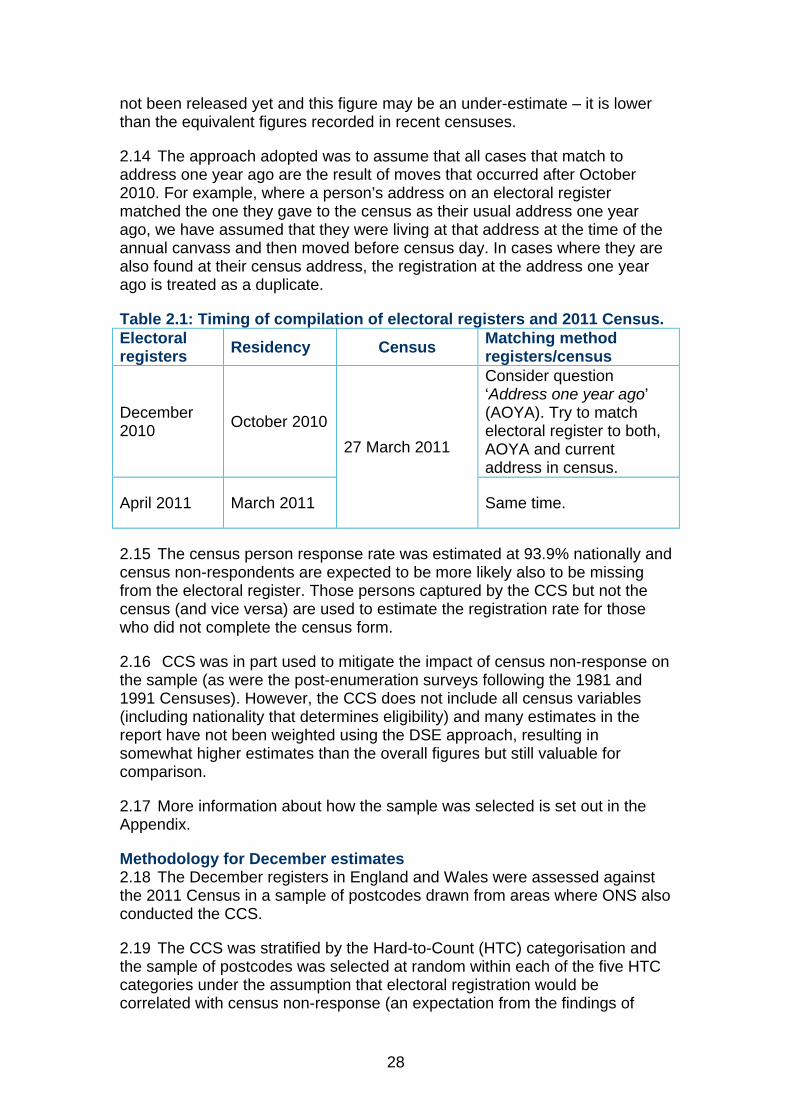
The approach adopted was to assume that all cases that match to 2.14address one year ago are the result of moves that occurred after October 2010. For example, where a person’s address on an electoral register matched the one they gave to the census as their usual address one year ago, we have assumed that they were living at that address at the time of the annual canvass and then moved before census day. In cases where they are also found at their census address, the registration at the address one year ago is treated as a duplicate.
Table 2.1: Timing of compilation of electoral registers and 2011 Census. Electoral registers Residency Census Matching method
registers/census
December 2010 October 2010
27 March 2011
Consider question ‘Address one year ago’ (AOYA). Try to match electoral register to both, AOYA and current address in census.
April 2011 March 2011 Same time.
The census person response rate was estimated at 93.9% nationally and 2.15census non-respondents are expected to be more likely also to be missing from the electoral register. Those persons captured by the CCS but not the census (and vice versa) are used to estimate the registration rate for those who did not complete the census form.
CCS was in part used to mitigate the impact of census non-response on 2.16the sample (as were the post-enumeration surveys following the 1981 and 1991 Censuses). However, the CCS does not include all census variables (including nationality that determines eligibility) and many estimates in the report have not been weighted using the DSE approach, resulting in somewhat higher estimates than the overall figures but still valuable for comparison.
More information about how the sample was selected is set out in the 2.17Appendix.
Methodology for December estimates The December registers in England and Wales were assessed against 2.18
the 2011 Census in a sample of postcodes drawn from areas where ONS also conducted the CCS.
The CCS was stratified by the Hard-to-Count (HTC) categorisation and 2.19the sample of postcodes was selected at random within each of the five HTC categories under the assumption that electoral registration would be correlated with census non-response (an expectation from the findings of
29
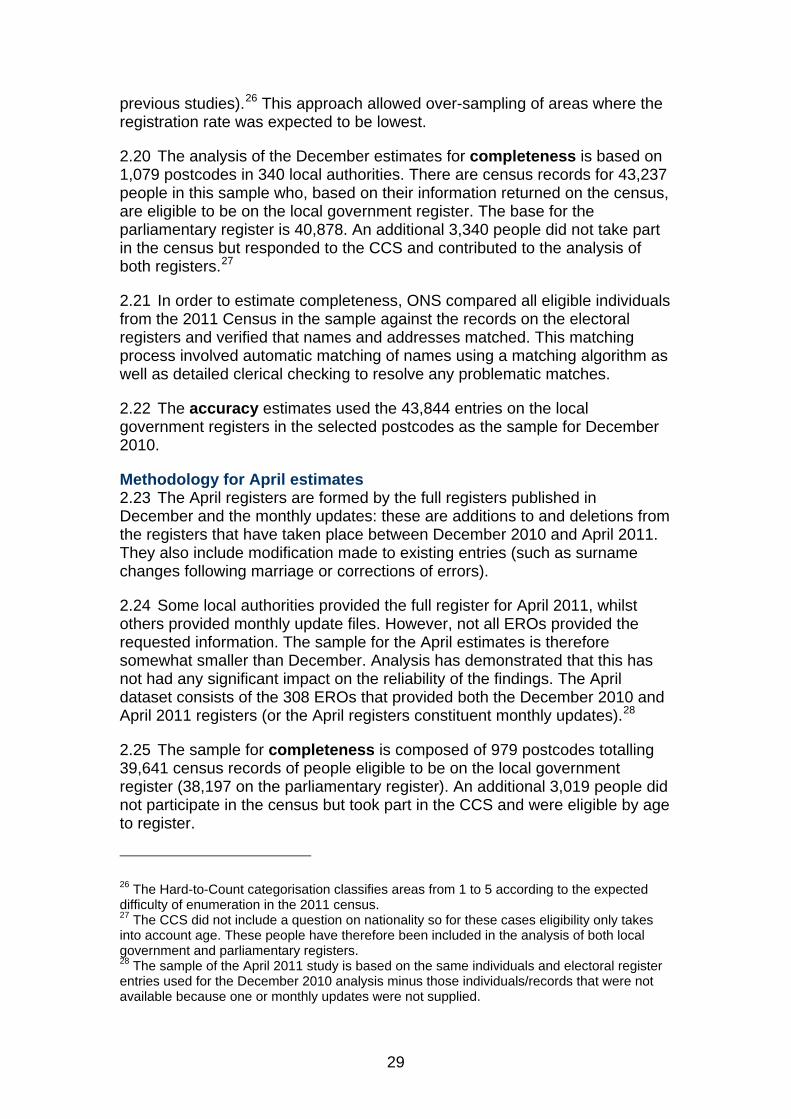
previous studies).26 This approach allowed over-sampling of areas where the registration rate was expected to be lowest.
The analysis of the December estimates for completeness is based on 2.201,079 postcodes in 340 local authorities. There are census records for 43,237 people in this sample who, based on their information returned on the census, are eligible to be on the local government register. The base for the parliamentary register is 40,878. An additional 3,340 people did not take part in the census but responded to the CCS and contributed to the analysis of both registers.27
In order to estimate completeness, ONS compared all eligible individuals 2.21from the 2011 Census in the sample against the records on the electoral registers and verified that names and addresses matched. This matching process involved automatic matching of names using a matching algorithm as well as detailed clerical checking to resolve any problematic matches.
The accuracy estimates used the 43,844 entries on the local 2.22government registers in the selected postcodes as the sample for December 2010.
Methodology for April estimates The April registers are formed by the full registers published in 2.23
December and the monthly updates: these are additions to and deletions from the registers that have taken place between December 2010 and April 2011. They also include modification made to existing entries (such as surname changes following marriage or corrections of errors).
Some local authorities provided the full register for April 2011, whilst 2.24others provided monthly update files. However, not all EROs provided the requested information. The sample for the April estimates is therefore somewhat smaller than December. Analysis has demonstrated that this has not had any significant impact on the reliability of the findings. The April dataset consists of the 308 EROs that provided both the December 2010 and April 2011 registers (or the April registers constituent monthly updates).28
The sample for completeness is composed of 979 postcodes totalling 2.2539,641 census records of people eligible to be on the local government register (38,197 on the parliamentary register). An additional 3,019 people did not participate in the census but took part in the CCS and were eligible by age to register.
26 The Hard-to-Count categorisation classifies areas from 1 to 5 according to the expected difficulty of enumeration in the 2011 census. 27 The CCS did not include a question on nationality so for these cases eligibility only takes into account age. These people have therefore been included in the analysis of both local government and parliamentary registers. 28 The sample of the April 2011 study is based on the same individuals and electoral register entries used for the December 2010 analysis minus those individuals/records that were not available because one or monthly updates were not supplied.
30
The sample for accuracy is based on the entries on the local 2.26government electoral registers in the selected postcode. There were 275 deletions and 289 additions to create the April registers, making a total to 40,008 electoral register records.
Methodology: Scotland The analysis of accuracy and completeness of the registers in Scotland 2.27
was conducted on the April 2011 registers only.29
It followed the approach used in England and Wales: completeness 2.28was assessed using a sample of individuals from the census, selected in areas where CCS was conducted. The records in the sample were matched against the ones on the electoral registers to derive an estimate for completeness. As with the England and Wales study the matching was a combination of automatic and clerical matching processes. The sample size was 62,399 census records (local government registers) and 59,863 (parliamentary registers). The results from the matching between electoral register and census records were not adjusted for census non-respondents which would have lowered the estimates for completeness.
The base for accuracy is the total number of entries on the registers in 2.29the selected postcodes. These were then matched against individuals on the census and the CCS to provide a single estimate for accuracy. The total sample for accuracy was based on 61,505 entries on the local government registers.30
One key difference between the work carried out by ONS and NRS is 2.30the approach to determining eligibility related to nationality. NRS omitted those born outside eligible countries from the analysis of both accuracy and completeness using the country of birth question on the census. ONS used the answers given to the national identity question. This was partly a result of the different wording of the national identity question on the Scottish census form.
29 This was due to the available capacity at NRS to conduct the research. 30 The sample size selected in Scotland was larger than that used across England and Wales. The final sample sizes were determined through discussion between each statistics agency and the Commission. They were selected on the basis of overall cost and the need for reliable findings.
31
3 Completeness Introduction
This chapter presents the completeness of the electoral registers in 3.1England, Wales and Scotland and provides an analysis by various demographic variables.
The study was conducted by the Office for National Statistics (ONS) for 3.2England and Wales and by the National Records of Scotland (NRS) for Scotland. Although the methodology in Scotland largely replicated that used by ONS, there are some differences in the approach and the variables available and used for the analysis. Where possible, the data from the two studies are presented in comparison. All figures are subject to confidence intervals shown in Appendix B.
Figures for England and Wales are for the December 2010 and April 3.32011 registers; the ones for Scotland are for the April 2011 registers only (please see previous chapter for more information on the research methodology).
The sample size in Wales does not allow us to provide demographic 3.4breakdowns. Breakdowns for England and Wales are therefore presented together.31 A separate project was required in Scotland as the census data is not held by ONS. More detailed information is therefore available for Scotland than for Wales.
The analysis set out in this chapter is mainly based on the local 3.5government registers. It is noted where this is not the case. Where it was possible to do so, the findings are adjusted for census non-response using Dual System Estimation (DSE) as set out in the previous chapter. However, as the Census Coverage Survey (CCS) collects limited data, many of the figures in this chapter have not had this additional weighting applied. Whether or not a figure has been adjusted for census non-response (under-coverage) is noted in the tables.
The chapter is structured as follow: 3.6A. Headline figures and summary of key findings B. Geographical estimates C. Demographic characteristics
31 The analysis conducted by ONS used a sample designed to provide reliable figures across England and Wales. It did not include a large enough sample in Wales to provide demographic breakdown for Wales alone. To do so would have increased the cost of the project while providing limited benefit as there is no evidence that patterns of registration are different by country within Great Britain. In fact the similarity of the findings in Scotland to those for England and Wales suggests the issues are the same across Great Britain.

32
D. Social and economic conditions E. Electoral registration practices

33
3A. Headline figures and summary of key findings
Headlines The 1 December 2010 parliamentary registers for England and Wales 3A.1
(combined) were estimated to be 85.6% complete. The equivalent figure for the local government registers is 84.9%.
Parliamentary registers were subsequently found to be 84.2% 3A.2complete by 1 April 2011, with the equivalent figure for local government registers being 83.2%.
This means that the completeness of the parliamentary registers 3A.3declined by 1.4% between their publication in December 2010 and the updated registers in April 2011, with a comparable decline of 1.7% for the local government registers. This is a smaller decline than anticipated by our previous research which suggested that registers could decline, on average, by around one percentage point for each month following a canvass.32 However, it is possible that the December estimates slightly over estimate completeness because of the need to make assumptions about home movement between the annual canvass and census day. This would reduce the decline observed between December and April.
In Scotland, the April 2011 parliamentary registers were found to be 3A.489.2% complete and the local government registers 86.5% complete. Estimates for the December 2010 register are not available in Scotland.
These findings are in line with those from our previous research on the 3A.5same registers using a different methodology. That exercise reached a lower estimate of 82% for the completeness of Great Britain’s April 2011 registers. However, it is important to note that margins of error apply to both those figures and the ones presented here and there do not appear to be any significant difference between the findings.
The previous estimate for December 2010 was a range of 85-87% 3A.6which is confirmed by these new findings.
32 The Electoral Commission, The completeness and accuracy of the electoral registers in Great Britain (March 2010).
34
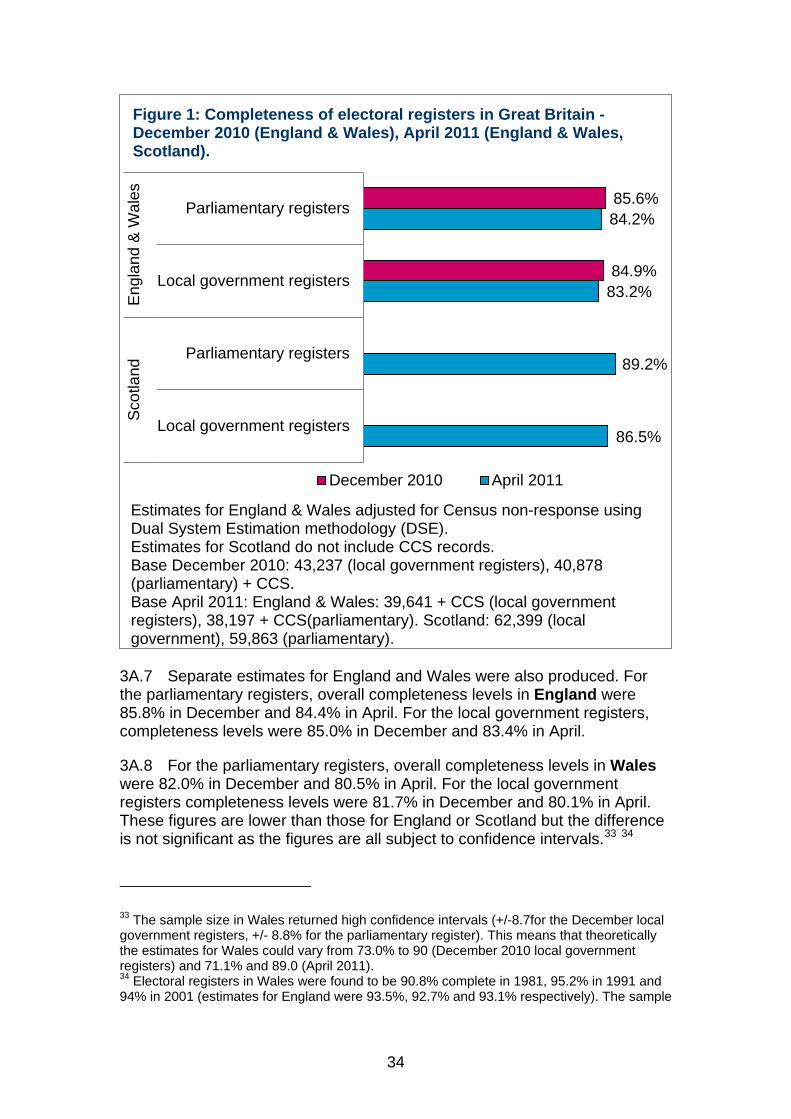
Separate estimates for England and Wales were also produced. For 3A.7the parliamentary registers, overall completeness levels in England were 85.8% in December and 84.4% in April. For the local government registers, completeness levels were 85.0% in December and 83.4% in April.
For the parliamentary registers, overall completeness levels in Wales 3A.8were 82.0% in December and 80.5% in April. For the local government registers completeness levels were 81.7% in December and 80.1% in April. These figures are lower than those for England or Scotland but the difference is not significant as the figures are all subject to confidence intervals.33 34
33 The sample size in Wales returned high confidence intervals (+/-8.7for the December local government registers, +/- 8.8% for the parliamentary register). This means that theoretically the estimates for Wales could vary from 73.0% to 90 (December 2010 local government registers) and 71.1% and 89.0 (April 2011). 34 Electoral registers in Wales were found to be 90.8% complete in 1981, 95.2% in 1991 and 94% in 2001 (estimates for England were 93.5%, 92.7% and 93.1% respectively). The sample
85.6%
84.9%
84.2%
83.2%
89.2%
86.5%
Parliamentary registers
Local government registers
Parliamentary registers
Local government registers
Engl
and
& W
ales
Scot
land
December 2010 April 2011
Estimates for England & Wales adjusted for Census non-response using Dual System Estimation methodology (DSE). Estimates for Scotland do not include CCS records. Base December 2010: 43,237 (local government registers), 40,878 (parliamentary) + CCS. Base April 2011: England & Wales: 39,641 + CCS (local government registers), 38,197 + CCS(parliamentary). Scotland: 62,399 (local government), 59,863 (parliamentary).
Figure 1: Completeness of electoral registers in Great Britain - December 2010 (England & Wales), April 2011 (England & Wales, Scotland).
35
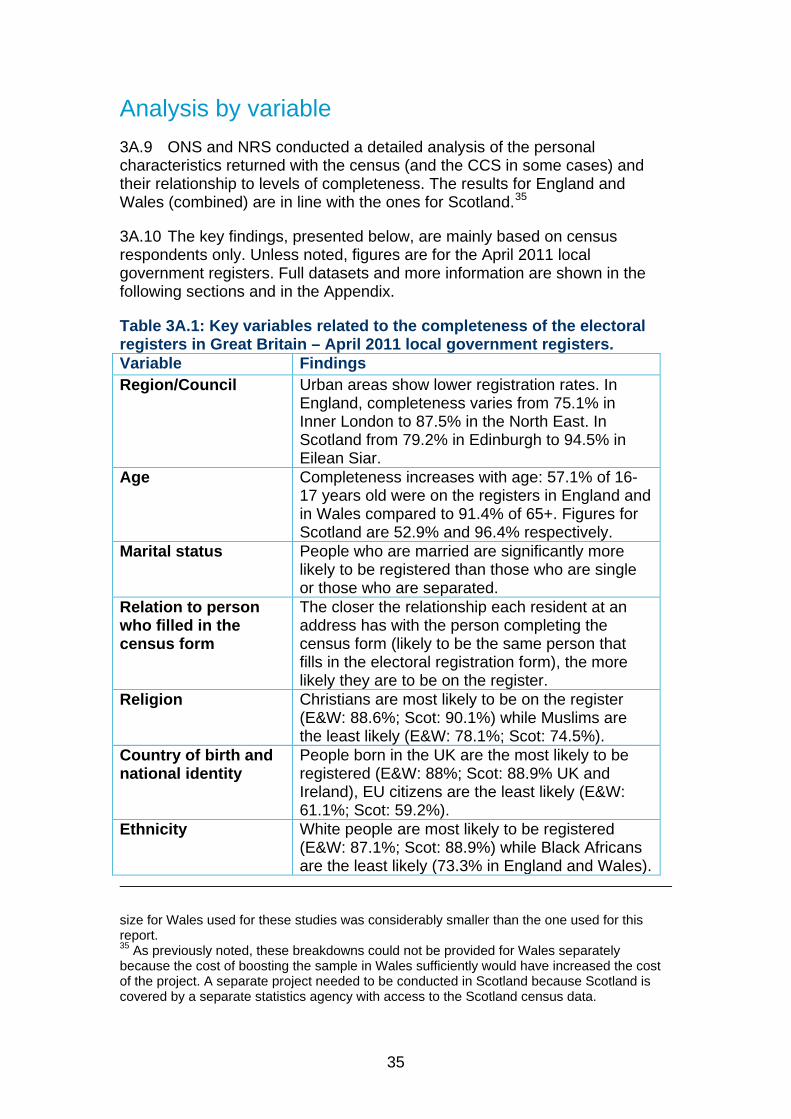
Analysis by variable ONS and NRS conducted a detailed analysis of the personal 3A.9
characteristics returned with the census (and the CCS in some cases) and their relationship to levels of completeness. The results for England and Wales (combined) are in line with the ones for Scotland.35
The key findings, presented below, are mainly based on census 3A.10respondents only. Unless noted, figures are for the April 2011 local government registers. Full datasets and more information are shown in the following sections and in the Appendix.
Table 3A.1: Key variables related to the completeness of the electoral registers in Great Britain – April 2011 local government registers. Variable Findings Region/Council Urban areas show lower registration rates. In
England, completeness varies from 75.1% in Inner London to 87.5% in the North East. In Scotland from 79.2% in Edinburgh to 94.5% in Eilean Siar.
Age Completeness increases with age: 57.1% of 16-17 years old were on the registers in England and in Wales compared to 91.4% of 65+. Figures for Scotland are 52.9% and 96.4% respectively.
Marital status People who are married are significantly more likely to be registered than those who are single or those who are separated.
Relation to person who filled in the census form
The closer the relationship each resident at an address has with the person completing the census form (likely to be the same person that fills in the electoral registration form), the more likely they are to be on the register.
Religion Christians are most likely to be on the register (E&W: 88.6%; Scot: 90.1%) while Muslims are the least likely (E&W: 78.1%; Scot: 74.5%).
Country of birth and national identity
People born in the UK are the most likely to be registered (E&W: 88%; Scot: 88.9% UK and Ireland), EU citizens are the least likely (E&W: 61.1%; Scot: 59.2%).
Ethnicity White people are most likely to be registered (E&W: 87.1%; Scot: 88.9%) while Black Africans are the least likely (73.3% in England and Wales).
size for Wales used for these studies was considerably smaller than the one used for this report. 35 As previously noted, these breakdowns could not be provided for Wales separately because the cost of boosting the sample in Wales sufficiently would have increased the cost of the project. A separate project needed to be conducted in Scotland because Scotland is covered by a separate statistics agency with access to the Scotland census data.
36
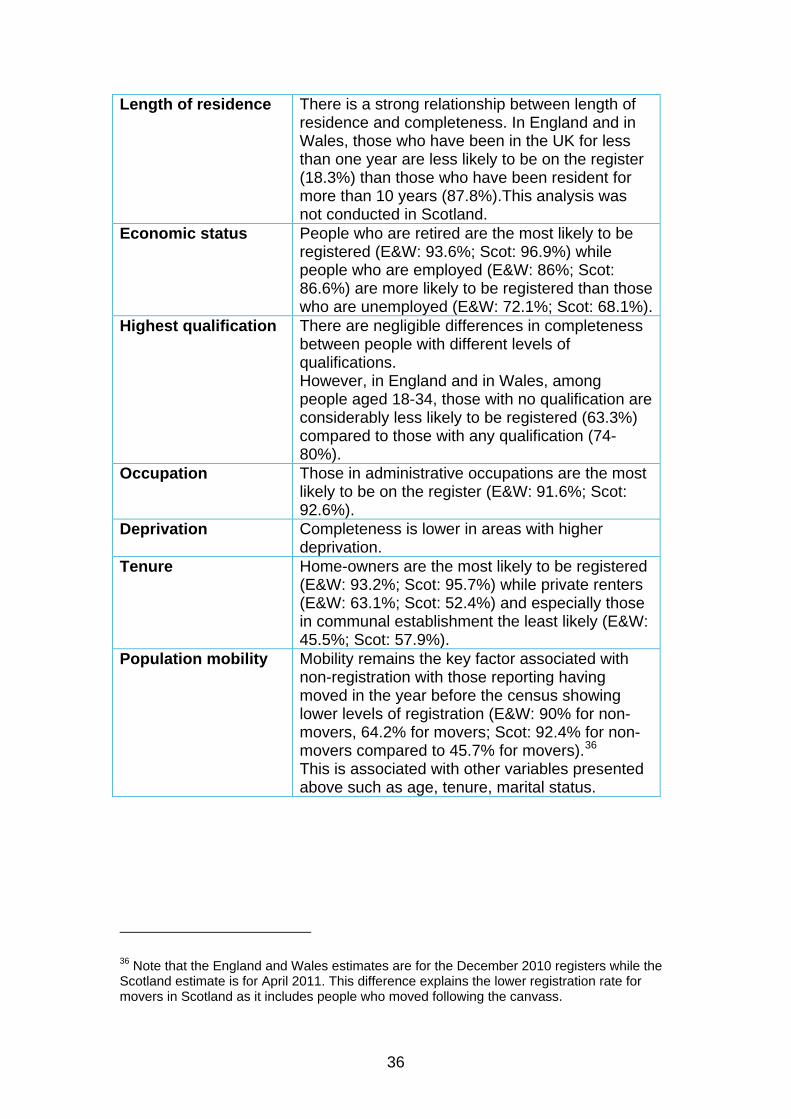
Length of residence There is a strong relationship between length of residence and completeness. In England and in Wales, those who have been in the UK for less than one year are less likely to be on the register (18.3%) than those who have been resident for more than 10 years (87.8%).This analysis was not conducted in Scotland.
Economic status People who are retired are the most likely to be registered (E&W: 93.6%; Scot: 96.9%) while people who are employed (E&W: 86%; Scot: 86.6%) are more likely to be registered than those who are unemployed (E&W: 72.1%; Scot: 68.1%).
Highest qualification There are negligible differences in completeness between people with different levels of qualifications. However, in England and in Wales, among people aged 18-34, those with no qualification are considerably less likely to be registered (63.3%) compared to those with any qualification (74-80%).
Occupation Those in administrative occupations are the most likely to be on the register (E&W: 91.6%; Scot: 92.6%).
Deprivation Completeness is lower in areas with higher deprivation.
Tenure Home-owners are the most likely to be registered (E&W: 93.2%; Scot: 95.7%) while private renters (E&W: 63.1%; Scot: 52.4%) and especially those in communal establishment the least likely (E&W: 45.5%; Scot: 57.9%).
Population mobility Mobility remains the key factor associated with non-registration with those reporting having moved in the year before the census showing lower levels of registration (E&W: 90% for non-movers, 64.2% for movers; Scot: 92.4% for non-movers compared to 45.7% for movers).36 This is associated with other variables presented above such as age, tenure, marital status.
36 Note that the England and Wales estimates are for the December 2010 registers while the Scotland estimate is for April 2011. This difference explains the lower registration rate for movers in Scotland as it includes people who moved following the canvass.
37
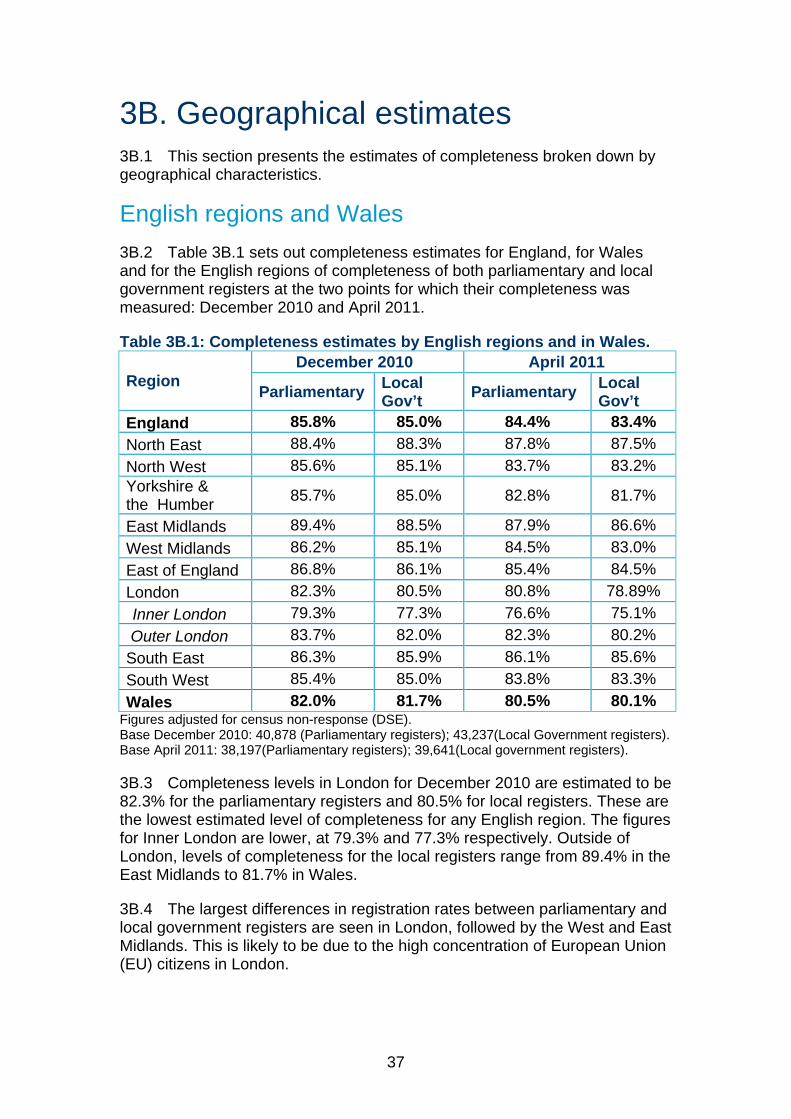
3B. Geographical estimates This section presents the estimates of completeness broken down by 3B.1
geographical characteristics.
English regions and Wales Table 3B.1 sets out completeness estimates for England, for Wales 3B.2
and for the English regions of completeness of both parliamentary and local government registers at the two points for which their completeness was measured: December 2010 and April 2011.
Table 3B.1: Completeness estimates by English regions and in Wales.
Region December 2010 April 2011
Parliamentary Local Gov’t Parliamentary Local
Gov’t England 85.8% 85.0% 84.4% 83.4% North East 88.4% 88.3% 87.8% 87.5% North West 85.6% 85.1% 83.7% 83.2% Yorkshire & the Humber 85.7% 85.0% 82.8% 81.7%
East Midlands 89.4% 88.5% 87.9% 86.6% West Midlands 86.2% 85.1% 84.5% 83.0% East of England 86.8% 86.1% 85.4% 84.5% London 82.3% 80.5% 80.8% 78.89% Inner London 79.3% 77.3% 76.6% 75.1% Outer London 83.7% 82.0% 82.3% 80.2%
South East 86.3% 85.9% 86.1% 85.6% South West 85.4% 85.0% 83.8% 83.3% Wales 82.0% 81.7% 80.5% 80.1%
Figures adjusted for census non-response (DSE). Base December 2010: 40,878 (Parliamentary registers); 43,237(Local Government registers). Base April 2011: 38,197(Parliamentary registers); 39,641(Local government registers).
Completeness levels in London for December 2010 are estimated to be 3B.382.3% for the parliamentary registers and 80.5% for local registers. These are the lowest estimated level of completeness for any English region. The figures for Inner London are lower, at 79.3% and 77.3% respectively. Outside of London, levels of completeness for the local registers range from 89.4% in the East Midlands to 81.7% in Wales.
The largest differences in registration rates between parliamentary and 3B.4local government registers are seen in London, followed by the West and East Midlands. This is likely to be due to the high concentration of European Union (EU) citizens in London.
38
The results for both the parliamentary and local government registers 3B.5show a drop between December 2010 and April 2011 of around 2% although there is some small regional variation.
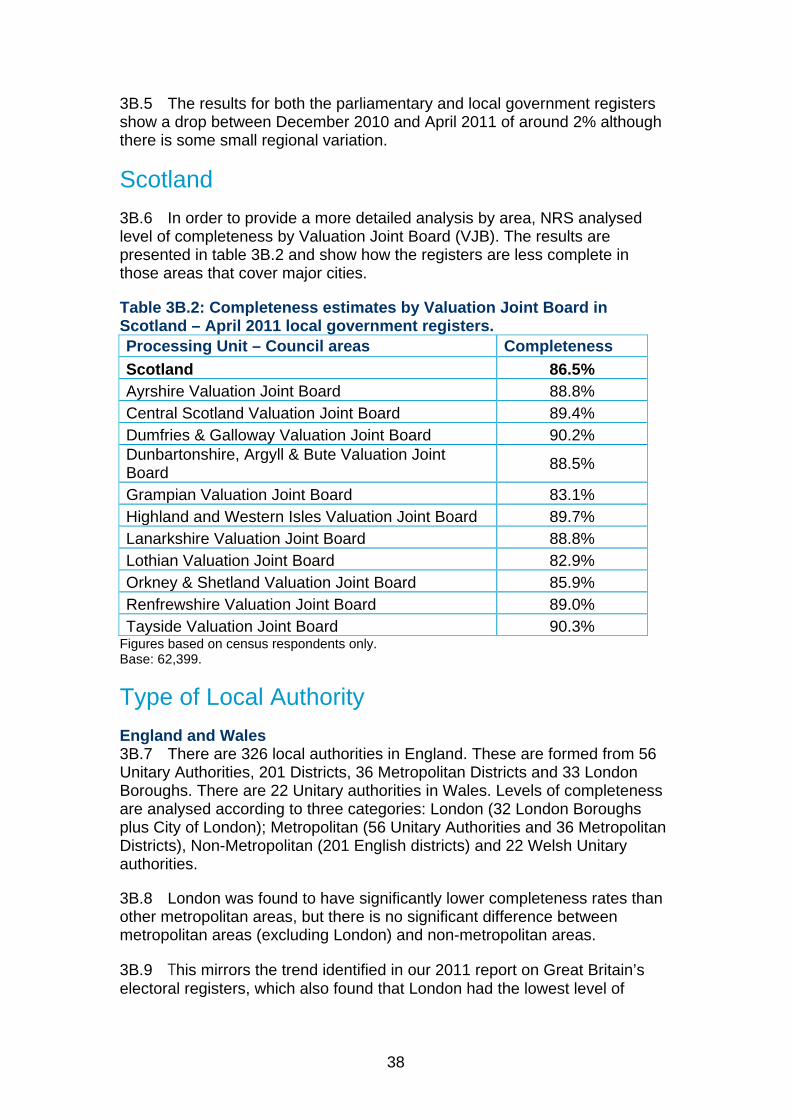
Scotland In order to provide a more detailed analysis by area, NRS analysed 3B.6
level of completeness by Valuation Joint Board (VJB). The results are presented in table 3B.2 and show how the registers are less complete in those areas that cover major cities.
Table 3B.2: Completeness estimates by Valuation Joint Board in Scotland – April 2011 local government registers. Processing Unit – Council areas Completeness Scotland 86.5% Ayrshire Valuation Joint Board 88.8% Central Scotland Valuation Joint Board 89.4% Dumfries & Galloway Valuation Joint Board 90.2% Dunbartonshire, Argyll & Bute Valuation Joint Board 88.5%
Grampian Valuation Joint Board 83.1% Highland and Western Isles Valuation Joint Board 89.7% Lanarkshire Valuation Joint Board 88.8% Lothian Valuation Joint Board 82.9% Orkney & Shetland Valuation Joint Board 85.9% Renfrewshire Valuation Joint Board 89.0% Tayside Valuation Joint Board 90.3%
Figures based on census respondents only. Base: 62,399.
Type of Local Authority England and Wales
There are 326 local authorities in England. These are formed from 56 3B.7Unitary Authorities, 201 Districts, 36 Metropolitan Districts and 33 London Boroughs. There are 22 Unitary authorities in Wales. Levels of completeness are analysed according to three categories: London (32 London Boroughs plus City of London); Metropolitan (56 Unitary Authorities and 36 Metropolitan Districts), Non-Metropolitan (201 English districts) and 22 Welsh Unitary authorities.
London was found to have significantly lower completeness rates than 3B.8other metropolitan areas, but there is no significant difference between metropolitan areas (excluding London) and non-metropolitan areas.
This mirrors the trend identified in our 2011 report on Great Britain’s 3B.9electoral registers, which also found that London had the lowest level of
39
completeness, but that there was no difference between metropolitan and non-metropolitan areas in England.37
Table 3B.3: Completeness estimates by local authority type in England and in Wales – December 2010 local government registers. Local authority type Completeness London Borough 84.0% Metropolitan 88.3% Non-Metropolitan 88.7% Welsh Unitary 87.0%
Figures based on census respondents only. Base: 42,237.
Scotland The sample size in Scotland also allows for estimates of completeness 3B.10
by local authority. Table 3B.4 below presents the rate for each of the 32 local authorities in Scotland.
There are considerable variations between different areas, ranging 3B.11from 94.5% in rural areas (Eilean Siar) to 79.2% in Edinburgh (figures for local government registers). These differences are likely to be primarily due to the demographic characteristics of the population of the areas. The variation is also in line with the findings of previous research by the Electoral Commission into eight local authority registers across Great Britain. That found levels of completeness that varied from 73% to 94% across the eight areas.
Table 3B.4: Completeness estimates by council in Scotland - April 2011 electoral registers.
Council Completeness
Parliamentary Local government
Scotland 89.2% 86.5% Aberdeen City 84.8% 80.9% Aberdeenshire 88.4% 84.3% Angus 92.2% 90.2% Argyll & Bute 89.3% 87.0% Clackmannanshire 90.6% 89.0% Dumfries & Galloway 91.2% 89.7% Dundee City 86.3% 84.4% East Ayrshire 88.3% 87.7% East Dunbartonshire 93.7% 92.2% East Lothian 88.4% 87.1% East Renfrewshire 96.0% 93.3%
37 The Electoral Commission, Great Britain’s electoral registers 2011 (December 2011).
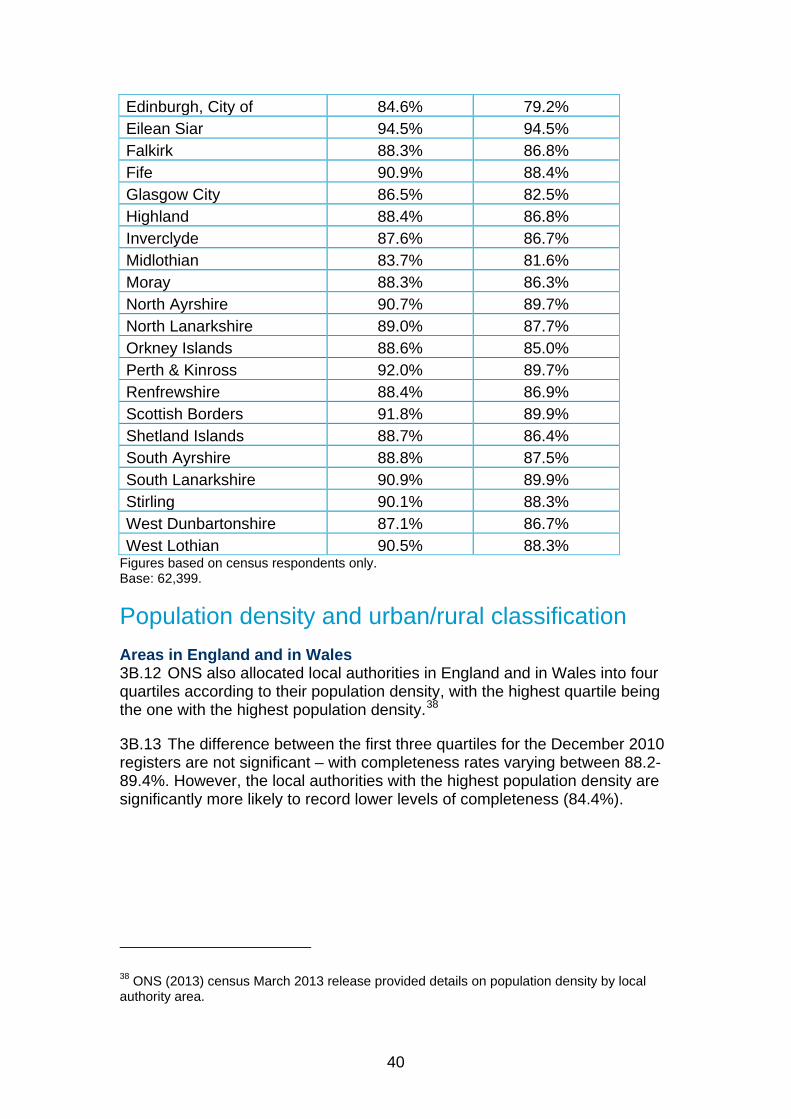
40
Edinburgh, City of 84.6% 79.2% Eilean Siar 94.5% 94.5% Falkirk 88.3% 86.8% Fife 90.9% 88.4% Glasgow City 86.5% 82.5% Highland 88.4% 86.8% Inverclyde 87.6% 86.7% Midlothian 83.7% 81.6% Moray 88.3% 86.3% North Ayrshire 90.7% 89.7% North Lanarkshire 89.0% 87.7% Orkney Islands 88.6% 85.0% Perth & Kinross 92.0% 89.7% Renfrewshire 88.4% 86.9% Scottish Borders 91.8% 89.9% Shetland Islands 88.7% 86.4% South Ayrshire 88.8% 87.5% South Lanarkshire 90.9% 89.9% Stirling 90.1% 88.3% West Dunbartonshire 87.1% 86.7% West Lothian 90.5% 88.3%
Figures based on census respondents only. Base: 62,399.
Population density and urban/rural classification Areas in England and in Wales
ONS also allocated local authorities in England and in Wales into four 3B.12quartiles according to their population density, with the highest quartile being the one with the highest population density.38
The difference between the first three quartiles for the December 2010 3B.13registers are not significant – with completeness rates varying between 88.2-89.4%. However, the local authorities with the highest population density are significantly more likely to record lower levels of completeness (84.4%).
38 ONS (2013) census March 2013 release provided details on population density by local authority area.
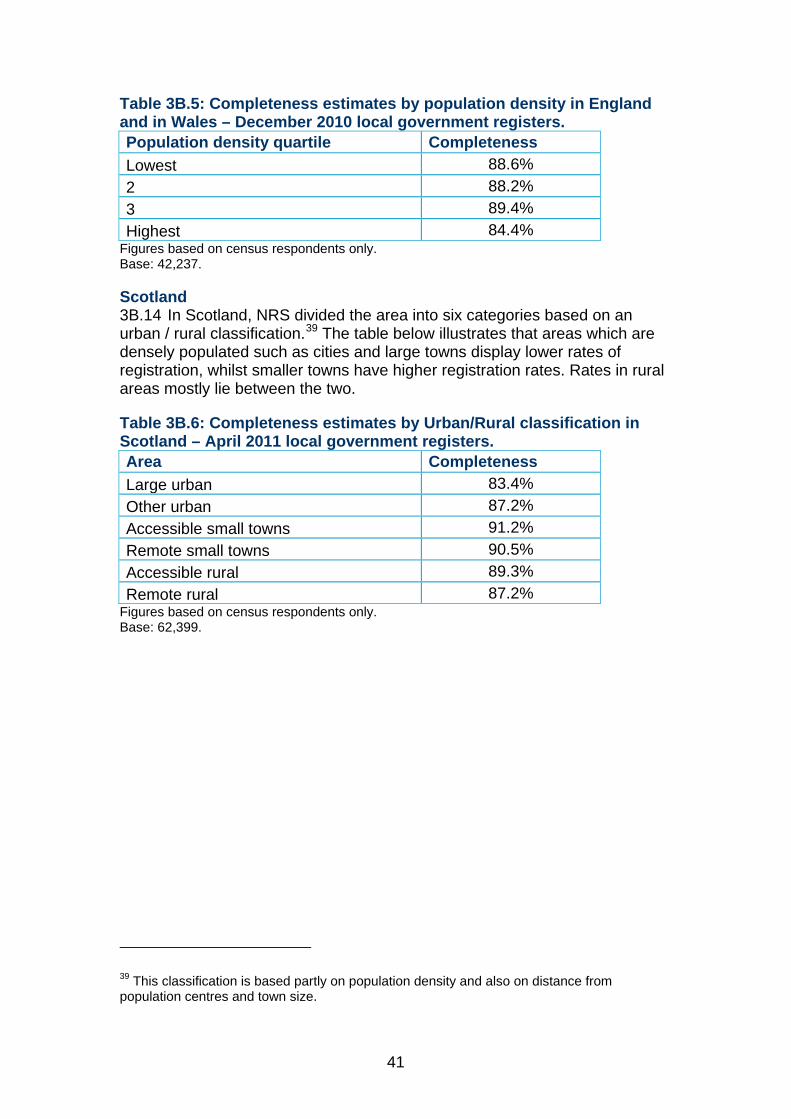
41
Table 3B.5: Completeness estimates by population density in England and in Wales – December 2010 local government registers. Population density quartile Completeness Lowest 88.6% 2 88.2% 3 89.4% Highest 84.4%
Figures based on census respondents only. Base: 42,237.
Scotland In Scotland, NRS divided the area into six categories based on an 3B.14
urban / rural classification.39 The table below illustrates that areas which are densely populated such as cities and large towns display lower rates of registration, whilst smaller towns have higher registration rates. Rates in rural areas mostly lie between the two.
Table 3B.6: Completeness estimates by Urban/Rural classification in Scotland – April 2011 local government registers. Area Completeness Large urban 83.4% Other urban 87.2% Accessible small towns 91.2% Remote small towns 90.5% Accessible rural 89.3% Remote rural 87.2%
Figures based on census respondents only. Base: 62,399.
39 This classification is based partly on population density and also on distance from population centres and town size.
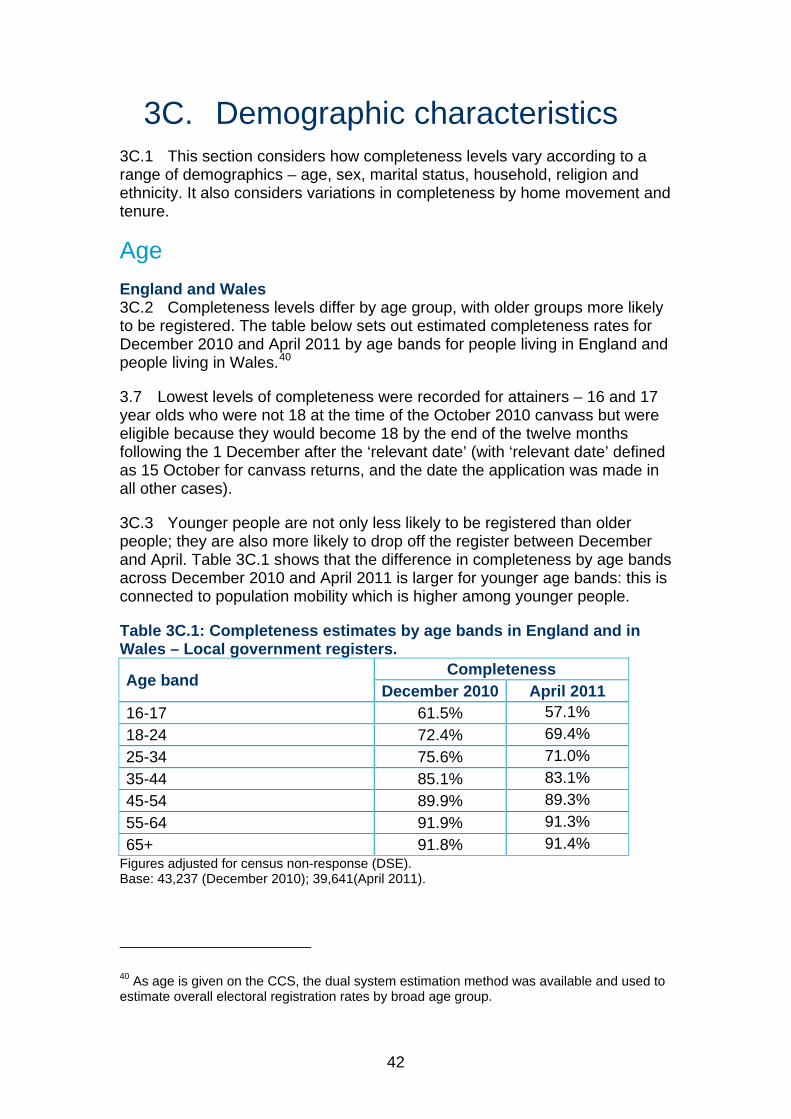
42
3C. Demographic characteristics This section considers how completeness levels vary according to a 3C.1
range of demographics – age, sex, marital status, household, religion and ethnicity. It also considers variations in completeness by home movement and tenure.
Age England and Wales
Completeness levels differ by age group, with older groups more likely 3C.2to be registered. The table below sets out estimated completeness rates for December 2010 and April 2011 by age bands for people living in England and people living in Wales.40
Lowest levels of completeness were recorded for attainers – 16 and 17 3.7year olds who were not 18 at the time of the October 2010 canvass but were eligible because they would become 18 by the end of the twelve months following the 1 December after the ‘relevant date’ (with ‘relevant date’ defined as 15 October for canvass returns, and the date the application was made in all other cases).
Younger people are not only less likely to be registered than older 3C.3people; they are also more likely to drop off the register between December and April. Table 3C.1 shows that the difference in completeness by age bands across December 2010 and April 2011 is larger for younger age bands: this is connected to population mobility which is higher among younger people.
Table 3C.1: Completeness estimates by age bands in England and in Wales – Local government registers.
Age band Completeness December 2010 April 2011
16-17 61.5% 57.1% 18-24 72.4% 69.4% 25-34 75.6% 71.0% 35-44 85.1% 83.1% 45-54 89.9% 89.3% 55-64 91.9% 91.3% 65+ 91.8% 91.4%
Figures adjusted for census non-response (DSE). Base: 43,237 (December 2010); 39,641(April 2011).
40 As age is given on the CCS, the dual system estimation method was available and used to estimate overall electoral registration rates by broad age group.
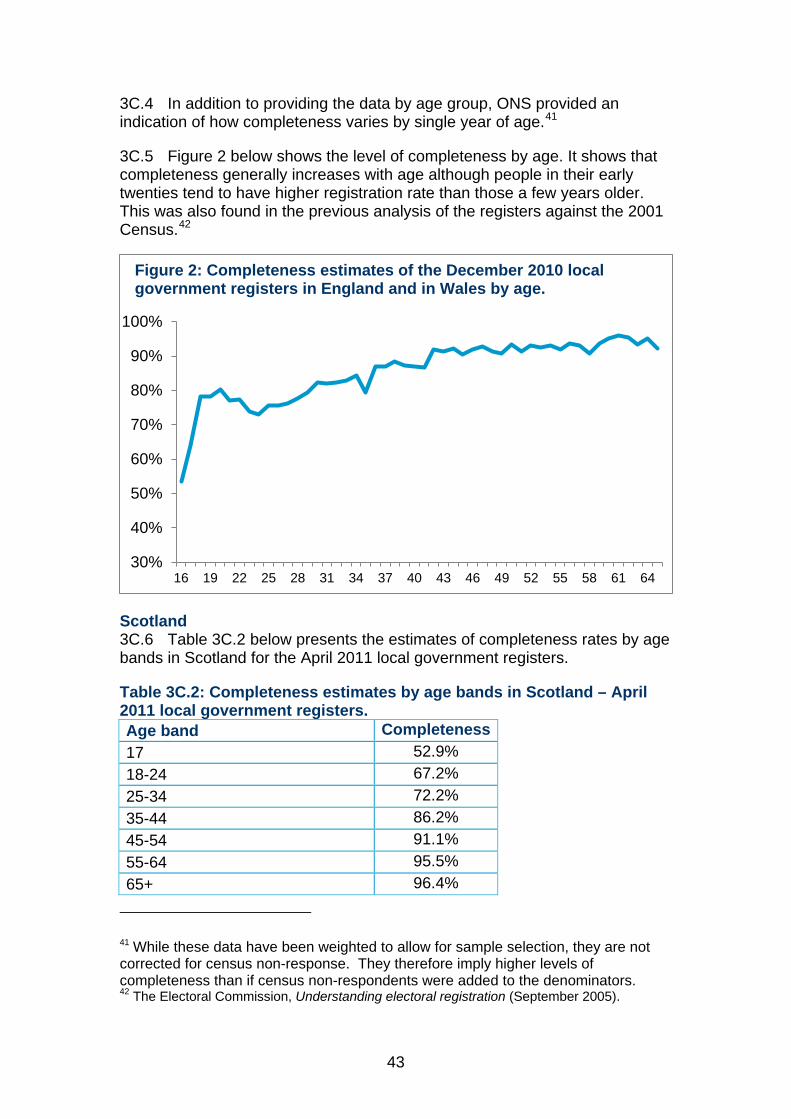
43
In addition to providing the data by age group, ONS provided an 3C.4indication of how completeness varies by single year of age.41
Figure 2 below shows the level of completeness by age. It shows that 3C.5completeness generally increases with age although people in their early twenties tend to have higher registration rate than those a few years older. This was also found in the previous analysis of the registers against the 2001 Census.42
Scotland Table 3C.2 below presents the estimates of completeness rates by age 3C.6
bands in Scotland for the April 2011 local government registers.
Table 3C.2: Completeness estimates by age bands in Scotland – April 2011 local government registers. Age band Completeness 17 52.9% 18-24 67.2% 25-34 72.2% 35-44 86.2% 45-54 91.1% 55-64 95.5% 65+ 96.4%
41 While these data have been weighted to allow for sample selection, they are not corrected for census non-response. They therefore imply higher levels of completeness than if census non-respondents were added to the denominators. 42 The Electoral Commission, Understanding electoral registration (September 2005).
30%
40%
50%
60%
70%
80%
90%
100%
16 19 22 25 28 31 34 37 40 43 46 49 52 55 58 61 64
Figure 2: Completeness estimates of the December 2010 local government registers in England and in Wales by age.
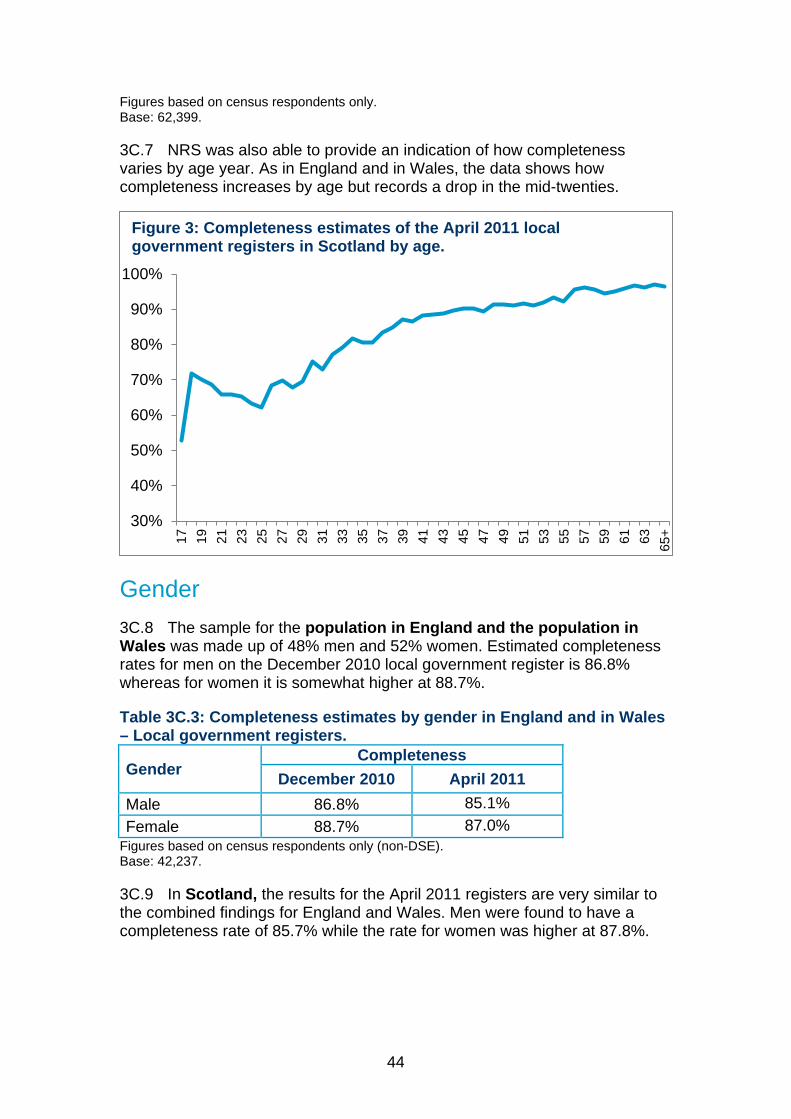
44
Figures based on census respondents only. Base: 62,399.
NRS was also able to provide an indication of how completeness 3C.7varies by age year. As in England and in Wales, the data shows how completeness increases by age but records a drop in the mid-twenties.
Gender The sample for the population in England and the population in 3C.8
Wales was made up of 48% men and 52% women. Estimated completeness rates for men on the December 2010 local government register is 86.8% whereas for women it is somewhat higher at 88.7%.
Table 3C.3: Completeness estimates by gender in England and in Wales – Local government registers.
Gender Completeness
December 2010 April 2011 Male 86.8% 85.1% Female 88.7% 87.0%
Figures based on census respondents only (non-DSE). Base: 42,237.
In Scotland, the results for the April 2011 registers are very similar to 3C.9the combined findings for England and Wales. Men were found to have a completeness rate of 85.7% while the rate for women was higher at 87.8%.
30%
40%
50%
60%
70%
80%
90%
100%
17 19 21 23 25 27 29 31 33 35 37 39 41 43 45 47 49 51 53 55 57 59 61 63 65+
Figure 3: Completeness estimates of the April 2011 local government registers in Scotland by age.
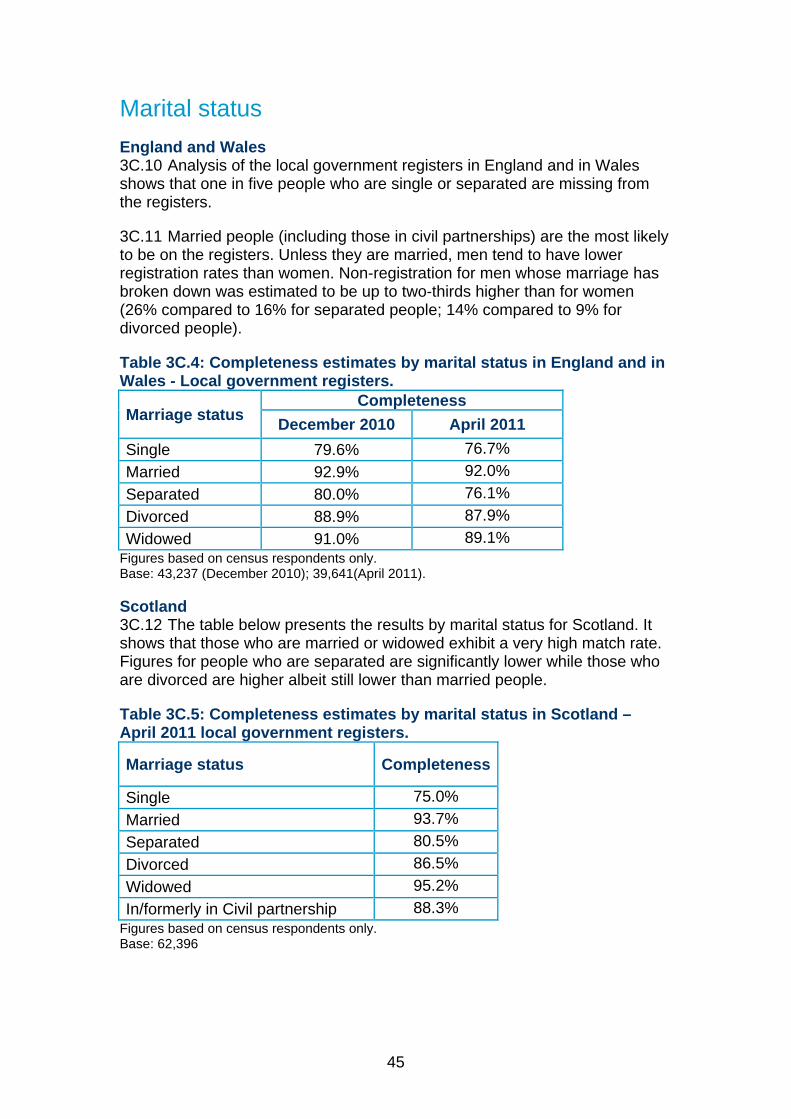
45
Marital status England and Wales
Analysis of the local government registers in England and in Wales 3C.10shows that one in five people who are single or separated are missing from the registers.
Married people (including those in civil partnerships) are the most likely 3C.11to be on the registers. Unless they are married, men tend to have lower registration rates than women. Non-registration for men whose marriage has broken down was estimated to be up to two-thirds higher than for women (26% compared to 16% for separated people; 14% compared to 9% for divorced people).
Table 3C.4: Completeness estimates by marital status in England and in Wales - Local government registers.
Marriage status Completeness
December 2010 April 2011 Single 79.6% 76.7% Married 92.9% 92.0% Separated 80.0% 76.1% Divorced 88.9% 87.9% Widowed 91.0% 89.1%
Figures based on census respondents only. Base: 43,237 (December 2010); 39,641(April 2011).
Scotland The table below presents the results by marital status for Scotland. It 3C.12
shows that those who are married or widowed exhibit a very high match rate. Figures for people who are separated are significantly lower while those who are divorced are higher albeit still lower than married people.
Table 3C.5: Completeness estimates by marital status in Scotland – April 2011 local government registers.
Marriage status Completeness
Single 75.0% Married 93.7% Separated 80.5% Divorced 86.5% Widowed 95.2% In/formerly in Civil partnership 88.3%
Figures based on census respondents only. Base: 62,396
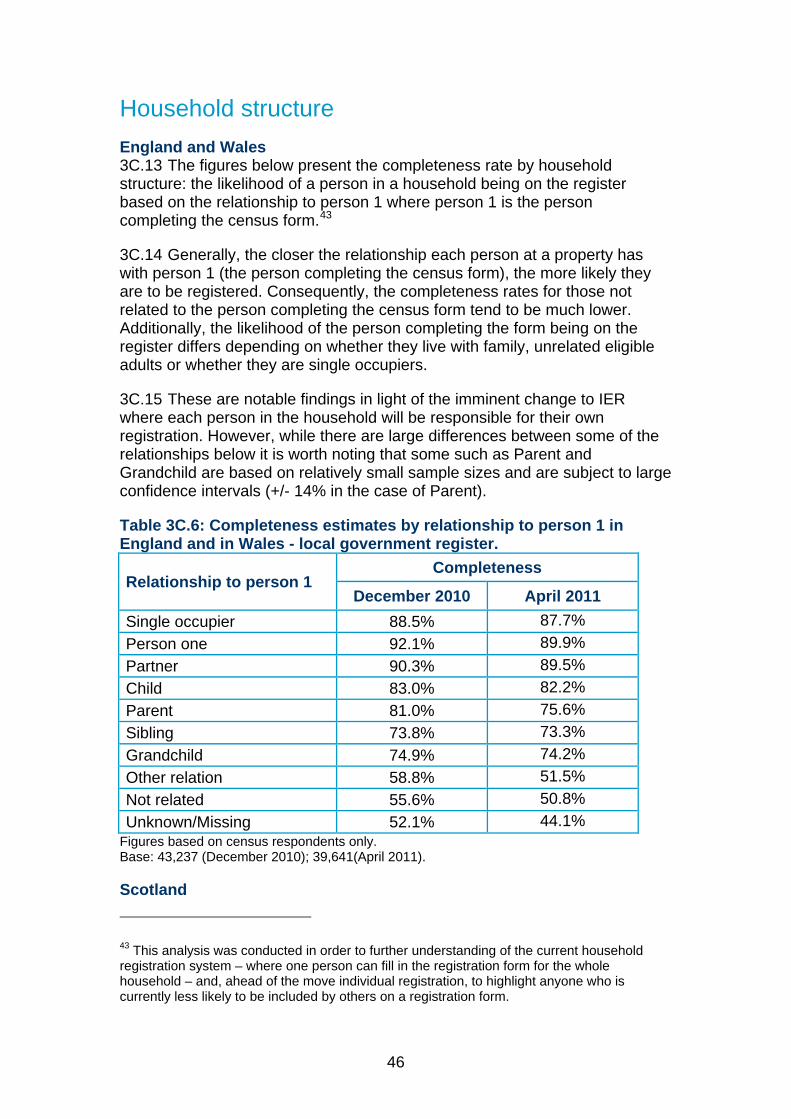
46
Household structure England and Wales
The figures below present the completeness rate by household 3C.13structure: the likelihood of a person in a household being on the register based on the relationship to person 1 where person 1 is the person completing the census form.43
Generally, the closer the relationship each person at a property has 3C.14with person 1 (the person completing the census form), the more likely they are to be registered. Consequently, the completeness rates for those not related to the person completing the census form tend to be much lower. Additionally, the likelihood of the person completing the form being on the register differs depending on whether they live with family, unrelated eligible adults or whether they are single occupiers.
These are notable findings in light of the imminent change to IER 3C.15where each person in the household will be responsible for their own registration. However, while there are large differences between some of the relationships below it is worth noting that some such as Parent and Grandchild are based on relatively small sample sizes and are subject to large confidence intervals (+/- 14% in the case of Parent).
Table 3C.6: Completeness estimates by relationship to person 1 in England and in Wales - local government register.
Relationship to person 1 Completeness
December 2010 April 2011 Single occupier 88.5% 87.7% Person one 92.1% 89.9% Partner 90.3% 89.5% Child 83.0% 82.2% Parent 81.0% 75.6% Sibling 73.8% 73.3% Grandchild 74.9% 74.2% Other relation 58.8% 51.5% Not related 55.6% 50.8% Unknown/Missing 52.1% 44.1%
Figures based on census respondents only. Base: 43,237 (December 2010); 39,641(April 2011).
Scotland 43 This analysis was conducted in order to further understanding of the current household registration system – where one person can fill in the registration form for the whole household – and, ahead of the move individual registration, to highlight anyone who is currently less likely to be included by others on a registration form.
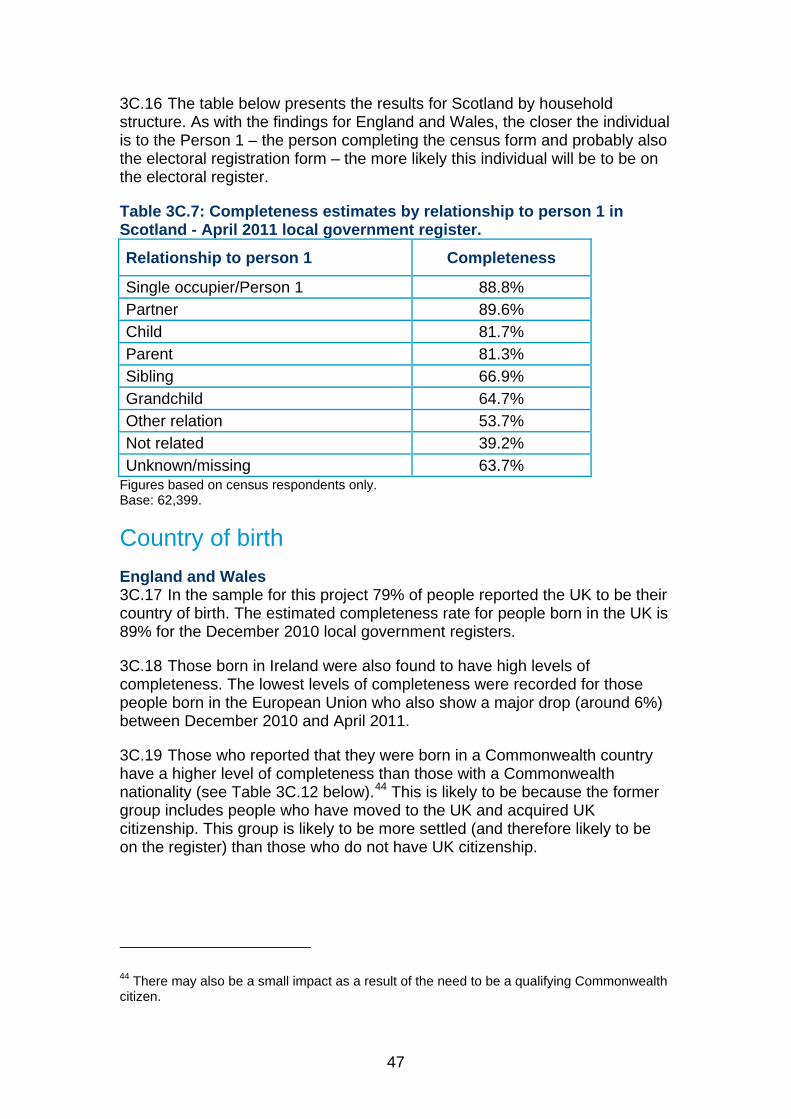
47
The table below presents the results for Scotland by household 3C.16structure. As with the findings for England and Wales, the closer the individual is to the Person 1 – the person completing the census form and probably also the electoral registration form – the more likely this individual will be to be on the electoral register.
Table 3C.7: Completeness estimates by relationship to person 1 in Scotland - April 2011 local government register.
Relationship to person 1 Completeness
Single occupier/Person 1 88.8% Partner 89.6% Child 81.7% Parent 81.3% Sibling 66.9% Grandchild 64.7% Other relation 53.7% Not related 39.2% Unknown/missing 63.7%
Figures based on census respondents only. Base: 62,399.
Country of birth England and Wales
In the sample for this project 79% of people reported the UK to be their 3C.17country of birth. The estimated completeness rate for people born in the UK is 89% for the December 2010 local government registers.
Those born in Ireland were also found to have high levels of 3C.18completeness. The lowest levels of completeness were recorded for those people born in the European Union who also show a major drop (around 6%) between December 2010 and April 2011.
Those who reported that they were born in a Commonwealth country 3C.19have a higher level of completeness than those with a Commonwealth nationality (see Table 3C.12 below).44 This is likely to be because the former group includes people who have moved to the UK and acquired UK citizenship. This group is likely to be more settled (and therefore likely to be on the register) than those who do not have UK citizenship.
44 There may also be a small impact as a result of the need to be a qualifying Commonwealth citizen.
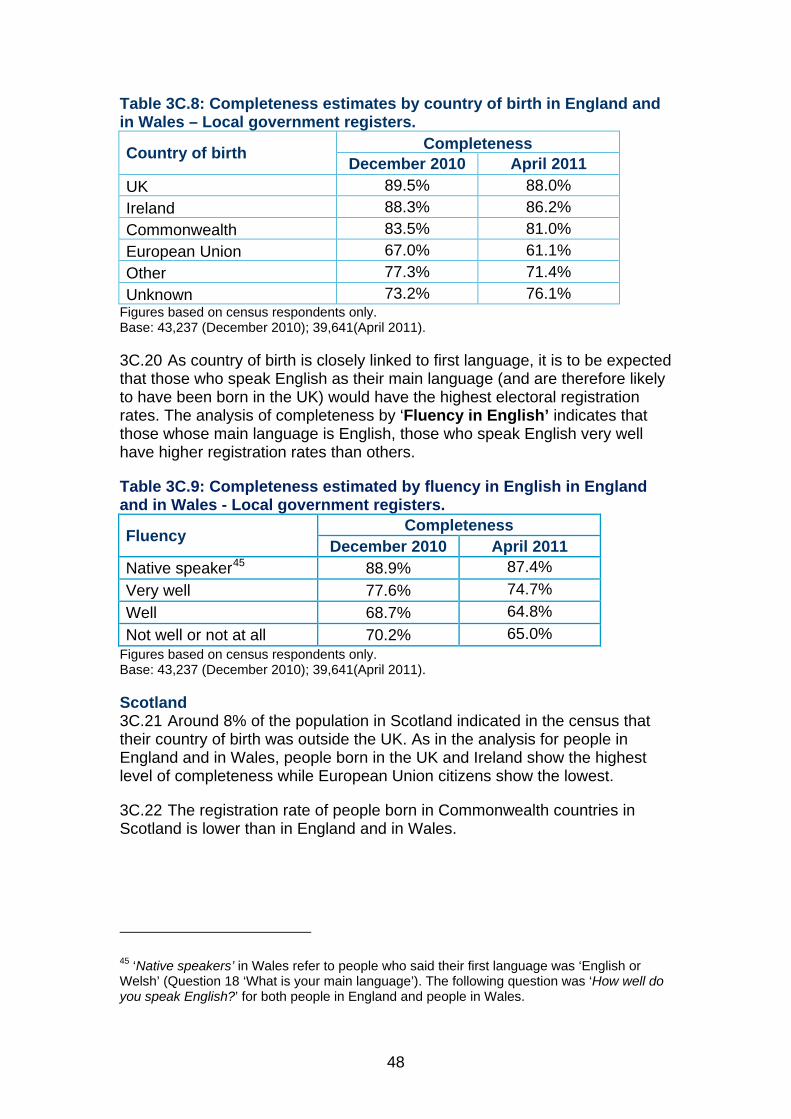
48
Table 3C.8: Completeness estimates by country of birth in England and in Wales – Local government registers.
Country of birth Completeness December 2010 April 2011
UK 89.5% 88.0% Ireland 88.3% 86.2% Commonwealth 83.5% 81.0% European Union 67.0% 61.1% Other 77.3% 71.4% Unknown 73.2% 76.1%
Figures based on census respondents only. Base: 43,237 (December 2010); 39,641(April 2011).
As country of birth is closely linked to first language, it is to be expected 3C.20that those who speak English as their main language (and are therefore likely to have been born in the UK) would have the highest electoral registration rates. The analysis of completeness by ‘Fluency in English’ indicates that those whose main language is English, those who speak English very well have higher registration rates than others.
Table 3C.9: Completeness estimated by fluency in English in England and in Wales - Local government registers.
Fluency Completeness December 2010 April 2011
Native speaker45 88.9% 87.4% Very well 77.6% 74.7% Well 68.7% 64.8% Not well or not at all 70.2% 65.0%
Figures based on census respondents only. Base: 43,237 (December 2010); 39,641(April 2011).
Scotland Around 8% of the population in Scotland indicated in the census that 3C.21
their country of birth was outside the UK. As in the analysis for people in England and in Wales, people born in the UK and Ireland show the highest level of completeness while European Union citizens show the lowest.
The registration rate of people born in Commonwealth countries in 3C.22Scotland is lower than in England and in Wales.
45 ‘Native speakers’ in Wales refer to people who said their first language was ‘English or Welsh’ (Question 18 ‘What is your main language’). The following question was ‘How well do you speak English?’ for both people in England and people in Wales.
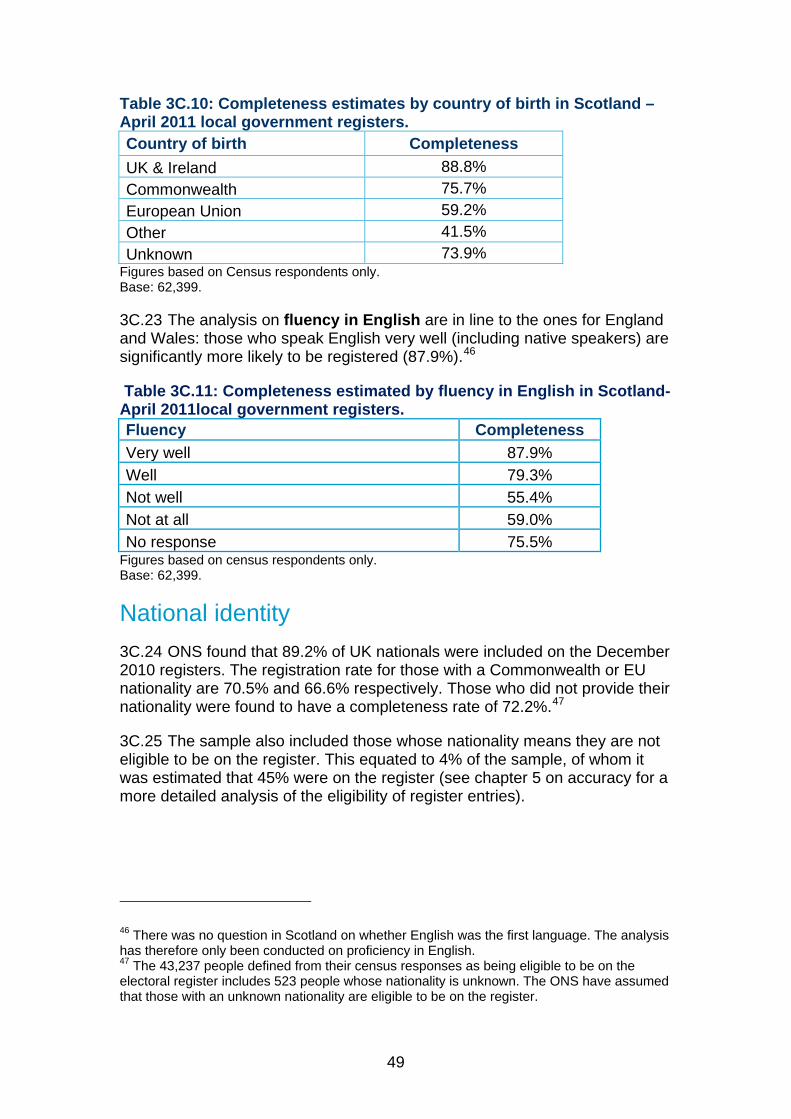
49
Table 3C.10: Completeness estimates by country of birth in Scotland – April 2011 local government registers. Country of birth Completeness UK & Ireland 88.8% Commonwealth 75.7% European Union 59.2% Other 41.5% Unknown 73.9%
Figures based on Census respondents only. Base: 62,399.
The analysis on fluency in English are in line to the ones for England 3C.23and Wales: those who speak English very well (including native speakers) are significantly more likely to be registered (87.9%).46
Table 3C.11: Completeness estimated by fluency in English in Scotland- April 2011local government registers. Fluency Completeness Very well 87.9% Well 79.3% Not well 55.4% Not at all 59.0% No response 75.5%
Figures based on census respondents only. Base: 62,399.
National identity ONS found that 89.2% of UK nationals were included on the December 3C.24
2010 registers. The registration rate for those with a Commonwealth or EU nationality are 70.5% and 66.6% respectively. Those who did not provide their nationality were found to have a completeness rate of 72.2%.47
The sample also included those whose nationality means they are not 3C.25eligible to be on the register. This equated to 4% of the sample, of whom it was estimated that 45% were on the register (see chapter 5 on accuracy for a more detailed analysis of the eligibility of register entries).
46 There was no question in Scotland on whether English was the first language. The analysis has therefore only been conducted on proficiency in English. 47 The 43,237 people defined from their census responses as being eligible to be on the electoral register includes 523 people whose nationality is unknown. The ONS have assumed that those with an unknown nationality are eligible to be on the register.
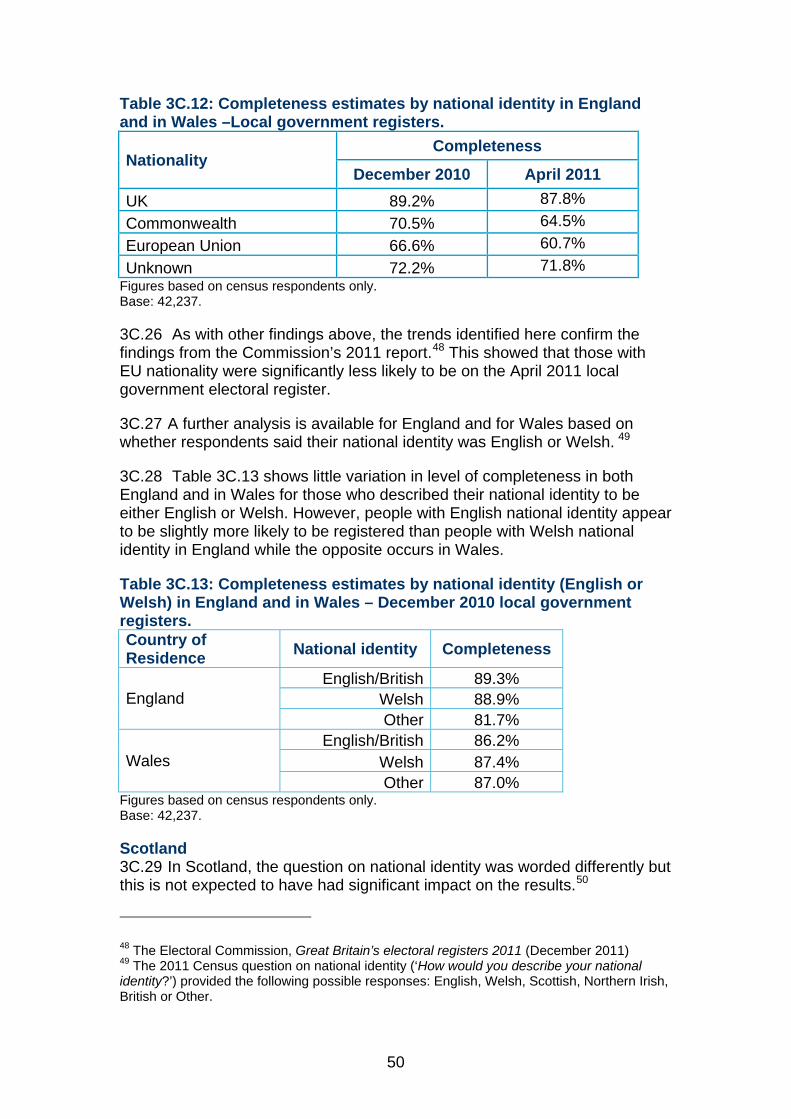
50
Table 3C.12: Completeness estimates by national identity in England and in Wales –Local government registers.
Nationality Completeness
December 2010 April 2011 UK 89.2% 87.8% Commonwealth 70.5% 64.5% European Union 66.6% 60.7% Unknown 72.2% 71.8%
Figures based on census respondents only. Base: 42,237.
As with other findings above, the trends identified here confirm the 3C.26findings from the Commission’s 2011 report.48 This showed that those with EU nationality were significantly less likely to be on the April 2011 local government electoral register.
A further analysis is available for England and for Wales based on 3C.27whether respondents said their national identity was English or Welsh. 49
Table 3C.13 shows little variation in level of completeness in both 3C.28England and in Wales for those who described their national identity to be either English or Welsh. However, people with English national identity appear to be slightly more likely to be registered than people with Welsh national identity in England while the opposite occurs in Wales.
Table 3C.13: Completeness estimates by national identity (English or Welsh) in England and in Wales – December 2010 local government registers. Country of Residence National identity Completeness
England English/British 89.3%
Welsh 88.9% Other 81.7%
Wales English/British 86.2%
Welsh 87.4% Other 87.0%
Figures based on census respondents only. Base: 42,237.
Scotland In Scotland, the question on national identity was worded differently but 3C.29
this is not expected to have had significant impact on the results.50
48 The Electoral Commission, Great Britain’s electoral registers 2011 (December 2011) 49 The 2011 Census question on national identity (‘How would you describe your national identity?’) provided the following possible responses: English, Welsh, Scottish, Northern Irish, British or Other.

51
NRS used the standard classification for analysis of the national 3C.30identity variable which has been used in census publications to present the results from the analysis. A breakdown of the ‘Other’ category between EU and Commonwealth citizens was not possible.
Table 3C.14: Completeness estimates by national identity in Scotland – April 2011 local government registers. Nationality Completeness Scottish only 87.8% Scottish and British 92.4% British only 89.0% English only 85.5% Other combinations of UK 87.1% Other identity 52.8%
Figures based on census respondents only. Base: 62,399.
Ethnicity England and Wales
Just over four-fifths (81%) of the England and Wales sample gave their 3C.31ethnicity as White. This group had the highest completeness rate, at just below 89% for the December 2010 registers. The next largest ethnic group was Asian, forming 10% of the sample. The majority of Asians are South Asians (largely from India, Pakistan and Bangladesh). Overall these groups behave very similarly to other Asians, with estimated completeness rates of approximately 82%.
However, among South Asian ethnicities, those who describe 3C.32themselves as Indian tend to be most likely to be registered (85.4%). With the exception of Black Caribbean, persons of Black ethnicity tend to have the lowest registration rates – although those who did not provide ethnicity information on the census form were the least likely to be registered.
Table 3C.15: Completeness estimates by ethnic group in England and in Wales – Local government registers.
Ethnicity Completeness December 2010 April 2011
White 88.8% 87.1% Mixed 79.3% 78.6% Indian 85.4% 83.3% Pakistani 80.5% 79.1%
50 The question on national identity in Scotland was: ‘What do you feel is your national identity?’.
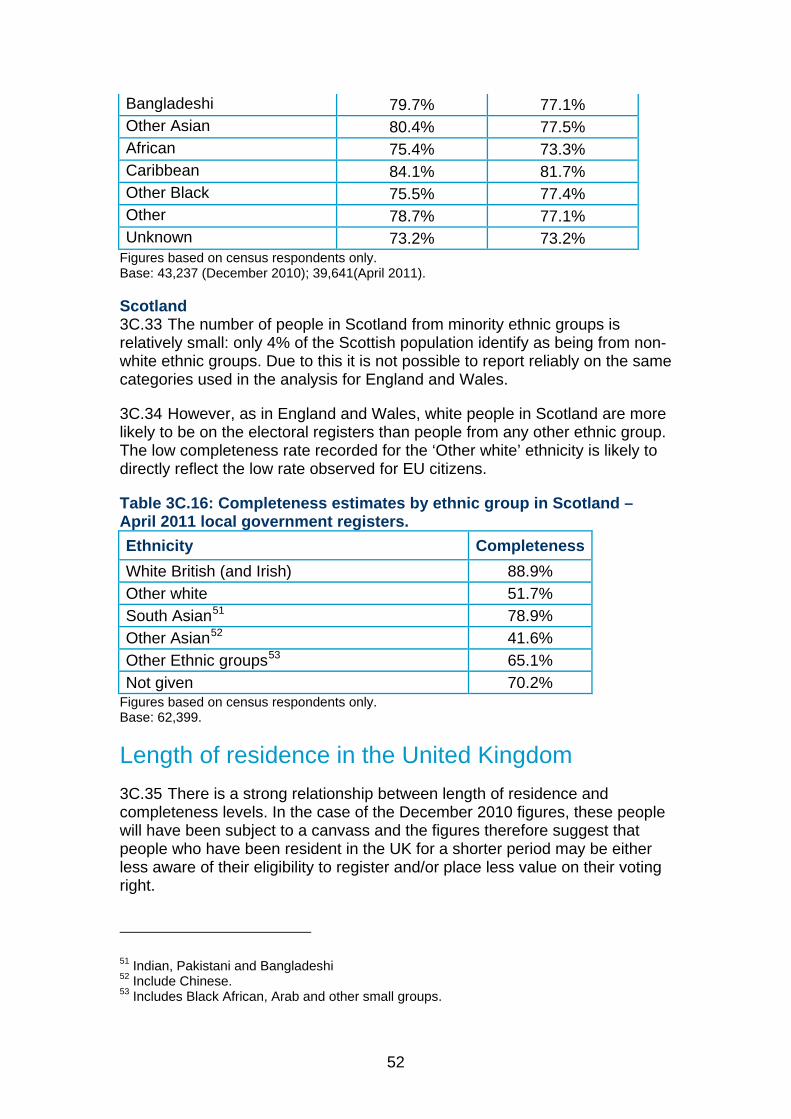
52
Bangladeshi 79.7% 77.1% Other Asian 80.4% 77.5% African 75.4% 73.3% Caribbean 84.1% 81.7% Other Black 75.5% 77.4% Other 78.7% 77.1% Unknown 73.2% 73.2%
Figures based on census respondents only. Base: 43,237 (December 2010); 39,641(April 2011).
Scotland The number of people in Scotland from minority ethnic groups is 3C.33
relatively small: only 4% of the Scottish population identify as being from non-white ethnic groups. Due to this it is not possible to report reliably on the same categories used in the analysis for England and Wales.
However, as in England and Wales, white people in Scotland are more 3C.34likely to be on the electoral registers than people from any other ethnic group. The low completeness rate recorded for the ‘Other white’ ethnicity is likely to directly reflect the low rate observed for EU citizens.
Table 3C.16: Completeness estimates by ethnic group in Scotland – April 2011 local government registers. Ethnicity Completeness White British (and Irish) 88.9% Other white 51.7% South Asian51 78.9% Other Asian52 41.6% Other Ethnic groups53 65.1% Not given 70.2%
Figures based on census respondents only. Base: 62,399.
Length of residence in the United Kingdom There is a strong relationship between length of residence and 3C.35
completeness levels. In the case of the December 2010 figures, these people will have been subject to a canvass and the figures therefore suggest that people who have been resident in the UK for a shorter period may be either less aware of their eligibility to register and/or place less value on their voting right.
51 Indian, Pakistani and Bangladeshi 52 Include Chinese. 53 Includes Black African, Arab and other small groups.
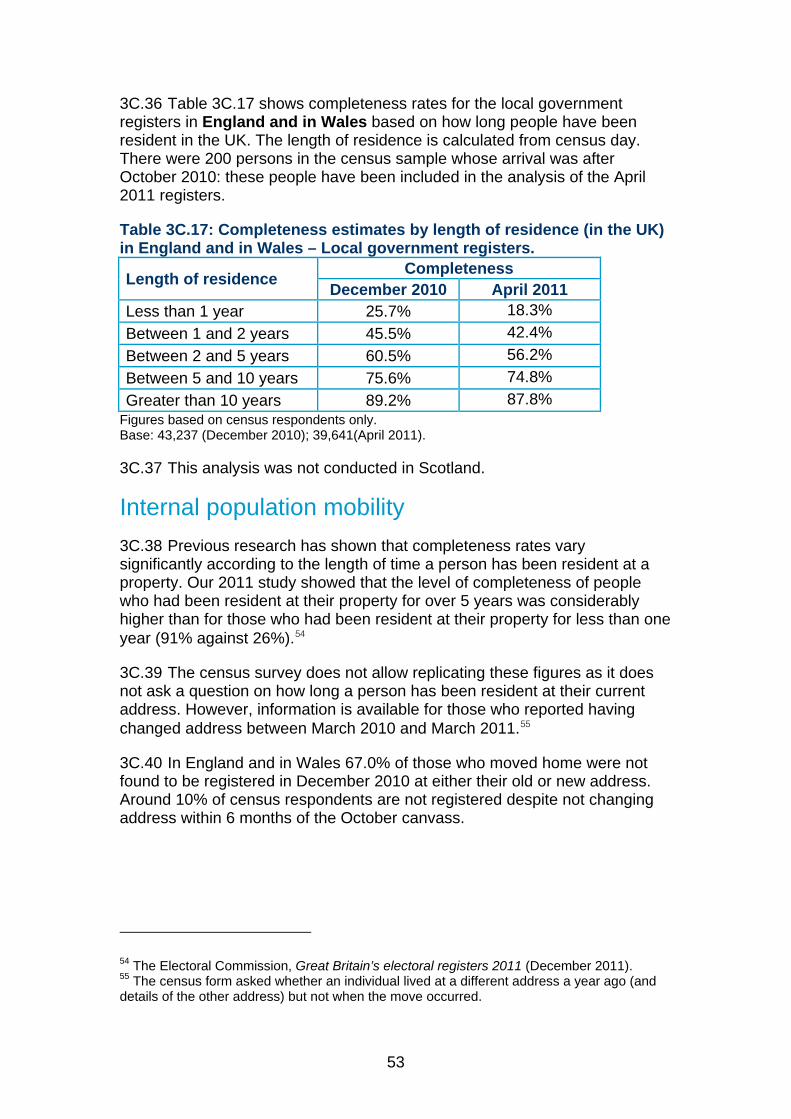
53
Table 3C.17 shows completeness rates for the local government 3C.36registers in England and in Wales based on how long people have been resident in the UK. The length of residence is calculated from census day. There were 200 persons in the census sample whose arrival was after October 2010: these people have been included in the analysis of the April 2011 registers.
Table 3C.17: Completeness estimates by length of residence (in the UK) in England and in Wales – Local government registers.
Length of residence Completeness December 2010 April 2011
Less than 1 year 25.7% 18.3% Between 1 and 2 years 45.5% 42.4% Between 2 and 5 years 60.5% 56.2% Between 5 and 10 years 75.6% 74.8% Greater than 10 years 89.2% 87.8%
Figures based on census respondents only. Base: 43,237 (December 2010); 39,641(April 2011).
This analysis was not conducted in Scotland. 3C.37
Internal population mobility Previous research has shown that completeness rates vary 3C.38
significantly according to the length of time a person has been resident at a property. Our 2011 study showed that the level of completeness of people who had been resident at their property for over 5 years was considerably higher than for those who had been resident at their property for less than one year (91% against 26%).54
The census survey does not allow replicating these figures as it does 3C.39not ask a question on how long a person has been resident at their current address. However, information is available for those who reported having changed address between March 2010 and March 2011.55
In England and in Wales 67.0% of those who moved home were not 3C.40found to be registered in December 2010 at either their old or new address. Around 10% of census respondents are not registered despite not changing address within 6 months of the October canvass.
54 The Electoral Commission, Great Britain’s electoral registers 2011 (December 2011). 55 The census form asked whether an individual lived at a different address a year ago (and details of the other address) but not when the move occurred.
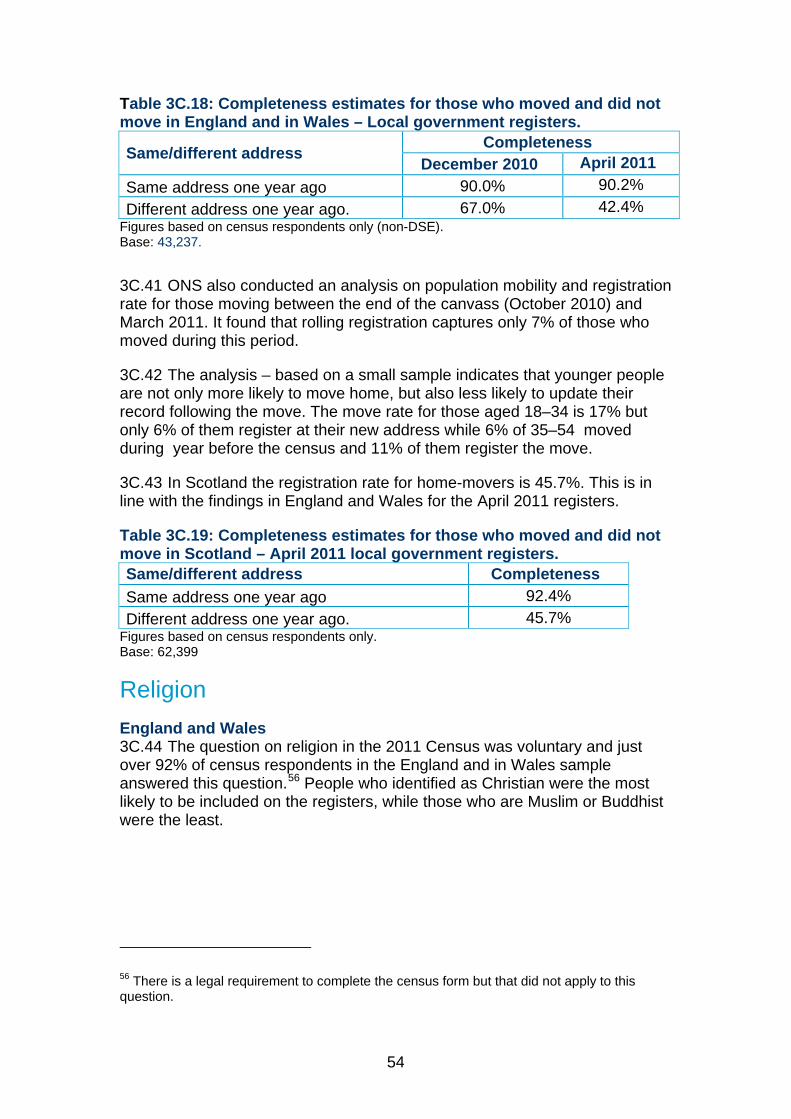
54
Table 3C.18: Completeness estimates for those who moved and did not move in England and in Wales – Local government registers.
Same/different address Completeness December 2010 April 2011
Same address one year ago 90.0% 90.2% Different address one year ago. 67.0% 42.4%
Figures based on census respondents only (non-DSE). Base: 43,237.
ONS also conducted an analysis on population mobility and registration 3C.41rate for those moving between the end of the canvass (October 2010) and March 2011. It found that rolling registration captures only 7% of those who moved during this period.
The analysis – based on a small sample indicates that younger people 3C.42are not only more likely to move home, but also less likely to update their record following the move. The move rate for those aged 18–34 is 17% but only 6% of them register at their new address while 6% of 35–54 moved during year before the census and 11% of them register the move.
In Scotland the registration rate for home-movers is 45.7%. This is in 3C.43line with the findings in England and Wales for the April 2011 registers.
Table 3C.19: Completeness estimates for those who moved and did not move in Scotland – April 2011 local government registers. Same/different address Completeness Same address one year ago 92.4% Different address one year ago. 45.7%
Figures based on census respondents only. Base: 62,399
Religion England and Wales
The question on religion in the 2011 Census was voluntary and just 3C.44over 92% of census respondents in the England and in Wales sample answered this question.56 People who identified as Christian were the most likely to be included on the registers, while those who are Muslim or Buddhist were the least.
56 There is a legal requirement to complete the census form but that did not apply to this question.
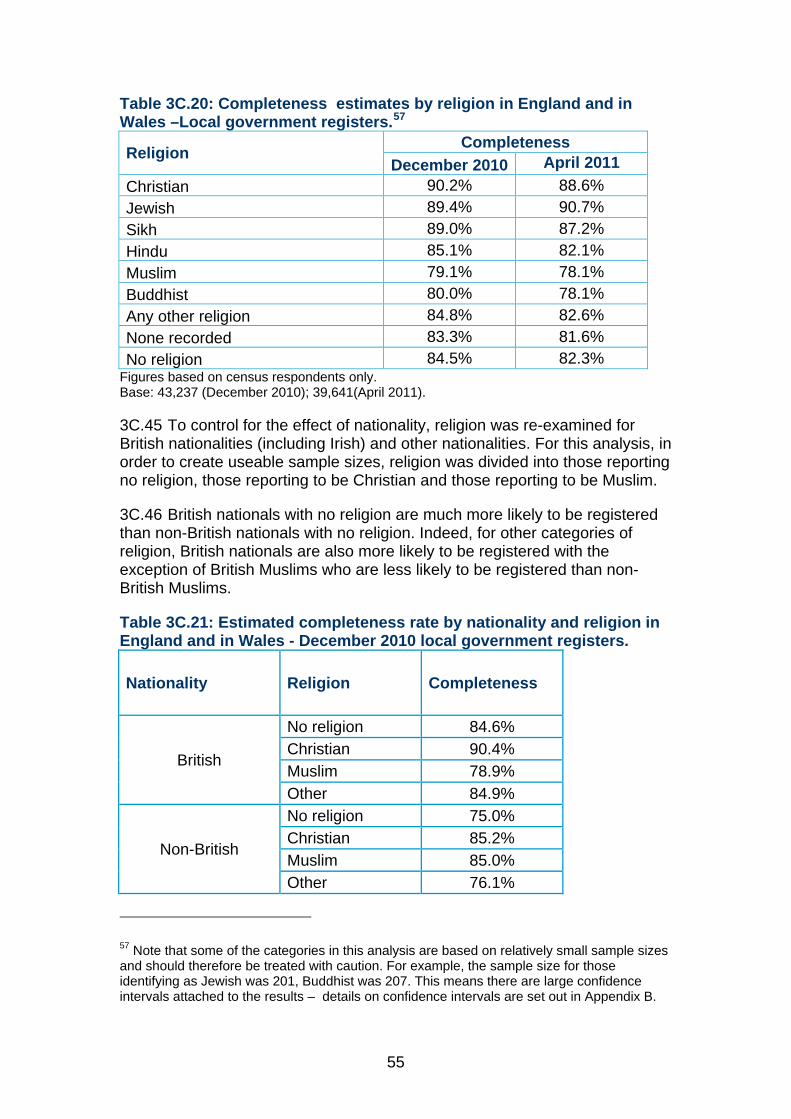
55
Table 3C.20: Completeness estimates by religion in England and in Wales –Local government registers.57
Religion Completeness December 2010 April 2011
Christian 90.2% 88.6% Jewish 89.4% 90.7% Sikh 89.0% 87.2% Hindu 85.1% 82.1% Muslim 79.1% 78.1% Buddhist 80.0% 78.1% Any other religion 84.8% 82.6% None recorded 83.3% 81.6% No religion 84.5% 82.3%
Figures based on census respondents only. Base: 43,237 (December 2010); 39,641(April 2011).
To control for the effect of nationality, religion was re-examined for 3C.45British nationalities (including Irish) and other nationalities. For this analysis, in order to create useable sample sizes, religion was divided into those reporting no religion, those reporting to be Christian and those reporting to be Muslim.
British nationals with no religion are much more likely to be registered 3C.46than non-British nationals with no religion. Indeed, for other categories of religion, British nationals are also more likely to be registered with the exception of British Muslims who are less likely to be registered than non-British Muslims.
Table 3C.21: Estimated completeness rate by nationality and religion in England and in Wales - December 2010 local government registers.
Nationality Religion Completeness
British
No religion 84.6% Christian 90.4% Muslim 78.9% Other 84.9%
Non-British
No religion 75.0% Christian 85.2% Muslim 85.0% Other 76.1%
57 Note that some of the categories in this analysis are based on relatively small sample sizes and should therefore be treated with caution. For example, the sample size for those identifying as Jewish was 201, Buddhist was 207. This means there are large confidence intervals attached to the results – details on confidence intervals are set out in Appendix B.
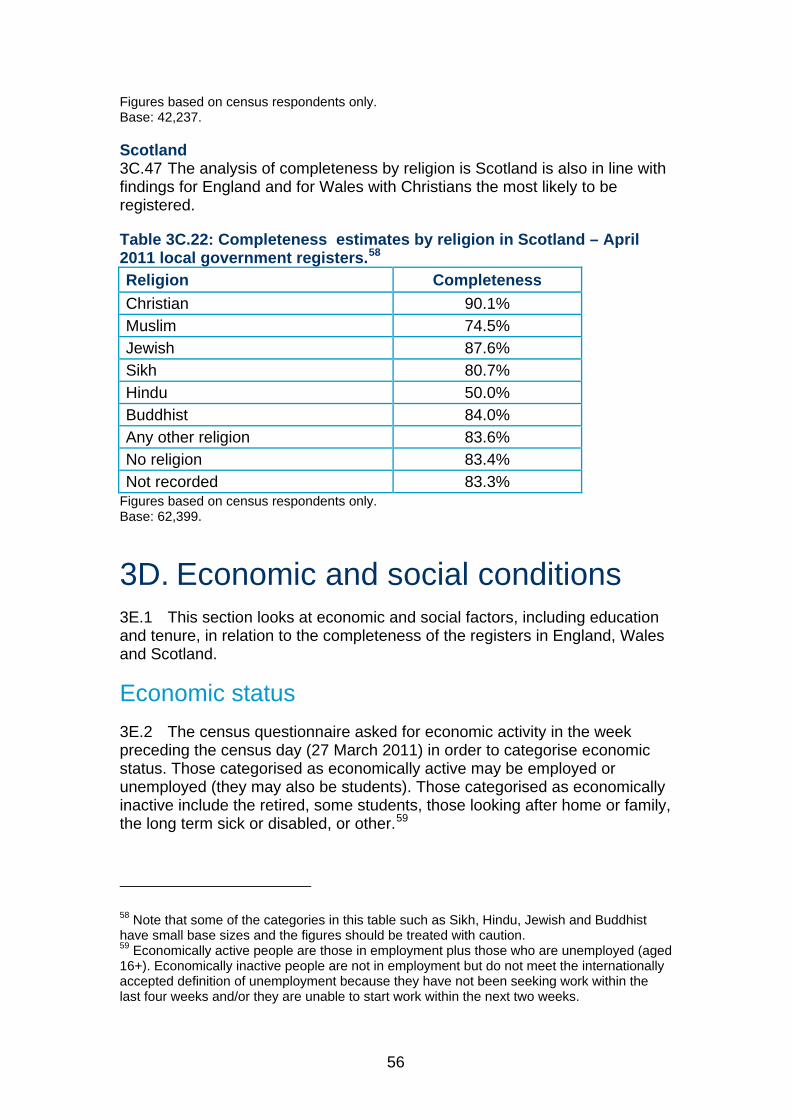
56
Figures based on census respondents only. Base: 42,237.
Scotland The analysis of completeness by religion is Scotland is also in line with 3C.47
findings for England and for Wales with Christians the most likely to be registered.
Table 3C.22: Completeness estimates by religion in Scotland – April 2011 local government registers.58 Religion Completeness Christian 90.1% Muslim 74.5% Jewish 87.6% Sikh 80.7% Hindu 50.0% Buddhist 84.0% Any other religion 83.6% No religion 83.4% Not recorded 83.3%
Figures based on census respondents only. Base: 62,399.
3D. Economic and social conditions This section looks at economic and social factors, including education 3E.1
and tenure, in relation to the completeness of the registers in England, Wales and Scotland.
Economic status The census questionnaire asked for economic activity in the week 3E.2
preceding the census day (27 March 2011) in order to categorise economic status. Those categorised as economically active may be employed or unemployed (they may also be students). Those categorised as economically inactive include the retired, some students, those looking after home or family, the long term sick or disabled, or other.59
58 Note that some of the categories in this table such as Sikh, Hindu, Jewish and Buddhist have small base sizes and the figures should be treated with caution. 59 Economically active people are those in employment plus those who are unemployed (aged 16+). Economically inactive people are not in employment but do not meet the internationally accepted definition of unemployment because they have not been seeking work within the last four weeks and/or they are unable to start work within the next two weeks.
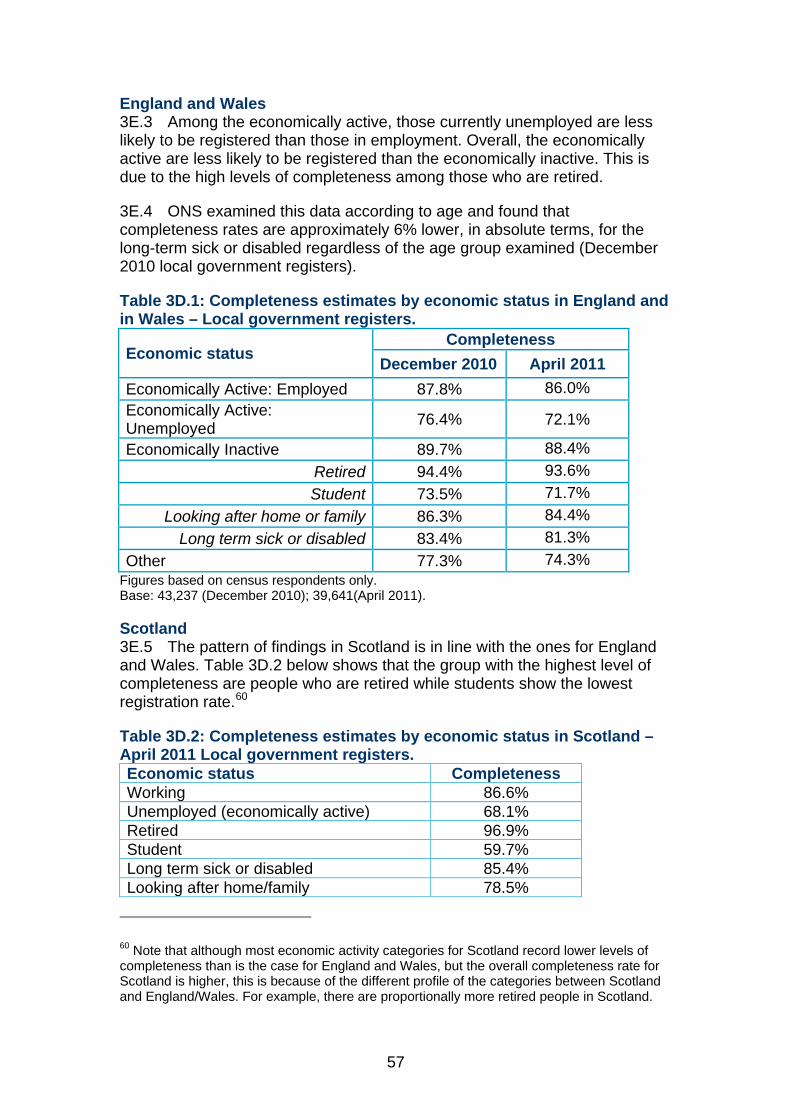
57
England and Wales Among the economically active, those currently unemployed are less 3E.3
likely to be registered than those in employment. Overall, the economically active are less likely to be registered than the economically inactive. This is due to the high levels of completeness among those who are retired.
ONS examined this data according to age and found that 3E.4completeness rates are approximately 6% lower, in absolute terms, for the long-term sick or disabled regardless of the age group examined (December 2010 local government registers).
Table 3D.1: Completeness estimates by economic status in England and in Wales – Local government registers.
Economic status Completeness
December 2010 April 2011 Economically Active: Employed 87.8% 86.0% Economically Active: Unemployed 76.4% 72.1%
Economically Inactive 89.7% 88.4% Retired 94.4% 93.6% Student 73.5% 71.7%
Looking after home or family 86.3% 84.4% Long term sick or disabled 83.4% 81.3%
Other 77.3% 74.3% Figures based on census respondents only. Base: 43,237 (December 2010); 39,641(April 2011).
Scotland The pattern of findings in Scotland is in line with the ones for England 3E.5
and Wales. Table 3D.2 below shows that the group with the highest level of completeness are people who are retired while students show the lowest registration rate.60
Table 3D.2: Completeness estimates by economic status in Scotland – April 2011 Local government registers. Economic status Completeness Working 86.6% Unemployed (economically active) 68.1% Retired 96.9% Student 59.7% Long term sick or disabled 85.4% Looking after home/family 78.5%
60 Note that although most economic activity categories for Scotland record lower levels of completeness than is the case for England and Wales, but the overall completeness rate for Scotland is higher, this is because of the different profile of the categories between Scotland and England/Wales. For example, there are proportionally more retired people in Scotland.
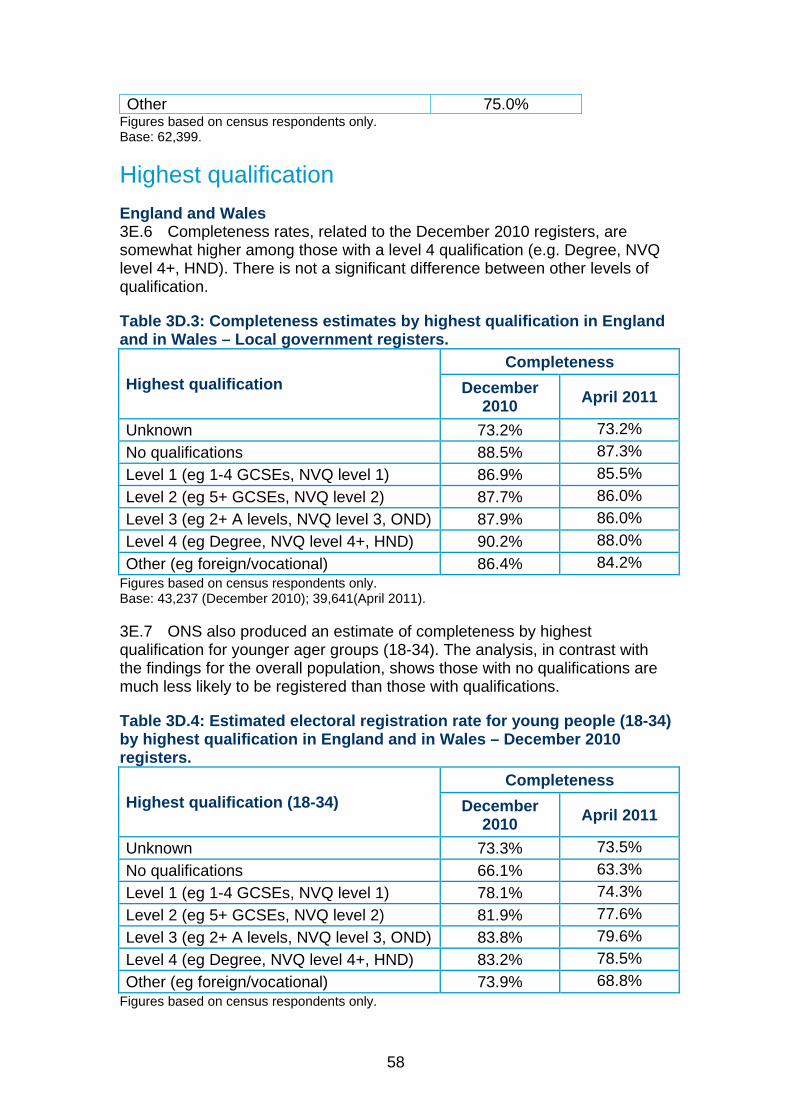
58
Other 75.0% Figures based on census respondents only. Base: 62,399.
Highest qualification England and Wales
Completeness rates, related to the December 2010 registers, are 3E.6somewhat higher among those with a level 4 qualification (e.g. Degree, NVQ level 4+, HND). There is not a significant difference between other levels of qualification.
Table 3D.3: Completeness estimates by highest qualification in England and in Wales – Local government registers.
Highest qualification Completeness
December 2010 April 2011
Unknown 73.2% 73.2% No qualifications 88.5% 87.3% Level 1 (eg 1-4 GCSEs, NVQ level 1) 86.9% 85.5% Level 2 (eg 5+ GCSEs, NVQ level 2) 87.7% 86.0% Level 3 (eg 2+ A levels, NVQ level 3, OND) 87.9% 86.0% Level 4 (eg Degree, NVQ level 4+, HND) 90.2% 88.0% Other (eg foreign/vocational) 86.4% 84.2%
Figures based on census respondents only. Base: 43,237 (December 2010); 39,641(April 2011).
ONS also produced an estimate of completeness by highest 3E.7qualification for younger ager groups (18-34). The analysis, in contrast with the findings for the overall population, shows those with no qualifications are much less likely to be registered than those with qualifications.
Table 3D.4: Estimated electoral registration rate for young people (18-34) by highest qualification in England and in Wales – December 2010 registers.
Highest qualification (18-34) Completeness
December 2010 April 2011
Unknown 73.3% 73.5% No qualifications 66.1% 63.3% Level 1 (eg 1-4 GCSEs, NVQ level 1) 78.1% 74.3% Level 2 (eg 5+ GCSEs, NVQ level 2) 81.9% 77.6% Level 3 (eg 2+ A levels, NVQ level 3, OND) 83.8% 79.6% Level 4 (eg Degree, NVQ level 4+, HND) 83.2% 78.5% Other (eg foreign/vocational) 73.9% 68.8%
Figures based on census respondents only.
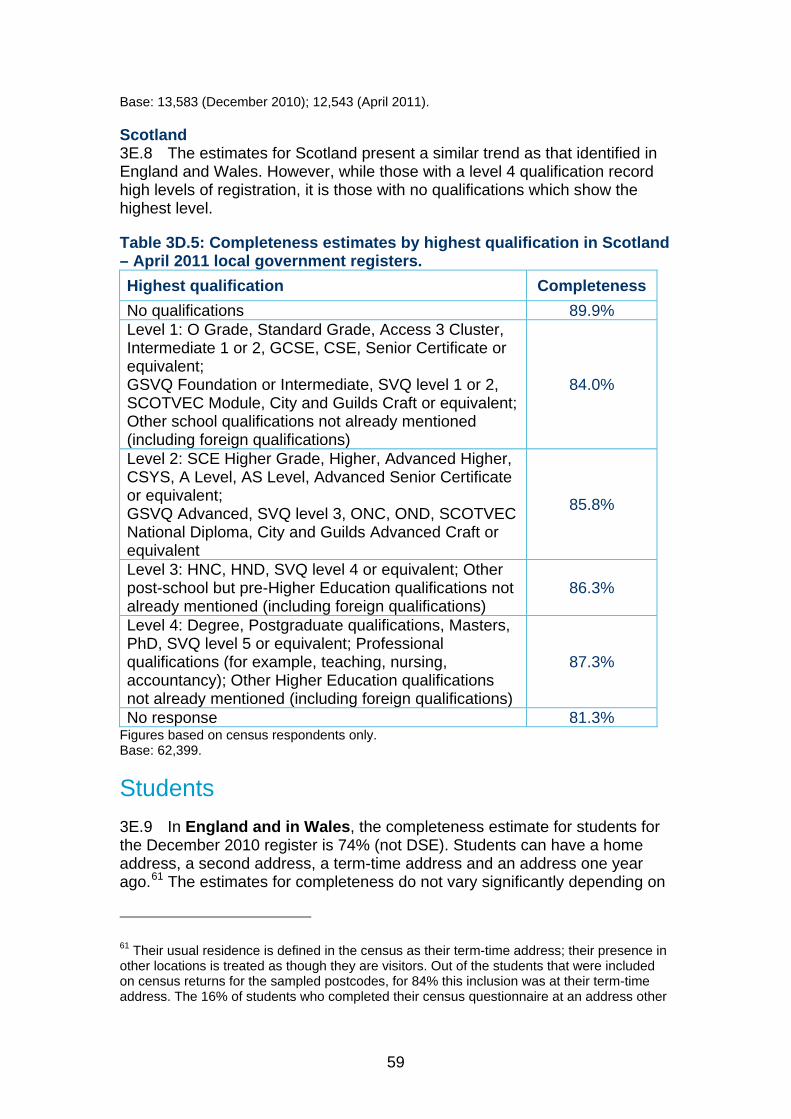
59
Base: 13,583 (December 2010); 12,543 (April 2011).
Scotland The estimates for Scotland present a similar trend as that identified in 3E.8
England and Wales. However, while those with a level 4 qualification record high levels of registration, it is those with no qualifications which show the highest level.
Table 3D.5: Completeness estimates by highest qualification in Scotland – April 2011 local government registers. Highest qualification Completeness No qualifications 89.9% Level 1: O Grade, Standard Grade, Access 3 Cluster, Intermediate 1 or 2, GCSE, CSE, Senior Certificate or equivalent; GSVQ Foundation or Intermediate, SVQ level 1 or 2, SCOTVEC Module, City and Guilds Craft or equivalent; Other school qualifications not already mentioned (including foreign qualifications)
84.0%
Level 2: SCE Higher Grade, Higher, Advanced Higher, CSYS, A Level, AS Level, Advanced Senior Certificate or equivalent; GSVQ Advanced, SVQ level 3, ONC, OND, SCOTVEC National Diploma, City and Guilds Advanced Craft or equivalent
85.8%
Level 3: HNC, HND, SVQ level 4 or equivalent; Other post-school but pre-Higher Education qualifications not already mentioned (including foreign qualifications)
86.3%
Level 4: Degree, Postgraduate qualifications, Masters, PhD, SVQ level 5 or equivalent; Professional qualifications (for example, teaching, nursing, accountancy); Other Higher Education qualifications not already mentioned (including foreign qualifications)
87.3%
No response 81.3% Figures based on census respondents only. Base: 62,399.
Students In England and in Wales, the completeness estimate for students for 3E.9
the December 2010 register is 74% (not DSE). Students can have a home address, a second address, a term-time address and an address one year ago.61 The estimates for completeness do not vary significantly depending on
61 Their usual residence is defined in the census as their term-time address; their presence in other locations is treated as though they are visitors. Out of the students that were included on census returns for the sampled postcodes, for 84% this inclusion was at their term-time address. The 16% of students who completed their census questionnaire at an address other
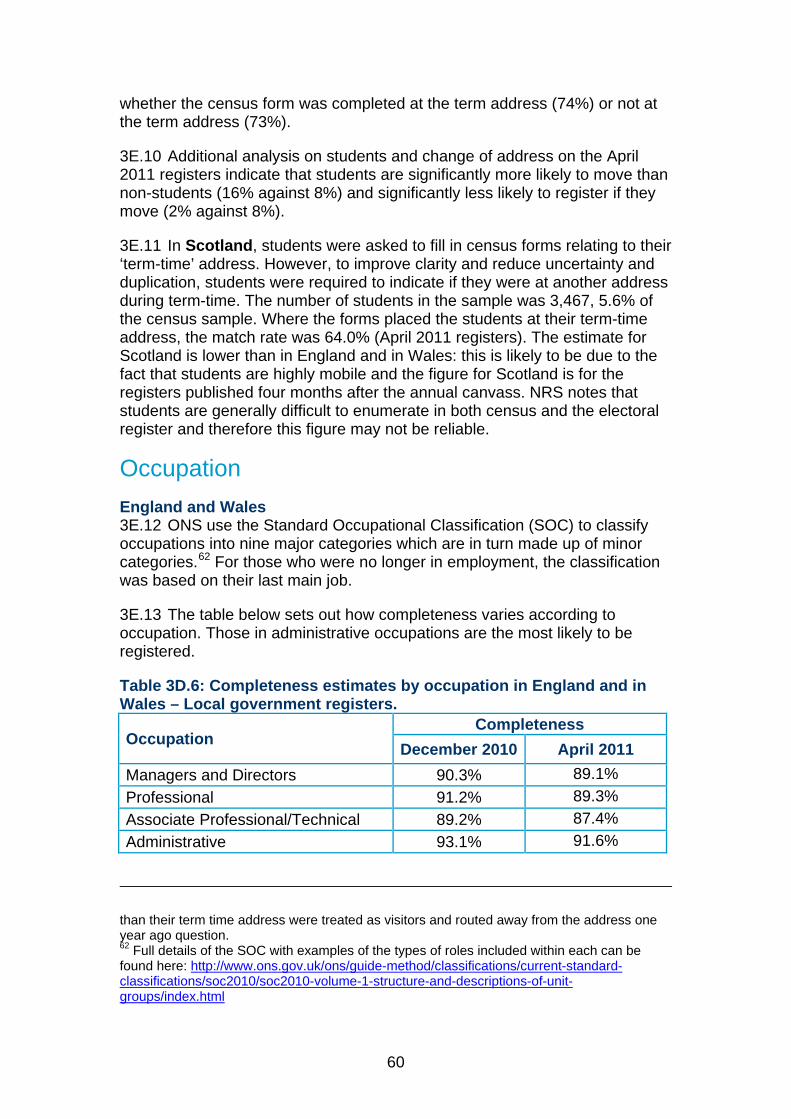
60
whether the census form was completed at the term address (74%) or not at the term address (73%).
Additional analysis on students and change of address on the April 3E.102011 registers indicate that students are significantly more likely to move than non-students (16% against 8%) and significantly less likely to register if they move (2% against 8%).
In Scotland, students were asked to fill in census forms relating to their 3E.11‘term-time’ address. However, to improve clarity and reduce uncertainty and duplication, students were required to indicate if they were at another address during term-time. The number of students in the sample was 3,467, 5.6% of the census sample. Where the forms placed the students at their term-time address, the match rate was 64.0% (April 2011 registers). The estimate for Scotland is lower than in England and in Wales: this is likely to be due to the fact that students are highly mobile and the figure for Scotland is for the registers published four months after the annual canvass. NRS notes that students are generally difficult to enumerate in both census and the electoral register and therefore this figure may not be reliable.
Occupation England and Wales
ONS use the Standard Occupational Classification (SOC) to classify 3E.12occupations into nine major categories which are in turn made up of minor categories.62 For those who were no longer in employment, the classification was based on their last main job.
The table below sets out how completeness varies according to 3E.13occupation. Those in administrative occupations are the most likely to be registered.
Table 3D.6: Completeness estimates by occupation in England and in Wales – Local government registers.
Occupation Completeness
December 2010 April 2011 Managers and Directors 90.3% 89.1% Professional 91.2% 89.3% Associate Professional/Technical 89.2% 87.4% Administrative 93.1% 91.6%
than their term time address were treated as visitors and routed away from the address one year ago question. 62 Full details of the SOC with examples of the types of roles included within each can be found here: http://www.ons.gov.uk/ons/guide-method/classifications/current-standard-classifications/soc2010/soc2010-volume-1-structure-and-descriptions-of-unit-groups/index.html
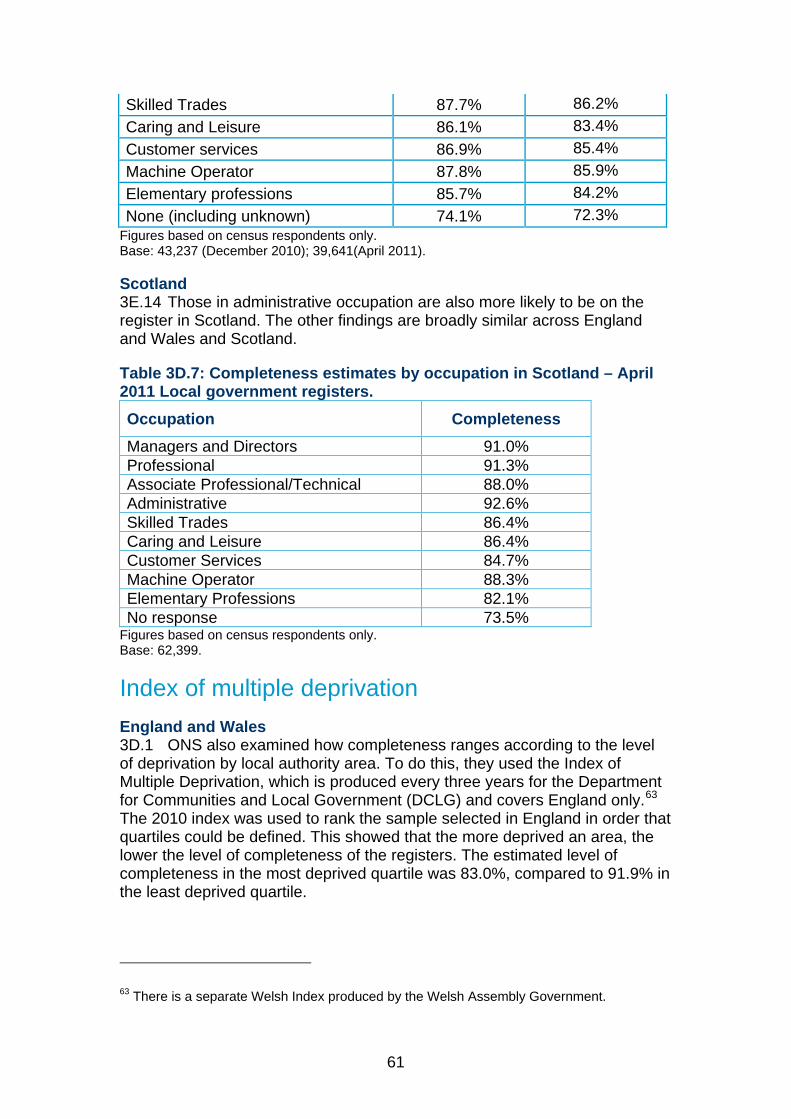
61
Skilled Trades 87.7% 86.2% Caring and Leisure 86.1% 83.4% Customer services 86.9% 85.4% Machine Operator 87.8% 85.9% Elementary professions 85.7% 84.2% None (including unknown) 74.1% 72.3%
Figures based on census respondents only. Base: 43,237 (December 2010); 39,641(April 2011).
Scotland Those in administrative occupation are also more likely to be on the 3E.14
register in Scotland. The other findings are broadly similar across England and Wales and Scotland.
Table 3D.7: Completeness estimates by occupation in Scotland – April 2011 Local government registers. Occupation Completeness Managers and Directors 91.0% Professional 91.3% Associate Professional/Technical 88.0% Administrative 92.6% Skilled Trades 86.4% Caring and Leisure 86.4% Customer Services 84.7% Machine Operator 88.3% Elementary Professions 82.1% No response 73.5%
Figures based on census respondents only. Base: 62,399.
Index of multiple deprivation England and Wales 3D.1 ONS also examined how completeness ranges according to the level of deprivation by local authority area. To do this, they used the Index of Multiple Deprivation, which is produced every three years for the Department for Communities and Local Government (DCLG) and covers England only.63 The 2010 index was used to rank the sample selected in England in order that quartiles could be defined. This showed that the more deprived an area, the lower the level of completeness of the registers. The estimated level of completeness in the most deprived quartile was 83.0%, compared to 91.9% in the least deprived quartile.
63 There is a separate Welsh Index produced by the Welsh Assembly Government.
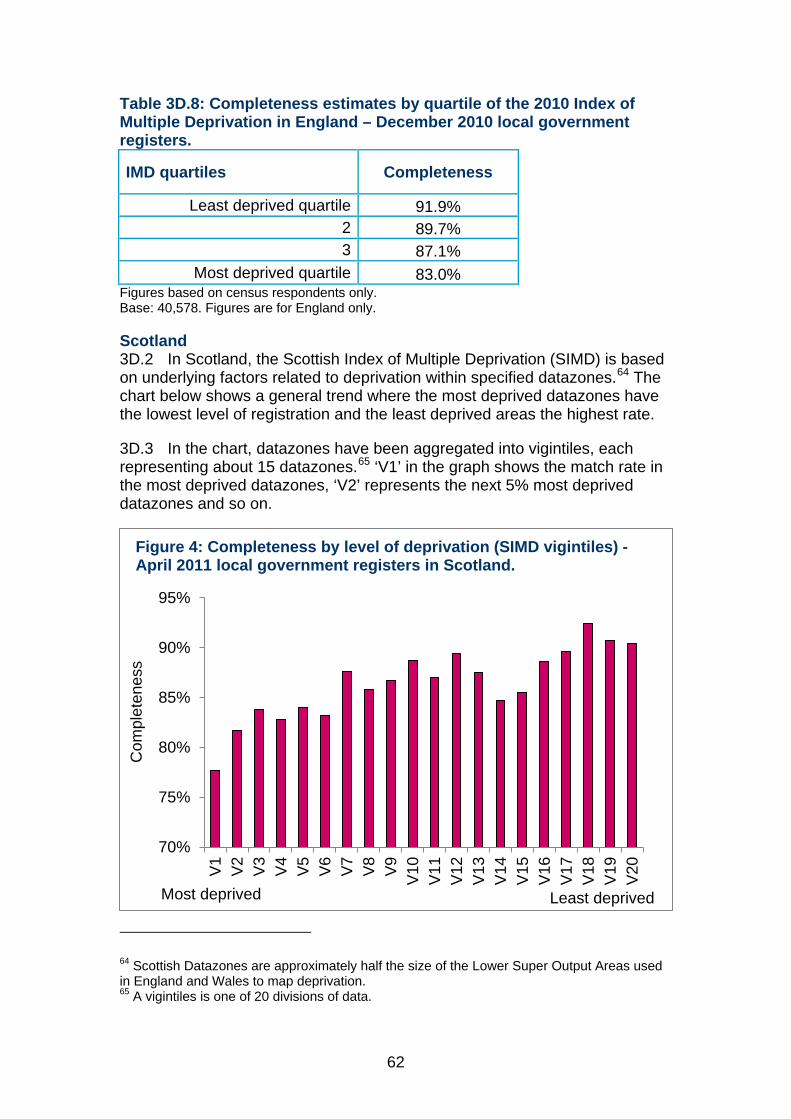
62
Table 3D.8: Completeness estimates by quartile of the 2010 Index of Multiple Deprivation in England – December 2010 local government registers.
IMD quartiles Completeness
Least deprived quartile 91.9% 2 89.7% 3 87.1%
Most deprived quartile 83.0% Figures based on census respondents only. Base: 40,578. Figures are for England only.
Scotland 3D.2 In Scotland, the Scottish Index of Multiple Deprivation (SIMD) is based on underlying factors related to deprivation within specified datazones.64 The chart below shows a general trend where the most deprived datazones have the lowest level of registration and the least deprived areas the highest rate.
3D.3 In the chart, datazones have been aggregated into vigintiles, each representing about 15 datazones.65 ‘V1’ in the graph shows the match rate in the most deprived datazones, ‘V2’ represents the next 5% most deprived datazones and so on.
64 Scottish Datazones are approximately half the size of the Lower Super Output Areas used in England and Wales to map deprivation. 65 A vigintiles is one of 20 divisions of data.
70%
75%
80%
85%
90%
95%
V1 V2 V3 V4 V5 V6 V7 V8 V9 V10
V11
V12
V13
V14
V15
V16
V17
V18
V19
V20
Com
plet
enes
s
Most deprived Least deprived
Figure 4: Completeness by level of deprivation (SIMD vigintiles) - April 2011 local government registers in Scotland.
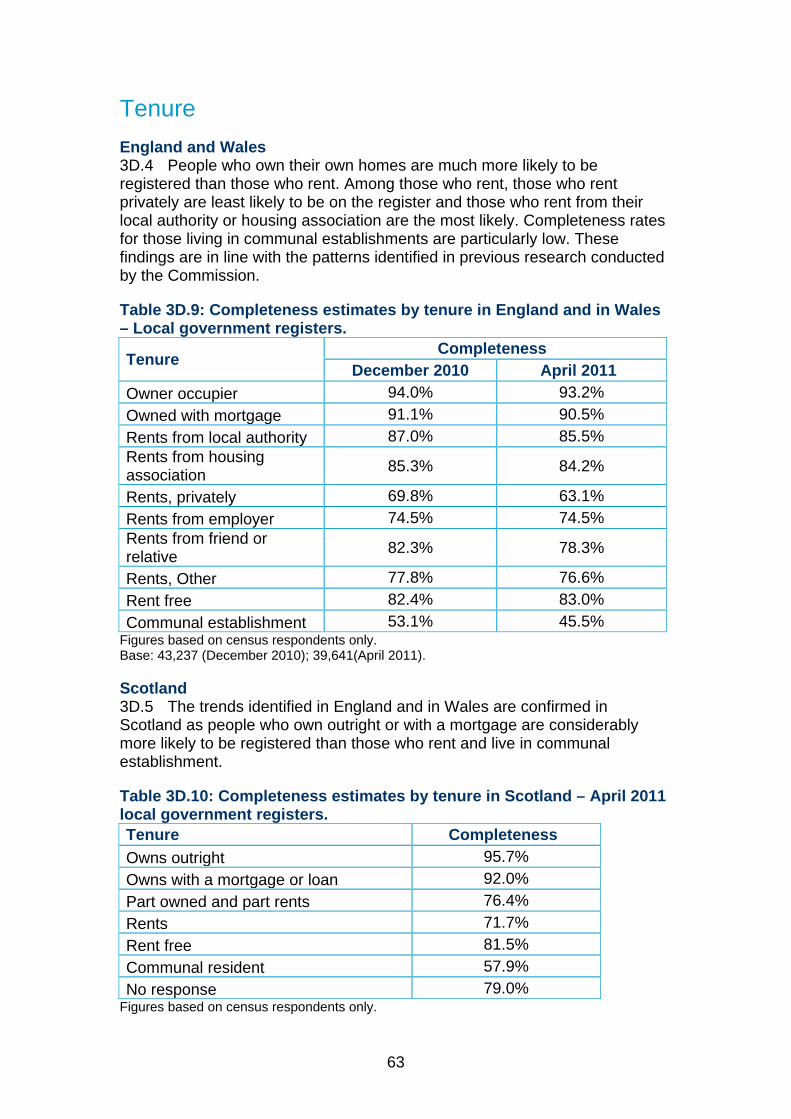
63
Tenure England and Wales 3D.4 People who own their own homes are much more likely to be registered than those who rent. Among those who rent, those who rent privately are least likely to be on the register and those who rent from their local authority or housing association are the most likely. Completeness rates for those living in communal establishments are particularly low. These findings are in line with the patterns identified in previous research conducted by the Commission.
Table 3D.9: Completeness estimates by tenure in England and in Wales – Local government registers.
Tenure Completeness December 2010 April 2011
Owner occupier 94.0% 93.2% Owned with mortgage 91.1% 90.5% Rents from local authority 87.0% 85.5% Rents from housing association 85.3% 84.2%
Rents, privately 69.8% 63.1% Rents from employer 74.5% 74.5% Rents from friend or relative 82.3% 78.3%
Rents, Other 77.8% 76.6% Rent free 82.4% 83.0% Communal establishment 53.1% 45.5%
Figures based on census respondents only. Base: 43,237 (December 2010); 39,641(April 2011).
Scotland 3D.5 The trends identified in England and in Wales are confirmed in Scotland as people who own outright or with a mortgage are considerably more likely to be registered than those who rent and live in communal establishment.
Table 3D.10: Completeness estimates by tenure in Scotland – April 2011 local government registers. Tenure Completeness Owns outright 95.7% Owns with a mortgage or loan 92.0% Part owned and part rents 76.4% Rents 71.7% Rent free 81.5% Communal resident 57.9% No response 79.0%
Figures based on census respondents only.
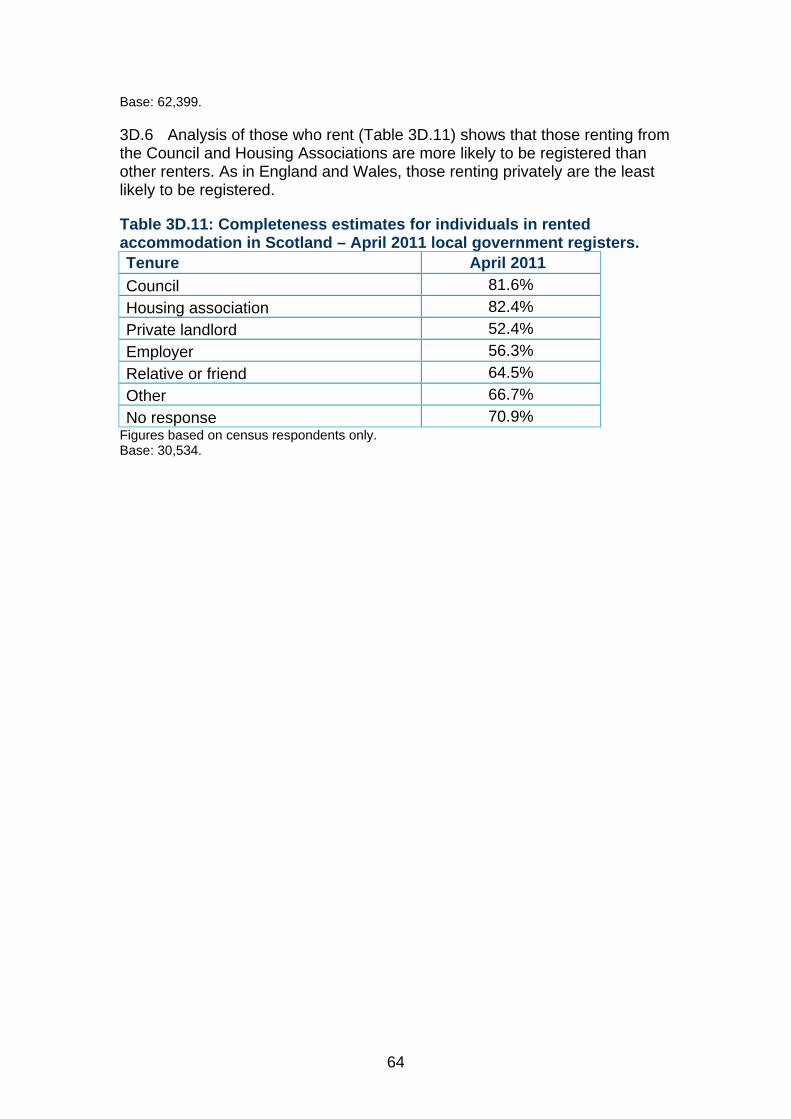
64
Base: 62,399.
3D.6 Analysis of those who rent (Table 3D.11) shows that those renting from the Council and Housing Associations are more likely to be registered than other renters. As in England and Wales, those renting privately are the least likely to be registered.
Table 3D.11: Completeness estimates for individuals in rented accommodation in Scotland – April 2011 local government registers. Tenure April 2011 Council 81.6% Housing association 82.4% Private landlord 52.4% Employer 56.3% Relative or friend 64.5% Other 66.7% No response 70.9%
Figures based on census respondents only. Base: 30,534.
65
3E. Electoral registration practices In 2010, we conducted a survey of electoral registration officers 3E.1
(EROs) on their canvassing practices and outcomes. EROs in 318 of the 348 local authorities in England and Wales responded.66
This data was provided to ONS as part of this analysis in order to 3E.2explore if any useful conclusions could be drawn about the effectiveness of different approaches to canvassing.
However, limited conclusions can be drawn for a number of reasons. 3E.3Firstly, there is no means to test what would have happened if the house to house canvassing was not applied – the annual canvass must, by law, be carried out by every ERO. Secondly, areas with the lowest registration rates may be more likely to use a variety of canvassing methods to try to increase registration and as a result it is impossible, for the purposes of this research, to distinguish between cause and effect.
In addition, the survey asked for response rates at each stage of the 3E.4canvassing process from each ERO. However, there is no observable relationship between the response rates obtained from EROs via the survey and the levels of completeness found in this analysis. This is likely to be because the rates reported by EROs are based on the address file that each authority used and are therefore household-based measures. In addition, there may be differences in how each ERO calculated their response rates. Whereas the completeness analysis is for individuals and is standardised across the country.
These issues severely limit the conclusions that can be drawn from this 3E.5analysis and we have included limited analysis below.
Local advertising There is no significant difference in estimated levels of completeness 3E.6
for those EROs that told us they advertised their canvass and those that told us they did not use any advertising. The publicity methods analysed are not mutually exclusive and the outcome dependent upon the use of each method are not significantly different from each other (Table 3E.1).This analysis could not make any assessment about what the advertising was designed to achieve or how it was targeted (for example, in terms of presentation and
66 The analysis in this sub-section looks at the estimates of completeness produced by ONS in relation to the information provided by local authorities on their registration practices. It is limited to those 318 EROs that responded to the survey and the 40,069 census respondents in the sample within these local authorities who are eligible to register.
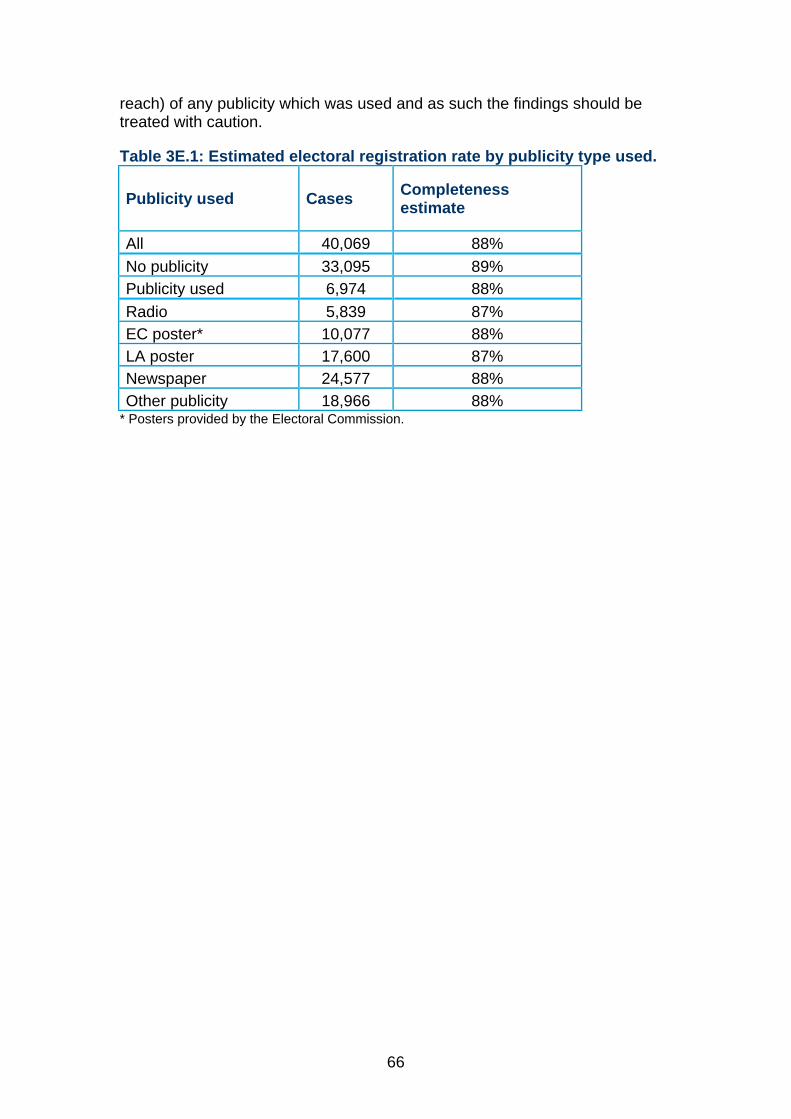
66
reach) of any publicity which was used and as such the findings should be treated with caution.
Table 3E.1: Estimated electoral registration rate by publicity type used.
Publicity used Cases Completeness estimate
All 40,069 88% No publicity 33,095 89% Publicity used 6,974 88% Radio 5,839 87% EC poster* 10,077 88% LA poster 17,600 87% Newspaper 24,577 88% Other publicity 18,966 88%
* Posters provided by the Electoral Commission.
67
4 Analysis of the findings This chapter sets outs the historical trend in completeness of the 4.1
electoral registers. In doing so, it assess the effect of changes to the population over the last ten years.
The trend in completeness Previous research has set out how the completeness of the registers has 4.2
changed over time.67 The highest recorded levels of completeness were produced in the 1950s and 1960s. At this time, registers were found to be 96% complete at the end of the canvass period (1950 and 1966) and up to 93-94% complete on the day of the registers’ publication the following February/March.68
There was then a substantial gap in the publication of national estimates 4.3of completeness, with the next estimate produced using the 1981 Census (based on the 1980 registers). This found that 93.5% of people were registered at the end of the canvass period.69 This showed that completeness started to decline by the early 1980s and to stabilise at around 91-93% during the 1990s (1991 Census) and 91-92% in 2001 (2001 Census).
However, our 2011 national study and the estimates presented in this 4.4report show between 2001 and 2011 there was a substantial increase in non-registration rates: from 8-9% in 2001 to 14-15% in 2011.70 71
Figure 5 below shows the change in Great Britain’s population aged 16 4.5and above and the number of electoral registers entries from 1991 to 2011. It also shows the registration rate (please see paragraph 2.4 to see how this is calculated) and the completeness estimates produced using census data (1991, 2001, and 2011) for the same period.
67 The Electoral Commission, Great Britain’s electoral registers 2011 (2011) 68 P.G. Gray and A. Gee, Electoral registration for parliamentary elections: an enquiry made for the Home Office (HMSO: London, 1967). At this time the registers were published in the February following the canvass rather than in December. 69 Todd and Butcher, Electoral registration in 1981 (1981) (referred to as the 1981 OPCS study). Between these two estimates there was a change to the franchise in the UK with the minimum age at which a person can vote being lowered from 21 to 18. The 1981 OPCS study estimated that while some of the decline in registration between the 1966 and 1981 estimates could be attributed to this (because young people are less likely to be registered) there was a decline not associated with the change. 70 The Electoral Commission, Great Britain’s electoral register 2011 (December 2011). 71 This compares the findings for the post-canvass registers in 2000/01 with the findings for the equivalent register (December 2010) in this study.

68
The figure shows that population and register entries were closely 4.6aligned until 2001. Between 2002 and 2006 the number of register entries dropped and then picked up again while population grew steadily. In our 2010 report we suggested that this drop may have been due to the increased use of all-postal canvasses from the mid-2000s.72 As a result, the registration rate started to drop from 2001 but has stabilised since 2006.
There are a number of factors which are likely to be responsible for the 4.7fall in completeness. Previous studies have suggested that these include public engagement and interest in politics, population, mobility and registration practices.
The Commission’s 2011 report Great Britain’s electoral registers and 4.8The quality of the 2014 electoral registers in Great Britain sets out these arguments in more detail.73
72 The Electoral Commission, The completeness and accuracy of the electoral registers in Great Britain (March 2010). 73 The Electoral Commission, Great Britain’s electoral register 2011 (December 2011)< The Electoral Commission, The quality of the 2014 electoral registers in Great Britain (July 2014).
75%
80%
85%
90%
95%
100%
38
40
42
44
46
48
50
52
1991
1992
1993
1994
1995
1996
1997
1998
1999
2000
2001
2002
2003
2004
2005
2006
2007
2008
2009
2010
2011
Milli
ons
16+ population Register entries Rate (%) Census study (%)
Figure 5: Population (16+), electoral register entries and registration rate in Great Britain - 1991-2011.
Source: ONS electoral statistics, mid-year population estimates and Census. Notes: Electoral register entries for parliamentary registers from 1991 to 1998, local government registers from 1999 to 2011.
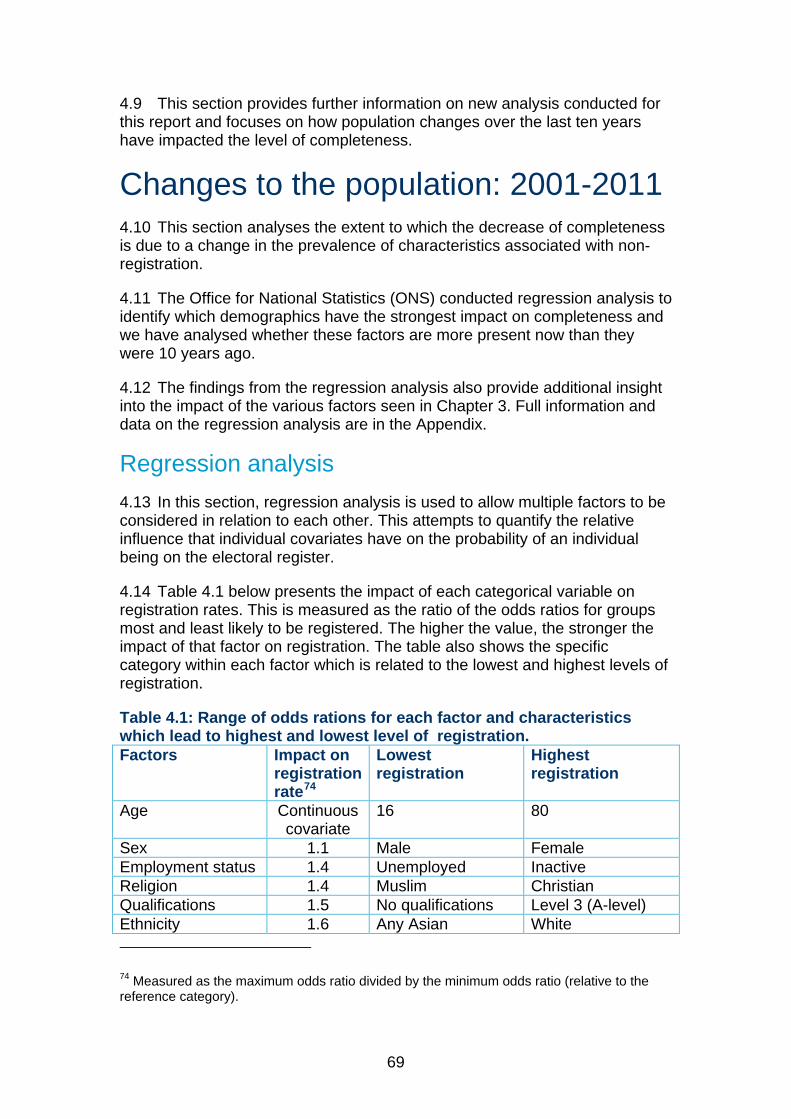
69
This section provides further information on new analysis conducted for 4.9this report and focuses on how population changes over the last ten years have impacted the level of completeness.
Changes to the population: 2001-2011 This section analyses the extent to which the decrease of completeness 4.10
is due to a change in the prevalence of characteristics associated with non-registration.
The Office for National Statistics (ONS) conducted regression analysis to 4.11identify which demographics have the strongest impact on completeness and we have analysed whether these factors are more present now than they were 10 years ago.
The findings from the regression analysis also provide additional insight 4.12into the impact of the various factors seen in Chapter 3. Full information and data on the regression analysis are in the Appendix.
Regression analysis In this section, regression analysis is used to allow multiple factors to be 4.13
considered in relation to each other. This attempts to quantify the relative influence that individual covariates have on the probability of an individual being on the electoral register.
Table 4.1 below presents the impact of each categorical variable on 4.14registration rates. This is measured as the ratio of the odds ratios for groups most and least likely to be registered. The higher the value, the stronger the impact of that factor on registration. The table also shows the specific category within each factor which is related to the lowest and highest levels of registration.
Table 4.1: Range of odds rations for each factor and characteristics which lead to highest and lowest level of registration. Factors Impact on
registration rate74
Lowest registration
Highest registration
Age Continuous covariate
16 80
Sex 1.1 Male Female Employment status 1.4 Unemployed Inactive Religion 1.4 Muslim Christian Qualifications 1.5 No qualifications Level 3 (A-level) Ethnicity 1.6 Any Asian White 74 Measured as the maximum odds ratio divided by the minimum odds ratio (relative to the reference category).
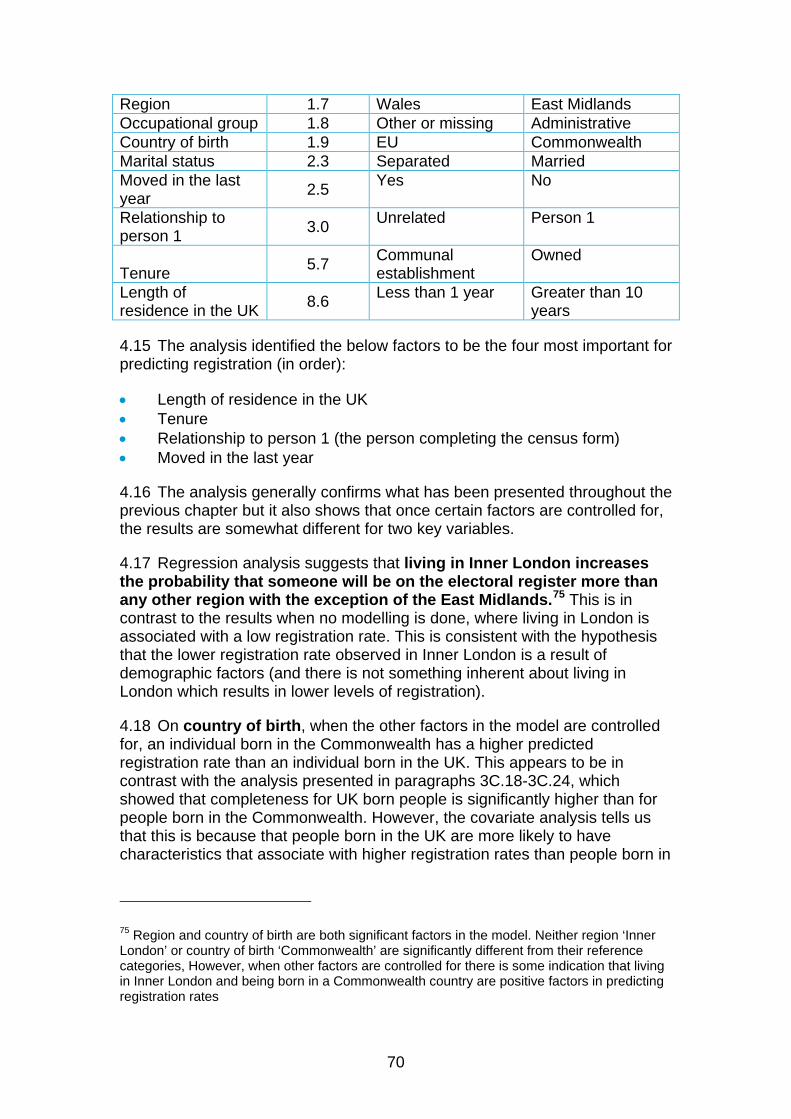
70
Region 1.7 Wales East Midlands Occupational group 1.8 Other or missing Administrative Country of birth 1.9 EU Commonwealth Marital status 2.3 Separated Married Moved in the last year 2.5 Yes No
Relationship to person 1 3.0 Unrelated Person 1
Tenure 5.7 Communal establishment
Owned
Length of residence in the UK 8.6 Less than 1 year Greater than 10
years
The analysis identified the below factors to be the four most important for 4.15predicting registration (in order):
• Length of residence in the UK • Tenure • Relationship to person 1 (the person completing the census form) • Moved in the last year
The analysis generally confirms what has been presented throughout the 4.16previous chapter but it also shows that once certain factors are controlled for, the results are somewhat different for two key variables.
Regression analysis suggests that living in Inner London increases 4.17the probability that someone will be on the electoral register more than any other region with the exception of the East Midlands.75 This is in contrast to the results when no modelling is done, where living in London is associated with a low registration rate. This is consistent with the hypothesis that the lower registration rate observed in Inner London is a result of demographic factors (and there is not something inherent about living in London which results in lower levels of registration).
On country of birth, when the other factors in the model are controlled 4.18for, an individual born in the Commonwealth has a higher predicted registration rate than an individual born in the UK. This appears to be in contrast with the analysis presented in paragraphs 3C.18-3C.24, which showed that completeness for UK born people is significantly higher than for people born in the Commonwealth. However, the covariate analysis tells us that this is because that people born in the UK are more likely to have characteristics that associate with higher registration rates than people born in
75 Region and country of birth are both significant factors in the model. Neither region ‘Inner London’ or country of birth ‘Commonwealth’ are significantly different from their reference categories, However, when other factors are controlled for there is some indication that living in Inner London and being born in a Commonwealth country are positive factors in predicting registration rates
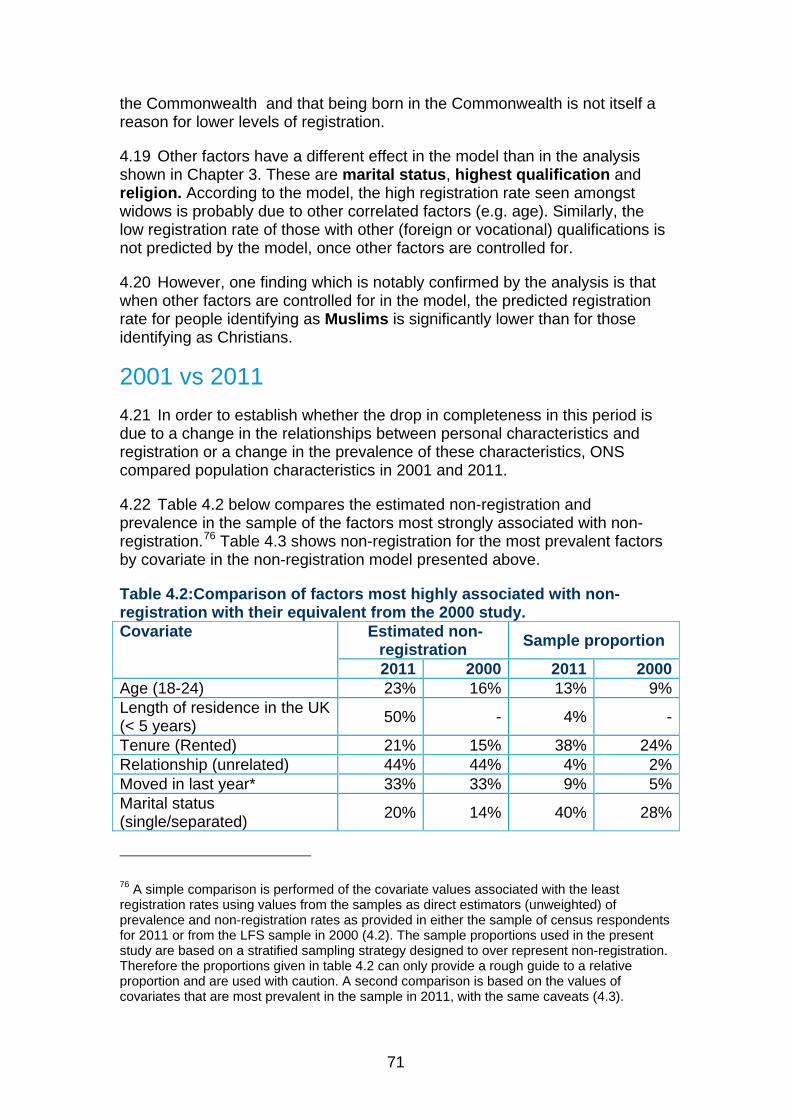
71
the Commonwealth and that being born in the Commonwealth is not itself a reason for lower levels of registration.
Other factors have a different effect in the model than in the analysis 4.19shown in Chapter 3. These are marital status, highest qualification and religion. According to the model, the high registration rate seen amongst widows is probably due to other correlated factors (e.g. age). Similarly, the low registration rate of those with other (foreign or vocational) qualifications is not predicted by the model, once other factors are controlled for.
However, one finding which is notably confirmed by the analysis is that 4.20when other factors are controlled for in the model, the predicted registration rate for people identifying as Muslims is significantly lower than for those identifying as Christians.
2001 vs 2011 In order to establish whether the drop in completeness in this period is 4.21
due to a change in the relationships between personal characteristics and registration or a change in the prevalence of these characteristics, ONS compared population characteristics in 2001 and 2011.
Table 4.2 below compares the estimated non-registration and 4.22prevalence in the sample of the factors most strongly associated with non-registration.76 Table 4.3 shows non-registration for the most prevalent factors by covariate in the non-registration model presented above.
Table 4.2:Comparison of factors most highly associated with non-registration with their equivalent from the 2000 study. Covariate Estimated non-
registration Sample proportion
2011 2000 2011 2000 Age (18-24) 23% 16% 13% 9% Length of residence in the UK (< 5 years) 50% - 4% -
Tenure (Rented) 21% 15% 38% 24% Relationship (unrelated) 44% 44% 4% 2% Moved in last year* 33% 33% 9% 5% Marital status (single/separated) 20% 14% 40% 28%
76 A simple comparison is performed of the covariate values associated with the least registration rates using values from the samples as direct estimators (unweighted) of prevalence and non-registration rates as provided in either the sample of census respondents for 2011 or from the LFS sample in 2000 (4.2). The sample proportions used in the present study are based on a stratified sampling strategy designed to over represent non-registration. Therefore the proportions given in table 4.2 can only provide a rough guide to a relative proportion and are used with caution. A second comparison is based on the values of covariates that are most prevalent in the sample in 2011, with the same caveats (4.3).
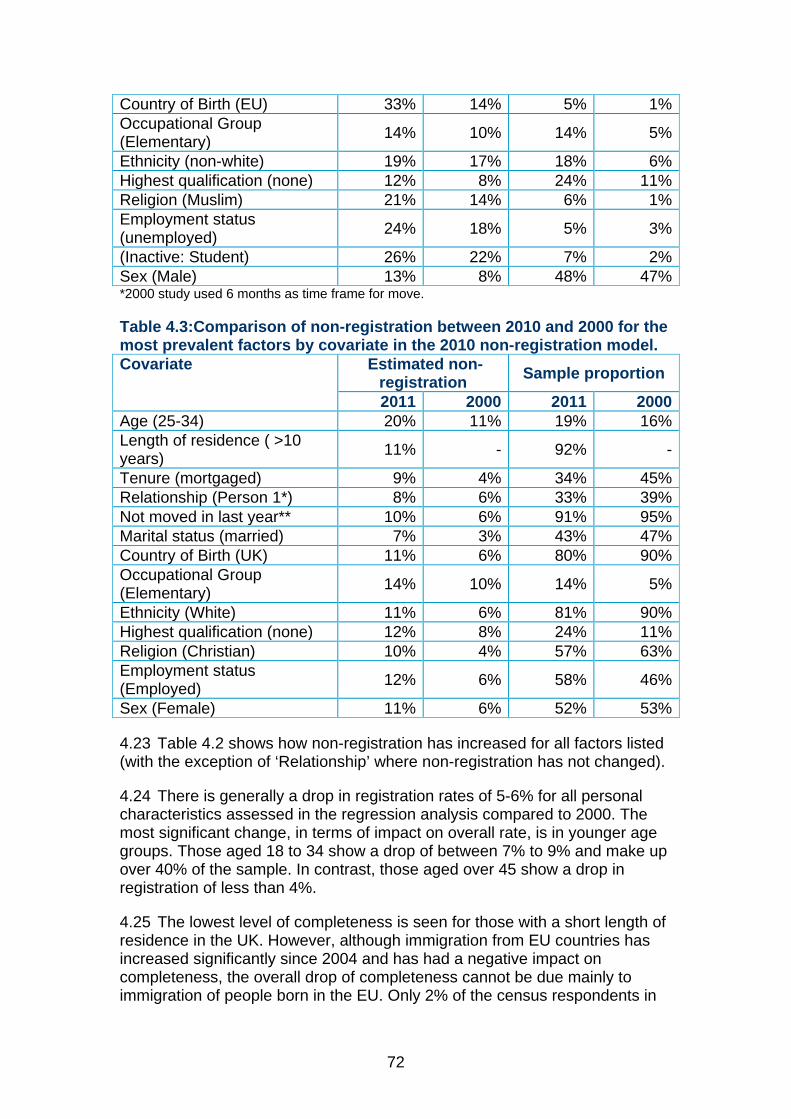
72
Country of Birth (EU) 33% 14% 5% 1% Occupational Group (Elementary) 14% 10% 14% 5%
Ethnicity (non-white) 19% 17% 18% 6% Highest qualification (none) 12% 8% 24% 11% Religion (Muslim) 21% 14% 6% 1% Employment status (unemployed) 24% 18% 5% 3%
(Inactive: Student) 26% 22% 7% 2% Sex (Male) 13% 8% 48% 47% *2000 study used 6 months as time frame for move.
Table 4.3:Comparison of non-registration between 2010 and 2000 for the most prevalent factors by covariate in the 2010 non-registration model. Covariate Estimated non-
registration Sample proportion
2011 2000 2011 2000 Age (25-34) 20% 11% 19% 16% Length of residence ( >10 years) 11% - 92% -
Tenure (mortgaged) 9% 4% 34% 45% Relationship (Person 1*) 8% 6% 33% 39% Not moved in last year** 10% 6% 91% 95% Marital status (married) 7% 3% 43% 47% Country of Birth (UK) 11% 6% 80% 90% Occupational Group (Elementary) 14% 10% 14% 5%
Ethnicity (White) 11% 6% 81% 90% Highest qualification (none) 12% 8% 24% 11% Religion (Christian) 10% 4% 57% 63% Employment status (Employed) 12% 6% 58% 46%
Sex (Female) 11% 6% 52% 53%
Table 4.2 shows how non-registration has increased for all factors listed 4.23(with the exception of ‘Relationship’ where non-registration has not changed).
There is generally a drop in registration rates of 5-6% for all personal 4.24characteristics assessed in the regression analysis compared to 2000. The most significant change, in terms of impact on overall rate, is in younger age groups. Those aged 18 to 34 show a drop of between 7% to 9% and make up over 40% of the sample. In contrast, those aged over 45 show a drop in registration of less than 4%.
The lowest level of completeness is seen for those with a short length of 4.25residence in the UK. However, although immigration from EU countries has increased significantly since 2004 and has had a negative impact on completeness, the overall drop of completeness cannot be due mainly to immigration of people born in the EU. Only 2% of the census respondents in
73
the sample were born in the EU and resident for less than 5 years. Their registration rate is low at 43%, but this can only account for a drop in registration rates of about 1%. Similarly, low registration of migrants from non-EU countries can only have a small effect upon registration rates as they represent just 2% of the census respondents in the sample.77
More significantly, Table 4.3 shows that the level of completeness of 4.26people born in the UK has decreased by 5% since 2001. Given their prevalence in the sample, this has a greater impact on the overall completeness rate.
Other characteristics associated with large drops in registration rates 4.27tend to be relatively rare: Country of Birth, EU (-19%); Ethnicity, Caribbean (-7%), Indian (-9%), Pakistani (-12%); Religion, Muslim (-7%), none (-8%); Tenure Rent, employer (-7%), Friend/relative (-9%); Occupational group, Caring and Leisure (-7%), Customer services (-7%); Education, level 1 (-9%), level 3 (-7%); Marital Status, widowed (-7%).
ONS concludes that the largest impact on overall levels of completeness 4.28is the fall in levels of registration for UK born persons, particularly the under 35s, with an additional effect coming from the low registration rates of migrants who have been resident in the UK for less than 5 years.
Conclusions As indicated by our previous research in 2011, this analysis confirms 4.29
that non-registration has increased significantly since 2001. The analysis conducted by ONS on the characteristics of the population shows this has mainly been due to lower registration rates amongst people born in the UK.
The deterioration in completeness has been strongly affected by the 4.30lowering registration rate of younger people: completeness of those aged 18-24 decreased by 7% while their prevalence in the sample increased by 4%; of those aged 25-34 by 9% and their presence in the sample increased by 3%.
Immigration from EU and Commonwealth countries also contributed to 4.31this deterioration but their impact is estimated to be around 2-3%.
77 Research conducted by the Migration Observatory at the University of Oxford found the UK population has increased considerably since the late 1990s. It is estimated that between mid-1991 and mid-2012 net migration accounted for just over half (54%) of UK population growth (The Migration Observatory at the University of Oxford, The impact of migration on UK population growth, February 2014). Immigration from EU countries increased considerably from 2004 following the EU enlargement: as a result, non-registration for EU nationals increased from 19% in 2001 to 33% in 2011.
74
5 Accuracy Introduction
This chapter sets out the estimates for accuracy of the electoral registers 5.1in December 2010 (England and Wales) and April 2011 (England and Wales, Scotland).
The chapter also provides an analysis of how the accuracy of the 5.2registers varies across the country. However, only limited analysis can be conducted on the characteristics associated with inaccurate entries. Most inaccurate register entries are for individuals who are no longer resident at an address and cannot therefore be matched to census/Census Coverage Survey (CCS) returns: it is therefore not possible to know the demographics of those individuals.
Measuring accuracy An accurate register entry is defined as one which relates to an eligible 5.3
person, currently resident at the address given on the register. The accuracy rate is therefore the percentage of entries on the registers which are found to relate to an eligible, current resident.
In this project, census responses were used to establish eligibility and 5.4residency and a register entry could only be assessed for accuracy if it could be matched with a census or CCS record. Specifically:
• Residency: the percentage of electoral register records that match to individuals resident at that address (this can be either the main or second address);
• Eligibility: the proportion of register entries that match to individuals eligible to be on the register (based on age and nationality, see paragraph 1.31-1.35).
In Scotland, NRS used country of birth rather than nationality to establish 5.5the eligibility of those on the electoral register. This is likely to underestimate the accuracy of the registers in Scotland as some people may have a UK, Commonwealth or EU passport despite not being born in one of those countries.
In England and Wales, nationality information is not collected in the 5.6CCS and the eligibility of those matched between the CCS and the electoral registers could not therefore be firmly established.
75
England and Wales The measurements of accuracy of the December 2010 registers are 5.7
based on a sample of 43,844 register entries within the selected postcode sample. The sample for the April 2011 is based on 40,008 register records.
These register entries were initially matched to census records within the 5.8sampled postcodes (as a result of their given census address or a previous address falling into those sampled postcodes). Any unmatched register entries after this process were then matched against any other census record that included an alternative address (e.g. a second home) within the sampled postcodes.
Scotland The estimate on accuracy for the April 2011 registers in Scotland is 5.9
based on 61,505 local government register entries and 60,698 entries on the parliamentary registers.
NRS first attempted to match the electoral register to the census: those 5.10who could not be matched were the looked for in the CCS.
Headline findings Figure 6 below shows the accuracy estimates in England and Wales and 5.11
Scotland: these are similar around 90%. However, the approach to measure accuracy was different and the figure for England and Wales is presented in a range.
Although limited analysis by demographics can be conducted, urban 5.12areas in England and Scotland are more likely to have lower level of accuracy.
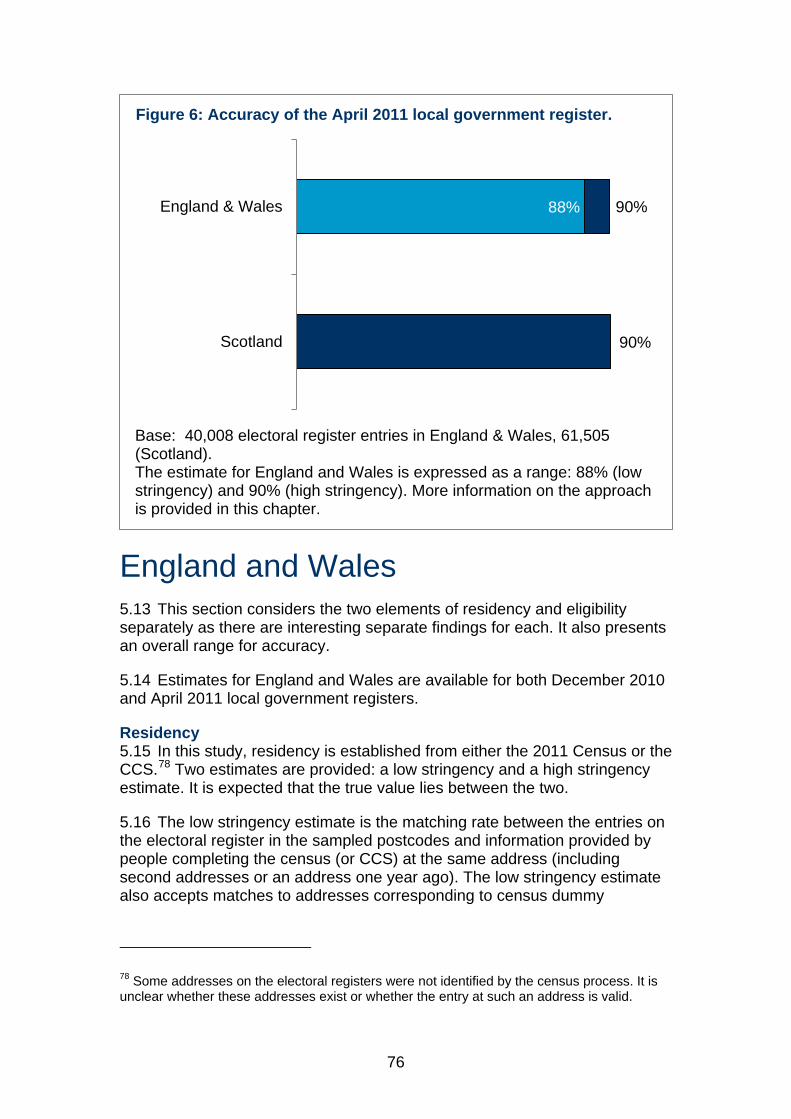
76
England and Wales This section considers the two elements of residency and eligibility 5.13
separately as there are interesting separate findings for each. It also presents an overall range for accuracy.
Estimates for England and Wales are available for both December 2010 5.14and April 2011 local government registers.
Residency In this study, residency is established from either the 2011 Census or the 5.15
CCS.78 Two estimates are provided: a low stringency and a high stringency estimate. It is expected that the true value lies between the two.
The low stringency estimate is the matching rate between the entries on 5.16the electoral register in the sampled postcodes and information provided by people completing the census (or CCS) at the same address (including second addresses or an address one year ago). The low stringency estimate also accepts matches to addresses corresponding to census dummy
78 Some addresses on the electoral registers were not identified by the census process. It is unclear whether these addresses exist or whether the entry at such an address is valid.
88% 90%
90%
England & Wales
Scotland
Figure 6: Accuracy of the April 2011 local government register.
Base: 40,008 electoral register entries in England & Wales, 61,505 (Scotland). The estimate for England and Wales is expressed as a range: 88% (low stringency) and 90% (high stringency). More information on the approach is provided in this chapter.
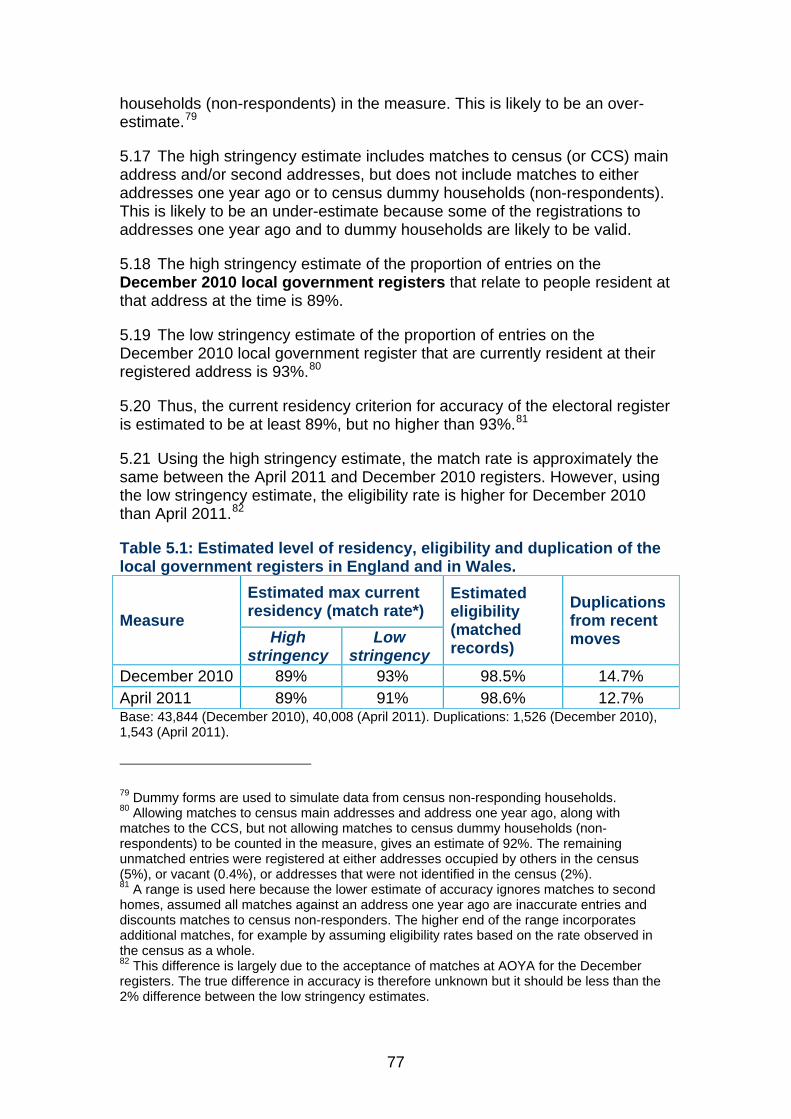
77
households (non-respondents) in the measure. This is likely to be an over-estimate.79
The high stringency estimate includes matches to census (or CCS) main 5.17address and/or second addresses, but does not include matches to either addresses one year ago or to census dummy households (non-respondents). This is likely to be an under-estimate because some of the registrations to addresses one year ago and to dummy households are likely to be valid.
The high stringency estimate of the proportion of entries on the 5.18December 2010 local government registers that relate to people resident at that address at the time is 89%.
The low stringency estimate of the proportion of entries on the 5.19December 2010 local government register that are currently resident at their registered address is 93%.80
Thus, the current residency criterion for accuracy of the electoral register 5.20is estimated to be at least 89%, but no higher than 93%.81
Using the high stringency estimate, the match rate is approximately the 5.21same between the April 2011 and December 2010 registers. However, using the low stringency estimate, the eligibility rate is higher for December 2010 than April 2011.82
Table 5.1: Estimated level of residency, eligibility and duplication of the local government registers in England and in Wales.
Measure
Estimated max current residency (match rate*)
Estimated eligibility (matched records)
Duplications from recent moves High
stringency Low
stringency December 2010 89% 93% 98.5% 14.7% April 2011 89% 91% 98.6% 12.7% Base: 43,844 (December 2010), 40,008 (April 2011). Duplications: 1,526 (December 2010), 1,543 (April 2011).
79 Dummy forms are used to simulate data from census non-responding households. 80 Allowing matches to census main addresses and address one year ago, along with matches to the CCS, but not allowing matches to census dummy households (non-respondents) to be counted in the measure, gives an estimate of 92%. The remaining unmatched entries were registered at either addresses occupied by others in the census (5%), or vacant (0.4%), or addresses that were not identified in the census (2%). 81 A range is used here because the lower estimate of accuracy ignores matches to second homes, assumed all matches against an address one year ago are inaccurate entries and discounts matches to census non-responders. The higher end of the range incorporates additional matches, for example by assuming eligibility rates based on the rate observed in the census as a whole. 82 This difference is largely due to the acceptance of matches at AOYA for the December registers. The true difference in accuracy is therefore unknown but it should be less than the 2% difference between the low stringency estimates.
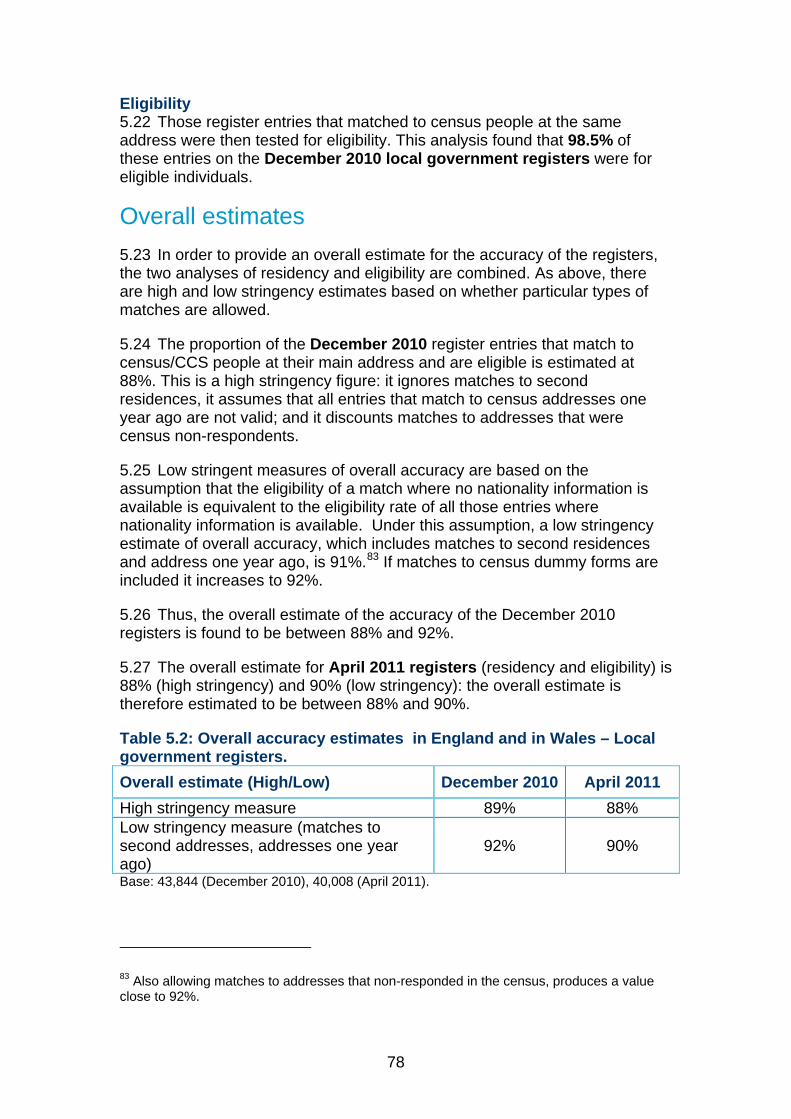
78
Eligibility Those register entries that matched to census people at the same 5.22
address were then tested for eligibility. This analysis found that 98.5% of these entries on the December 2010 local government registers were for eligible individuals.
Overall estimates In order to provide an overall estimate for the accuracy of the registers, 5.23
the two analyses of residency and eligibility are combined. As above, there are high and low stringency estimates based on whether particular types of matches are allowed.
The proportion of the December 2010 register entries that match to 5.24census/CCS people at their main address and are eligible is estimated at 88%. This is a high stringency figure: it ignores matches to second residences, it assumes that all entries that match to census addresses one year ago are not valid; and it discounts matches to addresses that were census non-respondents.
Low stringent measures of overall accuracy are based on the 5.25assumption that the eligibility of a match where no nationality information is available is equivalent to the eligibility rate of all those entries where nationality information is available. Under this assumption, a low stringency estimate of overall accuracy, which includes matches to second residences and address one year ago, is 91%.83 If matches to census dummy forms are included it increases to 92%.
Thus, the overall estimate of the accuracy of the December 2010 5.26registers is found to be between 88% and 92%.
The overall estimate for April 2011 registers (residency and eligibility) is 5.2788% (high stringency) and 90% (low stringency): the overall estimate is therefore estimated to be between 88% and 90%.
Table 5.2: Overall accuracy estimates in England and in Wales – Local government registers. Overall estimate (High/Low) December 2010 April 2011 High stringency measure 89% 88% Low stringency measure (matches to second addresses, addresses one year ago)
92% 90%
Base: 43,844 (December 2010), 40,008 (April 2011).
83 Also allowing matches to addresses that non-responded in the census, produces a value close to 92%.
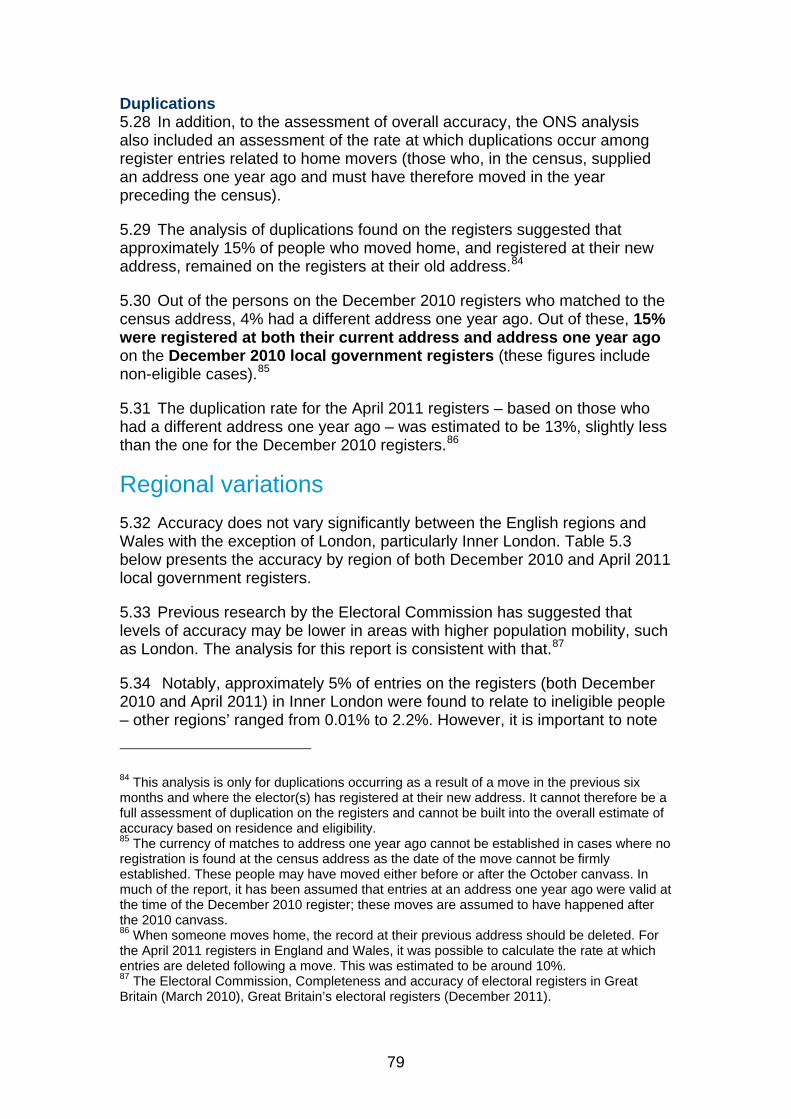
79
Duplications In addition, to the assessment of overall accuracy, the ONS analysis 5.28
also included an assessment of the rate at which duplications occur among register entries related to home movers (those who, in the census, supplied an address one year ago and must have therefore moved in the year preceding the census).
The analysis of duplications found on the registers suggested that 5.29approximately 15% of people who moved home, and registered at their new address, remained on the registers at their old address.84
Out of the persons on the December 2010 registers who matched to the 5.30census address, 4% had a different address one year ago. Out of these, 15% were registered at both their current address and address one year ago on the December 2010 local government registers (these figures include non-eligible cases).85
The duplication rate for the April 2011 registers – based on those who 5.31had a different address one year ago – was estimated to be 13%, slightly less than the one for the December 2010 registers.86
Regional variations Accuracy does not vary significantly between the English regions and 5.32
Wales with the exception of London, particularly Inner London. Table 5.3 below presents the accuracy by region of both December 2010 and April 2011 local government registers.
Previous research by the Electoral Commission has suggested that 5.33levels of accuracy may be lower in areas with higher population mobility, such as London. The analysis for this report is consistent with that.87
Notably, approximately 5% of entries on the registers (both December 5.342010 and April 2011) in Inner London were found to relate to ineligible people – other regions’ ranged from 0.01% to 2.2%. However, it is important to note
84 This analysis is only for duplications occurring as a result of a move in the previous six months and where the elector(s) has registered at their new address. It cannot therefore be a full assessment of duplication on the registers and cannot be built into the overall estimate of accuracy based on residence and eligibility. 85 The currency of matches to address one year ago cannot be established in cases where no registration is found at the census address as the date of the move cannot be firmly established. These people may have moved either before or after the October canvass. In much of the report, it has been assumed that entries at an address one year ago were valid at the time of the December 2010 register; these moves are assumed to have happened after the 2010 canvass. 86 When someone moves home, the record at their previous address should be deleted. For the April 2011 registers in England and Wales, it was possible to calculate the rate at which entries are deleted following a move. This was estimated to be around 10%. 87 The Electoral Commission, Completeness and accuracy of electoral registers in Great Britain (March 2010), Great Britain’s electoral registers (December 2011).

80
that, proportionate to the total number of people in the population with an ineligible nationality, there were no more ineligible entries in London than elsewhere. In fact the rate at which people with an ineligible nationality are found on the registers is slightly lower in London than it is elsewhere.
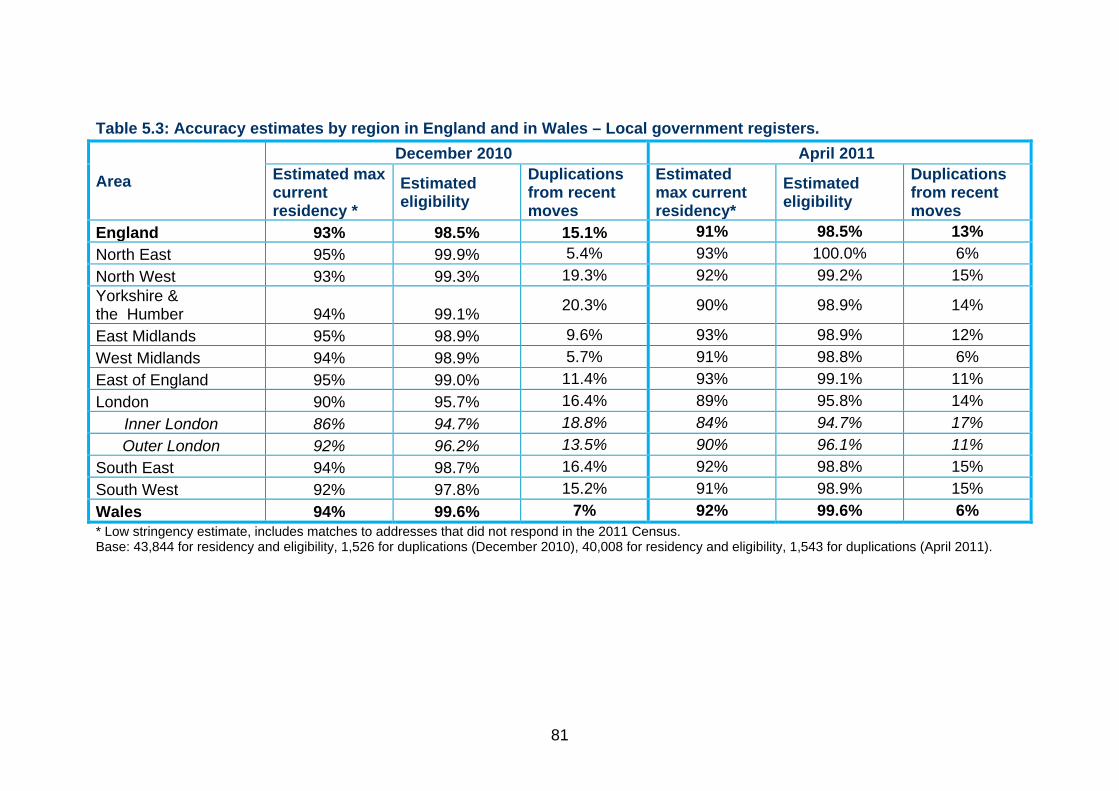
81
Table 5.3: Accuracy estimates by region in England and in Wales – Local government registers.
* Low stringency estimate, includes matches to addresses that did not respond in the 2011 Census. Base: 43,844 for residency and eligibility, 1,526 for duplications (December 2010), 40,008 for residency and eligibility, 1,543 for duplications (April 2011).
Area
December 2010 April 2011 Estimated max current residency *
Estimated eligibility
Duplications from recent moves
Estimated max current residency*
Estimated eligibility
Duplications from recent moves
England 93% 98.5% 15.1% 91% 98.5% 13% North East 95% 99.9% 5.4% 93% 100.0% 6% North West 93% 99.3% 19.3% 92% 99.2% 15% Yorkshire & the Humber 94% 99.1% 20.3% 90% 98.9% 14%
East Midlands 95% 98.9% 9.6% 93% 98.9% 12% West Midlands 94% 98.9% 5.7% 91% 98.8% 6% East of England 95% 99.0% 11.4% 93% 99.1% 11% London 90% 95.7% 16.4% 89% 95.8% 14%
Inner London 86% 94.7% 18.8% 84% 94.7% 17% Outer London 92% 96.2% 13.5% 90% 96.1% 11%
South East 94% 98.7% 16.4% 92% 98.8% 15% South West 92% 97.8% 15.2% 91% 98.9% 15% Wales 94% 99.6% 7% 92% 99.6% 6%
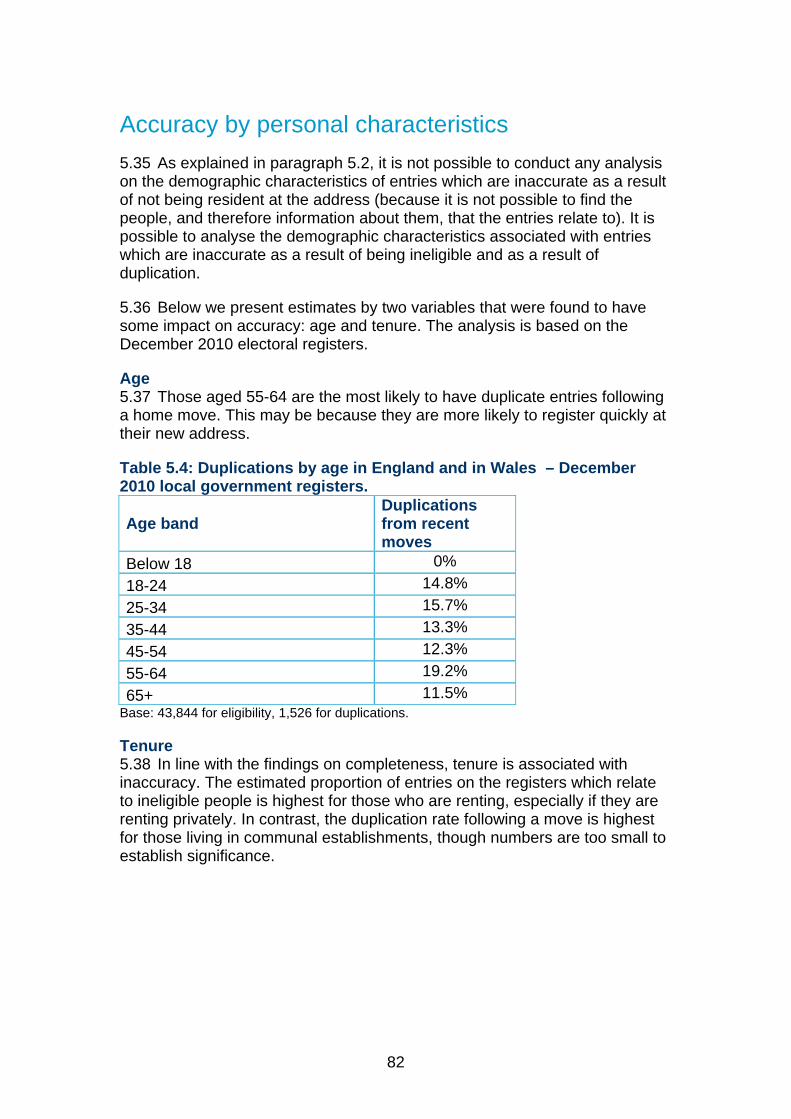
82
Accuracy by personal characteristics As explained in paragraph 5.2, it is not possible to conduct any analysis 5.35
on the demographic characteristics of entries which are inaccurate as a result of not being resident at the address (because it is not possible to find the people, and therefore information about them, that the entries relate to). It is possible to analyse the demographic characteristics associated with entries which are inaccurate as a result of being ineligible and as a result of duplication.
Below we present estimates by two variables that were found to have 5.36some impact on accuracy: age and tenure. The analysis is based on the December 2010 electoral registers.
Age Those aged 55-64 are the most likely to have duplicate entries following 5.37
a home move. This may be because they are more likely to register quickly at their new address.
Table 5.4: Duplications by age in England and in Wales – December 2010 local government registers.
Age band Duplications from recent moves
Below 18 0% 18-24 14.8% 25-34 15.7% 35-44 13.3% 45-54 12.3% 55-64 19.2% 65+ 11.5%
Base: 43,844 for eligibility, 1,526 for duplications.
Tenure In line with the findings on completeness, tenure is associated with 5.38
inaccuracy. The estimated proportion of entries on the registers which relate to ineligible people is highest for those who are renting, especially if they are renting privately. In contrast, the duplication rate following a move is highest for those living in communal establishments, though numbers are too small to establish significance.
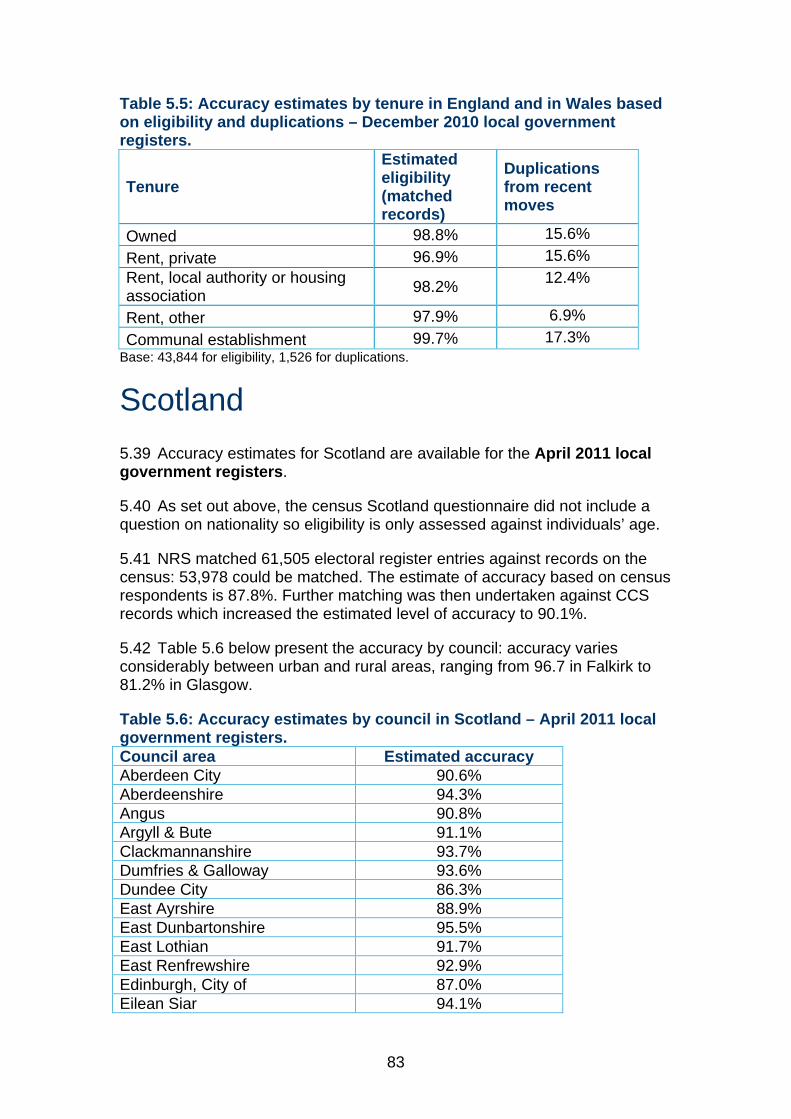
83
Table 5.5: Accuracy estimates by tenure in England and in Wales based on eligibility and duplications – December 2010 local government registers.
Tenure Estimated eligibility (matched records)
Duplications from recent moves
Owned 98.8% 15.6% Rent, private 96.9% 15.6% Rent, local authority or housing association 98.2% 12.4%
Rent, other 97.9% 6.9% Communal establishment 99.7% 17.3%
Base: 43,844 for eligibility, 1,526 for duplications.
Scotland Accuracy estimates for Scotland are available for the April 2011 local 5.39
government registers.
As set out above, the census Scotland questionnaire did not include a 5.40question on nationality so eligibility is only assessed against individuals’ age.
NRS matched 61,505 electoral register entries against records on the 5.41census: 53,978 could be matched. The estimate of accuracy based on census respondents is 87.8%. Further matching was then undertaken against CCS records which increased the estimated level of accuracy to 90.1%.
Table 5.6 below present the accuracy by council: accuracy varies 5.42considerably between urban and rural areas, ranging from 96.7 in Falkirk to 81.2% in Glasgow.
Table 5.6: Accuracy estimates by council in Scotland – April 2011 local government registers. Council area Estimated accuracy Aberdeen City 90.6% Aberdeenshire 94.3% Angus 90.8% Argyll & Bute 91.1% Clackmannanshire 93.7% Dumfries & Galloway 93.6% Dundee City 86.3% East Ayrshire 88.9% East Dunbartonshire 95.5% East Lothian 91.7% East Renfrewshire 92.9% Edinburgh, City of 87.0% Eilean Siar 94.1%
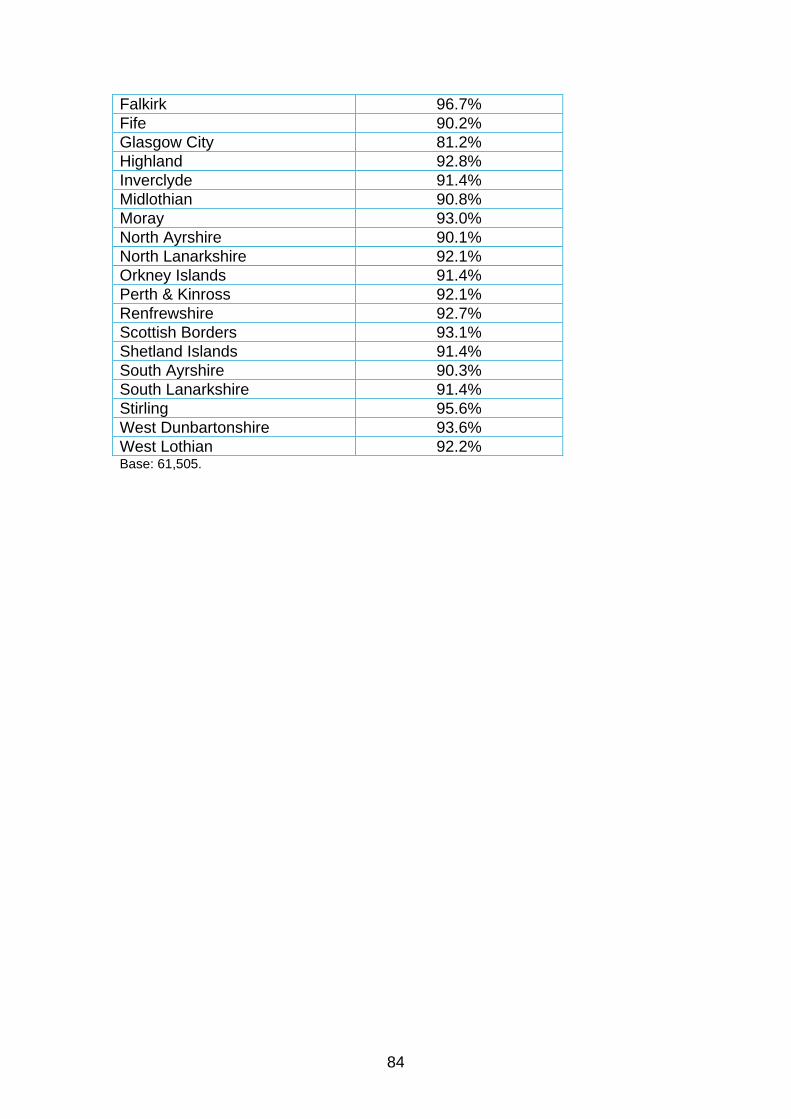
84
Falkirk 96.7% Fife 90.2% Glasgow City 81.2% Highland 92.8% Inverclyde 91.4% Midlothian 90.8% Moray 93.0% North Ayrshire 90.1% North Lanarkshire 92.1% Orkney Islands 91.4% Perth & Kinross 92.1% Renfrewshire 92.7% Scottish Borders 93.1% Shetland Islands 91.4% South Ayrshire 90.3% South Lanarkshire 91.4% Stirling 95.6% West Dunbartonshire 93.6% West Lothian 92.2% Base: 61,505.
85
6 Conclusions Introduction
This research has reported on the accuracy and completeness of the 6.1parliamentary and local government electoral registers in England and in Wales (for December 2010 and April 2011) and in Scotland (for April 2011).
The census provides an important opportunity to assess, in detail, the 6.2demographic and other factors associated with under-registration under the household system. It is not possible to cost-effectively report in this level of detail without census data as the Commission’s alternative approach to registration research is based on a house to house survey of a sample of addresses. Using that approach, the size of the sample required for detailed reporting is prohibitively expensive. This publication is also timely as an assessment of the registers under household registration as the transition to individual electoral registration is beginning.
The sections below summarise the key findings from the research with 6.3regards to completeness, accuracy and methodology.
Completeness The findings in England and Wales shows that the completeness of the 6.4
local government and parliamentary registers was 84.9% and 85.6% respectively in December 2010 and 83.2% and 84.2% respectively by the 1 April 2011.
These estimates confirmed that non-registration has increased 6.5significantly over the last ten years in England and in Wales: from 8-9% in 2001 to 14-17% in 2011.
Completeness in Scotland was found to be slightly higher than in 6.6England and Wales at 86-88% (the range of completeness between the local government and parliamentary registers).88 Separate estimates for Scotland from previous research using census data are not available so a comparison cannot be made.
The findings presented in this study have broadly confirmed the results 6.7of previous Electoral Commission research into the accuracy and completeness of the electoral registers. Our most recent, previous study was conducted on the same registers – December 2010 and April 2011 as were
88 Estimates for completeness in Scotland have not adjusted for census non-response which is likely to have lowered the estimates.
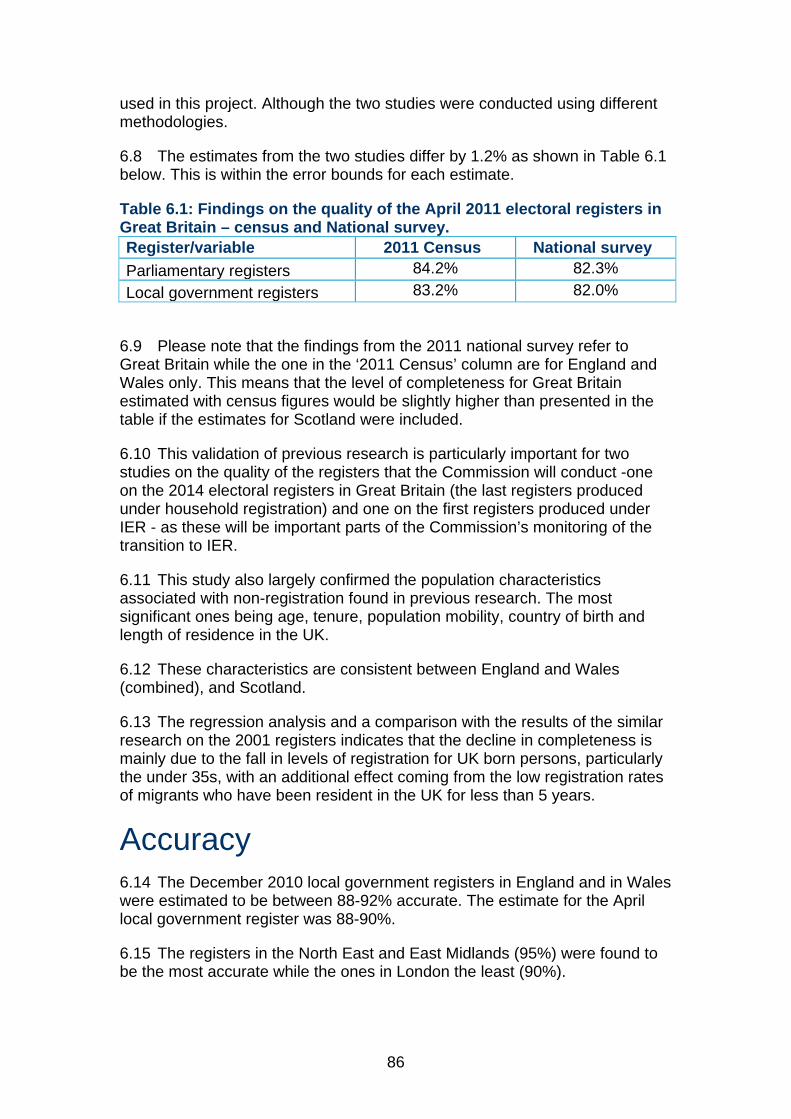
86
used in this project. Although the two studies were conducted using different methodologies.
The estimates from the two studies differ by 1.2% as shown in Table 6.1 6.8below. This is within the error bounds for each estimate.
Table 6.1: Findings on the quality of the April 2011 electoral registers in Great Britain – census and National survey. Register/variable 2011 Census National survey Parliamentary registers 84.2% 82.3% Local government registers 83.2% 82.0%
Please note that the findings from the 2011 national survey refer to 6.9Great Britain while the one in the ‘2011 Census’ column are for England and Wales only. This means that the level of completeness for Great Britain estimated with census figures would be slightly higher than presented in the table if the estimates for Scotland were included.
This validation of previous research is particularly important for two 6.10studies on the quality of the registers that the Commission will conduct -one on the 2014 electoral registers in Great Britain (the last registers produced under household registration) and one on the first registers produced under IER - as these will be important parts of the Commission’s monitoring of the transition to IER.
This study also largely confirmed the population characteristics 6.11associated with non-registration found in previous research. The most significant ones being age, tenure, population mobility, country of birth and length of residence in the UK.
These characteristics are consistent between England and Wales 6.12(combined), and Scotland.
The regression analysis and a comparison with the results of the similar 6.13research on the 2001 registers indicates that the decline in completeness is mainly due to the fall in levels of registration for UK born persons, particularly the under 35s, with an additional effect coming from the low registration rates of migrants who have been resident in the UK for less than 5 years.
Accuracy The December 2010 local government registers in England and in Wales 6.14
were estimated to be between 88-92% accurate. The estimate for the April local government register was 88-90%.
The registers in the North East and East Midlands (95%) were found to 6.15be the most accurate while the ones in London the least (90%).
87
The April 2011 local government registers in Scotland was found to be 6.1690.1% accurate. Accuracy varies considerably by council, ranging from 96.7% in Falkirk to 81.2% in Glasgow. This supports previous research findings that the registers are less accurate in densely populated areas and those with high population mobility.
Again, these findings are similar to those of our previous study on the 6.17same registers. In that case the accuracy estimate for the April 2011 registers for Great Britain as a whole was 85%.
An analysis of accuracy was not conducted with the 2001 Census data. 6.18The last reliable assessment of accuracy was published in 1981 and found that between 10.4%–13.5% of the names on the April 1981 registers belonged to people who, by that time, were not living at the address listed in the registers.
There has therefore been a decline in levels of accuracy on the registers 6.19since the early-1980s but it is a relatively small decline compared to that recorded for completeness.
88
Appendix A: Methodology Calculating accuracy and completeness A.1 The study was based on a comparison between the electoral registers at two points in time, December 2010 (England and Wales) and April 2011 (England, Wales and Scotland) and the 2011 Census data. Overall estimates also include individuals capture through the Census Coverage Survey (CCS).
A.2 The aim of the research was to assess the quality of the electoral registers. This is based on two measures: accuracy and completeness.
A.3 By completeness we mean that ‘every person who is entitled to have an entry in an electoral register is registered’.
A.4 Completeness is calculated using the total number of eligible individuals as denominator, while the numerator is the number of electoral register entries that match eligible individuals at their current address. The completeness of the register is therefore the percentage of eligible people who are registered at their current address.
A.5 To include census non-respondents in the base for completeness, some estimates presented in this report are based on Dual System Estimation methodology (DSE) which combines census and Census Coverage Survey to produce an overall estimate of the size of the population.
A.6 By accuracy we mean that ‘there are no false entries on the electoral registers’. Our definition of accuracy excludes minor errors, such as the misspelling of an elector’s name, which would not prevent an eligible elector from being able to cast a vote.
A.7 Accuracy is calculated used the total number of electoral register entries (denominator); the numerator is the number of individuals who are eligible and match a register record at their current address. The accuracy of the electoral registers is the percentage of register entries that match eligible voters resident at that address.
England and Wales A.8 The study for England and Wales was conducted for the Electoral Commission by the Office for National Statistics (ONS).

89
December 2010 electoral registers Sample Selection A.9 Usable data were provided by 342 out of the 348 Electoral Registration Officers (EROs) in England and Wales. The six authorities for register data could not be used were: Walsall, Luton, Medway, Three Rivers, Lincoln and Daventry. Moreover, two registers appeared to be incomplete (missing postcodes) - Redcar and Cleveland and North Warwickshire – and the entire sample within these two areas was also excluded. Analytical work at ONS suggests that these exclusions have little effect on the reliability of the findings.
A.10 The study was therefore conducted on a sample of 1079 postcodes in 340 local authorities. Postcodes were selected from the population of postcodes in which the Census Coverage Survey (CCS) was conducted. This is used in order to allow estimation of electoral registration rates for those people who did not complete their census questionnaire.
A.11 The CCS was stratified by the hard to count (HTC) categorisation which classifies areas from 1 to 5 according to the expected difficulty of enumeration in the 2011 Census. The sample of postcodes for analysis was selected at random within each of the five HTC categories under the assumption that electoral registration would be correlated with census non-response. Such a correlation is indicated from previous studies. This approached allowed over sampling of areas where registration rates are expected to be lowest.
Table A1: Sample size of census respondents and register entries in England and Wales – December 2010 registers.
December 2010 electoral registers
Census eligible records
(completeness)
Register records
(accuracy) CCS records
Parliamentary 40,878 Not assessed 3,340
Local government 43,237 43,844
Timing difference: December 2010 register A.12 The approach taken to overcome the timing difference between the December 2010 registers (compiled in October) and the March 2011 Census was to accept all cases with an address one year ago and treat all matches to the address one year ago as valid. This assumes that all cases that match to address one year ago are the result of moves that occurred after October 2010. As some of the cases that match the electoral register at their address one year ago but not at their census address will have moved before the October canvass, and will therefore not be valid, the estimates may be a slight over-estimate of completeness.
A.13 There were 3,918 individuals in the sample of census respondents who reported having a different address one year ago.
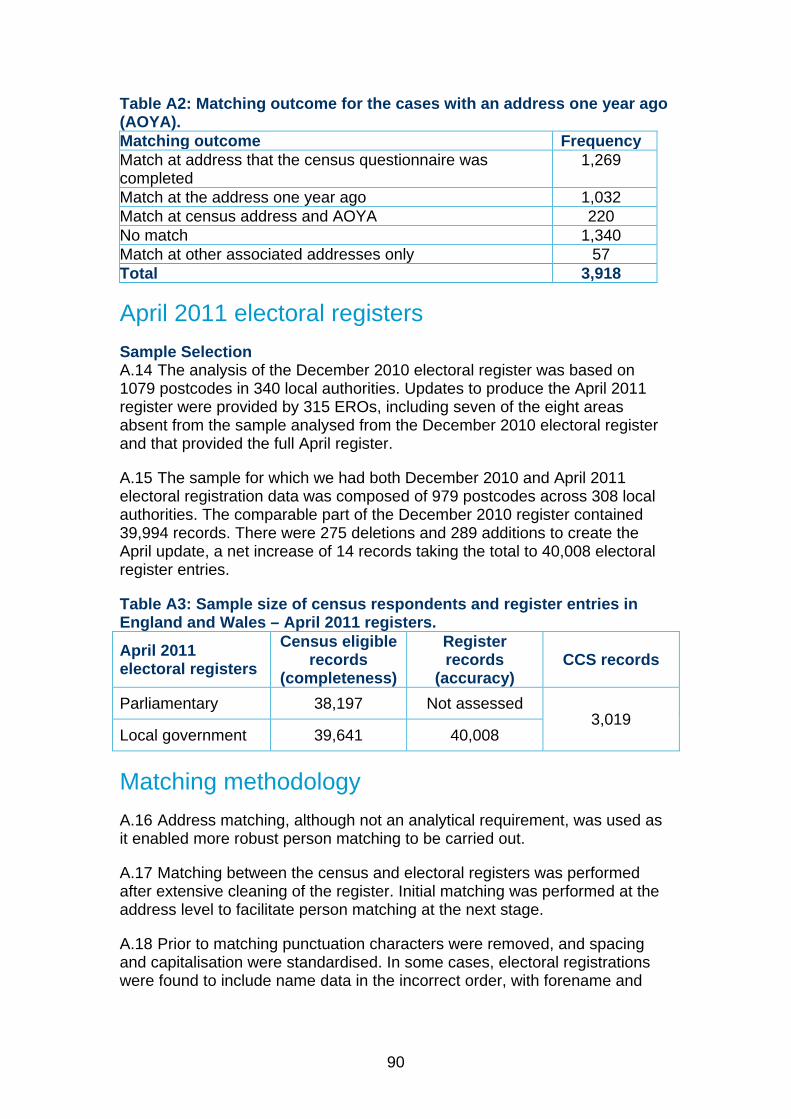
90
Table A2: Matching outcome for the cases with an address one year ago (AOYA). Matching outcome Frequency Match at address that the census questionnaire was completed
1,269
Match at the address one year ago 1,032 Match at census address and AOYA 220 No match 1,340 Match at other associated addresses only 57 Total 3,918
April 2011 electoral registers Sample Selection A.14 The analysis of the December 2010 electoral register was based on 1079 postcodes in 340 local authorities. Updates to produce the April 2011 register were provided by 315 EROs, including seven of the eight areas absent from the sample analysed from the December 2010 electoral register and that provided the full April register.
A.15 The sample for which we had both December 2010 and April 2011 electoral registration data was composed of 979 postcodes across 308 local authorities. The comparable part of the December 2010 register contained 39,994 records. There were 275 deletions and 289 additions to create the April update, a net increase of 14 records taking the total to 40,008 electoral register entries.
Table A3: Sample size of census respondents and register entries in England and Wales – April 2011 registers.
April 2011 electoral registers
Census eligible records
(completeness)
Register records
(accuracy) CCS records
Parliamentary 38,197 Not assessed 3,019
Local government 39,641 40,008
Matching methodology A.16 Address matching, although not an analytical requirement, was used as it enabled more robust person matching to be carried out.
A.17 Matching between the census and electoral registers was performed after extensive cleaning of the register. Initial matching was performed at the address level to facilitate person matching at the next stage.
A.18 Prior to matching punctuation characters were removed, and spacing and capitalisation were standardised. In some cases, electoral registrations were found to include name data in the incorrect order, with forename and
91
surnames swapped around. The matching routines included the option to match these in any order.
A.19 All matching exercises were carried out by postcode. The process followed was exact matching, with any residuals candidate matched through scoring based on a Term Frequency, Inverse Document Frequency (TF, IDF) algorithm and resolved clerically. Scanned images of completed census forms were available to assist the clerical matching team.
A.20 Clerical matching was favoured over automatic methods due to the greater degree of accuracy it provides. An expert matcher reviewed a 5% sample of cases.
A.21 Stage 1 was matching of addresses within postcodes. Stage 2 involved person matching within address matches. Stage 3 attempted to match person records in unmatched addresses within postcodes.
A.22 Additional matching to associated addresses. The 2011 Census also collected information on respondent’s second residence and usual address year one year ago (AOYA). Where this information existed for sampled census records matching was also carried out to the electoral registers at these alternative addresses. As the completeness of the address data for second residences and AOYAs was not as high as the main census, address matching was not used for these. Candidate pairs were produced using the following criteria: Postcode exact match and first letter of forename or first letter of surname.
A.23 The restriction on one matching inital was made to keep clerical resolution sets at a reasonable size while maximising match rates. As with previous sets, resolution files were double blinded and checked by an expert matcher.
A.24 A multi-stage matching strategy was employed to match people on the electoral register and in the 2011 Census together. There are two residuals. Unmatched people from the 2011 Census represent potential under-coverage of the electoral register. Unmatched people from the electoral register could either be census non-respondents or be representative of inaccurate entries on the register.
A.25 Primary matching was performed using the Census addresses (where the census questionnaire was completed) with the selected sample of postcodes. Additional matching was performed at associated addresses: second addresses and addresses one year ago that may be outside of the selected postcodes. This matching was used to analyse the completeness of the registers.
A.26 A secondary matching exercise relating to the accuracy of the electoral registers was also performed. The residual electoral registers that did not match census records in the selected postcodes were matched against census records whose associated addresses were in the selected postcodes.
92
Nationality/eligibility A.27 The sample included persons whose information on nationality was not provided in the census and therefore unknown. In this study, persons with missing nationality data are assumed to be citizens of the UK or Commonwealth country and therefore eligible to be on both the local government and parliamentary registers. Not all of these persons will actually have an eligible nationality causing a slight under estimation of completeness rates and over estimation of eligibility and accuracy.
Estimation A.28 Weighted estimates are shown to reflect the different selection probabilities in the sample. The estimated variance also accounted for selection weights and was calculated with ‘proc surveymeans’ in SAS, which uses Taylor approximations to estimate the variance. Estimation of total registration rates was based on the Duel System Estimation methodology (DSE) to estimate registration rates adjusting for census non-response. The variance associated with a DSE estimate is not easily calculated analytically, so bootstrap sampling was used. This involves sampling with replacement from the original sample of postcodes, then calculating the DSE estimate for each bootstrap. The variance in the obtained bootstrap sample is expected to be similar to that obtained analytically.
A.29 Postcodes were assigned a weight based on their probability of selection in the final sample and these weights used in estimation. These weighted estimates therefore provide measures representative of the population in the 340 local authorities in the sample for the December 2010 registers and 308 authorities for the April 2011 registers.
A.30 As the sampling methodology over-sampled HTC-5 areas relative to HTC-1 areas, it is expected that the un-weighted estimates of accuracy and completeness would tend to be lower than the weighted estimates. Variance estimation also accounted for the sampling weights and were calculated using ‘proc surveymeans’ in SAS.
A.31 Some initial investigation demonstrated that this methodology produced estimates very similar to Jack-knife based estimates of variance. Confidence intervals were constructed as simple symmetric estimates assuming the t distribution. For a comparison across a particular variable, we can call two estimates statistically distinct if their 95% confidence intervals do not overlap.
A.32 As any postcode which was found to have no electoral registration data was excluded from the analysis, estimated registration rates may be lower than actual if there are postcodes from which there was genuinely no electoral registration.
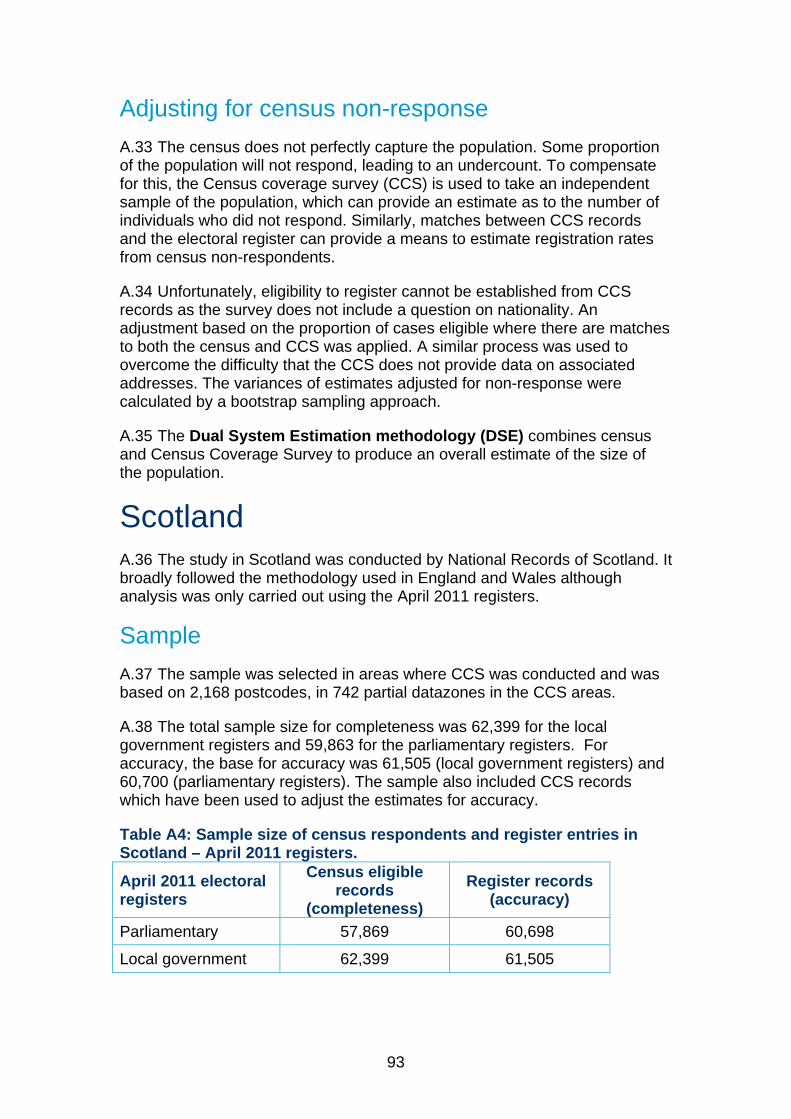
93
Adjusting for census non-response A.33 The census does not perfectly capture the population. Some proportion of the population will not respond, leading to an undercount. To compensate for this, the Census coverage survey (CCS) is used to take an independent sample of the population, which can provide an estimate as to the number of individuals who did not respond. Similarly, matches between CCS records and the electoral register can provide a means to estimate registration rates from census non-respondents.
A.34 Unfortunately, eligibility to register cannot be established from CCS records as the survey does not include a question on nationality. An adjustment based on the proportion of cases eligible where there are matches to both the census and CCS was applied. A similar process was used to overcome the difficulty that the CCS does not provide data on associated addresses. The variances of estimates adjusted for non-response were calculated by a bootstrap sampling approach.
A.35 The Dual System Estimation methodology (DSE) combines census and Census Coverage Survey to produce an overall estimate of the size of the population.
Scotland A.36 The study in Scotland was conducted by National Records of Scotland. It broadly followed the methodology used in England and Wales although analysis was only carried out using the April 2011 registers.
Sample A.37 The sample was selected in areas where CCS was conducted and was based on 2,168 postcodes, in 742 partial datazones in the CCS areas.
A.38 The total sample size for completeness was 62,399 for the local government registers and 59,863 for the parliamentary registers. For accuracy, the base for accuracy was 61,505 (local government registers) and 60,700 (parliamentary registers). The sample also included CCS records which have been used to adjust the estimates for accuracy.
Table A4: Sample size of census respondents and register entries in Scotland – April 2011 registers.
April 2011 electoral registers
Census eligible records
(completeness) Register records
(accuracy)
Parliamentary 57,869 60,698
Local government 62,399 61,505

94
Matching Methodology A.39 Data provided by the 15 EROs were processed and cleaned before matching could be conducted.
A.40 The match was conducted through automatic matching techniques and clerical inspection and research. The match incorporated a degree of flexibility – to permit matches where spelling, transcription and scanning errors were present, but all matching decisions were fully supported by evidence. In essence, the match was fully reliable, controlled and accurate.
Nationality/Eligibility A.41 In Scotland, NRS used the census question on country of birth to determine the eligibility of an individual. This is an approximation as some of these individuals may have or have gained UK citizenship (or citizenship of another eligible country).
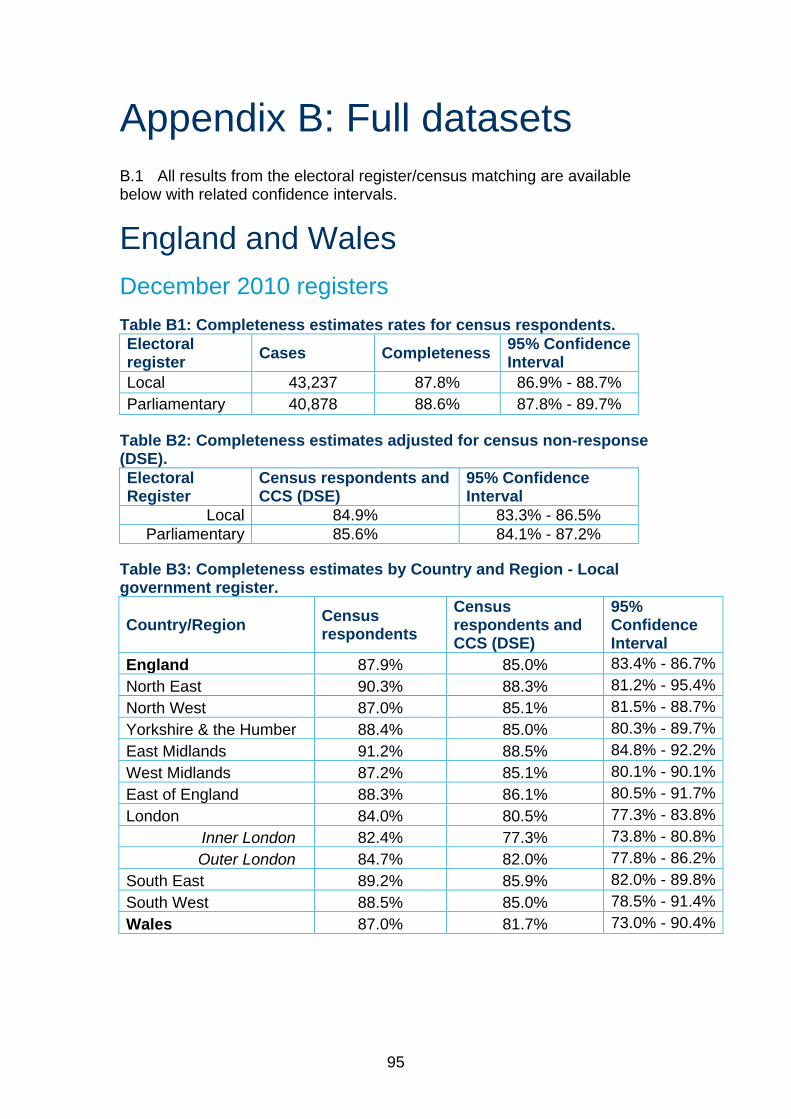
95
Appendix B: Full datasets B.1 All results from the electoral register/census matching are available below with related confidence intervals.
England and Wales December 2010 registers Table B1: Completeness estimates rates for census respondents. Electoral register Cases Completeness 95% Confidence
Interval Local 43,237 87.8% 86.9% - 88.7% Parliamentary 40,878 88.6% 87.8% - 89.7%
Table B2: Completeness estimates adjusted for census non-response (DSE). Electoral Register
Census respondents and CCS (DSE)
95% Confidence Interval
Local 84.9% 83.3% - 86.5% Parliamentary 85.6% 84.1% - 87.2%
Table B3: Completeness estimates by Country and Region - Local government register.
Country/Region Census respondents
Census respondents and CCS (DSE)
95% Confidence Interval
England 87.9% 85.0% 83.4% - 86.7% North East 90.3% 88.3% 81.2% - 95.4% North West 87.0% 85.1% 81.5% - 88.7% Yorkshire & the Humber 88.4% 85.0% 80.3% - 89.7% East Midlands 91.2% 88.5% 84.8% - 92.2% West Midlands 87.2% 85.1% 80.1% - 90.1% East of England 88.3% 86.1% 80.5% - 91.7% London 84.0% 80.5% 77.3% - 83.8%
Inner London 82.4% 77.3% 73.8% - 80.8% Outer London 84.7% 82.0% 77.8% - 86.2%
South East 89.2% 85.9% 82.0% - 89.8% South West 88.5% 85.0% 78.5% - 91.4% Wales 87.0% 81.7% 73.0% - 90.4%
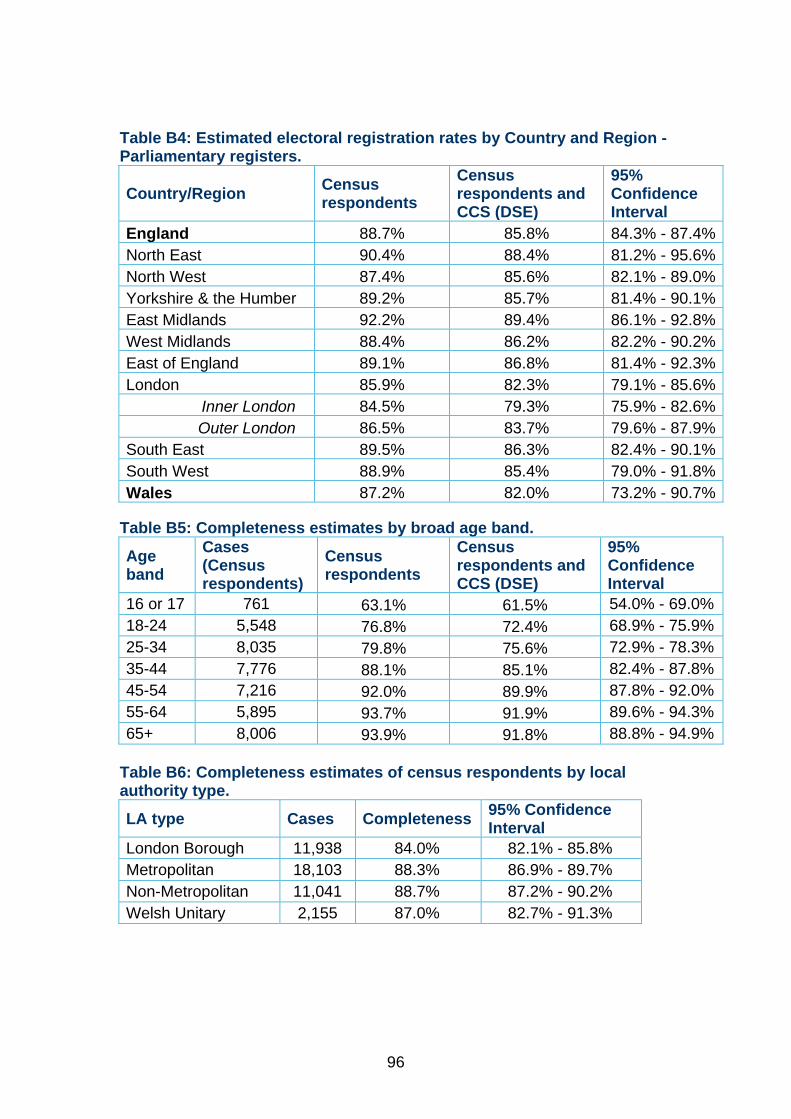
96
Table B4: Estimated electoral registration rates by Country and Region - Parliamentary registers.
Country/Region Census respondents
Census respondents and CCS (DSE)
95% Confidence Interval
England 88.7% 85.8% 84.3% - 87.4% North East 90.4% 88.4% 81.2% - 95.6% North West 87.4% 85.6% 82.1% - 89.0% Yorkshire & the Humber 89.2% 85.7% 81.4% - 90.1% East Midlands 92.2% 89.4% 86.1% - 92.8% West Midlands 88.4% 86.2% 82.2% - 90.2% East of England 89.1% 86.8% 81.4% - 92.3% London 85.9% 82.3% 79.1% - 85.6%
Inner London 84.5% 79.3% 75.9% - 82.6% Outer London 86.5% 83.7% 79.6% - 87.9%
South East 89.5% 86.3% 82.4% - 90.1% South West 88.9% 85.4% 79.0% - 91.8% Wales 87.2% 82.0% 73.2% - 90.7%
Table B5: Completeness estimates by broad age band.
Age band
Cases (Census respondents)
Census respondents
Census respondents and CCS (DSE)
95% Confidence Interval
16 or 17 761 63.1% 61.5% 54.0% - 69.0% 18-24 5,548 76.8% 72.4% 68.9% - 75.9% 25-34 8,035 79.8% 75.6% 72.9% - 78.3% 35-44 7,776 88.1% 85.1% 82.4% - 87.8% 45-54 7,216 92.0% 89.9% 87.8% - 92.0% 55-64 5,895 93.7% 91.9% 89.6% - 94.3% 65+ 8,006 93.9% 91.8% 88.8% - 94.9%
Table B6: Completeness estimates of census respondents by local authority type.
LA type Cases Completeness 95% Confidence Interval
London Borough 11,938 84.0% 82.1% - 85.8% Metropolitan 18,103 88.3% 86.9% - 89.7% Non-Metropolitan 11,041 88.7% 87.2% - 90.2% Welsh Unitary 2,155 87.0% 82.7% - 91.3%
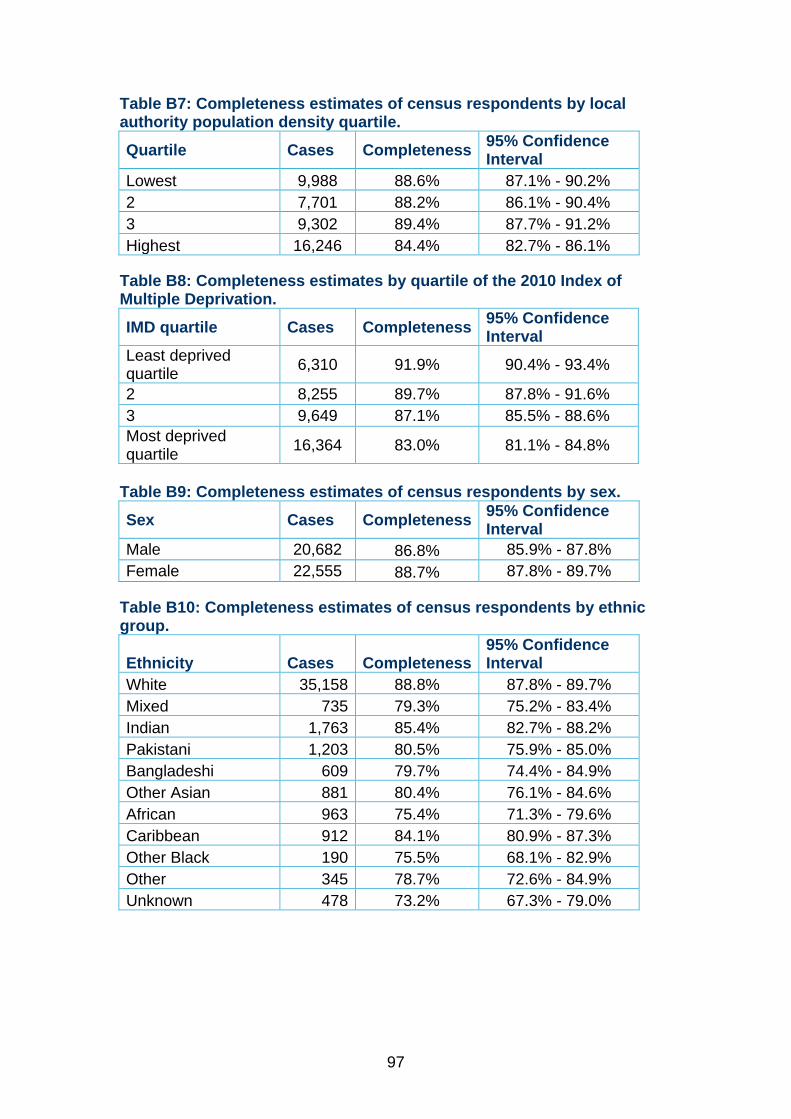
97
Table B7: Completeness estimates of census respondents by local authority population density quartile.
Quartile Cases Completeness 95% Confidence Interval
Lowest 9,988 88.6% 87.1% - 90.2% 2 7,701 88.2% 86.1% - 90.4% 3 9,302 89.4% 87.7% - 91.2% Highest 16,246 84.4% 82.7% - 86.1%
Table B8: Completeness estimates by quartile of the 2010 Index of Multiple Deprivation.
IMD quartile Cases Completeness 95% Confidence Interval
Least deprived quartile 6,310 91.9% 90.4% - 93.4%
2 8,255 89.7% 87.8% - 91.6% 3 9,649 87.1% 85.5% - 88.6% Most deprived quartile 16,364 83.0% 81.1% - 84.8%
Table B9: Completeness estimates of census respondents by sex.
Sex Cases Completeness 95% Confidence Interval
Male 20,682 86.8% 85.9% - 87.8% Female 22,555 88.7% 87.8% - 89.7%
Table B10: Completeness estimates of census respondents by ethnic group.
Ethnicity Cases Completeness 95% Confidence Interval
White 35,158 88.8% 87.8% - 89.7% Mixed 735 79.3% 75.2% - 83.4% Indian 1,763 85.4% 82.7% - 88.2% Pakistani 1,203 80.5% 75.9% - 85.0% Bangladeshi 609 79.7% 74.4% - 84.9% Other Asian 881 80.4% 76.1% - 84.6% African 963 75.4% 71.3% - 79.6% Caribbean 912 84.1% 80.9% - 87.3% Other Black 190 75.5% 68.1% - 82.9% Other 345 78.7% 72.6% - 84.9% Unknown 478 73.2% 67.3% - 79.0%
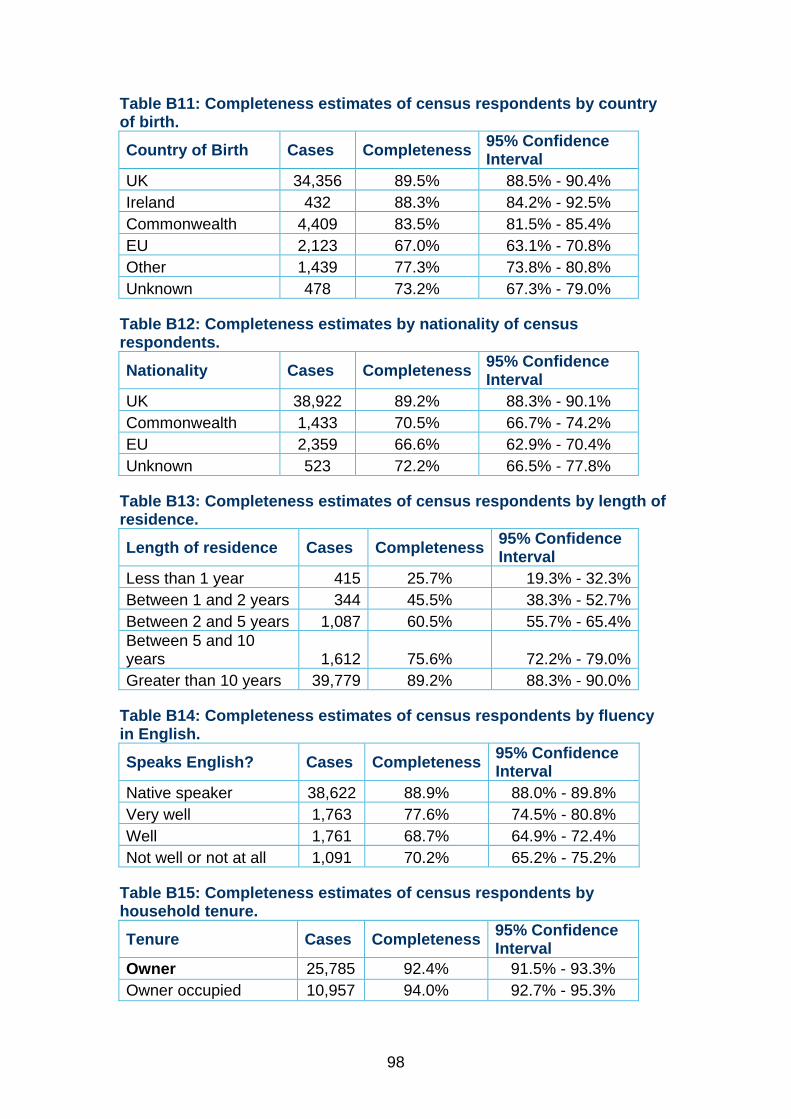
98
Table B11: Completeness estimates of census respondents by country of birth.
Country of Birth Cases Completeness 95% Confidence Interval
UK 34,356 89.5% 88.5% - 90.4% Ireland 432 88.3% 84.2% - 92.5% Commonwealth 4,409 83.5% 81.5% - 85.4% EU 2,123 67.0% 63.1% - 70.8% Other 1,439 77.3% 73.8% - 80.8% Unknown 478 73.2% 67.3% - 79.0%
Table B12: Completeness estimates by nationality of census respondents.
Nationality Cases Completeness 95% Confidence Interval
UK 38,922 89.2% 88.3% - 90.1% Commonwealth 1,433 70.5% 66.7% - 74.2% EU 2,359 66.6% 62.9% - 70.4% Unknown 523 72.2% 66.5% - 77.8%
Table B13: Completeness estimates of census respondents by length of residence.
Length of residence Cases Completeness 95% Confidence Interval
Less than 1 year 415 25.7% 19.3% - 32.3% Between 1 and 2 years 344 45.5% 38.3% - 52.7% Between 2 and 5 years 1,087 60.5% 55.7% - 65.4% Between 5 and 10 years 1,612 75.6% 72.2% - 79.0% Greater than 10 years 39,779 89.2% 88.3% - 90.0%
Table B14: Completeness estimates of census respondents by fluency in English.
Speaks English? Cases Completeness 95% Confidence Interval
Native speaker 38,622 88.9% 88.0% - 89.8% Very well 1,763 77.6% 74.5% - 80.8% Well 1,761 68.7% 64.9% - 72.4% Not well or not at all 1,091 70.2% 65.2% - 75.2%
Table B15: Completeness estimates of census respondents by household tenure.
Tenure Cases Completeness 95% Confidence Interval
Owner 25,785 92.4% 91.5% - 93.3% Owner occupied 10,957 94.0% 92.7% - 95.3%
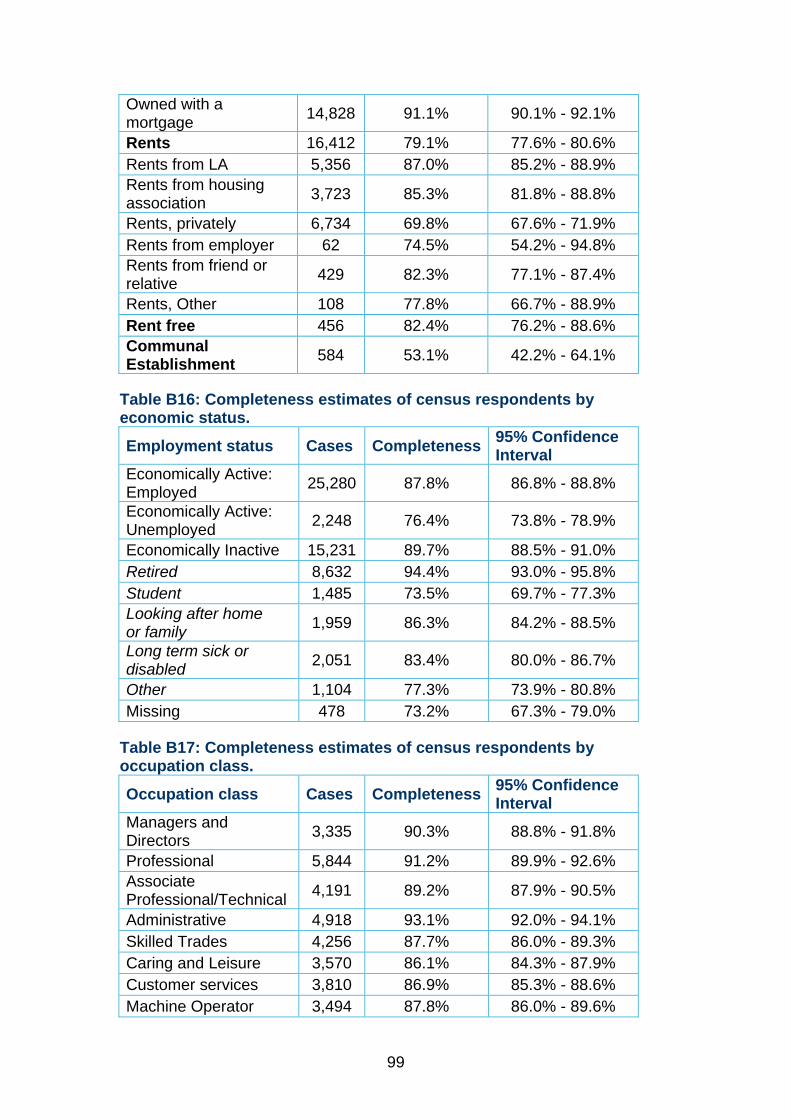
99
Owned with a mortgage 14,828 91.1% 90.1% - 92.1%
Rents 16,412 79.1% 77.6% - 80.6% Rents from LA 5,356 87.0% 85.2% - 88.9% Rents from housing association 3,723 85.3% 81.8% - 88.8%
Rents, privately 6,734 69.8% 67.6% - 71.9% Rents from employer 62 74.5% 54.2% - 94.8% Rents from friend or relative 429 82.3% 77.1% - 87.4%
Rents, Other 108 77.8% 66.7% - 88.9% Rent free 456 82.4% 76.2% - 88.6% Communal Establishment 584 53.1% 42.2% - 64.1%
Table B16: Completeness estimates of census respondents by economic status.
Employment status Cases Completeness 95% Confidence Interval
Economically Active: Employed 25,280 87.8% 86.8% - 88.8%
Economically Active: Unemployed 2,248 76.4% 73.8% - 78.9%
Economically Inactive 15,231 89.7% 88.5% - 91.0% Retired 8,632 94.4% 93.0% - 95.8% Student 1,485 73.5% 69.7% - 77.3% Looking after home or family 1,959 86.3% 84.2% - 88.5%
Long term sick or disabled 2,051 83.4% 80.0% - 86.7%
Other 1,104 77.3% 73.9% - 80.8% Missing 478 73.2% 67.3% - 79.0%
Table B17: Completeness estimates of census respondents by occupation class.
Occupation class Cases Completeness 95% Confidence Interval
Managers and Directors 3,335 90.3% 88.8% - 91.8%
Professional 5,844 91.2% 89.9% - 92.6% Associate Professional/Technical 4,191 89.2% 87.9% - 90.5%
Administrative 4,918 93.1% 92.0% - 94.1% Skilled Trades 4,256 87.7% 86.0% - 89.3% Caring and Leisure 3,570 86.1% 84.3% - 87.9% Customer services 3,810 86.9% 85.3% - 88.6% Machine Operator 3,494 87.8% 86.0% - 89.6%
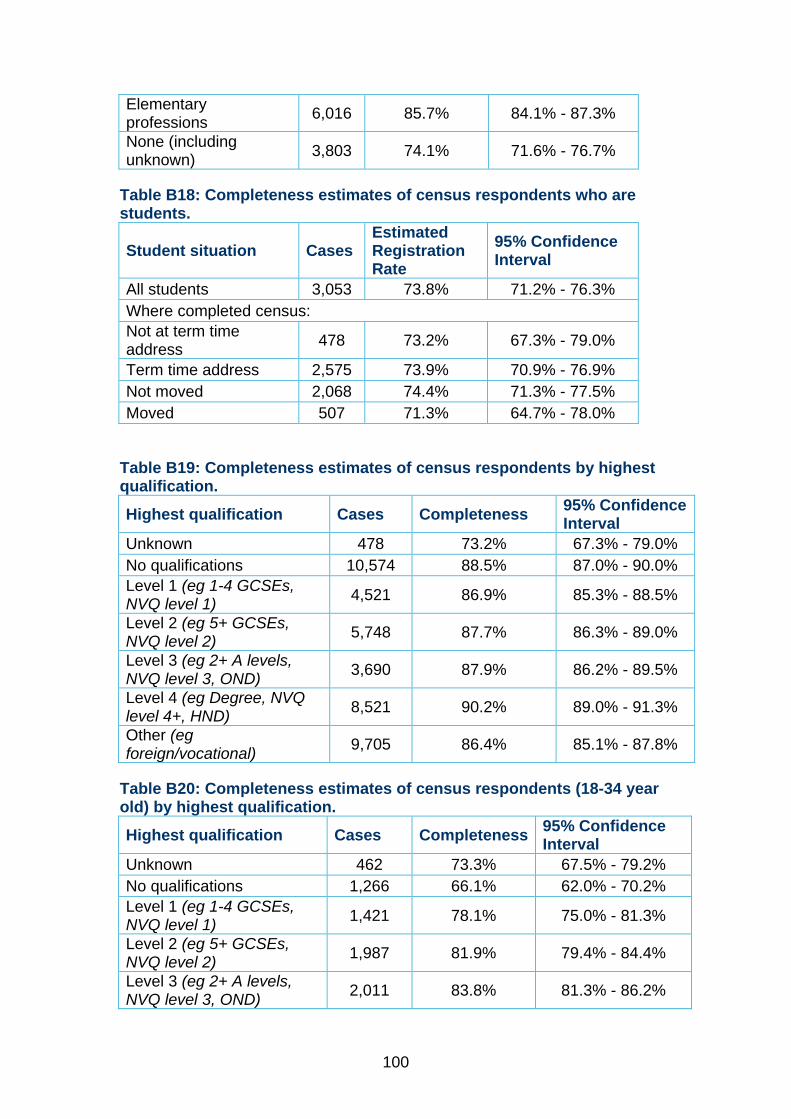
100
Elementary professions 6,016 85.7% 84.1% - 87.3%
None (including unknown) 3,803 74.1% 71.6% - 76.7%
Table B18: Completeness estimates of census respondents who are students.
Student situation Cases Estimated Registration Rate
95% Confidence Interval
All students 3,053 73.8% 71.2% - 76.3% Where completed census: Not at term time address 478 73.2% 67.3% - 79.0%
Term time address 2,575 73.9% 70.9% - 76.9% Not moved 2,068 74.4% 71.3% - 77.5% Moved 507 71.3% 64.7% - 78.0%
Table B19: Completeness estimates of census respondents by highest qualification.
Highest qualification Cases Completeness 95% Confidence Interval
Unknown 478 73.2% 67.3% - 79.0% No qualifications 10,574 88.5% 87.0% - 90.0% Level 1 (eg 1-4 GCSEs, NVQ level 1) 4,521 86.9% 85.3% - 88.5%
Level 2 (eg 5+ GCSEs, NVQ level 2) 5,748 87.7% 86.3% - 89.0%
Level 3 (eg 2+ A levels, NVQ level 3, OND) 3,690 87.9% 86.2% - 89.5%
Level 4 (eg Degree, NVQ level 4+, HND) 8,521 90.2% 89.0% - 91.3%
Other (eg foreign/vocational) 9,705 86.4% 85.1% - 87.8%
Table B20: Completeness estimates of census respondents (18-34 year old) by highest qualification.
Highest qualification Cases Completeness 95% Confidence Interval
Unknown 462 73.3% 67.5% - 79.2% No qualifications 1,266 66.1% 62.0% - 70.2% Level 1 (eg 1-4 GCSEs, NVQ level 1) 1,421 78.1% 75.0% - 81.3%
Level 2 (eg 5+ GCSEs, NVQ level 2) 1,987 81.9% 79.4% - 84.4%
Level 3 (eg 2+ A levels, NVQ level 3, OND) 2,011 83.8% 81.3% - 86.2%
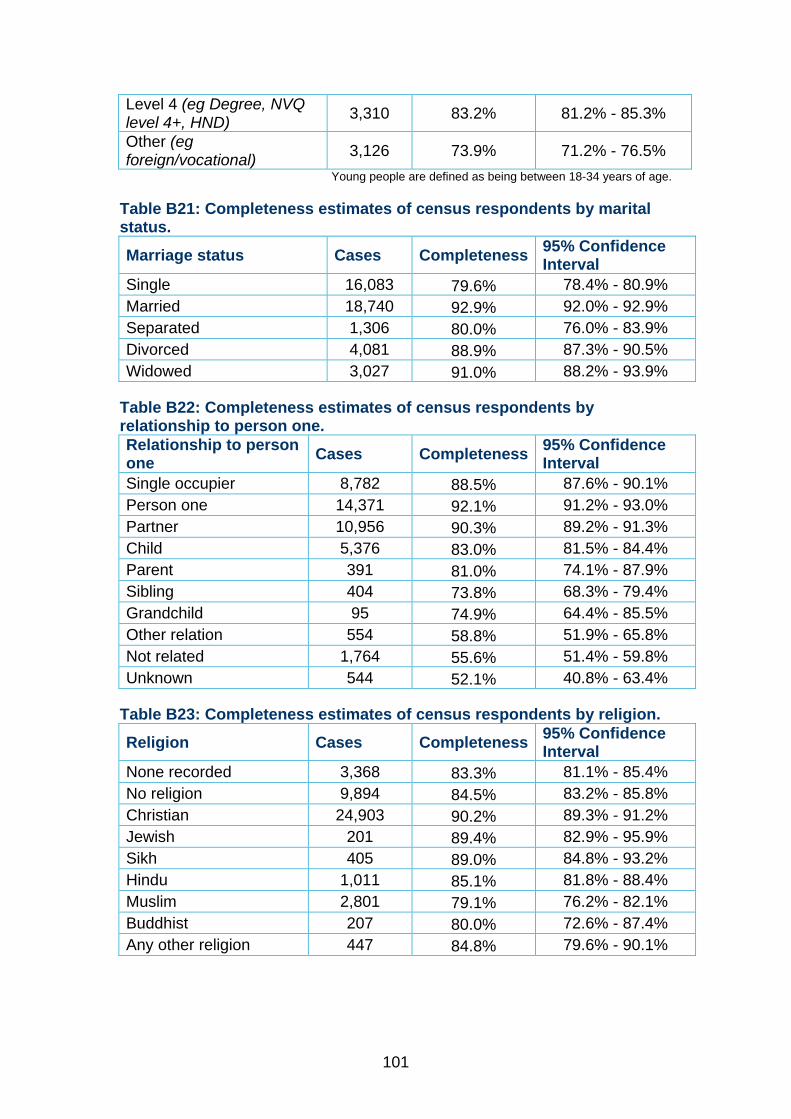
101
Level 4 (eg Degree, NVQ level 4+, HND) 3,310 83.2% 81.2% - 85.3%
Other (eg foreign/vocational) 3,126 73.9% 71.2% - 76.5%
Young people are defined as being between 18-34 years of age.
Table B21: Completeness estimates of census respondents by marital status.
Marriage status Cases Completeness 95% Confidence Interval
Single 16,083 79.6% 78.4% - 80.9% Married 18,740 92.9% 92.0% - 92.9% Separated 1,306 80.0% 76.0% - 83.9% Divorced 4,081 88.9% 87.3% - 90.5% Widowed 3,027 91.0% 88.2% - 93.9%
Table B22: Completeness estimates of census respondents by relationship to person one. Relationship to person one Cases Completeness 95% Confidence
Interval Single occupier 8,782 88.5% 87.6% - 90.1% Person one 14,371 92.1% 91.2% - 93.0% Partner 10,956 90.3% 89.2% - 91.3% Child 5,376 83.0% 81.5% - 84.4% Parent 391 81.0% 74.1% - 87.9% Sibling 404 73.8% 68.3% - 79.4% Grandchild 95 74.9% 64.4% - 85.5% Other relation 554 58.8% 51.9% - 65.8% Not related 1,764 55.6% 51.4% - 59.8% Unknown 544 52.1% 40.8% - 63.4%
Table B23: Completeness estimates of census respondents by religion.
Religion Cases Completeness 95% Confidence Interval
None recorded 3,368 83.3% 81.1% - 85.4% No religion 9,894 84.5% 83.2% - 85.8% Christian 24,903 90.2% 89.3% - 91.2% Jewish 201 89.4% 82.9% - 95.9% Sikh 405 89.0% 84.8% - 93.2% Hindu 1,011 85.1% 81.8% - 88.4% Muslim 2,801 79.1% 76.2% - 82.1% Buddhist 207 80.0% 72.6% - 87.4% Any other religion 447 84.8% 79.6% - 90.1%
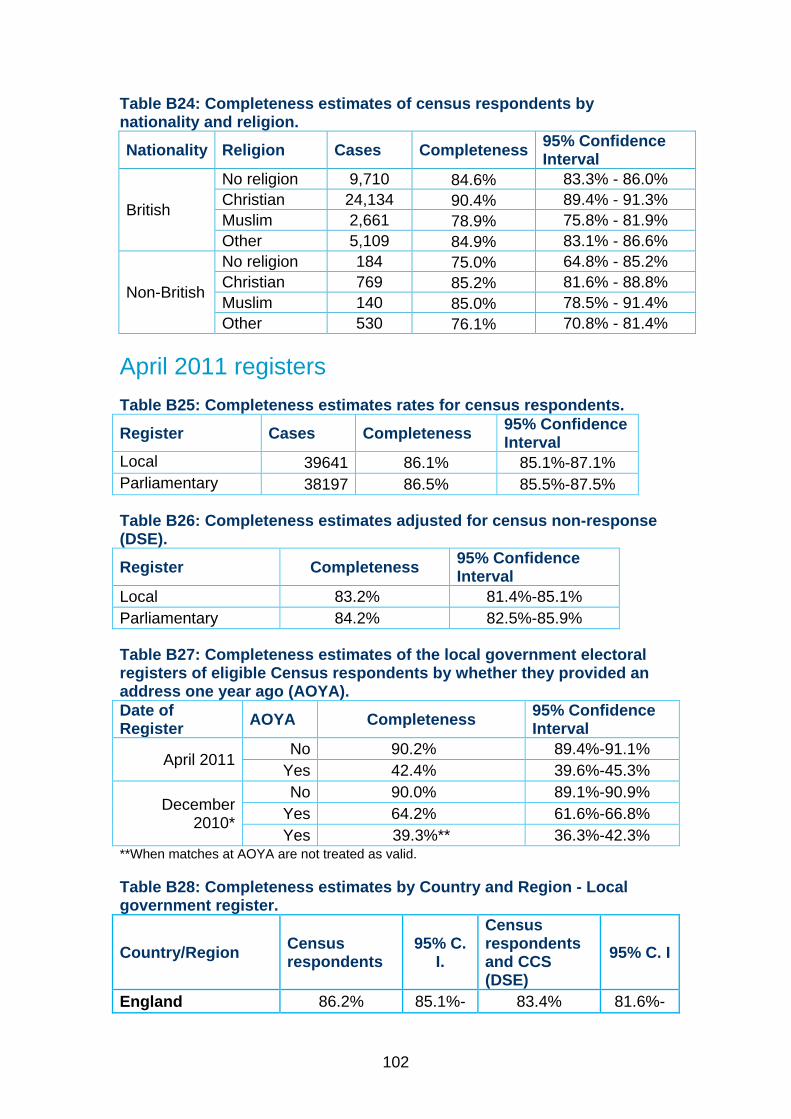
102
Table B24: Completeness estimates of census respondents by nationality and religion.
Nationality Religion Cases Completeness 95% Confidence Interval
British
No religion 9,710 84.6% 83.3% - 86.0% Christian 24,134 90.4% 89.4% - 91.3% Muslim 2,661 78.9% 75.8% - 81.9% Other 5,109 84.9% 83.1% - 86.6%
Non-British
No religion 184 75.0% 64.8% - 85.2% Christian 769 85.2% 81.6% - 88.8% Muslim 140 85.0% 78.5% - 91.4% Other 530 76.1% 70.8% - 81.4%
April 2011 registers Table B25: Completeness estimates rates for census respondents.
Register Cases Completeness 95% Confidence Interval
Local 39641 86.1% 85.1%-87.1% Parliamentary 38197 86.5% 85.5%-87.5%
Table B26: Completeness estimates adjusted for census non-response (DSE).
Register Completeness 95% Confidence Interval
Local 83.2% 81.4%-85.1% Parliamentary 84.2% 82.5%-85.9%
Table B27: Completeness estimates of the local government electoral registers of eligible Census respondents by whether they provided an address one year ago (AOYA). Date of Register AOYA Completeness 95% Confidence
Interval
April 2011 No 90.2% 89.4%-91.1%
Yes 42.4% 39.6%-45.3%
December 2010*
No 90.0% 89.1%-90.9% Yes 64.2% 61.6%-66.8% Yes 39.3%** 36.3%-42.3%
**When matches at AOYA are not treated as valid.
Table B28: Completeness estimates by Country and Region - Local government register.
Country/Region Census respondents
95% C. I.
Census respondents and CCS (DSE)
95% C. I
England 86.2% 85.1%- 83.4% 81.6%-
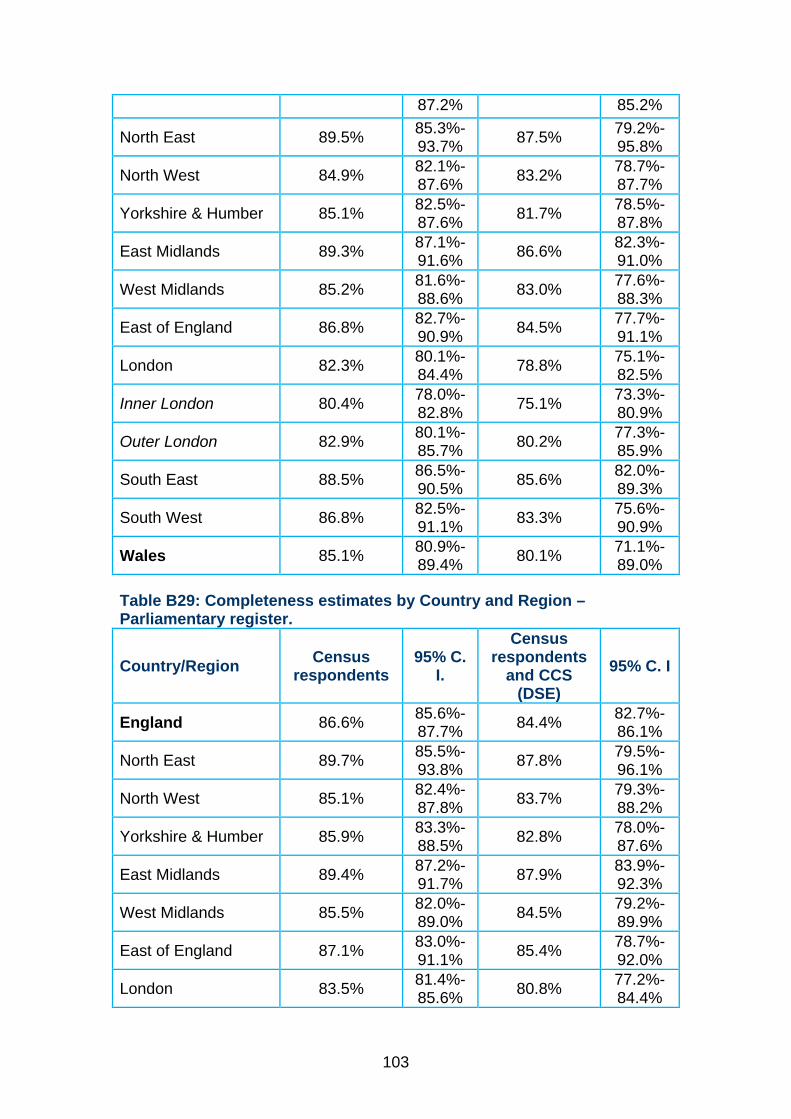
103
87.2% 85.2%
North East 89.5% 85.3%-93.7% 87.5% 79.2%-
95.8%
North West 84.9% 82.1%-87.6% 83.2% 78.7%-
87.7%
Yorkshire & Humber 85.1% 82.5%-87.6% 81.7% 78.5%-
87.8%
East Midlands 89.3% 87.1%-91.6% 86.6% 82.3%-
91.0%
West Midlands 85.2% 81.6%-88.6% 83.0% 77.6%-
88.3%
East of England 86.8% 82.7%-90.9% 84.5% 77.7%-
91.1%
London 82.3% 80.1%-84.4% 78.8% 75.1%-
82.5%
Inner London 80.4% 78.0%-82.8% 75.1% 73.3%-
80.9%
Outer London 82.9% 80.1%-85.7% 80.2% 77.3%-
85.9%
South East 88.5% 86.5%-90.5% 85.6% 82.0%-
89.3%
South West 86.8% 82.5%-91.1% 83.3% 75.6%-
90.9%
Wales 85.1% 80.9%-89.4% 80.1% 71.1%-
89.0%
Table B29: Completeness estimates by Country and Region – Parliamentary register.
Country/Region Census respondents
95% C. I.
Census respondents
and CCS (DSE)
95% C. I
England 86.6% 85.6%-87.7% 84.4% 82.7%-
86.1%
North East 89.7% 85.5%-93.8% 87.8% 79.5%-
96.1%
North West 85.1% 82.4%-87.8% 83.7% 79.3%-
88.2%
Yorkshire & Humber 85.9% 83.3%-88.5% 82.8% 78.0%-
87.6%
East Midlands 89.4% 87.2%-91.7% 87.9% 83.9%-
92.3%
West Midlands 85.5% 82.0%-89.0% 84.5% 79.2%-
89.9%
East of England 87.1% 83.0%-91.1% 85.4% 78.7%-
92.0%
London 83.5% 81.4%-85.6% 80.8% 77.2%-
84.4%
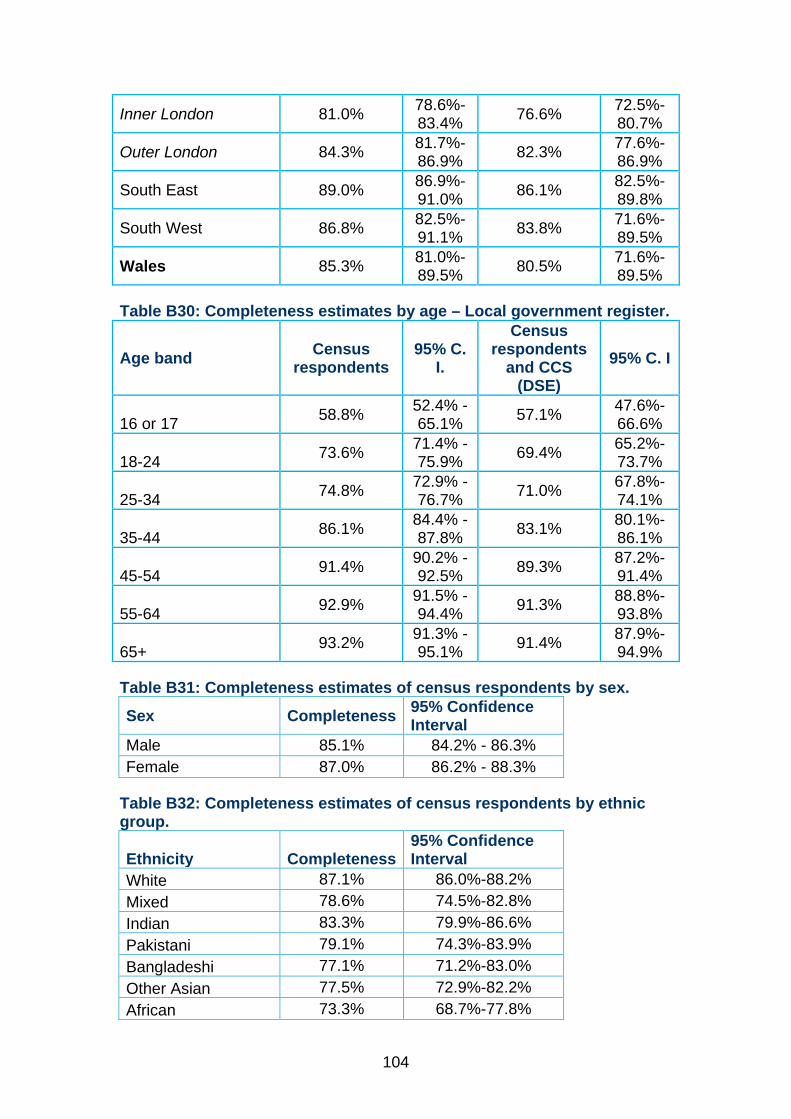
104
Inner London 81.0% 78.6%-83.4% 76.6% 72.5%-
80.7%
Outer London 84.3% 81.7%-86.9% 82.3% 77.6%-
86.9%
South East 89.0% 86.9%-91.0% 86.1% 82.5%-
89.8%
South West 86.8% 82.5%-91.1% 83.8% 71.6%-
89.5%
Wales 85.3% 81.0%-89.5% 80.5% 71.6%-
89.5%
Table B30: Completeness estimates by age – Local government register.
Age band Census respondents
95% C. I.
Census respondents
and CCS (DSE)
95% C. I
16 or 17 58.8% 52.4% - 65.1% 57.1% 47.6%-
66.6%
18-24 73.6% 71.4% - 75.9% 69.4% 65.2%-
73.7%
25-34 74.8% 72.9% - 76.7% 71.0% 67.8%-
74.1%
35-44 86.1% 84.4% - 87.8% 83.1% 80.1%-
86.1%
45-54 91.4% 90.2% - 92.5% 89.3% 87.2%-
91.4%
55-64 92.9% 91.5% - 94.4% 91.3% 88.8%-
93.8%
65+ 93.2% 91.3% - 95.1% 91.4% 87.9%-
94.9%
Table B31: Completeness estimates of census respondents by sex.
Sex Completeness 95% Confidence Interval
Male 85.1% 84.2% - 86.3% Female 87.0% 86.2% - 88.3%
Table B32: Completeness estimates of census respondents by ethnic group.
Ethnicity Completeness 95% Confidence Interval
White 87.1% 86.0%-88.2% Mixed 78.6% 74.5%-82.8% Indian 83.3% 79.9%-86.6% Pakistani 79.1% 74.3%-83.9% Bangladeshi 77.1% 71.2%-83.0% Other Asian 77.5% 72.9%-82.2% African 73.3% 68.7%-77.8%
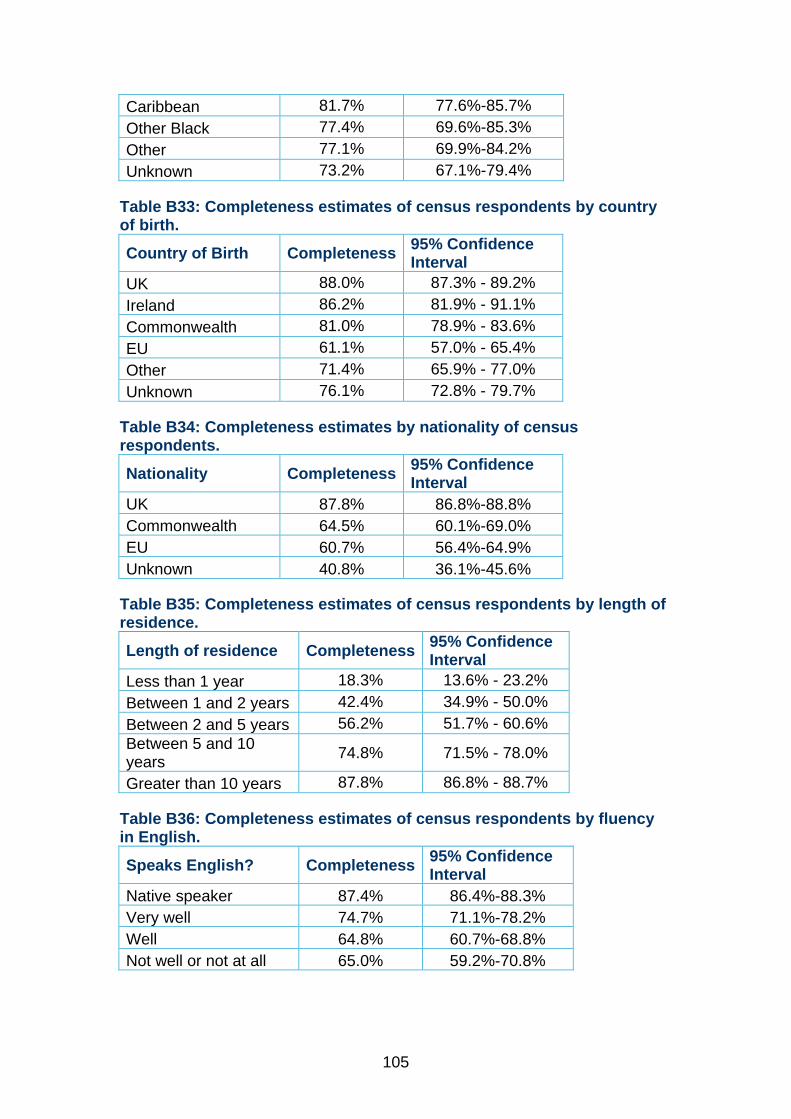
105
Caribbean 81.7% 77.6%-85.7% Other Black 77.4% 69.6%-85.3% Other 77.1% 69.9%-84.2% Unknown 73.2% 67.1%-79.4%
Table B33: Completeness estimates of census respondents by country of birth.
Country of Birth Completeness 95% Confidence Interval
UK 88.0% 87.3% - 89.2% Ireland 86.2% 81.9% - 91.1% Commonwealth 81.0% 78.9% - 83.6% EU 61.1% 57.0% - 65.4% Other 71.4% 65.9% - 77.0% Unknown 76.1% 72.8% - 79.7%
Table B34: Completeness estimates by nationality of census respondents.
Nationality Completeness 95% Confidence Interval
UK 87.8% 86.8%-88.8% Commonwealth 64.5% 60.1%-69.0% EU 60.7% 56.4%-64.9% Unknown 40.8% 36.1%-45.6%
Table B35: Completeness estimates of census respondents by length of residence.
Length of residence Completeness 95% Confidence Interval
Less than 1 year 18.3% 13.6% - 23.2% Between 1 and 2 years 42.4% 34.9% - 50.0% Between 2 and 5 years 56.2% 51.7% - 60.6% Between 5 and 10 years 74.8% 71.5% - 78.0%
Greater than 10 years 87.8% 86.8% - 88.7%
Table B36: Completeness estimates of census respondents by fluency in English.
Speaks English? Completeness 95% Confidence Interval
Native speaker 87.4% 86.4%-88.3% Very well 74.7% 71.1%-78.2% Well 64.8% 60.7%-68.8% Not well or not at all 65.0% 59.2%-70.8%
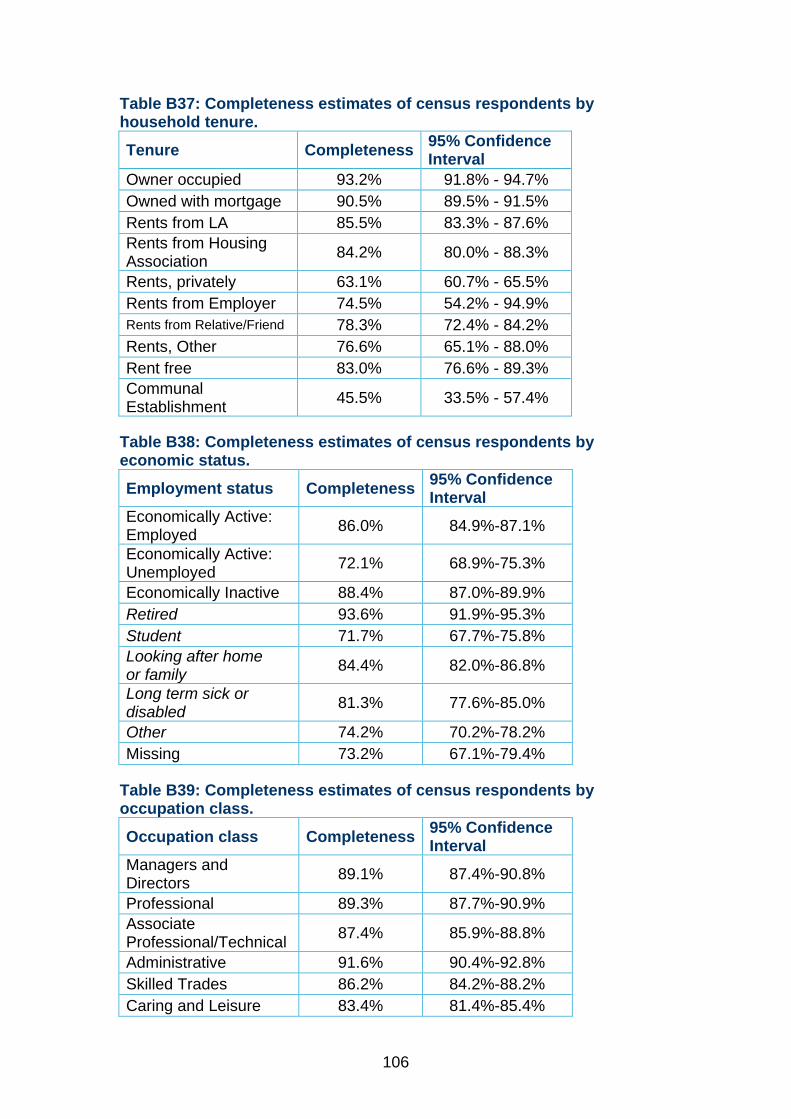
106
Table B37: Completeness estimates of census respondents by household tenure.
Tenure Completeness 95% Confidence Interval
Owner occupied 93.2% 91.8% - 94.7% Owned with mortgage 90.5% 89.5% - 91.5% Rents from LA 85.5% 83.3% - 87.6% Rents from Housing Association 84.2% 80.0% - 88.3%
Rents, privately 63.1% 60.7% - 65.5% Rents from Employer 74.5% 54.2% - 94.9% Rents from Relative/Friend 78.3% 72.4% - 84.2% Rents, Other 76.6% 65.1% - 88.0% Rent free 83.0% 76.6% - 89.3% Communal Establishment 45.5% 33.5% - 57.4%
Table B38: Completeness estimates of census respondents by economic status.
Employment status Completeness 95% Confidence Interval
Economically Active: Employed 86.0% 84.9%-87.1%
Economically Active: Unemployed 72.1% 68.9%-75.3%
Economically Inactive 88.4% 87.0%-89.9% Retired 93.6% 91.9%-95.3% Student 71.7% 67.7%-75.8% Looking after home or family 84.4% 82.0%-86.8%
Long term sick or disabled 81.3% 77.6%-85.0%
Other 74.2% 70.2%-78.2% Missing 73.2% 67.1%-79.4%
Table B39: Completeness estimates of census respondents by occupation class.
Occupation class Completeness 95% Confidence Interval
Managers and Directors 89.1% 87.4%-90.8%
Professional 89.3% 87.7%-90.9% Associate Professional/Technical 87.4% 85.9%-88.8%
Administrative 91.6% 90.4%-92.8% Skilled Trades 86.2% 84.2%-88.2% Caring and Leisure 83.4% 81.4%-85.4%
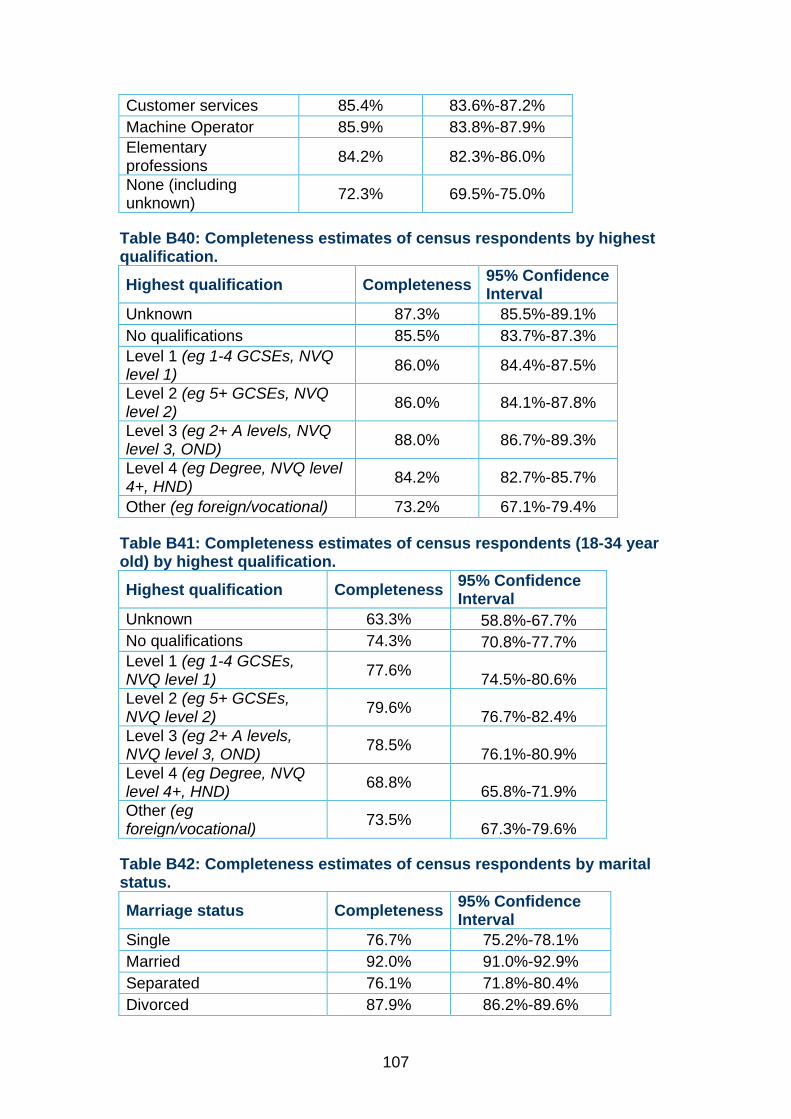
107
Customer services 85.4% 83.6%-87.2% Machine Operator 85.9% 83.8%-87.9% Elementary professions 84.2% 82.3%-86.0%
None (including unknown) 72.3% 69.5%-75.0%
Table B40: Completeness estimates of census respondents by highest qualification.
Highest qualification Completeness 95% Confidence Interval
Unknown 87.3% 85.5%-89.1% No qualifications 85.5% 83.7%-87.3% Level 1 (eg 1-4 GCSEs, NVQ level 1) 86.0% 84.4%-87.5%
Level 2 (eg 5+ GCSEs, NVQ level 2) 86.0% 84.1%-87.8%
Level 3 (eg 2+ A levels, NVQ level 3, OND) 88.0% 86.7%-89.3%
Level 4 (eg Degree, NVQ level 4+, HND) 84.2% 82.7%-85.7%
Other (eg foreign/vocational) 73.2% 67.1%-79.4%
Table B41: Completeness estimates of census respondents (18-34 year old) by highest qualification.
Highest qualification Completeness 95% Confidence Interval
Unknown 63.3% 58.8%-67.7% No qualifications 74.3% 70.8%-77.7% Level 1 (eg 1-4 GCSEs, NVQ level 1) 77.6% 74.5%-80.6% Level 2 (eg 5+ GCSEs, NVQ level 2) 79.6% 76.7%-82.4% Level 3 (eg 2+ A levels, NVQ level 3, OND) 78.5% 76.1%-80.9% Level 4 (eg Degree, NVQ level 4+, HND) 68.8% 65.8%-71.9% Other (eg foreign/vocational) 73.5% 67.3%-79.6%
Table B42: Completeness estimates of census respondents by marital status.
Marriage status Completeness 95% Confidence Interval
Single 76.7% 75.2%-78.1% Married 92.0% 91.0%-92.9% Separated 76.1% 71.8%-80.4% Divorced 87.9% 86.2%-89.6%

108
Widowed 89.1% 85.7%-92.6%
Table B43: Completeness estimates of census respondents by relationship to person one. Relationship to person one Completeness 95% Confidence
Interval Single occupier 87.7% 86.2%-91.1% Person one 89.9% 88.9%-90.9% Partner 89.5% 88.4%-90.6% Child 82.2% 80.7%-83.7% Parent 75.6% 67.7%-83.4% Sibling 73.3% 67.4%-79.2% Grandchild 74.2% 62.2%-86.1% Other relation 51.5% 44.2%-58.8% Not related 50.8% 46.2%-55.3% Unknown 44.1% 31.8%-56.4%
Table B44: Completeness estimates of census respondents by religion.
Religion Completeness 95% Confidence Interval
None recorded 81.6% 79.2%-84.0% No religion 82.3% 80.8%-83.8% Christian 88.6% 87.5%-89.8% Jewish 90.7% 83.5%-97.8% Sikh 87.2% 82.3%-92.2% Hindu 82.1% 77.8%-86.4% Muslim 78.1% 75.1%-81.2% Buddhist 78.1% 69.8%-86.4% Any other religion 82.6% 77.1%-88.1%
Scotland Table B45: Completeness estimates of census respondents by council – April 2011 electoral registers.
Council Local government Parliamentary
Compl. Lower Upper Compl. Lower Upper Aberdeen City 80.9% 78.7% 83.1% 84.8% 82.8% 86.8% Aberdeenshire 84.3% 82.1% 86.4% 88.4% 86.6% 90.2% Angus 90.2% 87.7% 92.6% 92.2% 90.0% 94.4% Argyll & Bute 87.0% 85.4% 88.7% 89.3% 87.7% 90.8% Clackmannanshire 89.0% 86.0% 92.0% 90.6% 87.8% 93.3%
Dumfries & Galloway 89.7% 88.4% 90.9% 91.2% 90.1% 92.4%
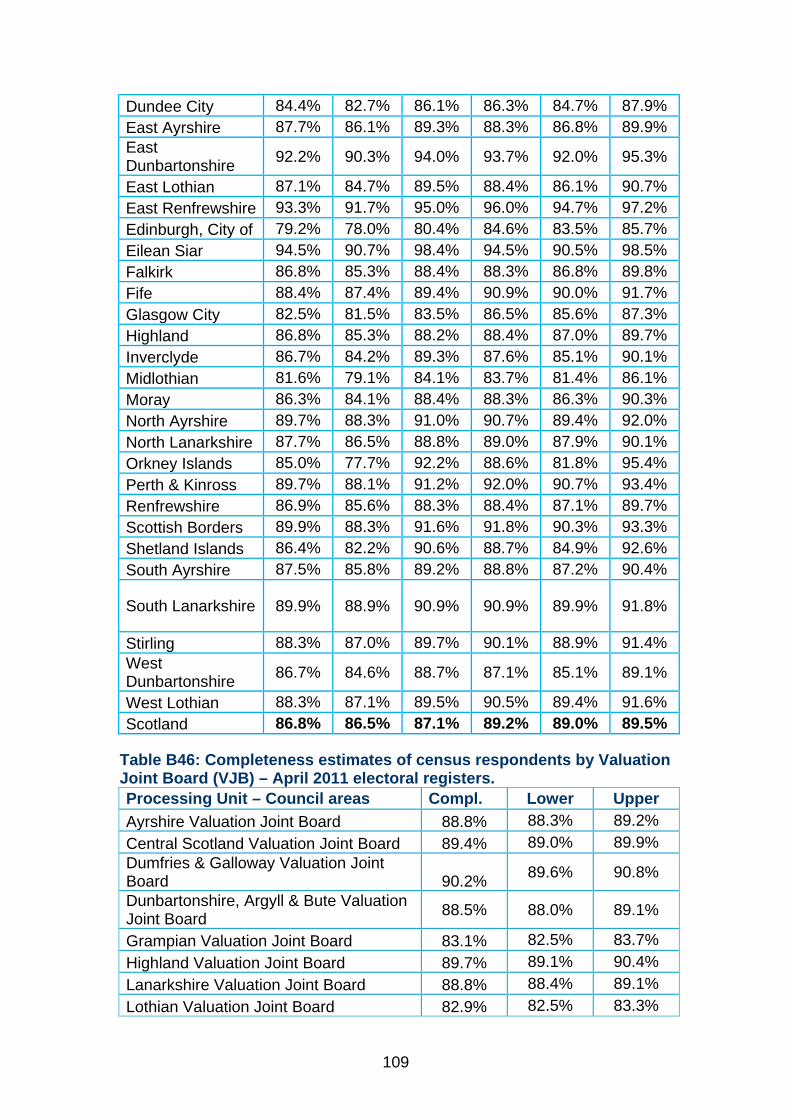
109
Dundee City 84.4% 82.7% 86.1% 86.3% 84.7% 87.9% East Ayrshire 87.7% 86.1% 89.3% 88.3% 86.8% 89.9% East Dunbartonshire 92.2% 90.3% 94.0% 93.7% 92.0% 95.3%
East Lothian 87.1% 84.7% 89.5% 88.4% 86.1% 90.7% East Renfrewshire 93.3% 91.7% 95.0% 96.0% 94.7% 97.2% Edinburgh, City of 79.2% 78.0% 80.4% 84.6% 83.5% 85.7% Eilean Siar 94.5% 90.7% 98.4% 94.5% 90.5% 98.5% Falkirk 86.8% 85.3% 88.4% 88.3% 86.8% 89.8% Fife 88.4% 87.4% 89.4% 90.9% 90.0% 91.7% Glasgow City 82.5% 81.5% 83.5% 86.5% 85.6% 87.3% Highland 86.8% 85.3% 88.2% 88.4% 87.0% 89.7% Inverclyde 86.7% 84.2% 89.3% 87.6% 85.1% 90.1% Midlothian 81.6% 79.1% 84.1% 83.7% 81.4% 86.1% Moray 86.3% 84.1% 88.4% 88.3% 86.3% 90.3% North Ayrshire 89.7% 88.3% 91.0% 90.7% 89.4% 92.0% North Lanarkshire 87.7% 86.5% 88.8% 89.0% 87.9% 90.1% Orkney Islands 85.0% 77.7% 92.2% 88.6% 81.8% 95.4% Perth & Kinross 89.7% 88.1% 91.2% 92.0% 90.7% 93.4% Renfrewshire 86.9% 85.6% 88.3% 88.4% 87.1% 89.7% Scottish Borders 89.9% 88.3% 91.6% 91.8% 90.3% 93.3% Shetland Islands 86.4% 82.2% 90.6% 88.7% 84.9% 92.6% South Ayrshire 87.5% 85.8% 89.2% 88.8% 87.2% 90.4%
South Lanarkshire 89.9% 88.9% 90.9% 90.9% 89.9% 91.8%
Stirling 88.3% 87.0% 89.7% 90.1% 88.9% 91.4% West Dunbartonshire 86.7% 84.6% 88.7% 87.1% 85.1% 89.1%
West Lothian 88.3% 87.1% 89.5% 90.5% 89.4% 91.6% Scotland 86.8% 86.5% 87.1% 89.2% 89.0% 89.5%
Table B46: Completeness estimates of census respondents by Valuation Joint Board (VJB) – April 2011 electoral registers. Processing Unit – Council areas Compl. Lower Upper Ayrshire Valuation Joint Board 88.8% 88.3% 89.2% Central Scotland Valuation Joint Board 89.4% 89.0% 89.9% Dumfries & Galloway Valuation Joint Board 90.2% 89.6% 90.8%
Dunbartonshire, Argyll & Bute Valuation Joint Board 88.5% 88.0% 89.1%
Grampian Valuation Joint Board 83.1% 82.5% 83.7% Highland Valuation Joint Board 89.7% 89.1% 90.4% Lanarkshire Valuation Joint Board 88.8% 88.4% 89.1% Lothian Valuation Joint Board 82.9% 82.5% 83.3%
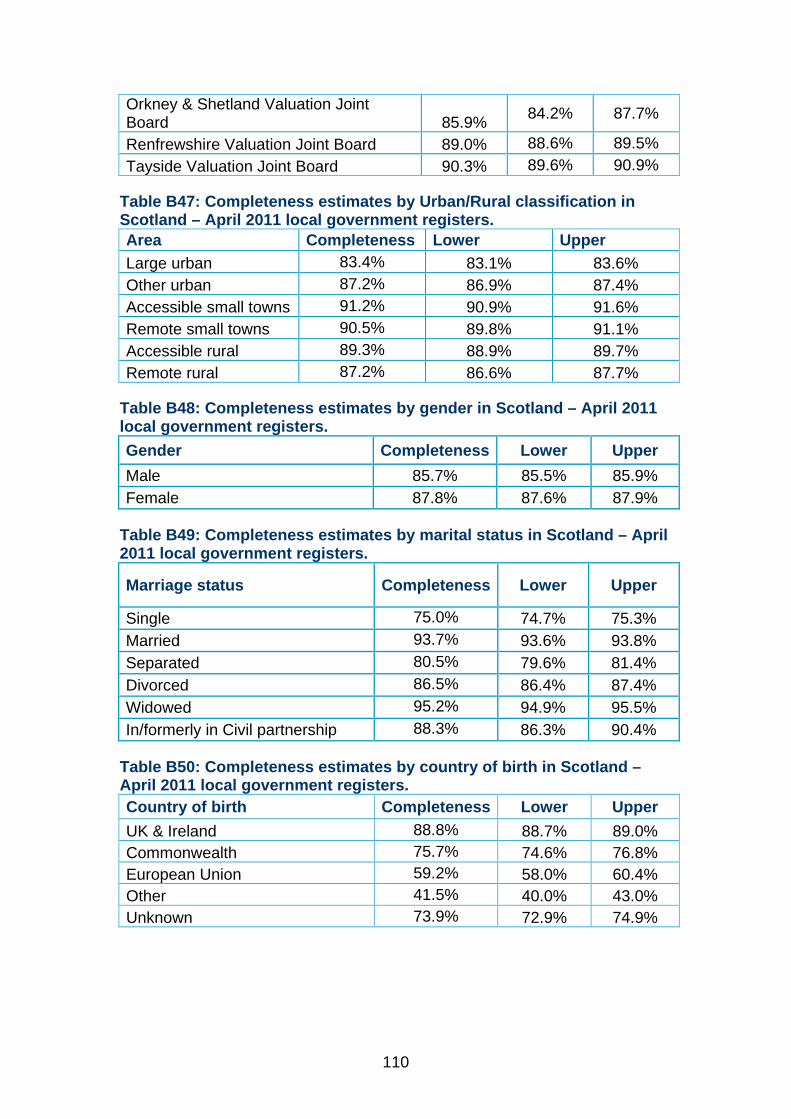
110
Orkney & Shetland Valuation Joint Board 85.9% 84.2% 87.7%
Renfrewshire Valuation Joint Board 89.0% 88.6% 89.5% Tayside Valuation Joint Board 90.3% 89.6% 90.9%
Table B47: Completeness estimates by Urban/Rural classification in Scotland – April 2011 local government registers. Area Completeness Lower Upper Large urban 83.4% 83.1% 83.6% Other urban 87.2% 86.9% 87.4% Accessible small towns 91.2% 90.9% 91.6% Remote small towns 90.5% 89.8% 91.1% Accessible rural 89.3% 88.9% 89.7% Remote rural 87.2% 86.6% 87.7%
Table B48: Completeness estimates by gender in Scotland – April 2011 local government registers. Gender Completeness Lower Upper Male 85.7% 85.5% 85.9% Female 87.8% 87.6% 87.9%
Table B49: Completeness estimates by marital status in Scotland – April 2011 local government registers.
Marriage status Completeness Lower Upper
Single 75.0% 74.7% 75.3% Married 93.7% 93.6% 93.8% Separated 80.5% 79.6% 81.4% Divorced 86.5% 86.4% 87.4% Widowed 95.2% 94.9% 95.5% In/formerly in Civil partnership 88.3% 86.3% 90.4%
Table B50: Completeness estimates by country of birth in Scotland – April 2011 local government registers. Country of birth Completeness Lower Upper UK & Ireland 88.8% 88.7% 89.0% Commonwealth 75.7% 74.6% 76.8% European Union 59.2% 58.0% 60.4% Other 41.5% 40.0% 43.0% Unknown 73.9% 72.9% 74.9%
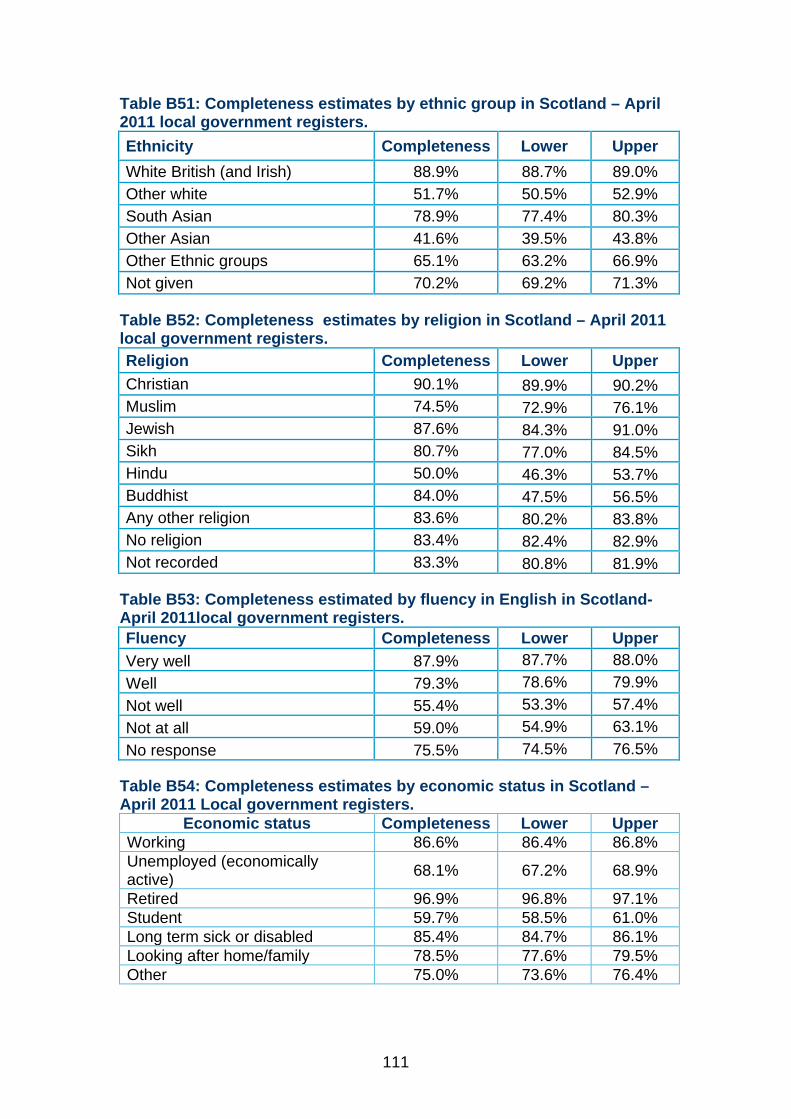
111
Table B51: Completeness estimates by ethnic group in Scotland – April 2011 local government registers. Ethnicity Completeness Lower Upper White British (and Irish) 88.9% 88.7% 89.0% Other white 51.7% 50.5% 52.9% South Asian 78.9% 77.4% 80.3% Other Asian 41.6% 39.5% 43.8% Other Ethnic groups 65.1% 63.2% 66.9% Not given 70.2% 69.2% 71.3%
Table B52: Completeness estimates by religion in Scotland – April 2011 local government registers. Religion Completeness Lower Upper Christian 90.1% 89.9% 90.2% Muslim 74.5% 72.9% 76.1% Jewish 87.6% 84.3% 91.0% Sikh 80.7% 77.0% 84.5% Hindu 50.0% 46.3% 53.7% Buddhist 84.0% 47.5% 56.5% Any other religion 83.6% 80.2% 83.8% No religion 83.4% 82.4% 82.9% Not recorded 83.3% 80.8% 81.9%
Table B53: Completeness estimated by fluency in English in Scotland- April 2011local government registers. Fluency Completeness Lower Upper Very well 87.9% 87.7% 88.0% Well 79.3% 78.6% 79.9% Not well 55.4% 53.3% 57.4% Not at all 59.0% 54.9% 63.1% No response 75.5% 74.5% 76.5%
Table B54: Completeness estimates by economic status in Scotland – April 2011 Local government registers.
Economic status Completeness Lower Upper Working 86.6% 86.4% 86.8% Unemployed (economically active) 68.1% 67.2% 68.9%
Retired 96.9% 96.8% 97.1% Student 59.7% 58.5% 61.0% Long term sick or disabled 85.4% 84.7% 86.1% Looking after home/family 78.5% 77.6% 79.5% Other 75.0% 73.6% 76.4%
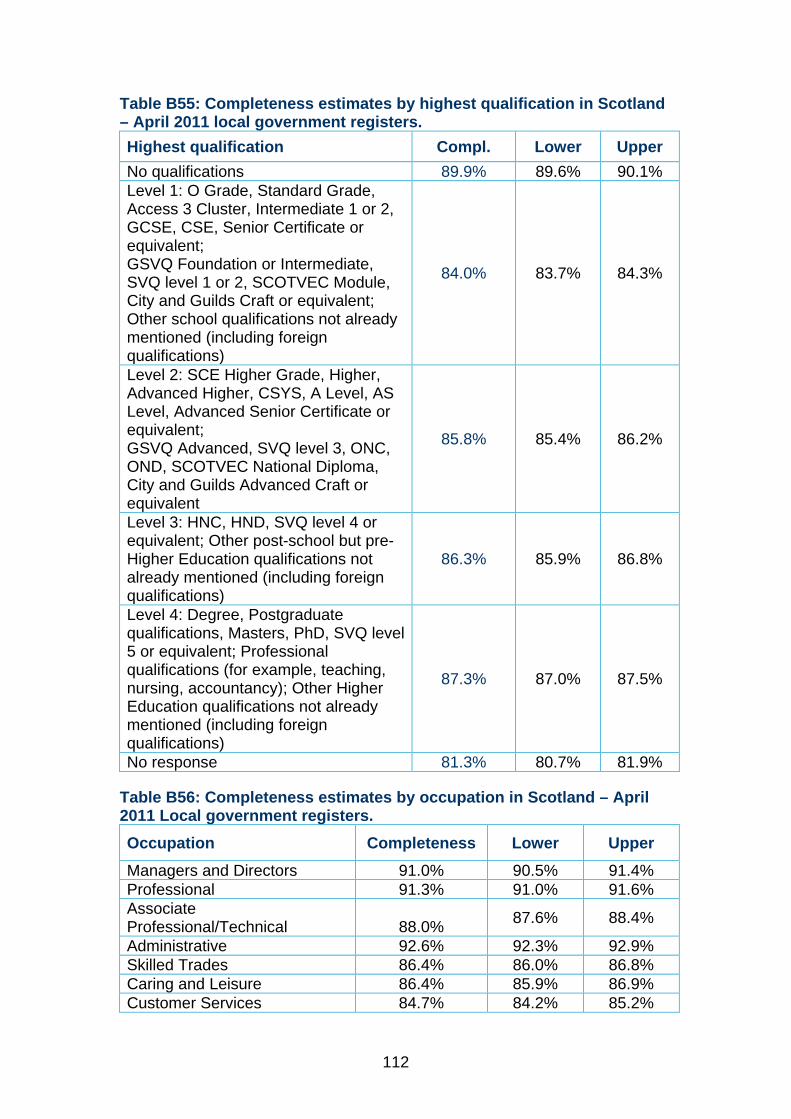
112
Table B55: Completeness estimates by highest qualification in Scotland – April 2011 local government registers. Highest qualification Compl. Lower Upper No qualifications 89.9% 89.6% 90.1% Level 1: O Grade, Standard Grade, Access 3 Cluster, Intermediate 1 or 2, GCSE, CSE, Senior Certificate or equivalent; GSVQ Foundation or Intermediate, SVQ level 1 or 2, SCOTVEC Module, City and Guilds Craft or equivalent; Other school qualifications not already mentioned (including foreign qualifications)
84.0% 83.7% 84.3%
Level 2: SCE Higher Grade, Higher, Advanced Higher, CSYS, A Level, AS Level, Advanced Senior Certificate or equivalent; GSVQ Advanced, SVQ level 3, ONC, OND, SCOTVEC National Diploma, City and Guilds Advanced Craft or equivalent
85.8% 85.4% 86.2%
Level 3: HNC, HND, SVQ level 4 or equivalent; Other post-school but pre-Higher Education qualifications not already mentioned (including foreign qualifications)
86.3% 85.9% 86.8%
Level 4: Degree, Postgraduate qualifications, Masters, PhD, SVQ level 5 or equivalent; Professional qualifications (for example, teaching, nursing, accountancy); Other Higher Education qualifications not already mentioned (including foreign qualifications)
87.3% 87.0% 87.5%
No response 81.3% 80.7% 81.9%
Table B56: Completeness estimates by occupation in Scotland – April 2011 Local government registers. Occupation Completeness Lower Upper Managers and Directors 91.0% 90.5% 91.4% Professional 91.3% 91.0% 91.6% Associate Professional/Technical 88.0% 87.6% 88.4%
Administrative 92.6% 92.3% 92.9% Skilled Trades 86.4% 86.0% 86.8% Caring and Leisure 86.4% 85.9% 86.9% Customer Services 84.7% 84.2% 85.2%
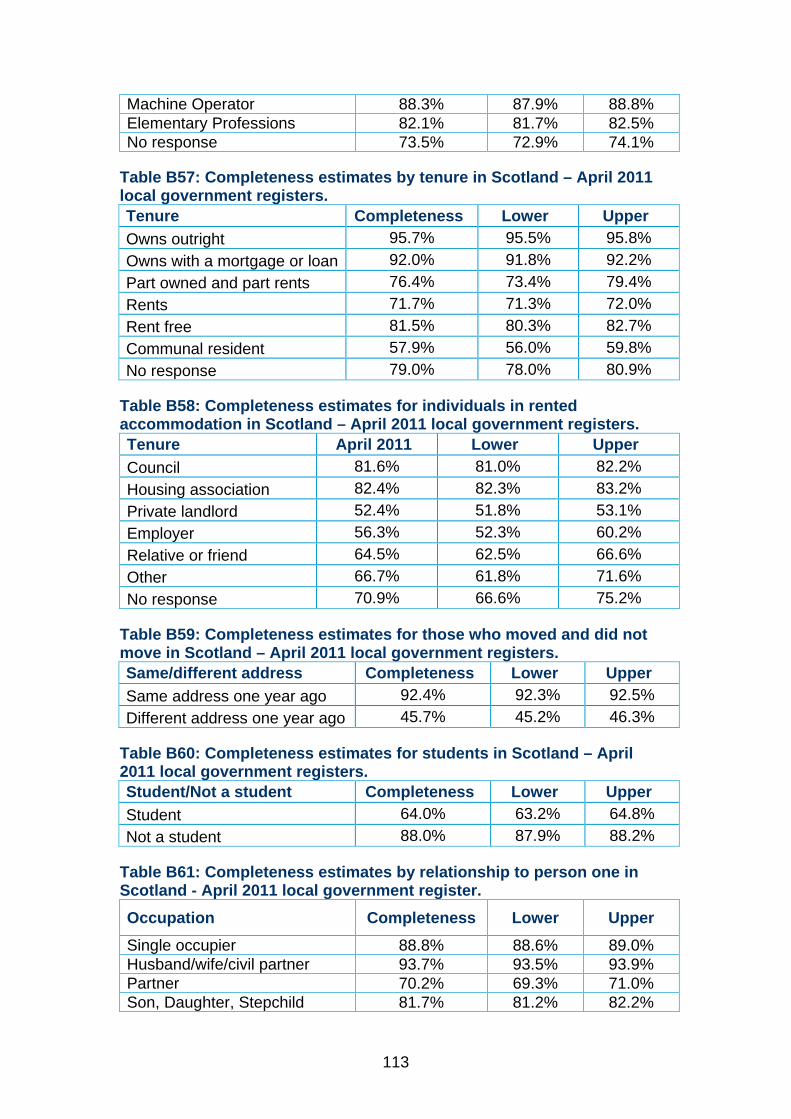
113
Machine Operator 88.3% 87.9% 88.8% Elementary Professions 82.1% 81.7% 82.5% No response 73.5% 72.9% 74.1%
Table B57: Completeness estimates by tenure in Scotland – April 2011 local government registers. Tenure Completeness Lower Upper Owns outright 95.7% 95.5% 95.8% Owns with a mortgage or loan 92.0% 91.8% 92.2% Part owned and part rents 76.4% 73.4% 79.4% Rents 71.7% 71.3% 72.0% Rent free 81.5% 80.3% 82.7% Communal resident 57.9% 56.0% 59.8% No response 79.0% 78.0% 80.9%
Table B58: Completeness estimates for individuals in rented accommodation in Scotland – April 2011 local government registers. Tenure April 2011 Lower Upper Council 81.6% 81.0% 82.2% Housing association 82.4% 82.3% 83.2% Private landlord 52.4% 51.8% 53.1% Employer 56.3% 52.3% 60.2% Relative or friend 64.5% 62.5% 66.6% Other 66.7% 61.8% 71.6% No response 70.9% 66.6% 75.2%
Table B59: Completeness estimates for those who moved and did not move in Scotland – April 2011 local government registers. Same/different address Completeness Lower Upper Same address one year ago 92.4% 92.3% 92.5% Different address one year ago 45.7% 45.2% 46.3%
Table B60: Completeness estimates for students in Scotland – April 2011 local government registers. Student/Not a student Completeness Lower Upper Student 64.0% 63.2% 64.8% Not a student 88.0% 87.9% 88.2%
Table B61: Completeness estimates by relationship to person one in Scotland - April 2011 local government register. Occupation Completeness Lower Upper Single occupier 88.8% 88.6% 89.0% Husband/wife/civil partner 93.7% 93.5% 93.9% Partner 70.2% 69.3% 71.0% Son, Daughter, Stepchild 81.7% 81.2% 82.2%
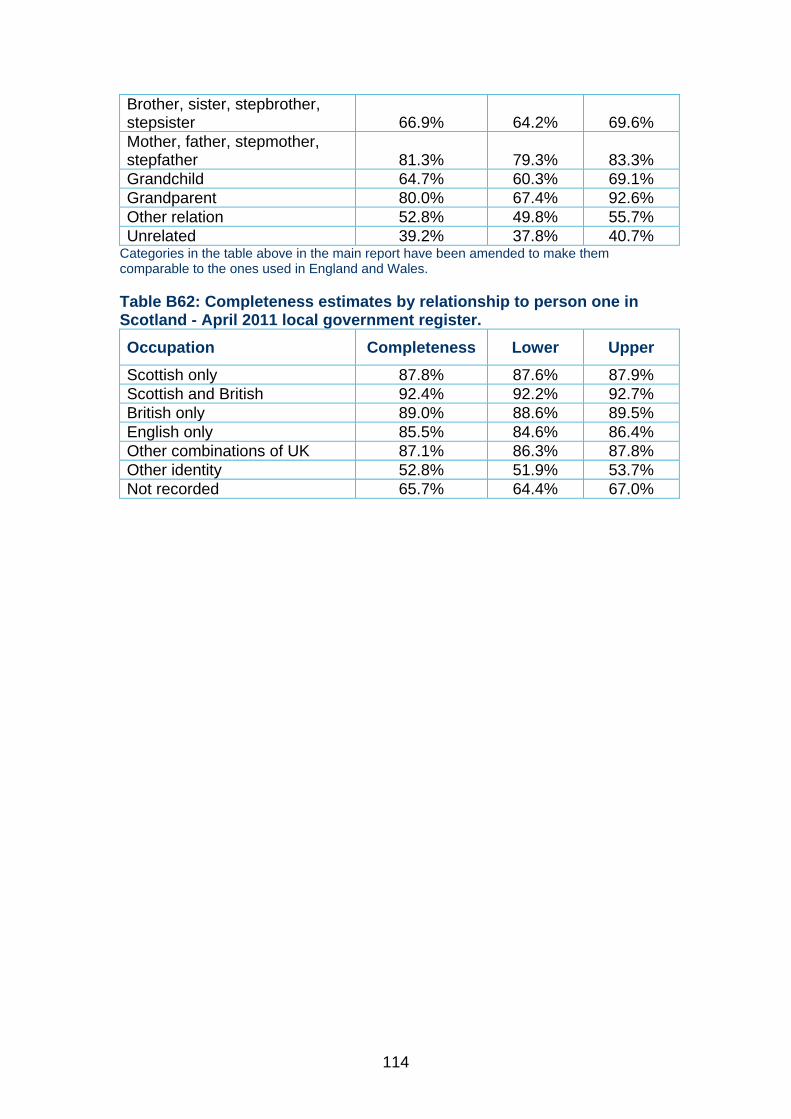
114
Brother, sister, stepbrother, stepsister 66.9% 64.2% 69.6% Mother, father, stepmother, stepfather 81.3% 79.3% 83.3% Grandchild 64.7% 60.3% 69.1% Grandparent 80.0% 67.4% 92.6% Other relation 52.8% 49.8% 55.7% Unrelated 39.2% 37.8% 40.7%
Categories in the table above in the main report have been amended to make them comparable to the ones used in England and Wales. Table B62: Completeness estimates by relationship to person one in Scotland - April 2011 local government register. Occupation Completeness Lower Upper Scottish only 87.8% 87.6% 87.9% Scottish and British 92.4% 92.2% 92.7% British only 89.0% 88.6% 89.5% English only 85.5% 84.6% 86.4% Other combinations of UK 87.1% 86.3% 87.8% Other identity 52.8% 51.9% 53.7% Not recorded 65.7% 64.4% 67.0%
115
Appendix C: Regression analysis C.1 ONS used statistical modelling to quantify the relative degree that individual covariates affect the probability of a person who is eligible and responded in the 2011 Census of being on the local government electoral register. This allows multiple covariates to be included simultaneously, giving their effect when other factors have been controlled for. Matching of eligible census respondents to the electoral register was used as a dichotomous response variable and the individual covariates considered in Chapter 3 of this report.
Model selection C.2 A logistic regression model was fitted to the data. This models the possible explanatory factors as linearly related to the probability of electoral registration for individual i, using the “link function” below, where pi is the probability that individual i will be on the electoral register, xij is the value of the jth explanatory covariate for the jth individual, and β j is the estimated size of the effect of the jth explanatory variable.
0 1 1log ... ,1
ii n in
i
p x xp
β β β= + + +−
C.3 Whether an explanatory variable is included within the model was determined via a stepwise process, where each possible explanatory variable was considered in turn for the model, then accepted or rejected depending on whether it was statistically significant. For simplicity, some of the categorical variables have had categories collapsed. All variables tested, except nationality, were selected for inclusion in the final model (table C1).
C.4 Nationality is highly correlated with country of birth, which is included. The logistic model describes the impact of each explanatory covariate on the predicted registration rate. A positive coefficient implies that the covariate increases predicted registration, while a negative coefficient indicates that the covariate reduces predicted registration.
C.5 The selected model, with estimated coefficients and their associated standard, is shown in table C1. Note that the p values are individual tests of each level of the covariate, but the global test may be significant even if all p values for each level are insignificant. The estimated coefficients can be converted to odds ratios to allow easier interpretation of the model.
C.6 An odds ratio indicates the impact of a particular level for a covariate, compared to a reference level. The odds ratios, calculated from the model shown in table C1, for each region compared to the reference category (Yorkshire) are shown in table C2.
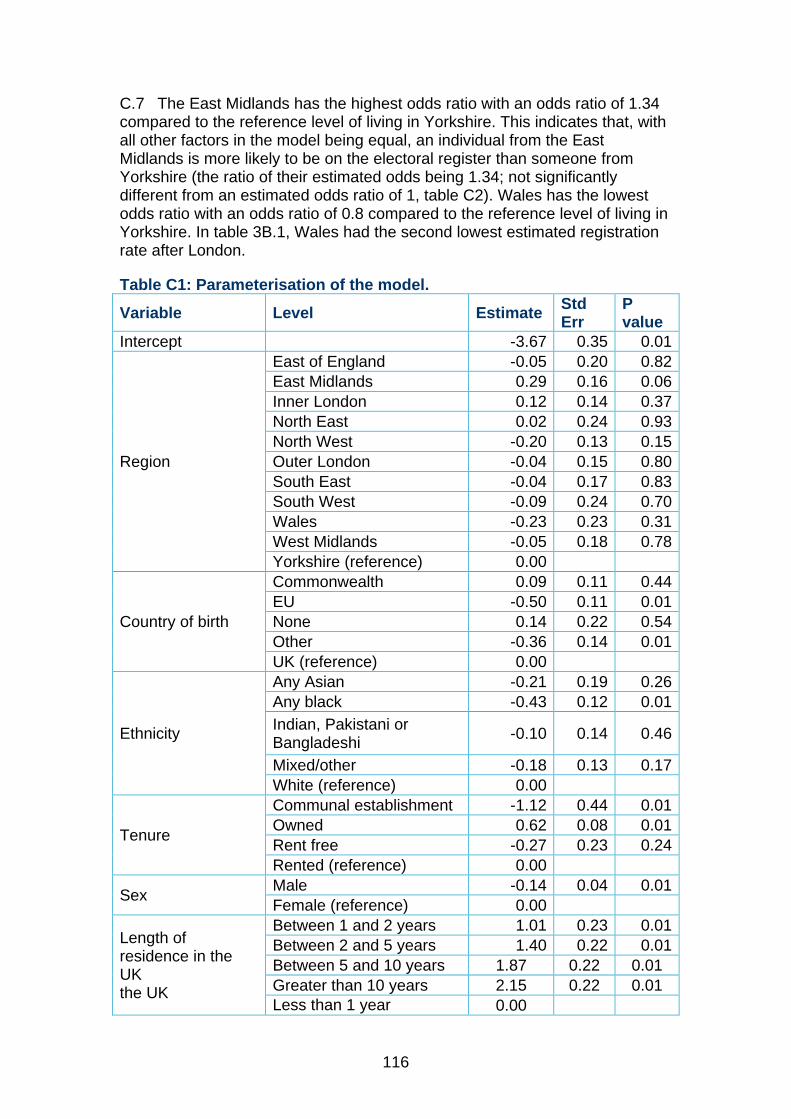
116
C.7 The East Midlands has the highest odds ratio with an odds ratio of 1.34 compared to the reference level of living in Yorkshire. This indicates that, with all other factors in the model being equal, an individual from the East Midlands is more likely to be on the electoral register than someone from Yorkshire (the ratio of their estimated odds being 1.34; not significantly different from an estimated odds ratio of 1, table C2). Wales has the lowest odds ratio with an odds ratio of 0.8 compared to the reference level of living in Yorkshire. In table 3B.1, Wales had the second lowest estimated registration rate after London.
Table C1: Parameterisation of the model. Variable Level Estimate Std
Err P value
Intercept -3.67 0.35 0.01
Region
East of England -0.05 0.20 0.82 East Midlands 0.29 0.16 0.06 Inner London 0.12 0.14 0.37 North East 0.02 0.24 0.93 North West -0.20 0.13 0.15 Outer London -0.04 0.15 0.80 South East -0.04 0.17 0.83 South West -0.09 0.24 0.70 Wales -0.23 0.23 0.31 West Midlands -0.05 0.18 0.78 Yorkshire (reference) 0.00
Country of birth
Commonwealth 0.09 0.11 0.44 EU -0.50 0.11 0.01 None 0.14 0.22 0.54 Other -0.36 0.14 0.01 UK (reference) 0.00
Ethnicity
Any Asian -0.21 0.19 0.26 Any black -0.43 0.12 0.01 Indian, Pakistani or Bangladeshi -0.10 0.14 0.46
Mixed/other -0.18 0.13 0.17 White (reference) 0.00
Tenure
Communal establishment -1.12 0.44 0.01 Owned 0.62 0.08 0.01 Rent free -0.27 0.23 0.24 Rented (reference) 0.00
Sex Male -0.14 0.04 0.01 Female (reference) 0.00
Length of residence in the UK the UK
Between 1 and 2 years 1.01 0.23 0.01 Between 2 and 5 years 1.40 0.22 0.01 Between 5 and 10 years 1.87 0.22 0.01 Greater than 10 years 2.15 0.22 0.01 Less than 1 year
0.00
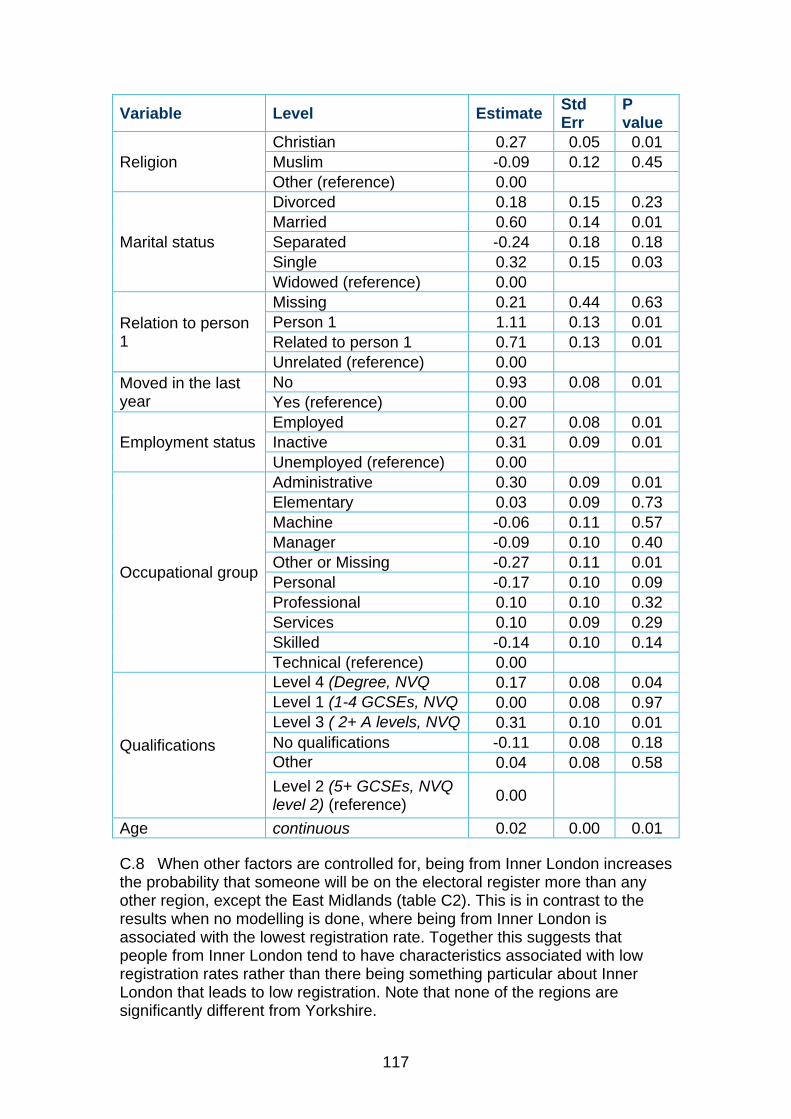
117
Variable Level Estimate Std Err
P value
Religion Christian 0.27 0.05 0.01 Muslim -0.09 0.12 0.45 Other (reference) 0.00
Marital status
Divorced 0.18 0.15 0.23 Married 0.60 0.14 0.01 Separated -0.24 0.18 0.18 Single 0.32 0.15 0.03 Widowed (reference) 0.00
Relation to person 1
Missing 0.21 0.44 0.63 Person 1 1.11 0.13 0.01 Related to person 1 0.71 0.13 0.01 Unrelated (reference) 0.00
Moved in the last year
No 0.93 0.08 0.01 Yes (reference) 0.00
Employment status Employed 0.27 0.08 0.01 Inactive 0.31 0.09 0.01 Unemployed (reference) 0.00
Occupational group
Administrative 0.30 0.09 0.01 Elementary 0.03 0.09 0.73 Machine -0.06 0.11 0.57 Manager -0.09 0.10 0.40 Other or Missing -0.27 0.11 0.01 Personal -0.17 0.10 0.09 Professional 0.10 0.10 0.32 Services 0.10 0.09 0.29 Skilled -0.14 0.10 0.14 Technical (reference) 0.00
Qualifications
Level 4 (Degree, NVQ
0.17 0.08 0.04 Level 1 (1-4 GCSEs, NVQ
0.00 0.08 0.97
Level 3 ( 2+ A levels, NVQ
0.31 0.10 0.01 No qualifications -0.11 0.08 0.18 Other
0.04 0.08 0.58 Level 2 (5+ GCSEs, NVQ level 2) (reference) 0.00
Age continuous 0.02 0.00 0.01
C.8 When other factors are controlled for, being from Inner London increases the probability that someone will be on the electoral register more than any other region, except the East Midlands (table C2). This is in contrast to the results when no modelling is done, where being from Inner London is associated with the lowest registration rate. Together this suggests that people from Inner London tend to have characteristics associated with low registration rates rather than there being something particular about Inner London that leads to low registration. Note that none of the regions are significantly different from Yorkshire.
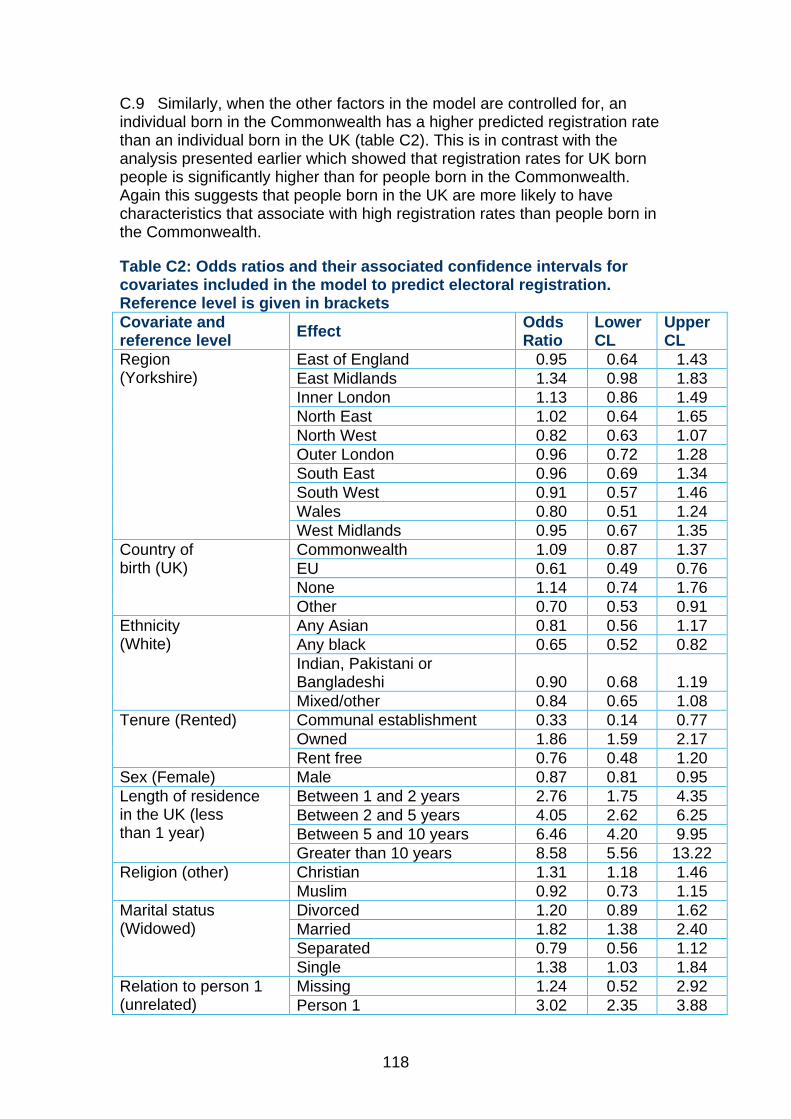
118
C.9 Similarly, when the other factors in the model are controlled for, an individual born in the Commonwealth has a higher predicted registration rate than an individual born in the UK (table C2). This is in contrast with the analysis presented earlier which showed that registration rates for UK born people is significantly higher than for people born in the Commonwealth. Again this suggests that people born in the UK are more likely to have characteristics that associate with high registration rates than people born in the Commonwealth.
Table C2: Odds ratios and their associated confidence intervals for covariates included in the model to predict electoral registration. Reference level is given in brackets Covariate and reference level Effect Odds
Ratio Lower CL
Upper CL
Region (Yorkshire)
East of England 0.95 0.64 1.43 East Midlands 1.34 0.98 1.83 Inner London 1.13 0.86 1.49 North East 1.02 0.64 1.65 North West 0.82 0.63 1.07 Outer London 0.96 0.72 1.28 South East 0.96 0.69 1.34 South West 0.91 0.57 1.46 Wales 0.80 0.51 1.24 West Midlands 0.95 0.67 1.35
Country of birth (UK)
Commonwealth 1.09 0.87 1.37 EU 0.61 0.49 0.76 None 1.14 0.74 1.76 Other 0.70 0.53 0.91
Ethnicity (White)
Any Asian 0.81 0.56 1.17 Any black 0.65 0.52 0.82 Indian, Pakistani or Bangladeshi 0.90 0.68 1.19 Mixed/other 0.84 0.65 1.08
Tenure (Rented) Communal establishment 0.33 0.14 0.77 Owned 1.86 1.59 2.17 Rent free 0.76 0.48 1.20
Sex (Female) Male 0.87 0.81 0.95 Length of residence in the UK (less than 1 year)
Between 1 and 2 years 2.76 1.75 4.35 Between 2 and 5 years 4.05 2.62 6.25 Between 5 and 10 years 6.46 4.20 9.95 Greater than 10 years 8.58 5.56 13.22
Religion (other) Christian 1.31 1.18 1.46 Muslim 0.92 0.73 1.15
Marital status (Widowed)
Divorced 1.20 0.89 1.62 Married 1.82 1.38 2.40 Separated 0.79 0.56 1.12 Single 1.38 1.03 1.84
Relation to person 1 (unrelated)
Missing 1.24 0.52 2.92 Person 1 3.02 2.35 3.88
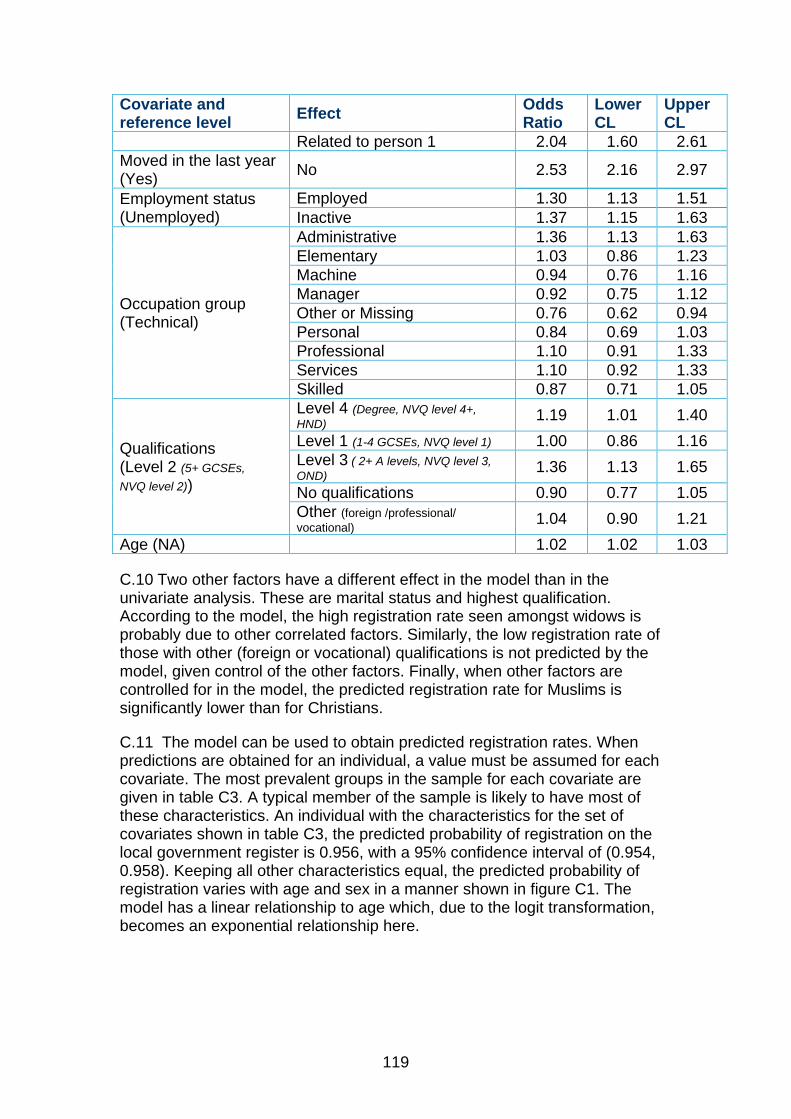
119
Covariate and reference level Effect Odds
Ratio Lower CL
Upper CL
Related to person 1 2.04 1.60 2.61 Moved in the last year (Yes) No 2.53 2.16 2.97
Employment status (Unemployed)
Employed 1.30 1.13 1.51 Inactive 1.37 1.15 1.63
Occupation group (Technical)
Administrative 1.36 1.13 1.63 Elementary 1.03 0.86 1.23 Machine 0.94 0.76 1.16 Manager 0.92 0.75 1.12 Other or Missing 0.76 0.62 0.94 Personal 0.84 0.69 1.03 Professional 1.10 0.91 1.33 Services 1.10 0.92 1.33 Skilled 0.87 0.71 1.05
Qualifications (Level 2 (5+ GCSEs, NVQ level 2))
Level 4 (Degree, NVQ level 4+, HND) 1.19 1.01 1.40 Level 1 (1-4 GCSEs, NVQ level 1) 1.00 0.86 1.16 Level 3 ( 2+ A levels, NVQ level 3, OND) 1.36 1.13 1.65 No qualifications 0.90 0.77 1.05 Other (foreign /professional/ vocational) 1.04 0.90 1.21
Age (NA) 1.02 1.02 1.03
C.10 Two other factors have a different effect in the model than in the univariate analysis. These are marital status and highest qualification. According to the model, the high registration rate seen amongst widows is probably due to other correlated factors. Similarly, the low registration rate of those with other (foreign or vocational) qualifications is not predicted by the model, given control of the other factors. Finally, when other factors are controlled for in the model, the predicted registration rate for Muslims is significantly lower than for Christians.
C.11 The model can be used to obtain predicted registration rates. When predictions are obtained for an individual, a value must be assumed for each covariate. The most prevalent groups in the sample for each covariate are given in table C3. A typical member of the sample is likely to have most of these characteristics. An individual with the characteristics for the set of covariates shown in table C3, the predicted probability of registration on the local government register is 0.956, with a 95% confidence interval of (0.954, 0.958). Keeping all other characteristics equal, the predicted probability of registration varies with age and sex in a manner shown in figure C1. The model has a linear relationship to age which, due to the logit transformation, becomes an exponential relationship here.
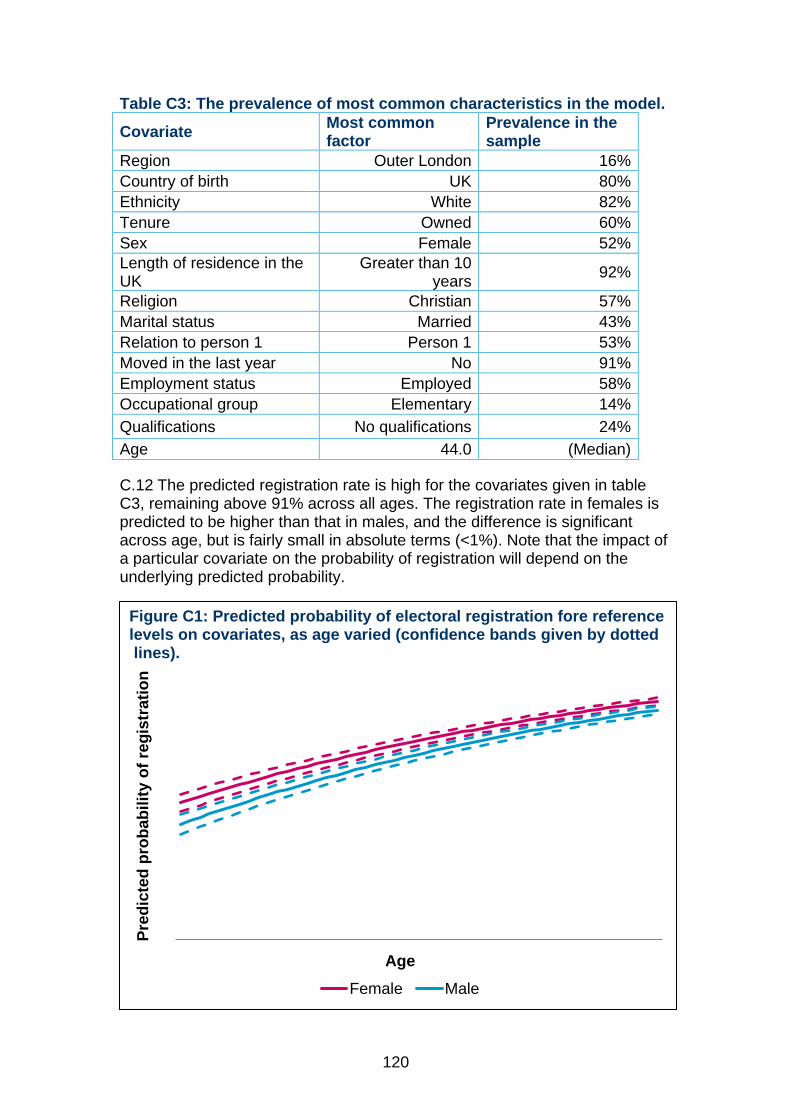
120
Table C3: The prevalence of most common characteristics in the model.
Covariate Most common factor
Prevalence in the sample
Region Outer London 16% Country of birth UK 80% Ethnicity White 82% Tenure Owned 60% Sex Female 52% Length of residence in the UK
Greater than 10 years 92%
Religion Christian 57% Marital status Married 43% Relation to person 1 Person 1 53% Moved in the last year No 91% Employment status Employed 58% Occupational group Elementary 14% Qualifications No qualifications 24% Age 44.0 (Median)
C.12 The predicted registration rate is high for the covariates given in table C3, remaining above 91% across all ages. The registration rate in females is predicted to be higher than that in males, and the difference is significant across age, but is fairly small in absolute terms (<1%). Note that the impact of a particular covariate on the probability of registration will depend on the underlying predicted probability.
Pred
icte
d pr
obab
ility
of r
egis
trat
ion
Age Female Male
Figure C1: Predicted probability of electoral registration fore reference levels on covariates, as age varied (confidence bands given by dotted lines).
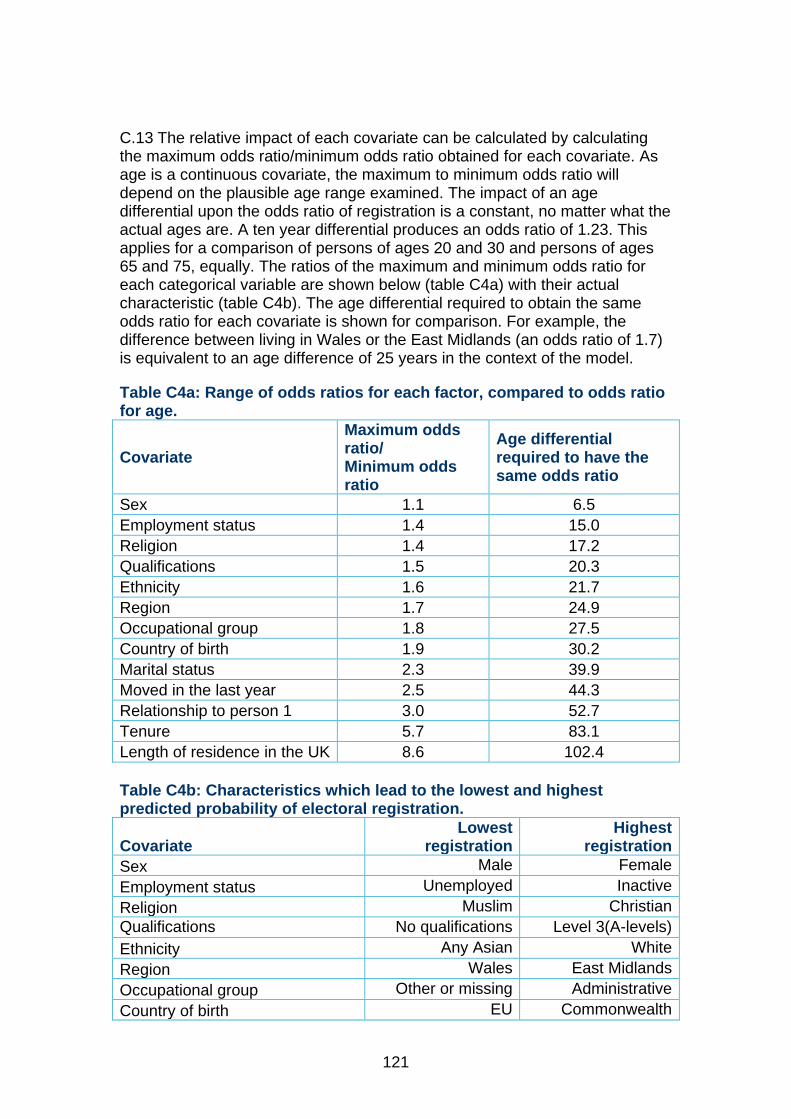
121
C.13 The relative impact of each covariate can be calculated by calculating the maximum odds ratio/minimum odds ratio obtained for each covariate. As age is a continuous covariate, the maximum to minimum odds ratio will depend on the plausible age range examined. The impact of an age differential upon the odds ratio of registration is a constant, no matter what the actual ages are. A ten year differential produces an odds ratio of 1.23. This applies for a comparison of persons of ages 20 and 30 and persons of ages 65 and 75, equally. The ratios of the maximum and minimum odds ratio for each categorical variable are shown below (table C4a) with their actual characteristic (table C4b). The age differential required to obtain the same odds ratio for each covariate is shown for comparison. For example, the difference between living in Wales or the East Midlands (an odds ratio of 1.7) is equivalent to an age difference of 25 years in the context of the model.
Table C4a: Range of odds ratios for each factor, compared to odds ratio for age.
Covariate Maximum odds ratio/ Minimum odds ratio
Age differential required to have the same odds ratio
Sex 1.1 6.5 Employment status 1.4 15.0 Religion 1.4 17.2 Qualifications 1.5 20.3 Ethnicity 1.6 21.7 Region 1.7 24.9 Occupational group 1.8 27.5 Country of birth 1.9 30.2 Marital status 2.3 39.9 Moved in the last year 2.5 44.3 Relationship to person 1 3.0 52.7 Tenure 5.7 83.1 Length of residence in the UK 8.6 102.4 Table C4b: Characteristics which lead to the lowest and highest predicted probability of electoral registration.
Covariate Lowest
registration Highest
registration Sex Male Female Employment status Unemployed Inactive Religion Muslim Christian Qualifications No qualifications Level 3(A-levels) Ethnicity Any Asian White Region Wales East Midlands Occupational group Other or missing Administrative Country of birth EU Commonwealth
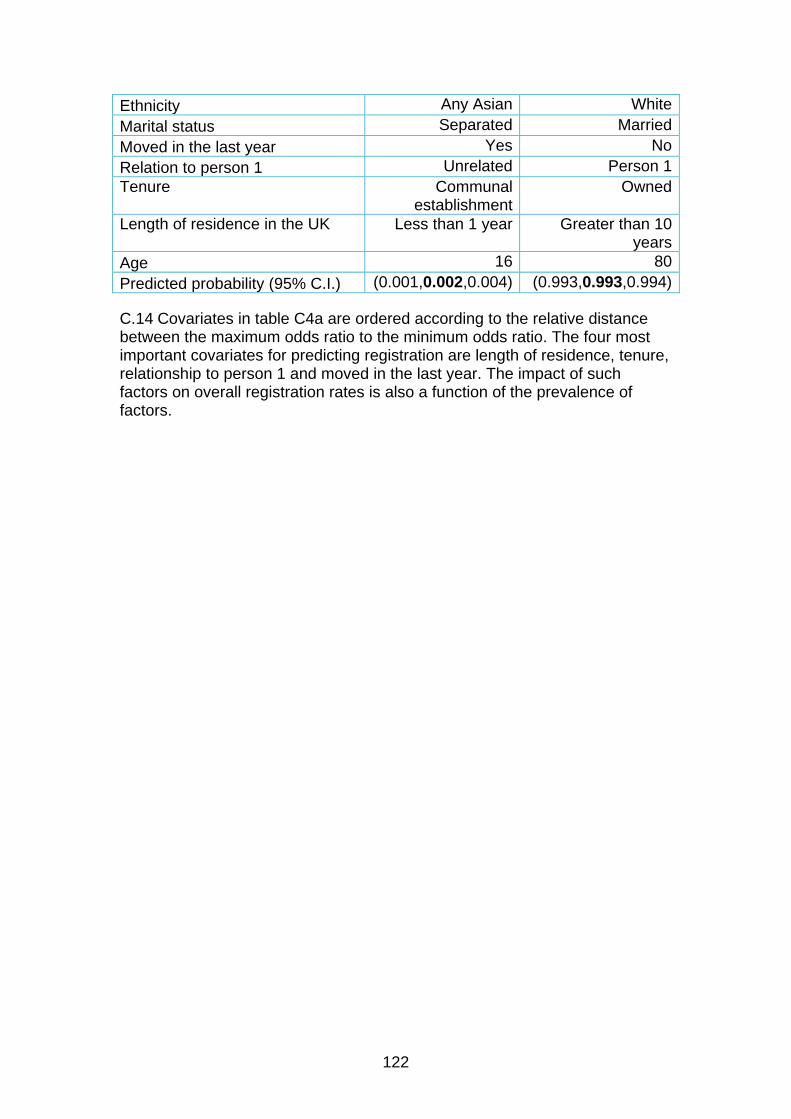
122
Ethnicity Any Asian White Marital status Separated Married Moved in the last year Yes No Relation to person 1 Unrelated Person 1 Tenure Communal
establishment Owned
Length of residence in the UK Less than 1 year Greater than 10 years
Age 16 80 Predicted probability (95% C.I.) (0.001,0.002,0.004) (0.993,0.993,0.994)
C.14 Covariates in table C4a are ordered according to the relative distance between the maximum odds ratio to the minimum odds ratio. The four most important covariates for predicting registration are length of residence, tenure, relationship to person 1 and moved in the last year. The impact of such factors on overall registration rates is also a function of the prevalence of factors.
123
Appendix D: Summaries of previous electoral registration research D.1 In Chapter 2, we presented different methods to estimate the quality of the electoral registers. Summaries of previous studies on the electoral registers, divided by method used, are presented below.
House to house surveys D.2 House to house survey is the methodology that was used for two recent studies conducted for the Electoral Commission.
The accuracy and completeness of electoral registers in Great Britain (March 2010) D.3 This case study looked at the accuracy and completeness of eight local authority electoral registers from April 2009, selected to ensure a mixture of urban and rural as well as a cross-section of affluent and less affluent areas with a geographical spread.89
D.4 The case study consisted of data-mining of the registers, a random house-to-house survey in each of the areas to assess the accuracy and completeness of the registers; and interviews with electoral registration administrators to learn more about their approach to updating the registers.
D.5 The sample was not nationally representative so estimates for accuracy and completeness for Great Britain could not be provided. The study found that accuracy and completeness are strongly associated with population movement, confirming findings from previous studies. The eight local authorities illustrated that the issues faced when registering electors can be specific to the demographics of the area and the type of authority.
D.6 It is therefore not surprising that the research confirmed that accuracy and completeness rates can vary quite significantly between local authority areas. For example, Knowsley, an area with a limited population movement, had the highest rate of completeness (94%) while in Lambeth, densely populated with a young and mobile population, the completeness rate was 73%.
89 The case study areas were: Derby, Glasgow City, Hambleton, Knowsley, Lambeth, South Ayrshire, Swansea and West Somerset.

124
Great Britain’s electoral registers (December 2011) D.7 This study, funded by the Cabinet Office, was the first national survey of its kind into the quality of the registers. It was the first time this method was used to assess both accuracy and completeness at national level, although the main elements of the methodology were previously tested in ‘The accuracy and completeness of electoral registers in Great Britain’ (2010).
D.8 The 2011 study was based on a survey of a nationally representative sample with trained interviewers gathering information from residents which were checked against the details held on the April 2011 electoral registers.
D.9 The sample was a multi-stage probability sample (‘random’) sample. Fifty local authorities across Great Britain were selected; within each of these local authorities five local government wards were selceted. Within each of these wards, 31-32 addresses were selected (totalling 7,845) from the small-user post-code address file (PAF); this was designed to yield on average about 20 interviews per ward, or a total of 5,000 across Great Britain. The 50 local authorities were selected randomly for inclusion in the research, stratified by nation/English region, local authority type and population density; the selection of wards within the local authorities was stratified by social class composition.90
D.10 The study found the April 2011 parliamentary registers to be 82.3% complete (local government registers, 82%) and 85.5% accurate (local government 85.4%). The completeness estimate equated to approximately 8.5 million unregistered people in Great Britain.
D.11 Using data gathered during the study, rough estimates of the completeness of the December 2010 register were produced which found these registers to be 85-87% complete (at least 6 million people missing).
D.12 The study confirmed findings from previous research with a clear relationship between accuracy and completeness and certain demographic factors such as mobility, age and housing tenure.
Estimates based on census data D.13 This is the approach taken for the research presented in this report.
D.14 The census has been conducted every ten years since 1801 and it is designed to count all people and households in the country to provide a snapshot of the population and its characteristics. It is the most complete source of information about the population, covering everyone at the same time.
90 More information on the methodology of the 2011 study can be found in Appendix A of the report Great Britain’s electoral registers 2011 (December 2011).
125
D.15 Data was collected through a postal questionnaire sent to every household, but people were also able to complete and submit the questionnaire online. Efforts are made to ensure everyone is covered: the Census Coverage Survey (CCS) is a voluntary survey carried out shortly after the census and is conducted to assess coverage, to estimate the population missed by the census, and to allow for adjustments to the census results based on those who did not respond.
D.16 In 2011, census day, when every household was required to complete their form, was 27 March. In England and Wales, the census is planned and carried out by the Office for National Statistics; in Scotland this responsibility lies with the National Records of Scotland and in Northern Ireland with the Northern Ireland Statistics and Research Agency.
D.17 In order to assess the quality of the electoral registers, a sample of census returns combined with data from the Census Coverage Survey can be cross-matched against the electoral registers to derive estimates of accuracy and completeness. Due to the timing of the census, this exercise has only been possible every 10 years.
D.18 Estimates of the quality of the registers have been produced using census data from 1966, 1981, 1991, 2001 and 2011.
D.19 These estimates have involved a comparison of data collected via the census with information held on the equivalent electoral registers, but there have been some differences in the methodologies used and what exactly has been reported on.
1966 and 1981 Census D.20 The first study on the quality of the registers of this type was conducted on the 1965 (October) registers in England and Wales using data from the 1966 Census. The research found the register to be 96% complete directly following the completion of the annual canvass.91
D.21 The following electoral register/census study was carried out by the Office for Population Censuses and Surveys (OPCS) on the October 1980 registers across Great Britain, matched against a sample of 10,481 records from the 1981 Census.
D.22 The study found that 6.5% of eligible electors were not registered, with non-registration to be much higher in Inner London than in any other areas. People from ethnic minorities and those who had just become eligible to vote were found to be more likely to be missing from the registers.
D.23 The research also found that between 10.4% and 13.5% of the names on the April 1981 registers belonged to people who, by that time, were not 91 P. G. Gray and A. Gee, Electoral registration for parliamentary elections: an enquiry made for the Home Office (HMSO: London, 1967). At this time the registers were published in February rather than in December.
126
living at the address listed in the registers. The OPCS also estimated that the proportion of names on the registers that were inaccurate at the October 1980 qualifying date was between 6.1% and 9.4%.
1991 Census D.24 The 1991 Electoral Register Check was undertaken by the OPCS and commissioned by the Home Office, the Scottish Home Office and Health Department.
D.25 The study was conducted on the October 1990 registers and was based on a sample of 6,000 households that returned a census form in Great Britain. It also used the Census Validation Survey (CVS) to measure and adjust for census non-response at the England & Wales level.92
D.26 Of the 12,827 private residents in the sample, 9,652 were considered to be eligible to register. The results indicted non-registration to be 7.1% in Great Britain. This compares to 4.5% in 1966 and 6.5% in 1981. The study found non-registration to be significantly higher in Inner London and for younger age groups.
D.27 The study also found that at least between 6% and 7.9% of the names listed at addresses which were occupied at the time of the census did not correspond with people living there at the time. However, unlike the 1981 study, an estimate for the percentage of names on the registers that were listed at addresses which were unoccupied at the time of the census was not added to this percentage.
2001 Census D.28 The Electoral Commission reported on the quality of the 2001 England and Wales registers in its 2005 report, Understanding electoral registration.93 The study, conducted by ONS, considered the completeness of the registers as of the qualifying date for registration for the February 2001 register (which at that time was 15 October 2000).
D.29 The report was based on a register check conducted by ONS, involving a comparison of population and registration data. However, it was not possible to repeat the approach taken previously because two components of the earlier studies could not be undertaken retrospectively – the Census Coverage Survey and the library-based register analysis. Instead, a composite population sample was created by ONS based upon the address sample of the Labour Force Survey (LFS) at the time of the qualifying date of October 2000, plus census data for non-responding households in the LFS address sample. This joint sample of 23,963 eligible adults was then matched against electronic versions of the electoral register published in February 2001. 92 The 1991 Census Validation Survey (CVS) was used to check the coverage and quality of the 1991 Census and it was decided it would also provide the best opportunity to check the coverage of the 1991 electoral registers. 93 The Electoral Commission, Understanding electoral registration (September 2005)
127
D.30 The February 2001 register was selected because of its proximity to the 2001 Census. Rolling registration was then introduced on 16 February 2001, which meant that new electors could apply to go on to the register on an ongoing basis, rather than having to wait until a canvass was conducted.
D.31 ONS found that non-registration among the eligible household population in England and Wales at 15 October 2000 was between 8% and 9%. This means that in the region of 3.5 million people across England and Wales eligible to be on the register at their main residence in October 2000 were missing from it.94
D.32 The research on the 2001 Census did not include an analysis of the accuracy of the registers.
94 The Electoral Commission, Understanding electoral registration (September 2005).