Embed Size (px)
Citation preview
Electric Circuits lab BME 311 Biomedical Engineering Department
Experiments: (1A),(1B)
Introduction to Basic Laboratory Test and Measurement Equipments
Part A: 1. The DC Power Supply:
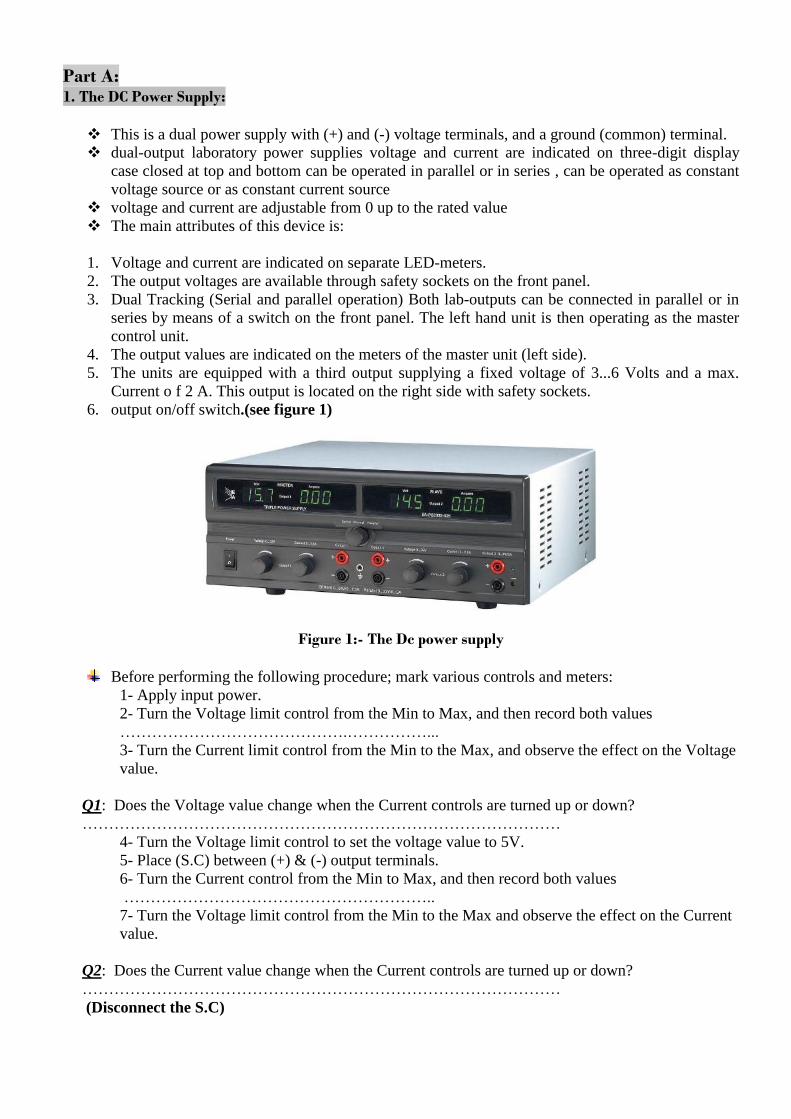
This is a dual power supply with (+) and (-) voltage terminals, and a ground (common) terminal.
dual-output laboratory power supplies voltage and current are indicated on three-digit display
case closed at top and bottom can be operated in parallel or in series , can be operated as constant
voltage source or as constant current source
voltage and current are adjustable from 0 up to the rated value
The main attributes of this device is:
1. Voltage and current are indicated on separate LED-meters.
2. The output voltages are available through safety sockets on the front panel.
3. Dual Tracking (Serial and parallel operation) Both lab-outputs can be connected in parallel or in
series by means of a switch on the front panel. The left hand unit is then operating as the master
control unit.
4. The output values are indicated on the meters of the master unit (left side).
5. The units are equipped with a third output supplying a fixed voltage of 3...6 Volts and a max.
Current o f 2 A. This output is located on the right side with safety sockets.
6. output on/off switch.(see figure 1)
Figure 1:- The Dc power supply
Before performing the following procedure; mark various controls and meters:
1- Apply input power.
2- Turn the Voltage limit control from the Min to Max, and then record both values
…………………………………….……………...
3- Turn the Current limit control from the Min to the Max, and observe the effect on the Voltage
value.
Q1: Does the Voltage value change when the Current controls are turned up or down?
………………………………………………………………………………
4- Turn the Voltage limit control to set the voltage value to 5V.
5- Place (S.C) between (+) & (-) output terminals.
6- Turn the Current control from the Min to Max, and then record both values
…………………………………………………..
7- Turn the Voltage limit control from the Min to the Max and observe the effect on the Current
value.
Q2: Does the Current value change when the Current controls are turned up or down?
………………………………………………………………………………
(Disconnect the S.C)
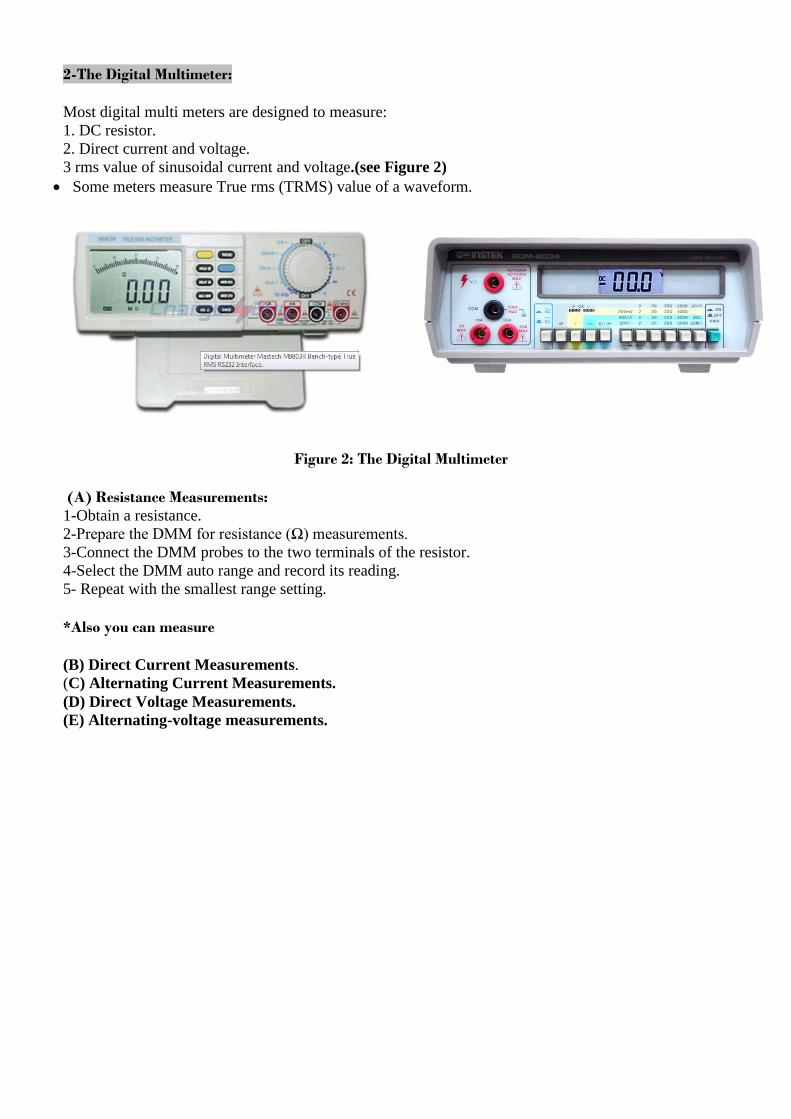
2-The Digital Multimeter:
Most digital multi meters are designed to measure:
1. DC resistor.
2. Direct current and voltage.
3 rms value of sinusoidal current and voltage.(see Figure 2)
Some meters measure True rms (TRMS) value of a waveform.
Figure 2: The Digital Multimeter
(A) Resistance Measurements:
1-Obtain a resistance.
2-Prepare the DMM for resistance (Ω) measurements.
3-Connect the DMM probes to the two terminals of the resistor.
4-Select the DMM auto range and record its reading.
5- Repeat with the smallest range setting.
*Also you can measure
(B) Direct Current Measurements.
(C) Alternating Current Measurements.
(D) Direct Voltage Measurements.
(E) Alternating-voltage measurements.
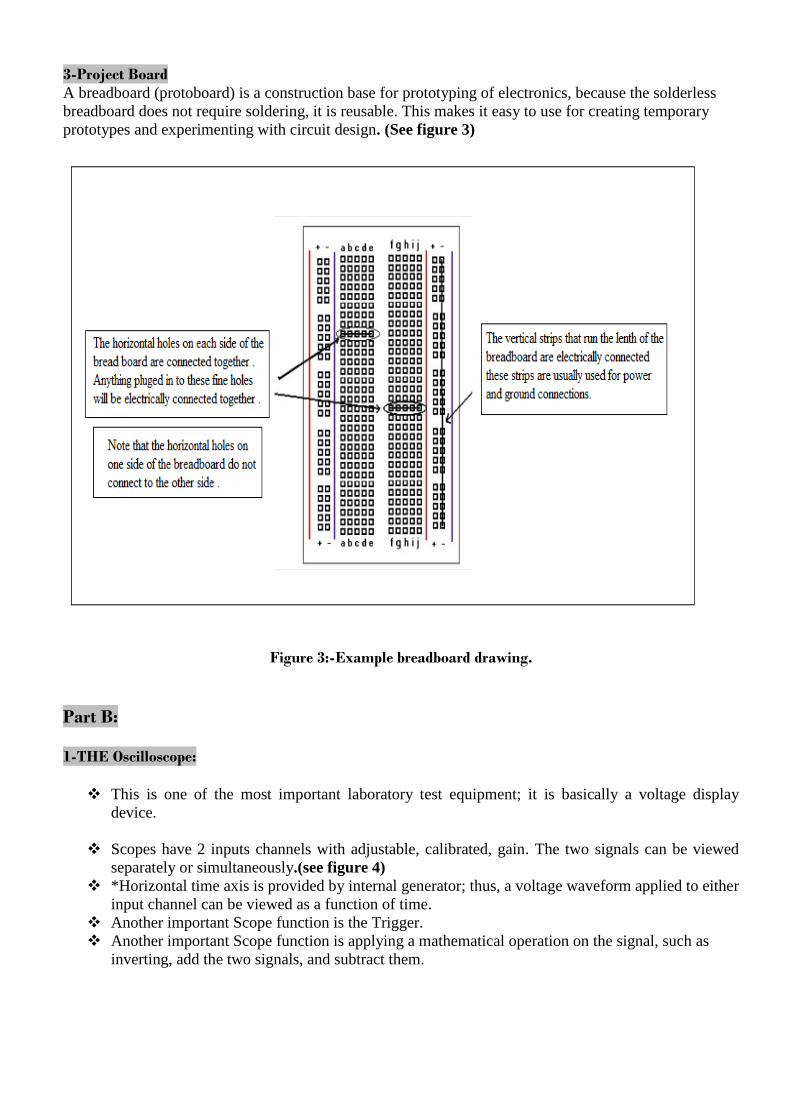
3-Project Board
A breadboard (protoboard) is a construction base for prototyping of electronics, because the solderless
breadboard does not require soldering, it is reusable. This makes it easy to use for creating temporary
prototypes and experimenting with circuit design. (See figure 3)
Figure 3:-Example breadboard drawing.
Part B:
1-THE Oscilloscope:
This is one of the most important laboratory test equipment; it is basically a voltage display
device.
Scopes have 2 inputs channels with adjustable, calibrated, gain. The two signals can be viewed
separately or simultaneously.(see figure 4)
*Horizontal time axis is provided by internal generator; thus, a voltage waveform applied to either
input channel can be viewed as a function of time.
Another important Scope function is the Trigger.
Another important Scope function is applying a mathematical operation on the signal, such as
inverting, add the two signals, and subtract them.
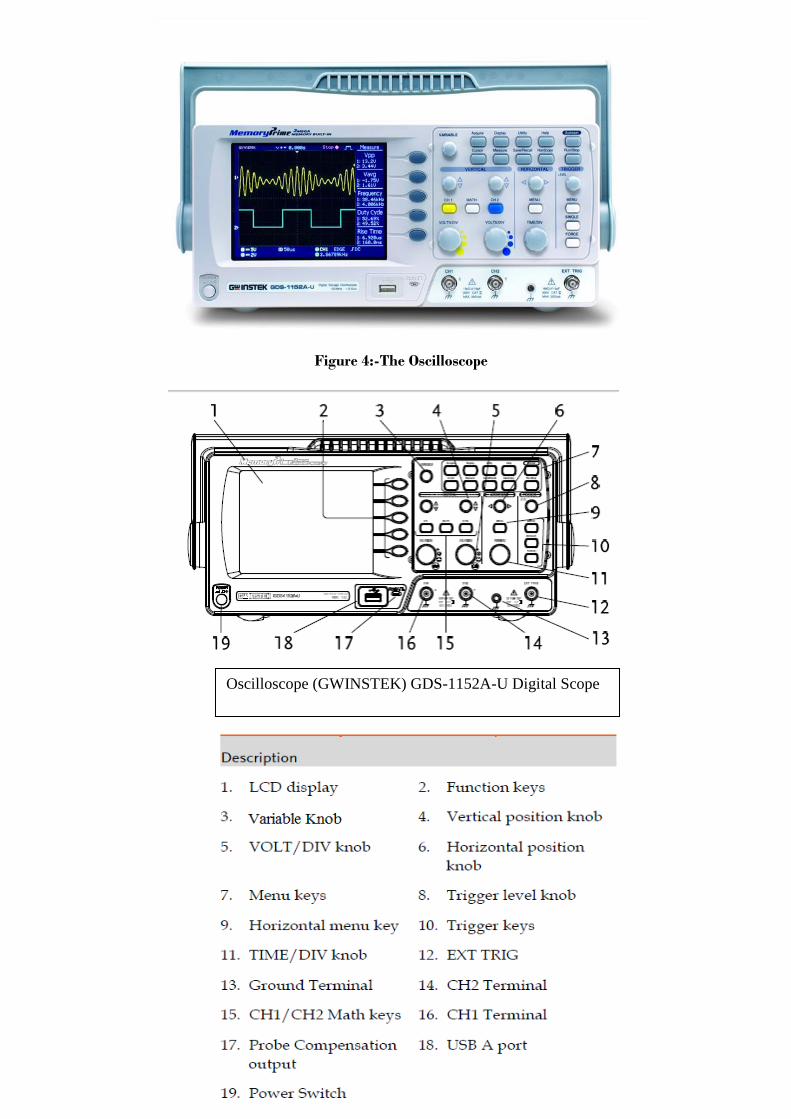
Figure 4:-The Oscilloscope
Oscilloscope (GWINSTEK) GDS-1152A-U Digital Scope
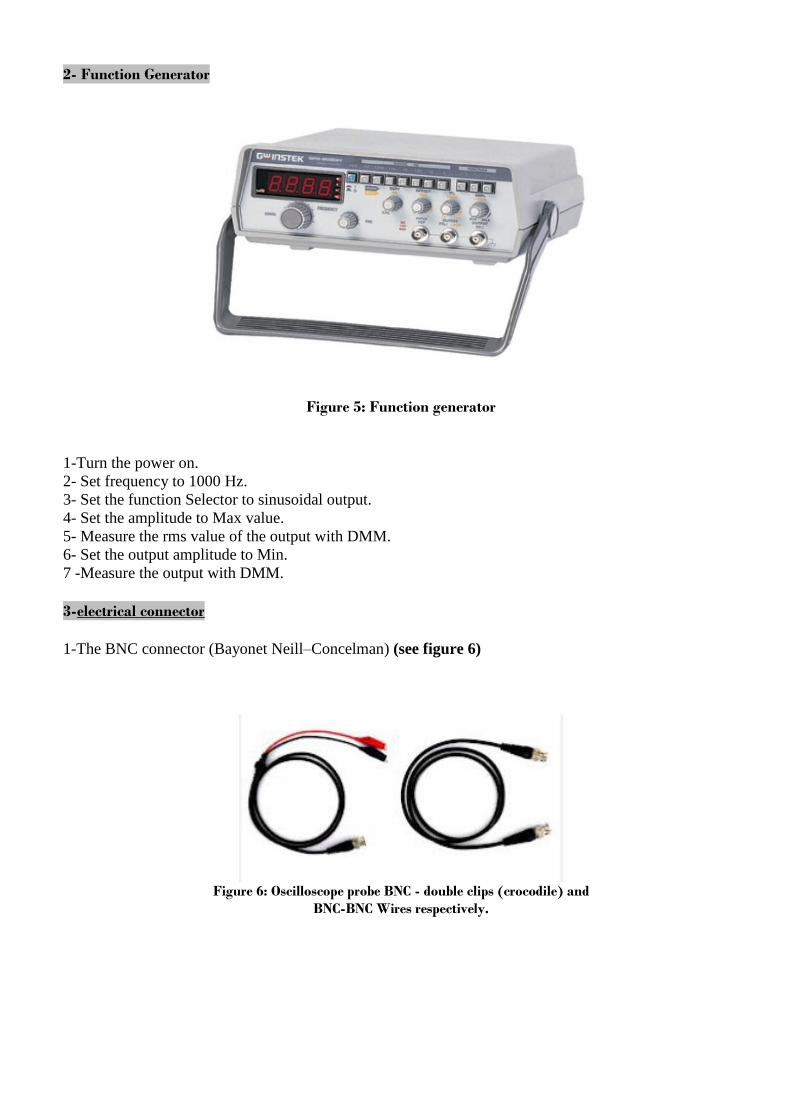
2- Function Generator
Figure 5: Function generator
1-Turn the power on.
2- Set frequency to 1000 Hz.
3- Set the function Selector to sinusoidal output.
4- Set the amplitude to Max value.
5- Measure the rms value of the output with DMM.
6- Set the output amplitude to Min.
7 -Measure the output with DMM.
3-electrical connector
1-The BNC connector (Bayonet Neill–Concelman) (see figure 6)
Figure 6: Oscilloscope probe BNC - double clips (crocodile) and
BNC-BNC Wires respectively.

2- Banana connectors. (See figure 7)
Figure 7: Banana plug to Banana plug wire
3- Banana Plug to Alligator (crocodile) Clip wire. (See figure 8)
Figure 8: Banana to crocodile connector

Electric Circuits lab BME 311 Biomedical Engineering Department
LAB SHEET 1
Experiment 2
Resistors, potentiometers, and Rheostats

Resistance Measurements: Several methods will be used to measure resistance. Their results will be compared with each other and
with nominal color-code value.
1-obtain two resistors having arbitrary values between 100 ohms and 100 K ohms and arbitrary power
ratings.
2-Tabulate their color codes, nominal values, percent tolerances, and power ratings.
(A) Ohmmeter Measurements:
1-Use the DMM to measure the value of each resistor directly on the most sensitive range.
R1 (measured)……………………………………………..
R2 (measured) …………………………………………….
2-Compare with the nominal values.
3-As an aside, measure and record your body resistance by holding the probes firmly. One with each
hand …………………………………..
(B) Voltage and Current Measurements:
Construct a measurement circuit as shown in the figure 1, where Rx is the resistance to be determined by
Ohm’s law:
Figure 1
1- Set each DMM to the highest possible range.
2- Increase Vs from 0 to near the highest responsible value. (Within limits that are safe for the resistor Rx )
(See the table next page).
Color-code Nominal value
(Calculated)
Tolerance Power
rating
(R1)
Brown-black-brown -Gold
(R2)
Red-red-red-Gold
Rx=Vx/Ix.

Vs (V) 3 5 10
Ix
Vx
Rx=Vx/Ix
3- Decrease the range setting of each DMM steps.
4- Record the measure value of Vx, Ix.
5-Calculate the value of Rx by the Ohm’s law.
(C) Bridge Measurements:
A Wheatstone bridge for measuring resistance is shown in Figure 2. When the Bridge is balanced,
i.e.,Ib=0,
Figure 2
The following relation holds:
Rx=R2*R3/R1
*Derive this formula in your report.
*Generally, a good measurement is obtained when all Resistors values are not too
far from each other; for example, within a factor of 3 or less.
1-Select reasonable values for R1and R2, and measure them with the DMM before placing them in the
Circuit.
2- Use decade box for the adjustable resistor R3.Use approximately 10 V for Vs.
3- Set the DMM initially to the highest Current range. As you adjust R3 to make Ib approach 0, increase
the DMM sensitivity. Stop adjusting when a minimum value of Ib is obtained on the lowest possible
range. Record this value for reference only.
4- Disconnect R3 and measure it directly with the DMM………………………..
5-Calculate the value of unknown Rx using above formula.
6- Compare with the nominal values.

Potentiometers
Two popular shapes of Potentiometers are:
1-Circular
2-Straight lines
Potentiometers are used as a:-
1) Voltage current device.
2) Current control device.
Rheostat: A rheostat is similar to a Potentiometer in structure. However, it differs in its intended use it is used as a
series element to control Current as shown in figure 3.
Thus, it is usually a higher-power device .To demonstrate its principle, one of the Potentiometer you
tested may be used in the following measurements.
Figure 4
Rheostat Measurements:
For the circuit shown in the figure 4. Obtain a Potentiometer, Select Ro such that the maximum
variation in the Current Io is 5 to 1.Measure and record the value of Ro.
Construct the circuit using 10 v for vs. starting at safe DMM current range measure Io on the lowest
possible range using the 4 marked sections of the potentiometer for Rs, i.e, 0,25,50,75.and 100 percent.
Plot Io Vs Rs, what functional relation does this plot indicates?
Rs (K ) Io
5
4
3
2
1
Electric Circuits lab BME 311 Biomedical Engineering Department
Post lab #1
Experiment 2
Resistors, potentiometers, and Rheostat
1. Student Name ………………………………………………………………………
Student ID…………………………………………………………………………..
2. Student Name ………………………………………………………………………
Student ID…………………………………………………………………………..
3. Student Name ………………………………………………………………………
Student ID…………………………………………………………………………..
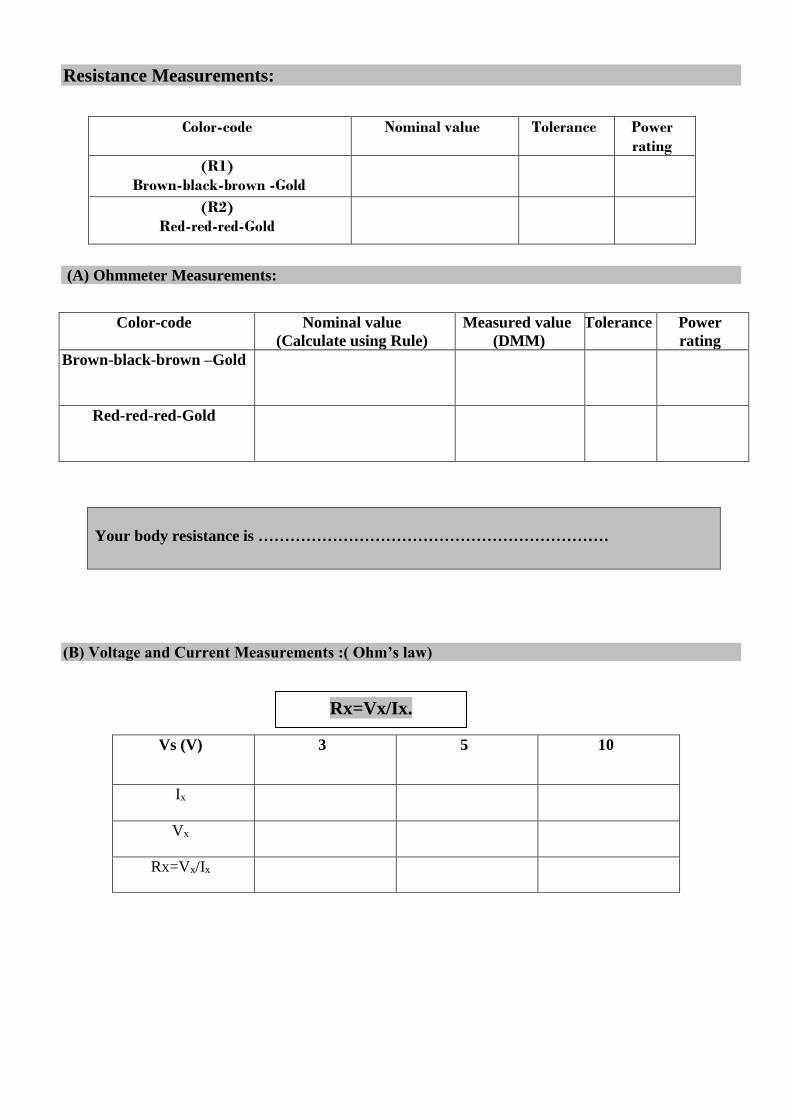
Resistance Measurements:
(A) Ohmmeter Measurements:
(B) Voltage and Current Measurements :( Ohm’s law)
Vs (V) 3 5 10
Ix
Vx
Rx=Vx/Ix
Color-code Nominal value Tolerance Power
rating
(R1)
Brown-black-brown -Gold
(R2)
Red-red-red-Gold
Color-code Nominal value
(Calculate using Rule)
Measured value
(DMM)
Tolerance Power
rating
Brown-black-brown –Gold
Red-red-red-Gold
Your body resistance is …………………………………………………………
Rx=Vx/Ix.

*Plot Ix vs Vx
(C) Bridge Measurements:
Rx=1
3*2
R
RR only when Ib=0
*Derive this formula:-
R3= ………..
Calculate the value of unknown Rx using above formula, Compare with the nominal values.
Rheostat Measurements:
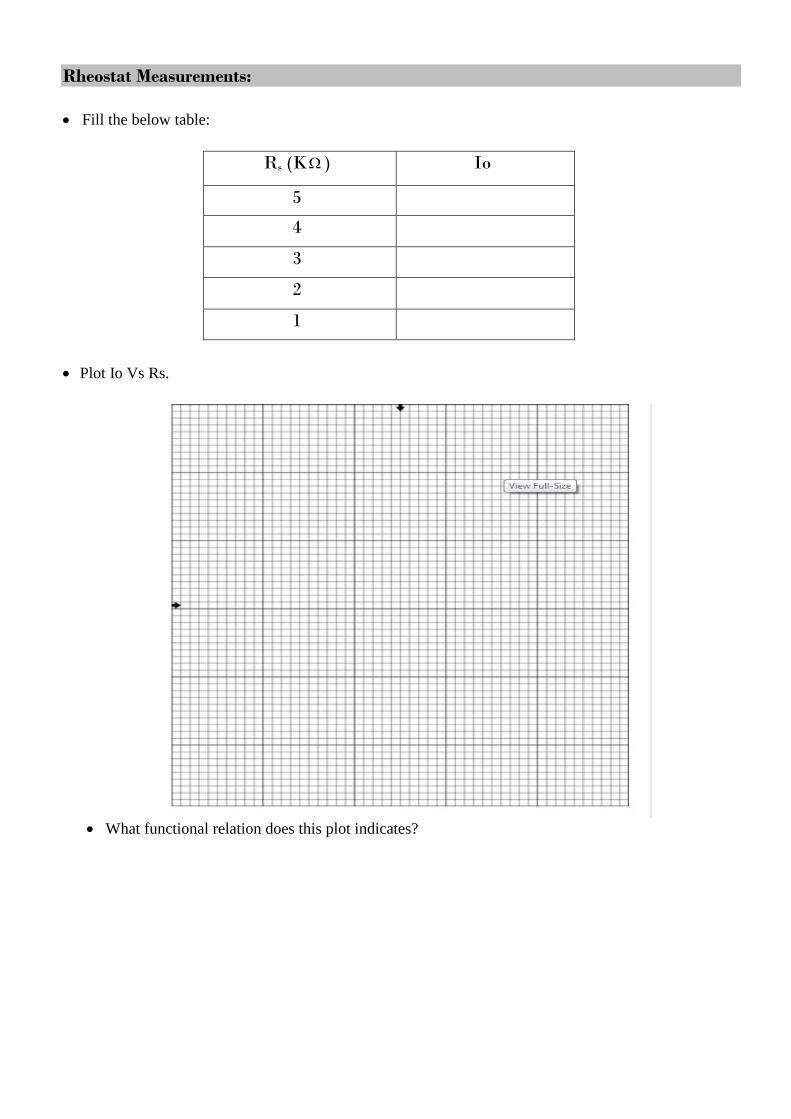
Fill the below table:
Rs (K ) Io
5
4
3
2
1
Plot Io Vs Rs.
What functional relation does this plot indicates?

Write a small paragraph which discuss your results and give your Conclusion about all
parts of this experiment.
1. ………………………………………………………………………………………
…………………………………………………………………………………………
…………………………………………………………………………………
2. ………………………………………………………………………………………
…………………………………………………………………………………………
……………………………………………………………………………........
3. ………………………………………………………………………………………
…………………………………………………………………………………………
………………………………………………………………………………….
4. ………………………………………………………………………………………
…………………………………………………………………………………………
………………………………………………………………………………….
5. ………………………………………………………………………………………
…………………………………………………………………………………………
………………………………………………………………………………….
6. ………………………………………………………………………………………
…………………………………………………………………………………………
……………………………………………………………………………….....

Electric Circuits lab BME 311 Biomedical Engineering Department
LAB SHEET 2
Experiment 3A
Dc Circuit Measurements
Part A

Part One:-Series Circuits
Kirchhoff's Voltage Law (KVL) states that the sum of voltages around a closed path is zero.
Use R1=330 Ω,R2=1 K Ω,R3=2.2K Ω, then connect the circuit in Figure 1
Figure 1
1. Use DMM1 as an ammeter.
2. Use DMM2 as a voltmeter.
Measure Is……………………………………….
Note: Always start at the highest meter range.
3.Move the connection of DMM2 around the circuit to measure the voltages:
4. Disconnect the power supply from the circuit, and use DMM2 as an ohmmeter to measure the
resistances values; (you need to use the measured values of resistances and Vs to calculate the
different voltages, and compare the results with the measured values of these voltages.)
Vs/ Parameter Name Vab Vbc Vcd Vde Is
Vs=15V
Resistance name Measured Values
R1
R2
R3
Is

Part Two:-Parallel Circuits:
Kirchhoff's Current Law (KCL) states that the sum of all currents at any node in a circuit is zero.
Construct the circuit shown in figure 2 below with the given values:
Figure 2
Now, adjust Vs until DMM1 reads Vs=15 V, then measure the value of Is as indicated by DMM2,
Is=………………………………………………..
Now place DMM2 in series with R1, R2, and R3 to measure the values of the different currents:
Vs/Parameter Name I1 I2 I3
Vs=15V
Disconnect the power supply, and use DMM1 as an Ohmmeter to measure the parallel combination of
R1, R2, and R3, then measure each resistance separately, ( you need to use the measured values of
resistances and Vs to calculate the different currents, and compare the results with the measured
values of these currents.).
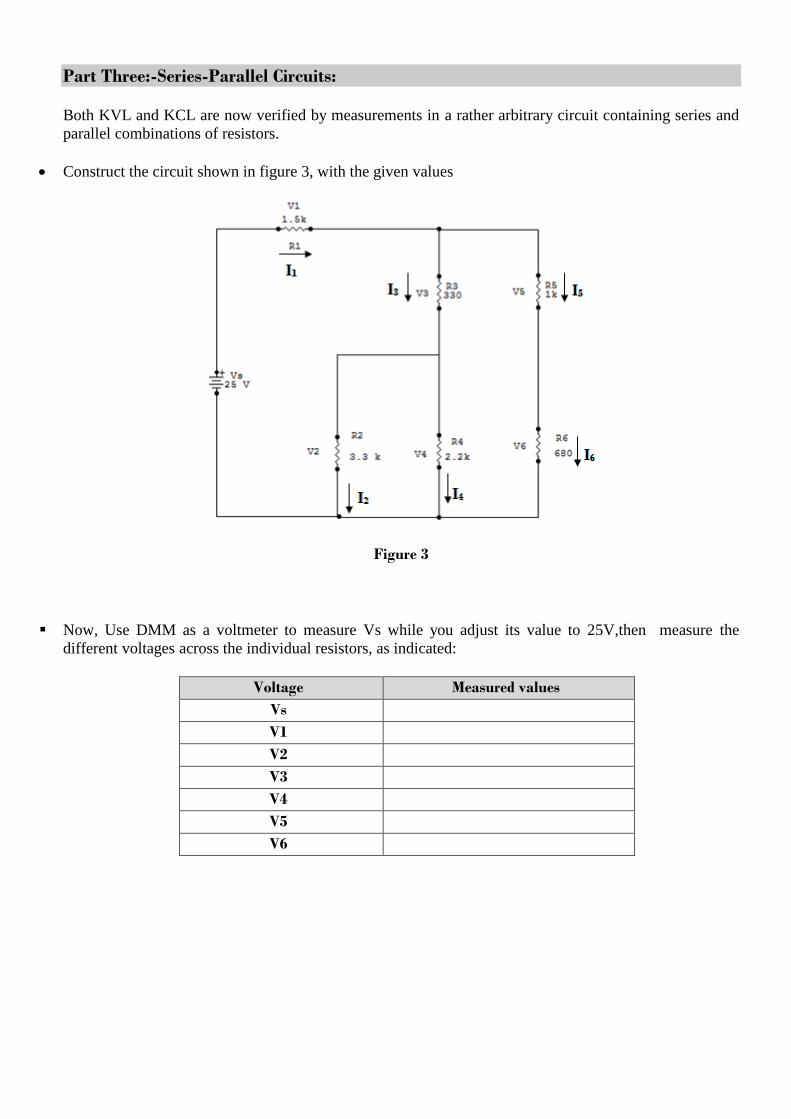
Part Three:-Series-Parallel Circuits:
Both KVL and KCL are now verified by measurements in a rather arbitrary circuit containing series and
parallel combinations of resistors.
Construct the circuit shown in figure 3, with the given values
Figure 3
Now, Use DMM as a voltmeter to measure Vs while you adjust its value to 25V,then measure the
different voltages across the individual resistors, as indicated:
Voltage Measured values
Vs
V1
V2
V3
V4
V5
V6

Now use the DMM as an ammeter to measure the different currents across the resistors, as below:
Current DMM value
I1
I2
I3
I4
I5
I6
Use the DMM as an Ohmmeter to measure the different resistances, as below:
Resistance name Measured value
R1
R2
R3
R4
R5
R6
Now, use the measured values of voltages to verify KVL on all closed paths, and use the measured values
of currents to verify KCL at all nodes. Finally, use the measured values of resistances with Ohm's law to
calculate voltages using measured currents and vice versa, then compare all the measured quantities.
Electric Circuits lab BME 311 Biomedical Engineering Department
Post lab #2
Experiment 3A
Dc Circuit Measurements
Part A
1. Student Name ………………………………………………………………………
Student ID…………………………………………………………………………..
2. Student Name ………………………………………………………………………
Student ID…………………………………………………………………………..
3. Student Name ………………………………………………………………………
Student ID…………………………………………………………………………..
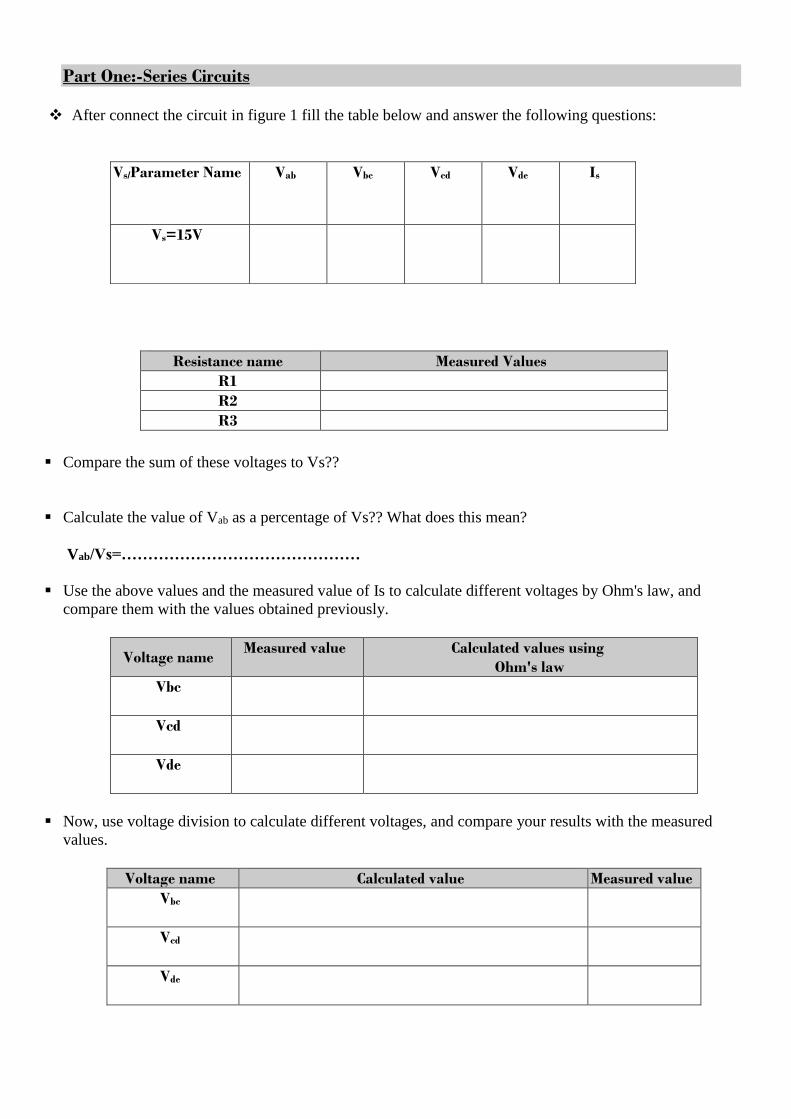
Part One:-Series Circuits
After connect the circuit in figure 1 fill the table below and answer the following questions:
Vs/Parameter Name Vab Vbc Vcd Vde Is
Vs=15V
Compare the sum of these voltages to Vs??
Calculate the value of Vab as a percentage of Vs?? What does this mean?
Vab/Vs=………………………………………
Use the above values and the measured value of Is to calculate different voltages by Ohm's law, and
compare them with the values obtained previously.
Voltage name Measured value Calculated values using
Ohm's law
Vbc
Vcd
Vde
Now, use voltage division to calculate different voltages, and compare your results with the measured
values.
Voltage name Calculated value Measured value
Vbc
Vcd
Vde
Resistance name Measured Values
R1
R2
R3
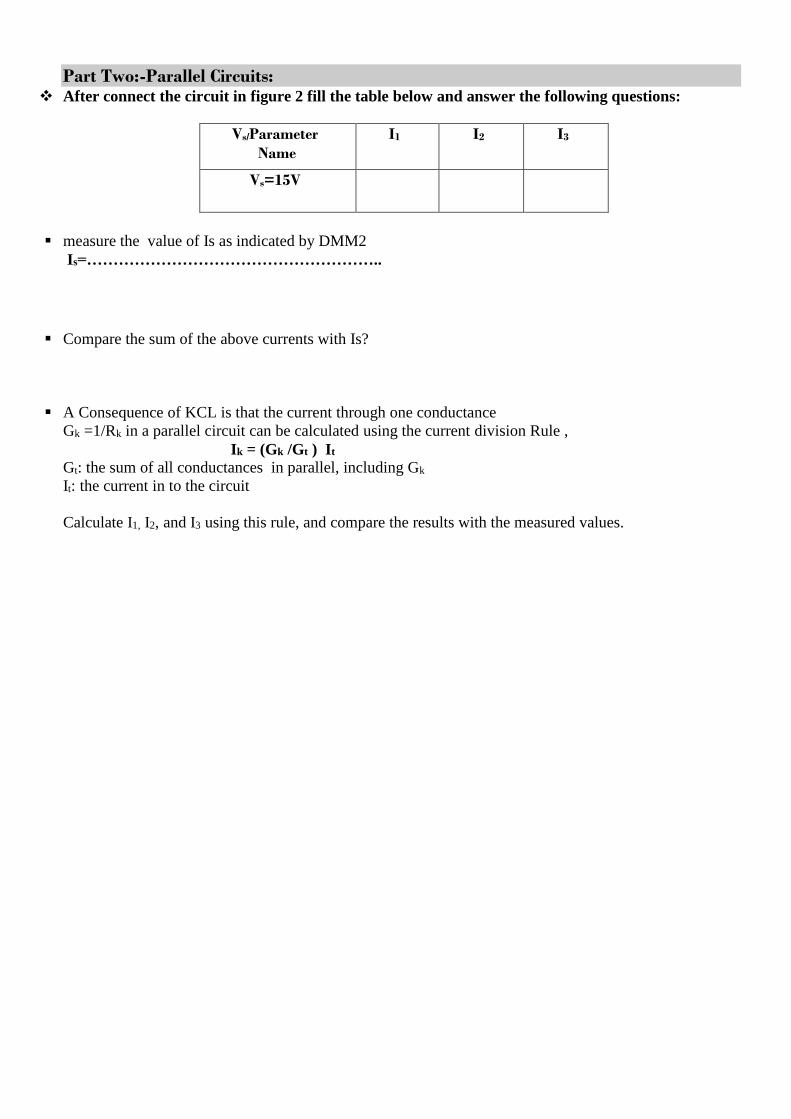
Part Two:-Parallel Circuits: After connect the circuit in figure 2 fill the table below and answer the following questions:
Vs/Parameter
Name
I1 I2 I3
Vs=15V
measure the value of Is as indicated by DMM2
Is=………………………………………………..
Compare the sum of the above currents with Is?
A Consequence of KCL is that the current through one conductance
Gk =1/Rk in a parallel circuit can be calculated using the current division Rule ,
Ik = (Gk /Gt ) It
Gt: the sum of all conductances in parallel, including Gk
It: the current in to the circuit
Calculate I1, I2, and I3 using this rule, and compare the results with the measured values.

Part Three:-Series-Parallel Circuits:
After connect the circuit in Figure 3 record the following results:-
Voltage Measured values
Vs
V1
V2
V3
V4
V5
V6
Current DMM value
I1
I2
I3
I4
I5
I6
Resistance name Measured value
R1
R2
R3
R4
R5
R6
Now, use the measured values of voltages to verify KVL on all closed paths, and use the measured values of
currents to verify KCL at all nodes. Finally, use the measured values of resistances with Ohm's law to
calculate voltages using measured currents and vice versa, then compare all the measured quantities.


Write a small paragraph which discuss your results and give your Conclusion about all
parts of this experiment.
1. ………………………………………………………………………………………
…………………………………………………………………………………………
…………………………………………………………………………………
2. ………………………………………………………………………………………
…………………………………………………………………………………………
……………………………………………………………………………........
3. ………………………………………………………………………………………
…………………………………………………………………………………………
………………………………………………………………………………….
4. …………………………………………………………………………………………
…………………………………………………………………………………………
……………………………………………………………………………….
5. ………………………………………………………………………………………
………………………………………………………………………………………
……………………………………………………………………………….
6. ………………………………………………………………………………………
………………………………………………………………………………………
……………………………………………………………………………
7. ………………………………………………………………………………………
…………………………………………………………………………………………
………………………………………………………………………………….

Electric Circuits lab BME 311 Biomedical Engineering Department
LAB SHEET 3
Experiment 3B
Dc Circuit Measurements
Part B

Part One:- Measure the I-V chars of a DC power supply limited by a current (Imax).
o Set the Coarse and Fine voltage controls and the Current Limit control to minimum.
o Set, and adjust the Current Limit control in your power supply to
(Imax or Is.c = 125 mA.) By connect short circuit between (+) and (–) terminals.
o Disconnect the short circuit, adjust the power supply for Vso = 10V.
o Connect the circuit shown in figure 1 use decade box for R1 .
R1 (Ω) ∞ 400 200 100 80 50 20 0
DMM1 (V)
DMM2 (mA)
- Readjust current limit to Imax = 80 mA
- Remove R1, adjust the power supply for Vso = 16V.
R1 (Ω) ∞ 1000 500 300 200 100 50 0
DMM1 (V)
DMM2 (mA)
Figure 1
Part Two:-Circuit Loading By Measurement Instruments.
1. Ammeter Loading
Note use the bench top multimeter (GDM-8034 ) to measure current
1. Turn both power supply voltage to Min.
2. Construct the circuit shown in figure 2.
3. Choose R=2.2K
4. Measure R Using DMM.
Figure 2

5. Adjust Voltage Source of 4 V on DMM1.
6. Record Current by DMM2.Using lowest range.
7. Move DMM1 to measure:
Va =……………………………….
Vr =………………………………
Ammeter Range
(A)
20m 200m 2000m
Calculate ra (Ω)
Va/I
2.Voltmeter Loading
Note use the bench top multimeter (M 9803 R ) to measure voltage
Measurements are now made to determine the equivalent resistance of the DMM when used at
voltmeter, and how it affects the accuracy of results:
1. Construct the Circuit shown in Figure3,R1= 470KΩ; R2 = 1 MΩ , Vs = 30 V.
Figure 3
2. Record DMM Mode number……………………………………………………..
3. Measure R1 and R2 Using ohmmeter
R1=…………………….
R2=…………………….
4. Measure V2 using lowest possible range.
5. Calculate the equivalent resistance of the DMM using the measured values of R1 and R2..
Hint Assume:
(Req//R2)=R
(R/(R+R1))*Vs=V2
I=………………..

3.Oscilloscope equivalent resistance:-
Figure 4
1. Construct the Circuit shown in figure 4.
2. Use Decade box for R2.
3. Use R1 = 1MΩ.
R1 measured……………………………………………………………
4. Set the function generator frequency to 1 KHz sine wave 8Vp-p then connect it to CH1 of the scope.
5. Connect CH2 with the voltage o/p at R2 set the scope DC coupling.
Measure Vout:
R2 R2 measured By DMM Vout
50 KΩ
1MΩ
2.2 MΩ
5 MΩ
You need to use the above results to calculate the equivalent Scope input resistance Rin using the
measured values of R1 and R2.

4.Function generator equivalent resistance:
Figure 5
1. Construct the circuit shown in figure 5 (use decade box for RL
2. Set the function generator frequency to 100 KHz sine wave With 1Vrms (Apply the o/p of function
generator to the DMM, AC measurements).
3. Measure Vo for different values of RL.
RL Vout (rms)
10 KΩ
1 KΩ
500Ω
200Ω
75 Ω
50 Ω
4. Change the frequency of function generator but keep its amplitude constant Then measure Vo. (With
RL=50Ω)
Frequency Value Vout (rms)
ƒ = 1 KHz
ƒ =10 KHz
ƒ= 100 KHz
ƒ = 1 MHz
You need to use the above results to calculate the equivalent resistance of the FG
At 10 KHz frequency.

Electric Circuits lab BME 311 Biomedical Engineering Department
Post lab #3
Experiment 3B
Dc Circuit Measurements
Part B
1. Student Name ………………………………………………………………………
Student ID…………………………………………………………………………..
2. Student Name ………………………………………………………………………
Student ID…………………………………………………………………………..
3. Student Name ………………………………………………………………………
Student ID…………………………………………………………………………..

Part One:- Measure the I-V characteristics of DC power supply limited by a current (Imax)
After connect the circuit in figure 1 fill the tables below and answer the following question:
For Imax=125mA, Vso=10V,
R1 (Ω) ∞ 400 200 100 80 50 20 0
DMM1 (V)
DMM2 (mA)
For Imax=80mA, Vso=16V,
R1 (Ω) ∞ 1000 500 300 200 100 50 0
DMM1 (V)
DMM2 (mA)
For the First table, Plot the I-V characteristics from the taken measurements. Show the load lines and the
operating points For Rl= 400, 80 and 40 Ω.

Part Two:-Circuit Loading By Measurement Instruments.
1.Ammeter Loading:
Measure R Using DMM……………………………………………………..
Record Current By DMM2.Using lowest range.
Move DMM1 to measure:
Va =……………………………….
Vr =………………………………
Ammeter Range
(A)
20m 200m 2000m
Calculate ra (Ω)
Va/I
Write your observations:-
…………………………………………………………………………………………………………….
…………………………………………………………………………………………………………….
-:Voltmeter Loading 2.
V2= …………..
R1(measured)=……………….
R2(measured)=……………….
Calculate the equivalent resistance of the DMM using the measured values of R1 and R2 ..
Hint Assume:
(Req//R2)=R
(R/(R+R1))*Vs=V2
How does this value affect the accuracy of experimental results?:-
I=………….

3.Oscilloscope equivalent resistance:-
R1 measured= ……………………………………………………………
Measure Vout:
R2 R2 measured By DMM Vout
50 KΩ
1MΩ
2 MΩ
3.3 MΩ
Use the above results to calculate the equivalent Scope input resistance Rin using the measured values of
R1 and R2 . Hint (the same equation as voltmeter)
4.Function generator equivalent resistance:
RL Vout (rms)
10 KΩ
1 KΩ
500Ω
200Ω
75 Ω
50 Ω
Frequency Value Vout (rms)
F = 1 KHz
F =10 KHz
F = 100 KHz
F = 1 MHz
-What is the difference between rms value and Vo p-p?

Use the above results to calculate the equivalent resistance of the FG at 10 KHz frequency.
Write a small paragraph which discuss your results and give your Conclusion about all
parts of this experiment.
1. ………………………………………………………………………………………
…………………………………………………………………………………………
…………………………………………………………………………………
2. ………………………………………………………………………………………
…………………………………………………………………………………………
……………………………………………………………………………........
3. ………………………………………………………………………………………
…………………………………………………………………………………………
………………………………………………………………………………….
4. …………………………………………………………………………………………
…………………………………………………………………………………………
……………………………………………………………………………….
5. ………………………………………………………………………………………
………………………………………………………………………………………
……………………………………………………………………………….
6. ………………………………………………………………………………………
………………………………………………………………………………………
……………………………………………………………………………
Electric Circuits lab BME 311 Biomedical Engineering Department
LAB SHEET 4
Experiment 4
Dc Circuit Analysis

Part One: Mesh and Nodal Analysis:
Mesh and nodal equations are proved using experimental data.
Figure 1 shows the circuit used for this purpose.
1-Measure the actual resistance values used with DMM.
2- Use a nominal 150Ω for RL.
3-Adjust the 2 outputs of the dual power supply to 16-v & 24-v using DMM
DC voltage Measured Value
16 v
24 v
4- Measure the currents I1, I2, and I3using DMM on the lowest possible range. similarly, use another
DMM to measure the node voltage Va, Vb.
Current Measured Value
I1
I2
I3
Voltage Measured Value
Va
Vb
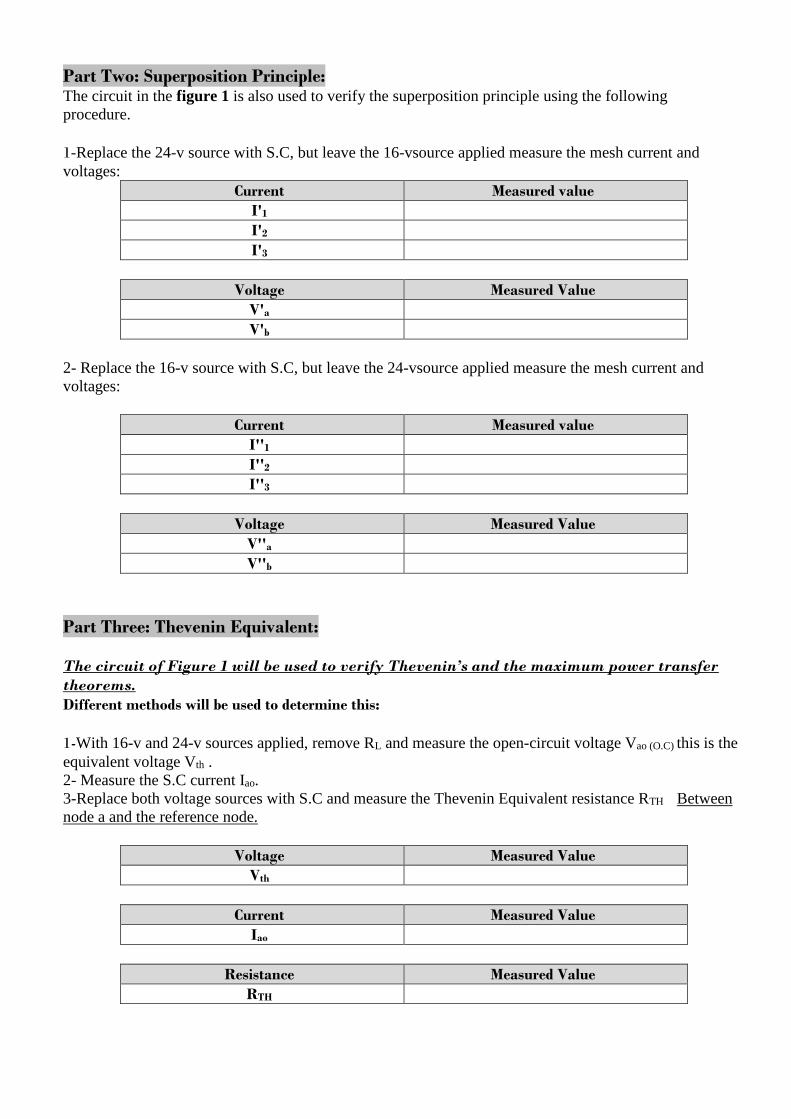
Part Two: Superposition Principle: The circuit in the figure 1 is also used to verify the superposition principle using the following
procedure.
1-Replace the 24-v source with S.C, but leave the 16-vsource applied measure the mesh current and
voltages:
Current Measured value
I'1
I'2
I'3
Voltage Measured Value
V'a
V'b
2- Replace the 16-v source with S.C, but leave the 24-vsource applied measure the mesh current and
voltages:
Current Measured value
I''1
I''2
I''3
Voltage Measured Value
V''a
V''b
Part Three: Thevenin Equivalent:
The circuit of Figure 1 will be used to verify Thevenin’s and the maximum power transfer
theorems.
Different methods will be used to determine this:
1-With 16-v and 24-v sources applied, remove RL and measure the open-circuit voltage Vao (O.C) this is the
equivalent voltage Vth .
2- Measure the S.C current Iao.
3-Replace both voltage sources with S.C and measure the Thevenin Equivalent resistance RTH Between
node a and the reference node.
Voltage Measured Value
Vth
Current Measured Value
Iao
Resistance Measured Value
RTH
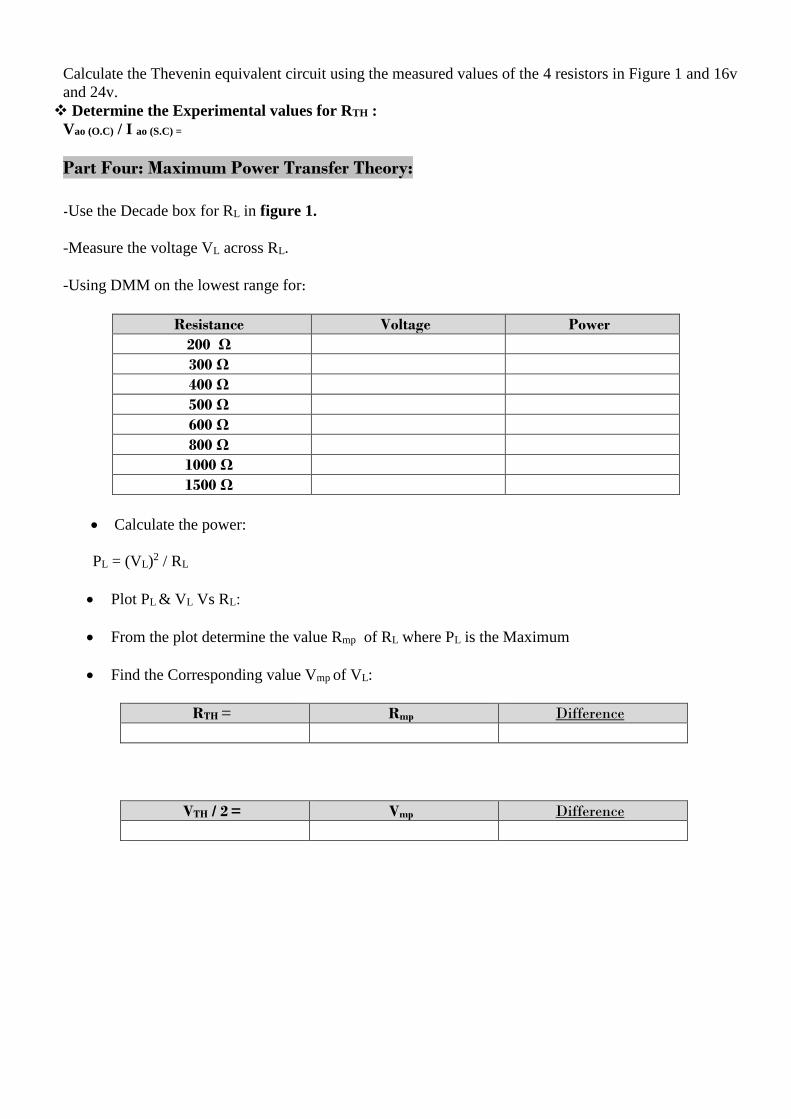
Calculate the Thevenin equivalent circuit using the measured values of the 4 resistors in Figure 1 and 16v
and 24v.
Determine the Experimental values for RTH :
Vao (O.C) / I ao (S.C) =
Part Four: Maximum Power Transfer Theory:
-Use the Decade box for RL in figure 1.
-Measure the voltage VL across RL.
-Using DMM on the lowest range for:
Resistance Voltage Power
200 Ω
300 Ω
400 Ω
500 Ω
600 Ω
800 Ω
1000 Ω
1500 Ω
Calculate the power:
PL = (VL)2 / RL
Plot PL & VL Vs RL:
From the plot determine the value Rmp of RL where PL is the Maximum
Find the Corresponding value Vmp of VL:
RTH = Rmp Difference
VTH / 2 = Vmp Difference

Part Five: Source Transformations:
Connect the circuit below
Set the short circuit current limit on each supply to about 200mA, And then set the open circuit voltages
Vs1 = 20V and Vs2 = 10V.
Construct the above circuit using 2-Watt resistors R1 = 330Ω and R2 = 100Ω. And use a decade box for
Ro.
Now use two DMM to measure Vo and Io for different values of Ro
Ro Measured Vo Measured Io
0 Ω
20 Ω
50 Ω
100 Ω
200 Ω
500 Ω
1 K Ω
5 K Ω
IS1 = VS1 / R1 =
IS2 = VS2 / R2 =
Ise = Is1 + Is2
For the Circuit Shown at the next page:
For Ise use a short-circuit-current limited supply
Set the open-circuit voltage of the power supply to a value slightly above say 10% above, the value
Req = R1//R2 = R1R2/(R1 + R2) =
Ise.[R1.R2/(R1+R2)], the value is:
Vse = Ise * Req =
Vse +10% Vse =
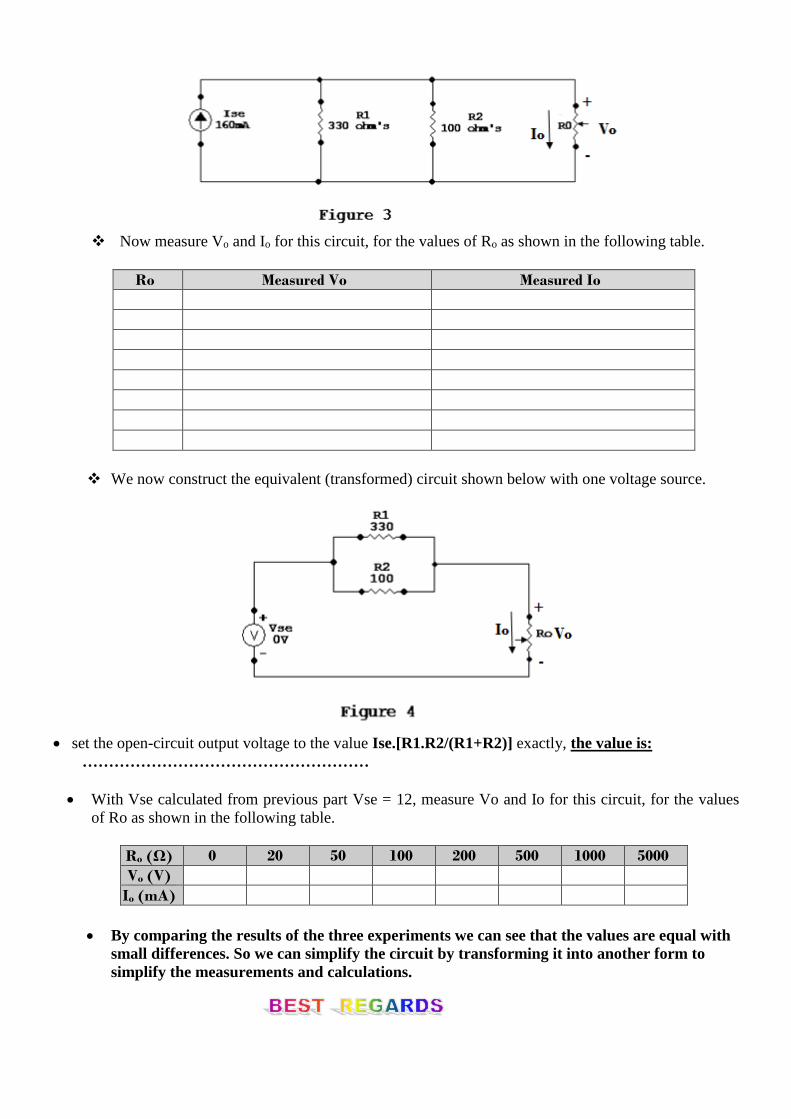
Now measure Vo and Io for this circuit, for the values of Ro as shown in the following table.
Ro Measured Vo Measured Io
0 Ω
20 Ω
50 Ω
100 Ω
200 Ω
500 Ω
1 K Ω
5 K Ω
We now construct the equivalent (transformed) circuit shown below with one voltage source.
set the open-circuit output voltage to the value Ise.[R1.R2/(R1+R2)] exactly, the value is:
………………………………………………
With Vse calculated from previous part Vse = 12, measure Vo and Io for this circuit, for the values
of Ro as shown in the following table.
Ro (Ω) 0 20 50 100 200 500 1000 5000
Vo (V)
Io (mA)
By comparing the results of the three experiments we can see that the values are equal with
small differences. So we can simplify the circuit by transforming it into another form to
simplify the measurements and calculations.

Electric Circuits lab BME 311 Biomedical Engineering Department
Post lab #4
Experiment 4
Dc Circuit Analysis
1. Student Name ………………………………………………………………………
Student ID…………………………………………………………………………..
2. Student Name ………………………………………………………………………
Student ID…………………………………………………………………………..
3. Student Name ………………………………………………………………………
Student ID…………………………………………………………………………..

Part One:- Mesh and Nodal analysis:
DC voltage Measured Value
16 v
24 v
Measure the currents I1, I2, and I3 using DMM on the lowest possible range.Similarly, use another DMM
to measure the node voltage Va, Vb.
Current Calculated Measured
Value
Difference
I1
I2
I3
Voltage Calculated Measured
Value
Difference
Va
Vb
Substitute the measured values of resistances, source voltages, and mesh currents into the mesh
equations, group all terms in every equation on one side and compare their sum with zero.
Explain any discrepancies.
Substitute the measured values of resistances and voltages into the nodal equations, group all
terms in every equation on one side and compare their sum with zero. Explain any discrepancies.

Part Two: Superposition Principle:
Replace the 24-v source with S.C, but leave the 16-vsource applied measure the mesh current and
voltages:
Current Measured value
I'1
I'2
I'3
Voltage Measured Value
V'a
V'b
Replace the 16-v source with S.C, but leave the 24-vsource applied measure the mesh current and
voltages:
Current Measured value
I''1
I''2
I''3
Voltage Measured Value
V''a
V''b
Compare the sum of each two measurement components with the corresponding total quantity
measured.
1. (I1' + I1'' = I1)
2. (I2' + I2'' = I2)
3. (I3' + I3 ''= I3)
4. (Va' + Va '' = Va)
5. (Vb' + Vb'' = Vb)
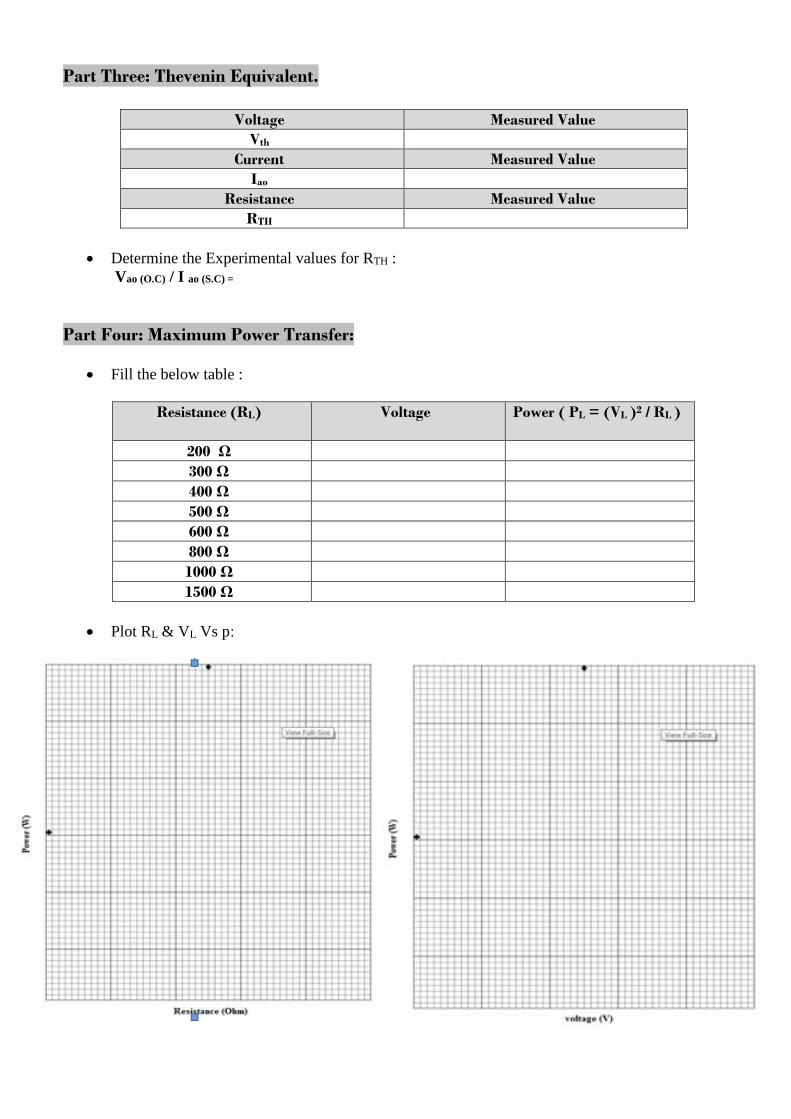
Part Three: Thevenin Equivalent.
Voltage Measured Value
Vth
Current Measured Value
Iao
Resistance Measured Value
RTH
Determine the Experimental values for RTH :
Vao (O.C) / I ao (S.C) =
Part Four: Maximum Power Transfer:
Fill the below table :
Resistance (RL) Voltage Power ( PL = (VL )2 / RL )
200 Ω
300 Ω
400 Ω
500 Ω
600 Ω
800 Ω
1000 Ω
1500 Ω
Plot RL & VL Vs p:

From the plot determine the value Rmp of RL where PL is the Maximum.
From the plot determine the Corresponding value Vmp of VL where PL is the Maximum.
RTH Rmp Difference
VTH / 2 Vmp Difference
PART FIVE: Source Transformations:
Ro Measured Vo Measured Io
0 Ω
20 Ω
50 Ω
100 Ω
200 Ω
500 Ω
1 K Ω
5 K Ω
IS1 = VS1 / R1 =
IS2 = VS2 / R2 =
Ise = Is1 + Is2
Ise * [R1.R2/(R1+R2)], the value is:
Req = R1//R2 = 21
R2*R1
RR =
Vse = Ise * Req =
Vse +10% Vse=
Ro Measured Vo Measured Io
0 Ω
20 Ω
50 Ω
100 Ω
200 Ω
500 Ω
1 K Ω
5 K Ω

set the open-circuit output voltage to the value Ise.[R1.R2/(R1+R2)] exactly, the value is:
………………………………………………
Ro Measured Vo Measured Io
0 Ω
20 Ω
50 Ω
100 Ω
200 Ω
500 Ω
1 K Ω
5 K Ω
Compare the results of the three sets of measurements made, and explain any discrepancies.
Write a small paragraph which discuss your results and give your Conclusion about
all parts of this experiment.
1. …………………………………………………………………………………………
…………………………………………………………………………………………
………………………………………………………………………………
2. ………………………………………………………………………………………
…………………………………………………………………………………………
……………………………………………………………………………........
3. ………………………………………………………………………………………
…………………………………………………………………………………………
………………………………………………………………………………….
4. ………………………………………………………………………………………
…………………………………………………………………………………………
………………………………………………………………………………….
Electric Circuits lab BME 311 Biomedical Engineering Department
LAB SHEET 5
Experiment 5A
Inductance, Capacitance I-V Relation and
Transients in RL and RC Circuits

Part One: Inductance and Capacitance Voltage-Current Relations.
1. Inductor Test:
1- Obtain the inductor decade box Use DMM to measure the DC resistance RL at 400-mH setting.
2- Construct the circuit shown in figure 1 Where Vs is 4-Vp-p, 2-KHz square wave, and Rs = 47 Ω
Figure 1
RL (measured) = Rs = 47Ω L = 400 mH
Period of input Vs( t ) (T )=( 1/F )= ………………………….
3- Display the FG output voltage V1 and V2 across Rs Make an accurate sketch of both signals showing
values of time and amplitude.
4- Calculate (L / RL ) and compare with ( T/ 2 ) Where T is the period of input Vs( t ).
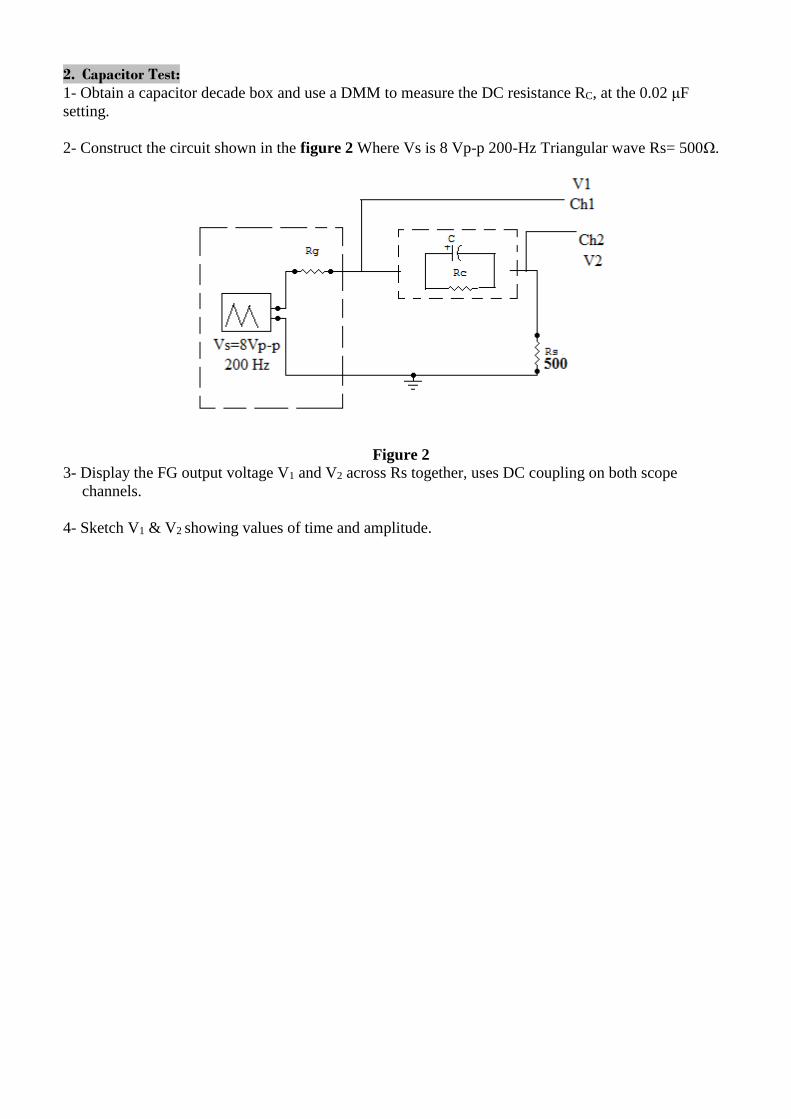
2. Capacitor Test:
1- Obtain a capacitor decade box and use a DMM to measure the DC resistance RC, at the 0.02 μF
setting.
2- Construct the circuit shown in the figure 2 Where Vs is 8 Vp-p 200-Hz Triangular wave Rs= 500Ω.
Figure 2
3- Display the FG output voltage V1 and V2 across Rs together, uses DC coupling on both scope
channels.
4- Sketch V1 & V2 showing values of time and amplitude.

Part Two: RL & RC Circuit Transients:
Circuit Transient Tests:-RL1.
Figure 3
1- Construct the RL circuit of figure 3, using R= 1 K ohm’s L = 1 H.
2- Measure the dc resistance of the inductor and the actual value of R with an Ohmmeter.
Note: Remember to record the 50-ohm’s source resistance of the FG found in previous experiment.
Rg RL R(measured)
RRgRL
L
T/2
3- Use a 100-Hz symmetrical square wave from the FG, with voltage = 4 Vp-p .
4- Connect the Oscilloscope to measure VL (t). See figure 4
Figure 4: RL and RC Transient response
6- Make an accurate sketch of VL(t) ,then expand the time scale to make an accurate measurement of τ
using the 63% change Criterion.
Record the measured value…………………………………………………….
7- measure τ using two-point method:
t1= Y1= t2= Y2= Yf=
8- Exchange the positions of R and L in the circuit to enable the display of VR By Using a common
ground between the scope and FG.

2. RC transient Tests:
Figure 5
1- For the RC circuit shown in Fig 5. Use Use a 100-Hz symmetrical square wave from the FG, with
voltage = 4 Vp-p .
2- Select R = 100 K Ω and C= 10 nF Measure the actual value of resistance R with an ohmmeter and
calculate theoretical value of the time τ = RC.
R( measured)=
τ = RC
3- Make an accurate sketch of VC(t) ,then expand the time scale to make an accurate measurement of τ
using the 63% change Criterion.
Record the measured value…………………………………………………….
4- Measure τ using two-point method:
t1= Y1= t2= Y2= Yf=
5- Exchange the positions of R and C in the circuit to enable the display of VR by using a common
ground between the scope and FG.

Electric Circuits lab BME 311 Biomedical Engineering Department
Post lab #5
Experiment 5A
Inductance, Capacitance I-V Relation and
Transients in RL and RC Circuits
Student Name ………………………………………………………………………
Student ID…………………………………………………………………………..
2. Student Name ………………………………………………………………………
Student ID…………………………………………………………………………..
3. Student Name ………………………………………………………………………
Student ID…………………………………………………………………………..

Part One: Inductance and Capacitance Voltage-Current Relations.
1. Inductor Test:
1-Use DMM to measure the DC resistance RL at 400-mH setting…………
RL = Rs = 47Ω L = 400 mH
period of input Vs( t ) (T )=
2-Make an accurate sketch of both signals showing values of time and amplitude for(Ch1,Ch2)
3-Calculate (L / RL ), then compare with the value of (T/2).
L / RL =
T / 2 =

4-Calculate an approximate expression for IL = ( 1/ L) ∫ VL dt, using the 400-mH nominal value of L,
and VL ≈ Vs( t ), then Compared with measure iL (t).
iL (t)=(1/. 4) * ∫ VL.dt =
iL =V2(t) / Rs=
5. Use VL (t) = Vs (t) and diL / dt from measurements in the expression VL (t) =L* diL / dt to calculate
an approximation value for L compare with nominal value 400 mH.(Note: use only one point to calculate
L)
2. Capacitor Test:
1-Display the FG output voltage V1 and V2 across Rs together, uses DC coupling on both scope
channels.

2- Calculate an approximate expression for iC (t) = C * dv / dt, By using the 0.02 μF Nominal value for C,
and dvc / dt = dvs / dt .then Compared with the measured iC(t).
ic(t) = C(dvC/dt) =
i Measured(t) = V2(t)/Rs =
3- In the expression VC(t)= (1/C) ∫iC(t) dt, use VC(t) ≈VS(t) and the measured iC(t) to calculate an
approximate value for C, then compare with the nominal value of .02µF.(Note: use only one point to
calculate C)
Part Two: RL & RC Circuit Transients:
Circuit Transient Tests:-RL1.
1- Measure the dc resistance of the inductor and the actual value of R with an Ohmmeter and calculate
the value of ( τ ).
Rg RL R(measured)
RRgRL
L
T/2

the 63% change criterion.then calculate ( τ ) using , (t)Lan accurate sketch of V Make -2
Record the measured value of τ =…………………………………………………….
3- measure τ using two-point method:
t1= Y1= t2= Y2= Yf=
τ= )2ln()1ln(
12
YYfYYf
tt
4- Calculate an approximate expression for IL(t) using the following formula:
IL(t)= Rtotal
Vm- [
Rtotal
Vm-Io] *e^(-t/ τ), where:
Vm= Vs(p-p)/2
Rtotal= RL+Rg+R1
Assume: Io=0A

5- Exchange the positions of R and L in the circuit to enable the display of VR By Using a common
ground between the scope and FG
6- Draw [VL(t)+V2(t) ]and compare the result with input voltage.

2.RC transient Tests:
1. Measure the actual value of resistance R with an ohmmeter and calculate theoretical value of the
time τ = RC.
R Measured =…………………………………………………
τ = RC =……………………………………………………..
riterion.) using the 63% change c τthen calculate ( , (t)can accurate sketch of V Make2.
Record the measured value of τ =…………………………………………………….
3- Measure τ using two-point method:
t1= Y1= t2= Y2= Yf=
τ= )2ln()1ln(
12
YYfYYf
tt
4- Calculate an approximate expression for Ic(t) using the following formula:
Ic(t)= Rtotal
Vm- [
Rtotal
VoVm ] *e^(-t/ τ), where:
Vm= Vs(p-p)/2
Rtotal= Rg+R1
Assume :Vo=1.8V
5- Exchange the positions of R and C in the circuit to enable the display of VR By Using a common
ground between the scope and FG.
6- Draw [VC(t)+V2(t) ]and compare the result with input voltage.

Write a small paragraph which discuss your results and give your Conclusion about all
parts of this experiment.
1. …………………………………………………………………………………………
…………………………………………………………………………………………
………………………………………………………………………………
2. ………………………………………………………………………………………
…………………………………………………………………………………………
……………………………………………………………………………........
3. ………………………………………………………………………………………
…………………………………………………………………………………………
………………………………………………………………………………….
4. ………………………………………………………………………………………
…………………………………………………………………………………………
………………………………………………………………………………….
5. ………………………………………………………………………………………
…………………………………………………………………………………………
………………………………………………………………………………….
6. ………………………………………………………………………………………
…………………………………………………………………………………………
……………………………………………………………………………….....

Electric Circuits BME 311
Biomedical Engineering Department
LAB SHEET 6
Experiment 5B
Transients in RLC Circuits

Part One: the under damped Case 1- Construct the circuit of figure 1 using the following R=1.5KΩ, L=500 mH, C=10 nF, and use a square
wave input with 4Vp-p at 100Hz frequency.
Figure 1
2-Measure the resistance of the inductor used -----------.
3-Display about 2 periods of Oscillation of voltage VR (t) which is proportional to the desired current i(t).
(See Figure 2).
4-Measure the following data:
T IP1 IP2
Note: you need these results to calculate α , ωd, , ω0 using equations (20), (21), (19)
respectively then compare these values with theoretical values .

Part Two: the Critically damped Case 1- Use the same circuit as in figure 1, but Let R: decade Box.
2-Display VR (t) on Oscilloscope, Increase R Gradually until the oscillation just disappears. Figure (3)
3-Measure the Following data:-
Rmeasured Im: Vm/R tm t1 t2 I12: V12/R Vco
4- Interchange the physical position of Rand C in the test circuit. Display VC (t) on the oscilloscope
and measure its initial value VCO.
Note: you need the above results to calculate α using equations ( 25 ), (26) and compare
these values with theoretical value obtained using equation (16),also compare the value of Im
measured directly with the value calculated using equation (24).

Part Three: the over Damped Case 1- Use the same circuit as in figure 1, but Let R=25KΩ
2-Display VR (t) on Oscilloscope, which is proportional to the desired current i(t), see Figure (4)
3-Measure the following data:
tm t1 t2 Im I1 I2
Note: you need these results to calculate α1, α, and α2 using equations (33),(34),(35) then
compare these values with theoretical values .
Electric Circuits lab BME 311 Biomedical Engineering Department
Post lab #6
Experiment 5B
Transients in RLC Circuits
1. Student Name ………………………………………………………………………
Student ID…………………………………………………………………………..
2. Student Name ………………………………………………………………………
Student ID…………………………………………………………………………..
3. Student Name ………………………………………………………………………
Student ID…………………………………………………………………………..

Part One: Under Damped Case:-
1. Sketch VR(t):-
2. Fill the below measured values:
T IP1 IP2
3. From the measured data, calculate:-
A. α from equation (22)
B. ωd from equation (21)
C. ωo from equation (19)
4. Calculate the above parameters using equations (16+17+19), then compare between the measured and
the calculated one.
Part Two: Critical damped Case
1. The value of R (decade Box) =…………………………
2. Sketch VR(t), VC(t):
3. Fill the below measured values:
Im: Vm/R tm t1 t2 I12: V/R Vco

4. From the measured data, calculate, then compare with the theoretical values:
A. α from equation (25) then from equation (26)
B. Im from equation (24)
Part Three: The Over Damped Case
1. Sketch VR(t):-
2. Fill the below measured values:
tm t1 t2 Im I1 I2

3. From the measured data, calculate, then compare with the theoretical values:
A. α1 from equation (33)
B. α from equation (34, 17)
C. α2 from equation (35)
Write a small paragraph which discuss your results and give your Conclusion about all
parts of this experiment.
1. …………………………………………………………………………………………
…………………………………………………………………………………………
………………………………………………………………………………
2. …………………………………………………………………………………………
…………………………………………………………………………………………
…………………………………………………………………………........
3. …………………………………………………………………………………………
…………………………………………………………………………………………
……………………………………………………………………………….
4. …………………………………………………………………………………………
……………………………………………………………………………………………
…………………………………………………………………………….
5. …………………………………………………………………………………………
……………………………………………………………………………………………
…………………………………………………………………………….
Electric Circuits lab BME 311 Biomedical Engineering Department
LAB SHEET 7
Experiment 6
Sinusoidal Ac Circuit Measurments
Part One: Phase- angle measurements.
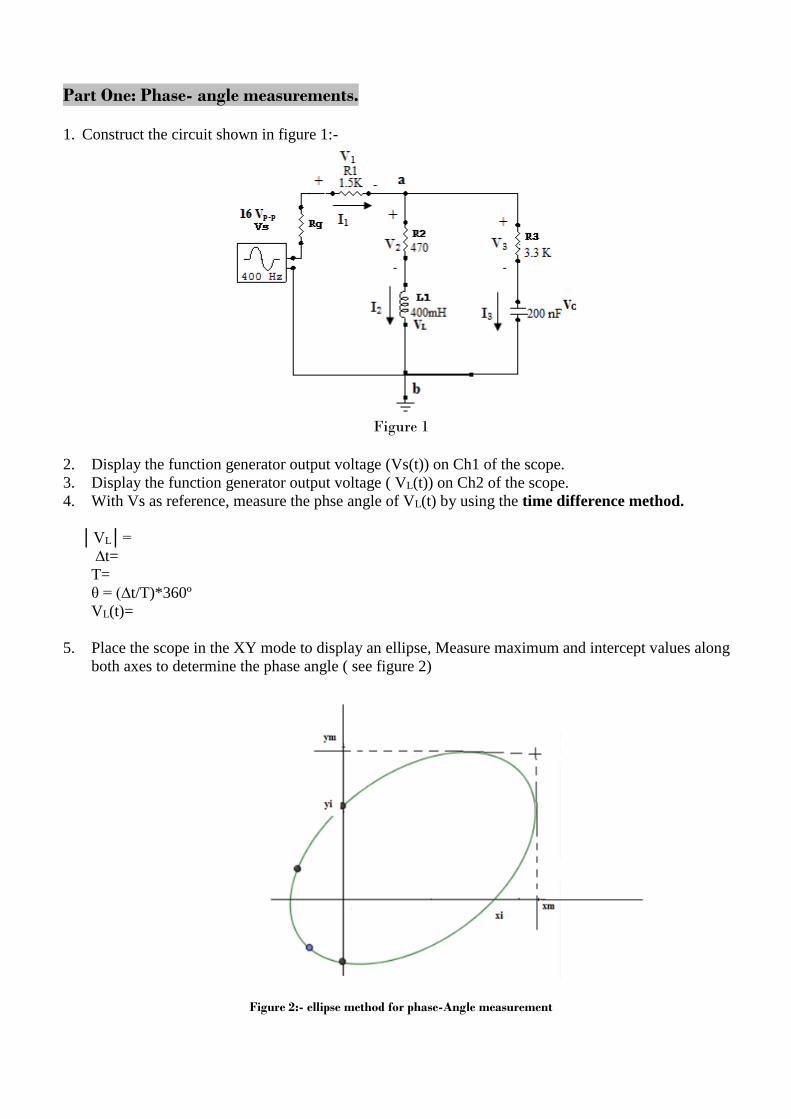
1. Construct the circuit shown in figure 1:-
Figure 1
2. Display the function generator output voltage (Vs(t)) on Ch1 of the scope.
3. Display the function generator output voltage ( VL(t)) on Ch2 of the scope.
4. With Vs as reference, measure the phse angle of VL(t) by using the time difference method.
VL=
∆t=
T=
θ = (∆t/T)*360º
VL(t)=
5. Place the scope in the XY mode to display an ellipse, Measure maximum and intercept values along
both axes to determine the phase angle ( see figure 2)
Figure 2:- ellipse method for phase-Angle measurement

Xi Xm Yi Ym
6. Repeat steps 4 and 5 above when Ch2 of scope is connected across the capacitor (VC(t)) in order to
measure the phase angle
VC=
∆t=
T=
θ = (∆t/T)*360º
VC(t)=
Xi Xm Yi Ym
Part Two: Current and Voltage Phasor Measurements:-
1-Use the same circuit in figure1:
2-Exchange the position of L and R2 and of C and R3
3- With Vs as reference, measure the amplitude and phase angle of V2(t) and of V3(t) and Vab(t) using the
time difference method.
Note: 1. To measure V2 Interchange the physical position of R2 and L in the test circuit.
2. To measure V3 Interchange the physical position of R3 and C in the test circuit.
Vab ∆t V2 ∆t V3 ∆t
5- Turn the function-generator connections around so that its ground is connected to point g2,
then measure the amplitude and phase angle of v1(t)
V1=
∆t=
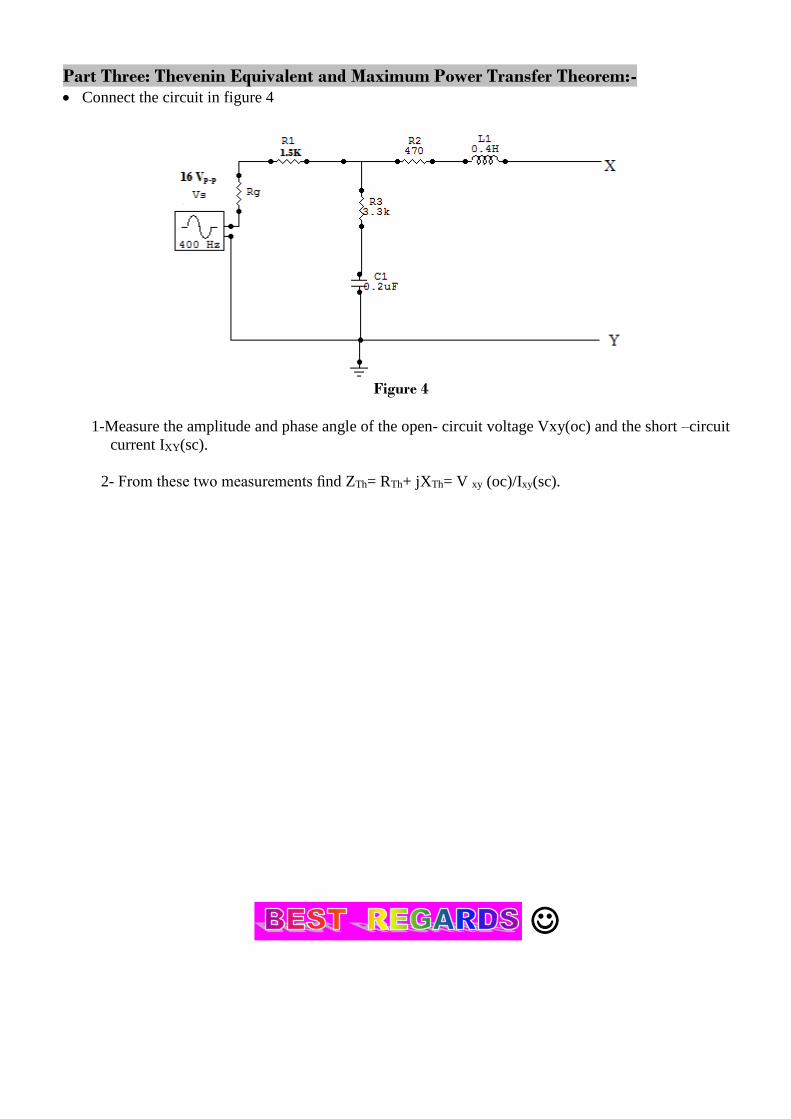
Part Three: Thevenin Equivalent and Maximum Power Transfer Theorem:- Connect the circuit in figure 4
Figure 4
1-Measure the amplitude and phase angle of the open- circuit voltage Vxy(oc) and the short –circuit
current IXY(sc).
2- From these two measurements find ZTh= RTh+ jXTh= V xy (oc)/Ixy(sc).
Electric Circuits lab EE 213 Biomedical Engineering Department
Post lab #7
Experiment 6
Sinusoidal Ac Circuit Measurments
1. Student Name ………………………………………………………………………
Student ID…………………………………………………………………………..
2. Student Name ………………………………………………………………………
Student ID…………………………………………………………………………..
3. Student Name ………………………………………………………………………
Student ID…………………………………………………………………………..
Part One: Phase- angle measurements.
1. Fill the below table referring to measurement at circuit of figure1:
VL ∆t θ VL(t) VC ∆t θ VC(t)
2. After place the scope in the XY mode Fill the below table, then compare the value of θ with that
from the previous part.
A. For the inductor :
Xi Xm θ =Sin-1(
Xm
Xi)
Yi Ym θ =Sin-1(
Ym
Yi)
B. For the capacitor :
Xi Xm θ =Sin-1(
Xm
Xi)
Yi Ym θ =Sin-1(
Ym
Yi)
Part Two: Current and Voltage Phasor Measurements:-
1. Measure the amplitude and phase angle of V3(t), V2(t), and Vab (t) using the time- difference method.
Note: Express the phasors corresponding to the measured voltages in rectangular form.
V2 θ V3 θ Vab θ
V2(t)=
V3(t)=
Vab(t)=

3. Turn the function-generator connections around so that its ground is connected to point g2, then
measure the amplitude and phase angle of v1(t)
Note: Express the phasors corresponding to the measured voltages in rectangular form.
V1 θ
V1(t) =
4. Calculate the current phasor using the previously measured value of voltage V1, V2, and V3 and
check KCL.
I1=1
1
R
V I2=
2
2
R
V I3=
3
3
R
V
I1-I2-I3
4- Check voltage sums and KVL. For example, Vab= VL+ V2= VC+ V3,and V1+ V2+ V L− V s= 0.
5- Check power balance by calculating the entries of the following table:
VS*I1*cos(θ1)
(I12*R1)+ (I2
2*R2)+ (I32*R3)

Part Three: Thevenin Equivalent and Maximum Power Transfer:-
1-Measure the amplitude and phase angle of the open- circuit voltage Vxy(oc), the short –circuit
current IXY(sc), and find ZTh= Vxy (oc)/Ixy(sc).
Voc
θOC
ISC
θSC Zth=
Isc
Voc
Zth*
2- Find ZTh= RTh+ jXTh.
3- Determine the value of L and C for the ZTh and conjugate ZTh*

Write a small paragraph which discuss your results and give your Conclusion about all
parts of this experiment.
1. …………………………………………………………………………………………
…………………………………………………………………………………………
………………………………………………………………………………
2. …………………………………………………………………………………………
…………………………………………………………………………………………
…………………………………………………………………………........
3. …………………………………………………………………………………………
…………………………………………………………………………………………
……………………………………………………………………………….
4. …………………………………………………………………………………………
……………………………………………………………………………………………
…………………………………………………………………………….
5. …………………………………………………………………………………………
……………………………………………………………………………………………
…………………………………………………………………………….
6. …………………………………………………………………………………………
……………………………………………………………………………………………
……………………………………………………………………………..
Electric Circuits lab BME 311 Biomedical Engineering Department
LAB SHEET 8
Experiment 7
Series and Parallel Resonance

Part One: Series resonance
1-Construct the RLC circuit shown in the figure below use R=200Ω, L=0.1H, and C=0.1μf.
Figure 1: RLC Circuit for Series Resonance Measurements
2- Measure Rl and R using DMM.
Rl=
R=
3- Connect a 5-Vrms sinusoidal voltage Vs and maintain this value at all frequencies.
4-Display the function generator output voltage (Vs(t) )on Ch1of the scope.
Vs(P-P)=
5 -Display the voltage across R (VR (t)) on Ch2 of the scope.
6- Begin from f= 100Hz and increase the frequency until a zero phase shift between Vs (t) and VR (t)
occurs. This value represents the resonance frequency f0.
F0=…………………………………. VR (peak) =……………………….
7- Increase and decrease the frequency required until you get the following values:-
VRmax at resonance 0.9 VRMax 0.8 VRMax 0.7 VRMax 0.6 VRMax 0.5 VRMax 0.4 VRMax
F1
above resonance
θ1
above resonance
F2
below resonance
θ 2
below resonance

Part Two: Parallel resonance:-
1- Construct the circuit of Figure2 with R = 2KΩ ohm’s L = 80 mH and C = 80 n F.
2- Measure RL
RL=
3- Connect a 6-Vrms sinusoidal voltage Vs and maintain this value at all frequencies.
4-Display the function generator output voltage (Vs(t) )on Ch1of the scope.
Vs(P-P)=
5-Display the voltage across C (VC (t)) on Ch2 of the scope.
6- Begin from f= 100Hz and increase the frequency until a zero phase shift between Vs (t) and VR (t)
occurs. This value represents the resonance frequency f0.
F0=…………………………………. VP (peak) =……………………….
7- Increase and decrease the frequency required until you get the following values:-
VRmax at resonance 0.9 VRMax 0.8 VRMax 0.7 VRMax 0.6 VRMax 0.5 VRMax 0.4 VRMax
F1
above resonance
θ1
above resonance
F2
below resonance
θ 2
below resonance
Electric Circuits lab BME 311 Biomedical Engineering Department
Postlab #8
Experiment 7
Series and Parallel Resonance

Part One: Series resonance 1- R(measured)=
RL(measured)=
2- Sketch the voltage across R (VR (t)) on CH2 of the scope.
VR (t)
F0=…………………………………. VR (peak) =……………………….
2- Fill the table below table:
VRmax at resonance 0.9 VRMax 0.8 VRMax 0.7 VRMax 0.6 VRMax 0.5 VRMax 0.4 VRMax
F1
above resonance
θ1º
above resonance
F2
below resonance
θ 2 º
below resonance

3- From these measurements data determine the following:
ωo
α equ(3)
ω1@ .7VP
ω2@ .7VP
β equ(13)
Qo equ(13)
ξ equ(5)
4- Compare these results with theoretical ones.
5- Plot | Is| =( |VR|/R) VS ω using a logarithmic scale for ω .
6- Plot |Zs|=(|Vs/Is| ) VS ω using a logarithmic scale for ω .
7- Plot the phase angle of VR VS ω using a logarithmic scale for ω .
Part Two: Parallel resonance
1- RL(measured)=
2- Sketch the voltage across C (VP (t)) on CH2 of the scope.
VP (t)
F0=…………………………………. VP (peak) =……………………….
2- Fill the table below table:
VPmax at resonance 0.9 VPMax 0.8 VPMax 0.7 VPMax 0.6 VPMax 0.5 VPMax 0.4 VPMax
F1
above resonance
θ1º
above resonance
F2
below resonance
θ 2 º
below resonance

3- From these measurements data determine the following:
ωo
α equ(3)
ω1@ .7VP
ω2@ .7VP
β equ(13)
Qo equ(13)
ξ equ(5)
4- Compare these results with theoretical ones.
5- Plot | VP VS ω using a logarithmic scale for ω .

6- Plot the phase angle of Vp VS ω using a logarithmic scale for ω .

Write a small paragraph which discuss your results and give your Conclusion about all
parts of this experiment.
1. …………………………………………………………………………………………
…………………………………………………………………………………………
………………………………………………………………………………………….
2. …………………………………………………………………………………………
…………………………………………………………………………………………
…………………………………………………………………………........
3. …………………………………………………………………………………………
…………………………………………………………………………………………
……………………………………………………………………………….
4. …………………………………………………………………………………………
……………………………………………………………………………………………
…………………………………………………………………………….
5. …………………………………………………………………………………………
……………………………………………………………………………………………
…………………………………………………………………………….
6. …………………………………………………………………………………………
……………………………………………………………………………………………
……………………………………………………………………………..