Embed Size (px)
Citation preview

ArXiv Pre-Print – Submitted 11/30/2021
1
Electric Field Induced Macroscopic Cellular Phase of Nanoparticles
Abigail Rendos+,1 Wenhan Cao+,2 Margaret Chern,1 Marco Lauricella,3 Sauro Succi,3 Jӧrg G.
Werner,1,2 Allison M. Dennis,1,4 Keith A. Brown,1,2,5
1 Division of Materials Science & Engineering, Boston University, Boston, MA, USA.
2 Department of Mechanical Engineering, Boston University, Boston, MA, USA.
3 Center for Life Nano Science, Italian Institute of Technology, Rome, Italy.
4 Biomedical Engineering Department, Boston University, Boston, MA, USA.
5 Physics Department, Boston University, Boston, MA, USA.
+ Contributed Equally *Corresponding Author: Keith A. Brown, email address: [email protected]
Keywords: Electric field effects, spinodal decomposition, nanoparticles, particle interactions, self-assembly
A suspension of nanoparticles with very low volume fraction is found to assemble into a
macroscopic cellular phase under the collective influence of AC and DC voltages. Systematic
study of this phase transition shows that it was the result of electrophoretic assembly into a two-
dimensional configuration followed by spinodal decomposition into particle-rich walls and
particle-poor cells mediated principally by electrohydrodynamic flow. This mechanistic
understanding reveals two characteristics needed for a cellular phase to form, namely 1) a system
that is considered two dimensional and 2) short-range attractive, long-range repulsive interparticle
interactions. In addition to determining the mechanism underpinning the formation of the cellular
phase, this work presents a method to reversibly assemble microscale continuous structures out of
nanoscale particles in a manner that may enable the creation of materials that impact diverse fields
including energy storage and filtration.

ArXiv Pre-Print – Submitted 11/30/2021
2
Introduction
Electric fields provide a flexible means to manipulate soft matter, however, they interact with
materials in electrolytic solutions through numerous distinct phenomena making the outcome of
field-directed assembly difficult to predict. When a suspension of polarizable particles experiences
a spatially uniform electric field, their induced dipoles lead them to form isolated chains along
field lines, causing solidification through the electrorheological effect.[1–3] In contrast,
suspensions have also been experimentally observed to assemble into macroscopic porous
structures with particle-rich walls and particle-poor voids,[4–8] even though this phase has not
been completely recapitulated in simulation.[3,9,10] While these porous structures suggest a path
to realizing continuous mesoporous solids with extremely low densities, the origin of this phase is
not clear even though, and perhaps because, the cellular phase was observed in vastly different
systems spanning orders of magnitude in particle size, particle volume fraction, and electric
excitation. While electrohydrodynamic (EHD) flow was identified as the primary mechanism of
formation in two instances[4,5] and electroosmotic (EO) flow in another,[8] the other two
examples list the interactions between induced dipoles as the origin of the structure.[6,7] Overall,
the lack of a cohesive and encompassing explanation for the formation of the cellular phase hinders
the ability to design macroscopic porous structures.
Here, we find that a nanoparticle suspension exhibits a macroscopic cellular phase when an
AC voltage VAC and DC voltage VDC are simultaneously applied, despite using quantum dot (QD)
particles with a diameter and volume fraction both at least an order of magnitude smaller than all
prior examples of the cellular phase. Indeed, systematic study revealed that the cellular phase only
formed in the presence of both VDC and VAC at volume fraction-dependent critical voltages. The
complex interactions required to produce a cellular phase in this system include (1)
ArXiv Pre-Print – Submitted 11/30/2021
3
electrochemistry to generate a DC current, (2) electrophoresis to aggregate particles into a 2D
arrangement on one electrode, and (3) an instability driven by the long-ranged repulsive and short-
ranged attractive EHD flow that nucleates at regions on the electrode with high local field
enhancement. Notably, EO and other purely attractive interactions are competitive with the cellular
phase and instead drive the system towards a cluster-phase (i.e. pearl chaining). This mechanistic
explanation was compared to all previous examples of the electrically-mediated cellular phase to
identify a set of unifying factors that appear to always be present, namely that the system adopts
an effective 2D arrangement and features an in-plane interaction that is short-range attractive and
long-range repulsive. This understanding paves the way towards the concerted formation of
hierarchical porous structures that may impact fields including energy storage and
filtration.[11,12]
Experimental Methods
As a model system for assembly, poly(maleic anhydride-alt-1-octadecene) (PMAO)-
coated CdSe/CdS quantum dots (QDs),[13,14] were suspended in dilute borate buffer (3.125 mM,
5.5 nm Debye screening length)15 at a volume fraction φ = 6×10⁻⁵ which is equivalent to a 25 nM
particle concentration. For a typical assembly experiment, indium tin oxide (ITO) slides (2277 -
University Wafer, 703176 – Sigma Aldrich) were prepared by sonicating them in acetone and
subsequently isopropanol for 5 min each before drying them under an N2 stream. Finally, the ITO
slides were placed into the 3D printed frame pictured in Fig. S2(a). A laser-cut polyimide spacer
(2271K72 – McMaster) with a height fixed by a 177 ± 1 µm was then placed onto one of the ITO
slides and 4 µL of the suspension was pipetted onto the (ITO)-coated glass and covered with a
second ITO-coated glass slide to form a fluid cell as shown in Fig. 1(a).

ArXiv Pre-Print – Submitted 11/30/2021
4
This complete cell was then transferred to an Olympus BX43 microscope with a GS3-U3-
120S6M-C Grasshopper camera. A filter cube with an emission wavelength at 642 nm, 75 nm BW
(67-036 – Edmund Optics Inc.), a short-pass excitation filter with a cutoff at 500 nm (84-706 –
Edmund Optics Inc.), and a dichroic with cutoff at 550 nm (DMLP550R – ThorLabs Inc.) were
used to visualize the photoluminescent QDs. Alligator-clip leads were attached to a corner of each
ITO-coated slide as shown in Fig. S2(b) in order to apply an AC voltage with amplitude VAC and
DC offset voltage VDC across the fluid cell using a Keysight 33521B waveform generator.
Fluorescence micrographs were taken using 5× magnification with a 500 ms exposure time and 14
dB gain to have sufficient contrast. In most experiments, such as those conducted in Figs. 1 and 5
along with supplemental Figs. S3, S4, and S7, VAC = 2 V with frequency f = 500 kHz and VDC =
2.2 V.
Results and Discussion
Simultaneously applying VAC and VDC across the QD suspension resulted in a cellular phase
at strikingly low φ, particle size, and field intensities. Specifically, setting VDC = 2.2 V and VAC =
2 V amplitude at 500 kHz, the particles assembled into a cellular phase over the course of a few
minutes as shown in Fig. 1(b). To determine whether this process was reversible, the field was
subsequently switched off, which led the suspension to gradually homogenize through diffusion,
as seen in Fig. 1(c). Given that this phase has not been previously observed for particles with
hydrodynamic diameters < 100 nm, we considered whether this could be specific to these QDs.
Thus, we repeated this experiment with commercially available fluorophore-doped polystyrene
nanoparticles and again observed the cellular phase (Fig. S3), showing that this phase is not
restricted to these QDs.

ArXiv Pre-Print – Submitted 11/30/2021
5
To explore the mechanism of the cellular phase and whether it originated from forces
between induced dipoles, we compute the non-dimensional parameter Λ =𝛼𝑉2
8𝑘𝐵𝑇𝐻2, which reflects
the importance of induced dipole interactions between particles relative to thermal energy given
particle polarizability α, applied voltage V, electrode separation H, Boltzmann’s constant 𝑘𝐵, and
temperature T. Here, we estimate Λ ~ 0.008, indicating that induced dipole mediated assembly
should not occur and that other interactions must drive the formation of the cellular phase. Another
potential mechanism is suggested by the resemblance of the cellular phase to Benárd cells where
gravity-driven natural convection from density gradients produces similar cells.[16–18] Thus, we
repeated the experimental conditions shown in Fig. 1 with the cell rotated 90° such that gravity
pointed along the electrodes and the same cellular structure formed (Fig. S4), indicating that
natural convection is not responsible for the cellular phase.
Fig. 1 (a) Fluid cell consisting of two ITO-coated glass slides separated by a polyimide spacer and
containing a suspension of quantum dots (QDs). DC and AC voltages, VDC and VAC respectively,
were applied across the fluid cell. (b) Fluorescent micrographs showing the formation of the cellular phase when VDC = 2.2 V and VAC
= 2 V were applied to a suspension with volume fraction
𝜑 = 6×10⁻⁵. The scale bar depicts 500 m. (c) Fluorescent micrographs showing that after VDC and
VAC were turned off, the particles diffused back into a homogenous distribution.
In order to explore the mechanism of the cellular phase, we examined the contributions of
VDC and VAC. Specifically, we performed a series of experiments holding VAC fixed while VDC was
ArXiv Pre-Print – Submitted 11/30/2021
6
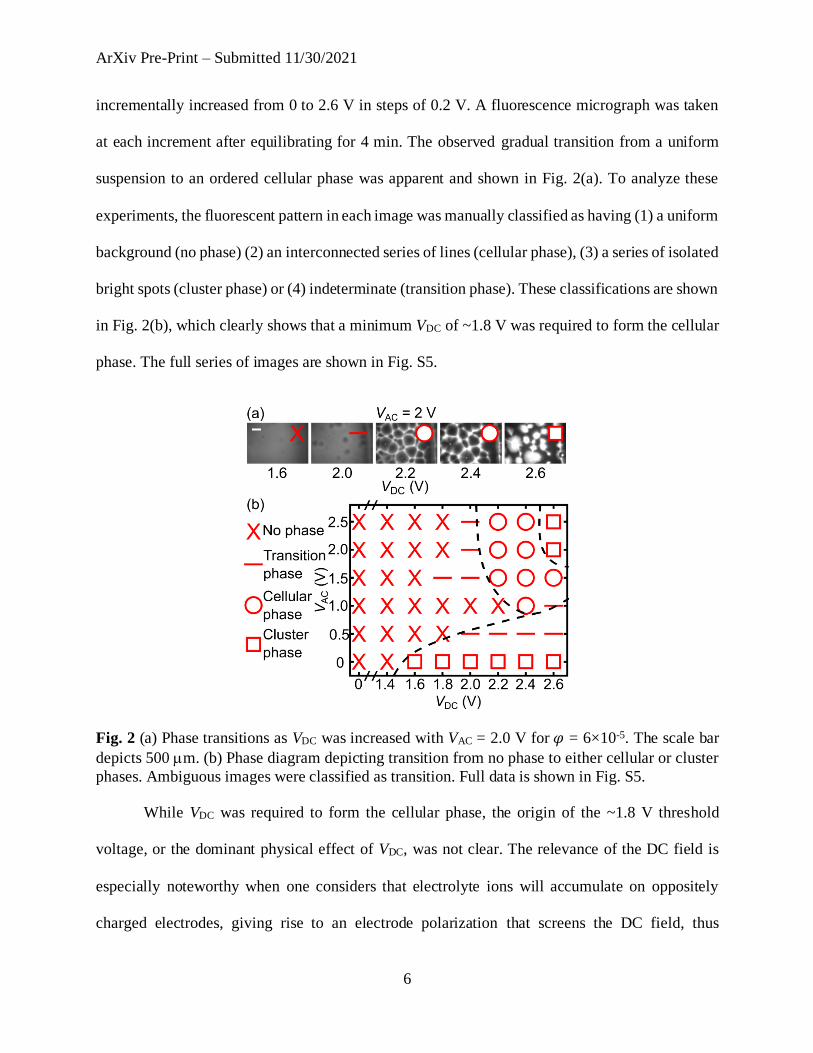
incrementally increased from 0 to 2.6 V in steps of 0.2 V. A fluorescence micrograph was taken
at each increment after equilibrating for 4 min. The observed gradual transition from a uniform
suspension to an ordered cellular phase was apparent and shown in Fig. 2(a). To analyze these
experiments, the fluorescent pattern in each image was manually classified as having (1) a uniform
background (no phase) (2) an interconnected series of lines (cellular phase), (3) a series of isolated
bright spots (cluster phase) or (4) indeterminate (transition phase). These classifications are shown
in Fig. 2(b), which clearly shows that a minimum VDC of ~1.8 V was required to form the cellular
phase. The full series of images are shown in Fig. S5.
Fig. 2 (a) Phase transitions as VDC was increased with VAC = 2.0 V for 𝜑 = 6×10⁻⁵. The scale bar
depicts 500 m. (b) Phase diagram depicting transition from no phase to either cellular or cluster
phases. Ambiguous images were classified as transition. Full data is shown in Fig. S5. While VDC was required to form the cellular phase, the origin of the ~1.8 V threshold
voltage, or the dominant physical effect of VDC, was not clear. The relevance of the DC field is
especially noteworthy when one considers that electrolyte ions will accumulate on oppositely
charged electrodes, giving rise to an electrode polarization that screens the DC field, thus

ArXiv Pre-Print – Submitted 11/30/2021
7
preventing a strong DC component in the bulk.[19,20] One process that could maintain a steady-
state DC field is a constant flow of ions across the chamber mediated by their electrochemical
generation/annihilation at the anode and cathode. Electrochemical reactions at the electrodes could
also explain the VDC threshold as highly non-linear currents are common in electrochemistry due
to reaction-specific standard reduction/oxidation potentials and mass transport effects.[21] To
determine whether electrochemical currents were present, two-electrode cyclic voltammetry
measurements were conducted on the cell, confirming that electrochemical reactions were present
and resulted in an appreciable current when VDC > 1.5 V (Fig. S6). The observed reactions were
likely due to a combination of water electrolysis and ITO degradation.[22,23] While the current
turn-on behavior was commensurate with the onset of the cellular phase, we sought to establish a
more definitive link between electrochemical reactions on the electrodes and the cellular phase.
Thus, we coated the surface of the ITO electrodes with an insulating layer of poly(methyl
methacrylate) (PMMA) to prevent electrochemical reactions from occurring and repeated the
assembly experiment. After this treatment, the cellular phase did not form at any voltage (Fig. S7),
verifying that electrochemistry was required for the cellular phase to form.
Due to the electrochemical reactions at the electrodes, a steady-state DC field persisted in
the chamber and led to electrophoresis of the QDs and a subsequent increase in their local
concentration on one electrode. Since these QDs had a slightly negative zeta potential,[25] they
will accumulate on the positively charged electrode and form a thin particle-dense film, calculated
to be about a monolayer in thickness. To understand the fate of this initially uniform film, it is
useful to consider that the magnitude of VAC determines whether it will adopt a cellular or cluster
phase, as shown in Fig. 2(b). Particles on a substrate will interact through two types of electrically-
induced fluid flows: EO flow and EHD flow.[21,25,26] While EO flow is a DC phenomenon, EHD

ArXiv Pre-Print – Submitted 11/30/2021
8
flows arise from both VAC and VDC.[20,24] Interestingly, these effects are expected to produce
contrasting flow fields in which EO draws particles together in the plane while EHD flow, despite
being short-range attractive, will repel particles at long ranges. While a Cahn-Hilliard analysis of
these interactions revealed that both interactions can drive a spinodal decomposition, and will do
so in a concentration-dependent manner, the instigator of the cellular phase was not clear from this
analysis alone.
To determine what interaction drove the spinodal decomposition from a film to the cellular
phase, we performed a series of experiments at various φ in which VDC was held constant while
VAC was gradually increased. First, we prepared a sample with φ = 3×10⁻⁵, VDC = 1.9 V, and
increased VAC from 0.5 to 5.5 V in steps of 0.5 V. To quantify the critical AC voltage 𝑉𝐴𝐶∗ at which
the cellular phase forms, the images were analyzed to count the number N of cells in each image
(Fig. S8). Fitting N vs. VAC to a sigmoid (Eq. S16) allowed us to quantify 𝑉𝐴𝐶∗ . A typical experiment
is shown in Fig. 3(a). Eight conditions were tested in triplicate (at four values of φ and both VDC =
1.9 V and VDC = 2.2 V) over the range of VAC, enabling a Cahn-Hilliard analysis of the cellular
phase formation. In this framework, spinodal decomposition is predicted to occur when the
interparticle interaction (i.e. EO or EHD) leads perturbations to grow faster than they dissipate
through diffusion. Due to these competing effects, a general relationship is expected wherein the
strength of EHD and EO are assigned unknown, but concentration and field independent, pre-
factors βEHD and βEO. EHD and EO scale with electric field quadratically and linearly,
respectively.[21] Thus, the data in Fig. 3(b) was fit to,
𝜑−1 = 𝛽𝐸𝐻𝐷(𝑉𝐴𝐶∗ + 𝑏𝑉𝐷𝐶)2 + 𝛽𝐸𝑂𝑉𝐷𝐶 (1)
where b reflects that while AC and DC voltages can both give rise to EHD, they may have different
intensities.[21] Using nonlinear least squares fitting, we found βEHD = 0.004 ± 0.001 V-2, b = 9.7

ArXiv Pre-Print – Submitted 11/30/2021
9
± 0.8, and βEO = -0.9 ± 0.2 V-1. Critically, since both βEHD and b were positive, this means that
EHD promoted the formation of the cellular phase. In contrast, βEO being negative means that EO
flow inhibited the cellular phase formation. Interestingly, these results implied that VDC played
two competing roles by contributing to both EO and EHD. These results demonstrated that EHD
flow was critical to the formation of the cellular phase.
Fig. 3 (a) Using image processing, the normalized number N of cells for 𝜑 = 3×10⁻⁵ and VDC = 1.9 V vs. VAC are plotted and fit to a sigmoid to identify the transition voltage VAC
*. Representative
images displayed with a 500 m scale bar. (b) VAC* vs. 𝜑 and concentration C for VDC = 1.9 and
2.2 V with the lines depicting a single fit to Eq. 1.
Given that EHD was identified as an instigator, and EO an inhibitor, of the cellular phase,
other features of assembly can be understood by considering where the cells form. Specifically, by
performing the assembly experiment with conditions that lead to the cellular phase (VDC = 2.2 V,
VAC = 2.0 V, φ = 6×10⁻⁵), leaving the field off for 40 min to allow the particles to homogenize,
and then repeating the same experiment, we found that the structure of the cellular phase was
repeatable with voids occurring at the same locations as shown in Fig. S9(a). To explore this
further, an experiment was performed where a solution was exposed to conditions that led to a
cellular phase (VDC = 2.2 V, VAC = 3.0 V, φ = 6×10⁻⁵), the system was then allowed to homogenize
with the field off, and then exposed to conditions that led to a cluster phase (VDC = 2.4 V, VAC = 0
V). Importantly, Fig. S9(b) shows that many of the cluster phases were co-localized with the
centers of the voids of the cellular phase. Together, these results suggest that features of the

ArXiv Pre-Print – Submitted 11/30/2021
10
underlying substrate, likely asperities that enhance local electric field,[28] break the symmetry of
the system and nucleate the phase transition. Furthermore, the fact that the same location can lead
to voids through repulsive EHD flows or clusters through attractive EO flows further suggests that
the mode of spinodal decomposition is fundamentally different between EHD- and EO-mediated
phases.
These experiments and analysis coalesced into a proposed mechanism for the cellular phase
formation involving electrophoresis, EO flow, and EHD flow. Once VDC was applied to the particle
suspension, electrochemistry at the electrodes led to a DC current that electrophoretically pulled
the particles to one side of the chamber as shown in Fig. 4(a). Once assembled into a film, EO led
to an attractive flow that promoted particle aggregation as shown in Fig. 4(b). However, VAC and
VDC also produced an EHD flow as depicted in Fig. 4(c) that was short-range attractive but
repulsive at long ranges. Both flow profiles in Fig. 4(d) were replotted from Ristenpart et al.[21]
Depending on which flow dominated, spinodal decomposition in Fig. 4(e) either began through
the nucleation of an excess or decrease of particles at the high field regions, which subsequently
led to the cluster phase or cellular phase, respectively. A similar dichotomy of spinodal
decompositions has been observed in simulations of colloids with competing interparticle
interactions.[29,30] Interestingly, at VDC > 2.4 V, a transition from a cellular phase to a cluster
phase was observed, but this is qualitatively different than the low VAC cluster phase as it occurs
at the nodes of the cells. Thus, we attribute this to the vertices of the cells becoming tall enough to
span the chamber, at the expense of the structure becoming thinner, at which point particles are
recirculated into the voids.
ArXiv Pre-Print – Submitted 11/30/2021
11
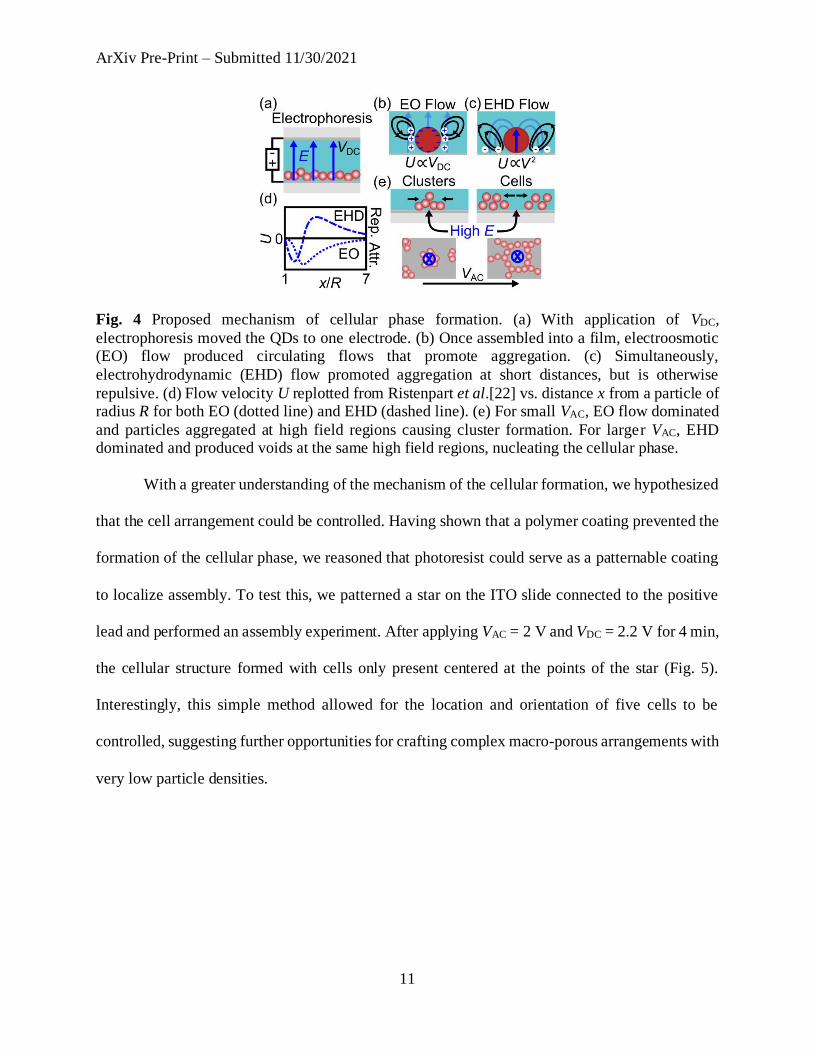
Fig. 4 Proposed mechanism of cellular phase formation. (a) With application of VDC,
electrophoresis moved the QDs to one electrode. (b) Once assembled into a film, electroosmotic (EO) flow produced circulating flows that promote aggregation. (c) Simultaneously,
electrohydrodynamic (EHD) flow promoted aggregation at short distances, but is otherwise
repulsive. (d) Flow velocity U replotted from Ristenpart et al.[22] vs. distance x from a particle of radius R for both EO (dotted line) and EHD (dashed line). (e) For small VAC, EO flow dominated
and particles aggregated at high field regions causing cluster formation. For larger VAC, EHD dominated and produced voids at the same high field regions, nucleating the cellular phase.
With a greater understanding of the mechanism of the cellular formation, we hypothesized
that the cell arrangement could be controlled. Having shown that a polymer coating prevented the
formation of the cellular phase, we reasoned that photoresist could serve as a patternable coating
to localize assembly. To test this, we patterned a star on the ITO slide connected to the positive
lead and performed an assembly experiment. After applying VAC = 2 V and VDC = 2.2 V for 4 min,
the cellular structure formed with cells only present centered at the points of the star (Fig. 5).
Interestingly, this simple method allowed for the location and orientation of five cells to be
controlled, suggesting further opportunities for crafting complex macro-porous arrangements with
very low particle densities.

ArXiv Pre-Print – Submitted 11/30/2021
12
Fig. 5 Fluorescence micrograph of cells formed at the points of the star pattern where the star is
the exposed ITO and the rest is covered with photoresist. Here, VAC = 2.0 V, VDC = 2.2 V, and 𝜑
= 6×10⁻⁵. The scale bar depicts 500 m.
Considering the mechanism of formation identified in the present work and the
characteristics of prior work that resulted in the cellular phase, two commonalities emerge that
unify all observations of the electrically mediated cellular phase. The first commonality is that
each system can be effectively reduced to 2D by way of gravity or VDC pulling particles to one side
of the chamber,[4,5,8] or through the formation of chains spanning the entire chamber.[6,7] The
second commonality is that all feature interactions that are short-range attractive and long-range
repulsive in the plane of the electrode, either through dipolar interactions of particle chains or
through EHD flow. Indeed, a qualitatively similar cellular phase has been observed in suspensions
of magnetic particles under the influence of triaxial magnetic fields that were effectively 2D
systems in which the interaction was short-range attractive and long-range repulsive,[31–33]
suggesting that these features can contribute towards a more general and complete understanding
of the cellular phase.

ArXiv Pre-Print – Submitted 11/30/2021
13
Conclusion
We observed an ultra-low density macroscopic cellular phase through the electrically
mediated assembly of nanoparticles that were an order of magnitude smaller than previous
examples. Additional control experiments helped tease out the factors that contribute to cellular
phase formation such as EO and EHD flows and the importance of electrochemistry at the
electrode surface. This interaction between electrochemistry, electrophoresis, EO, and EHD results
in a unique porous structure made of nanoparticles where the characteristic length of the pores is
10,000 times larger than the size of the particles. Importantly, by comparing to prior work, we
identified two characteristics that appear to be required to form the cellular phase: particles that
are confined in some way to 2D and an interparticle interaction that is short-range attractive, long-
range repulsive. This level of understanding is essential to bridging the gap between observing and
utilizing the unique structures produced by this assembly process.
Acknowledgements
Acknowledgment is made to the donors of the American Chemical Society Petroleum Research
Fund for partial support of this research under award 57452-DNI9. A.R. acknowledges support
from the Boston University Nanotechnology Innovation Center. We acknowledge support from
the Boston University Photonics Center, the College of Engineering Dean’s Catalyst Award, and
the Gordon and Betty Moore Foundation.

ArXiv Pre-Print – Submitted 11/30/2021
14
References
1 A. A. Füredi and R. C. Valentine, BBA - Biochimica et Biophysica Acta, 1962, 56, 33–
42.
2 J. N. Foulc, Advanced Materials, 2001, 13, 1847–1857. 3 J. S. Park and D. Saintillan, Physical Review E - Statistical, Nonlinear, and Soft Matter
Physics, 2011, 83, 1–6. 4 M. Trau, S. Sankaran, D. A. Saville and I. A. Aksay, Langmuir, 1995, 11, 4665–4672.
5 M. v. Sapozhnikov, Y. v. Tolmachev, I. S. Aranson and W. K. Kwok, Physical Review
Letters, 2003, 90, 4. 6 A. Kumar, B. Khusid, Z. Qiu and A. Acrivos, Physical Review Letters, 2005, 95, 3–6.
7 A. K. Agarwal and A. Yethiraj, Physical Review Letters, 2009, 102, 100–103. 8 S. Hardt, J. Hartmann, S. Zhao and A. Bandopadhyay, Physical Review Letters, 2020,
124, 64501.
9 A. Tiribocchi, A. Montessori, M. Lauricella, F. Bonaccorso, K. A. Brown and S. Succi, 2021, 1–7.
10 A. M. Almudallal and I. Saika-Voivod, Physical Review E - Statistical, Nonlinear, and Soft Matter Physics, 2011, 84, 1–9.
11 A. VahidMohammadi, M. Mojtabavi, N. M. Caffrey, M. Wanunu and M. Beidaghi,
Advanced Materials, 2019, 31, 1–9. 12 H. Mukaibo, T. Wang, V. H. Perez-Gonzalez, J. Getpreecharsawas, J. Wurzer, B. H.
Lapizco-Encinas and J. L. McGrath, Nanotechnology, , DOI:10.1088/1361-6528/aab5f7. 13 M. Chern, T. T. Nguyen, A. H. Mahler and A. M. Dennis, Nanoscale, 2017, 9, 16446–
16458.
14 M. Nasilowski, P. Spinicelli, G. Patriarche and B. Dubertret, Nano Letters, 2015, 15, 3953–3958.
15 W. Cao, M. Chern, A. M. Dennis and K. A. Brown, Nano Letters, 2019, 19, 5762–5768. 16 E. Bodenschatz, W. Pesch and G. Ahlers, Annua Rev. Fluid Mech., 2000, 32, 709–778.
17 P. Bergé and M. Dubois, Contemporary Physics, 1984, 25, 535–582.
18 P. Cerisier, B. Porterie, A. Kaiss and J. Cordonnier, European Physical Journal E, 2005, 18, 85–93.
19 H. P. Schwan, Annals of the New York Academy of Sciences, 1968, 148, 191–209. 20 P. ben Ishai, M. S. Talary, A. Caduff, E. Levy and Y. Feldman, Measurement Science
and Technology, DOI:10.1088/0957-0233/24/10/102001.
21 W. D. Ristenpart, I. A. Aksay and D. A. Saville, Langmuir, 2007, 23, 4071–4080. 22 S. Geiger, O. Kasian, M. Ledendecker, E. Pizzutilo, W. Fu, O. Diaz-morales, Z. Li, T.
Oellers, L. Fruchter, A. Ludwig, K. J. J. Mayrhofer, M. T. M. Koper and S. Cherevko, Nature Catalysis, 2018, 1, 508–515.
23 J. D. Benck, B. A. Pinaud, Y. Gorlin and T. F. Jaramillo, PLoS ONE, ,
DOI:10.1371/journal.pone.0107942. 24 N. A. Lewinski, H. Zhu, H. J. E. Jo, D. Pham, R. R. Kamath, C. R. Ouyang, C. D. Vulpe,
V. L. Colvin and R. A. Drezek, Environmental Science and Technology, 2010, 44, 1841–1846.
25 W. D. Ristenpart, I. A. Aksay and D. A. Saville, Journal of Fluid Mechanics, 2007, 575, 83–109.
ArXiv Pre-Print – Submitted 11/30/2021
15
26 A. Gencoglu, D. Olney, A. LaLonde, K. S. Koppula and B. H. Lapizco-Encinas, Journal of Nanotechnology in Engineering and Medicine, 2013, 4, 1–7.
27 W. Cao and K. A. Brown, Electrophoresis, 2021, 42, 635–643. 28 H. J. Zhao, V. R. Misko and F. M. Peeters, New Journal of Physics, , DOI:10.1088/1367-
2630/14/6/063032.
29 B. A. Lindquist, S. Dutta, R. B. Jadrich, D. J. Milliron and T. M. Truskett, Soft Matter, 2017, 13, 1335–1343.
30 J. E. Martin, E. Venturini, G. L. Gulley and J. Williamson, Physical Review E - Statistical, Nonlinear, and Soft Matter Physics, 2004, 69, 1–15.
31 K. Müller, N. Osterman, D. Babič, C. N. Likos, J. Dobnikar and A. Nikoubashman,
Langmuir, 2014, 30, 5088–5096. 32 A. T. Pham, Y. Zhuang, P. Detwiler, J. E. S. Socolar, P. Charbonneau and B. B. Yellen,
Physical Review E, DOI:10.1103/PhysRevE.95.052607.

ArXiv Pre-Print – Submitted 11/30/2021
16
Supplemental Information
Electric Field Induced Macroscopic Cellular Phase of Nanoparticles
Abigail Rendos+,1 Wenhan Cao+,2 Margaret Chern,1 Marco Lauricella,3 Sauro Succi,3 Jӧrg G.
Werner,1,2 Allison M. Dennis,1,4 Keith A. Brown,1,2,5
1 Division of Materials Science & Engineering, Boston University, Boston, MA, USA.
2 Department of Mechanical Engineering, Boston University, Boston, MA, USA.
3 Center for Life Nano Science, Italian Institute of Technology, Genova, Italy.
4 Biomedical Engineering Department, Boston University, Boston, MA, USA.
5 Physics Department, Boston University, Boston, MA, USA.
+Contributed Equally
*Corresponding Author: Keith A. Brown, email address: [email protected]
I. Cahn-Hilliard Analysis
To analyze the spinodal decomposition of the particles from a uniform distribution to a cellular
phase, we perform a Cahn-Hilliard analysis. As an initial state for this analysis, we posit that the
DC electric field E will lead the particles to assemble onto the electrode that is positively charged.
To justify this, we estimate the electrophoretic speed 𝑣𝑝 of the QDs which is given by,1
𝑣𝑝 =𝜀𝑚ζp𝐸
𝜂 for 𝜅𝑅 ≫ 1, (S1)
with particle radius R, inverse Debye length 𝜅, particle zeta potential 𝜁𝑝, medium permittivity 𝜀𝑚,
and medium viscosity 𝜂. For our system of QDs suspended in 3.125 mM borate buffer, 𝜅 =
0.18 nm-1 and R = 8.5 nm, so 𝜅𝑅 > 1. Based on Eq. S1, a particle with 𝜁𝑝 ≅ -30 mV2 at room
temperature in water will move ~0.2 mm/s when 2 V is applied across 200 µm. Under these
conditions, the particle would traverse the fluid cell in ~1 s, so all the particles will concentrate on
the electrode immediately upon application of E. If the QDs have a packing fraction of 0.74 and
are dispersed at a bulk volume fraction 𝜑 of 6×10⁻⁵, they are expected to form a film ~12 nm thick
on the surface of the electrode which is approximately a monolayer of particles

ArXiv Pre-Print – Submitted 11/30/2021
17
Once assembled into a two-dimensional film, the movement of particles can be described by
the convection-diffusion equation,3
𝜕𝑛(𝒓,𝑡)
𝜕𝑡+ ∇ ∙ [𝑛(𝒓, 𝑡)𝑼(𝒓, 𝑡)] = 𝐷∇2𝑛(𝒓, 𝑡), (S2)
where the first term describes the change in particle areal concentration n with time t at a location
r on the surface of the electrode, the second term describes the convection of particles due to flow
field U, and the final term represents the diffusion of the particles with diffusion coefficient D,
which is assumed to be constant. The total number of particles is not changing and as a result no
source or sink term is included.
After assembly onto one electrode due to electrophoresis, the initial areal concentration 𝑛0 on
the positively charged electrode is given by,
𝑛0 =3𝜑0𝐻
4𝜋𝑅3, (S3)
where 𝜑0 is the bulk volume fraction and H is the chamber height. In the Cahn-Hilliard analysis,
a plane wave perturbation 𝑛′ is added and the growth or decay of this term will determine the
stability of the film. This leads to an expression,
𝑛(𝐫, 𝑡) = 𝑛0 + 𝑎(𝑡)e𝑖𝑘𝑥, (S4)
where a(t) is the amplitude of the wave perturbation, k is the non-dimensional wave vector
normalized by R, and x is a direction along the electrode. We assume that initially the perturbation
𝑛′ is small compared to 𝑛0. Due to this perturbation, the flow field can be separated into 𝑼 = 𝑼0 +
𝑼′ where 𝑼0 is due to 𝑛0 and 𝑼′ is due 𝑛′. However, we assume the initially uniform distribution
of particles indicates that 𝑼0 = 0. Thus, Eq. S2 can be linearized to show,
𝜕𝑛′
𝜕𝑡+ 𝑛0∇ ∙ 𝑼′ = 𝐷∇2𝑛′. (S5)
By introducing Eq. S4 into Eq. S5 and simplifying, the expression becomes,

ArXiv Pre-Print – Submitted 11/30/2021
18
𝑒 𝑖𝑘𝑥𝑎′(𝑡) + 𝑛0∇ ∙ 𝑼′ = 𝐷𝑎(𝑡)∇2𝑒 𝑖𝑘𝑥. (S6)
Drawing from the analysis performed by Hardt et al,4 we define 𝑼′ generally using the integral,
𝑈′ = −a(t)𝑒 𝑖𝑘𝑥𝑖
4𝜋𝜂∫ ∫ sin(𝑘𝑟𝑐𝑜𝑠𝜃) cos(𝜃) ∙ 𝑣(𝑟) 𝑑𝑟𝑑𝜃
∞
0
𝜋
−𝜋, (S7)
where 𝑣(𝑟) is the flow velocity as a function of the magnitude of the location r in the x-y plane
and 𝜃 describes the direction of r. Importantly, there were two flow types present in our system,
electroosmotic (EO) and electrohydrodynamic (EHD) flow. The EHD velocity 𝑣𝐸𝐻𝐷(𝑟) and EO
velocity 𝑣𝐸𝑂(𝑟) can be defined as,
𝑣𝐸𝐻𝐷(𝑟) = 𝑉2𝛾𝐸𝐻𝐷𝑓𝐸𝐻𝐷(𝑟) (S8)
and
𝑣𝐸𝑂(𝑟) = 𝑉𝐷𝐶𝛾𝐸𝑂𝑓𝐸𝑂(𝑟), (S9)
where the functions 𝑓(𝑟) describe the flow at a point r away from a single particle based on the
flow profiles in Fig. 4(d) which were replotted from theory described by Ristenpart et al.5 and the
constants 𝛾 describe the strength of the flow field with subscripts denoting EHD and EO flow. It
is known that EHD flow is proportional to the voltage squared, whereas EO flow scales directly
with the applied voltage5 as described in Eqs. S8 and S9. For each flow, the integral in Eq. S7 was
solved numerically as a function of k. Thus, Eq. S7 can be expressed as,
𝑈′(𝑘) =−𝑎(𝑡)𝑒 𝑖𝑘𝑥𝑖
4𝜋𝜂(𝑉2𝛾𝐸𝐻𝐷𝑊𝐸𝐻𝐷(𝑘) + 𝑉𝐷𝐶𝛾𝐸𝑂𝑊𝐸𝑂(𝑘)), (S10)
where 𝑊𝐸𝐻𝐷(𝑘) and 𝑊𝐸𝑂(𝑘) are the result of the double integral described by Eq. S7 for 𝑓𝐸𝐻𝐷 and
𝑓𝐸𝑂 , respectively. The plot of 𝑊(𝑘)/𝑘 in Fig. S1 for EHD shows that at low 𝑘 (or high wavelength
𝜆) repulsion between particles is expected.
To apply this understanding to our data, Eq. S10 was introduced into Eq. S6 and simplified,
𝑎′(𝑡) = 𝑎(𝑡)(−𝐷𝑘2 + 𝑘𝑛0
4𝜋𝜂(𝑉2𝛾𝐸𝐻𝐷𝑊𝐸𝐻𝐷(𝑘) + 𝑉𝐷𝐶𝛾𝐸𝑂𝑊𝐸𝑂(𝑘))), (S11)

ArXiv Pre-Print – Submitted 11/30/2021
19
which describes the evolution of the amplitude over time. When the term multiplied by 𝑎(𝑡) is
positive, the perturbation grows, leading to spinodal decomposition. Thus, Eq. S11, can be used to
compute a critical voltage 𝑉∗ at which an instability will occur which is found to be,
𝑉∗ = √4𝜋𝜂𝐷𝑘
𝑛0𝛾𝐸𝐻𝐷𝑊𝐸𝐻𝐷(𝑘)−
𝛾𝐸𝑂𝑊𝐸𝑂(𝑘)𝑉𝐷𝐶
𝛾𝐸𝐻𝐷𝑊𝐸𝐻𝐷(𝑘). (S12)
Using the Stokes-Einstein equation for D,6
𝐷 =𝑘𝐵𝑇
6𝜋𝜂𝑅, (S13)
where 𝑘𝐵 is Boltzmann’s constant and T is temperature, Eq.
S12 can be simplified to,
𝑉∗ = √2𝑘𝐵𝑇𝑘
3𝑅𝑛0𝛾𝐸𝐻𝐷 𝑊𝐸𝐻𝐷 (𝑘)−
𝛾𝐸𝑂 𝑊𝐸𝑂 (𝑘)𝑉𝐷𝐶
𝛾𝐸𝐻𝐷 𝑊𝐸𝐻𝐷 (𝑘). (S14)
Importantly, Eq. S14 shows that 𝑉∗ is inversely related to 𝑛0,
which implies that as the volume fraction increases, the necessary voltage to observe the cellular
phase will decrease. Additionally, 𝑉∗ must be expanded into its AC and DC components,
𝑉∗ = 𝑉𝐴𝐶∗ + 𝑏𝑉𝐷𝐶, (S15)
where the dimensionless constant b allows VAC and VDC to contribute to EHD with intensities
reflecting the different complex conductivities at DC and high frequencies.7 In our experiments,
the critical AC voltage 𝑉𝐴𝐶∗ at which the cellular phase was observed was determined by fitting the
experimental data to a sigmoid as seen in Fig. 3(a),
𝑁
𝑁𝑚𝑎𝑥= 𝑎1 +
𝑎2
1+𝑒 𝑎3(𝑉𝐴𝐶−𝑉𝐴𝐶∗ ), (S16)
where 𝑁 is the number of cells, 𝑁𝑚𝑎𝑥 is the maximum number of cells observed in that experiment,
and 𝑎1 , 𝑎2, and 𝑎3 are additional fitting parameters. Incorporating Eq. S15 and S3 into Eq. S14
yields,
Fig. S1 𝑊(𝑘)/𝑘 plotted
versus wavenumber k for both EHD and EO flows.

ArXiv Pre-Print – Submitted 11/30/2021
20
𝑉𝐴𝐶∗ = √
8𝜋𝑘𝑘𝐵𝑇𝑅2
9𝐻𝜑0𝛾𝐸𝐻𝐷𝑊𝐸𝐻𝐷(𝑘)−
𝛾𝐸𝑂𝑊𝐸𝑂 (𝑘)𝑉𝐷𝐶
𝛾𝐸𝐻𝐷 𝑊𝐸𝐻𝐷 (𝑘)− 𝑏𝑉𝐷𝐶, (S17)
which was simplified to the functional form used to fit the data in Fig. 3(b),
𝑉𝐴𝐶∗ = √
1
𝛽𝐸𝐻𝐷𝜑0−
𝛽𝐸𝑂𝑉𝐷𝐶
𝛽𝐸𝐻𝐷− 𝑏𝑉𝐷𝐶 . (S18)
where b, 𝛽𝐸𝐻𝐷, and 𝛽𝐸𝑂 are fitting parameters. Equation S18 captures the behavior in our
experimental determination of 𝑉𝐴𝐶∗ shown in Fig. 3(b) and confirms that as 𝑉𝐴𝐶
∗ increases, 𝜑0 and
𝑉𝐷𝐶 decrease.
II. Supplementary Tables and Figures
TABLE S1. Summary of experimental conditions and materials used for previous studies of the cellular phase and this current work.
Paper Particle
type
Particle
diameter
Particle
volume
fraction
Medium Field strength
Trau – 19957
Barium
titanate
100 nm 0.025 vol% Castor oil DC: 0.05 V/µm
Sapozhnikov –
20038
Bronze
spheres 120 (& 40) m 3 vol% Ethanol toluene
mixture
DC: 0.66 V/µm
Kumar – 20059 poly-
alpha olefin
spheres
45 to 87 µm 0.5 – 10
vol%
Corn oil AC: 0.1 to 3
kHz, 1.6 – 5 V/µm
Agarwal – 200910 Silica 800 nm 0.07 – 4 vol%
Water + dimethyl
sulfoxide mixture
AC: 1 MHz, 1 V/µm
Hardt – 20204
DNA ~350 nm11
(hydrodynamic diameter)
~0.02
vol%
Dextran and
polyethylene glycol
DC: 10-30 V,
length across which field is
applied is not specified
This work QDs 17 nm
(hydrodynamic diameter)12
0.0015 –
0.012 vol%
3.125 mM
borate buffer
Typical
conditions: DC: 0.01 V/µm
AC: 500 kHz, 0.01 V/µm

ArXiv Pre-Print – Submitted 11/30/2021
21
Fig S2. (a) Top and bottom of 3D printed fluid cell frame designed to hold one-inch square indium tin oxide (ITO)-coated glass slides. ITO-glass slides are shown with the polyimide spacer on one
slide. Arms were used to align the cell and screw cell together. (b) Fully assembled fluid cell with
glass slides, droplet, spacer, screws, and leads.
Fig S3. (a) Experimental set-up for fluid cell with polystyrene particles with a diameter of 26 nm
at a volume fraction 𝜑 = 9×10⁻⁵. (b) Fluorescence micrograph of cell when field was off. Scale bar
depicts 500 m. (c) Image of cell after applying AC voltage amplitude VAC = 2 V with frequency
f = 500 kHz and turning on DC voltage VDC = 2.2 V for 4 min.

ArXiv Pre-Print – Submitted 11/30/2021
22
Fig S4. Buoyancy experiments performed with the cell in three orientations relative to gravity g:
(a) g and applied electric field E in alignment (b) g and E in opposite directions and (c) g and E perpendicular to one another. Each shows a fluorescence micrograph of the cellular phase at VAC
= 2 V and VDC = 2.2 V with QDs at 𝜑 = 6×10⁻⁵ where the QDs accumulate on the positive electrode.
The scale bar depicts 500 m.
Fig S5. Full set of fluorescence micrographs of assembly experiments of QDs at 𝜑 = 6×10⁻⁵ in
which VAC was initially set to a value from 0 V to 2.5 V and then VDC was increased from 0 V to 2.6 V in steps of 0.2 V. After each time VDC was increased, the system was allowed to stabilize for
4 min before images were taken.

ArXiv Pre-Print – Submitted 11/30/2021
23
Fig S6. Current I versus voltage V plots from two-electrode cyclic voltammetry electrochemical measurements conducted at a sweep rate of 20 mV/s using the Gamry Reference 600+
Potentiostat/Galvanostat/ZRA on the fluid cell with 3.125 mM borate buffer (BB) solution and
QDs in 3.125 mM borate buffer (QD + BB) solution with 𝜑 = 6×10⁻⁵ in (a) linear and (b) log-y
scale.
Fig S7. (a) Experimental set-up for fluid cell with polymethylmethacrylate (PMMA) coated ITO
glass slides made by spin-coating PMMA (molecular weight = 950 kg/mol, diluted to 6% solids
weight) onto both ITO glass slides and then baking them on a hot plate for 2 min at 100 ̊C. (b)
Images of top view when field was off with 𝜑 = 6×10⁻⁵. The scale bar depicts 500 m. (c) Image
after applying VAC = 2 V and turning on VDC for 4 min.
ArXiv Pre-Print – Submitted 11/30/2021
24
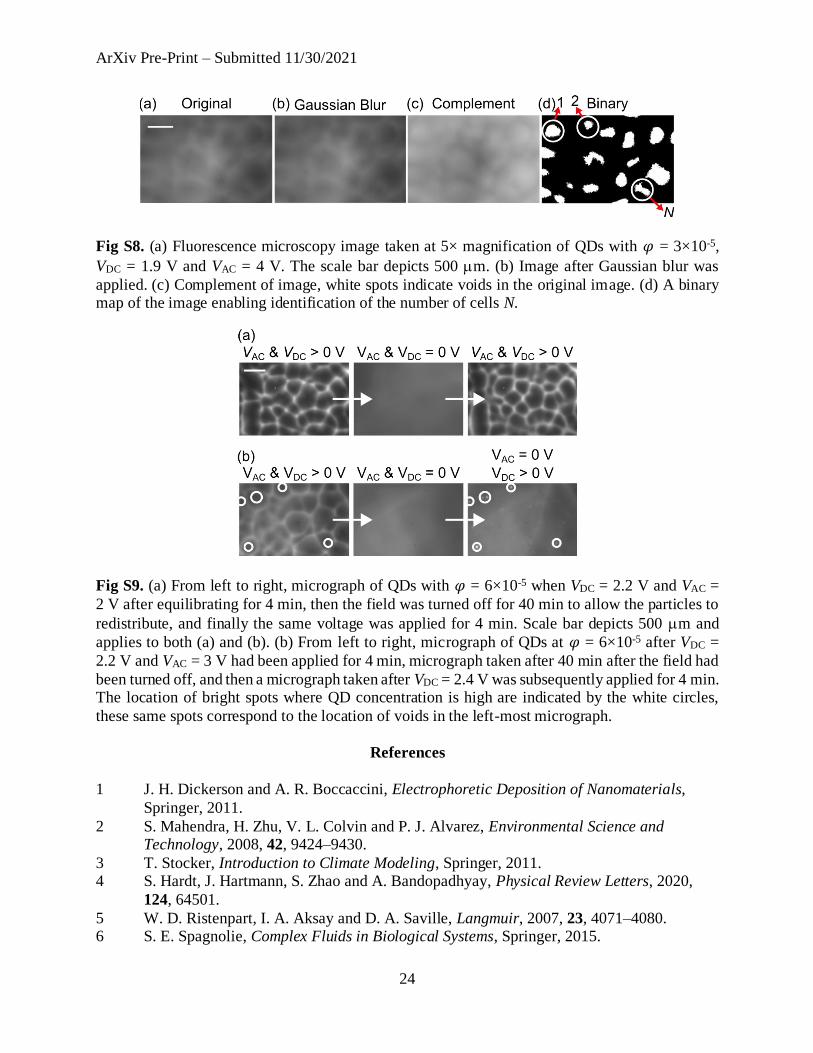
Fig S8. (a) Fluorescence microscopy image taken at 5× magnification of QDs with 𝜑 = 3×10⁻⁵,
VDC = 1.9 V and VAC = 4 V. The scale bar depicts 500 m. (b) Image after Gaussian blur was
applied. (c) Complement of image, white spots indicate voids in the original image. (d) A binary map of the image enabling identification of the number of cells N.
Fig S9. (a) From left to right, micrograph of QDs with 𝜑 = 6×10⁻⁵ when VDC = 2.2 V and VAC =
2 V after equilibrating for 4 min, then the field was turned off for 40 min to allow the particles to
redistribute, and finally the same voltage was applied for 4 min. Scale bar depicts 500 m and
applies to both (a) and (b). (b) From left to right, micrograph of QDs at 𝜑 = 6×10⁻⁵ after VDC =
2.2 V and VAC = 3 V had been applied for 4 min, micrograph taken after 40 min after the field had
been turned off, and then a micrograph taken after VDC = 2.4 V was subsequently applied for 4 min. The location of bright spots where QD concentration is high are indicated by the white circles,
these same spots correspond to the location of voids in the left-most micrograph.
References
1 J. H. Dickerson and A. R. Boccaccini, Electrophoretic Deposition of Nanomaterials,
Springer, 2011.
2 S. Mahendra, H. Zhu, V. L. Colvin and P. J. Alvarez, Environmental Science and Technology, 2008, 42, 9424–9430.
3 T. Stocker, Introduction to Climate Modeling, Springer, 2011. 4 S. Hardt, J. Hartmann, S. Zhao and A. Bandopadhyay, Physical Review Letters, 2020,
124, 64501.
5 W. D. Ristenpart, I. A. Aksay and D. A. Saville, Langmuir, 2007, 23, 4071–4080. 6 S. E. Spagnolie, Complex Fluids in Biological Systems, Springer, 2015.

ArXiv Pre-Print – Submitted 11/30/2021
25
7 M. Trau, S. Sankaran, D. A. Saville and I. A. Aksay, Langmuir, 1995, 11, 4665–4672. 8 M. v. Sapozhnikov, Y. v. Tolmachev, I. S. Aranson and W. K. Kwok, Physical Review
Letters, 2003, 90, 4. 9 A. Kumar, B. Khusid, Z. Qiu and A. Acrivos, Physical Review Letters, 2005, 95, 3–6.
10 A. K. Agarwal and A. Yethiraj, Physical Review Letters, 2009, 102, 100–103.
11 B. Wang, D. Sun, C. Zhang, K. Wang and J. Bai, Analytical Methods, 2019, 11, 2778–2784.
12 W. Cao, M. Chern, A. M. Dennis and K. A. Brown, Nano Letters, 2019, 19, 5762–5768.