Embed Size (px)
DESCRIPTION
Electric Mines of the Future - the State of Energy Storage Technologies for Renewable Energy Sources at Remote Communities
Citation preview
MECHATRONICS ENGINEERING FINAL
YEAR PROJECT PROGRESS REPORT
Electric Mines of the Future - the State of Energy Storage Technologies for Renewable Energy
Sources at Islanded Locations
MAY 23, 2014 LUKE T WILSON 20357241
University of Western Australia
Supervisor; Prof Thomas Braunl, School of Electrical, Electronic and Computer Engineering
Co-Supervisor; Professor Melinda Hodkiewicz, School of Mechanical and Chemical Engineering
i
Contents
Nomenclature ii
Introduction 1
Motivation 1
Project Overview 1
Objective Outline 1
Stakeholder Identification and Management 2
Gantt chart 3
Risk Assessment 3
Research Methods 4
Relevance of Energy Storage to Mine Sites 4
Forming a Power Consumption Profile for a Model Mine Site 5
Process of Determining a Suitable Energy Storage Solution 6
Process Framework 6
1. Evaluation by Economic Optimisation Modelling 6
2. Evaluation of Decisions Involving Multiple Criteria 7
Renewable Energy Storage Technologies 8
Pumped Hydro 8
Compressed Air Energy Storage 10
Thermal Energy Storage 10
Electrochemical Energy Storage 11
Advanced Lead Acid 11
Eos Battery Cells 12
Aquion Battery Cells 12
Lithium-Ion Battery 13
Suitability Comparison 16
Discussion 16
Methodology for Completion of Thesis 17
Further Research 17
ii
Towards Achieving Objectives 17
References 18
Appendix 1 20
Gantt chart 20
Appendix 2 21
Risk Assessment Matrices 21
Appendix 3 22
Output Characteristics 22
Implementation 24
Lifetime and Cost 26
Nomenclature
CAES Compressed Air Energy Storage
FES Flywheel Energy Storage
PHES Pumped Hydro-electrical Energy Storage
SMES Superconductive Magnetic Energy Storage
UPHES Underground Pumped Hydro-electrical Energy Storage
1
Introduction
Motivation
magine a world where the cities of humankind are powered by sustainably harnessing the natural
energy that constantly surrounds us. Instead, fossil fuel deposits continue to be depleted and the
marginal cost of fuel extraction increases (Gordon, 2013). Concerns over global warming are at
the forefront of many agendas and global society is progressively turning towards the utilisation of
intermittent renewable energy sources, in doing so magnifying the importance and necessity of energy
storage (Yang and Jackson, 2011). These are small steps on the journey to achieving a world where
power production enhances the Earth, instead of slowly extinguishing it.
In the effort to adopt increasing amounts of renewable energy sources, problems between the demand
for power and when it can be supplied need to be addressed. Energy storage was found to effectively
mitigate imbalances between power supply and demand, whilst also severely reducing the amount of
excess energy that is wasted (Gordon, 2013). Politically there is increased pressure for governments to
agree to global targets to reduce CO2 emissions and increase the percentage of power generated by
renewables. If this is to occur then a logical necessity is to develop and further deploy energy storage
devices (Inage, 2009).
Project Overview
Objective Outline
The primary objective of the author is to deliver a process that can determine the most suitable
renewable energy storage solution for a prospective mine site. The sites specific geological factors
and the dimensions of the available technology will be the inputs to the process, and a storage
recommendation will be the output. To reach this final objective, it is necessary to produce a
document that concisely illustrates the state of the energy storage market, in terms of developing
technology, current products, prices and market leaders. The document will compare and contrast
these technologies, to ascertain those that are capable of being utilised in a base load generating
energy storage system. The focus will then turn to applying these technologies to remote mine sites
that do not have access to grid power, and so must source their own site power. There will also be
included a power consumption profile for a model mine site, based on figures of power consumption
from real world mine sites, which will act as a base unit to which an energy storage solution can be
applied. A process will be developed that can be applied to any mine site, taking in its specific details
and generating a customised solution; the framework of the process is discussed later in this report.
The final stage is to provide a working process, a short list of example geographical scenarios (sites of
typical Australian remote mines) and the corresponding energy storage solutions that are shown, by
I
2
the developed process, to be the most ideal. In so doing the process will allow for an efficient and
informative estimation to be established with minimal site-specific research and cost formulation
being carried out.
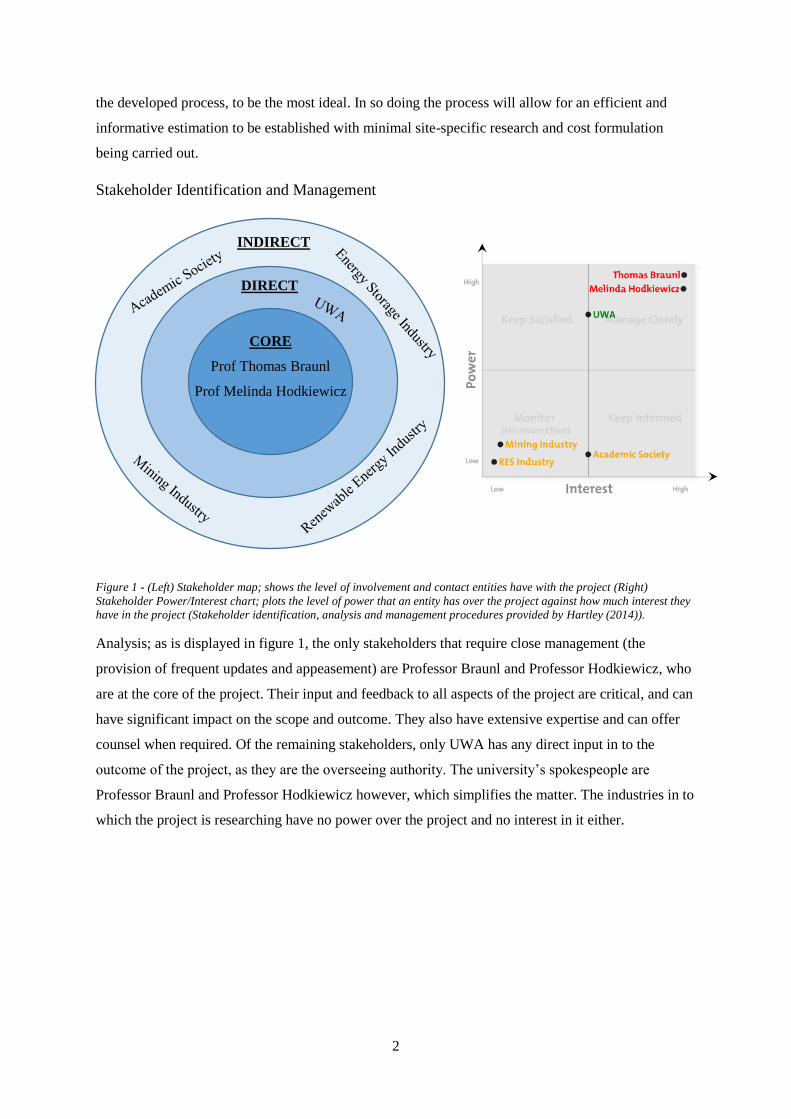
Stakeholder Identification and Management
Figure 1 - (Left) Stakeholder map; shows the level of involvement and contact entities have with the project (Right)
Stakeholder Power/Interest chart; plots the level of power that an entity has over the project against how much interest they
have in the project (Stakeholder identification, analysis and management procedures provided by Hartley (2014)).
Analysis; as is displayed in figure 1, the only stakeholders that require close management (the
provision of frequent updates and appeasement) are Professor Braunl and Professor Hodkiewicz, who
are at the core of the project. Their input and feedback to all aspects of the project are critical, and can
have significant impact on the scope and outcome. They also have extensive expertise and can offer
counsel when required. Of the remaining stakeholders, only UWA has any direct input in to the
outcome of the project, as they are the overseeing authority. The university’s spokespeople are
Professor Braunl and Professor Hodkiewicz however, which simplifies the matter. The industries in to
which the project is researching have no power over the project and no interest in it either.
CORE
Prof Thomas Braunl
Prof Melinda Hodkiewicz
DIRECT
INDIRECT

3
Action; the following table explains how each of the stakeholders will be managed, the information
that they will be provided and how frequently.
Table 1 - Stakeholder Management Matrix (matrix template provided by Hartley (2014))
Stakeholder Responsibilities Information
Required
Format of
Information
Frequency of
Information
Who delivers
Prof. Thomas
Braunl
Determine scope
of project
What is being
covered in thesis,
main objectives of
thesis, progress on
thesis
Meeting, e-mail Fortnightly Author
Prof. Melinda
Hodkiewicz
Determine scope
of project, grade
progress report
What is being
covered in thesis,
main objectives of
thesis, progress on
thesis
Meeting, e-mail Fortnightly Author
UWA Provide markers
for final thesis
Final thesis Thesis Paper One off Author
Industry and
Academia
N/A N/A N/A N/A N/A
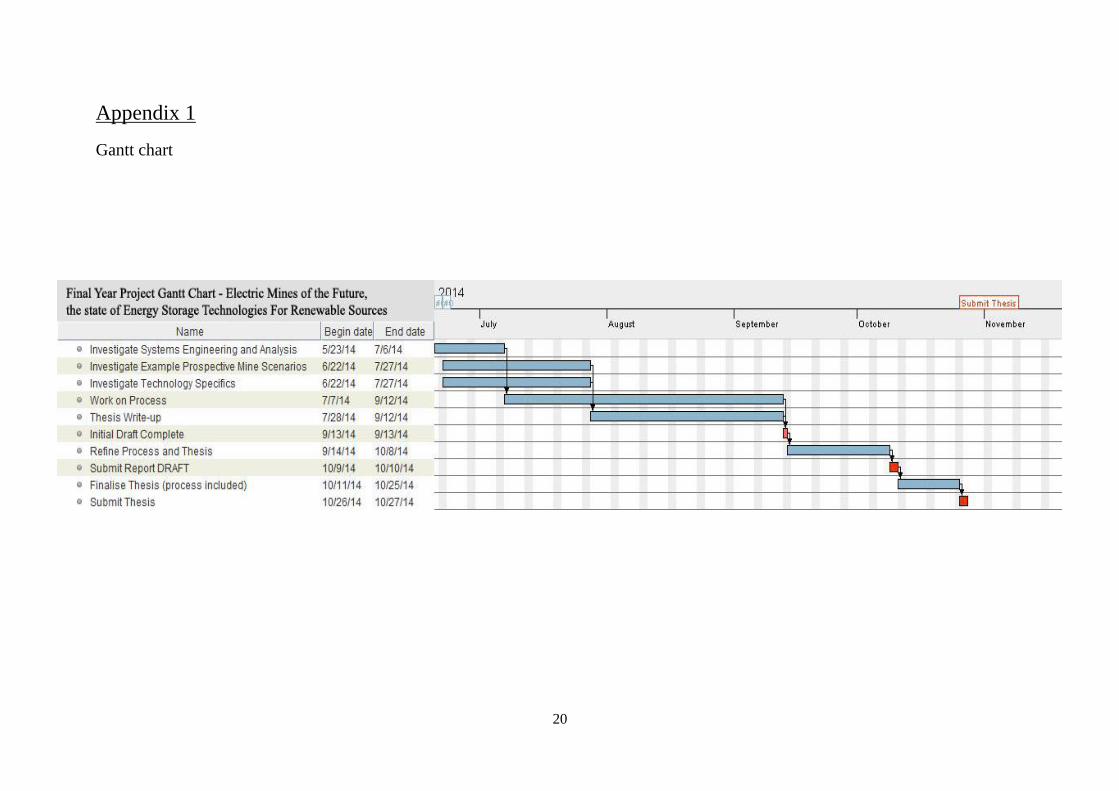
Gantt chart
A Gantt chart has been generated (see appendix 1) to illustrate the current timeline for completing
objectives. Major points to note are;
1- 27th July 2014; the completion of investigation in to Systems Engineering and Analysis
models, example prospective mine scenarios and technological specifics. This triggers the
start of the thesis write-up.
2- 13th Sept 2014; initial thesis draft submission
3- 10th Oct 2014; final thesis draft submission
4- 27th Oct 2014; thesis submission
The Gantt chart is to be continually updated as the situation and information changes. Notable
additions in the future are the dates for the conference and conference abstract submission.
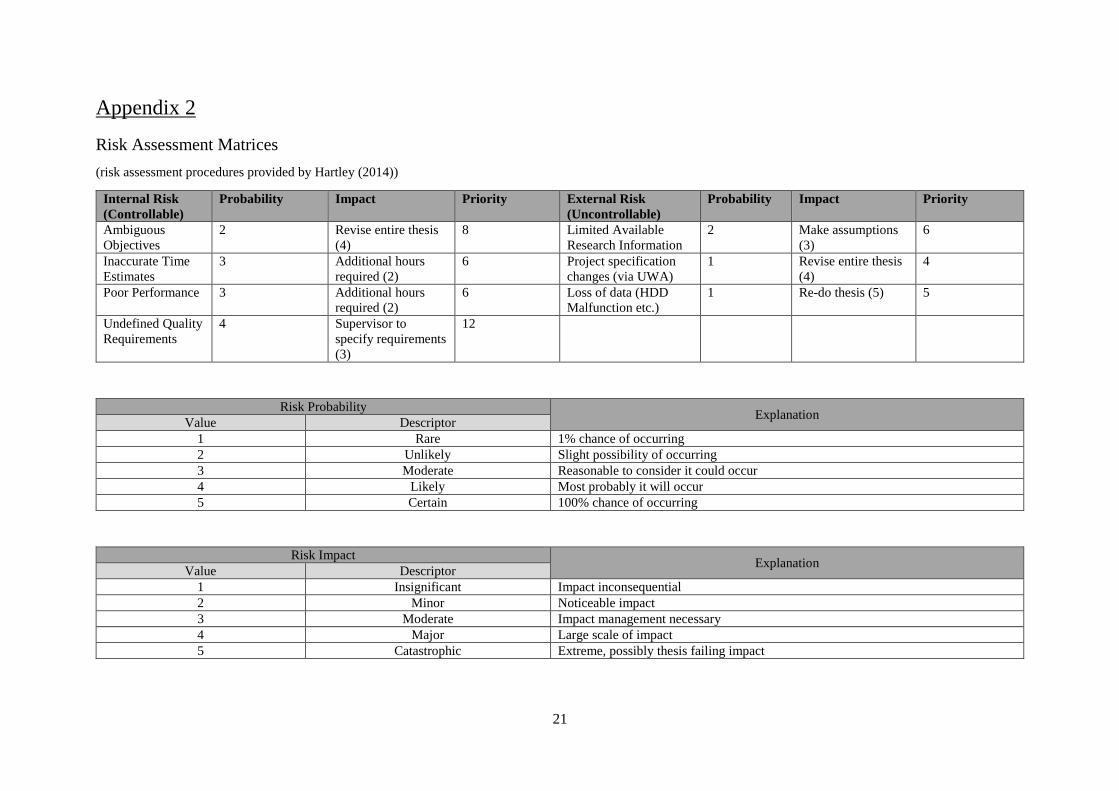
Risk Assessment
Appendix 2 provides risk assessment matrices that lay out some of the more probable risks that will
be encountered throughout the project. The 2 most likely risks and their mitigation techniques are;
1- Undefined Quality Requirements; this would result in the completion of a thesis that did not
meet UWA standards and received a grade lower than 68%. To mitigate this it is necessary to
attain a written document specifying points that will aid in ensuring a thesis of high quality is
produced. If this is not possible, recurrent meetings with supervisors is recommended to
receive feedback on how to improve thesis quality.
2- Ambiguous Objectives; this would result in the completion of a low quality thesis. To
mitigate this, documentation of specific objectives must be agreed upon by supervisors. This
4
should be obtained before the 27th of July, when the thesis write-up begins, so as to minimise
impact.
Research Methods
Throughout this progress report, and the included literature review, the author has endeavoured to
only make use of articles and information that are of a high standard, principally peer reviewed
articles and papers from acknowledged and respected journals. In some instances there was only
access to company websites and their research papers, as the technology or product was new to the
market and so no independent studies, or projects utilising the technology, were available; this lack of
independent analysis has been noted within the body of the report.
From a number of central energy storage ‘handbooks’ and secondary sources it was possible to follow
the referenced and referencing papers upstream and downstream respectively. Following the
references used also provided the ability to ‘branch out’ horizontally and identify research groups and
companies that were working within the same discipline or technological area. This helped in
providing information to cross check data and statistics about the discussed technologies.
After referring to Onwuegbuzie et al. (2012) and their in depth inspection of literature reviews, the
author engaged in several additional analyses in order to try and better understand the information
presented, and thus to draw a superior conclusion from it. A taxonomic analysis was used at the onset
of writing the report, which aided in discovering overlapping areas of suitability of technologies that
could provide a solution to the energy storage problem, and to uncover the factors that resulted in
disqualification of technologies from being possible solutions. From midway through researching a
component analysis was employed, which consists of breaking each technology down in to
comparable categories and rating them on a meaningful scale, as it was apparent that it would provide
an effective way to differentiate between the most suitable technology and what would be the
remaining close contenders.
Relevance of Energy Storage to Mine Sites
The mining industry is a substantial section of the Australian economy, providing thousands upon
thousands of jobs, generating large amounts of exports and bolstering the overall economy. The
industry in its current state though, relies heavily on stand-alone diesel power systems that expose the
mining companies to the increasing operational and production costs associated with the ever rising
cost of fossil fuels. Increases in international competition, and political and social pressure to address
environmental issues is making this situation more undesirable by the year. Making use of the
renewable energy sources available to them is a practicable way of dealing with these issues, while
simultaneously achieving power security and reduced fuel costs (Gordon, 2013). For this to be a

5
viable option, however, these sources must be able to provide around the clock power, and
intermittency is a well-known problem associated with many of these technologies. The need for
energy storage, to enable the holding of power from periods of over production until those of
underproduction, becomes of paramount importance.
Forming a Power Consumption Profile for a Model Mine Site
In order to provide modular energy storage solutions it is necessary to determine an average level of
power consumption for mine sites, and to convert this in to a base unit that can be scaled up or down
depending on the scenario.
Due to the confidential and restricted nature of mining operations data, it was difficult to ascertain
power profiles for a large number of sites. Several sites throughout Canada have released their power
consumption statistics, and as such these are the figures that were utilised to generate an average
power profile for a medium sized mine site, in an attempt to provide a scalable power storage
solution.
Anonymous mine site (of approximately 400 personnel), average 59.39MW (Carvalho, 2012)
Donlin Creek Gold Mine, average 130MW (peak load 152MW, 16.9% above average)
Fort Knox Gold Mine, average 35MW
Red Dog Gold Mine, average 43MW
Information provided by McKittrick and McKittrick (2010) and Reichardt et al. (2010).
Working with these figures, adjusted somewhat for respective size and type of operation, it can be
established that an average sized, gold quarrying mine site consumes approximately 45.8MW of
power. This is taken as the base unit for which the energy storage solutions process will be initially
tested against. Once the method has matured it will be able to provide solutions for any specified mine
site power consumption level, but for the early stages this basic example will prove useful for
assessing its quality.
6
Process of Determining a Suitable Energy Storage Solution
The main objective of this thesis is to produce a process that allows a suitable energy storage solution
to be found, for any prospective mine site. Given all the geographical characteristics, mining
operation specifics and available technology particulars as input factors, the process should be
methodically applied and a solution found; the end result providing enough information to make an
informed decision on how to proceed. Generating such a process must be done systematically and
carefully, to ensure that it is made robust and capable. As such, a solid foundation must be established
upon which to construct it.
Process Framework
The following decision evaluation methods and frameworks are drawn from Blanchard and Fabrycky (2006).
In order to make a decision between alternative system designs, many factors must be identified and
considered. The first type of factors to examine are the limiting factors, as these are the ones that will
block the achievement of objectives and make that design unsuitable (an example being inadequate
power output to run a mine site). This leads to identifying the strategic factors, those that can be
altered to make progress possible. Identifying strategic factors is vital as it allows the decision maker
to notice areas where success is possible.
Ones these factors have been identified, it is possible to apply some decision evaluation theory in
order to differentiate between these factors and come up with a final solution. The author has opted to
evaluate 2 possible models for decision evaluation, to determine which is most beneficial.
1. Evaluation by Economic Optimisation Modelling
This evaluation method operates on the basis that there are 3 types of parameters, which are defined
as follows:
a) Design-dependent parameters (Yd); factors under the control of designer. Every unique
instance represents a different candidate design.
b) Design-independent parameters (Yi); factors outside the control of the designer. Each
instance impacts the effectiveness of all candidate designs and can significantly alter their
appeal.
c) Design variables (X); factors that define the design optimisation space. Each candidate
system is optimised over the set of design variables before being compared with the other
alternative. In this way, equivalence is assured.
𝐸 = 𝑓(X, 𝑌𝑑 , 𝑌𝑖)
It is necessary to identify and isolate the design-dependent system parameters (Yd) from design-
independent system parameters (Yi). Equation 1 shows the relationship between an evaluation
(1)

7
measure, E (e.g. initial investment cost), and the system parameters, and is useful for choosing
mutually exclusive design alternatives based on design-dependent parameters. This approach involves
separating the system design space (represented by design-dependent parameters) from the
optimisation space (represented by design variables). This method appears to offer an evaluation
process that may be useful in providing a monetary analysis, as well as functionality analysis, which
may provide more useful information to mining companies. This method’s effectiveness will be
determined through utilisation and experimentation on energy storage and mine site examples.
2. Evaluation of Decisions Involving Multiple Criteria
Some criteria are quantifiable (e.g. power output) while others are solely qualitative in nature (e.g.
effect on company reputation). Regardless of this, it is vital to ensure that the criteria necessary for the
final solution are all completely independent of each other. Independence is considered to be when the
order of preference AND trade-off for different levels of the criteria does not depend on the levels of
other criteria. It is also necessary to only consider those criteria that highlight true differences between
design options, as they are the important ones for analysis and decision making (e.g. whether or not
the power output is adequate).
A combination of the Graphical Additive Method and Systematic Elimination Method has been
selected as the evaluation process of choice; the elimination method is first applied. This method is
applicable when values or outcomes can be specified for all the criteria and alternatives. The values
should be measurable (scalar) or at least rank orderable (ordinal). The criteria are compared across the
alternatives, which are either eliminated due to inferiority (one alternative is dominant over another)
or due to being below a specified standard (the decision maker sets the desired standard).
After some of the alternatives have been eliminated, the criteria are then weighted. This weighting
explicitly recognises the higher importance or priority of some criteria over others. The different
system designs are then assigned a rating of how well they perform under each criteria. The weighting
of each criteria and rating for each alternative is then multiplied and summed together to form an
aggregate performance total. These aggregates, displayed as a stacked bar chart, can then be compared
across alternatives to determine which is most appropriate.
After experimentation, one of these 2 methods will be selected to provide the framework upon which
the process for determining a correct energy storage solution will be formed.
8
Renewable Energy Storage Technologies
Though there is an abundance of technologies that provide the capability to store energy, many of
these are not applicable for providing prolonged base load power to a remote mine site. The following
section, therefore, only looks at the state of the industry for those technologies that have met certain
criteria (displayed in the Suitability Comparison section on page 16) and can be looked at as possible
solutions for mine site energy storage.
Pumped Hydro
Current State of Technology
Pumped Hydro-electrical Storage (PHES) can be divided in to 2 separate methods of implementation,
typical above ground storage which utilises damming techniques to create upper and lower reservoirs,
and Underground PHES (UPHES) which employs excavation to create underground lower reservoirs
and has the upper reservoir situated at ground level.
The standard PHES system requires 2 reservoirs, an upper and a lower, which are connected by a
tunnel (the headrace, penstock and tailrace) that houses the pump-turbine and motor-generator. When
acting in generator mode, water is allowed to descend down the penstock and through the turbine,
spinning it forward and generating electricity. When needed to store energy, the turbine is supplied
with power (i.e. excess generation capacity from a renewable source) which operates in reverse and
pumps water from the lower to the upper reservoir via the penstock (Pickard, 2012). The primary
problem in application to remote sites is the surface area required for 2 reservoirs, which is expansive,
and the specific topographical layout required (elevated catchment zone with lower catchment and
runoff area for lower reservoir). It is preferable for these reservoirs to have several hundred meters of
penstock between them, but be adjacent horizontally. This is due to the fact that a great deal of energy
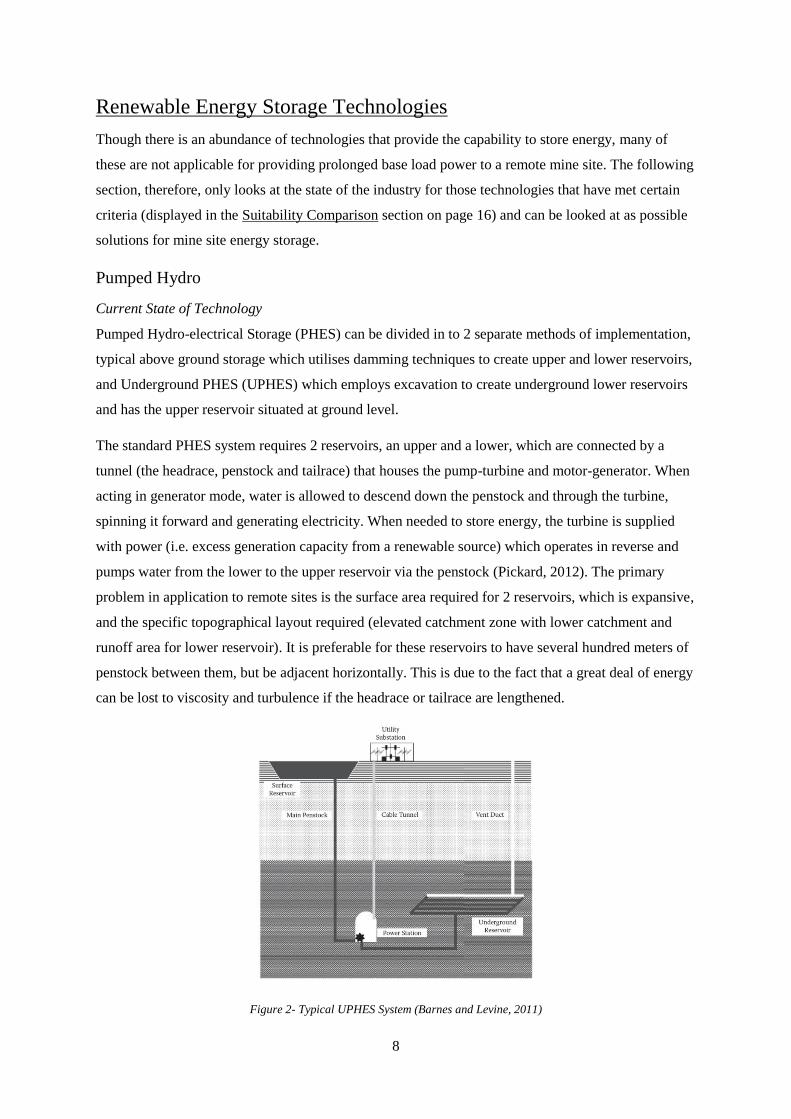
can be lost to viscosity and turbulence if the headrace or tailrace are lengthened.
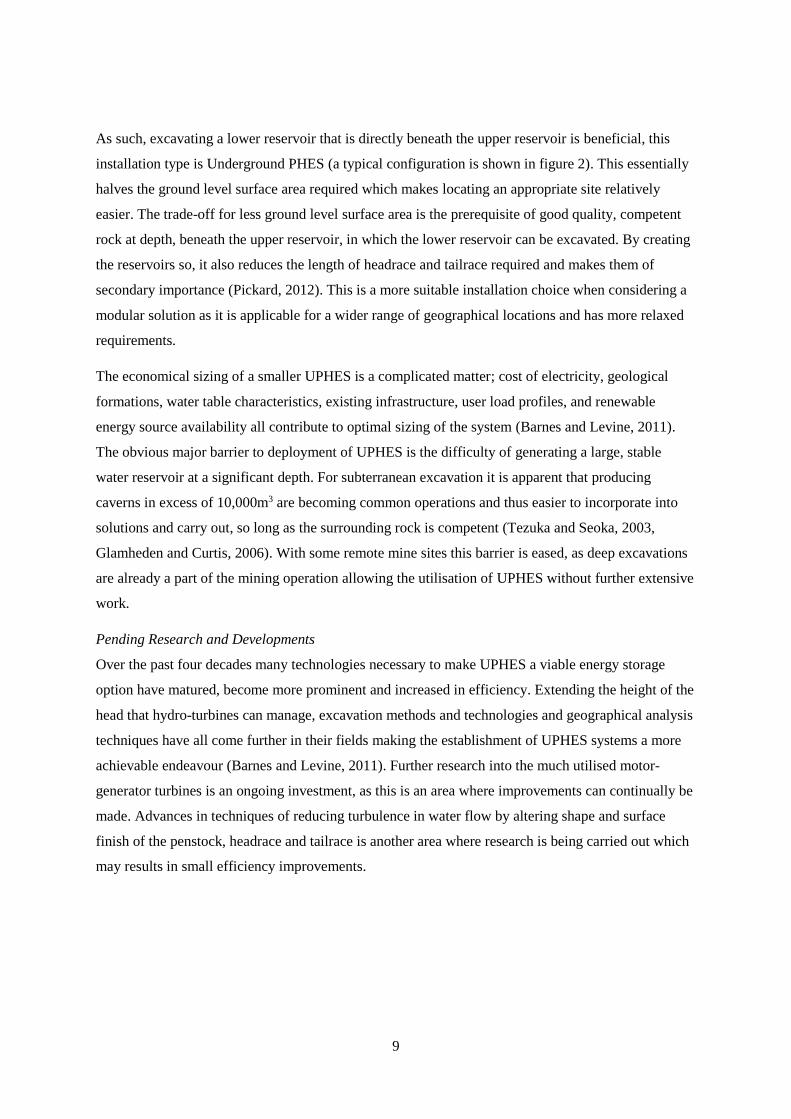
Figure 2- Typical UPHES System (Barnes and Levine, 2011)
9
As such, excavating a lower reservoir that is directly beneath the upper reservoir is beneficial, this
installation type is Underground PHES (a typical configuration is shown in figure 2). This essentially
halves the ground level surface area required which makes locating an appropriate site relatively
easier. The trade-off for less ground level surface area is the prerequisite of good quality, competent
rock at depth, beneath the upper reservoir, in which the lower reservoir can be excavated. By creating
the reservoirs so, it also reduces the length of headrace and tailrace required and makes them of
secondary importance (Pickard, 2012). This is a more suitable installation choice when considering a
modular solution as it is applicable for a wider range of geographical locations and has more relaxed
requirements.
The economical sizing of a smaller UPHES is a complicated matter; cost of electricity, geological
formations, water table characteristics, existing infrastructure, user load profiles, and renewable
energy source availability all contribute to optimal sizing of the system (Barnes and Levine, 2011).
The obvious major barrier to deployment of UPHES is the difficulty of generating a large, stable
water reservoir at a significant depth. For subterranean excavation it is apparent that producing
caverns in excess of 10,000m3 are becoming common operations and thus easier to incorporate into
solutions and carry out, so long as the surrounding rock is competent (Tezuka and Seoka, 2003,
Glamheden and Curtis, 2006). With some remote mine sites this barrier is eased, as deep excavations
are already a part of the mining operation allowing the utilisation of UPHES without further extensive
work.
Pending Research and Developments
Over the past four decades many technologies necessary to make UPHES a viable energy storage
option have matured, become more prominent and increased in efficiency. Extending the height of the
head that hydro-turbines can manage, excavation methods and technologies and geographical analysis
techniques have all come further in their fields making the establishment of UPHES systems a more
achievable endeavour (Barnes and Levine, 2011). Further research into the much utilised motor-
generator turbines is an ongoing investment, as this is an area where improvements can continually be
made. Advances in techniques of reducing turbulence in water flow by altering shape and surface
finish of the penstock, headrace and tailrace is another area where research is being carried out which
may results in small efficiency improvements.

10
Compressed Air Energy Storage
Current State of Technology
CAES systems work in essentially the same fashion as conventional gas turbine power plants, though
with a few differences that result approximately 3 fold increase in power output. Consider a simplified
gas turbine plant that is made up of 4 components; a compressor, a combustion chamber, a turbine and
a generator. The compressor injects high pressure air into the combustion chamber at the same time as
fuel is injected, this mixture is burnt and heats the air so as to greatly increase its pressure. The high
speed vaporous exhaust of this combustion drives the turbine and is then vented. Two thirds of the
resultant mechanical energy is reinvested into running the compressor and only one third is actually
converted to electrical energy (Crotogino, 2001). The primary difference between this and a CAES
system is the separation of the compressing action and the combustion, this is achieved by introducing
clutches (allowing the compressor and the turbine to be individually connected to the motor-
generator, so they can interact independently with it) and pressure chambers to store the compressed
air. During off-peak intervals the compressor fills the pressure chamber so that during peak-demand
periods it can be expanded to produce power. This results in 100% of the mechanical energy being
converted into electrical, hence the 3 fold increase in output. This has the result of making CAES
lower cost on a capital-dollar-input-to-power-output basis than gas turbine plants, as essentially the
same setup costs are incorporated but 3 times the output is acquired. A major downside for the system
is its need for a combustion agent (such as natural gas), meaning CAES systems cannot be included as
part of a fully sustainable, ‘clean’ energy storage solution. The system on average consumes
approximately 33% the amount of premium fuel that conventional combustion turbines do and
consequently emits 33% of the pollution that is output from them; though greatly reduced, it hasn’t
eliminated pollution output or reliance on fuels.
To be put to use as a modular energy storage solution, the size, shape and prerequisite characteristics
of the compressed air chamber (which for grid storage would need to be an expansive underground
cavity) are of utmost importance. Drawing from the Barnes and Levine (2011) theoretically ideal
example, the optimal shape is a vertical cylinder with an aspect ratio of 6:1, and the size of the cavity
for a 290MW output system, with turbine inlet pressure of 46 bar, is in the area of 130,000 m3 per
hour.
Thermal Energy Storage
Current State of Technology
TES systems store energy as heat, which can be converted in to electrical energy during peak-demand
periods. The principle behind the technology is that of storing energy in materials, and utilising

11
heating and cooling to manage the temperature of said materials. It is preferable for the reservoir
materials to be able to handle large changes in internal energy per unit volume so as to minimise the
space required for energy storage. There are 3 distinct ways of storing energy;
Sensible heat; based on an actual temperature change in the reservoir material.
Latent heat; works on an isothermal phase change (temperature remains constant throughout) of the
material within the reservoir (melting, vaporising, freezing etc.).
Thermochemical heat; the heat of a reversible chemical reaction of the material in the reservoir
(Barnes and Levine, 2011).
The ideal storage vessel for the above ground reservoir is of a cylindrical design, as at larger radii the
geometry of the cylinder results in greater surface area and also much greater volume. Spherical tanks
are much harder to construct, and the storage materials are much harder to tailor for this shape of tank.
Underground designs can utilise spherical storage vessels, though the modifying of the storage
materials and support structures will inevitably lead to increased costs of setup. These storage tanks
make up most of the size of installation, needing a 3,460m3 tank for 182MWhthermal (which equates to
approximately10MW of electrical power at the Solar One installation in Barstow, CA, USA). The
area required for a Parabolic Trough is 5 acres/MW for, 8 acres/MW for a Power Tower installation,
and 4 acres/MW for a Stirling Dish (Bhuiyan and Yazdani, 2012). This demonstrates some ability to
be modified depending on specific circumstance. The drawbacks of this method of energy storage are
the lack of total capacity and discharge time, with the largest installation in the world (Solar One)
managing 15MW and a maximum of 12 hours output.
Electrochemical Energy Storage
There are several electrochemical storage options that have been developed which may be applicable
to utility scale energy storage, most of which are under continual development and improvement. The
following sections will provide background information into their operation, as well as some strengths
and weaknesses and their overall applicability to grid storage.
Advanced Lead Acid
Current State of Technology
Over the past 4 decades the lead-acid battery has been the primary heavy duty battery cell utilised by
the energy storage market and within the last decade has been the subject of R&D by many
companies, resulting in innovations and development of more efficient forms. To begin with, all lead-
acid batteries share a common basic chemistry, a positive electrode (lead dioxide) and a negative
electrode (metallic lead) where both electrodes are very porous to maximise surface area to increase
reaction rate (Barnes and Levine, 2011). From the CSIRO has come the creation of the Ultra Battery,

12
which combines an asymmetric super capacitor electrode with the advanced carbon-lead-acid battery
cell into one module. Through use of the capacitor the formulation of lead sulphate deposits inside the
negative plate is eliminated, the capacitor achieves this by altering the process of forming and
dissolving sulphate crystals on the negative plate upon charge and discharge; overall the roundtrip
efficiency is increased (Cooper et al., 2009). Ecoult has used 4 parallel strings of these battery cells,
stored in a containerised format for flexibility, to generate 3MW of power for regulation services
(Wood, 2013).
Eos Battery Cells
Current State of Technology
Another promising developing technology is the Zinc Hybrid Cathode (coined Znyth™) battery being
produced by EOS Energy Storage, which boasts a titanium current collector that is permanently
conductive, non-corrosive and self-healing, a nearly neutral pH electrolyte with additives and
buffering agents that eliminates carbonate clogging issues and improves zinc solubility thus
improving energy density and run time. The company also claims that its “hybridisation of cathode
chemistries and electro-active catalysts improves power density and roundtrip efficiency” (Amendola,
2014) whilst being produced through a highly standardised manufacturing process that lowers costs.
Their current largest modular export is the Eos Aurora which has a capacity of 6 MWh, and is shipped
in an ISO 40ft shipping container (standardised for easy integration). This configuration offers a cost
of $160/kWh, is projected to last for over 10,000 cycles (38 year calendar life based on 5 cycles per
week) and is made from non-toxic materials with no mode of catastrophic failure (Amendola, 2014).
Due to its incredibly recent production, the author has not been able to locate any peer-reviewed
articles that independently and objectively analyse the Eos Battery solution, but recommends
watching this product in the future.
Aquion Battery Cells
Current State of Technology
Aqueous Hydrogen Ion (AHI) Technology was developed by Professor Jay Whitacre in response to
the growing energy needs he saw globally. He produced a battery using abundant, non-toxic materials
and an inexpensive manufacturing technique. The technology comprises saltwater electrolytes, a
synthetic cotton separator, carbon composite anode and manganese oxide cathode. This assortment of
materials results in a non-combustible and non-toxic product that poses no handling risks and is
environmentally friendly. It also uses a non-corrosive reaction at the anode and cathode to prevent
deterioration of the inner components. The batteries are shown to have close to 100% columbic
13
efficiency at 1000 cycles, greater than 40wH per kg specific energy capacity and a round trip
efficiency of roughly 92%.
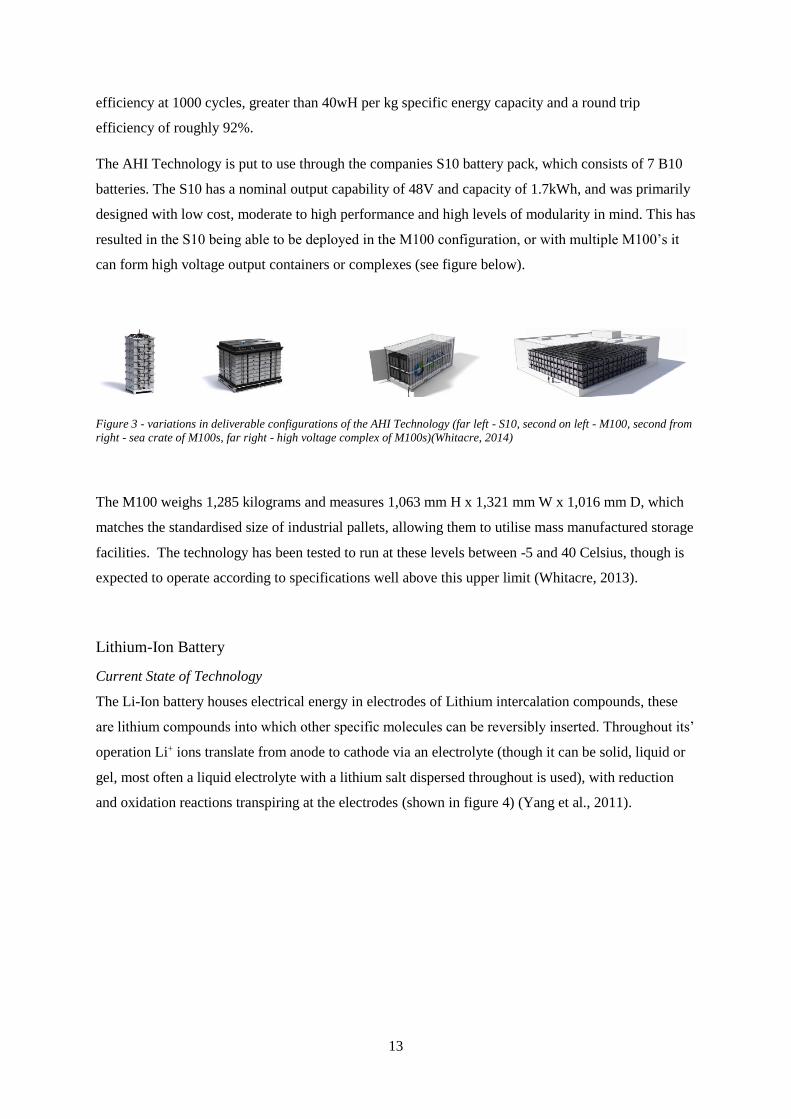
The AHI Technology is put to use through the companies S10 battery pack, which consists of 7 B10
batteries. The S10 has a nominal output capability of 48V and capacity of 1.7kWh, and was primarily
designed with low cost, moderate to high performance and high levels of modularity in mind. This has
resulted in the S10 being able to be deployed in the M100 configuration, or with multiple M100’s it
can form high voltage output containers or complexes (see figure below).
Figure 3 - variations in deliverable configurations of the AHI Technology (far left - S10, second on left - M100, second from
right - sea crate of M100s, far right - high voltage complex of M100s)(Whitacre, 2014)
The M100 weighs 1,285 kilograms and measures 1,063 mm H x 1,321 mm W x 1,016 mm D, which
matches the standardised size of industrial pallets, allowing them to utilise mass manufactured storage
facilities. The technology has been tested to run at these levels between -5 and 40 Celsius, though is
expected to operate according to specifications well above this upper limit (Whitacre, 2013).
Lithium-Ion Battery
Current State of Technology
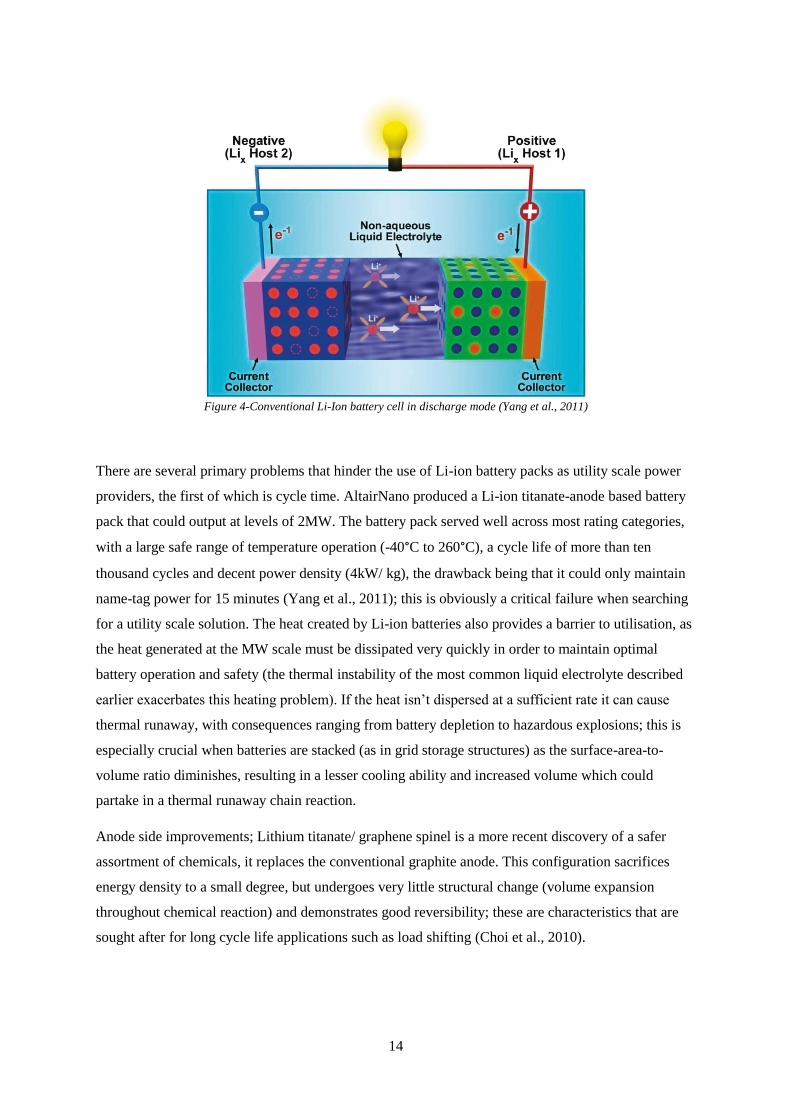
The Li-Ion battery houses electrical energy in electrodes of Lithium intercalation compounds, these
are lithium compounds into which other specific molecules can be reversibly inserted. Throughout its’
operation Li+ ions translate from anode to cathode via an electrolyte (though it can be solid, liquid or
gel, most often a liquid electrolyte with a lithium salt dispersed throughout is used), with reduction
and oxidation reactions transpiring at the electrodes (shown in figure 4) (Yang et al., 2011).
14
Figure 4-Conventional Li-Ion battery cell in discharge mode (Yang et al., 2011)
There are several primary problems that hinder the use of Li-ion battery packs as utility scale power
providers, the first of which is cycle time. AltairNano produced a Li-ion titanate-anode based battery
pack that could output at levels of 2MW. The battery pack served well across most rating categories,
with a large safe range of temperature operation (-40°C to 260°C), a cycle life of more than ten
thousand cycles and decent power density (4kW/ kg), the drawback being that it could only maintain
name-tag power for 15 minutes (Yang et al., 2011); this is obviously a critical failure when searching
for a utility scale solution. The heat created by Li-ion batteries also provides a barrier to utilisation, as
the heat generated at the MW scale must be dissipated very quickly in order to maintain optimal
battery operation and safety (the thermal instability of the most common liquid electrolyte described
earlier exacerbates this heating problem). If the heat isn’t dispersed at a sufficient rate it can cause
thermal runaway, with consequences ranging from battery depletion to hazardous explosions; this is
especially crucial when batteries are stacked (as in grid storage structures) as the surface-area-to-
volume ratio diminishes, resulting in a lesser cooling ability and increased volume which could
partake in a thermal runaway chain reaction.
Anode side improvements; Lithium titanate/ graphene spinel is a more recent discovery of a safer
assortment of chemicals, it replaces the conventional graphite anode. This configuration sacrifices
energy density to a small degree, but undergoes very little structural change (volume expansion
throughout chemical reaction) and demonstrates good reversibility; these are characteristics that are
sought after for long cycle life applications such as load shifting (Choi et al., 2010).

15
Pending Research and Developments
Solid state electrolytes are being increasingly employed as they are theoretically safer and longer
lasting (Yang et al., 2011), the problem they pose is a costly and impractical assembly process. Due to
this unperfected process, solid state electrolytes generally have poor electrochemical activity
characteristics (at low temperatures the mobility of the Li+ ions through the electrolyte is not rapid)
which subsequently increases heat production and lowers power output.
On a similar theme, enhancing the rate performance of Li-ion batteries as a whole (including the many
electrolyte and electrode combinations) is vital, as it is necessary to achieve increased power and to
also reduce the polarization that results from internal resistance; this polarization is a leading cause of
heat generation (Choi et al., 2010). Further research into these areas of the technology is required if it
is to be adopted as a primary source of renewable energy storage.

16
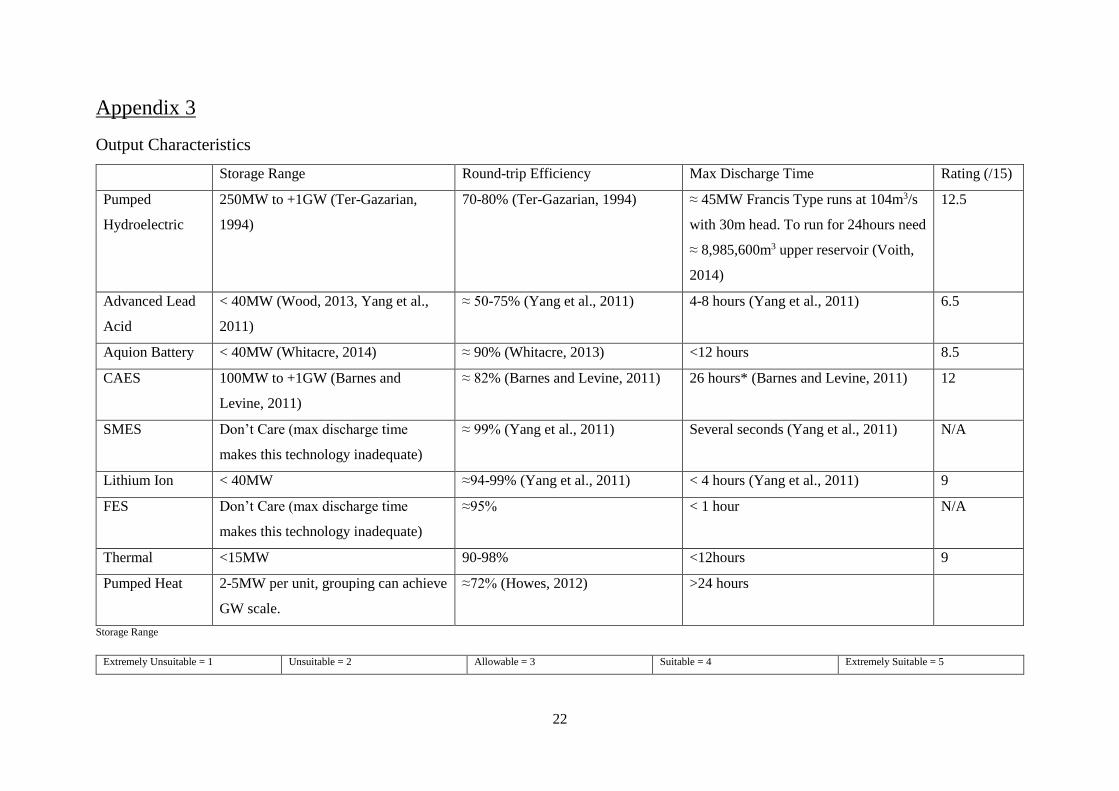
Suitability Comparison
The following table represents a distillation of the rating tables in Appendix 3, which combines the
information previously presented in this document, as well as additional information from further
research. This table is an abstracted representation of the suitability of these technologies to certain
criteria, which are further explained in Appendix 3. For this table the higher the rating, the more
suitable that technology is. These ratings are simply preliminary findings on overall suitability to mine
site power storage and generation, which will add to the information needed to develop the full
recommended energy storage process.
Output
Characteristics (/5) Implementation (/5)
Lifetime and Cost
(/5)
Rating
(/15)
Pumped
Hydroelectric 4.2 3 5 12.2
Advanced
Lead Acid 2.2 4 3 9.2
Aquion
Battery 2.8 4 2 8.8
CAES 4 3 5 12
Lithium Ion 3 4.5 3 10.5
TES 3
4 3 10
Extremely
Unsuitable Unsuitable Allowable Suitable
Extremely
Suitable
Discussion
As is perhaps not so clear, many of the technologies are not suitable for use as whole day, full energy
generation solutions. TES, though offering adequate power, can only support output for 3-8 hours
which is insufficient, and FES for only a matter of minutes. This displays the importance of testing the
rating criteria robustness and quality across many applications. Battery solutions are becoming more
suitable as their cycle life and total output increases, their implementation costs remain low relative to
the alternatives and their inherent modularity makes them easy to modify to specific scenarios. Lastly,
UPHES and CAES systems look promising due to their large output ability and low cost per unit
output over entire lifetime, what appears to be their major drawback at the moment is their expensive
initial capital investment and lengthy installation time. With more research in to these specifics, these
barriers may be found to be not so insurmountable.
17
Methodology for Completion of Thesis
Further Research
More research is needed in to all of the associated costs of most of the reviewed energy storage
technologies, ranging from setup costs to maintenance costs to end-of-life/ reclamation costs. This is
vital to providing a useful modular example.
Also, more information is coming out weekly with updates on the Aquion Batteries, the Advanced
Lead Acid Batteries and the Eos Battery Cells, as these are still undergoing finalisation, testing and
entering of the market place. This will hopefully mean much field testing will take place, resulting in
an abundance of accurate information. This will remain a focus throughout the remainder of the
thesis.
Finally, the method for rating each of the characteristics is still in its infancy and requires much work.
Through further investigation of other papers rating systems the author hopes to produce a very
meaningful and information laden rating system that is easy to interpret, but that does not lose
information in the process of ranking. This will help to ascertain the prominent technology for this
application, and to show proof through transparent and understandable reasoning.
Towards Achieving Objectives
The author has identified two objectives to be completed for the thesis, firstly to determine the
optimal energy storage technology, or combination of technologies, that can be used as storage for
renewable energy sources in a variety of remote Australian mine site scenarios. Secondly, to identify a
modular form of the solution systems that can be easily scaled and applied to these scenarios so as to
provide initial information (approximate cost, installation size, time until start-up, applicable
technologies and relevant background information) with minimal site-specific research and cost
formulation being carried out. In doing so, major market manufacturers and suppliers of identified
technologies will need to be recognised so that relatively specific installation times and costs can be
found.
To achieve these objectives, the author needs to further define the current market leaders in
manufacturing, supplying and researching and more accurately identify their costs (with special
attention paid to variation in size of system). From here it is also necessary to research and generate a
list of typical environments (and their characteristics) that prospective remote mine sites encounter.
To realise the development of the energy storage solution model, major work is to be put in to
exploring the usefulness of the 2 decision evaluation methods; evaluation by economic optimisation
modelling and also of decisions involving multiple criteria. One will be selected and using this
framework the process will be created. Upon completion of these milestones, it should be delivered in
a document that is easily interpreted and just as easily put to use.

18
References
AMENDOLA, S. 2014. EOS Energy Storage - Znyth Technology and Products [Online]. Available: http://www.eosenergystorage.com/technology-and-products/ [Accessed 20th May 2014 2014].
BARNES, F. S. & LEVINE, J. G. 2011. Large Energy Storage Systems Handbook, 6000 Broken Sound Parkway NW, Suite 300, Boca Raton, FL 33487-2742, CRC Press.
BHUIYAN, F. A. & YAZDANI, A. Energy storage technologies for grid-connected and off-grid power system applications. Electrical Power and Energy Conference (EPEC), 2012 IEEE, 10-12 Oct. 2012 2012. 303-310.
BLANCHARD, B. S. & FABRYCKY, W. J. 2006. Systems Engineering and Analysis, Uppwe Saddle River, New Jersey 07458, Pearson Prentice Hall.
CARVALHO, M. 2012. Concept Development of Optimal Mine Site Energy Supply. energies, 2012, 20. CHEN, H., CONG, T. N., YANG, W., TAN, C., LI, Y. & DING, Y. 2009. Progress in electrical energy
storage system: A critical review. Progress in Natural Science, 19, 291-312. CHOI, D., WANG, D., VISWANATHAN, V. V., BAE, I.-T., WANG, W., NIE, Z., ZHANG, J.-G., GRAFF, G. L.,
LIU, J., YANG, Z. & DUONG, T. 2010. Li-ion batteries from LiFePO4 cathode and anatase/graphene composite anode for stationary energy storage. Electrochemistry Communications, 12, 378-381.
COOPER, A., FURAKAWA, J., LAM, L. & KELLAWAY, M. 2009. The UltraBattery—A new battery design for a new beginning in hybrid electric vehicle energy storage. Journal of Power Sources, 188, 642-649.
CROTOGINO, F. 2001. Huntorf CAES: More than 20 Years of Successful Operation. Orlando, Florida, USA: KBB GmbH, Hannover, Germany.
DEANE, J. P., Ó GALLACHÓIR, B. P. & MCKEOGH, E. J. 2010. Techno-economic review of existing and new pumped hydro energy storage plant. Renewable and Sustainable Energy Reviews, 14, 1293-1302.
GLAMHEDEN, R. & CURTIS, P. 2006. Excavation of a cavern for high-pressure storage of natural gas. Tunnelling and Underground Space Technology, 21, 56-67.
GORDON, J. 2013. Voltage and Frequency Stability Analysis of an Isolated Mining Grid with High Levels of PV Penetration. Bachelor of Electrical Engineering, The University of Newcastle.
HARTLEY, S. 2014. Professional Project Management; the integration of strategy, operations and change, Praham VIC 3181 Australia, Tilde Publishing and Distribution.
HOWES, J. 2012. Concept and Development of a Pumped Heat Electricity Storage Device. Proc. IEEE, 100, 493-503.
INAGE, S.-I. 2009. Prospects for Large-Scale Energy Storage in Decarbonised Power Grids. 9 rue de la Fédération, 75739 Paris Cedex 15, France: International Energy Agency.
MCKITTRICK, H. & MCKITTRICK, E. 2010. Donlin Gold Project [Online]. Seldovia, AK 99663: Ground Truth Trekking. Available: http://www.groundtruthtrekking.org/Issues/MetalsMining/Donlin-Creek-gold-mine-prospect.html 2014].
ONWUEGBUZIE, A. J., LEECH, N. L. & COLLINS, K. M. T. 2012. Qualitative Analysis Techniques for the Review of the Literature. The Qualitative Report, 17, 1-28.
OZAWA, K. 2012. Lithium Ion Rechargeable Batteries, Hoboken : John Wiley & Sons. PICKARD, W. F. 2012. The History, Present State, and Future Prospects of Underground Pumped
Hydro for Massive Energy Storage. Proceedings of the IEEE, 100, 473-483. REICHARDT, P., HANEMANN, L., MILLER, P. A., LUM, D., SORENSEN, A. & YORDY, J. 2010. Fort Knox
Mine [Online]. 830 College Road, Fairbanks, AK 99701: Northern Alaska Environmental Center. Available: http://northern.org/programs/clean-water-mines/hardrock-mines-in-interior-and-arctic-alaska/fort-knox-true-north-mine-1/fort-knox-true-north-mine 2014].

19
TER-GAZARIAN, A. 1994. Energy Storage for Power Systems. Available: http://app.knovel.com/hotlink/toc/id:kpESPS000D/energy-storage-power-2.
TEZUKA, M. & SEOKA, T. 2003. Latest technology of underground rock cavern excavation in Japan. Tunnelling and Underground Space Technology, 18, 127-144.
VOITH 2014. Francis turbines. Alexanderstrasse 11, 89522 Heidenheim/Germany: Voith Hydro Holding GmbH & Co. KG.
WHITACRE, J. 2013. Large Format Aqueous Electrolyte Polyionic Devices for Low Cost, Multi-Hour Stationary Energy Storage. In: ENERGY, A. (ed.) Aquion Energy. Aquion Energy, 32 39th Street, Pittsburgh PA 15201: Aquion Energy.
WHITACRE, J. 2014. Aquion Energy [Online]. 32 39th Street, Pittsburgh, PA 15201, 412.904.6400: Aquion Energy. Available: http://www.aquionenergy.com 2014].
WOOD, J. 2013. Integrating Renewables into the Grid: Applying UltraBattery® Technology in MW Scale Energy Storage Solutions for Continuous Variability Management. In: ECOULT (ed.).
YANG, C.-J. & JACKSON, R. B. 2011. Opportunities and barriers to pumped-hydro energy storage in the United States. Renewable and Sustainable Energy Reviews, 15, 839-844.
YANG, Z., ZHANG, J., KINTNER-MEYER, M. C. W., LU, X., CHOI, D., LEMMON, J. P. & LIU, J. 2011. Electrochemical Energy Storage for Green Grid. Chemical Reviews, 111, 3577-3613.
20
Appendix 1
Gantt chart
21
Appendix 2
Risk Assessment Matrices
(risk assessment procedures provided by Hartley (2014))
Internal Risk
(Controllable)
Probability Impact Priority External Risk
(Uncontrollable)
Probability Impact Priority
Ambiguous
Objectives
2 Revise entire thesis
(4)
8 Limited Available
Research Information
2 Make assumptions
(3)
6
Inaccurate Time
Estimates
3 Additional hours
required (2)
6 Project specification
changes (via UWA)
1 Revise entire thesis
(4)
4
Poor Performance 3 Additional hours
required (2)
6 Loss of data (HDD
Malfunction etc.)
1 Re-do thesis (5) 5
Undefined Quality
Requirements
4 Supervisor to
specify requirements
(3)
12
Risk Probability Explanation
Value Descriptor
1 Rare 1% chance of occurring
2 Unlikely Slight possibility of occurring
3 Moderate Reasonable to consider it could occur
4 Likely Most probably it will occur
5 Certain 100% chance of occurring
Risk Impact Explanation
Value Descriptor
1 Insignificant Impact inconsequential
2 Minor Noticeable impact
3 Moderate Impact management necessary
4 Major Large scale of impact
5 Catastrophic Extreme, possibly thesis failing impact
22
Appendix 3
Output Characteristics
Storage Range Round-trip Efficiency Max Discharge Time Rating (/15)
Pumped
Hydroelectric
250MW to +1GW (Ter-Gazarian,
1994)
70-80% (Ter-Gazarian, 1994) ≈ 45MW Francis Type runs at 104m3/s
with 30m head. To run for 24hours need
≈ 8,985,600m3 upper reservoir (Voith,
2014)
12.5
Advanced Lead
Acid
< 40MW (Wood, 2013, Yang et al.,
2011)
≈ 50-75% (Yang et al., 2011) 4-8 hours (Yang et al., 2011) 6.5
Aquion Battery < 40MW (Whitacre, 2014) ≈ 90% (Whitacre, 2013) <12 hours 8.5
CAES 100MW to +1GW (Barnes and
Levine, 2011)
≈ 82% (Barnes and Levine, 2011) 26 hours* (Barnes and Levine, 2011) 12
SMES Don’t Care (max discharge time
makes this technology inadequate)
≈ 99% (Yang et al., 2011) Several seconds (Yang et al., 2011) N/A
Lithium Ion < 40MW ≈94-99% (Yang et al., 2011) < 4 hours (Yang et al., 2011) 9
FES Don’t Care (max discharge time
makes this technology inadequate)
≈95% < 1 hour N/A
Thermal <15MW 90-98% <12hours 9
Pumped Heat 2-5MW per unit, grouping can achieve
GW scale.
≈72% (Howes, 2012) >24 hours
Storage Range
Extremely Unsuitable = 1 Unsuitable = 2 Allowable = 3 Suitable = 4 Extremely Suitable = 5

23
< 5MW 6-34MW 35-99MW 100-199MW > 200MW
Round Trip Efficiency
Extremely Unsuitable = 1 Unsuitable = 2 Allowable = 3 Suitable = 4 Extremely Suitable = 5
0-24% 25-49% 50-74% 75-89% >90%
Max Discharge Time
Extremely Unsuitable = 1 Unsuitable = 2 Allowable = 3 Suitable = 4 Extremely Suitable = 5
<0.5day 0.5-1day 1-2days 2-3days >3days
24
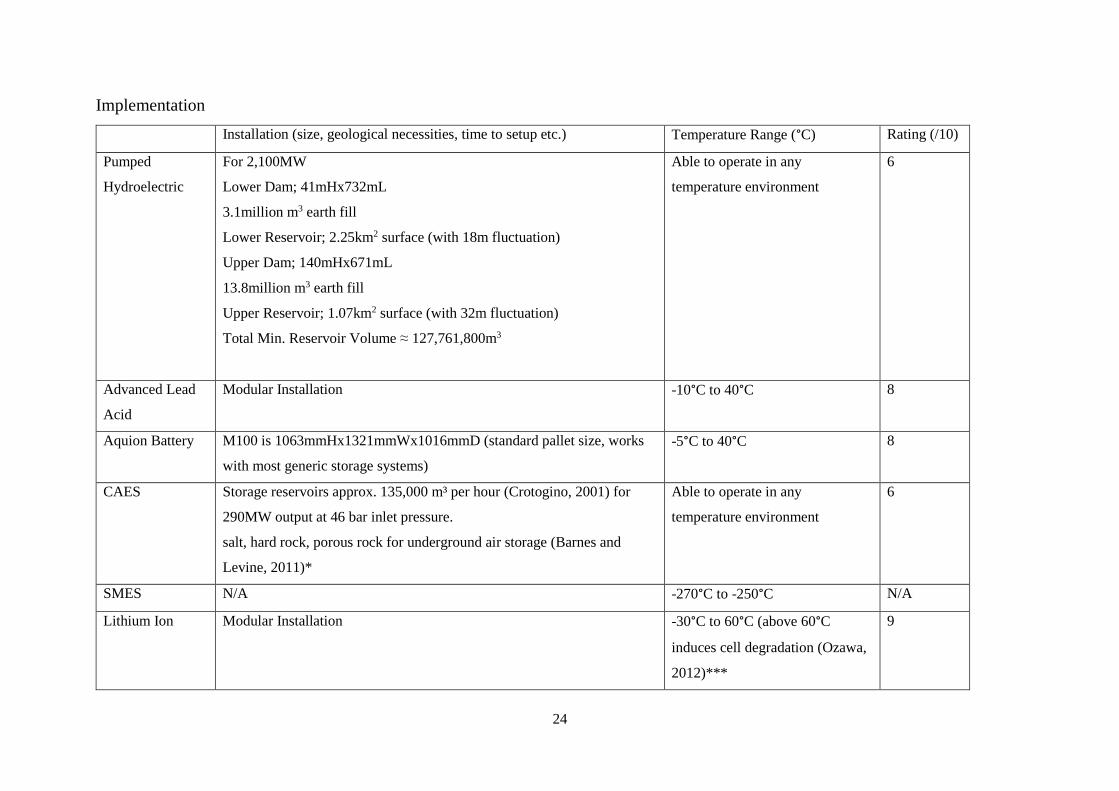
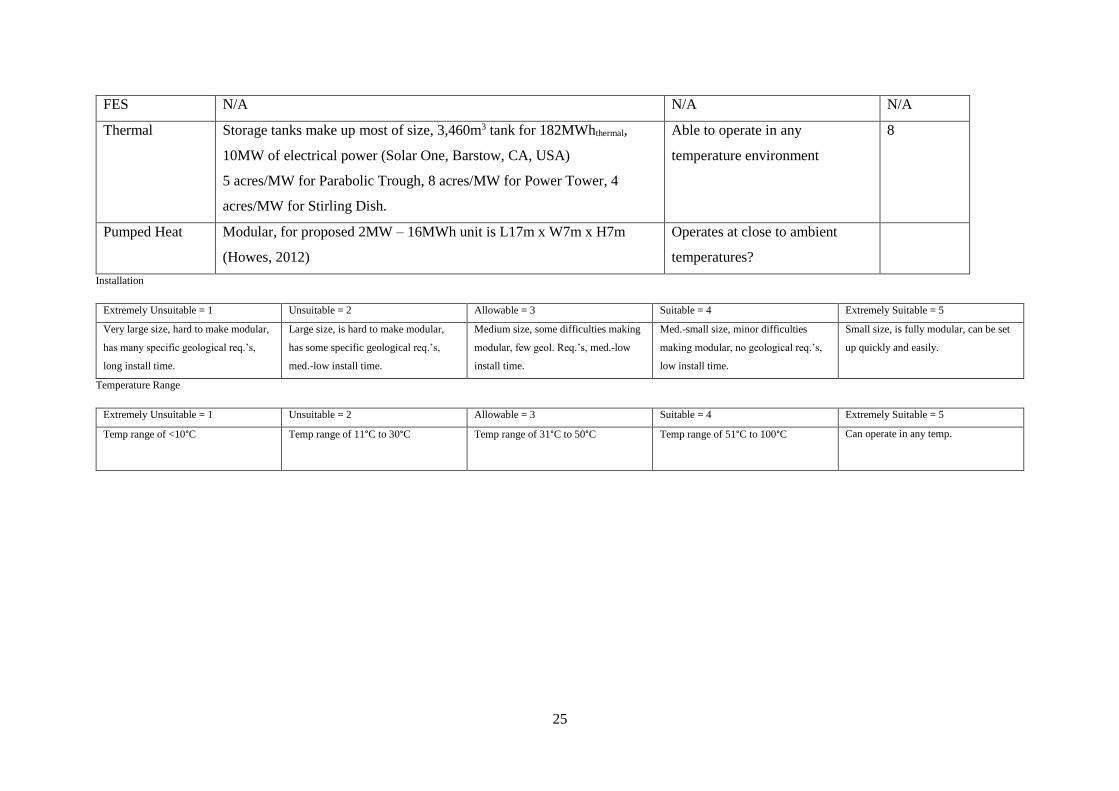
Implementation
Installation (size, geological necessities, time to setup etc.) Temperature Range (°C) Rating (/10)
Pumped
Hydroelectric
For 2,100MW
Lower Dam; 41mHx732mL
3.1million m3 earth fill
Lower Reservoir; 2.25km2 surface (with 18m fluctuation)
Upper Dam; 140mHx671mL
13.8million m3 earth fill
Upper Reservoir; 1.07km2 surface (with 32m fluctuation)
Total Min. Reservoir Volume ≈ 127,761,800m3
Able to operate in any
temperature environment
6
Advanced Lead
Acid
Modular Installation -10°C to 40°C 8
Aquion Battery M100 is 1063mmHx1321mmWx1016mmD (standard pallet size, works
with most generic storage systems)
-5°C to 40°C 8
CAES Storage reservoirs approx. 135,000 m³ per hour (Crotogino, 2001) for
290MW output at 46 bar inlet pressure.
salt, hard rock, porous rock for underground air storage (Barnes and
Levine, 2011)*
Able to operate in any
temperature environment
6
SMES N/A -270°C to -250°C N/A
Lithium Ion Modular Installation -30°C to 60°C (above 60°C
induces cell degradation (Ozawa,
2012)***
9
25
FES N/A N/A N/A
Thermal Storage tanks make up most of size, 3,460m3 tank for 182MWhthermal,
10MW of electrical power (Solar One, Barstow, CA, USA)
5 acres/MW for Parabolic Trough, 8 acres/MW for Power Tower, 4
acres/MW for Stirling Dish.
Able to operate in any
temperature environment
8
Pumped Heat Modular, for proposed 2MW – 16MWh unit is L17m x W7m x H7m
(Howes, 2012)
Operates at close to ambient
temperatures?
Installation
Extremely Unsuitable = 1 Unsuitable = 2 Allowable = 3 Suitable = 4 Extremely Suitable = 5
Very large size, hard to make modular,
has many specific geological req.’s,
long install time.
Large size, is hard to make modular,
has some specific geological req.’s,
med.-low install time.
Medium size, some difficulties making
modular, few geol. Req.’s, med.-low
install time.
Med.-small size, minor difficulties
making modular, no geological req.’s,
low install time.
Small size, is fully modular, can be set
up quickly and easily.
Temperature Range
Extremely Unsuitable = 1 Unsuitable = 2 Allowable = 3 Suitable = 4 Extremely Suitable = 5
Temp range of <10°C Temp range of 11°C to 30°C Temp range of 31°C to 50°C Temp range of 51°C to 100°C Can operate in any temp.
26
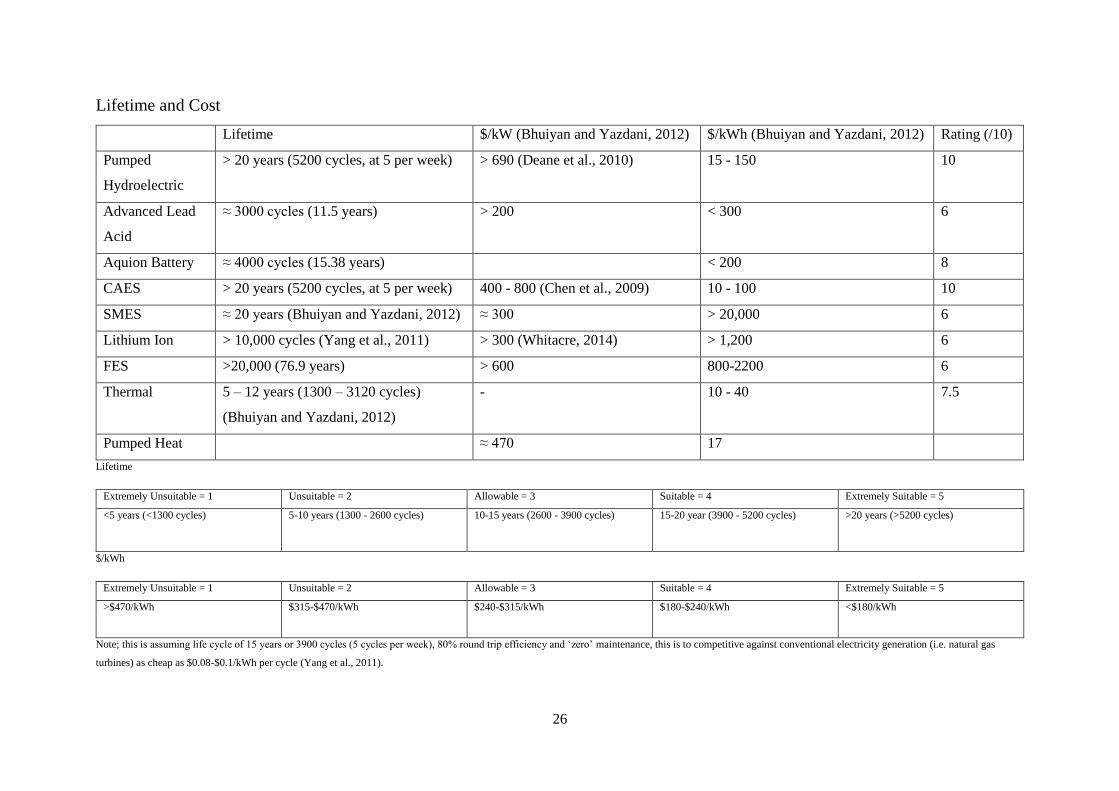
Lifetime and Cost
Lifetime $/kW (Bhuiyan and Yazdani, 2012) $/kWh (Bhuiyan and Yazdani, 2012) Rating (/10)
Pumped
Hydroelectric
> 20 years (5200 cycles, at 5 per week) > 690 (Deane et al., 2010) 15 - 150 10
Advanced Lead
Acid
≈ 3000 cycles (11.5 years) > 200 < 300 6
Aquion Battery ≈ 4000 cycles (15.38 years) < 200 8
CAES > 20 years (5200 cycles, at 5 per week) 400 - 800 (Chen et al., 2009) 10 - 100 10
SMES ≈ 20 years (Bhuiyan and Yazdani, 2012) ≈ 300 > 20,000 6
Lithium Ion > 10,000 cycles (Yang et al., 2011) > 300 (Whitacre, 2014) > 1,200 6
FES >20,000 (76.9 years) > 600 800-2200 6
Thermal 5 – 12 years (1300 – 3120 cycles)
(Bhuiyan and Yazdani, 2012)
- 10 - 40 7.5
Pumped Heat ≈ 470 17
Lifetime
Extremely Unsuitable = 1 Unsuitable = 2 Allowable = 3 Suitable = 4 Extremely Suitable = 5
<5 years (<1300 cycles) 5-10 years (1300 - 2600 cycles) 10-15 years (2600 - 3900 cycles) 15-20 year (3900 - 5200 cycles) >20 years (>5200 cycles)
$/kWh
Extremely Unsuitable = 1 Unsuitable = 2 Allowable = 3 Suitable = 4 Extremely Suitable = 5
>$470/kWh $315-$470/kWh $240-$315/kWh
$180-$240/kWh <$180/kWh
Note; this is assuming life cycle of 15 years or 3900 cycles (5 cycles per week), 80% round trip efficiency and ‘zero’ maintenance, this is to competitive against conventional electricity generation (i.e. natural gas
turbines) as cheap as $0.08-$0.1/kWh per cycle (Yang et al., 2011).