Embed Size (px)
Citation preview
Electric Vehicles: A future Projection
Interactive Qualifying Project
From: Sotirios- Aris Papaioannou
Submitted to: Professor Robert Thompson
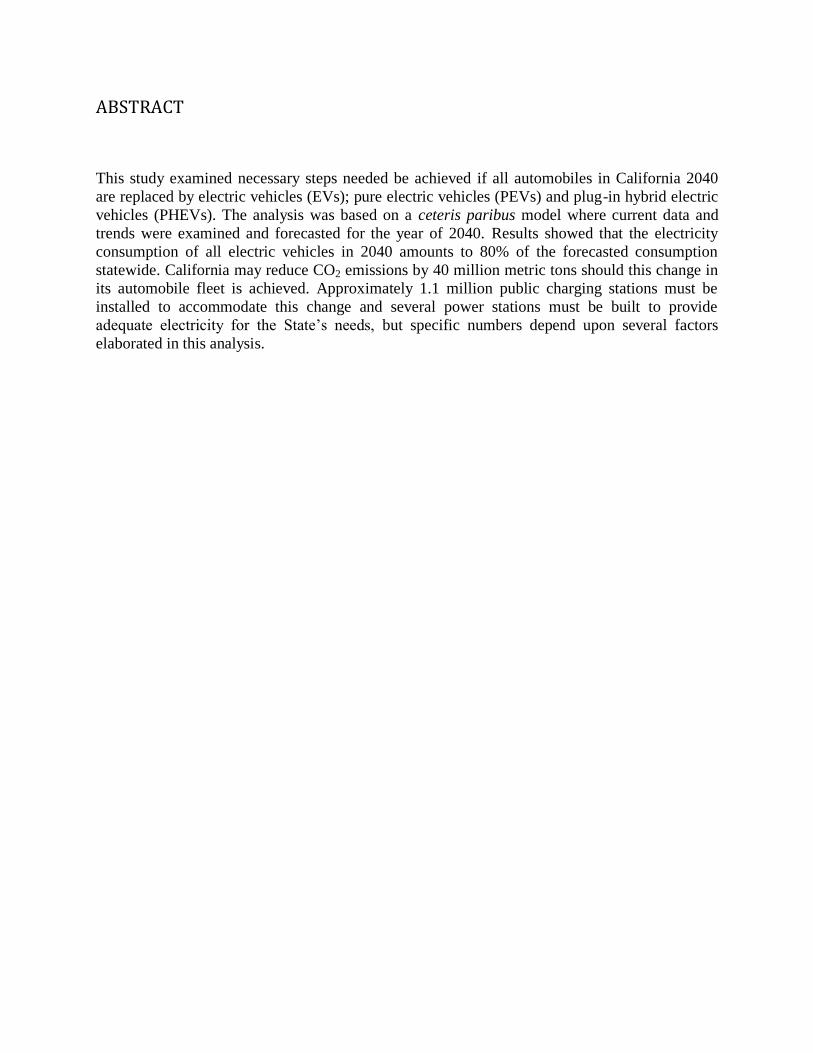
ABSTRACT
This study examined necessary steps needed be achieved if all automobiles in California 2040
are replaced by electric vehicles (EVs); pure electric vehicles (PEVs) and plug-in hybrid electric
vehicles (PHEVs). The analysis was based on a ceteris paribus model where current data and
trends were examined and forecasted for the year of 2040. Results showed that the electricity
consumption of all electric vehicles in 2040 amounts to 80% of the forecasted consumption
statewide. California may reduce CO2 emissions by 40 million metric tons should this change in
its automobile fleet is achieved. Approximately 1.1 million public charging stations must be
installed to accommodate this change and several power stations must be built to provide
adequate electricity for the State’s needs, but specific numbers depend upon several factors
elaborated in this analysis.
ACKNOWLEDGEMENTS
I would like to express my sincere appreciation and thankfulness to my advisor, Professor Robert
Thompson, for his guidance and continuous support through the course of this work. His useful,
instructive suggestions and guiding reading material not only was essential to the completion of
this report but had great pedagogic value to me as a person and a future citizen. I would like to
particularly thank him for that.
Additionally, I would like to thank Miss Deborah Scott for taking the time to share her useful
personal experience with a plug-in hybrid electric vehicle, Miss Liz Tomaszewski who provided
knowledge on charging stations and Professor John Orr for providing essential technical
knowledge on electricity generation, transmission and distribution. Last but not least, I would
like to thank Mr. John Swanton, spokesman of the California Air Resources Board, who
analytically answered to clarifying questions regarding the Zero Emission Vehicle Action Plan.
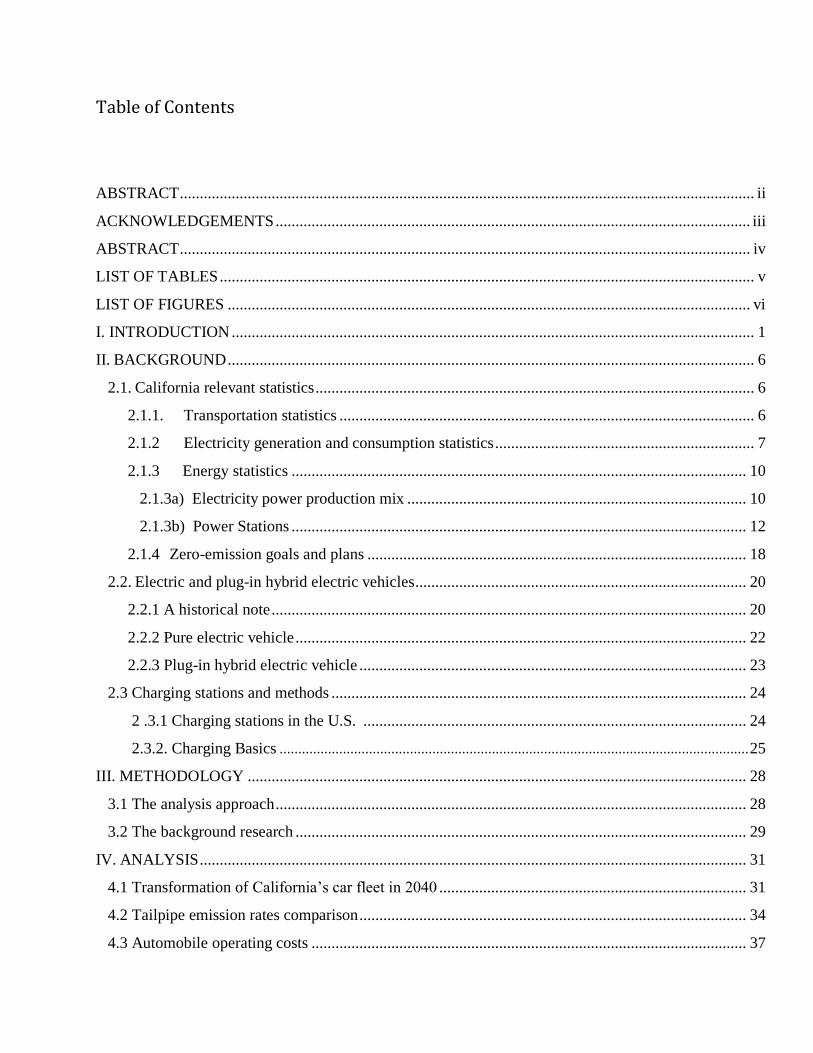
Table of Contents
ABSTRACT ................................................................................................................................................ ii
ACKNOWLEDGEMENTS ....................................................................................................................... iii
ABSTRACT ............................................................................................................................................... iv
LIST OF TABLES ...................................................................................................................................... v
LIST OF FIGURES ................................................................................................................................... vi
I. INTRODUCTION ................................................................................................................................... 1
II. BACKGROUND .................................................................................................................................... 6
2.1. California relevant statistics .............................................................................................................. 6
2.1.1. Transportation statistics ........................................................................................................ 6
2.1.2 Electricity generation and consumption statistics ................................................................. 7
2.1.3 Energy statistics .................................................................................................................. 10
2.1.3a) Electricity power production mix ..................................................................................... 10
2.1.3b) Power Stations .................................................................................................................. 12
2.1.4 Zero-emission goals and plans ............................................................................................... 18
2.2. Electric and plug-in hybrid electric vehicles ................................................................................... 20
2.2.1 A historical note ....................................................................................................................... 20
2.2.2 Pure electric vehicle ................................................................................................................. 22
2.2.3 Plug-in hybrid electric vehicle ................................................................................................. 23
2.3 Charging stations and methods ........................................................................................................ 24
2 .3.1 Charging stations in the U.S. ................................................................................................ 24
2.3.2. Charging Basics .............................................................................................................................. 25
III. METHODOLOGY ............................................................................................................................. 28
3.1 The analysis approach ...................................................................................................................... 28
3.2 The background research ................................................................................................................. 29
IV. ANALYSIS ......................................................................................................................................... 31
4.1 Transformation of California’s car fleet in 2040 ............................................................................. 31
4.2 Tailpipe emission rates comparison ................................................................................................. 34
4.3 Automobile operating costs ............................................................................................................. 37
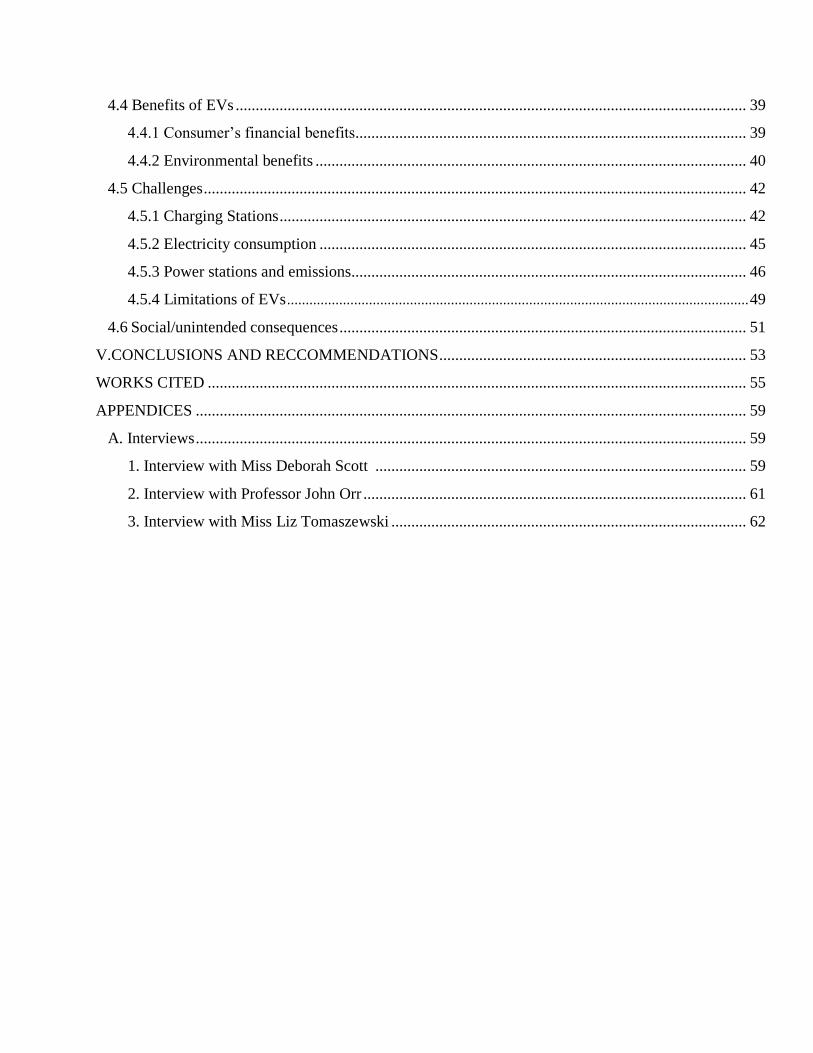
4.4 Benefits of EVs ................................................................................................................................ 39
4.4.1 Consumer’s financial benefits.................................................................................................. 39
4.4.2 Environmental benefits ............................................................................................................ 40
4.5 Challenges ........................................................................................................................................ 42
4.5.1 Charging Stations ..................................................................................................................... 42
4.5.2 Electricity consumption ........................................................................................................... 45
4.5.3 Power stations and emissions................................................................................................... 46
4.5.4 Limitations of EVs ............................................................................................................................ 49
4.6 Social/unintended consequences ...................................................................................................... 51
V.CONCLUSIONS AND RECCOMMENDATIONS ............................................................................. 53
WORKS CITED ....................................................................................................................................... 55
APPENDICES .......................................................................................................................................... 59
A. Interviews .......................................................................................................................................... 59
1. Interview with Miss Deborah Scott ............................................................................................. 59
2. Interview with Professor John Orr ................................................................................................ 61
3. Interview with Miss Liz Tomaszewski ......................................................................................... 62
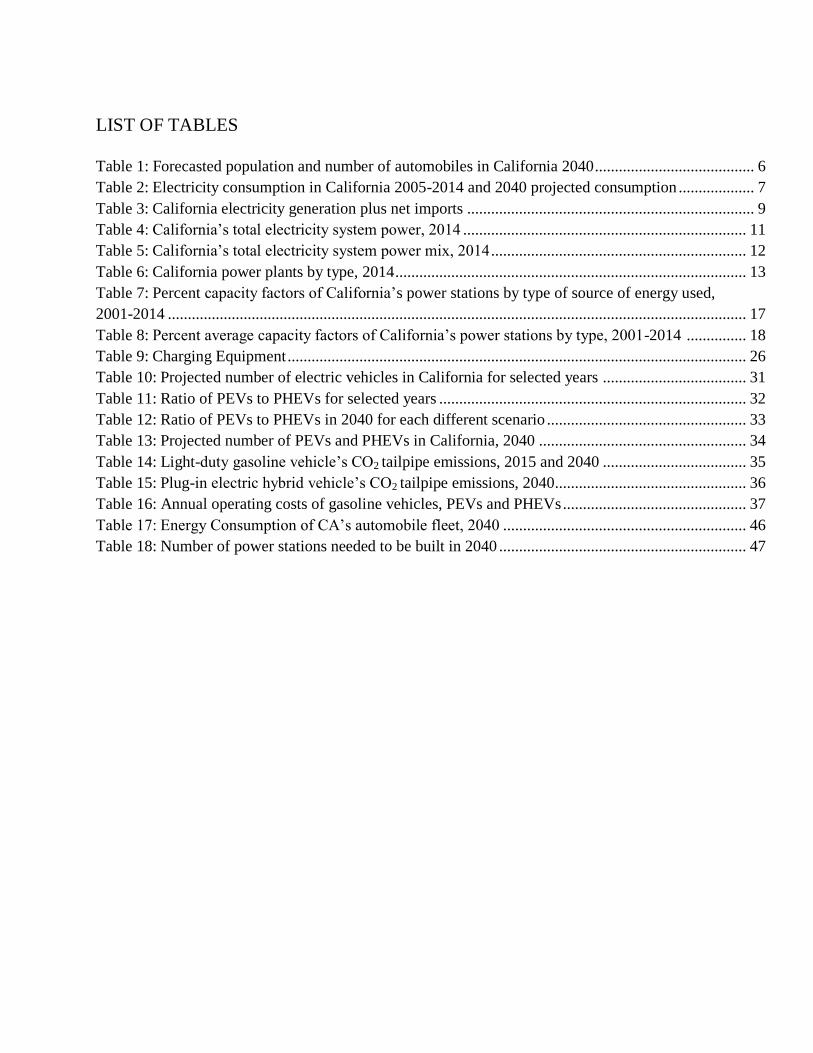
LIST OF TABLES
Table 1: Forecasted population and number of automobiles in California 2040 ........................................ 6
Table 2: Electricity consumption in California 2005-2014 and 2040 projected consumption ................... 7
Table 3: California electricity generation plus net imports ........................................................................ 9
Table 4: California’s total electricity system power, 2014 ....................................................................... 11
Table 5: California’s total electricity system power mix, 2014 ................................................................ 12
Table 6: California power plants by type, 2014 ........................................................................................ 13
Table 7: Percent capacity factors of California’s power stations by type of source of energy used,
2001-2014 ................................................................................................................................................. 17
Table 8: Percent average capacity factors of California’s power stations by type, 2001-2014 ............... 18
Table 9: Charging Equipment ................................................................................................................... 26
Table 10: Projected number of electric vehicles in California for selected years .................................... 31
Table 11: Ratio of PEVs to PHEVs for selected years ............................................................................. 32
Table 12: Ratio of PEVs to PHEVs in 2040 for each different scenario .................................................. 33
Table 13: Projected number of PEVs and PHEVs in California, 2040 .................................................... 34
Table 14: Light-duty gasoline vehicle’s CO2 tailpipe emissions, 2015 and 2040 .................................... 35
Table 15: Plug-in electric hybrid vehicle’s CO2 tailpipe emissions, 2040................................................ 36
Table 16: Annual operating costs of gasoline vehicles, PEVs and PHEVs .............................................. 37
Table 17: Energy Consumption of CA’s automobile fleet, 2040 ............................................................. 46
Table 18: Number of power stations needed to be built in 2040 .............................................................. 47
LIST OF FIGURES
Figure 1: ‘Can electrics rev up?’ ................................................................................................................ 2
Figure 2: Hybrid electric car market annual sales ..................................................................................... 3
Figure 3: California’s per capita electricity consumption, 1960-2010 ....................................................... 8
Figure 4: In-state electric generation by fuel type, 2001-2014 ................................................................. 14
Figure 5: Installed in-state electric generation nameplate capacity by fuel type, 2001-2014................... 16
Figure 6: Robert Anderson’s electric vehicle, 1832 ................................................................................. 21
Figure 7: Typical PEVs battery pack ........................................................................................................ 22
Figure 8: Electric charging stations in the U.S., 2015 .............................................................................. 25
Figure 9: Ratio of PEVs to PHEVs for three different scenarios, linear regression model ...................... 32
Figure 10: EVs pollution ratings vs gasoline vehicles’emissions by region, 2015 .................................. 41
Figure 11: Range vs temperature, Tesla owner’s personal usage data ..................................................... 50
I. INTRODUCTION
Since the appearance of the internal combustion engine towards the end of the 19th
century and
specifically its installation and use in wheeled automobiles, motorcars have been creating
pollution as a result of their emissions to the environment. The degree of this pollution has been
increasing over time with more and more automobiles appearing on the roads through the years.
It was only in the early 1950’s when air pollution and automobiles were first linked by a
California researcher who determined that vehicle traffic was the cause for the smoggy skies
over the city of Los Angeles [1]. In relatively recent years, there have been several attempts to
regulate these emissions, such as the first auto emissions law which was passed in California in
1964 and the establishment of the United States Environmental Protection Agency in 1970 under
the presidency of Richard Nixon. Despite the several emissions regulations, the internal
combustion engine, powered by fossil fuels, will inevitably continue to emit and cause
environmental pollution. This fact, coupled with the rapid technological developments through
the late 20th
century until today, has stimulated corporations worldwide to pursue and develop
alternative means to vehicle power, in an overall effort of both reducing environmental harm and
abiding to stringent emission laws passed by national governments around the globe.
Hybrid and electric vehicles have gained significant popularity over the past few years as they
are generally believed to be a ‘greener’ solution compared to their gasoline peers. It is well
known that vehicle emissions are responsible for large amounts of greenhouse gas production
and are leading contributors toward smog and general air pollution. Consumers as a whole are
starting to be more environmentally aware of these problems. With gas prices skyrocketing over
the past few decades consumers have yet another reason to start paying more attention to the
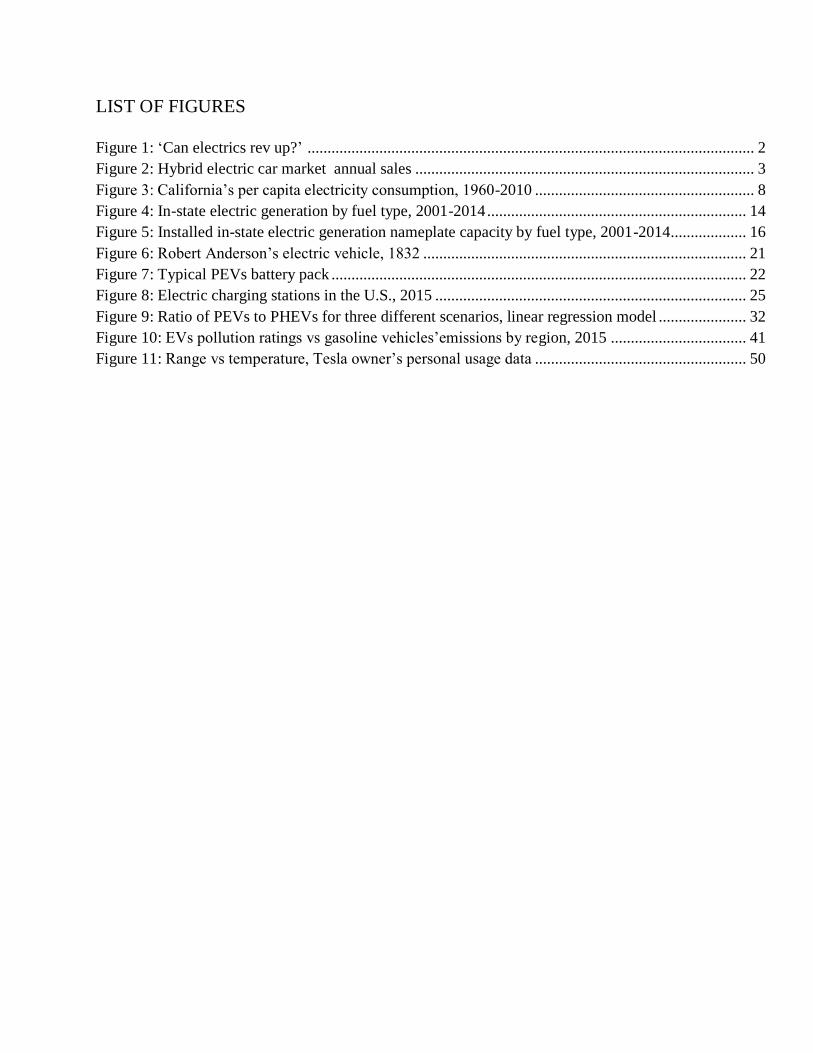
benefits of using alternative, low-emission vehicles. At the same time, car manufacturers around
the world have been developing new technologies to promote the usage of hybrid and electric
vehicles. “The market for electric cars is sputtering, but the price of the technology is falling”
[2], says Michael Law, an analyst at Needham & Co. Electric vehicles’ annual sales statistics
who also supports this prediction.
Figure 1: ‘Can Electrics Rev up?’ [2]
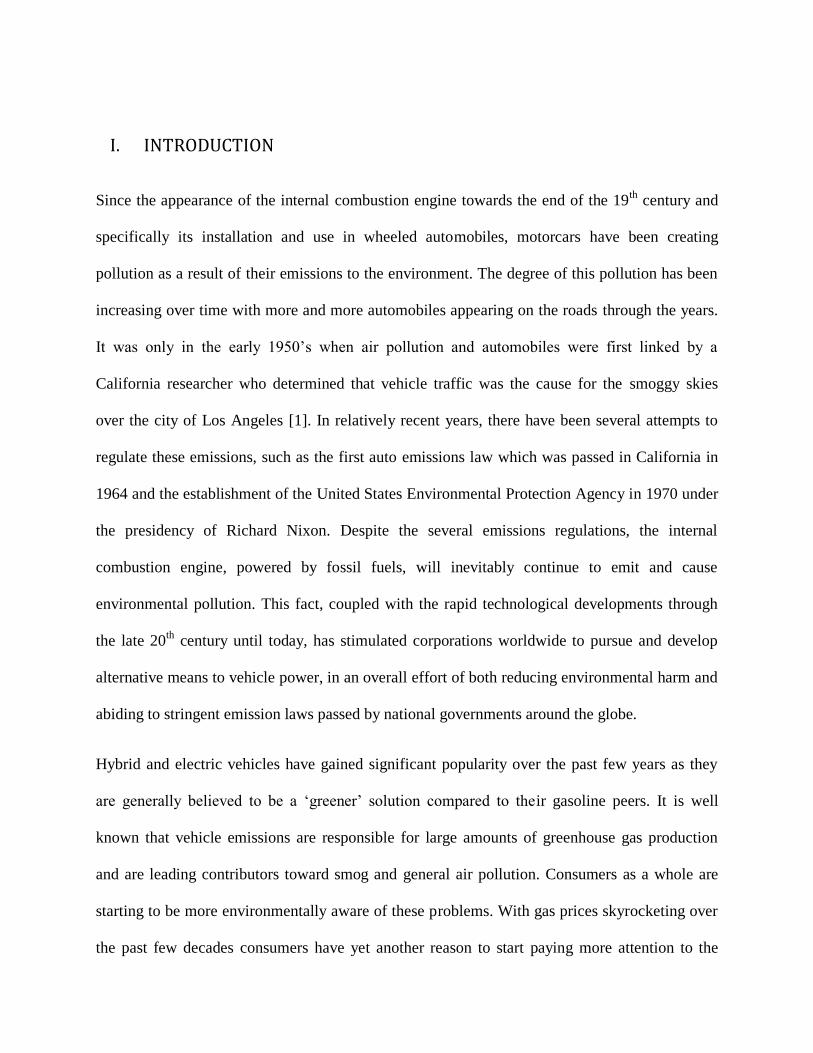
Figure 2: Hybrid Electric Car Market Annual Sales [2]
In the United States the federal government has been supportive towards these emerging
technologies by offering tax credits to owners of such vehicles while incentivizing consumers to
purchase such vehicles by offering mandates and other subsidies.
Specifically in California, a government plan, known as the Zero-Emission Vehicle Plan, has
been developed to promote ownership and usage of hybrid and pure electric vehicles [3].
Meanwhile, a big question is still left unanswered, "when and how can low-emission vehicles
replace traditional petroleum ones?” Current electric and hybrid vehicle technology does not
offer the vehicle functionalities and conveniences that their gasoline peers provide. Indicatively,
a Nissan Leaf has a city mile range between 84 and 107 miles but needs 24 hours on average (at
110 Volts) and an average of 7 hours (at 220 Volts) for a full charge. A Chevrolet Volt requires a
shorter time for a full charge with 13 hours to be the usual at 110V and up to 4.5 hours at 220
Volts. However, according to owner’s testimonials the car’s battery range is short, compared to
the range of a gasoline-powered vehicle, being approximately 50 miles during spring season and
down to 26 miles during winter [4]. Moreover, internal combustion vehicles have dominated the
market since their appearance until today that at least one gas station is located in every town
across the U.S. The same cannot be claimed for electric and hybrid cars as the number of electric
stations and charging outlets across the country has been increasing only in the past few years.
Nationwide, about 10,000 publicly available EV chargers compete with about 114,000 gas
stations, according to Department of Energy data.
To provide adequate electricity to EV’s, a considerable amount of charging stations might need
to be built, let alone power plants to support them. The current conditions, though, do not prevent
California Governor Edmund G. Brown Jr. from believing in the fate of these vehicles. He has
ordered that 1.5 million zero-emission vehicles “be on California roads” by 2025 as a regulatory
weigh station in order to meet the state’s goal of cutting its greenhouse emission to 80% below
1990 levels [3]. Governor’s interagency working group has prepared the zero-emission vehicle
action plan in a coherent attempt to achieve these goals.
This statement provides the drive of this study which more specifically investigates some of the
necessary steps needed be achieved if all automobiles in California of 2040 were to be replaced
by pure electric vehicles (PEV’s) and plug-in hybrid electric vehicles (PHEV’s), altogether
referred to as electric vehicles (EV’s), and the associated benefits and challenges of this.
Initially, relevant background information regarding the State of California is provided and
projected for the year of 2040. Further, the current status of EV’s, including a brief history of the
electric vehicle and currently available charging methods are looked at. An emission analysis
follows and an estimate of EVs’ annual operating cost. Results on the number of electric
charging stations and power plants needed to be built in order to accommodate this change are

provided. Finally, the report closes with a discussion of the benefits and limitations of electric
vehicles and their future.
II. BACKGROUND
2.1 CALIFORNIA RELEVANT STATISTICS
2.1.1 TRANSPORTATION STATISTICS
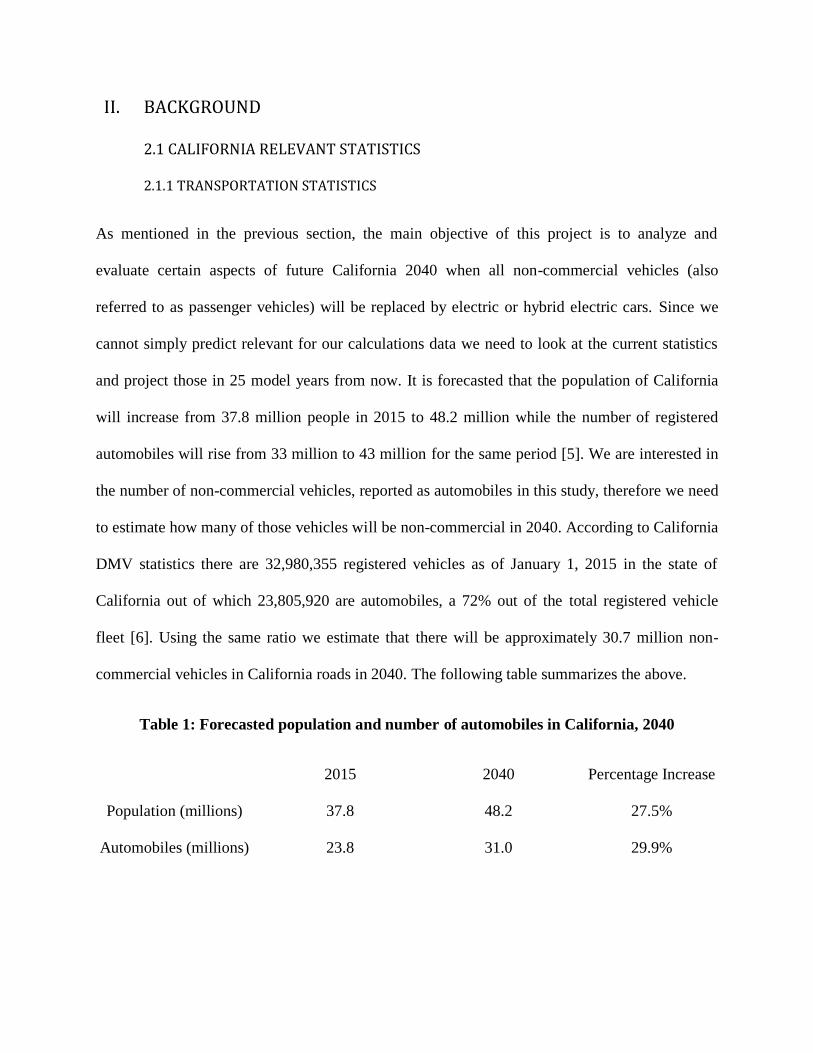
As mentioned in the previous section, the main objective of this project is to analyze and
evaluate certain aspects of future California 2040 when all non-commercial vehicles (also
referred to as passenger vehicles) will be replaced by electric or hybrid electric cars. Since we
cannot simply predict relevant for our calculations data we need to look at the current statistics
and project those in 25 model years from now. It is forecasted that the population of California
will increase from 37.8 million people in 2015 to 48.2 million while the number of registered
automobiles will rise from 33 million to 43 million for the same period [5]. We are interested in
the number of non-commercial vehicles, reported as automobiles in this study, therefore we need
to estimate how many of those vehicles will be non-commercial in 2040. According to California
DMV statistics there are 32,980,355 registered vehicles as of January 1, 2015 in the state of
California out of which 23,805,920 are automobiles, a 72% out of the total registered vehicle
fleet [6]. Using the same ratio we estimate that there will be approximately 30.7 million non-
commercial vehicles in California roads in 2040. The following table summarizes the above.
Table 1: Forecasted population and number of automobiles in California, 2040
2015 2040 Percentage Increase
Population (millions) 37.8 48.2 27.5%
Automobiles (millions) 23.8 31.0 29.9%
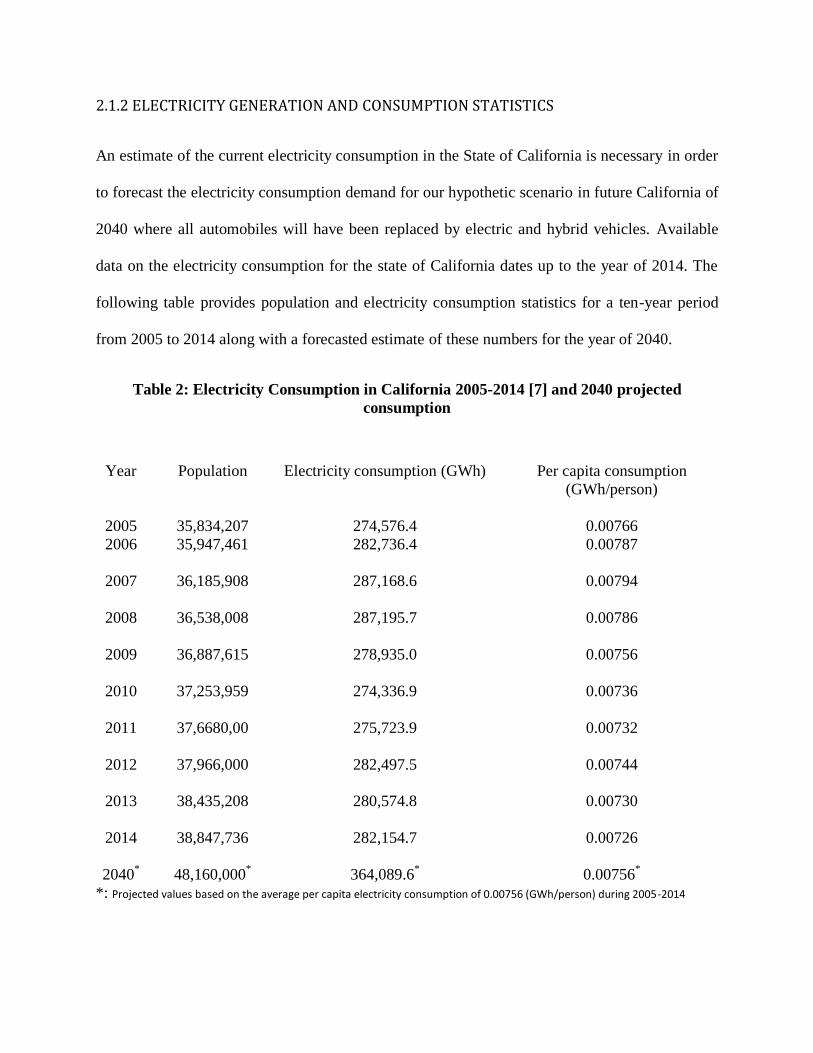
2.1.2 ELECTRICITY GENERATION AND CONSUMPTION STATISTICS
An estimate of the current electricity consumption in the State of California is necessary in order
to forecast the electricity consumption demand for our hypothetic scenario in future California of
2040 where all automobiles will have been replaced by electric and hybrid vehicles. Available
data on the electricity consumption for the state of California dates up to the year of 2014. The
following table provides population and electricity consumption statistics for a ten-year period
from 2005 to 2014 along with a forecasted estimate of these numbers for the year of 2040.
Table 2: Electricity Consumption in California 2005-2014 [7] and 2040 projected
consumption
Year Population Electricity consumption (GWh) Per capita consumption
(GWh/person)
2005 35,834,207 274,576.4 0.00766
2006 35,947,461 282,736.4
0.00787
2007 36,185,908 287,168.6
0.00794
2008 36,538,008 287,195.7
0.00786
2009 36,887,615 278,935.0
0.00756
2010 37,253,959 274,336.9
0.00736
2011 37,6680,00 275,723.9
0.00732
2012 37,966,000 282,497.5
0.00744
2013 38,435,208 280,574.8
0.00730
2014 38,847,736 282,154.7
0.00726
2040*
48,160,000*
364,089.6*
0.00756*
*: Projected values based on the average per capita electricity consumption of 0.00756 (GWh/person) during 2005-2014
The average per capita electricity consumption in the state of California during the years 2005 to
2014 is estimated to be equal to 0.00756 GWh/person. Using this number as an indicative
average it is forecasted that the electricity consumption in California in 2040 will amount to
364,089.6 gigawatt-hours (GWh). It should be noted that this is only a forecasted approximation
supported by historic data and trends assuming a ceteris paribus (‘all other things being equal’)
analysis. More on this approach will be found in the Methodology section of this report.
Furthermore, this predicted value for the net electricity consumption in California in 2040 does
not take into account the overall impact of the relative energy and electricity aspects due to the
shift of the California automobile fleet to electric and hybrid vehicles.
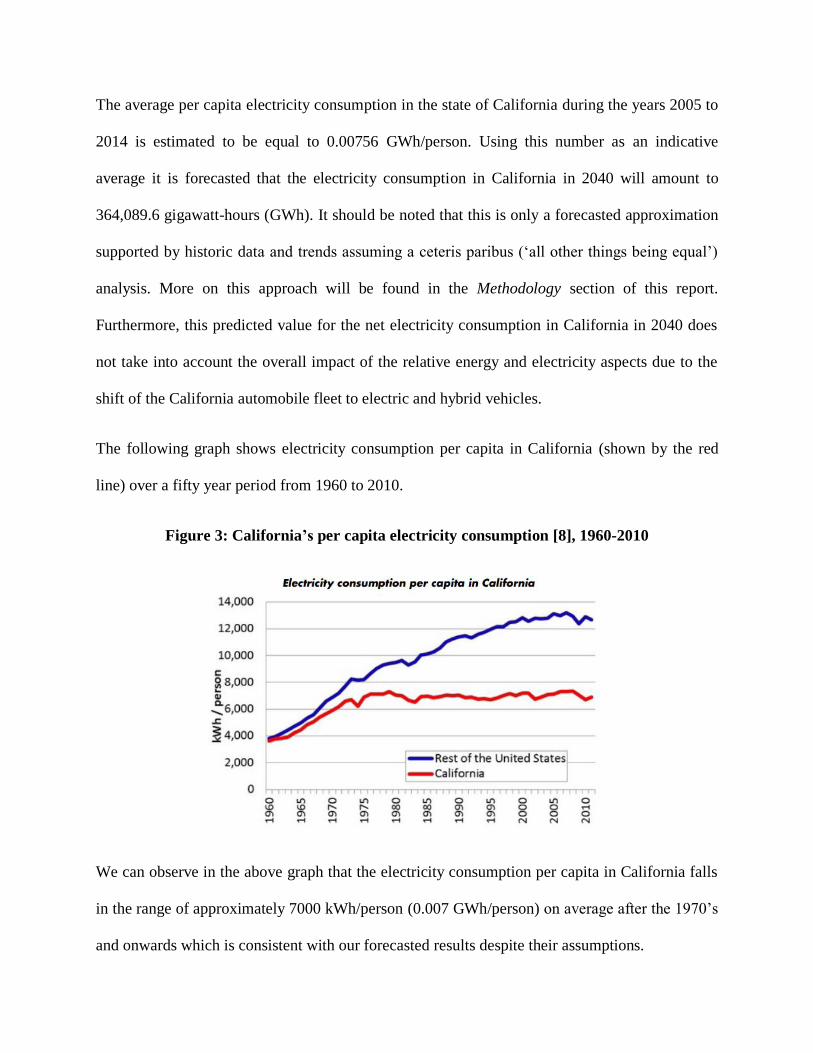
The following graph shows electricity consumption per capita in California (shown by the red
line) over a fifty year period from 1960 to 2010.
Figure 3: California’s per capita electricity consumption [8], 1960-2010
We can observe in the above graph that the electricity consumption per capita in California falls
in the range of approximately 7000 kWh/person (0.007 GWh/person) on average after the 1970’s
and onwards which is consistent with our forecasted results despite their assumptions.
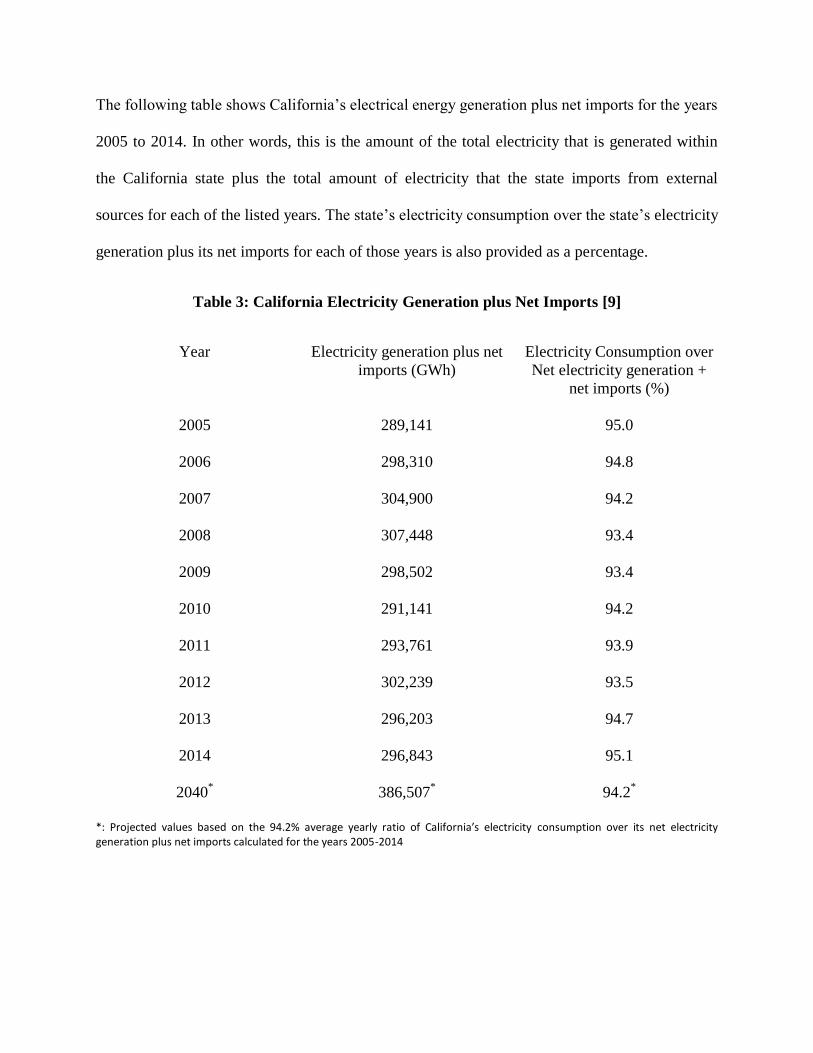
The following table shows California’s electrical energy generation plus net imports for the years
2005 to 2014. In other words, this is the amount of the total electricity that is generated within
the California state plus the total amount of electricity that the state imports from external
sources for each of the listed years. The state’s electricity consumption over the state’s electricity
generation plus its net imports for each of those years is also provided as a percentage.
Table 3: California Electricity Generation plus Net Imports [9]
Year Electricity generation plus net
imports (GWh)
Electricity Consumption over
Net electricity generation +
net imports (%)
2005 289,141 95.0
2006 298,310 94.8
2007 304,900 94.2
2008 307,448 93.4
2009 298,502 93.4
2010 291,141 94.2
2011 293,761 93.9
2012 302,239 93.5
2013 296,203 94.7
2014 296,843 95.1
2040*
386,507*
94.2*
*: Projected values based on the 94.2% average yearly ratio of California’s electricity consumption over its net electricity generation plus net imports calculated for the years 2005-2014
The ratio of California’s yearly electricity consumption over its yearly net electricity generation
plus its net imports is calculated as a percentage for each of the years from 2005 to 2014. The
average of these percentage ratios was estimated to be equal to 94.2%. That is, on average for the
time period from 2005 to 2014 the state of California consumes 94.2% of its total net electricity
generation which results from in-state but also out-of-state sources. The amount of electricity
that California will be generating in 2040, in-stately plus from its net electricity imports, was
forecasted assuming that the state will be consuming 94.2% of this amount and using the
predicted electricity consumption for the same year (364,089.6 GWh), provided in Table 2.
Again, this is a forecasted approximation using past historic data and assuming that all other
things are kept equal (ceteris paribus). These data, actual and forecasted, will be essential for the
analysis which will follow in the ‘Results and Discussion’ Section of this report.
2.1.3. ENERGY STATISTICS
2.1.3a) ELECTRICITY POWER PRODUCTION MIX
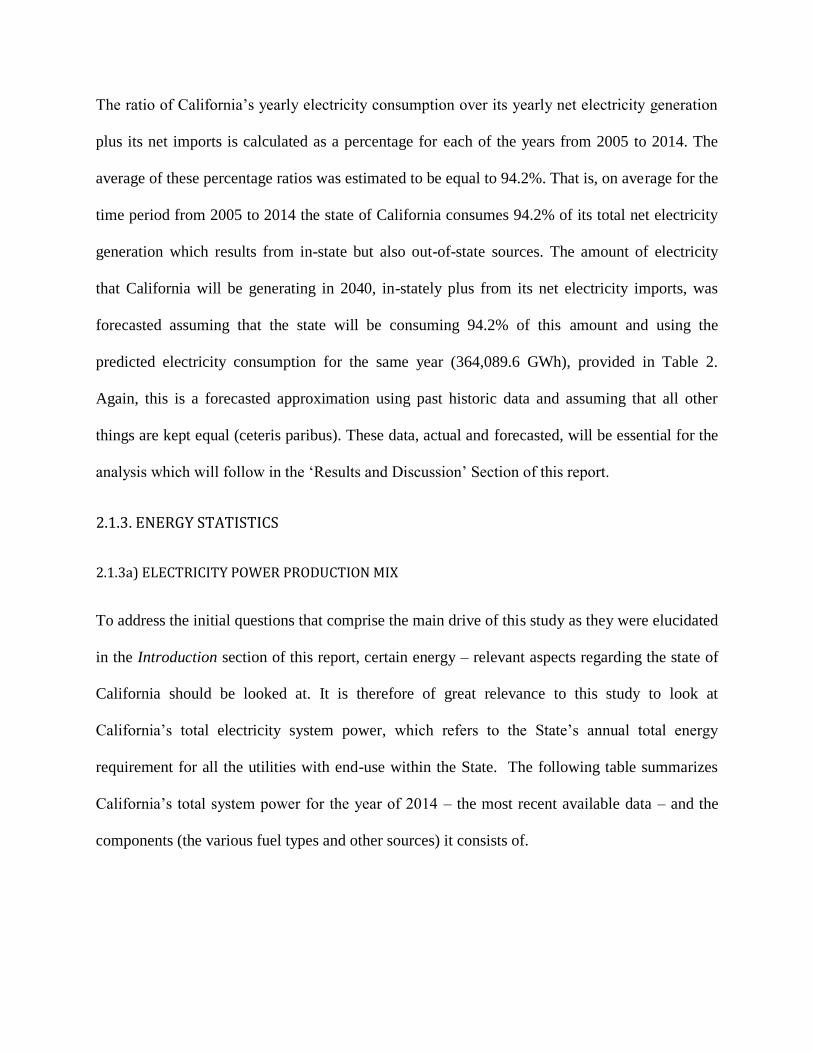
To address the initial questions that comprise the main drive of this study as they were elucidated
in the Introduction section of this report, certain energy – relevant aspects regarding the state of
California should be looked at. It is therefore of great relevance to this study to look at
California’s total electricity system power, which refers to the State’s annual total energy
requirement for all the utilities with end-use within the State. The following table summarizes
California’s total system power for the year of 2014 – the most recent available data – and the
components (the various fuel types and other sources) it consists of.
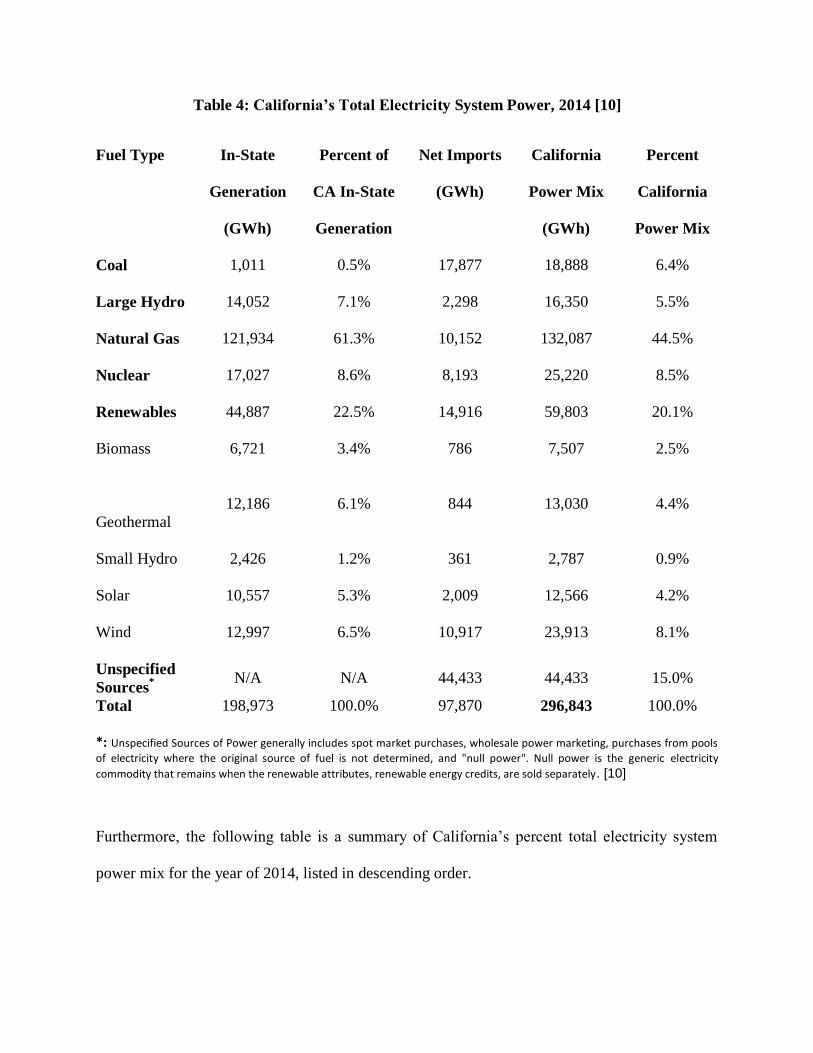
Table 4: California’s Total Electricity System Power, 2014 [10]
Fuel Type In-State
Generation
(GWh)
Percent of
CA In-State
Generation
Net Imports
(GWh)
California
Power Mix
(GWh)
Percent
California
Power Mix
Coal 1,011 0.5% 17,877 18,888 6.4%
Large Hydro 14,052 7.1% 2,298 16,350 5.5%
Natural Gas 121,934 61.3% 10,152 132,087 44.5%
Nuclear 17,027 8.6% 8,193 25,220 8.5%
Renewables 44,887 22.5% 14,916 59,803 20.1%
Biomass 6,721 3.4% 786 7,507 2.5%
Geothermal
12,186 6.1% 844 13,030 4.4%
Small Hydro 2,426 1.2% 361 2,787 0.9%
Solar 10,557 5.3% 2,009 12,566 4.2%
Wind 12,997 6.5% 10,917 23,913 8.1%
Unspecified
Sources*
N/A N/A 44,433 44,433 15.0%
Total 198,973 100.0% 97,870 296,843 100.0%
*: Unspecified Sources of Power generally includes spot market purchases, wholesale power marketing, purchases from pools
of electricity where the original source of fuel is not determined, and "null power". Null power is the generic electricity
commodity that remains when the renewable attributes, renewable energy credits, are sold separately. [10]
Furthermore, the following table is a summary of California’s percent total electricity system
power mix for the year of 2014, listed in descending order.
Table 5: California’s Total Electricity System Power Mix, 2014 [produced from values in Table 6]
Fuel Type Percent California Power Mix
Natural Gas 44.5%
Renewables 20.1%
Unspecified Sources 15.0%
Nuclear 8.5%
Coal 6.4%
Large Hydro 5.5%
Total 100.0%
As it shown in Table 7, California produced most of its electricity to meet its energy demands for
the year of 2014 from natural gas, amounting to nearly half of its total power mix, followed by
renewable sources with wind power to be the predominant one among them (as it can be seen in
Table 6). A 15% of the State’s power mix originated from spot market purchases and pools of
electricity in which the original source of fuel could not be determined by the government’s
energy commission.
The following section includes relevant information on California’s power stations, also known
as power plants, along with an explanation of some useful relevant terms which will be used later
on to produce results and facilitate further discussion.
2.1.3b) POWER STATIONS
The following table provides a list of power stations in the state of California based on the type
of fuel they use or their source of electricity generation. The list is based upon the most recent
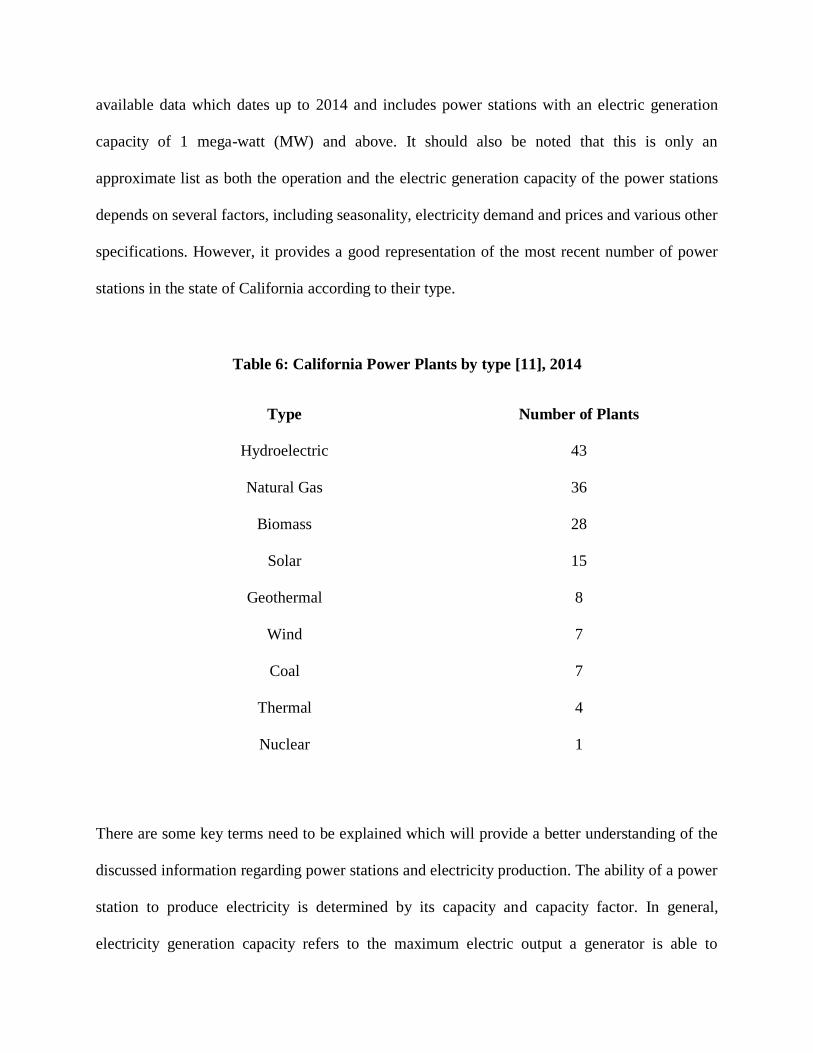
available data which dates up to 2014 and includes power stations with an electric generation
capacity of 1 mega-watt (MW) and above. It should also be noted that this is only an
approximate list as both the operation and the electric generation capacity of the power stations
depends on several factors, including seasonality, electricity demand and prices and various other
specifications. However, it provides a good representation of the most recent number of power
stations in the state of California according to their type.
Table 6: California Power Plants by type [11], 2014
Type Number of Plants
Hydroelectric 43
Natural Gas 36
Biomass 28
Solar 15
Geothermal 8
Wind 7
Coal 7
Thermal 4
Nuclear 1
There are some key terms need to be explained which will provide a better understanding of the
discussed information regarding power stations and electricity production. The ability of a power
station to produce electricity is determined by its capacity and capacity factor. In general,
electricity generation capacity refers to the maximum electric output a generator is able to
produce under specific conditions. It is determined by the generator’s manufacturer and indicates
the maximum output that it can produce without exceeding design thermal limits [12] (also
known as nameplate or installed capacity). This is different to electricity generation which refers
to the amount of electricity a generator produces over a specific period of time at its capacity and
is usually measured in Mega-Watts (MW). Furthermore, net electricity generation is the amount
of gross electricity a generator produces minus the electricity used to operate the power station
[12]. Last but not least, another key-term when it comes to any type of power production is the
capacity factor. For a power plant that produces electricity, the capacity factor is the ratio of the
net electricity generated over a period of time (actual output), to the electricity that could have
been generated if the plant was operating at continuous full-power operation – at its nameplate
capacity – during the same period of time (potential output) [13].
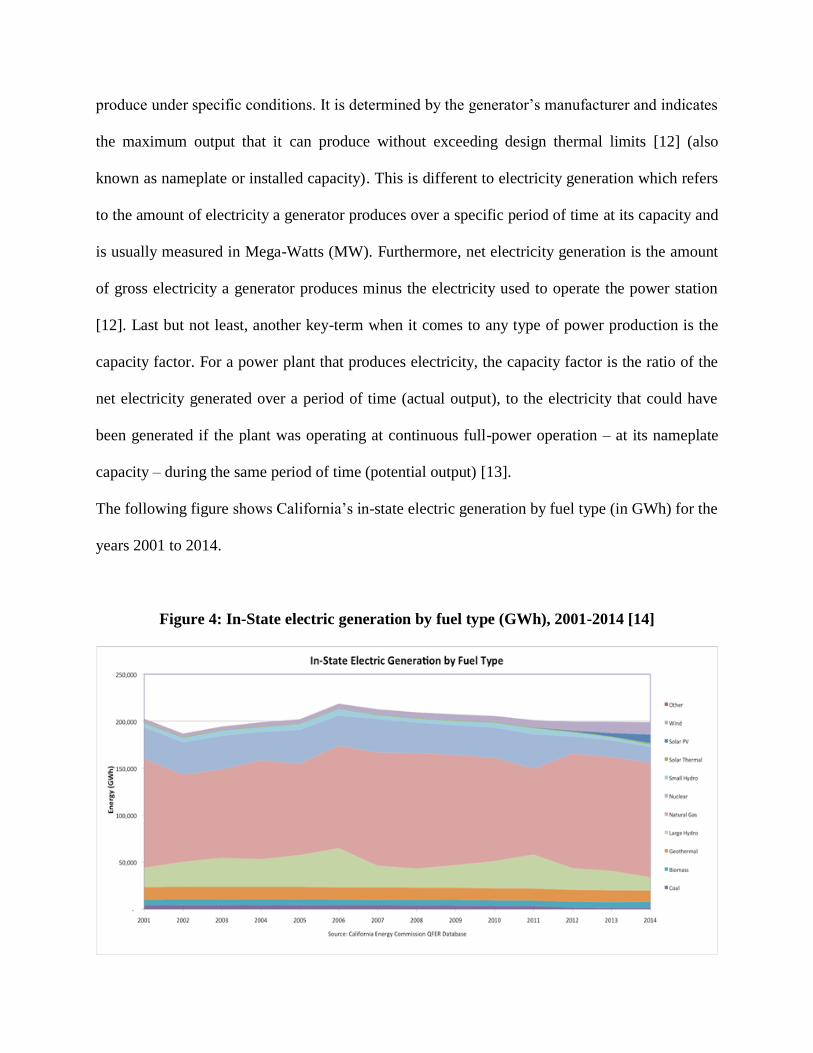
The following figure shows California’s in-state electric generation by fuel type (in GWh) for the
years 2001 to 2014.
Figure 4: In-State electric generation by fuel type (GWh), 2001-2014 [14]
The figure above highlights California’s power production mix during the time period 2001-
2014, as was indicated in the previous section of this report 2.1.3a). Moreover, it provides a
visual representation of the contribution of each of the listed energy sources to the net amount of
electricity generated during these years. To this contributed the breakthrough, in the relatively
recent years, in the photovoltaic technology which led to the adoption and installation of several
photovoltaic units and panels across the state of California. Most of the electricity generated
comes from natural gas sources, followed by the renewable sources of energy - which is the net
sum of biomass, geothermal, small hydroelectric, solar and finally wind sources – followed by
nuclear power which alone surmounts the electricity generated by the individual components that
comprise the renewable sources. Furthermore, the ‘unstable’, seasonal character of some of the
renewable sources such as wind, small hydroelectric and solar - which are greatly dependent
upon the weather and other climate conditions - relatively to the more consistent nature of other
sources such as geothermal and biomass is also depicted. Finally, there is a gradual decrease in
the net electricity generation coming from coal as the State is moving away towards more
environmental – friendly sources, such as solar energy which conversely started gaining ground
during the most recent years. Nuclear power despite its high contribution – due to its known high
capacity factor (possessing the highest capacity factor against all other sources of energy) – to
the net electricity generation, has lost some ground in 2014 relatively to previous years (as in
2006) as a result of State shutting down nuclear power plants leaving only one operating (as it
was also shown in Table 8).
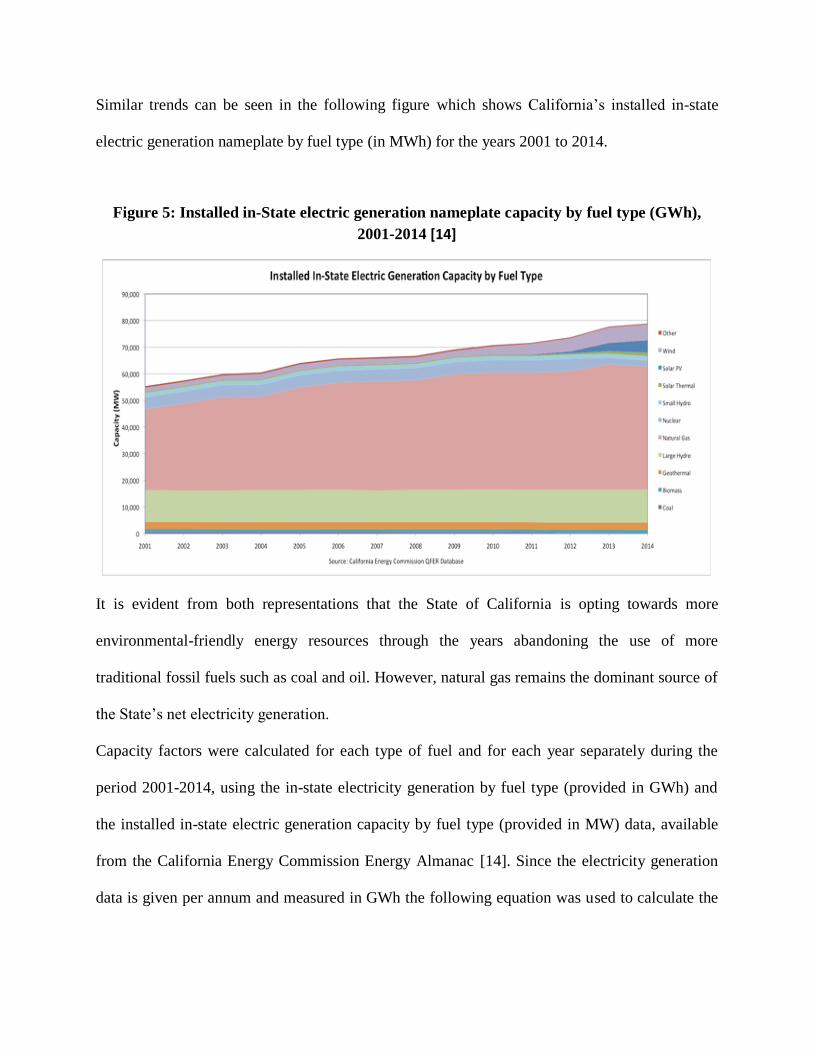
Similar trends can be seen in the following figure which shows California’s installed in-state
electric generation nameplate by fuel type (in MWh) for the years 2001 to 2014.
Figure 5: Installed in-State electric generation nameplate capacity by fuel type (GWh),
2001-2014 [14]
It is evident from both representations that the State of California is opting towards more
environmental-friendly energy resources through the years abandoning the use of more
traditional fossil fuels such as coal and oil. However, natural gas remains the dominant source of
the State’s net electricity generation.
Capacity factors were calculated for each type of fuel and for each year separately during the
period 2001-2014, using the in-state electricity generation by fuel type (provided in GWh) and
the installed in-state electric generation capacity by fuel type (provided in MW) data, available
from the California Energy Commission Energy Almanac [14]. Since the electricity generation
data is given per annum and measured in GWh the following equation was used to calculate the
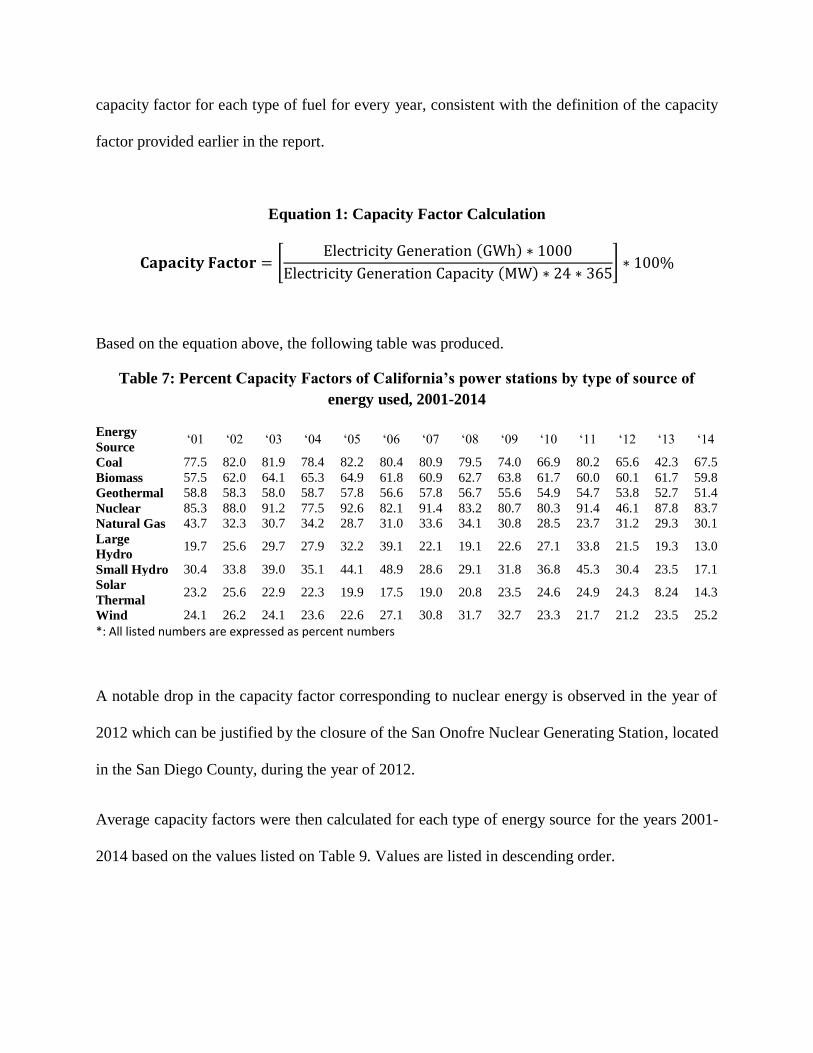
capacity factor for each type of fuel for every year, consistent with the definition of the capacity
factor provided earlier in the report.
Equation 1: Capacity Factor Calculation
𝐂𝐚𝐩𝐚𝐜𝐢𝐭𝐲 𝐅𝐚𝐜𝐭𝐨𝐫 = [Electricity Generation (GWh) ∗ 1000
Electricity Generation Capacity (MW) ∗ 24 ∗ 365] ∗ 100%
Based on the equation above, the following table was produced.
Table 7: Percent Capacity Factors of California’s power stations by type of source of
energy used, 2001-2014
Energy
Source ‘01 ‘02 ‘03 ‘04 ‘05 ‘06 ‘07 ‘08 ‘09 ‘10 ‘11 ‘12 ‘13 ‘14
Coal 77.5 82.0 81.9 78.4 82.2 80.4 80.9 79.5 74.0 66.9 80.2 65.6 42.3 67.5
Biomass 57.5 62.0 64.1 65.3 64.9 61.8 60.9 62.7 63.8 61.7 60.0 60.1 61.7 59.8
Geothermal 58.8 58.3 58.0 58.7 57.8 56.6 57.8 56.7 55.6 54.9 54.7 53.8 52.7 51.4
Nuclear 85.3 88.0 91.2 77.5 92.6 82.1 91.4 83.2 80.7 80.3 91.4 46.1 87.8 83.7
Natural Gas 43.7 32.3 30.7 34.2 28.7 31.0 33.6 34.1 30.8 28.5 23.7 31.2 29.3 30.1
Large
Hydro 19.7 25.6 29.7 27.9 32.2 39.1 22.1 19.1 22.6 27.1 33.8 21.5 19.3 13.0
Small Hydro 30.4 33.8 39.0 35.1 44.1 48.9 28.6 29.1 31.8 36.8 45.3 30.4 23.5 17.1
Solar
Thermal 23.2 25.6 22.9 22.3 19.9 17.5 19.0 20.8 23.5 24.6 24.9 24.3 8.24 14.3
Wind 24.1 26.2 24.1 23.6 22.6 27.1 30.8 31.7 32.7 23.3 21.7 21.2 23.5 25.2
*: All listed numbers are expressed as percent numbers
A notable drop in the capacity factor corresponding to nuclear energy is observed in the year of
2012 which can be justified by the closure of the San Onofre Nuclear Generating Station, located
in the San Diego County, during the year of 2012.
Average capacity factors were then calculated for each type of energy source for the years 2001-
2014 based on the values listed on Table 9. Values are listed in descending order.
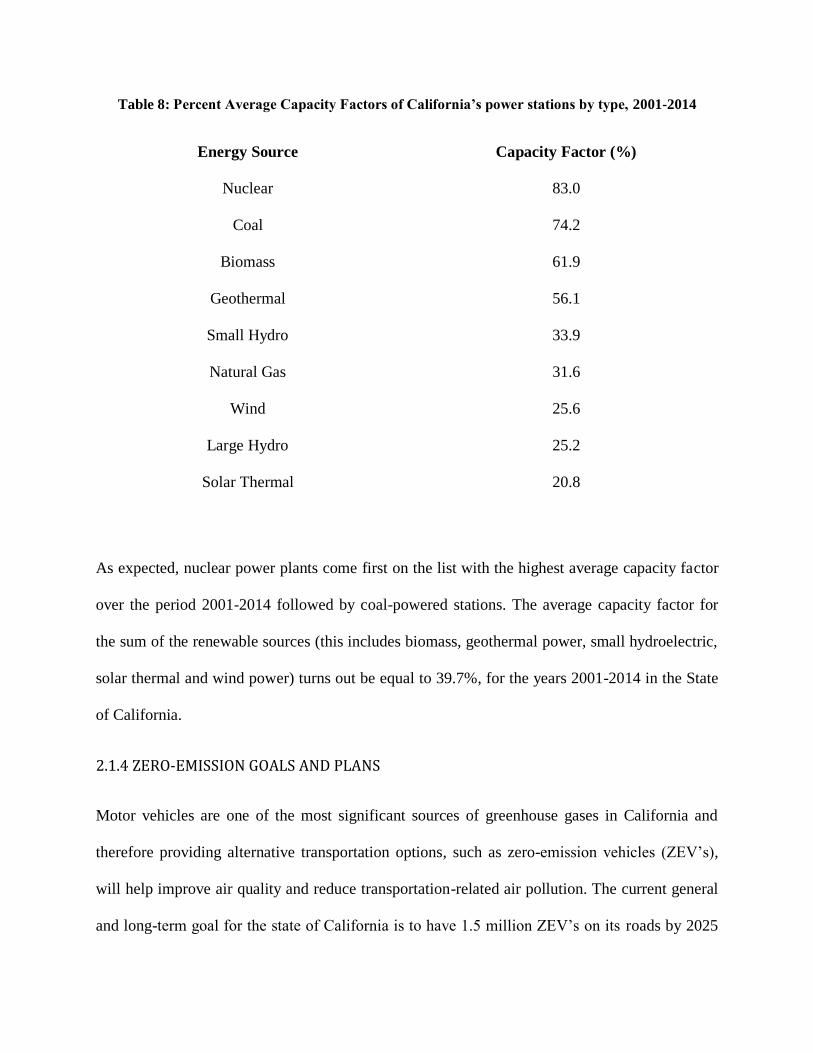
Table 8: Percent Average Capacity Factors of California’s power stations by type, 2001-2014
Energy Source Capacity Factor (%)
Nuclear 83.0
Coal 74.2
Biomass 61.9
Geothermal 56.1
Small Hydro 33.9
Natural Gas 31.6
Wind 25.6
Large Hydro 25.2
Solar Thermal 20.8
As expected, nuclear power plants come first on the list with the highest average capacity factor
over the period 2001-2014 followed by coal-powered stations. The average capacity factor for
the sum of the renewable sources (this includes biomass, geothermal power, small hydroelectric,
solar thermal and wind power) turns out be equal to 39.7%, for the years 2001-2014 in the State
of California.
2.1.4 ZERO-EMISSION GOALS AND PLANS
Motor vehicles are one of the most significant sources of greenhouse gases in California and
therefore providing alternative transportation options, such as zero-emission vehicles (ZEV’s),
will help improve air quality and reduce transportation-related air pollution. The current general
and long-term goal for the state of California is to have 1.5 million ZEV’s on its roads by 2025
and to reduce transportation-related greenhouse gas emissions by 80% below 1990 levels by
2050 [3]. Successful commercialization of ZEV’s will be guaranteed through consistent
statewide efforts to install adequate charging infrastructure, through developing streamlined
metering options for homes equipped with electric vehicle chargers, by evaluating opportunities
to reduce vehicle operating costs and increasing electric system efficiency through time-of-use
electricity rates and net metering for electric vehicles, and strengthening the connection between
ZEVs and renewable energy.
More specifically, the State’s plan of action is divided into three time periods, 2015, 2020 and
2025, each with distinct goals [3]. By 2015, the goal is that the state’s major metropolitan areas
will have adequate infrastructure to be able to accommodate zero-emission vehicles and
specifically plug-in electric vehicles. While private investment and manufacturing in the ZEV
sector is expected to be growing, by 2015 the State’s academic institutions are expected to
contribute to ZEV market expansion by building understanding of how ZEV’s are used. In the
next five years, the state’s infrastructure is expected to be able to support up to one million zero
emission vehicles. Moreover, the cost of the zero-emission vehicles will not only be competitive
with the conventional combustion vehicles but also zero-emission vehicles will be accessible to
mainstream consumers. Finally, by 2025 with the goal of 1.5 million ZEV’s on California
roadways it is projected that the clean and efficient zero-emission vehicles will annually displace
at least 1.5 billion gallons of petroleum fuels coming from the ordinary combustion vehicles. To
put some numbers, so far more than $25.3 million has been awarded in a variety of infrastructure
projects [3]. In 2010, there were 1,300 charging stations at 401 different sites in the state of
California with most of them located in the Los Angeles and San Francisco Bay Areas [3]. To
date, the Energy Commission has begun establishing the foundation for a zero emission
transportation feature through the funding of approximately 6,200 electric vehicle charging
stations. Also, by 2025 it is projected that new automobiles will emit 34 percent fewer global
warming gases and 75 percent fewer smog-forming emissions [3]. It is also estimated that
consumer savings on fuel costs will average $6,000 over the life of the car. The savings more
than offsets the average $1,900 increase in vehicle price for the ultra-clean, high-efficiency
technology.
2.2 ELECTRIC AND PLUG-IN HYBRID VEHICLES
2.2.1 A HISTORICAL NOTE
Although electric vehicles started getting attention during the last decade, the concepts that led to
their genesis dates back in the early 20th
century when Danish physicist Hans Christian Orsted
discovered in 1920 that electric currents create magnetic fields, a significant aspect of
electromagnetism.
One of the very first electric vehicles can be tracked back to a Scottish man named Robert
Anderson in 1832. However, this electric carriage was powered by non-rechargeable batteries
and therefore did not succeed [15].The first successful commercial electric vehicles, known as
the “Electrobat” and the “Riker Electric Vehicle”, were manufactured by the “Electric Vehicle
Company” in the late 1890’s [16]. The “Electrobat” was a lead-acid battery based vehicle created
by an engineer and chemist, Henry G. Morris and Pedro G. Salom respectively.
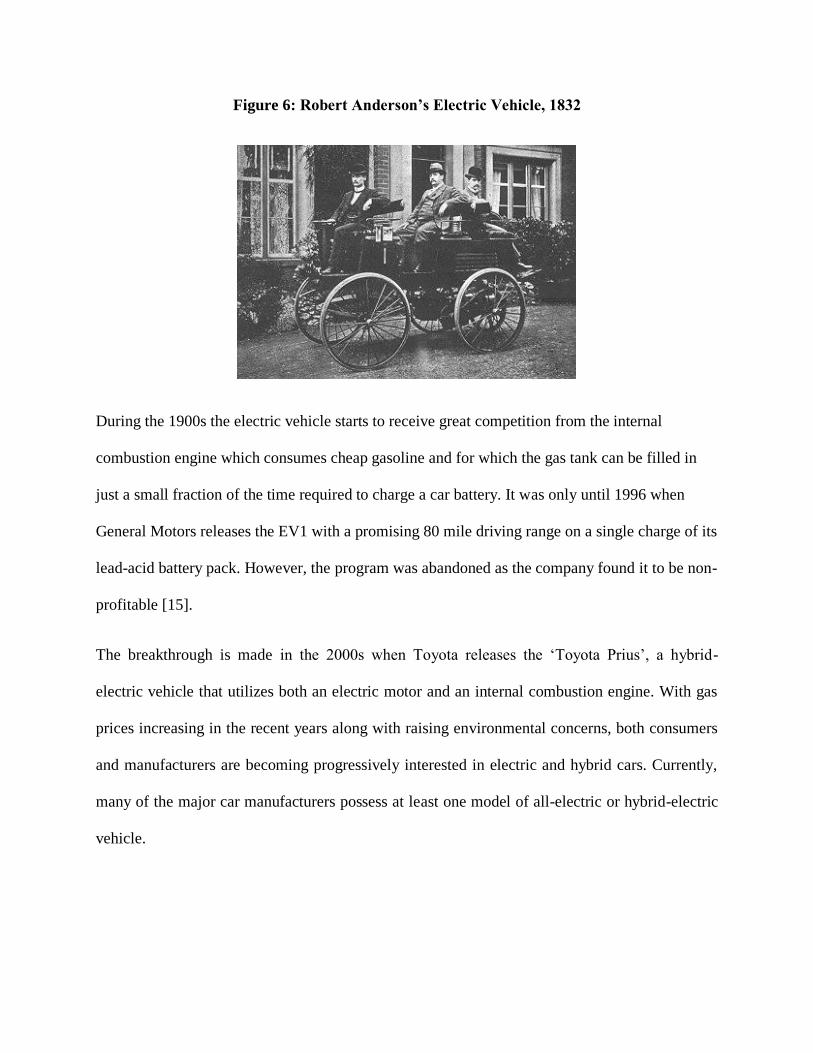
Figure 6: Robert Anderson’s Electric Vehicle, 1832
During the 1900s the electric vehicle starts to receive great competition from the internal
combustion engine which consumes cheap gasoline and for which the gas tank can be filled in
just a small fraction of the time required to charge a car battery. It was only until 1996 when
General Motors releases the EV1 with a promising 80 mile driving range on a single charge of its
lead-acid battery pack. However, the program was abandoned as the company found it to be non-
profitable [15].
The breakthrough is made in the 2000s when Toyota releases the ‘Toyota Prius’, a hybrid-
electric vehicle that utilizes both an electric motor and an internal combustion engine. With gas
prices increasing in the recent years along with raising environmental concerns, both consumers
and manufacturers are becoming progressively interested in electric and hybrid cars. Currently,
many of the major car manufacturers possess at least one model of all-electric or hybrid-electric
vehicle.
2.2.2 PURE ELECTRIC VEHICLE
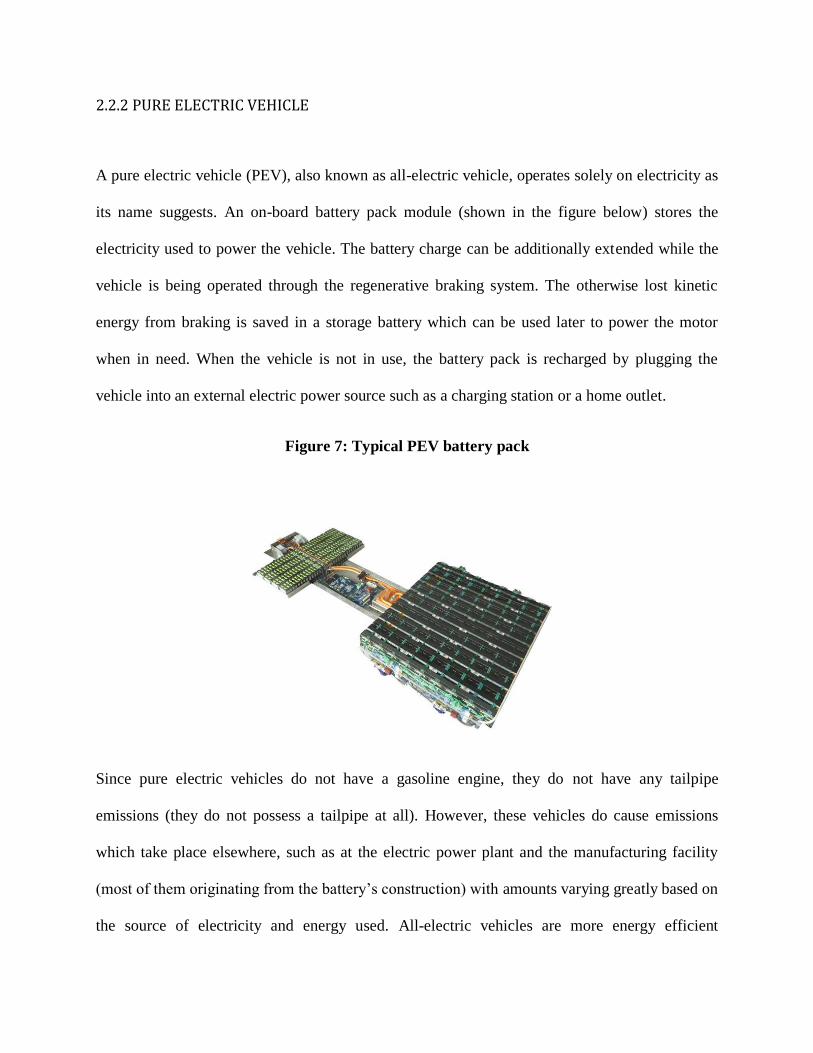
A pure electric vehicle (PEV), also known as all-electric vehicle, operates solely on electricity as
its name suggests. An on-board battery pack module (shown in the figure below) stores the
electricity used to power the vehicle. The battery charge can be additionally extended while the
vehicle is being operated through the regenerative braking system. The otherwise lost kinetic
energy from braking is saved in a storage battery which can be used later to power the motor
when in need. When the vehicle is not in use, the battery pack is recharged by plugging the
vehicle into an external electric power source such as a charging station or a home outlet.
Figure 7: Typical PEV battery pack
Since pure electric vehicles do not have a gasoline engine, they do not have any tailpipe
emissions (they do not possess a tailpipe at all). However, these vehicles do cause emissions
which take place elsewhere, such as at the electric power plant and the manufacturing facility
(most of them originating from the battery’s construction) with amounts varying greatly based on
the source of electricity and energy used. All-electric vehicles are more energy efficient
compared to conventional gasoline vehicles, as they are able to convert about 59%-62% of the
electrical energy provided by the grid to power the wheels, whereas a typical gasoline vehicle is
only able to convert about 17%-21% of the energy stored in gasoline to useful power [17].
Their driving range on a full charge typically ranges between 60-100 miles, according to the
most recent (2015) available models, with a few exceptions which can reach up to 200-300
miles, as in the Tesla Model S 85D ($85,000) with a boasting rating of 270 miles on a full
battery charge [18]. Fully recharging the vehicle’s battery pack typically takes between 4-8
hours, according to the charging technology used. There is the option of what is known as a
‘superfast charge’, which can recharge the vehicle’s battery to 80% capacity in about 30 minutes
[17]. More on current available charging technologies is provided in section 2.3 Charging
Station Technology.
2.2.3 PLUG-IN HYBRID ELECTRIC VEHICLE
On a technical scale, plug-in hybrid electric vehicles are conceptually more similar to the all-
electric car than they are to the traditional internal combustion vehicles. The traditional car
requires an internal combustion engine (ICE) to rotate a drive shaft which propels the car.
Instead of an engine, PHEVs use four motors, one in each wheel, which relies on electricity to
run the vehicle. Contrary to the pure electric vehicles which do not have an engine, plug-in
hybrid electric vehicles (PHEV’s) possess both an internal combustion engine and an electric
motor which uses a battery pack module stored-on board, as in an all- electric vehicle. Therefore,
they are powered by a combination of conventional or alternative fuels and the electricity stored
in the battery. During urban driving, a PHEV would power its motion from the stored electricity
in the battery, assuming the battery is charged. On average, for short distances – about 10 to 40
miles in current models - and relatively low speeds the electric motor on its own suffices. This is
commonly referred to as “the all-electric range” of the vehicle [19]. The internal combustion
engine would kick in in case the vehicle requires more power. The battery is charged through the
internal combustion engine, an external electric power source or through regenerative braking.
This allows for a smaller engine capacity and therefore results in improved fuel economy,
compared to a pure gasoline vehicle, without sacrificing performance at the same time. A
PHEV’s fuel economy varies depending on the distance traveled between battery charges. For
instance, if the vehicle travels a shorter distance than its “all-electric range” and is plugged in for
charging between consecutive trips, it might be able to operate solely on electric power. A
PHEV’s battery capacity is typically lower than in an all-electric vehicle, and therefore requires a
shorter charging time, with typical values ranging from 1 to 4 hours depending on the charging
method used [20].
2.3 CHARGING STATIONS AND METHODS
2.3.1 CHARGING STATIONS IN THE U.S.
According to most recent available data from the U.S. Department of Energy, there are currently
11,822 electric charging stations across the nation, which provide a total of 29,901 available
charging outlets (these numbers exclude privately owned charging stations). During the last year
there were built 3,731 charging stations nationwide which provide 10,267 additional charging
outlets today. In the state of California alone, there exist 2,821 electric charging stations – 24%
of the entire nation - providing a total of 8,687 available charging outlets [21].
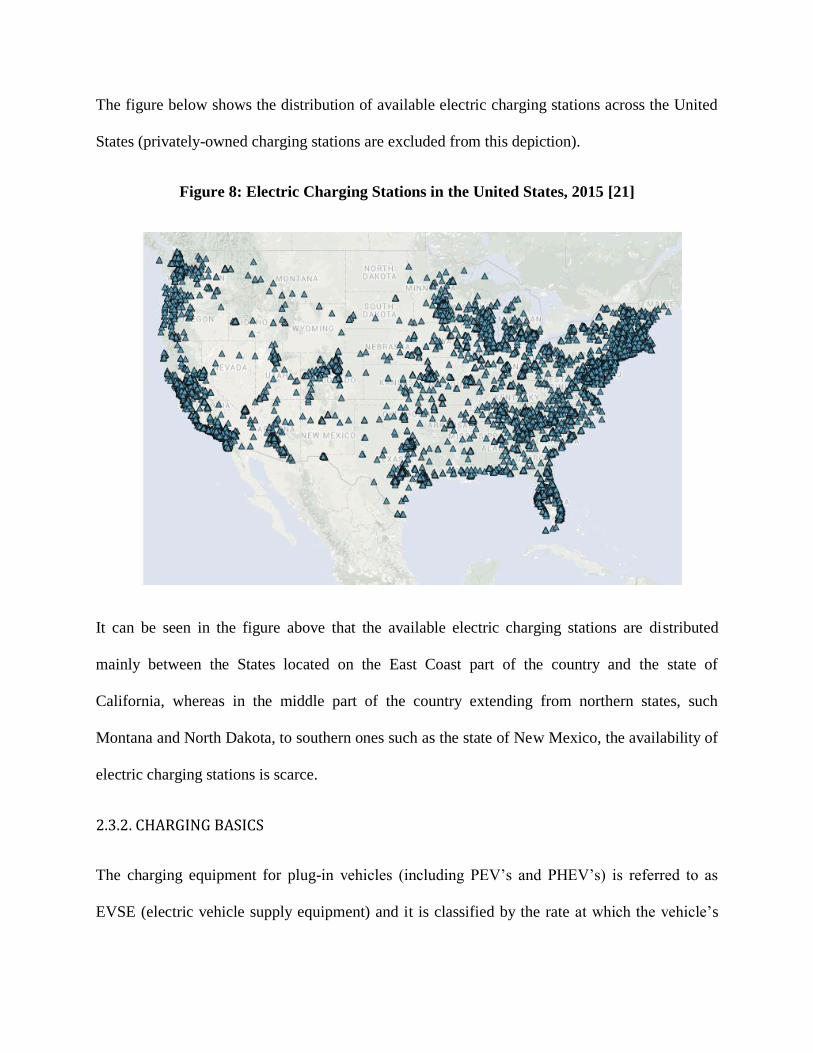
The figure below shows the distribution of available electric charging stations across the United
States (privately-owned charging stations are excluded from this depiction).
Figure 8: Electric Charging Stations in the United States, 2015 [21]
It can be seen in the figure above that the available electric charging stations are distributed
mainly between the States located on the East Coast part of the country and the state of
California, whereas in the middle part of the country extending from northern states, such
Montana and North Dakota, to southern ones such as the state of New Mexico, the availability of
electric charging stations is scarce.
2.3.2. CHARGING BASICS
The charging equipment for plug-in vehicles (including PEV’s and PHEV’s) is referred to as
EVSE (electric vehicle supply equipment) and it is classified by the rate at which the vehicle’s
battery is charged [22]. Charging times vary depending on several factors such as the battery’s
electric capacity, its type (Lithium-ion, lead-acid, etc.), how depleted the battery is, the type of
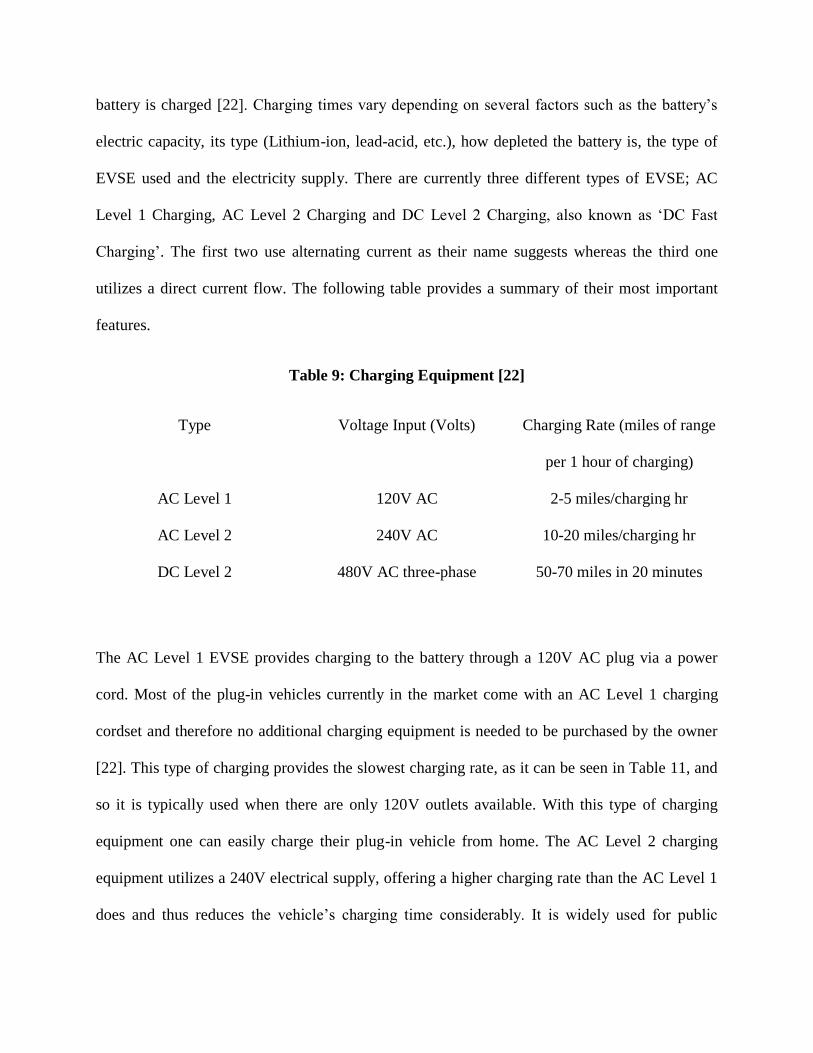
EVSE used and the electricity supply. There are currently three different types of EVSE; AC
Level 1 Charging, AC Level 2 Charging and DC Level 2 Charging, also known as ‘DC Fast
Charging’. The first two use alternating current as their name suggests whereas the third one
utilizes a direct current flow. The following table provides a summary of their most important
features.
Table 9: Charging Equipment [22]
Type Voltage Input (Volts) Charging Rate (miles of range
per 1 hour of charging)
AC Level 1 120V AC 2-5 miles/charging hr
AC Level 2 240V AC 10-20 miles/charging hr
DC Level 2 480V AC three-phase 50-70 miles in 20 minutes
The AC Level 1 EVSE provides charging to the battery through a 120V AC plug via a power
cord. Most of the plug-in vehicles currently in the market come with an AC Level 1 charging
cordset and therefore no additional charging equipment is needed to be purchased by the owner
[22]. This type of charging provides the slowest charging rate, as it can be seen in Table 11, and
so it is typically used when there are only 120V outlets available. With this type of charging
equipment one can easily charge their plug-in vehicle from home. The AC Level 2 charging
equipment utilizes a 240V electrical supply, offering a higher charging rate than the AC Level 1
does and thus reduces the vehicle’s charging time considerably. It is widely used for public
charging equipment and also for home charging, where the EV owner can fully charge their
vehicle overnight. However, some homes might have insufficient electrical capacity for AC
Level 2 charging equipment [23]. AC Level 2 equipment uses the same type of connector as in
AC Level 1 charging and therefore all commercially available plug-in electric vehicles have the
ability to charge using either of these two charging methods, with the exception of Tesla vehicles
which require a special adapter in order to do so [22]. Finally, the DC Level 2 charging
equipment, or DC fast charging equipment, provides the fastest charging method currently
available. Utilizing a three-phase 480V input, it enables fast charging along heavy traffic
corridors at installed stations [22]. This type of charging method offers a restricted charge,
stopping at 80% of the battery’s state of charge level, or changes charging rate after this limit is
reached to avoid potential damage to the vehicle’s battery.
III. METHODOLOGY
3.1 THE ANALYSIS APPROACH
As mentioned in the Introduction section of this report, the drive and purpose of this
investigation originated from California’s Governor E.G. ‘Jerry’ Brown Jr. who ordered ‘1.5
million zero-emission vehicles be on the roads of California by 2025’, as a regulatory weigh
station in order to meet the State’s goal to cut down its greenhouse emission levels to 80% below
1990 levels [3]. Based on this proposal, the study of a hypothetical scenario emerges in which
the California State will have replaced all of its automobiles with pure electric (PEV’s) and plug-
in hybrid vehicles (PHEV’s) by 2040. In order to be able to predict relative aspects and
conditions 25 model years ahead, a certain assumption is needed to be made. Current relevant
data and important aspects were looked at based upon, as it is known in the engineering world, a
‘steady-state’ assumption in order to avoid the unpredictability of the transient and dynamic
nature of the aspects involved in this study. Specifically, present-day data for California were
collected and based upon historic trends by averaging data of earlier years the same data for
California 2040 were forecasted. These data namely include the number of registered vehicles,
California’s population, the State’s electricity generation and consumption, the number and type
of power stations. This ceteris paribus analysis (assuming ‘all else kept equal’) does not take into
account several underlying factors which at times could prove to be rather determining. Most
important of these factors would be the rapid, exponential development of technology which in
25 model years from now could end up producing a far more different ‘picture’ of the one
forecasted by this analysis. Aspects, relevant to this study, to which the rapid evolution of
technology contributes, are further elaborated in the Discussion section of this report but
indicatively include battery technology, improvements in the electricity grid distribution, energy
production, charging technology and infrastructure. Other unforeseen factors which could
influence the consistency of this report’s results and predictions may include changes in the
nation’s political scene, which specifically to the state of California may impact and determine
the future of the zero-emission vehicles in several ways from alternative governmental
regulations to the State’s net imported quantities, potential financial crises, and other natural
(like earthquakes) or socio-economical disasters. Despite all this, this scientific approach of
forecasting future data by inferring it from present and past trends provides a good, consistent
method of analysis and furthermore exactly pinpoints to the certain limitations and assumptions
involved, giving rise to a more meaningful and qualitative analysis.
3.2 THE BACKGROUND RESEARCH
A rather extensive background research was needed to be done in order to get an insightful
comprehension of the topic under investigation and to further determine the scope of this study
by narrowing it down to the most relative and essential aspects while neglecting and leaving out
non-essential information. In order to gain a basic understanding on charging stations and
electricity transmission and distribution an interview with Professor John Orr of WPI’s Electrical
and Computer Engineering Department was conducted. Insightful knowledge on charging
stations and charging costs was obtained through an interview with Miss Liz Tomaszewski,
WPI’s Sustainability Coordinator. Additionally, through an interview with WPI’s Chief
Information Officer, Deborah Scott, valuable knowledge on plug-in hybrid electric vehicles was
gained from a personal user’s point of view which was used to facilitate relevant results and
further discussion.
Overall, this gathered information enabled to narrow down the scope of this study and
understand what areas and information need to be further looked at. Consequently, data on
transportation, current EV’s technology, power stations and sources of electricity generation
along with greenhouse emissions were further collected. Useful articles and reviews from
various standpoints were investigated in order to provide a more coherent and objective view on
the topic. Finally, a list of questions regarding concepts and information needed further
clarifying, mainly drawn from the study of the ‘2013 Zero-emission Vehicle Action Plan’ was
developed. Useful answers and information were provided from Mr. John Swanton of the
California Air Resources Board.
IV. ANALYSIS
4.1 TRANSFORMATION OF CALIFORNIA’S CAR FLEET IN 2040
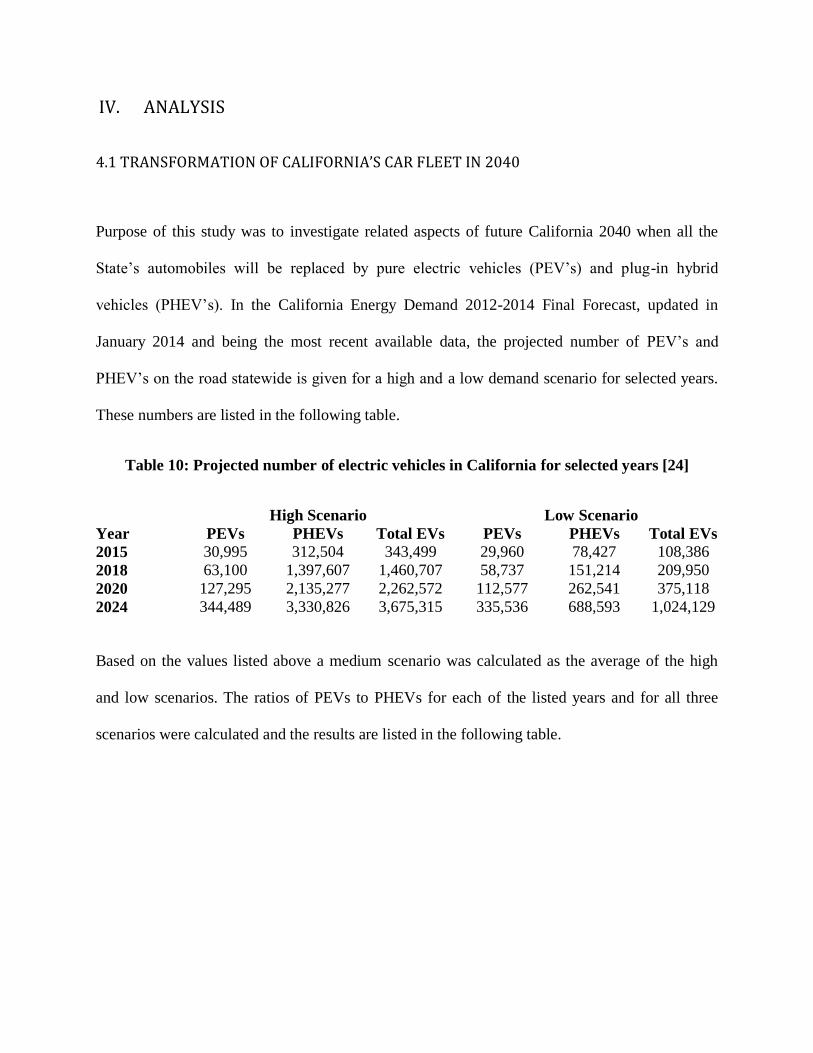
Purpose of this study was to investigate related aspects of future California 2040 when all the
State’s automobiles will be replaced by pure electric vehicles (PEV’s) and plug-in hybrid
vehicles (PHEV’s). In the California Energy Demand 2012-2014 Final Forecast, updated in
January 2014 and being the most recent available data, the projected number of PEV’s and
PHEV’s on the road statewide is given for a high and a low demand scenario for selected years.
These numbers are listed in the following table.
Table 10: Projected number of electric vehicles in California for selected years [24]
High Scenario Low Scenario
Year PEVs PHEVs Total EVs PEVs PHEVs Total EVs
2015 30,995 312,504 343,499 29,960 78,427 108,386
2018 63,100 1,397,607 1,460,707 58,737 151,214 209,950
2020 127,295 2,135,277 2,262,572 112,577 262,541 375,118
2024 344,489 3,330,826 3,675,315 335,536 688,593 1,024,129
Based on the values listed above a medium scenario was calculated as the average of the high
and low scenarios. The ratios of PEVs to PHEVs for each of the listed years and for all three
scenarios were calculated and the results are listed in the following table.
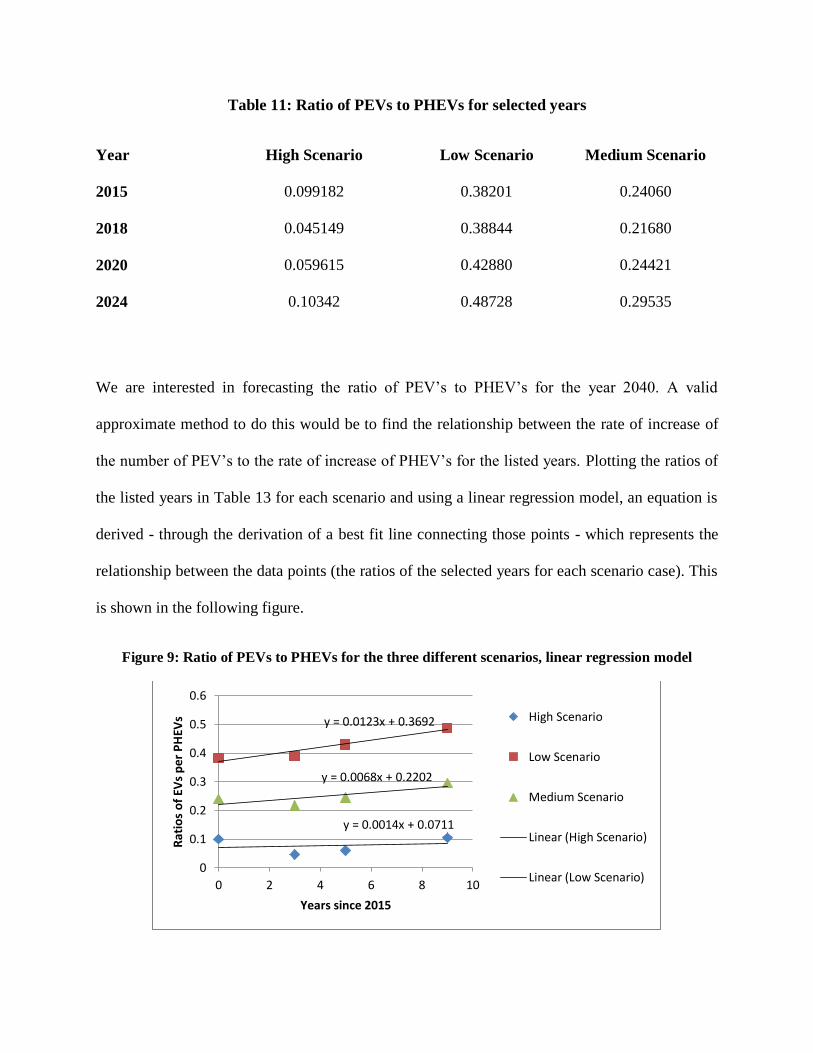
Table 11: Ratio of PEVs to PHEVs for selected years
Year High Scenario Low Scenario Medium Scenario
2015 0.099182 0.38201 0.24060
2018 0.045149 0.38844 0.21680
2020 0.059615 0.42880 0.24421
2024 0.10342 0.48728 0.29535
We are interested in forecasting the ratio of PEV’s to PHEV’s for the year 2040. A valid
approximate method to do this would be to find the relationship between the rate of increase of
the number of PEV’s to the rate of increase of PHEV’s for the listed years. Plotting the ratios of
the listed years in Table 13 for each scenario and using a linear regression model, an equation is
derived - through the derivation of a best fit line connecting those points - which represents the
relationship between the data points (the ratios of the selected years for each scenario case). This
is shown in the following figure.
Figure 9: Ratio of PEVs to PHEVs for the three different scenarios, linear regression model
y = 0.0014x + 0.0711
y = 0.0123x + 0.3692
y = 0.0068x + 0.2202
0
0.1
0.2
0.3
0.4
0.5
0.6
0 2 4 6 8 10
Rat
ios
of
EVs
per
PH
EVs
Years since 2015
High Scenario
Low Scenario
Medium Scenario
Linear (High Scenario)
Linear (Low Scenario)
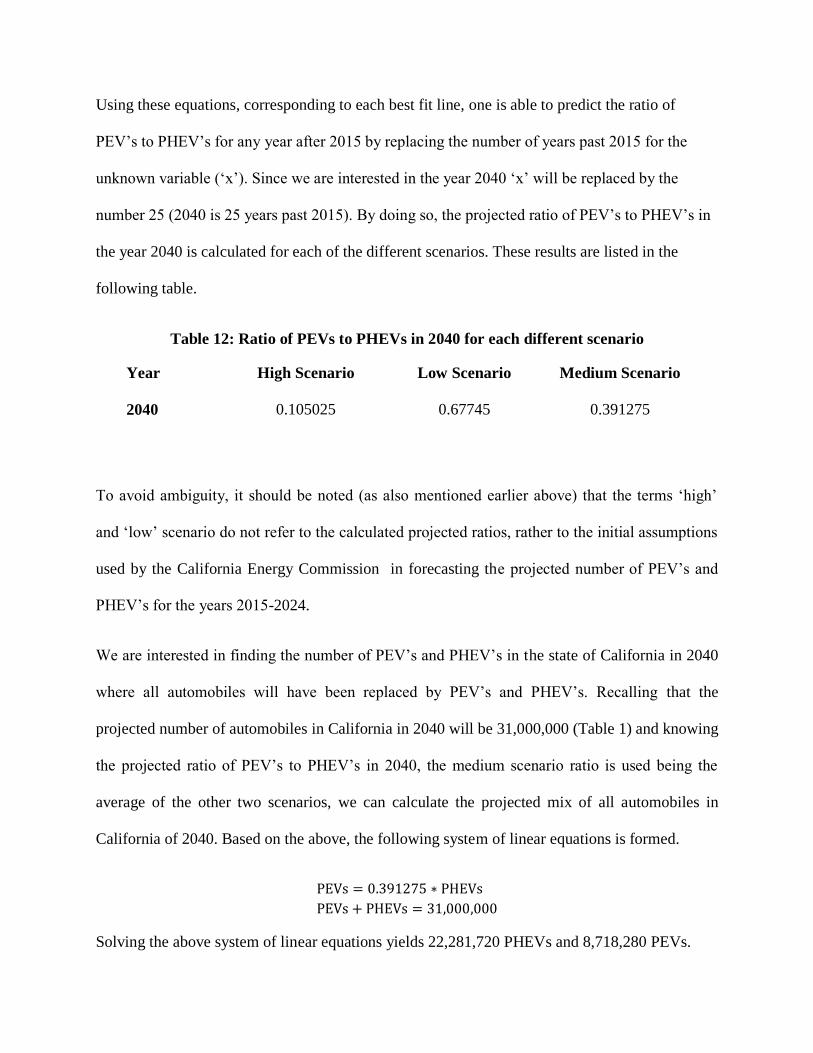
Using these equations, corresponding to each best fit line, one is able to predict the ratio of
PEV’s to PHEV’s for any year after 2015 by replacing the number of years past 2015 for the
unknown variable (‘x’). Since we are interested in the year 2040 ‘x’ will be replaced by the
number 25 (2040 is 25 years past 2015). By doing so, the projected ratio of PEV’s to PHEV’s in
the year 2040 is calculated for each of the different scenarios. These results are listed in the
following table.
Table 12: Ratio of PEVs to PHEVs in 2040 for each different scenario
Year High Scenario Low Scenario Medium Scenario
2040 0.105025 0.67745 0.391275
To avoid ambiguity, it should be noted (as also mentioned earlier above) that the terms ‘high’
and ‘low’ scenario do not refer to the calculated projected ratios, rather to the initial assumptions
used by the California Energy Commission in forecasting the projected number of PEV’s and
PHEV’s for the years 2015-2024.
We are interested in finding the number of PEV’s and PHEV’s in the state of California in 2040
where all automobiles will have been replaced by PEV’s and PHEV’s. Recalling that the
projected number of automobiles in California in 2040 will be 31,000,000 (Table 1) and knowing
the projected ratio of PEV’s to PHEV’s in 2040, the medium scenario ratio is used being the
average of the other two scenarios, we can calculate the projected mix of all automobiles in
California of 2040. Based on the above, the following system of linear equations is formed.
PEVs = 0.391275 ∗ PHEVs
PEVs + PHEVs = 31,000,000
Solving the above system of linear equations yields 22,281,720 PHEVs and 8,718,280 PEVs.
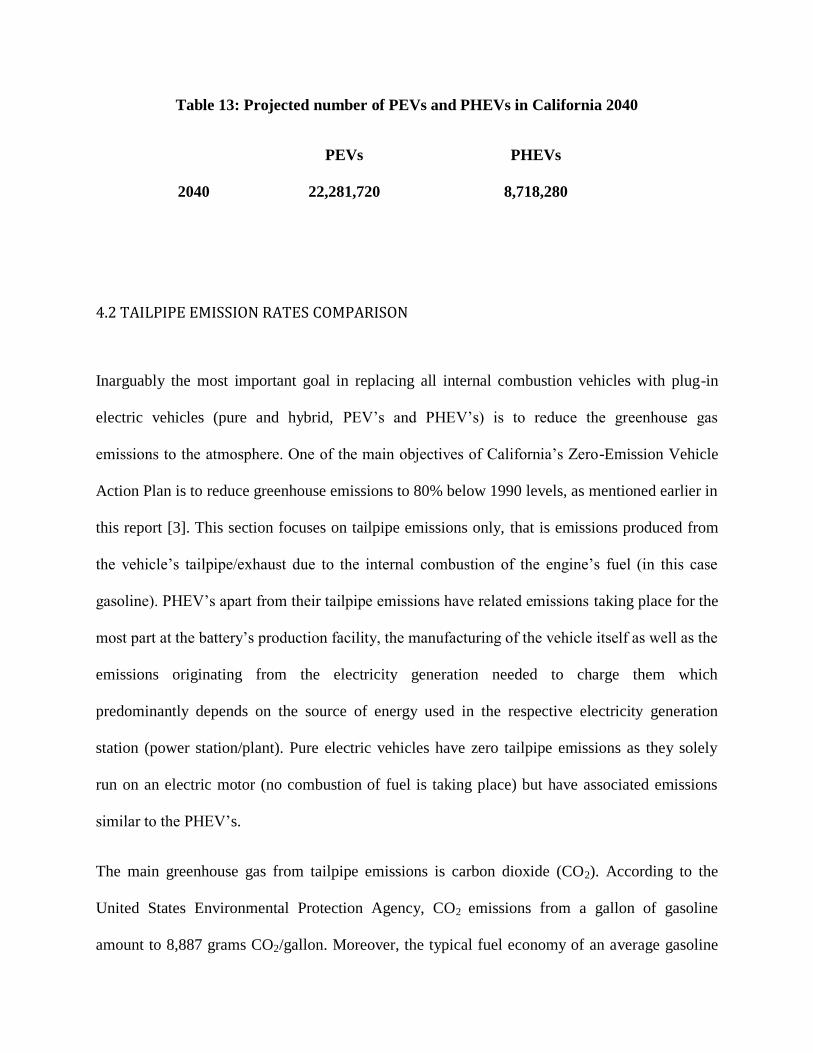
Table 13: Projected number of PEVs and PHEVs in California 2040
PEVs PHEVs
2040 22,281,720 8,718,280
4.2 TAILPIPE EMISSION RATES COMPARISON
Inarguably the most important goal in replacing all internal combustion vehicles with plug-in
electric vehicles (pure and hybrid, PEV’s and PHEV’s) is to reduce the greenhouse gas
emissions to the atmosphere. One of the main objectives of California’s Zero-Emission Vehicle
Action Plan is to reduce greenhouse emissions to 80% below 1990 levels, as mentioned earlier in
this report [3]. This section focuses on tailpipe emissions only, that is emissions produced from
the vehicle’s tailpipe/exhaust due to the internal combustion of the engine’s fuel (in this case
gasoline). PHEV’s apart from their tailpipe emissions have related emissions taking place for the
most part at the battery’s production facility, the manufacturing of the vehicle itself as well as the
emissions originating from the electricity generation needed to charge them which
predominantly depends on the source of energy used in the respective electricity generation
station (power station/plant). Pure electric vehicles have zero tailpipe emissions as they solely
run on an electric motor (no combustion of fuel is taking place) but have associated emissions
similar to the PHEV’s.
The main greenhouse gas from tailpipe emissions is carbon dioxide (CO2). According to the
United States Environmental Protection Agency, CO2 emissions from a gallon of gasoline
amount to 8,887 grams CO2/gallon. Moreover, the typical fuel economy of an average gasoline
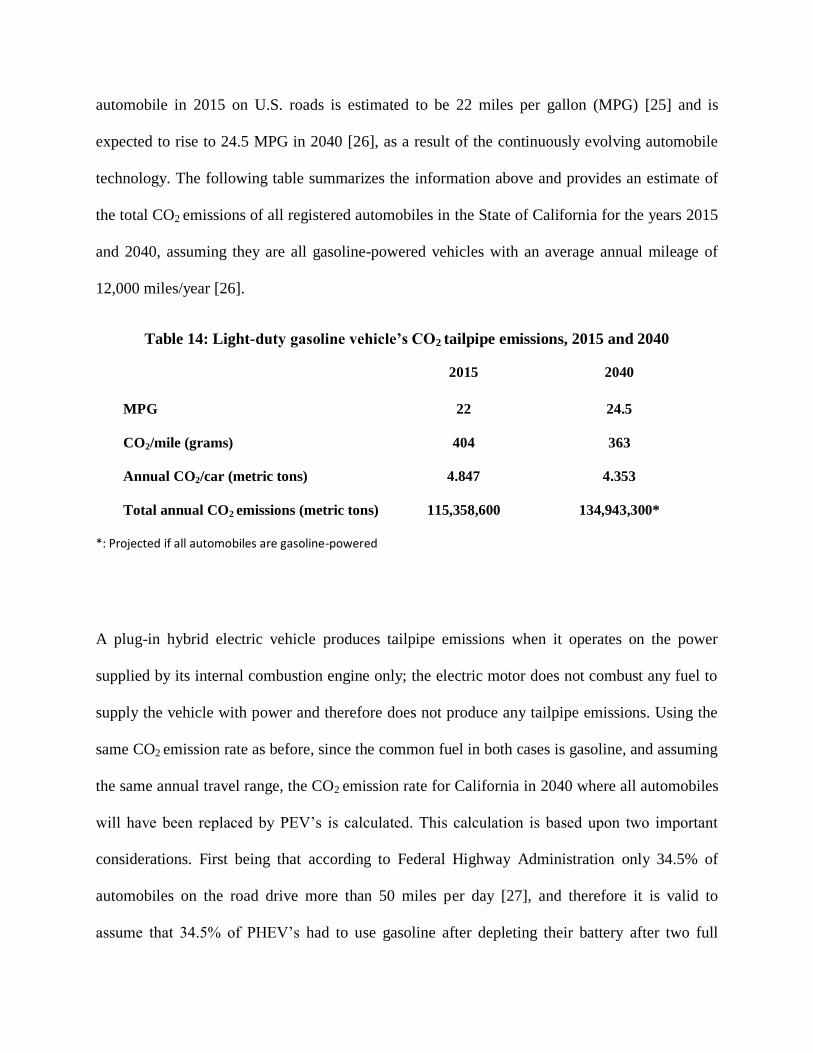
automobile in 2015 on U.S. roads is estimated to be 22 miles per gallon (MPG) [25] and is
expected to rise to 24.5 MPG in 2040 [26], as a result of the continuously evolving automobile
technology. The following table summarizes the information above and provides an estimate of
the total CO2 emissions of all registered automobiles in the State of California for the years 2015
and 2040, assuming they are all gasoline-powered vehicles with an average annual mileage of
12,000 miles/year [26].
Table 14: Light-duty gasoline vehicle’s CO2 tailpipe emissions, 2015 and 2040
2015 2040
MPG 22 24.5
CO2/mile (grams) 404 363
Annual CO2/car (metric tons) 4.847 4.353
Total annual CO2 emissions (metric tons) 115,358,600 134,943,300*
*: Projected if all automobiles are gasoline-powered
A plug-in hybrid electric vehicle produces tailpipe emissions when it operates on the power
supplied by its internal combustion engine only; the electric motor does not combust any fuel to
supply the vehicle with power and therefore does not produce any tailpipe emissions. Using the
same CO2 emission rate as before, since the common fuel in both cases is gasoline, and assuming
the same annual travel range, the CO2 emission rate for California in 2040 where all automobiles
will have been replaced by PEV’s is calculated. This calculation is based upon two important
considerations. First being that according to Federal Highway Administration only 34.5% of
automobiles on the road drive more than 50 miles per day [27], and therefore it is valid to
assume that 34.5% of PHEV’s had to use gasoline after depleting their battery after two full
battery charges (the typical all-electric range of PHEV’s being 25 miles) [28]. Second, it should
be noted that as projected in Table 14 the automobile fleet of the State of California consists of
PEV’s and PHEV’s. However, only the number of PHEV’s (22,281,720) – and actually based on
the first consideration 34.5% of it – will be used for the following calculations since this section
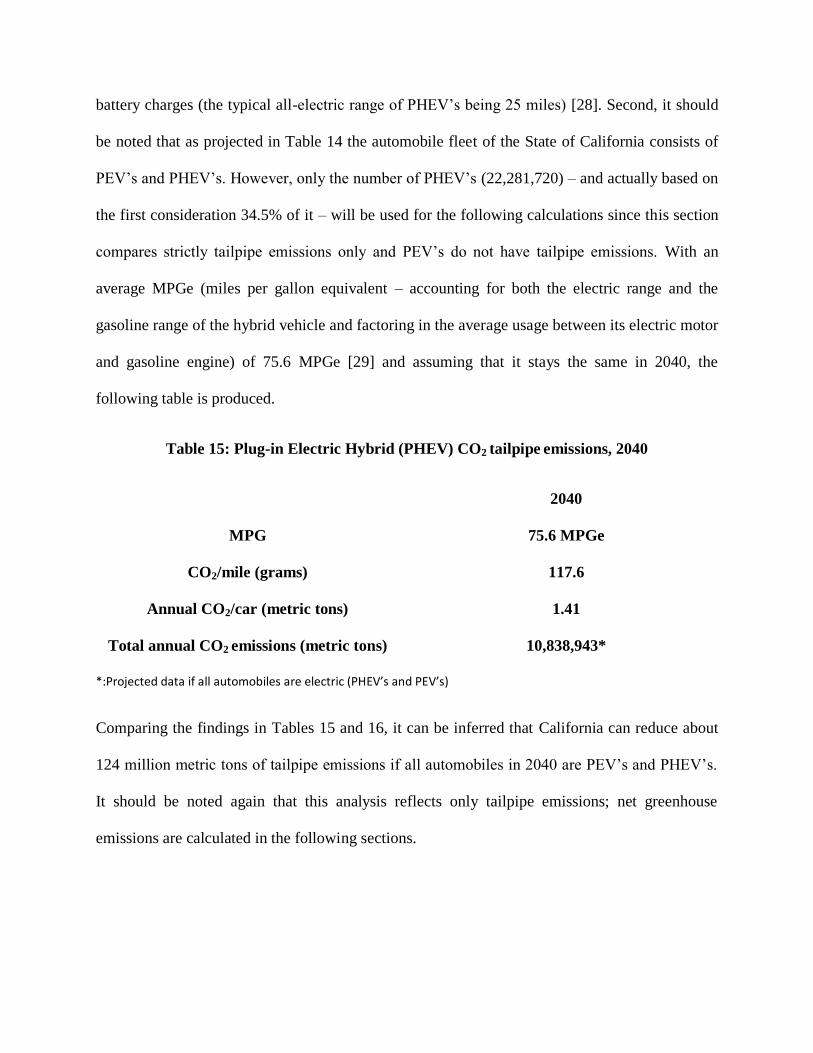
compares strictly tailpipe emissions only and PEV’s do not have tailpipe emissions. With an
average MPGe (miles per gallon equivalent – accounting for both the electric range and the
gasoline range of the hybrid vehicle and factoring in the average usage between its electric motor
and gasoline engine) of 75.6 MPGe [29] and assuming that it stays the same in 2040, the
following table is produced.
Table 15: Plug-in Electric Hybrid (PHEV) CO2 tailpipe emissions, 2040
2040
MPG 75.6 MPGe
CO2/mile (grams) 117.6
Annual CO2/car (metric tons) 1.41
Total annual CO2 emissions (metric tons) 10,838,943*
*:Projected data if all automobiles are electric (PHEV’s and PEV’s)
Comparing the findings in Tables 15 and 16, it can be inferred that California can reduce about
124 million metric tons of tailpipe emissions if all automobiles in 2040 are PEV’s and PHEV’s.
It should be noted again that this analysis reflects only tailpipe emissions; net greenhouse
emissions are calculated in the following sections.
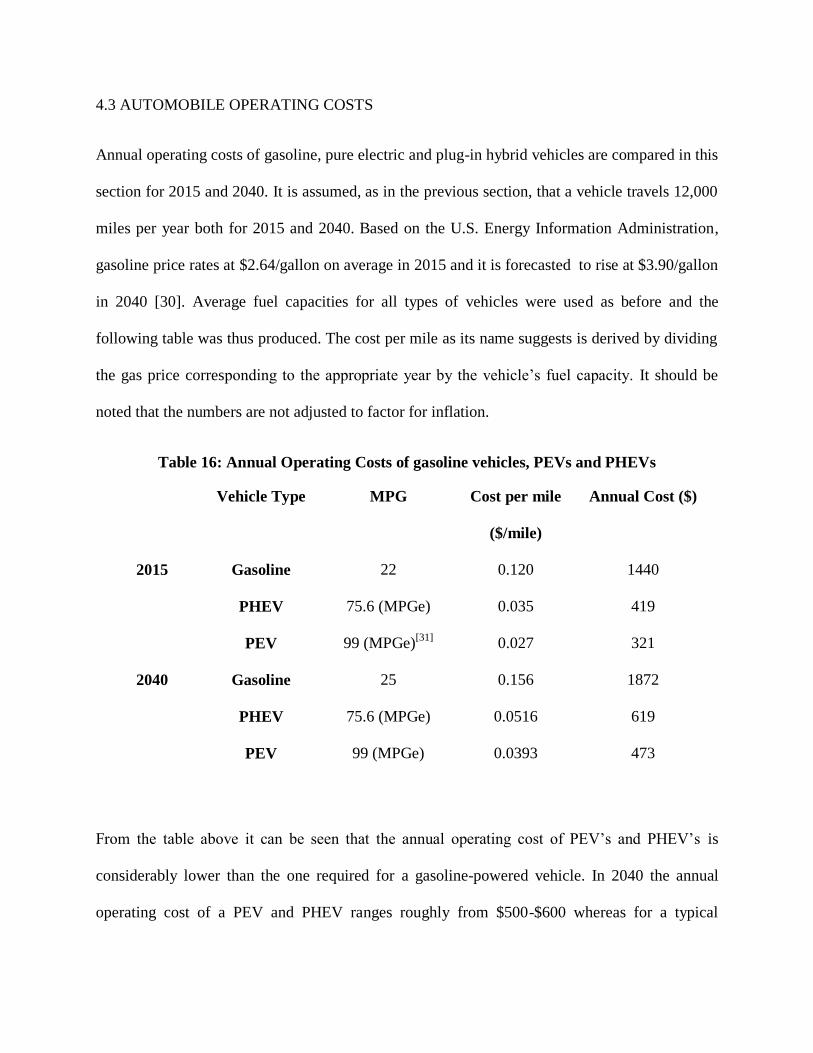
4.3 AUTOMOBILE OPERATING COSTS
Annual operating costs of gasoline, pure electric and plug-in hybrid vehicles are compared in this
section for 2015 and 2040. It is assumed, as in the previous section, that a vehicle travels 12,000
miles per year both for 2015 and 2040. Based on the U.S. Energy Information Administration,
gasoline price rates at $2.64/gallon on average in 2015 and it is forecasted to rise at $3.90/gallon
in 2040 [30]. Average fuel capacities for all types of vehicles were used as before and the
following table was thus produced. The cost per mile as its name suggests is derived by dividing
the gas price corresponding to the appropriate year by the vehicle’s fuel capacity. It should be
noted that the numbers are not adjusted to factor for inflation.
Table 16: Annual Operating Costs of gasoline vehicles, PEVs and PHEVs
Vehicle Type MPG Cost per mile
($/mile)
Annual Cost ($)
2015 Gasoline 22 0.120 1440
PHEV 75.6 (MPGe) 0.035 419
PEV 99 (MPGe)[31]
0.027 321
2040 Gasoline 25 0.156 1872
PHEV 75.6 (MPGe) 0.0516 619
PEV 99 (MPGe) 0.0393 473
From the table above it can be seen that the annual operating cost of PEV’s and PHEV’s is
considerably lower than the one required for a gasoline-powered vehicle. In 2040 the annual
operating cost of a PEV and PHEV ranges roughly from $500-$600 whereas for a typical
gasoline vehicle the annual operating cost in 2040 is projected to be $1872. With an average
EV’s battery life of 10-15 years [32] and an average 30KWh rating the typical battery cost,
which currently rates at $300/KWh [33] is estimated at $9000 and is expected to further decline
in the future. Thus, for the period between 2015-2040 (25 years) with an average annual cost of
PEV’s and PHEV’s for this entire period amounting to $458 dollars, a consumer, purchasing the
PEV or PHEV in 2015, would have to replace the vehicle’s battery once totaling to an overall
cost of $20450 compared to $41400 that he/she would have to spend on gas to fuel a gasoline
vehicle for the same period.
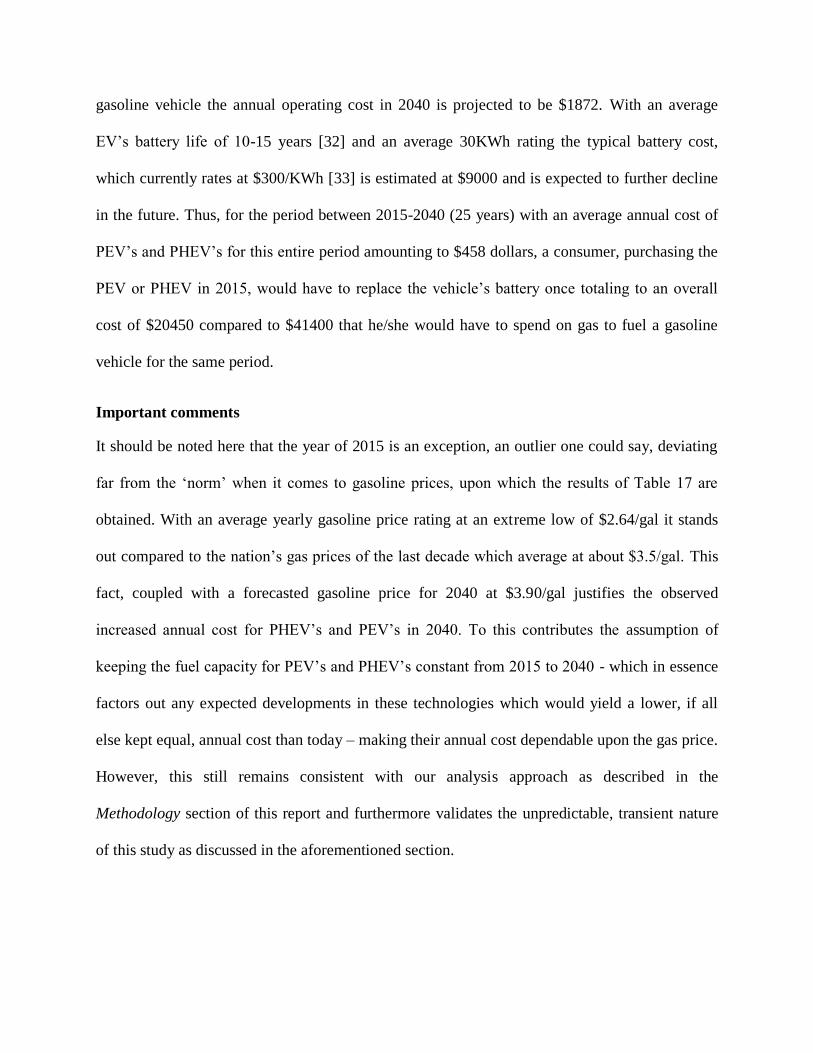
Important comments
It should be noted here that the year of 2015 is an exception, an outlier one could say, deviating
far from the ‘norm’ when it comes to gasoline prices, upon which the results of Table 17 are
obtained. With an average yearly gasoline price rating at an extreme low of $2.64/gal it stands
out compared to the nation’s gas prices of the last decade which average at about $3.5/gal. This
fact, coupled with a forecasted gasoline price for 2040 at $3.90/gal justifies the observed
increased annual cost for PHEV’s and PEV’s in 2040. To this contributes the assumption of
keeping the fuel capacity for PEV’s and PHEV’s constant from 2015 to 2040 - which in essence
factors out any expected developments in these technologies which would yield a lower, if all
else kept equal, annual cost than today – making their annual cost dependable upon the gas price.
However, this still remains consistent with our analysis approach as described in the
Methodology section of this report and furthermore validates the unpredictable, transient nature
of this study as discussed in the aforementioned section.
4.4 BENEFITS OF EVs
4.4.1 CONSUMER’S FINANCIAL BENEFITS
As shown in section 4.3 in Table 17 the annual operating cost for PEV’s and PHEV’s is 3-4
times less than that of a gasoline-powered automobile. As mentioned in previous sections, there
are financial benefits offered by federal and state governments to incentivize the purchase of
EV’s, whose up-front cost might seem at first daunting. Specifically, there are federal tax credits
which bring the price of EV’s down by $7,500 [34]. Moreover, the State of California offers
$2,500 [34] rebates to electric vehicle buyers, in an effort to increase market share and promote
these technologies. These combined government incentives can reduce the price of a Nissan
electric Leaf down to $18,000 [34]. As more consumers invest in this technology, there will be
less of a demand for oil, which reduces the cost of importing foreign oil giving more ‘freedom’
to the government to allocate its resources.
Through an interview with Miss Deborah Schott, an employee at WPI and owner of a 2012
Chevy Volt, a plug-in hybrid electric vehicle, useful information was obtained from the
perspective of a personal user. One of the most important benefits that the vehicle offers is its
significantly reduced operational cost compared to a typical gasoline –powered car. Miss
Deborah Scott estimates that on average she pays $20 dollars a month [4] to charge her vehicle at
home (as she can infer from her monthly electric bill). She further emphasized on the benefits of
being able to charge her vehicle at her workplace location as in that way she manages to
commute from her house to her job using only the power coming from the car’s battery without
needing to use the gas engine and thus avoiding gas money but also tailpipe emissions.
Compared to her previous gasoline car, she estimates that she now saves approximately $200 a
month [4] which would otherwise go towards paying for gasoline. This translates to a total of
$2400 yearly savings. Apart from replacing the tires, she did not have any additional
maintenance costs. This is common for this type of vehicles as they possess a minimal amount of
moving parts.
Moreover, many electric companies offer discounted rates on electricity consumption during off-
peak hours to try to encourage consumers to charge their vehicles at night rather than during the
day during peak hours. While batteries may still seem to be an issue due to their high prices, the
average lifespan of a battery is 12-15 years and will only improve as the technology advances.
Additionally, as mentioned in earlier sections of this report, the battery’s price is on a constant
decline. “We have an internal target to go down by at least a factor of two by 2020” [35], says
Prabhakar Patil, Chief Executive officer of LG Chem. Power Inc.
4.4.2. ENVIRONMENTAL BENEFITS
Along with the economic benefit of having to rely less on foreign oil, as consumers utilize more
electric vehicles, there will be less need to use gasoline-powered vehicles which in turn will
cause less greenhouse gas emissions. While burning coal at electric power plants is not that much
better than burning oil, the electricity generated for electric vehicles can also come from power
plants fueled by other energy sources that are much cleaner than oil and coal: hydro power,
nuclear, geothermal, solar power and wind power. Companies in the private sector have begun
giving their employees incentives to take advantage of solar technology by subsidizing solar
panels in the roofs of their employees’ homes to make clean energy. As these technologies
improve, the emissions associated with generating electricity for electric vehicles will be further
reduced.
As it was shown in section 4.2, switching from gasoline vehicles to electric vehicles (PEV’s and
PHEV’s) will significantly reduce tailpipe emissions. Specifically, it was calculated from the
results of Table 15 and Table 16 that the State of California can reduce CO2 tailpipe emissions
by a total of 124 million metric tons, if it replaces its current vehicle fleet by electric vehicles in
2040.
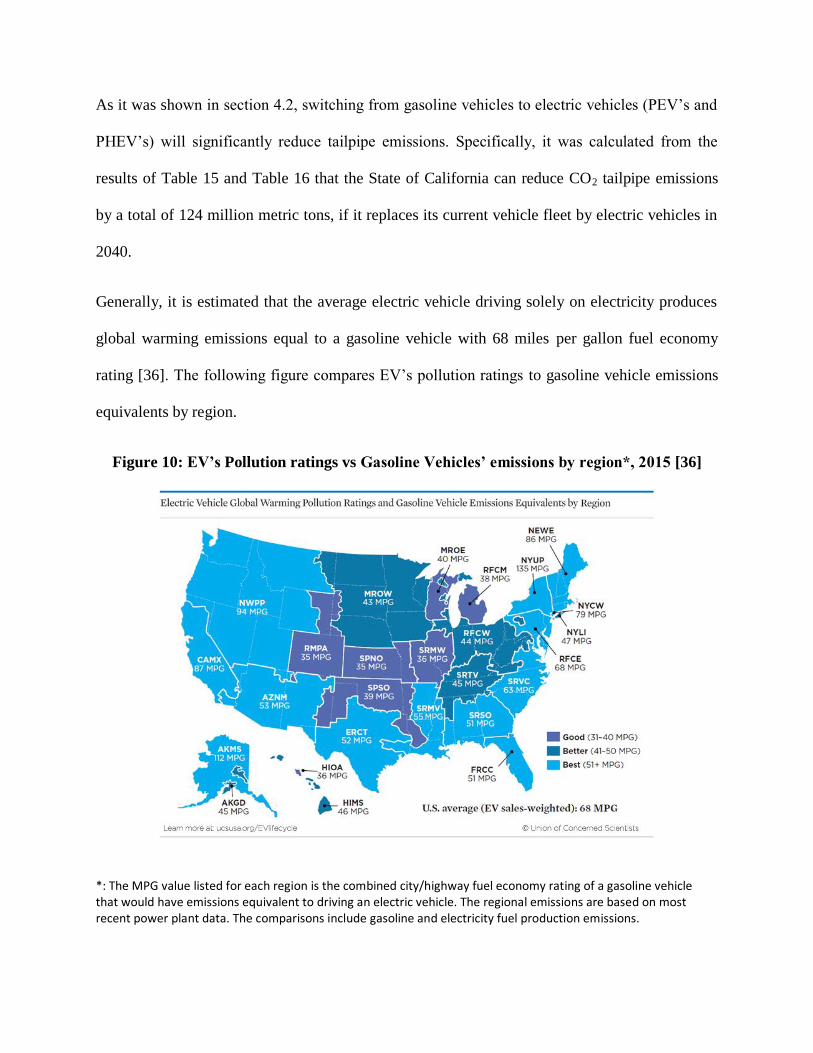
Generally, it is estimated that the average electric vehicle driving solely on electricity produces
global warming emissions equal to a gasoline vehicle with 68 miles per gallon fuel economy
rating [36]. The following figure compares EV’s pollution ratings to gasoline vehicle emissions
equivalents by region.
Figure 10: EV’s Pollution ratings vs Gasoline Vehicles’ emissions by region*, 2015 [36]
*: The MPG value listed for each region is the combined city/highway fuel economy rating of a gasoline vehicle that would have emissions equivalent to driving an electric vehicle. The regional emissions are based on most recent power plant data. The comparisons include gasoline and electricity fuel production emissions.
Furthermore, electric vehicles will become even ‘cleaner’ as more electricity is generated by
renewable sources of energy. National data from 2013-2015 show a declining percentage of
electricity generated by coal power and an increasing in renewable sources, such as wind and
solar which suggests that emissions from operating electric vehicles are most likely to keep
falling [26]. According to the Union of Concerned Scientists, in a grid that is composed of 80%
renewable electricity, the manufacturing of an all-electric vehicle will result in an over 25%
reduction in manufacturing’s emissions and an 84% reduction in emissions from driving,
resulting to an overall emissions reduction of more than 60% [36].
4.5 CHALLENGES
4.5.1 CHARGING STATIONS
If all automobiles in the State of California are replaced by electric vehicles (PEV’s and
PHEV’s) in 2040, it is consequent that a great number of charging stations will be needed to
build and installed in order to accommodate this change. In table 14 of section 4.1 it was found
that if the 2040 projected California car fleet of 31 million automobiles is entirely replaced by
electric vehicles, there will be 22,281,720 plug-in hybrid electric vehicles and 8,718,720 pure
electric vehicles on California roads in 2040. Infographic data shows that 69% of U.S. drivers
drive less than 60 miles on weekdays [37] and this information will be assumed to be true for
2040 California drivers as well. Sixty miles is well within the driving range of a pure electric
vehicle on a single full charge – even the tiny Smart EV delivers up to 68 miles on a full charge
[38]. Now, the total projected number of automobiles in California 2040 was found to be 31
million, Table 1 of section 2.1.1, so based on the aforementioned infographic data and related
assumptions 31% of these automobiles will drive more than 60 miles on a weekday which
translates to a total of 9,610,000 automobiles. But of the 31 million automobiles 22,281,720 will
be plug-in hybrid electric vehicles and 8,718,280 will be pure electric. Therefore, a total of
2,702,667 pure electric vehicles will drive more than 60 miles needing a second battery charge
additional to the assumed one they receive overnight at home. The average all-electric range of a
typical (within a reasonable vehicle price) plug-in hybrid electric vehicle is estimated to be 26
miles. The PHEV can switch to using its gasoline engine when the battery is depleted, however it
is assumed that for the 31% of the drivers what will run more than 60 miles on a given weekday,
it is likely that they would aim for a recharge during the day and while at work to avoid using the
car’s gasoline engine and thus avoiding extra operating cost and unnecessary emissions.
Therefore, a total of 6,907,333 plug-in hybrid electric vehicles may need to use a publicly
available charging station giving a net total of 9,610,000 electric vehicles requiring a recharge at
a public electric charging station in the state of California in 2040.
Charging times may vary depending on different aspects, such as the type of vehicle (PEV or
PHEV), the vehicle’s battery technology and condition, the battery’s charging status (how
depleted the battery is – the fuller the battery the slower the charging time gets), the charging
method used, the grid’s electricity capacity and current usage. Typically, as mentioned in
previous sections a PEV achieves a full battery charge in 6 hours and a PHEV in about 3 hours
using AC Level 2 charging. Moreover, as mentioned in 2.3.1, there are currently 2,821 public
charging stations in the state of California giving a total of 8,678 charging outlets with an
average ratio of 3 outlets per station. Therefore, for any given weekday assuming a 12 hour
working period an electric charge station may provide charging for 6 PEV’s or 12 PHEV’s.
Since the ratio of PHEVs to PEVs in California 2040 is nearly 3:1, and taking into account the
aforementioned assumptions, a charging station is able to charge a total of 9 electric vehicles on
a given weekday. Based on these results, a total of 1,067,778 charging stations need to be
publicly available to adequately power the State’s car fleet in 2040. From 2.3.1 there are 2,821
public electric charging stations currently in California and therefore based on this analysis
1,064,957 charging stations needs to be additionally built by 2040 resulting in 42,599 charging
stations needed to be built per year during this 25 year model period. From 2014-2015 the State
of California built 1,110 charging stations which indicates that in order to meet this goal the
State has to increase its yearly installment of charging stations by a little more than 38 times. As
the building and installment of each station comes with associated financial costs, the feasibility
of this goal is dependent upon several factors, mainly including the effort to attract and convince
the public to switch to these technologies. With an increased demand in electric vehicles, market
share will increase reducing all associated costs – including the price of the vehicles themselves,
the costs of the battery alone, the price of the charging stations and their installment – as
manufactures will lower prices to meet the increased market demand. Moreover, as electric
charging stations technology advances, faster and more efficient charging methods are being
developed, such as the DC ‘superfast’ charger, mentioned in 2.3.2, which may come with
increased prices – which are likely to fall with increasing demand as explained – but provides a
very fast charging time (about 30 minutes) which could thus translate in a decreased number of
charging stations needed to be built.
4.5.2. ELECTRICITY CONSUMPTION
It is of paramount interest to estimate the energy required to power California’s automobile fleet
in 2040 which, based on this study, will be comprised solely by PEV’s and PHEV’s and compare
that to the energy required to fuel California’s automobiles in 2040 if they were all gasoline-
powered.
Based on the information and assumptions listed in the previous section, 4.5.1, on a given day
31% of the total number of PEV’s, that is 8,718,280 PEV’s, will require two battery charges,
with the rest requiring just one and the same ratio holds for the total number of PHEV’s,
translating to 22,718,280 PHEV’s requiring a second charge on a given day. Now, based on most
current data the average battery capacity of a typical PEV is estimated to be 24KWh and for a
PHEV 8.5 KWh [39]. In other words, 24 KWh are required to fully charge an average PEV
whereas 8.5 KWh are needed for a PHEV, respectively. Putting all this together, a net 797.26668
GWh of electricity are required to adequately power 2040 California’s fleet on a given day,
consisting entirely of PEV’s and PHEV’s, based on the aforementioned analysis and stated
assumptions. Therefore for the entire period of 2040, the State of California will need to supply
291 TWh of electricity - which corresponds to 80% of the State’s projected electricity
consumption in 2040 (Table 2) - to adequately power its automobile fleet, which consists of
PEV’s and PHEV’s only.
Now, let us compare what would the energy demand to fuel California’s automobile fleet if that
consists entirely of gasoline-powered vehicles. Based on 2014 data, the State consumed 12.3
billion gallons of gasoline [40] which roughly translates to 517 gallons per automobile for that
year. With 31 million automobiles in 2040, all of them assumed to be gasoline-powered in this
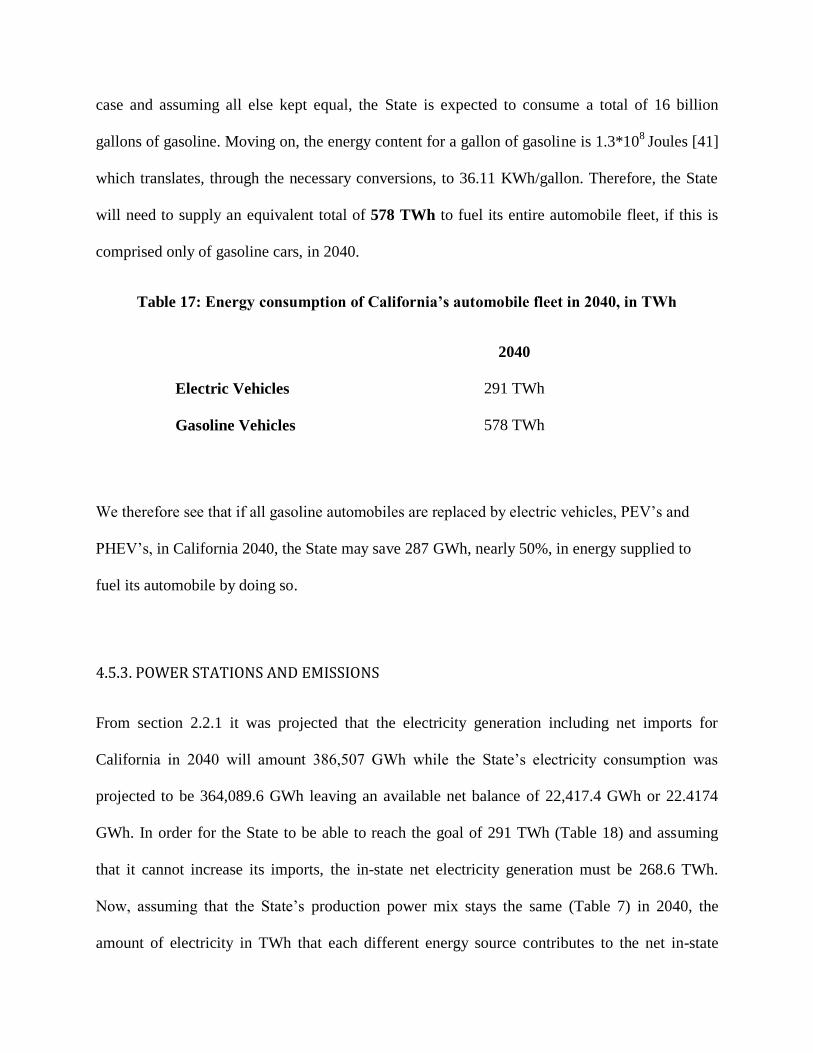
case and assuming all else kept equal, the State is expected to consume a total of 16 billion
gallons of gasoline. Moving on, the energy content for a gallon of gasoline is 1.3*108
Joules [41]
which translates, through the necessary conversions, to 36.11 KWh/gallon. Therefore, the State
will need to supply an equivalent total of 578 TWh to fuel its entire automobile fleet, if this is
comprised only of gasoline cars, in 2040.
Table 17: Energy consumption of California’s automobile fleet in 2040, in TWh
2040
Electric Vehicles 291 TWh
Gasoline Vehicles 578 TWh
We therefore see that if all gasoline automobiles are replaced by electric vehicles, PEV’s and
PHEV’s, in California 2040, the State may save 287 GWh, nearly 50%, in energy supplied to
fuel its automobile by doing so.
4.5.3. POWER STATIONS AND EMISSIONS
From section 2.2.1 it was projected that the electricity generation including net imports for
California in 2040 will amount 386,507 GWh while the State’s electricity consumption was
projected to be 364,089.6 GWh leaving an available net balance of 22,417.4 GWh or 22.4174
GWh. In order for the State to be able to reach the goal of 291 TWh (Table 18) and assuming
that it cannot increase its imports, the in-state net electricity generation must be 268.6 TWh.
Now, assuming that the State’s production power mix stays the same (Table 7) in 2040, the
amount of electricity in TWh that each different energy source contributes to the net in-state
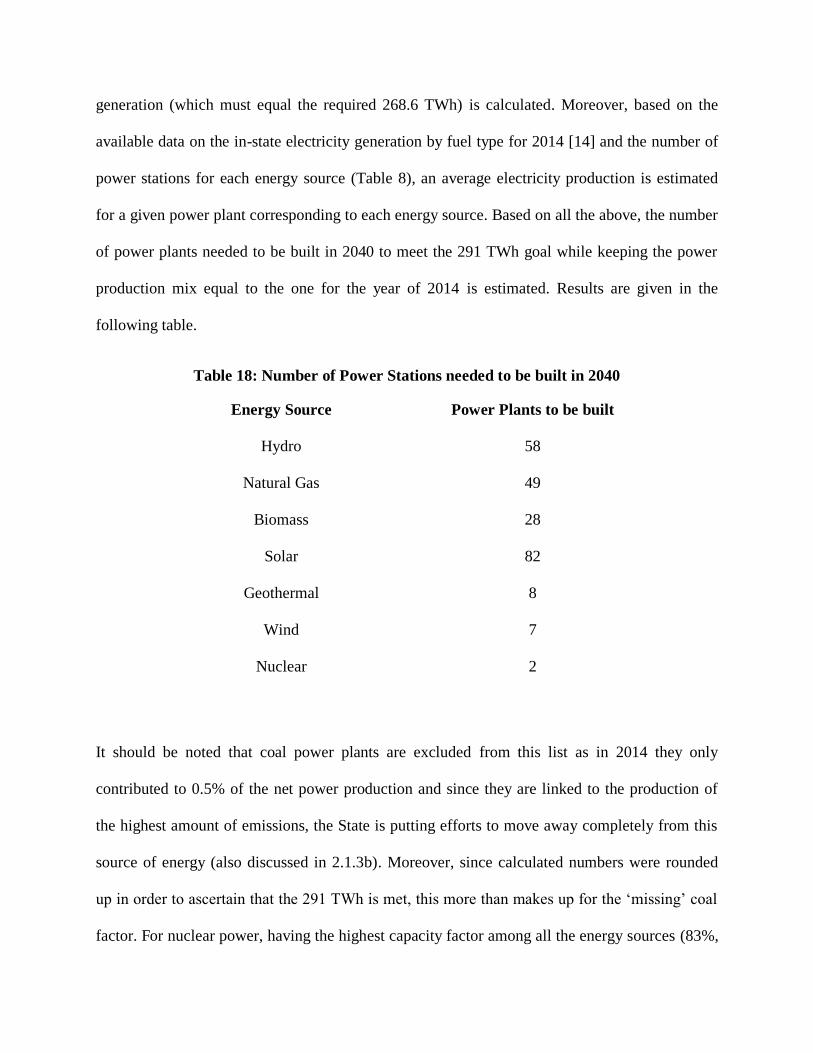
generation (which must equal the required 268.6 TWh) is calculated. Moreover, based on the
available data on the in-state electricity generation by fuel type for 2014 [14] and the number of
power stations for each energy source (Table 8), an average electricity production is estimated
for a given power plant corresponding to each energy source. Based on all the above, the number
of power plants needed to be built in 2040 to meet the 291 TWh goal while keeping the power
production mix equal to the one for the year of 2014 is estimated. Results are given in the
following table.
Table 18: Number of Power Stations needed to be built in 2040
Energy Source Power Plants to be built
Hydro 58
Natural Gas 49
Biomass 28
Solar 82
Geothermal 8
Wind 7
Nuclear 2
It should be noted that coal power plants are excluded from this list as in 2014 they only
contributed to 0.5% of the net power production and since they are linked to the production of
the highest amount of emissions, the State is putting efforts to move away completely from this
source of energy (also discussed in 2.1.3b). Moreover, since calculated numbers were rounded
up in order to ascertain that the 291 TWh is met, this more than makes up for the ‘missing’ coal
factor. For nuclear power, having the highest capacity factor among all the energy sources (83%,
Table 10), the lowest number of plants is required to be built while solar energy, on the other
hand, having the lowest capacity factor due to mainly its seasonal nature, requires the highest
number of additional power stations to be built in order to match its projected contribution to the
net electricity generation needed to fuel California’s automobile in 2040.
While, emissions from renewable sources – namely biomass, solar, wind and geothermal – and
from nuclear plants are negligible, data shows that the average CO2 emissions rate of a natural
gas power plant is 1135lbs/MWh [42]. For the required 268.6 TWh energy demand which should
be met by building additional power plants in 2040 and using the same production power mix as
in 2014 – process explained in the same section further above – the total amount of electricity
that should be generated by natural gas plants is estimated to be 164,652 GWh which thus
translates to a total of 84,776,414 metric tons of CO2 emissions. In section 4.2 it was calculated
that if all vehicles on 2040 California roads are gasoline-powered the overall tailpipe emissions
would be 134,943,300 CO2 metric tons. Moreover, in the same section it was estimated that if all
vehicles switch to electric cars in 2040 (PEV’s and PHEV’s) the overall tailpipe emissions would
be 10,838,943 CO2 metric tons. Therefore, if all cars are replaced by electric vehicles in 2040 the
overall CO2 emissions for the year, assuming the current production power mix which heavily
depends on natural gas – which bears the associated CO2 emissions - will be 95,615,357 (tailpipe
emissions plus related emissions to power them) which results in about 40 million metric tons
CO2 reduction if they were all gasoline. From the 95,615,357 million CO2 tons, 87% comes
from the power plants – the ones using natural gas as their primary source in this case – which
supply electricity to fuel the State’s automobile fleet.
4.5.4 LIMITATIONS OF EV’s
This section summarizes a few of the related limitations and concerns relating to electric vehicles
and their associated technologies which are likely to hamper consumers' interest towards them.
Current battery life and battery cost is one of them. With current battery life, as mentioned in
previous sections, averaging around 8 years or 100,000 miles and its high average price
amounting typically to 25% of the vehicle’s total cost [43] and coupled with the fact that
gasoline-powered vehicles are getting better and better fuel economy ratings, the average
consumer is less likely to explore the option of electric vehicles as they might seem less cost
effective. Adding to this, comes the worry of a significant portion of consumers who fear that the
range of the EV’s battery is short and might ‘die’ leaving them stranded in an uncomfortable
scenario, what is known as ‘range anxiety’ [44].
Moreover, climate temperature conditions, driving faster, carrying loads and battery’s age could
further reduce the vehicle’s driving age [45]. Mentioned earlier in this report, Miss Deborah
Scott, owner of a Chevy Volt (a plug-in hybrid electric car), says that in very cold days (around
35 Fahrenheit degree or under) she would get 26 miles or maybe lower from the battery, while in
spring season she can get approximately 50 miles in electric range [4]. In addition, she observes
that extra energy is needed to be spent to keep her car’s interior warm, and as there is no engine,
the outside of the car remains very, very cold. Under very cold weather the car will use power to
keep the battery warm enough [4]. She further notes that when the battery is running low the user
can feel the vehicle’s response to be more sluggish.
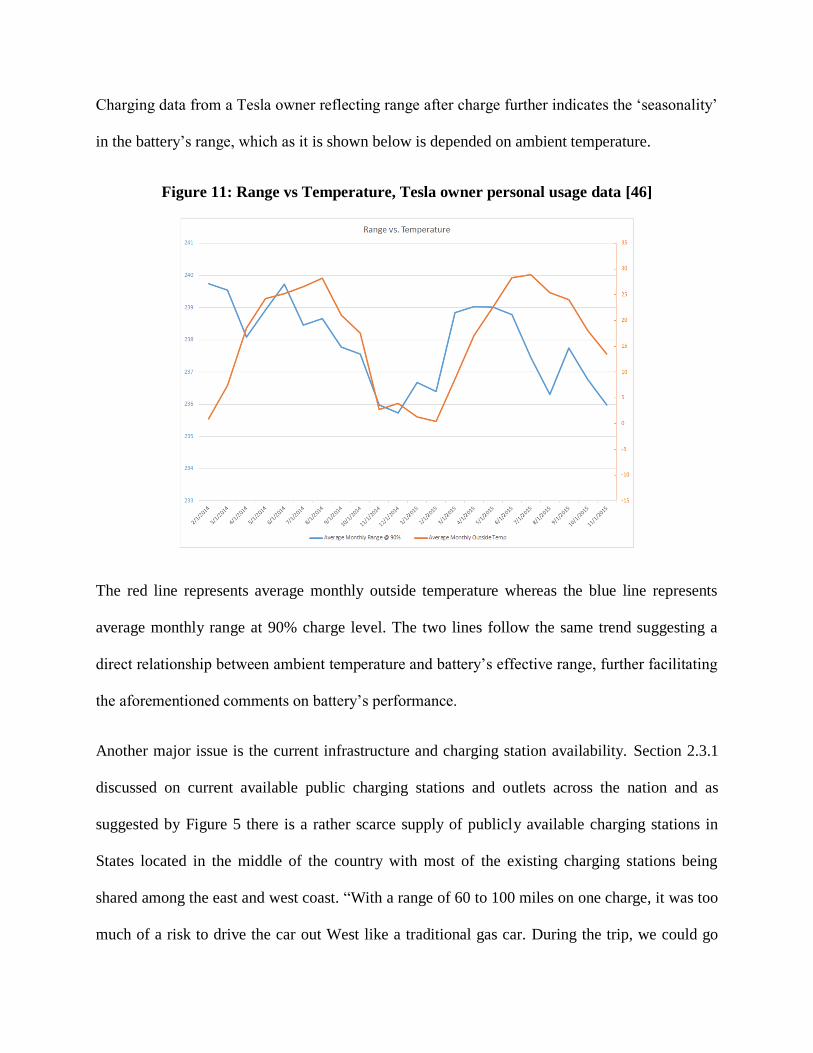
Charging data from a Tesla owner reflecting range after charge further indicates the ‘seasonality’
in the battery’s range, which as it is shown below is depended on ambient temperature.
Figure 11: Range vs Temperature, Tesla owner personal usage data [46]
The red line represents average monthly outside temperature whereas the blue line represents
average monthly range at 90% charge level. The two lines follow the same trend suggesting a
direct relationship between ambient temperature and battery’s effective range, further facilitating
the aforementioned comments on battery’s performance.
Another major issue is the current infrastructure and charging station availability. Section 2.3.1
discussed on current available public charging stations and outlets across the nation and as
suggested by Figure 5 there is a rather scarce supply of publicly available charging stations in
States located in the middle of the country with most of the existing charging stations being
shared among the east and west coast. “With a range of 60 to 100 miles on one charge, it was too
much of a risk to drive the car out West like a traditional gas car. During the trip, we could go
days without seeing an electric charging station”, an owner of an electric Nissan Leaf reports.
She further notes, “The trouble is, those are fewer and farther between than you’d expect; you’d
think they’d be everywhere” [47]. “I think one of the biggest challenges facing the industry is
how to get charging infrastructure” [47] states Cal. Lankton, director of global EV infrastructure
for Tesla Motors. He adds, “We have to adopt our infrastructure policy to meet the needs of
consumers” [47]. Another EV user states “we do not have a range issue, we have a charging
issue” [45]. He made a 3,500 mile trek in 44 days using his electric Zero DS motorcycle which is
nearly ten times longer than someone using a gasoline-powered motorbike would have done.
Overall, the infrastructure/charging station availability seems to present a ‘chicken and the egg’
scenario. Consumers will stay reluctant to purchase EVs without knowing they can conveniently
recharge their vehicles, while manufacturers will not install charging stations until they know
they can make profits from consumers utilizing the stations.
4.6 SOCIAL/UNINTENDED CONSEQUENCES
As electric vehicle usage increases, so will the job opportunities associated with supporting EVs.
Vehicle repair, maintenance of charging stations, and various other new jobs will emerge and
may contribute in reducing the overall unemployment rate in the United States. There is also the
view, though, that the electric car will realize only modest scale economics in that, as a car, it
already is a largely mature product and that after all it does not stop being an energy device
which can thus expect to benefit from marginal efficiency enhancement [48].
Skeptics on the actual benefits that electric vehicles are believed to bring, both on a personal and
on a more general societal level, protest that taxpayers’ money should not be used to subsidize
the hobby of ‘the few’ [49]. Moreover, this federal ‘war’, as characterized by Robert L. Bradley
Jr. in his article ‘The cost of demonizing carbon’, against consumer-chosen fossil fuel energy to
promote ‘green’ energies survive will have a great impact to the free-market energy – oil, gas
and coal – the bright spot of the American economy supporting 9.8 million American jobs and
paying $200 billion in direct wages to U.S. employees and is expected to create another one
million new positions over the next 10 years [49].
V. CONCLUSIONS AND RECCOMENDATIONS
This study looked at future California 2040, 25 model years from now, when it was assumed that
all automobiles will have been replaced by electric (PEVs and PHEVs) vehicles only. Certain
assumptions were needed to be held in order to forecast various types of data, essential to the
process of obtaining related results.
Results showed that the annual cost of operating a PEV or a PHEV, in California 2040, is 3 to 4
times as low compared to a gasoline-powered car, not including battery’s replacement cost.
Furthermore, it was estimated that the cost to fuel California’s automobile fleet in 2040 would be
half of that required had there been only gasoline-powered vehicles on the roads of California.
The study also calculated the net tailpipe emissions of all automobiles in 2040 for the two cases
where in the first case they are all electric (PEVs and PHEVs) and in the second they are all
gasoline-powered.
It was found that if California switches to electric vehicles it would reduce its CO2 emissions by
40 million metric tons. The number of power stations needed to be built to meet the electricity
demand to power the State’s automobile fleet in 2040 was estimated by the type of energy source
the plant uses, assuming the State’s power production mix is the same between now and 2040.
However, as the State is expected to increasingly keep moving towards renewable sources, in
order to meet its goal of reducing its emissions by 80% of 1990 levels, California is likely to
reduce even further the projected 40 million metric tons of CO2 emissions. Moreover, should the
State decide to resort to using nuclear sources of energy more widely in the future, not only it
will be able to reduce substantially its CO2 emissions but also will need to build far fewer plants
due to the very high capacity factor nuclear source brings into the mix.
Another great challenge that the State will need to overcome in order to accommodate the
transformation of its future, 2040, automobile fleet into an electric-based one (consisting solely
of PEV’s and PHEV’s) is the construction and installment of a great number of charging stations.
Specifically, based on the stated assumptions, it was estimated that the State will need to build on
average 42,599 charging stations per year in the period 2015-2040 a rate 38 times higher to the
one between 2014 and 2015. However, with developments in charging technology in
combination to an increased demand for electric vehicle technologies the number of required
charging stations may decrease along with the cost of their construction.
Through this study, overall, it is apparent that the benefits that EV’s bring, assumed not only on a
personal for the consumer level but also for the general well-being, are significant. However,
major steps need to be taken towards battery technology and charging planning and
infrastructure. But, since a free market is dictated by the economic laws of supply and demand, it
is equally important that consumers’ view on these technologies must change in order to
propagate such revolutions. On a more individual level, I believe that it is duty of us all to be as
adequately aware of these, and any developing, technologies in order to be able to make
responsible, to ourselves, the others and the planet, decisions.
‘The more you know, the less you need’.
-Yvon Chouinard
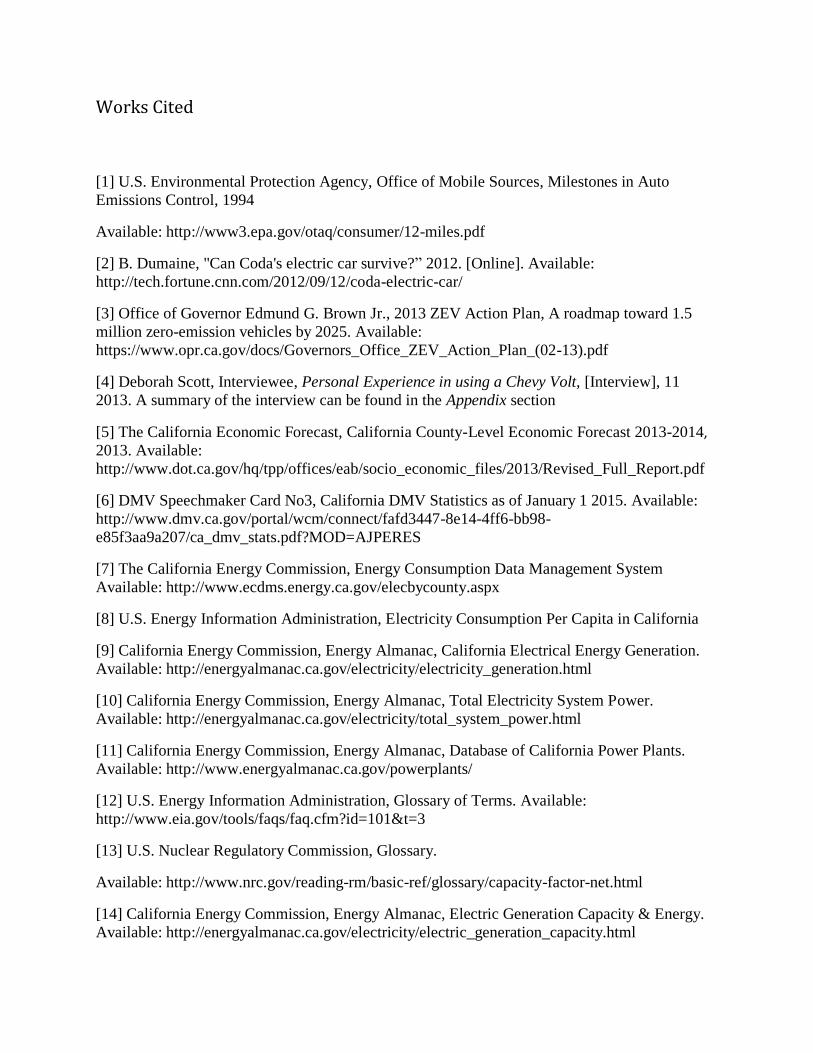
Works Cited
[1] U.S. Environmental Protection Agency, Office of Mobile Sources, Milestones in Auto
Emissions Control, 1994
Available: http://www3.epa.gov/otaq/consumer/12-miles.pdf
[2] B. Dumaine, "Can Coda's electric car survive?” 2012. [Online]. Available:
http://tech.fortune.cnn.com/2012/09/12/coda-electric-car/
[3] Office of Governor Edmund G. Brown Jr., 2013 ZEV Action Plan, A roadmap toward 1.5
million zero-emission vehicles by 2025. Available:
https://www.opr.ca.gov/docs/Governors_Office_ZEV_Action_Plan_(02-13).pdf
[4] Deborah Scott, Interviewee, Personal Experience in using a Chevy Volt, [Interview], 11
2013. A summary of the interview can be found in the Appendix section
[5] The California Economic Forecast, California County-Level Economic Forecast 2013-2014,
2013. Available:
http://www.dot.ca.gov/hq/tpp/offices/eab/socio_economic_files/2013/Revised_Full_Report.pdf
[6] DMV Speechmaker Card No3, California DMV Statistics as of January 1 2015. Available:
http://www.dmv.ca.gov/portal/wcm/connect/fafd3447-8e14-4ff6-bb98-
e85f3aa9a207/ca_dmv_stats.pdf?MOD=AJPERES
[7] The California Energy Commission, Energy Consumption Data Management System
Available: http://www.ecdms.energy.ca.gov/elecbycounty.aspx
[8] U.S. Energy Information Administration, Electricity Consumption Per Capita in California
[9] California Energy Commission, Energy Almanac, California Electrical Energy Generation.
Available: http://energyalmanac.ca.gov/electricity/electricity_generation.html
[10] California Energy Commission, Energy Almanac, Total Electricity System Power.
Available: http://energyalmanac.ca.gov/electricity/total_system_power.html
[11] California Energy Commission, Energy Almanac, Database of California Power Plants.
Available: http://www.energyalmanac.ca.gov/powerplants/
[12] U.S. Energy Information Administration, Glossary of Terms. Available:
http://www.eia.gov/tools/faqs/faq.cfm?id=101&t=3
[13] U.S. Nuclear Regulatory Commission, Glossary.
Available: http://www.nrc.gov/reading-rm/basic-ref/glossary/capacity-factor-net.html
[14] California Energy Commission, Energy Almanac, Electric Generation Capacity & Energy.
Available: http://energyalmanac.ca.gov/electricity/electric_generation_capacity.html
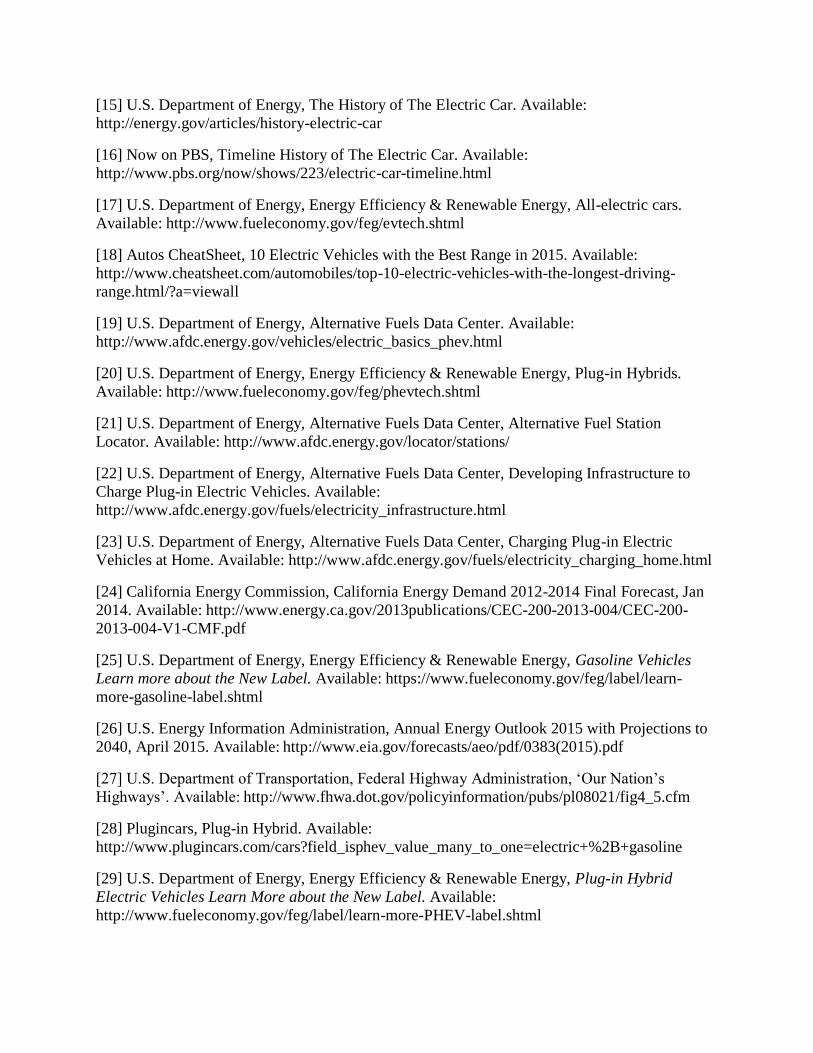
[15] U.S. Department of Energy, The History of The Electric Car. Available:
http://energy.gov/articles/history-electric-car
[16] Now on PBS, Timeline History of The Electric Car. Available:
http://www.pbs.org/now/shows/223/electric-car-timeline.html
[17] U.S. Department of Energy, Energy Efficiency & Renewable Energy, All-electric cars.
Available: http://www.fueleconomy.gov/feg/evtech.shtml
[18] Autos CheatSheet, 10 Electric Vehicles with the Best Range in 2015. Available:
http://www.cheatsheet.com/automobiles/top-10-electric-vehicles-with-the-longest-driving-
range.html/?a=viewall
[19] U.S. Department of Energy, Alternative Fuels Data Center. Available:
http://www.afdc.energy.gov/vehicles/electric_basics_phev.html
[20] U.S. Department of Energy, Energy Efficiency & Renewable Energy, Plug-in Hybrids.
Available: http://www.fueleconomy.gov/feg/phevtech.shtml
[21] U.S. Department of Energy, Alternative Fuels Data Center, Alternative Fuel Station
Locator. Available: http://www.afdc.energy.gov/locator/stations/
[22] U.S. Department of Energy, Alternative Fuels Data Center, Developing Infrastructure to
Charge Plug-in Electric Vehicles. Available:
http://www.afdc.energy.gov/fuels/electricity_infrastructure.html
[23] U.S. Department of Energy, Alternative Fuels Data Center, Charging Plug-in Electric
Vehicles at Home. Available: http://www.afdc.energy.gov/fuels/electricity_charging_home.html
[24] California Energy Commission, California Energy Demand 2012-2014 Final Forecast, Jan
2014. Available: http://www.energy.ca.gov/2013publications/CEC-200-2013-004/CEC-200-
2013-004-V1-CMF.pdf
[25] U.S. Department of Energy, Energy Efficiency & Renewable Energy, Gasoline Vehicles
Learn more about the New Label. Available: https://www.fueleconomy.gov/feg/label/learn-
more-gasoline-label.shtml
[26] U.S. Energy Information Administration, Annual Energy Outlook 2015 with Projections to
2040, April 2015. Available: http://www.eia.gov/forecasts/aeo/pdf/0383(2015).pdf
[27] U.S. Department of Transportation, Federal Highway Administration, ‘Our Nation’s
Highways’. Available: http://www.fhwa.dot.gov/policyinformation/pubs/pl08021/fig4_5.cfm
[28] Plugincars, Plug-in Hybrid. Available:
http://www.plugincars.com/cars?field_isphev_value_many_to_one=electric+%2B+gasoline
[29] U.S. Department of Energy, Energy Efficiency & Renewable Energy, Plug-in Hybrid
Electric Vehicles Learn More about the New Label. Available:
http://www.fueleconomy.gov/feg/label/learn-more-PHEV-label.shtml
[30] U.S. Energy Information Administration, Petroleum and Other Liquids, U.S. Regular
Gasoline Prices. Available: http://www.eia.gov/petroleum/gasdiesel/
[31] U.S. Department of Energy, Energy Efficiency & Renewable Energy, Electric Vehicles
Learn More about the New Label. Available: http://www.fueleconomy.gov/feg/label/learn-more-
electric-label.shtml
[32] Comparison of Battery Life across Real-World Automobile Drive Cycles, 7th
Lithium
Battery Power Conference Las Vegas, NV. Available:
http://www.nrel.gov/docs/fy12osti/53470.pdf
[33] Arstechnica, Electric vehicle batteries are getting cheaper much faster than we expected,
July 2015. Available: http://arstechnica.com/science/2015/07/electric-vehicle-batteries-are-
getting-cheaper-much-faster-than-we-expected/
[34] The Wall Street Journal, A Green Car Named Desire, Sep 2013. Available:
http://www.wsj.com/news/articles/SB10001424127887323981304579079321154539590
[35] ZD Net, Why Electric Car prices could plummet by 2020, Sep 2013. Available:
http://www.zdnet.com/article/why-electric-car-prices-could-plummet-by-2020/
[36] Union of Concerned Scientists, Cleaner Cars from Cradle to Grave, 2015. Available:
http://www.ucsusa.org/sites/default/files/attach/2015/11/Cleaner-Cars-from-Cradle-to-Grave-
exec-summary.pdf
[37] Union of Concerned Scientists, Infographic Data 2013. Available:
http://www.ucsusa.org/clean_vehicles/smart-transportation-solutions/advanced-vehicle-
technologies/electric-cars/bev-phev-range-electric-car.html#.Vonk0fkrLIV
[38] Autos CheatSheet, 10 Electric Vehicles with the Best Range in 2015, Nov 2015. Available:
http://www.cheatsheet.com/automobiles/top-10-electric-vehicles-with-the-longest-driving-
range.html/?a=viewall
[39] PlugInAmerica, Plug-in Vehicle Tracker, What’s Coming When. Available:
http://www.pluginamerica.org/vehicles
[40] Green Car Reports, California to use 1 billion gallons less gasoline in six years? Available:
http://www.greencarreports.com/news/1091840_california-to-use-1-billion-gallons-less-
gasoline-in-six-years
[41] EVworld, Energy Numbers. Available:
http://www.evworld.com/library/energy_numbers.pdf
[42] U.S. Environmental Protection Agency, Electricty from Natural Gas. Available:
http://www.epa.gov/energy
[43] HybridCars, How long will an electric car’s battery last? Apr 2014. Available:
http://www.hybridcars.com/how-long-will-an-evs-battery-last/
[44] GAS2, Canadian study shows EV range anxiety is real, Oct 2015. Available:
http://gas2.org/2015/10/02/canadian-study-shows-ev-range-anxiety-is-real/
[45] WIRED, Charging time, not range, is the biggest EV issue, Aug 2013. Available:
http://www.wired.com/2013/08/current-affair-4/
[46] EV Obsession, Tesla Range and Seasonality. Available: http://evobsession.com/tesla-range-
seasonality/
[47] Scientific American, Electric Car Owners Struggle to Find a Charge, July 2015. Available:
http://www.scientificamerican.com/article/electric-car-owners-struggle-to-find-a-charge/
[48] The Wall Street Journal, Inventions without Government and the Physics of Cars, Sep 2013.
Available: http://www.wsj.com/articles/SB10001424052702304713704579091380122734934
[49] The Wall Street Journal, Consumer Reports spends its juice badly, Aug 2015. Available:
http://www.wsj.com/articles/consumer-reports-spends-its-juice-badly-1440803078
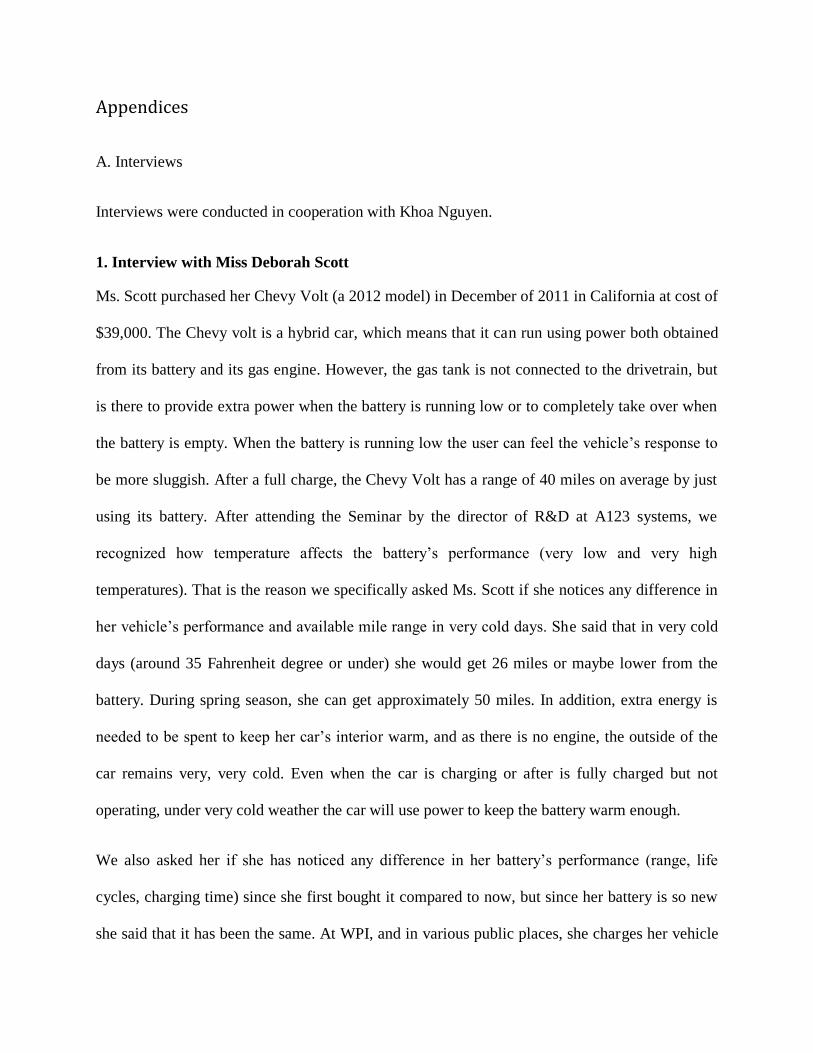
Appendices
A. Interviews
Interviews were conducted in cooperation with Khoa Nguyen.
1. Interview with Miss Deborah Scott
Ms. Scott purchased her Chevy Volt (a 2012 model) in December of 2011 in California at cost of
$39,000. The Chevy volt is a hybrid car, which means that it can run using power both obtained
from its battery and its gas engine. However, the gas tank is not connected to the drivetrain, but
is there to provide extra power when the battery is running low or to completely take over when
the battery is empty. When the battery is running low the user can feel the vehicle’s response to
be more sluggish. After a full charge, the Chevy Volt has a range of 40 miles on average by just
using its battery. After attending the Seminar by the director of R&D at A123 systems, we
recognized how temperature affects the battery’s performance (very low and very high
temperatures). That is the reason we specifically asked Ms. Scott if she notices any difference in
her vehicle’s performance and available mile range in very cold days. She said that in very cold
days (around 35 Fahrenheit degree or under) she would get 26 miles or maybe lower from the
battery. During spring season, she can get approximately 50 miles. In addition, extra energy is
needed to be spent to keep her car’s interior warm, and as there is no engine, the outside of the
car remains very, very cold. Even when the car is charging or after is fully charged but not
operating, under very cold weather the car will use power to keep the battery warm enough.
We also asked her if she has noticed any difference in her battery’s performance (range, life
cycles, charging time) since she first bought it compared to now, but since her battery is so new
she said that it has been the same. At WPI, and in various public places, she charges her vehicle
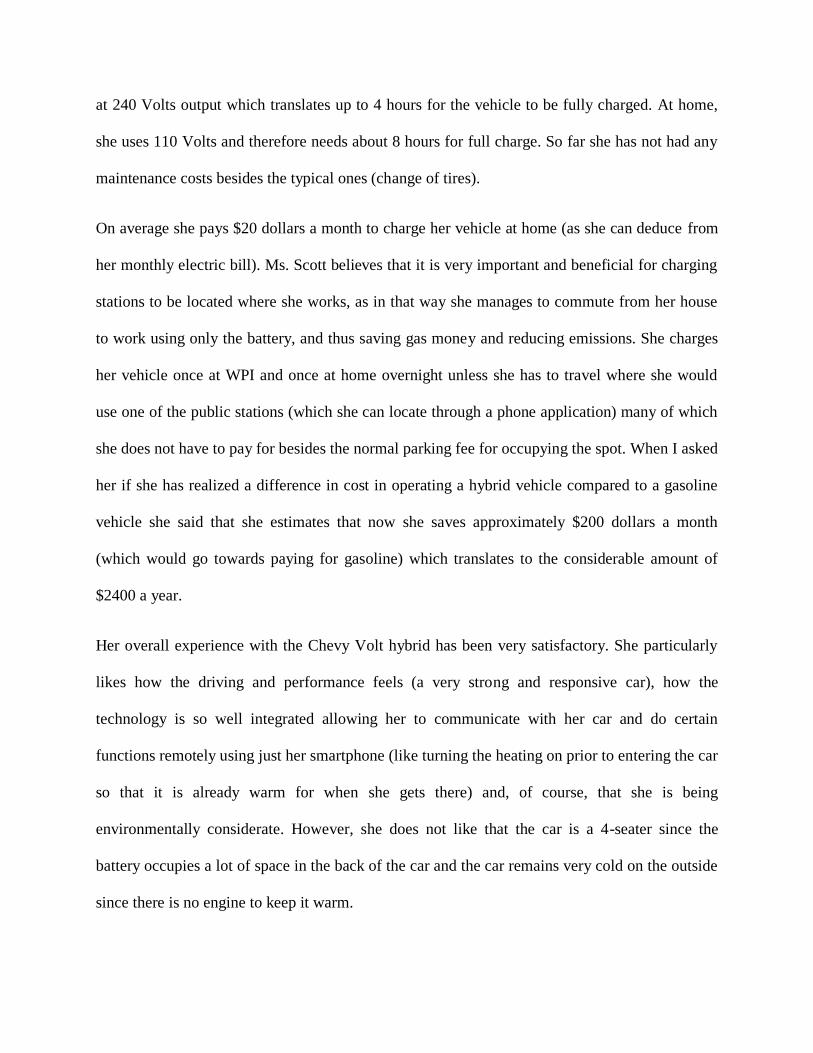
at 240 Volts output which translates up to 4 hours for the vehicle to be fully charged. At home,
she uses 110 Volts and therefore needs about 8 hours for full charge. So far she has not had any
maintenance costs besides the typical ones (change of tires).
On average she pays $20 dollars a month to charge her vehicle at home (as she can deduce from
her monthly electric bill). Ms. Scott believes that it is very important and beneficial for charging
stations to be located where she works, as in that way she manages to commute from her house
to work using only the battery, and thus saving gas money and reducing emissions. She charges
her vehicle once at WPI and once at home overnight unless she has to travel where she would
use one of the public stations (which she can locate through a phone application) many of which
she does not have to pay for besides the normal parking fee for occupying the spot. When I asked
her if she has realized a difference in cost in operating a hybrid vehicle compared to a gasoline
vehicle she said that she estimates that now she saves approximately $200 dollars a month
(which would go towards paying for gasoline) which translates to the considerable amount of
$2400 a year.
Her overall experience with the Chevy Volt hybrid has been very satisfactory. She particularly
likes how the driving and performance feels (a very strong and responsive car), how the
technology is so well integrated allowing her to communicate with her car and do certain
functions remotely using just her smartphone (like turning the heating on prior to entering the car
so that it is already warm for when she gets there) and, of course, that she is being
environmentally considerate. However, she does not like that the car is a 4-seater since the
battery occupies a lot of space in the back of the car and the car remains very cold on the outside
since there is no engine to keep it warm.
2. Interview with Professor John Orr
From our meeting with Professor Orr, we obtained some more technical information on the
specifics of how electricity transmits from the generator in the factory to the charging station that
is directly connected to the electric or hybrid vehicle. A mechanical (usually rotating) device,
called the generator, is used in the factory to generate the electricity and from there it passes
through a transformer and a transmitter where its voltage ranges between 69 and 500 kV. Then it
passes through another transformer which lowers the voltage somewhere between 6 and 50 kV,
the typical value is 13.8 kV, to end up to a distributor. From there it passes through another
transformer which brings it down to 120V, 240V or 480V depending on the type of the charging
station and then it is used to charge the vehicle. Therefore, one very important consideration is
how to minimize transmission losses while delivering high power. They are estimated to be on
average about 10% from end-to-end (so from the output voltage value of the generator to the
output transformer value of the charging station). The 480V, being at a higher voltage, gives out
more power than the rest of the voltage output values. Some other topics that came up from our
discussion with Professor Orr was the ‘Smart Grid’ which refers to the effort to reduce
generating stations and replacing them with distributors. Also the efficiency of the charger in its
connectivity with the battery. How to store the energy efficiently using a pump hydro and a
reservoir located on a hill in which case the potential energy of the falling water is used to
generate electricity. Also environmental concerns arise with issues like producing the battery,
disposing of it, and, of course, generating the electricity for it. One thing is for sure, as Professor
Orr says, that if the electricity for the battery comes from a coal-powered plant then it is ‘dirtier’
than simply using gasoline vehicles.
3. Interview with Miss Liz Tomaszewski
From our meeting with Ms. Liz Tomaszewski we obtained the following information based on
our questions. There are currently two fully functional EV charging stations located on the WPI
campus. They are both duals, meaning that each has two parking positions so that two vehicles
can use the station to recharge at the same time. However, not all four spots are active (or live)
so there are three spots, in total, available for recharge use. The first charging station, located
next to Goddard Hall, was built in April of 2012 from Coulomb Manufacture and the second one
which is located at parking garage on Park Avenue was introduced to the campus in January of
2013 and was made by the same manufacturer. WPI received a grant which covered the
infrastructure, implementation, maintenance, and any charging costs for those two charging
stations and therefore the user is not required to pay anything for using the station . Both stations
have similar technical specifications (AC Type 2) with a charging output of 240 volts which
translates to an average time of four hours to fully charge an electric vehicle. The two charging
stations are not connected with each other; however they do use the same electricity grid.
The daily power consumption to use the charging station, according to Ms. Tomaszewski’s
estimations, is $0.65 per user , and is considered a negligible amount which further justifies the
fact that no charge fee is required from the user. Also, note that the charging stations are
available to the whole public and not just the WPI community.
Now, when it comes to organizational issues and whether or not they EV owners are able to
always use the stations, the statistics (obtained from a special application by chargepoint which
shows relative daily usage, trends in the usage of the charging stations and other useful data)
show that WPI is on average at half capacity and has never been on full capacity. What this
practically means is that on a daily basis, for example, an average of two people will use the
charging stations. Therefore, as Ms. Tomaszewski says there is no current need to open up the
fourth available charging spot. Through the Chargepoint network EV users are able to be
informed when their vehicle is done charging. Finally Ms. Tomaszewski says that in case
demand rises then the fourth charging spot will be available, and if it is further needed a new
charging station will be implemented (a superfast one is also a possibility). However, there have
been occurrences where non-EV’s have been found to be occupying charging spots. Those
instances fall under the campus police authorities to give tickets and maintain order. Last but not
least, after our request on the specific daily (permanent) number of EV’s that use the WPI
charging stations, Ms. Tomaszewski contacted WPI police which informed her that there is only
one registered (a Chevy Volt).