Embed Size (px)
Citation preview
ISSN 1977-8449
Electric vehicles from life cycle and circular economy perspectives TERM 2018: Transport and Environment Reporting Mechanism (TERM) report
EEA Report No 13/2018

Electric vehicles from life cycle and circular economy perspectives TERM 2018: Transport and Environment Reporting Mechanism (TERM) report
EEA Report No 13/2018

Legal noticeThe contents of this publication do not necessarily reflect the official opinions of the European Commission or other institutions of the European Union. Neither the European Environment Agency nor any person or company acting on behalf of the Agency is responsible for the use that may be made of the information contained in this report.
Copyright notice© European Environment Agency, 2018Reproduction is authorised provided the source is acknowledged.
More information on the European Union is available on the Internet (http://europa.eu).
Luxembourg: Publications Office of the European Union, 2018
ISBN 978-92-9213-985-8ISSN 1977-8449doi:10.2800/77428
European Environment AgencyKongens Nytorv 61050 Copenhagen KDenmark
Tel.: +45 33 36 71 00Web: eea.europa.euEnquiries: eea.europa.eu/enquiries
Cover design: EEACover photo: © EEA

Contents
3
Contents
Electric vehicles from life cycle and circular economy perspectives
Acknowledgements .................................................................................................................... 5
Executive summary .................................................................................................................... 6
1 Introduction ......................................................................................................................... 101.1 Electric vehicles — vehicle types ........................................................................................101.2 Electric vehicles — current and future roles ......................................................................111.3 Importance of a life cycle and circular economy perspective .........................................111.4 Objective and key outputs of this report............................................................................131.5 Report structure ...................................................................................................................13
2 Raw materials stage ............................................................................................................ 142.1 Introduction ...........................................................................................................................142.2 Environmental impacts .........................................................................................................152.3 Challenges for raw material supply and processing ........................................................172.4 Circular economy perspectives ...........................................................................................202.5 Summary: minimising the environmental impacts of raw materials .............................21
3 Production stage ................................................................................................................. 223.1 Introduction ...........................................................................................................................223.2 Overview of production impacts .........................................................................................243.3 Factors affecting the environmental impacts of production ...........................................273.4 Summary: minimising the environmental impacts of BEV production ..........................29
4 Use stage .............................................................................................................................. 304.1 Introduction ...........................................................................................................................304.2 Greenhouse gas emissions ..................................................................................................324.3 Health impacts ......................................................................................................................334.4 Ecosystem impacts ................................................................................................................364.5 Factors affecting battery electric vehicle energy consumption and impacts of electricity generation ............................................................................................................374.6 The role of electric vehicles in personal mobility ..............................................................434.7 Summary: minimising the environmental impacts of BEV use .......................................45
5 End-of-life stage ................................................................................................................... 465.1 Introduction ...........................................................................................................................465.2 Current end-of-life processes ..............................................................................................46
Contents
4 Electric vehicles from life cycle and circular economy perspectives
5.3 Future end-of-life needs .......................................................................................................485.4 Future reuse and recycling ...................................................................................................485.5 Environmental impacts of end-of-life stage .......................................................................535.6 Summary: minimising environmental impacts of the end-of-life stage .......................56
6 Summary of key findings .................................................................................................... 576.1 Climate change impacts ......................................................................................................576.2 Health impacts ......................................................................................................................586.3 Ecosystem impacts ...............................................................................................................596.4 Synergies with the circular economy .................................................................................60
7 Concluding remarks ............................................................................................................ 62
Abbreviations, symbols and units .......................................................................................... 63
Glossary ...................................................................................................................................... 66
References ................................................................................................................................. 68

5
Acknowledgements
Electric vehicles from life cycle and circular economy perspectives
Acknowledgements
The Transport and Environment Reporting Mechanism (TERM) process is steered jointly by the European Environment Agency (EEA) and the European Commission (Eurostat, Directorate-General for Environment, Directorate-General for Mobility and Transport, and Directorate-General for Climate Action).
This report was prepared by the EEA, based upon a draft assessment by the European Topic Centre on Air Pollution and Climate Change Mitigation (ETC/ACM). The ETC/ACM contribution was led by Alison Pridmore (Aether, United Kingdom), supported by Kathryn Hampshire, Richard German (Aether) and Jaume Fons (UAB).
The EEA project manager was Andreas Unterstaller.
Almut Reichel, Anke Lükewille, Eulalia Peris, Magdalena Jozwicka, Martin Adams (all EEA) and Simone Manfredi (European Commission, Joint Research Centre) are thanked for their input to this year's report.
We gratefully acknowledge comments on the draft version of this report received from EEA member countries and the European Commission.
Executive summary
66
Executive summary
Electric vehicles from life cycle and circular economy perspectives
Executive summary
TERM 2018 — a focus on electric vehicles from life cycle assessment and circular economy perspectives
Electric vehicles are anticipated to be a key future component of Europe's mobility system, helping reduce impacts on climate change and air quality. Battery electric vehicles (BEVs) comprised around 0.6 % of all new car registrations in the EU in 2017 (EEA, 2018a). By 2030, BEVs could be between 3.9 % and 13.0 % of new car registrations, depending on the EU-wide fleet average CO2 target levels set for passenger cars in the future (EC, 2017a).
There is, therefore, an increasing need to understand BEVs from a systems perspective. This involves an in-depth consideration of the environmental impact of the product using life cycle assessment (LCA) as well as taking a broader 'circular economy' approach. On the one hand, LCA is a means of assessing the environmental impact associated with all stages of a product's life from cradle to grave: from raw material extraction and processing to the product's manufacture to its use in everyday life and finally to its end of life. On the other hand, the concept of a circular economy considers impacts and in turn solutions across the whole societal system. In a traditional linear economy products are made, used and then disposed of, whereas in a circular economy the value of materials and products is kept as high as possible for as long as possible (EEA, 2017b). This, in turn, helps reduce requirements for new materials and energy needs, ameliorating environmental pressures. Additional aspects that can be considered within the circular economy concept (e.g. Jackson, 2017; Kopnina, 2017; Ellen MacArthur Foundation, 2018) include the use of renewable energy and sustainable consumption, e.g. through the shared ownership of goods. Reflecting their relevance to BEVs, these additional aspects are also considered in this report.
The aims of this report are to:
• bring together existing evidence on the environmental impact of BEVs across the stages of their life cycle, undertaking where possible comparison with internal combustion engine vehicles (ICEVs);
• consider how a move to a circular economy could reduce these impacts.
Key findings
For the purposes of this report, environmental impacts are grouped under the following themes:
• climate change;
• health impacts;
• ecosystem impacts.
These are considered in turn below. Although a number of LCA studies were reviewed for this report, providing a quantitative comparison using an up-to-date synthesised dataset is not possible given the different coverage and approaches used in the studies. To provide an internally consistent and comparative summary in graphical form, we present results from Hawkins et al. (2013) (1), who analysed a broad range of environmental impacts, with vehicle types, life stages and geographic coverage that are well matched to the scope of this report.
Climate change impacts
Overall, across its life cycle, a typical BEV in Europe offers a reduction in greenhouse gas (GHG) emissions compared with its ICEV equivalent
(1) The LCA performed in Hawkins et al. (2013) was based on compact/mid-sized passenger cars: the BEV was based on a Nissan LEAF, the petrol ICEV on a Mercedes A 170, and the diesel ICEV on an average of Mercedes A 160 and A 180, which have comparable size, mass and performance characteristics. Use phase energy requirements were based on the New European Driving Cycle (NEDC). A lifetime mileage of 150 000 km was assumed for all vehicles, with the BEV battery lasting for the whole vehicle lifetime. Impacts were normalised relative to the vehicle with the highest impact, which received a score of 1. The results for a BEV with lithium-nickel-cobalt-manganese (NCM) battery chemistry are presented in all charts.
Executive summary
7 Electric vehicles from life cycle and circular economy perspectives
(e.g. Hawkins et al, 2013; ICCT, 2018b). The extent of the difference can depend on a number of factors, including the size of vehicle considered, the electricity mix and whether the BEV is compared with a petrol or diesel conventional vehicle. Hawkins et al. (2013) reported life-cycle GHG emissions from BEVs charged using the average European electricity mix, 17-21 % and 26-30 % lower than similar diesel and petrol vehicles, respectively (detailed in Figure 6.1). This is broadly in line with more recent assessments based on the average European electricity mix (e.g. Ellingsen et al., 2016; Ellingsen and Hung, 2018).
GHG emissions from raw material and production LCA phases are typically higher for a BEV than for its ICEV equivalent. This is related to the energy requirements for raw material extraction and processing as well as producing the batteries. For the end-of-life stage GHG emissions from both BEVS and ICEVS are low in terms of the overall life cycle (Hawkins et al., 2013; Tagliaferri et al., 2016); however, there is much uncertainty around the data. The potential for reuse and recycling of vehicle components is a key area of further research and development.
The largest potential reduction in GHG emissions between a BEV and an ICEV occurs in the in-use phase, which can more than offset the higher impact of the raw materials extraction and production phases. However, the extent to which the GHG emissions advantage is realised during the in-use stage of BEVs depends strongly on the electricity mix. BEVs charged with electricity generated from coal currently have higher life-cycle emissions than ICEVs, whereas the life-cycle emissions of a BEV could be almost 90 % lower than an equivalent ICEV (IEA, 2017a) using electricity generated from wind power. In future, with greater use of lower carbon electricity in the European mix the typical GHG emissions saving of BEVs relative to ICEVs will increase.
Human health impacts
The health impacts considered include air pollution, noise exposure and 'human toxicity'. The first two are particular relevant for BEVs and are therefore considered in detail, despite not aligning neatly with the impact categories commonly reported in LCAs.
BEVs can offer local air quality benefits due to zero exhaust emissions, e.g. nitrogen oxides (NOx) and particulate matter (PM). However, BEVs still emit PM locally from road, tyre and brake wear, as all motor vehicles do. For local PM emissions, there is a great deal of uncertainty and variation in the results, depending on the assumptions made around ICEV emissions and on the different estimation methods
for non-exhaust emissions. In addition, electricity generation also produces emissions. Here, the spatial location of emissions is important. Where power stations are located away from population centres, replacing ICEVs with BEVs is likely to lead to an improvement in urban air quality, even in contexts in which the total emissions of the latter may be greater (e.g. Soret et al., 2014). Under these circumstances, the contribution of power stations to regional background levels of air pollution, which also affect the air quality in cities, will probably be outweighed by a reduction in local emissions. As the proportion of renewable electricity increases and coal combustion decreases in the European electricity mix (EC, 2016) the advantage in terms of air quality of BEVs over ICEVS is likely to increase in tandem (e.g. Öko-Institut and Transport & Mobility Leuven, 2016).
In relation to noise pollution, the available literature considered in this report relates only to the use stage. The difference in noise emissions between BEVs and ICEVs strongly depends on vehicle speed. Reflecting this, modelling studies have shown benefits of passenger car fleet electrification in terms of exposure to, and annoyance from, noise in urban areas where speeds are generally low and traffic is frequently stationary (RIVM, 2010; Campello-Vicente et al., 2017). However, there is unlikely to be a large benefit on rural roads or motorways where speeds are higher. The extent of noise reduction will also depend strongly on the proportion of BEVs in the vehicle fleet (UBA-DE, 2013). However, proposals for acoustic vehicle alerting systems (AVASs) on BEVs to mitigate road safety concerns would probably reduce the potential of BEVs to reduce traffic noise.
The literature on human toxicity impacts is limited in comparison to that on climate change impacts. However, it suggests that BEV impacts could be higher overall than their ICEV equivalents (e.g. Nordelöf et al., 2014; Borén and Ny, 2016). Existing research suggest that the larger impact of BEVs results from additional copper (and, where relevant, nickel) requirements.
Ecosystem impacts
The ecosystem impacts of BEVs can be higher or lower than ICEVs, depending on the individual impact. The effects of BEVs on freshwater ecotoxicity and eutrophication can be higher than for ICEVs because of the impacts associated with mining and processing metals and mining and burning coal to produce electricity (e.g. Hawkins et al., 2013). The proportion of low-carbon electricity generation (and associated reductions in coal production) is expected to increase both in Europe and in key battery production locations
Executive summary
8 Electric vehicles from life cycle and circular economy perspectives
in the future, e.g. China, South Korea and Japan (EC, 2016; ICCT, 2018b), which will help to reduce these impacts.
Synergies with the circular economy
BEVs offer important opportunities to reduce GHG emissions and local air pollution. However, as described above, there is also the potential for increased impacts in other areas, in particular higher human toxicity- and ecosystem-related impacts. However, the environmental impacts of BEVs, and their advantages or disadvantages relative to ICEVs, are influenced by a range of key variables associated with vehicle design, vehicle choice and use patterns, reuse and recycling and the electricity generation mix. Promoting a circular economy approach presents opportunities to influence the future trajectories of these key variables by offering incentives for improvement, which will increase the benefits and reduce the negative impacts of BEVs.
For vehicle design, the most important component determining environmental impact is the battery. Here, standardisation of battery design could play a key role in helping ensure future battery reuse and recycling. Complementing this are designs that allow reduced inputs of raw materials alongside using alternatives at the very start of the process.
Consumer expectations with regard to vehicle range will be key to future battery development. Larger (heavier) batteries provide greater energy storage and in turn vehicle range, and typically this increased vehicle range helps address consumer anxiety around using BEVs. However, larger batteries require a greater quantity of raw materials and energy to produce, resulting in greater environmental impacts across all categories (UBA-DE, 2016), and the extra weight also leads to higher in-use energy requirement per kilometre. Impacts across the life cycle will be minimised if the automotive industry is incentivised to provide vehicles with modest ranges with ever-smaller batteries, as opposed to ever increasing ranges and associated increasing battery size. The density of the charging network and the time it takes to charge a BEV are also important factors affecting consumers' range expectations.
To maximise vehicle range there is also an emphasis on the use of lighter materials in the vehicles, e.g. carbon composites. This can reduce use-stage energy consumption, but it can come at the cost of higher impacts during the production phase and lower recyclability of materials (Egede, 2017). In terms of overall impacts, when there is a trade-off between impacts in the use stage and those in other stages, the
lifetime mileage of the BEV then becomes important. The higher the lifetime mileage of a vehicle, the lower the influence of production-related impacts.
Lifetime mileage is itself, in part, a question of vehicle design. Lifetime mileage will be maximised if durability and ease of maintenance are prioritised in the design of individual components (especially the battery) and throughout the vehicle as a whole.
For vehicle use, the research highlighted that robust evidence on annual mileage, trip purpose and lifetime mileage is currently limited because consumer uptake of BEVs was very low until relatively recently. Future research on this topic could make use of data from national travel surveys and periodic roadworthiness tests, the latter being mandatory across the EU. BEVs could help transition society to a more sustainable form of mobility. Here, shared mobility could play a role for a number of reasons. First, it enables testing of electric vehicles, which has been shown to reduce range anxiety. This in turn could have impacts in terms of expectations of vehicle range and as a result allow the use of lighter, 'lower' energy batteries with the associated GHG reductions in the production phase. Second, shared mobility, especially where it allows consumers access to a range of vehicles, could help ensure the choice of the most appropriate car for their needs. Third, while BEVs have an important role to play in terms of future mobility, it is essential to consider the role of BEVs alongside public transport and active travel (i.e. walking and cycling) modes.
Reuse and recycling need to be 'designed in' to vehicles from the start. New processes need to be considered in the context of future access to rare earth elements (REEs) and steps taken to fully understand the barriers and opportunities for second-life applications and remanufacturing of batteries. There is a need to better understand the use of carbon composites and future recycling needs.
The role of low-carbon electricity sources is important across all life-cycle stages to facilitate achieving the full GHG reduction potential from the use of BEVs. While this has the greatest impact in the in-use stage, it also relates to the raw material extraction and production stages, which involve energy-intensive processes. A reduction in the use of coal has further benefits in terms of reducing human ecotoxicity and the ecosystem impacts associated with coal mining and combustion. Related to this, the proportion of renewable generation sources in the electricity mix is expected to rise over the coming decades both in the EU (where BEVs are used) and in key cell and battery manufacturing locations outside the EU (Huo et al., 2015; EC, 2016). Furthermore, as the BEV

Executive summary
9 Electric vehicles from life cycle and circular economy perspectives
fleet grows, it will be essential that BEV charging patterns are managed in a way that can take advantage of renewable and other low-carbon electricity sources and avoids causing high peak electricity demand. There is also ongoing research around the feasibility
of BEV batteries playing an active role in the electricity grid, to store excess renewable power and provide grid-stabilising services, either while BEVs are plugged in or as a second-life use of the batteries.
Introduction
1010
Introduction
Electric vehicles from life cycle and circular economy perspectives
1 Introduction
Through the Transport and Environment Reporting Mechanism (TERM) report, the EEA has been monitoring progress in integrating environmental objectives in transport since 2000. The TERM report provides information to the EEA's member countries, the EU and the public.
The TERM includes several indicators used for tracking the short- and long-term environmental performance of the transport sector and for measuring progress towards meeting key transport-related policy targets. Since 2017, the indicator-based assessment component of the TERM report has been published as a separate briefing.
The EU Seventh Environment Action Programme (7th EAP) sets out a clear vision: 'In 2050, we live well, within the planet's ecological limits. Our prosperity and healthy environment stem from an innovative, circular economy where nothing is wasted and where natural resources are managed sustainably, and biodiversity is protected, valued and restored in ways that enhance our society's resilience' (EU, 2013). To achieve this vision, environmental pressures arising from all sectors of the economy should be significantly reduced. As one of the key economic sectors, reducing the environmental and climate pressures arising from Europe's transport sector will be critical in achieving the 7th EAP's longer term objectives.
There are high expectations for new passenger vehicle technologies, and increasingly for electric vehicles, to reduce these environmental pressures. This reflects the fact that, historically, passenger vehicles have dominated emissions in the transport sector and that road vehicles have shorter development times and lifetimes than aircraft, trains and ships (Skinner et al., 2010). Development and market penetration of new passenger vehicle technologies is therefore easier to achieve than for other modes of transport (Skinner et al., 2010) and offers greater reductions in CO2 and air pollutant emissions.
In 2016, the EEA published a summary of the key information on electric road vehicles in Europe (EEA, 2016a), explaining the different types that are now available, how each type works and their
respective advantages and disadvantages. The EEA has also published briefings (EEA, 2016b, 2017a) and commissioned research into the future impacts of electric vehicles on the energy and environment (Öko-Institut and Transport & Mobility Leuven, 2016) This report builds on this previous research by considering the environmental aspirations for electric vehicles from the perspectives of life cycle assessment and the circular economy.
1.1 Electric vehicles — vehicle types
There are several different electric vehicle types (EEA, 2016a) including:
• Battery electric vehicles (BEVs) are powered solely by an electric motor, using electricity stored in an on-board battery.
• Plug-in hybrid electric vehicles (PHEVs) are powered by an electric motor and an internal combustion engine that work together or separately.
• Range extended electric vehicles (REEVs) have a serial hybrid configuration in which their internal combustion engine has no direct link to the wheels. Instead the combustion engine acts as an electricity generator and is used to power the electric motor or recharge the battery when it is low. The battery can also be charged from the grid.
• Hybrid electric vehicles (HEVs) combine an internal combustion engine and an electric motor that assists the conventional engine, for example during vehicle acceleration.
• Fuel cell electric vehicles (FCEVs) are entirely propelled by electricity. The electric energy is provided by a fuel cell 'stack' that uses hydrogen from an on-board tank combined with oxygen from the air.
The emphasis in this report is on BEVs, reflecting the focus in the literature. Where relevant literature is available, reference is made to the other vehicle types.
Introduction
11 Electric vehicles from life cycle and circular economy perspectives
1.2 Electric vehicles — current and future roles
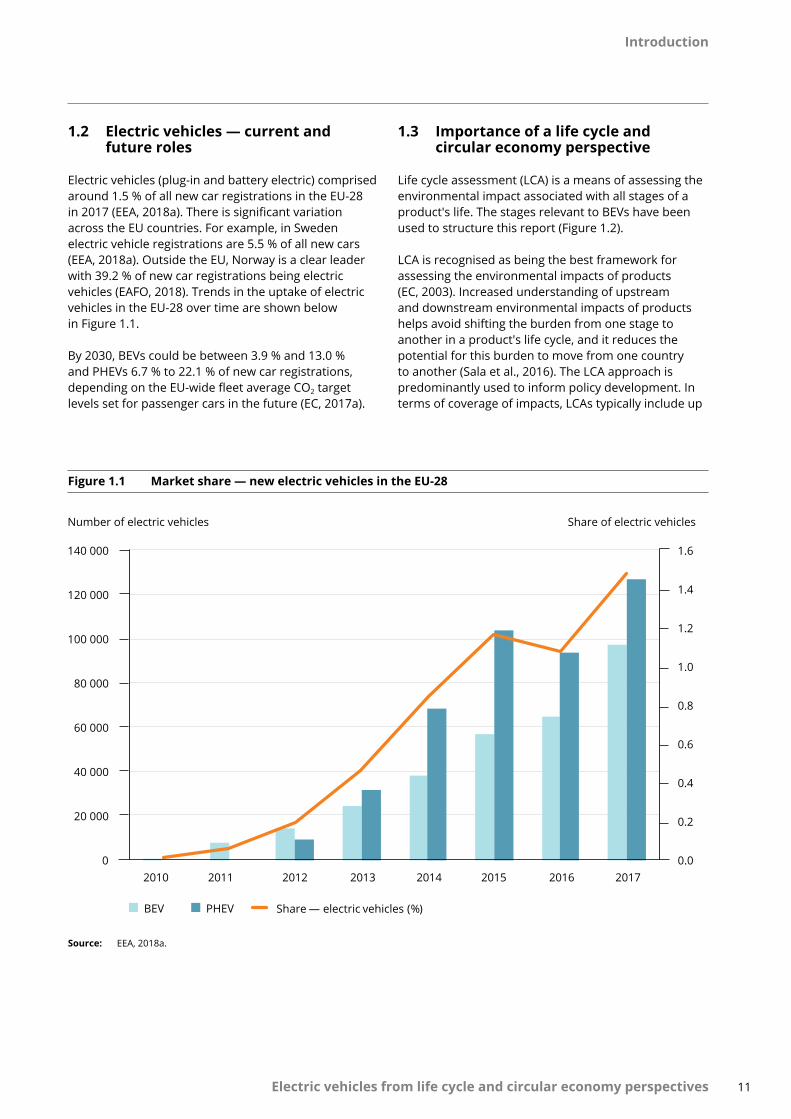
Electric vehicles (plug-in and battery electric) comprised around 1.5 % of all new car registrations in the EU-28 in 2017 (EEA, 2018a). There is significant variation across the EU countries. For example, in Sweden electric vehicle registrations are 5.5 % of all new cars (EEA, 2018a). Outside the EU, Norway is a clear leader with 39.2 % of new car registrations being electric vehicles (EAFO, 2018). Trends in the uptake of electric vehicles in the EU-28 over time are shown below in Figure 1.1.
By 2030, BEVs could be between 3.9 % and 13.0 % and PHEVs 6.7 % to 22.1 % of new car registrations, depending on the EU-wide fleet average CO2 target levels set for passenger cars in the future (EC, 2017a).
Figure 1.1 Market share — new electric vehicles in the EU-28
0.0
0.2
0.4
0.6
0.8
1.0
1.2
1.4
1.6
0
20 000
40 000
60 000
80 000
100 000
120 000
140 000
2010 2011 2012 2013 2014 2015 2016 2017
Share of electric vehiclesNumber of electric vehicles
BEV PHEV Share — electric vehicles (%)
Source: EEA, 2018a.
1.3 Importance of a life cycle and circular economy perspective
Life cycle assessment (LCA) is a means of assessing the environmental impact associated with all stages of a product's life. The stages relevant to BEVs have been used to structure this report (Figure 1.2).
LCA is recognised as being the best framework for assessing the environmental impacts of products (EC, 2003). Increased understanding of upstream and downstream environmental impacts of products helps avoid shifting the burden from one stage to another in a product's life cycle, and it reduces the potential for this burden to move from one country to another (Sala et al., 2016). The LCA approach is predominantly used to inform policy development. In terms of coverage of impacts, LCAs typically include up

Introduction
12 Electric vehicles from life cycle and circular economy perspectives
Figure 1.2 Life cycle assessment stages used in this report
Mining of raw materials
Processing to usable form
Manufacturing of components
Production
Use
Vehicle end of life
Raw materials
Production
to 16 categories (e.g. US EPA, 2013; Sala et al., 2017), including climate change, ozone depletion, ecotoxicity and resource depletion. For the purposes of this report, environmental impacts are grouped under the following themes:
• climate change;
• health impacts, particularly focused on:
– 'human toxicity';
– air quality impacts on health with a focus on nitrogen oxides (NOx) and particulate matter (PM), e.g. in relation to;
• ecosystem impacts, including:
– freshwater ecotoxicity.
These themes reflect the key topics covered in the LCA literature on electric vehicles. Furthermore, detailed consideration of the climate change- and air quality-related health impacts was seen as pertinent, given the expectations that electric vehicles will help to address these challenges.
The concept of a circular economy is complementary to key aspects as they relate to LCA, considering impacts and in turn solutions across the relevant system. The circular economy is an alternative to the traditional linear economy, which focuses on make, use and dispose.
'Central to the concept is that the value of materials and products is kept as high as possible for as long as possible' (EEA, 2017b).
This helps to reduce new material input and energy needs throughout a product's life cycle. The benefits are usually higher for what can be considered 'inner circle' approaches — reuse, repair, redistribution, refurbishment and remanufacturing — than for recycling and energy recovery (EEA, 2017b). This is due to losses during collection and processing and to degradation of material quality during recycling.
Relevant aspects of this 'closed loop system' include (EEA, 2017b; Ellen MacArthur Foundation, 2018):
• products designed to reduce waste and pollution;
• keeping products and materials in use for as long as possible/feasible;
• remanufacturing and recycling of goods.
A stronger circular economy can result in decoupling rising prosperity (e.g. in terms of gross domestic product) from increases in resource consumption; this goes beyond incremental efficiency gains to deliver substantial change (Preston, 2012). As well as environmental advantages, this can also offer economic benefits, contributing to innovation, growth and job creation.
In December 2015, the European Commission introduced the EU action plan for the circular economy, which addressed the whole product life cycle from design and production through consumption to waste management. This action plan forms part of the circular economy package, which includes proposals to revise key elements of the EU waste acquis (accumulated legislation, legal acts and court decisions as they relate to EU law) including directives on end-of-life vehicles and batteries. In January 2018, the European Commission updated the circular economy package with a new set of measures including a Europe-wide strategy for plastics, a monitoring framework on progress towards a circular economy, and a report on critical raw materials and the circular economy.
There are additional aspects (e.g. Jackson, 2017; Kopnina, 2017; Ellen MacArthur Foundation, 2018) that can be considered within the circular economy concept and these are:
Introduction
13 Electric vehicles from life cycle and circular economy perspectives
• regeneration of nature systems — providing a focus on natural capital;
• use of renewable energy;
• sustainable consumption, e.g. through shared ownership of goods.
This report purposefully considers these aspects too, reflecting, for example, the synergies between renewable energy and the powering of electric vehicles and the opportunities that shared ownership can offer in enabling consumers to use lower impact vehicles for their day-to-day needs.
1.4 Objective and key outputs of this report
The key objectives of this report are to:
• bring together existing evidence on the environmental impact of BEVs across the life cycle stages and, where possible, compare them with ICEVs;
• consider how a move to a circular economy could reduce these current impacts.
Key messages and overarching themes in the existing research are detailed in the report. The work has also helped identify gaps in current knowledge and future research needs. Key outputs are as follows:
• Research findings on environmental impacts from the different life cycle stages of electric vehicles
are brought together in the context of the circular economy.
• In-depth consideration is given to the production stages and end-of-life stages of electric vehicles. There is currently less information in the literature on these stages than on the use stage.
• Recommendations to ensure that electric vehicles contribute their true potential to environmental goals are detailed. This is particularly pertinent given the expectations that electric vehicles will help to achieve air quality and climate change goals.
• These recommendations consider how a move to a circular economy could reduce these impacts. Existing synergies and areas where there are further opportunities are highlighted.
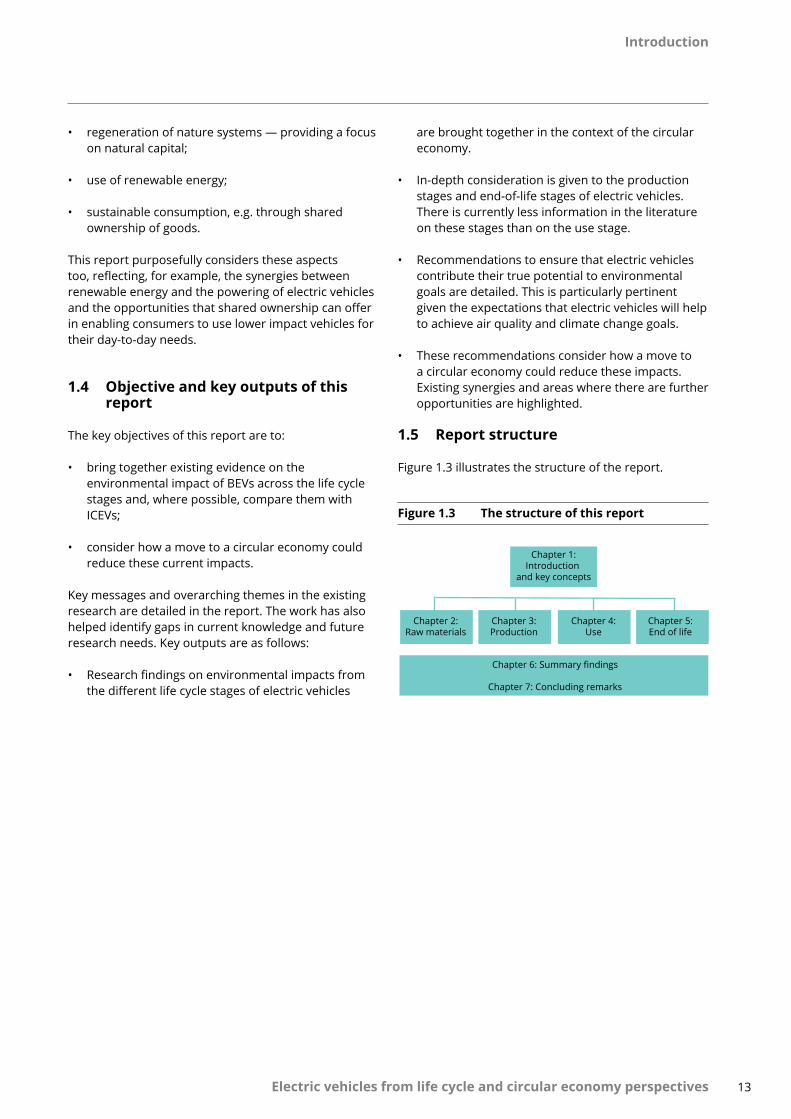
1.5 Report structure
Figure 1.3 illustrates the structure of the report.
Figure 1.3 The structure of this report
Chapter 2:Raw materials
Chapter 3:Production
Chapter 6: Summary findings
Chapter 7: Concluding remarks
Chapter 4:Use
Chapter 5:End of life
Chapter 1:Introduction
and key concepts
Raw materials stage
1414
Raw materials stage
Electric vehicles from life cycle and circular economy perspectives
2 Raw materials stage
• Electric vehicles (in relation to the battery and electric traction motor) use more copper and potentially nickel, as well as critical raw materials and REEs, than conventional vehicles.
• 'Lightweighting' of vehicles (ICEVs and BEVs) may result in increased use of carbon composites and aluminium in future, resulting in higher energy use.
• Issues concerning critical raw materials (CRM) and REEs include potential future resource constraints linked to their (typically) high-risk supply, e.g. due to limited geographical availability. This could result in economic impacts because of the (vast) growing demand for these materials compared with their supply. This may substantially influence the price of batteries and have an impact on the attractiveness of electric vehicles.
• LCA highlights the high energy use and associated GHG emissions related to material extraction as well as potentially negative health and ecosystem impacts.
• From a circular economy perspective the following aspects are of importance:
– design: through, for example, material substitution;
– keeping products in use and ensuring their most efficient use;
– considering the impacts from a natural capital perspective.
2.1 Introduction
This chapter looks at the key environmental impacts, issues and challenges associated with the supply of raw materials for producing BEVs. The scope includes the processes of obtaining metals, plastics and other materials used in vehicles and their components. The impacts arising from later stages of vehicle production are discussed in Chapter 3 — Production stage impacts.
Production of BEVs requires a range of raw materials. Compared with an ICEV, the main differences in the materials required arise from the battery, power electronics and electric motor in a BEV. These components contain substantial amounts of base metals such as copper (a BEV can use on average four times as much copper than an ICEV; Transport and Environment, 2017a), aluminium and iron, but also CRMs. The EU defines CRMs as materials that have high economic importance but also a high-risk supply
(Erdmann et al., 2015, Blengini et al., 2017, EC, 2018a). CRMs, including REEs, are more abundant in electric vehicles than in ICEVs (Mathieux et al., 2017). These materials require energy-intensive extraction and refining processes (Gradin et al., 2018).
Currently, for the BEV body and auxiliary systems, in many cases the same materials and similar quantities are used as for ICEVs for BEV models adapted directly from an ICEV model. However, because of the importance of maximising vehicle range for BEVs, in some cases BEV bodies are specifically designed using more lightweight materials such as aluminium, carbon fibre and plastic composites. Known as 'lightweighting', this process may become increasingly important in the future.
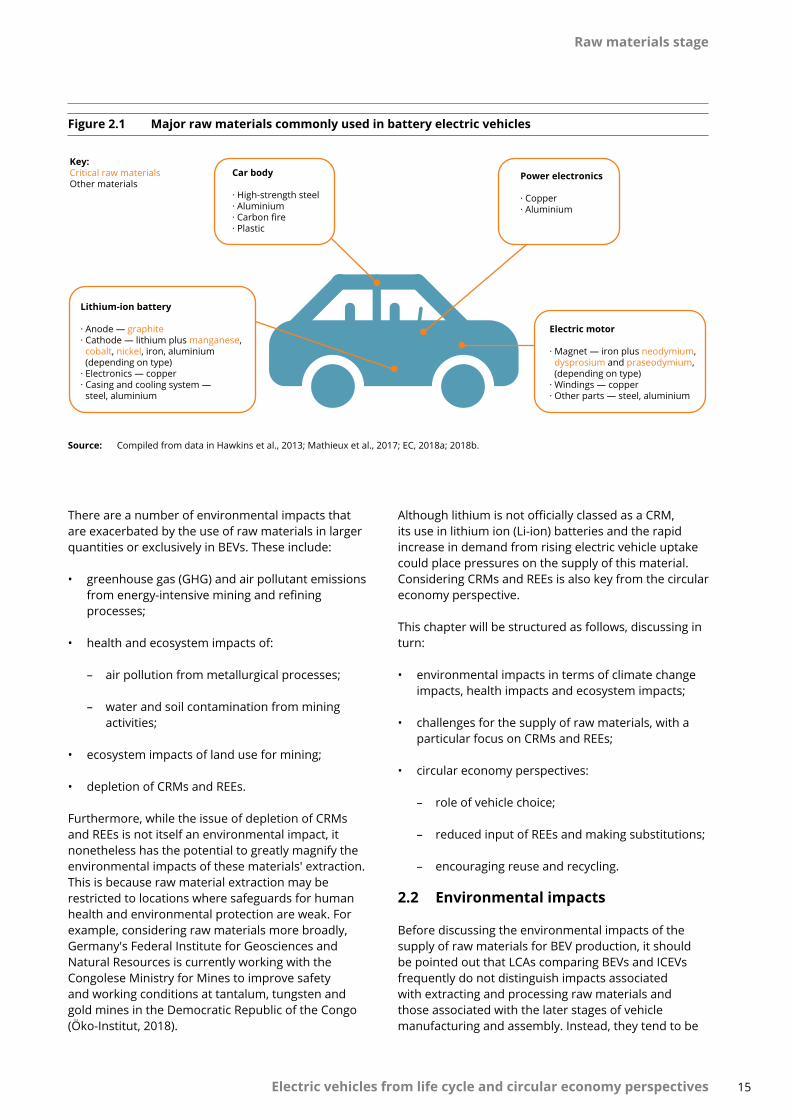
The key metals and other raw materials required for those BEV components that are used in greater quantities than in ICEVs are illustrated in Figure 2.1.
Raw materials stage
15 Electric vehicles from life cycle and circular economy perspectives
Figure 2.1 Major raw materials commonly used in battery electric vehicles
Lithium-ion battery
· Anode — graphite· Cathode — lithium plus manganese, cobalt, nickel, iron, aluminium (depending on type)· Electronics — copper· Casing and cooling system — steel, aluminium
Electric motor
· Magnet — iron plus neodymium, dysprosium and praseodymium, (depending on type)· Windings — copper· Other parts — steel, aluminium
Power electronics
· Copper· Aluminium
Car body
· High-strength steel· Aluminium· Carbon fire· Plastic
Key:Critical raw materialsOther materials
Source: Compiled from data in Hawkins et al., 2013; Mathieux et al., 2017; EC, 2018a; 2018b.
There are a number of environmental impacts that are exacerbated by the use of raw materials in larger quantities or exclusively in BEVs. These include:
• greenhouse gas (GHG) and air pollutant emissions from energy-intensive mining and refining processes;
• health and ecosystem impacts of:
– air pollution from metallurgical processes;
– water and soil contamination from mining activities;
• ecosystem impacts of land use for mining;
• depletion of CRMs and REEs.
Furthermore, while the issue of depletion of CRMs and REEs is not itself an environmental impact, it nonetheless has the potential to greatly magnify the environmental impacts of these materials' extraction. This is because raw material extraction may be restricted to locations where safeguards for human health and environmental protection are weak. For example, considering raw materials more broadly, Germany's Federal Institute for Geosciences and Natural Resources is currently working with the Congolese Ministry for Mines to improve safety and working conditions at tantalum, tungsten and gold mines in the Democratic Republic of the Congo (Öko-Institut, 2018).
Although lithium is not officially classed as a CRM, its use in lithium ion (Li-ion) batteries and the rapid increase in demand from rising electric vehicle uptake could place pressures on the supply of this material. Considering CRMs and REEs is also key from the circular economy perspective.
This chapter will be structured as follows, discussing in turn:
• environmental impacts in terms of climate change impacts, health impacts and ecosystem impacts;
• challenges for the supply of raw materials, with a particular focus on CRMs and REEs;
• circular economy perspectives:
– role of vehicle choice;
– reduced input of REEs and making substitutions;
– encouraging reuse and recycling.
2.2 Environmental impacts
Before discussing the environmental impacts of the supply of raw materials for BEV production, it should be pointed out that LCAs comparing BEVs and ICEVs frequently do not distinguish impacts associated with extracting and processing raw materials and those associated with the later stages of vehicle manufacturing and assembly. Instead, they tend to be
Raw materials stage
16 Electric vehicles from life cycle and circular economy perspectives
presented in combined form, covering all processes occurring prior to vehicle use (Box 3.1). Furthermore, impacts are typically disaggregated according to the different parts of the vehicle, in particular reporting the impacts of battery production and producing the rest of the vehicle separately.
Consequently, there is little evidence to directly compare the environmental impacts of raw material extraction and processing for BEVs and ICEVs. In this chapter, emphasis is placed on discussing the qualitative issues surrounding the supply of raw materials particularly in demand for BEVs. Quantitative comparisons between BEVs and ICEVS of the environmental impacts arising from raw material extraction and vehicle production combined are covered in Chapter 3 — Production stage impacts.
2.2.1 Climate change
The processes involved in raw material sourcing, which include extraction, separation and refining, are resource intensive. Large volumes of water, energy and other substances such as ammonia are consumed. This contributes to making material extraction and processing into a useable form a significant contributor to energy use and correspondingly GHG emissions (Massari and Ruberti, 2013; Larcher and Tarascon, 2014; Dunn et al., 2015). Estimates of the GHG emissions from raw material extraction and processing for Li-ion batteries vary widely, but recent LCAs suggest that it is responsible for around 20 % of the total GHG emissions from battery production (Kim et al., 2016; Ellingsen and Hung, 2018).
The energy used in raw material extraction and processing may be in the form of electricity, heat or fossil fuels used in vehicles and machinery. Compared with BEV manufacture and use, in which electricity is the dominant energy source, a larger proportion of the energy demand for raw material extraction and processing comes from fuel combustion in vehicles and to provide heat. For the portion of energy provided by electricity, the climate change impact depends on the carbon intensity of electricity generation types feeding into the grid at the time and location of use. This varies considerably by country: those with the highest carbon intensity are those where coal-fired power stations dominate. Further explanation and examples of how the electricity generation mix affects the carbon intensity of electricity production is provided in Chapter 4.
As well as GHG emissions from energy use, another key source of GHGs is direct emissions of CO2 and perfluorocarbons arising from aluminium production.
Depending on the vehicle model, this could be a more important source for BEVs than for ICEVs because of the greater quantity of aluminium used for lightweighting of vehicle components in BEVs (see Section 2.4.3).
The resource intensity of raw material supply can be reduced through recycling, as this reduces the need to source virgin raw materials. For example, producing primary aluminium requires around 20 times as much energy as recycling scrap aluminium (IEA 2000a, 2000b). Moreover, other research suggests that using recycled materials for the entire battery could result in reductions in GHG emissions of up to 50 % across the battery production process (Dunn et al., 2015). Although the recycling process does require additional energy inputs at the end of a vehicle's life, the benefit in terms of resources saved by not producing new products usually outweighs this. For example, recycling electric vehicle batteries through pyrometallurgy (see Box 5.4) can reduce primary energy demand by 6-56 % through material recovery (Hendrickson et al., 2015). However, the extent to which such resource savings can be achieved through recycling depends, in part, upon the economic attractiveness of different end-of-life options. This is discussed further in Chapter 5 — which covers the end-of-life stage.
2.2.2 Health impacts
It is estimated that the potential human toxicity impacts of the production phase are between 2.2 and 3.3 times greater for electric vehicles than for ICEVs (Hawkins et al., 2013). The wide range in the magnitude of the impact is a result of the variety of electric vehicle options, including the electricity sources used. Potential human toxicity impacts arise because of toxic emissions associated with mining and producing metals such as copper and nickel (e.g. Hawkins et al., 2013) and mining REEs.
One key health concern is the air pollution caused by the energy-intensive processes associated with raw material extraction and processing. Fuel combustion — to power machinery and to generate heat and electricity — results in emissions of PM, NOx and other air pollutants, which have inter alia impacts on respiratory health (EEA, 2017c). As is the case for GHG emissions, the air pollutant emissions from electricity generated to power these processes strongly depend on the generation sources in the grid mix, as well as on fuel quality and abatement measures applied in combustion plants. This is discussed in more detail in Chapter 4 — which covers vehicle use.
Raw materials stage
17 Electric vehicles from life cycle and circular economy perspectives
Of the many factors making up the human toxicity impact category considered in LCAs, toxic emissions from disposing of copper and nickel mining tailings accounts for between 70 and 75 % of the total impact for the production phase, with spoil from lignite and coal mining to provide energy making up most of the remainder (Majeau-Bettez et al., 2011; Hawkins et al., 2013; Nordelöf et al., 2014;). A recent LCA indicated that emissions of heavy metals (including lead, arsenic, cadmium, zinc, chromium and mercury) are currently given most weight in calculating the human toxicity impact category, although robust data are often limited (UBA-DE, 2016).
Mining of REEs and CRMs often takes place in countries where health and safety precautions are less stringent than they are in the EU. There can be toxic substances in water bodies. This can cause pollution of local community drinking water sources with associated health risks such as an increased risk of exposure to radioactive substances and respiratory diseases (Massari and Ruberti 2013, Rim et al., 2013; Gradin et al., 2018). Similarly, exposure to cobalt, often a by-product of nickel or copper mining, can adversely affect the health of local mining communities (Dunn et al., 2015).
The mining of REEs, such as dysprosium and neodymium, used in electric car magnets, is also associated with negative impacts on human health. The mining of neodymium produces dust, which can cause pulmonary embolisms and damage to the liver with accumulated exposure (Rim et al., 2013). Dysprosium presents a risk of explosions (Rim et al., 2013). In general, human health impacts arise from mine tailings, as most rare earth deposits contain radioactive substances and present a risk of emitting radioactive water and dust. These risks are exacerbated by poor working conditions: inadequate ventilation, lack of awareness of safety precautions among workers and improper use of protective equipment (Rim et al., 2013).
2.2.3 Ecosystem impacts
Mining processes, the release of toxic emissions and leakages of toxic substances can have harmful impacts on human and ecosystem health. For ecosystems this can include:
• eutrophication;
• acidification of water bodies and wetlands;
• soil contamination with heavy metals and soil erosion;
• biodiversity loss, including of land vegetation and aquatic species, especially fish (Majeau-Bettez et al., 2011; Hawkins et al., 2013; Dunn et al., 2015).
As discussed in Section 2.2.2, energy use results in emissions of air pollutants from fuel combustion, including NOx and sulphur oxides (SOx), which contribute to eutrophication and acidification. In addition to emissions from energy use, producing the metals used results in direct emissions of acidifying gases:
• Sulphur dioxide (SO2) is released during primary production of copper and nickel from sulphide ores for batteries, electronics and electric motors (EMEP/EEA, 2016).
• Hydrogen chloride and hydrogen fluoride (which also have local health impacts) are released during aluminium production (EMEP/EEA, 2016).
Information on the ecosystem impacts of REEs (dysprosium, neodymium and praseodymium) is currently limited; however, studies to investigate the environmental impacts of REE mining are becoming more numerous (Rim, 2016; MacMillan et al., 2017). Traditionally, REEs were thought to be low risk to ecosystems, as they are largely immobile and insoluble. Recent laboratory studies have, however, revealed the potential for bioaccumulation and toxicity of REEs among aquatic species. For example, REEs have been shown to inhibit the growth of plants and of certain species of marine algae as well as causing decreased chlorophyll production (Rim, 2016; MacMillan et al., 2017).
2.3 Challenges for raw material supply and processing
The expected rise in the numbers of electric vehicles in Europe will increase the demand for certain raw materials such as copper and nickel and in particular CRMs and REEs. Although this is a key challenge for the future, there are also concerns over the sustainability of current practices.
2.3.1 Increased vehicle driving range
Range anxiety is one of the main barriers to adopting BEVs cited by consumers. To address this, vehicle manufacturers are keen to offer increased driving ranges, by increasing the battery capacity and minimising the overall weight of the vehicle. Although
Raw materials stage
18 Electric vehicles from life cycle and circular economy perspectives
this increases the attractiveness of BEVs to consumers, there is the potential for increased impacts arising from raw material extraction and processing.
Battery capacity
One way of increasing the battery capacity in BEVs is simply to add more cells to the battery pack. Although this increases the weight of the battery pack and the vehicle as a whole, the additional storage capacity tends to more than compensate for this, resulting in an increased driving range. In general, BEVs in larger car segments tend to have superior ranges, but to achieve this they tend to have disproportionately large batteries. For example, Ellingsen et al. (2016) showed that both typical battery capacity and the driving ranges of BEVs increase across car segments from 'mini-cars' to 'luxury cars'. Typically, battery size in the luxury segment was around 3.4 times greater than in mini-cars, whereas driving range was only about 2.3 times greater due to the doubling of vehicle weight. Clearly, increasing battery capacity by adding more cells proportionately increases the environmental impact of raw material extraction and processing.
Another way of increasing vehicle range is to choose a battery chemistry with higher energy density, which provides greater storage capacity for the same battery weight. However, currently, those cell materials offering higher energy density also have higher impacts in terms of GHG and air pollutant emissions. Of the various types of lithium ion battery in use, lithium-nickel-manganese-cobalt (NMC) oxide and lithium-cobalt oxide (LCO) have high energy densities. However, the production of cobalt and nickel required for these batteries is very energy intensive, resulting in much higher GHG and SOx emissions per mass of cell material produced for these battery types than for other chemistries (Dunn et al., 2015).
Lightweight design
There are several ways to reduce the weight of materials used in vehicles (the 'lightweighting' process as mentioned previously), but from the perspective of environmental impacts it is useful to distinguish two kinds of lightweighting:
• reducing the quantity of a given material used through careful design;
• substituting existing materials with less dense materials of equal strength (Egede, 2017).
Reducing the quantity of materials used through design (e.g. by using only as much material as is required to withstand the load placed on a component) should always reduce the environmental impacts of the raw materials used.
In contrast, material substitution may result in higher environmental impacts in some cases. For example, steel components of the electric motor, battery and vehicle body may be replaced by other metals such as wrought aluminium, magnesium and titanium, or composite materials such as carbon fibre reinforced plastic (CFRP). These materials tend to require more energy and have a higher global warming potential in the production stage than the heavier materials they replace (Kim and Wallington, 2013; Delogu et al., 2017; Egede, 2017). Some materials such as composites may also be more difficult to recycle, increasing the impact of end-of-life processes and necessitating use of virgin raw materials over recycled ones in future products (Egede, 2017). Chapter 5 discusses end-of-life processes in more detail.
From a life cycle perspective, any additional environmental impacts arising from producing lightweight materials must of course be set against those saved through lower energy requirements in the use stage. A recent analysis at the component level showed that lightweighting reduced GHG emissions over the whole life cycle for only two out of the five components studied (Delogu et al., 2017). However, the overall balance of impacts depends heavily on the source of electricity in the use stage and on the lifetime mileage of the vehicle. These considerations are discussed in more detail in Chapter 3.
2.3.2 Rising demand for critical raw materials
Related to the above the expected growth in the electric vehicle market will be accompanied by increasing demand for CRMs, including cobalt and REEs contained in Li-ion batteries (Massari and Ruberti, 2013; Mathieux et al., 2017). For example, under a scenario of limiting average global temperature rise to 2 ºC, global lithium demand will rise to 160 000 tonnes in 2030 and 500 000 tonnes in 2050. Electric cars will account for 82 % of the road transport-related demand in 2030 and 83 % in 2050. This assumes that in 2030 electric car annual sales (BEVs, PHEVs and FCEVs) will be around 26 million and in 2050 will be around 97 million (Öko-Institut, 2018).
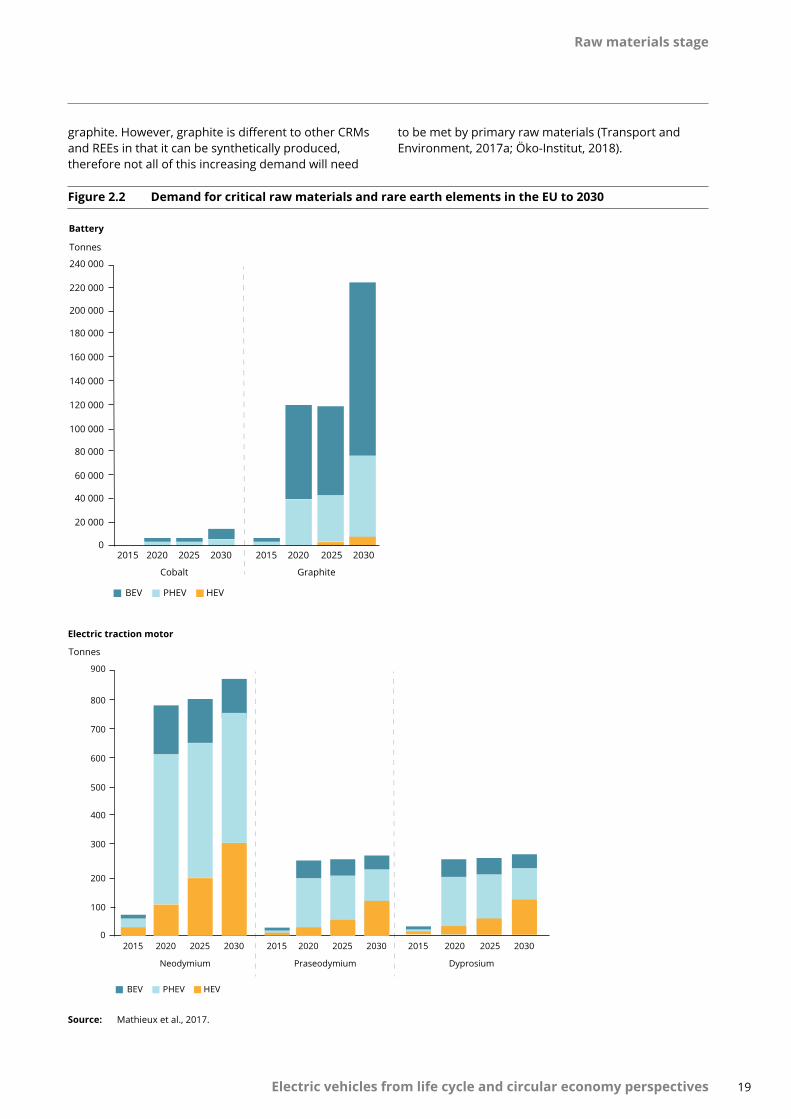
Figure 2.2 shows demand for CRMs and REEs in the EU to 2030. Note the expected increased demand for
Raw materials stage
19 Electric vehicles from life cycle and circular economy perspectives
graphite. However, graphite is different to other CRMs and REEs in that it can be synthetically produced, therefore not all of this increasing demand will need
Figure 2.2 Demand for critical raw materials and rare earth elements in the EU to 2030
220 000
240 000
200 000
180 000
160 000
140 000
120 000
100 000
80 000
60 000
40 000
20 000
0
Cobalt Graphite
Tonnes
2015 2020 2025 2030 2015 2020 2025 2030
HEV PHEV BEV
Battery
to be met by primary raw materials (Transport and Environment, 2017a; Öko-Institut, 2018).
Source: Mathieux et al., 2017.
800
900
700
600
500
400
300
200
100
0
Neodymium Praseodymium Dyprosium
Tonnes
2015 2020 2025 2030 2015 2020 2025 2030 2015 2020 2025 2030
HEV PHEV BEV
Electric traction motor Electric traction motor
Tonnes
Raw materials stage
20 Electric vehicles from life cycle and circular economy perspectives
2.3.3 Geographical availability and monopoly of supply
Despite their name, not all REEs are scarce in the Earth's crust. However, their availability is restricted to a few regions, adding to the riskiness and cost of supply (Gradin et al., 2018). In terms of production and exports and imports of raw materials used in electric vehicle drivetrains and electronics, China is overall the most significant actor, accounting for 70 % of the global supply of CRMs (EC, 2017b). For the EU, China provides 62 % of the total supply of CRMs, including 40 % of the EU supply of neodymium, praseodymium and dysprosium and 69 % of natural graphite (EC, 2017b, 2018b). The dominance of the market by one country creates a supply and economic risk. Having significant control over the price of materials, the dominant actor can increase prices at any moment, an economic risk for buyers of these materials (Massari and Ruberti, 2013).
2.4 Circular economy perspectives
The extraction and processing of raw materials for electric vehicles can lead to significant environmental impacts, and therefore we need to find solutions that address this challenge. For example, the environmental burden caused by raw material supply could be reduced through improved waste handling and by using an energy mix with a higher proportion of renewable sources (Nordelöf et al., 2014). This section will examine the ways in which raw material production could be made more sustainable, e.g. by consumers choosing the most sustainable vehicle for their needs and reducing the amount of REEs required by reducing inputs and using alternative materials.
2.4.1 Vehicle choice
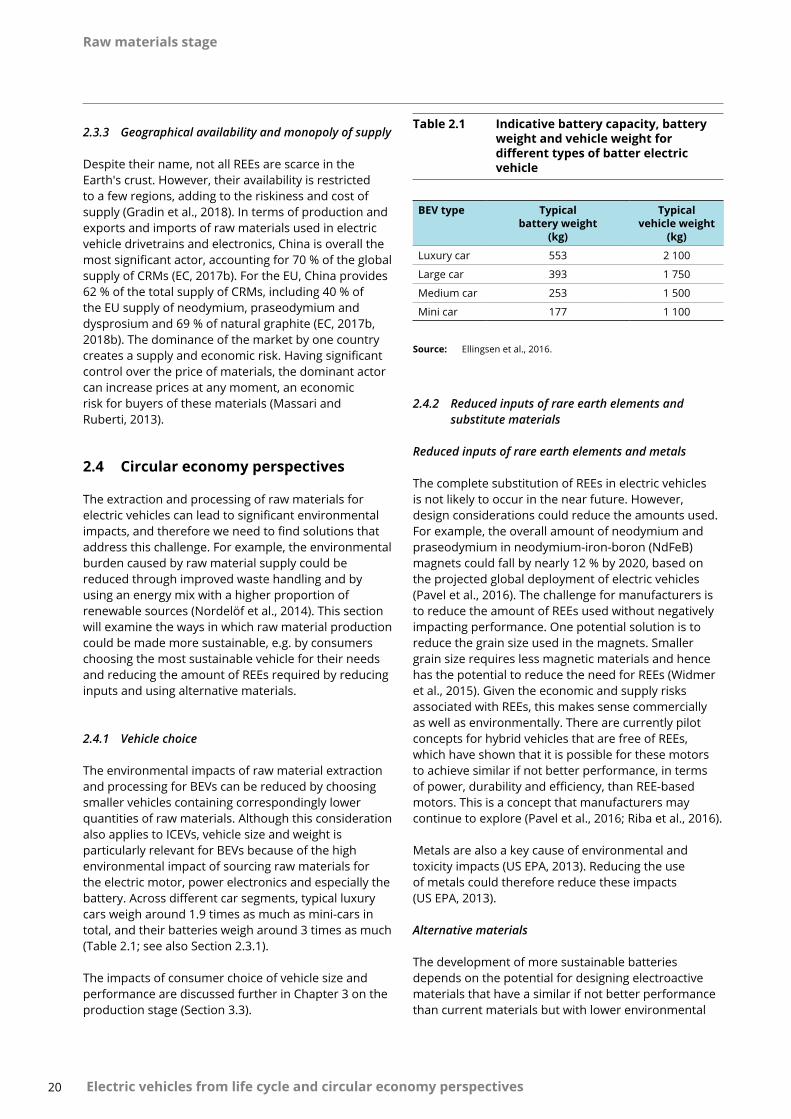
The environmental impacts of raw material extraction and processing for BEVs can be reduced by choosing smaller vehicles containing correspondingly lower quantities of raw materials. Although this consideration also applies to ICEVs, vehicle size and weight is particularly relevant for BEVs because of the high environmental impact of sourcing raw materials for the electric motor, power electronics and especially the battery. Across different car segments, typical luxury cars weigh around 1.9 times as much as mini-cars in total, and their batteries weigh around 3 times as much (Table 2.1; see also Section 2.3.1).
The impacts of consumer choice of vehicle size and performance are discussed further in Chapter 3 on the production stage (Section 3.3).
Table 2.1 Indicative battery capacity, battery weight and vehicle weight for different types of batter electric vehicle
BEV type Typical battery weight
(kg)
Typical vehicle weight
(kg)
Luxury car 553 2 100
Large car 393 1 750
Medium car 253 1 500
Mini car 177 1 100
Source: Ellingsen et al., 2016.
2.4.2 Reduced inputs of rare earth elements and substitute materials
Reduced inputs of rare earth elements and metals
The complete substitution of REEs in electric vehicles is not likely to occur in the near future. However, design considerations could reduce the amounts used. For example, the overall amount of neodymium and praseodymium in neodymium-iron-boron (NdFeB) magnets could fall by nearly 12 % by 2020, based on the projected global deployment of electric vehicles (Pavel et al., 2016). The challenge for manufacturers is to reduce the amount of REEs used without negatively impacting performance. One potential solution is to reduce the grain size used in the magnets. Smaller grain size requires less magnetic materials and hence has the potential to reduce the need for REEs (Widmer et al., 2015). Given the economic and supply risks associated with REEs, this makes sense commercially as well as environmentally. There are currently pilot concepts for hybrid vehicles that are free of REEs, which have shown that it is possible for these motors to achieve similar if not better performance, in terms of power, durability and efficiency, than REE-based motors. This is a concept that manufacturers may continue to explore (Pavel et al., 2016; Riba et al., 2016).
Metals are also a key cause of environmental and toxicity impacts (US EPA, 2013). Reducing the use of metals could therefore reduce these impacts (US EPA, 2013).
Alternative materials
The development of more sustainable batteries depends on the potential for designing electroactive materials that have a similar if not better performance than current materials but with lower environmental
Raw materials stage
21 Electric vehicles from life cycle and circular economy perspectives
burdens (Larcher and Tarascon, 2014). Substitution could be a solution for Europe, which lacks a domestic supply of REEs, while also offering global environmental benefits through reducing the demand for these materials (Pavel et al., 2016). For example, improved material efficiency could lead to a 4 % reduction in the amount of dysprosium required in electric vehicle permanent motors by 2020 (Pavel et al., 2016). Some studies have highlighted the potential of iron nitride- and manganese-based compounds as high-performance magnetic materials; however, it is unclear whether these materials are close to market or even viable. Commercialisation of these materials is therefore at least several years away (Widmer et al., 2015).
When developing alternative substances, it is important to consider the whole life cycle, not just raw material supply. Although a raw material may appear sustainable, cheap and readily available, we must also consider its extraction and processing needs and its suitability for recycling (Larcher and Tarascon, 2014).
Further research requirements
Research into reduced use of REEs in electric vehicle permanent magnet motors is still at a relatively early stage. It is becoming clear, however, that this is an important field of research that could have significant impacts on the large-scale deployment of BEVs (Pavel et al., 2016). Currently, there is sufficient supply of REEs at relatively low prices, and therefore there is little incentive to phase out REEs and push for REE-free motors. As outlined above, however, the supply and economics are uncertain and present a risk in future. Therefore, developing such solutions could become more important in the future (Pavel et al., 2016).
2.4.3 Encouraging reuse and recycling
The reuse and recycling of electric vehicle batteries, including second uses in other applications, could reduce the amount of REEs and CRMs required. Recovery of key materials or materials with a high-risk supply chain could reduce the environmental impacts associated with sourcing and extracting REEs and contribute to the circular economy.
With respect to REEs contained in electric traction motors, although the current level of recycling from magnets is still very limited (Tsamis and Coyne, 2015), several studies estimate the potential level of recycling
of neodymium from magnets to be around 30 % in the next 20 years (Blagoeva et al., 2016). Cobalt is the current material of interest for Li-ion battery recycling. However, a decline in the use of cobalt and its associated challenges could make recycling unattractive, especially if recycling of other materials such as lithium or graphite is also economically impractical (EC, 2018b). Although the current recycling technologies available may be sufficient for future Li-ion battery chemistries, the processes may have to adapt to cope with changing battery dimensions and energy content (Recharge, 2013).
2.5 Summary: minimising the environmental impacts of raw materials
The extraction of copper, nickel and CRMs, including REEs, for use in electric vehicles can have detrimental environmental impacts, including:
• resource-intensive extraction processes;
• risk of releasing toxic materials into water;
• risk of soil contamination (Hawkins et al., 2013; Borén and Ny, 2016; Helmers and Weiss, 2017).
In future, lightweighting can also have negative impacts, e.g. due to the increased need for energy-intensive processes associated with producing lightweight materials.
Mechanisms to reduce these environmental impacts include:
• careful vehicle design and use of smaller vehicles;
• reducing the use of REEs, copper and aluminium in electric vehicles — this makes sense from environmental and commercial perspectives because of the reduced negative environmental impacts and a reduced reliance on materials with supply chain risks;
• using alternative materials — a comparatively simple solution, in theory, to reducing the amount of CRMs, although further development is needed to make these options viable;
• encouraging recycling and reuse of vehicle components.
Production stage
2222
Production stage
Electric vehicles from life cycle and circular economy perspectives
3 Production stage
• From a life cycle perspective, GHG and air pollutant emissions from BEV production are generally higher than those from ICEV production. This is largely due to the energy-intensive process of battery manufacture. This higher energy use has associated broader health and ecosystem impacts.
• The impacts vary according to the battery chemistry and size and the energy mix used in the production processes.
• From a circular economy perspective, the negative environmental impacts of vehicle production can be minimised by:
increased use of renewable electricity to provide energy for BEV production;
– recycling — increasing the use of recycled rather than virgin materials;
– changes in consumption patterns by encouraging consumers to choose the smallest possible vehicle category — this is can be facilitated through shared mobility services;
– reducing waste generation — by taking advantage of economies of scale and new techniques in battery and vehicle production;
– choosing battery types with the lowest impact per unit of energy provided.
3.1 Introduction
Nearly all major car manufacturers currently produce or have committed to producing electric or hybrid electric vehicles (ICCT, 2018a). The principal features distinguishing BEVs from ICEVs are the components for energy storage, propulsion and braking. In place of the fuel tank, engine, gearbox and exhaust found in ICEVs, BEVs require a battery, an electric motor (which also acts as an electromagnetic brake) and power electronics.
Currently, other components, such as the vehicle body and auxiliary systems, do not necessarily differ. Many existing BEVs are adapted from ICEV vehicle bodies to save on development time and costs and to take advantage of existing production lines (Delogu et al., 2017). Notable exceptions to this are
models such as the BMW i3 and Tesla vehicles, which incorporate lightweight materials to optimise driving range and performance.
The production of the battery and other BEV-specific components requires raw materials and assembly processes different from those for ICEV manufacture, resulting in different environmental impacts. The use of alternative materials (such as aluminium) can also affect the environmental impacts of production.
The issues associated with raw material extraction and processing into a useable form are discussed in Chapter 2. This chapter focuses on the environmental issues related to the energy-intensity of BEV manufacture, once materials have been processed into a useable form (e.g. aluminium sheets).
Production stage
23 Electric vehicles from life cycle and circular economy perspectives
The content of this chapter is as follows:
• current production methods;
• how production impacts can be measured;
• environmental impacts:
– GHG emissions;
– health impacts resulting from air pollution;
– ecosystem impacts;
• factors affecting the environmental impacts:
– vehicle and battery size;
– lifetime mileage;
– battery type;
– manufacturing energy efficiency;
– electricity generation;
• steps to minimise environmental impacts.
3.1.1 Battery production
As is the case for ICEVs, various BEV components are frequently manufactured in a variety of locations then assembled elsewhere. From an environmental perspective, the location of battery production is very important (see later sections in this chapter), as the battery constitutes a large fraction (up to 25 %) of the mass of the vehicle (Mayyas et al., 2017) and involves energy-intensive processes.
The development of Li-ion batteries has played a crucial role in increasing the practicality of BEVs and consumer interest in them, due to their superior energy density and/or durability compared with previous battery technology (Ellingsen and Hung, 2018). Production of Li-ion battery packs is a multi-step process, involving:
• preparation of anode and cathode materials;
• combining anode and cathode materials with electrolyte, collector and separator materials and a container to produce cells;
• assembling multiple cells into a battery pack, which also comprises the battery casing, electrical system, thermal management system and electronic battery management system (Ellingsen and Hung, 2018).
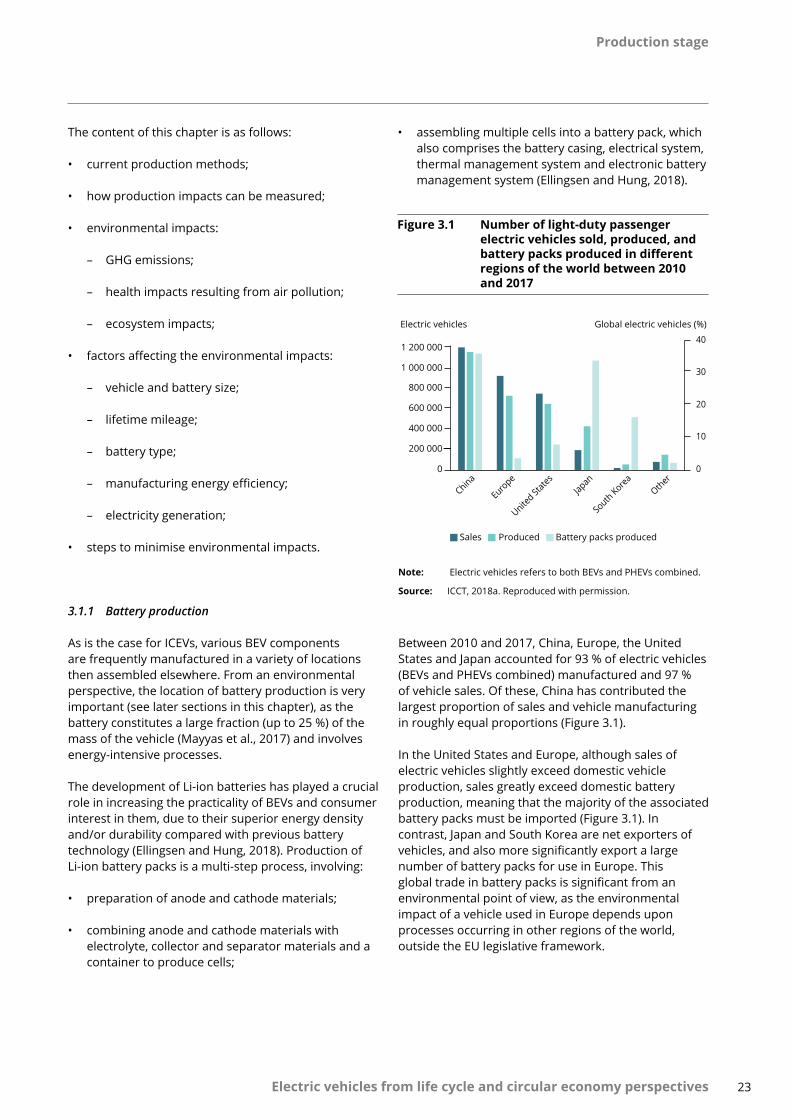
Figure 3.1 Number of light-duty passenger electric vehicles sold, produced, and battery packs produced in different regions of the world between 2010 and 2017
Sales Produced Battery packs produced
0
10
20
30
40
0
200 000
400 000
600 000
800 000
1 000 000
1 200 000
China
Europe
United St
atesJapan
South Korea
Other
Global electric vehicles (%)Electric vehicles
Note: Electric vehicles refers to both BEVs and PHEVs combined.
Source: ICCT, 2018a. Reproduced with permission.
Between 2010 and 2017, China, Europe, the United States and Japan accounted for 93 % of electric vehicles (BEVs and PHEVs combined) manufactured and 97 % of vehicle sales. Of these, China has contributed the largest proportion of sales and vehicle manufacturing in roughly equal proportions (Figure 3.1).
In the United States and Europe, although sales of electric vehicles slightly exceed domestic vehicle production, sales greatly exceed domestic battery production, meaning that the majority of the associated battery packs must be imported (Figure 3.1). In contrast, Japan and South Korea are net exporters of vehicles, and also more significantly export a large number of battery packs for use in Europe. This global trade in battery packs is significant from an environmental point of view, as the environmental impact of a vehicle used in Europe depends upon processes occurring in other regions of the world, outside the EU legislative framework.
Production stage
24 Electric vehicles from life cycle and circular economy perspectives
3.2 Overview of production impacts
3.2.1 How do we measure production impacts?
Before discussing the environmental impacts of BEV production, it is worth highlighting that they can be expressed in different ways. In the use stage, impacts are usually expressed per kilometre, as it is the action of driving that causes the impacts. However, production stage impacts occur before any distance has been driven.
The simplest way to express production impacts are per vehicle produced. However, this kind of assessment is only meaningful if it is assumed that vehicle lifetime and maintenance requirements are the same for all vehicles compared, which may not hold true. A better way to express production impacts is per kilometre driven, which takes into account the differing lifetime mileages and maintenance requirements. This means, however, that results are very sensitive to lifetime mileage assumptions (Hawkins et al., 2013), and robust data on this are limited (as discussed further in Chapter 4 — Use stage). Some LCAs use the per vehicle approach, whereas others use the per kilometre driven approach. Here, we use examples of results from both types of LCA, so the caveats presented above should be borne in mind.
3.2.2 Greenhouse gas emissions
A large proportion of GHG emissions and air pollutants released during BEV production are related to generating electricity and other forms of energy required for energy-intensive processes (Ellingsen and Hung, 2018).
Most LCAs of BEVs find that battery production is responsible for the largest proportion of energy use (and GHG emissions) in the production phase (Nordelöf et al., 2014), with estimates ranging between 10 and 75 % of manufacturing energy and 10 and 70 % of manufacturing GHG emissions (Nealer and Hendrickson, 2015). A recent review found that all stages of battery production account for
Box 3.1 Overlap between the impacts of raw material extraction and processing and vehicle production
LCAs comparing BEVs and ICEVs frequently do not distinguish impacts associated with raw material extraction and processing and those associated with the later stages of vehicle manufacturing and assembly. Instead, they tend to be presented together, covering all the processes occurring before the vehicle is used. Consequently, when we make quantitative comparisons of environmental impacts between BEVs and ICEVs in this chapter, the comparison encompasses all stages of production from raw material extraction to final assembly, unless otherwise stated.
33-44 % of total BEV production emissions (Ellingsen and Hung, 2018). Of this total, LCAs report that cell manufacturing and battery assembly accounts for anything between 3 and 80 % of total battery production emissions depending on the approach taken, with the rest arising from raw material extraction and processing (Kim et al., 2016; Ellingsen and Hung, 2018) — see Chapter 2. Recent data obtained directly from manufacturers suggests that the higher of these two figures is more likely to reflect reality, as it better accounts for all forms of energy use during manufacturing (Kim et al., 2016; Ellingsen and Hung, 2018). Industry studies suggest that in the key Li-ion battery manufacturing locations of China, South Korea and Japan, around half of the GHG emissions arise from energy use in cell manufacture (Hao et al., 2017, ICCT 2018b, Ellingsen and Hung, 2018). The key stages in battery production identified as being especially energy intensive are electrode drying and operating drying rooms during cell manufacture (Ellingsen and Hung, 2018). See Section 3.3 for further discussion of factors affecting GHG emissions in BEV production.
Considering other vehicle components, the electric motor contributes around 7-8 % of total production-related emissions (including raw material extraction) because of the high copper and aluminium content, other power train components with a high aluminium content contribute 16-18 %, and the remainder of the vehicle contributes around 35 % (Hawkins et al., 2013).
Despite the high energy requirement of BEV production, LCAs find that the energy used in driving is far greater than the production impact and dominates life cycle energy use (Nordelöf et al., 2014). However, where use stage electricity consumption can be delivered from low-carbon sources, the BEV production phase can be responsible for up to 75 % of GHG emissions over the whole life cycle (Faria et al., 2013). This is because currently most battery production takes place in countries with high-carbon-intensity electricity (ICCT, 2018b) — see Figure 3.1. In comparison, using the average EU-28 electricity generation mix for 2015 to estimate use stage impacts, the battery production phase accounts for around 30 % of the lifetime GHG emissions.
Production stage
25 Electric vehicles from life cycle and circular economy perspectives
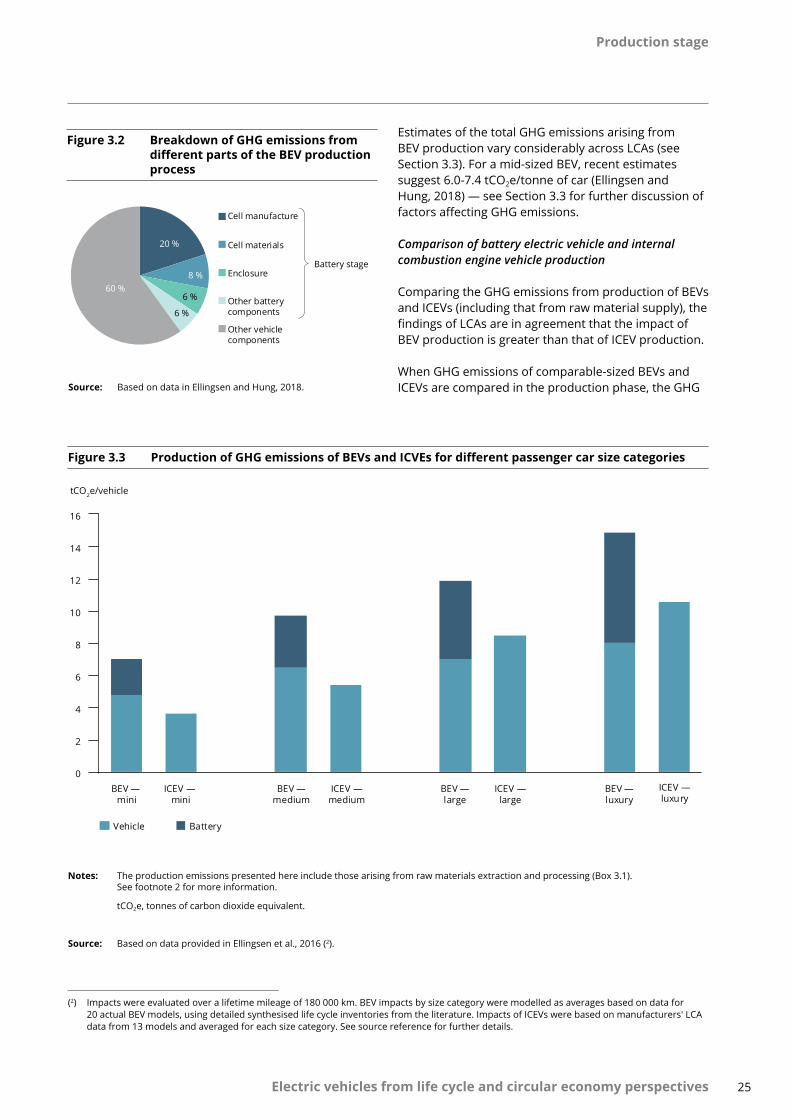
Estimates of the total GHG emissions arising from BEV production vary considerably across LCAs (see Section 3.3). For a mid-sized BEV, recent estimates suggest 6.0-7.4 tCO2e/tonne of car (Ellingsen and Hung, 2018) — see Section 3.3 for further discussion of factors affecting GHG emissions.
Comparison of battery electric vehicle and internal combustion engine vehicle production
Comparing the GHG emissions from production of BEVs and ICEVs (including that from raw material supply), the findings of LCAs are in agreement that the impact of BEV production is greater than that of ICEV production.
When GHG emissions of comparable-sized BEVs and ICEVs are compared in the production phase, the GHG
Figure 3.2 Breakdown of GHG emissions from different parts of the BEV production process
Source: Based on data in Ellingsen and Hung, 2018.
20 %
8 %
6 %
6 %
60 %
Cell manufacture
Cell materials
Enclosure
Other battery components
Other vehicle components
Battery stage
Figure 3.3 Production of GHG emissions of BEVs and ICVEs for different passenger car size categories
0
2
4
6
8
10
12
14
16
BEV — mini
ICEV — mini
BEV —medium
ICEV —medium
BEV —large
ICEV —large
BEV —luxury
ICEV —luxury
tCO2e/vehicle
Vehicle Battery
Notes: The production emissions presented here include those arising from raw materials extraction and processing (Box 3.1). See footnote 2 for more information.
tCO2e, tonnes of carbon dioxide equivalent.
Source: Based on data provided in Ellingsen et al., 2016 (2).
(2) Impacts were evaluated over a lifetime mileage of 180 000 km. BEV impacts by size category were modelled as averages based on data for 20 actual BEV models, using detailed synthesised life cycle inventories from the literature. Impacts of ICEVs were based on manufacturers' LCA data from 13 models and averaged for each size category. See source reference for further details.
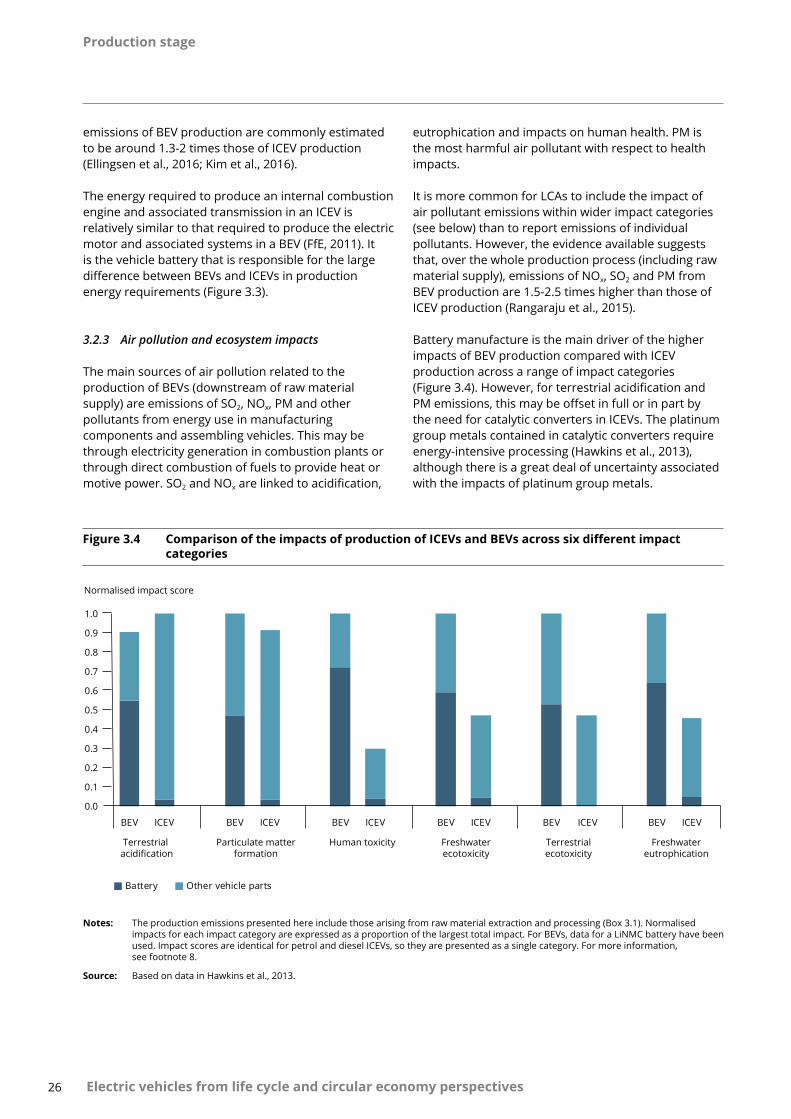
Production stage
26 Electric vehicles from life cycle and circular economy perspectives
emissions of BEV production are commonly estimated to be around 1.3-2 times those of ICEV production (Ellingsen et al., 2016; Kim et al., 2016).
The energy required to produce an internal combustion engine and associated transmission in an ICEV is relatively similar to that required to produce the electric motor and associated systems in a BEV (FfE, 2011). It is the vehicle battery that is responsible for the large difference between BEVs and ICEVs in production energy requirements (Figure 3.3).
3.2.3 Air pollution and ecosystem impacts
The main sources of air pollution related to the production of BEVs (downstream of raw material supply) are emissions of SO2, NOx, PM and other pollutants from energy use in manufacturing components and assembling vehicles. This may be through electricity generation in combustion plants or through direct combustion of fuels to provide heat or motive power. SO2 and NOx are linked to acidification,
eutrophication and impacts on human health. PM is the most harmful air pollutant with respect to health impacts.
It is more common for LCAs to include the impact of air pollutant emissions within wider impact categories (see below) than to report emissions of individual pollutants. However, the evidence available suggests that, over the whole production process (including raw material supply), emissions of NOx, SO2 and PM from BEV production are 1.5-2.5 times higher than those of ICEV production (Rangaraju et al., 2015).
Battery manufacture is the main driver of the higher impacts of BEV production compared with ICEV production across a range of impact categories (Figure 3.4). However, for terrestrial acidification and PM emissions, this may be offset in full or in part by the need for catalytic converters in ICEVs. The platinum group metals contained in catalytic converters require energy-intensive processing (Hawkins et al., 2013), although there is a great deal of uncertainty associated with the impacts of platinum group metals.
Figure 3.4 Comparison of the impacts of production of ICEVs and BEVs across six different impact categories
0.0
0.1
0.2
0.3
0.4
0.5
0.6
0.7
0.8
0.9
1.0
BEV ICEV BEV ICEV BEV ICEV BEV ICEV BEV ICEV BEV ICEV
Battery Other vehicle parts
Terrestrial acidification
Particulate matterformation
Human toxicity Freshwaterecotoxicity
Terrestrialecotoxicity
Freshwatereutrophication
Normalised impact score
Notes: The production emissions presented here include those arising from raw material extraction and processing (Box 3.1). Normalised impacts for each impact category are expressed as a proportion of the largest total impact. For BEVs, data for a LiNMC battery have been used. Impact scores are identical for petrol and diesel ICEVs, so they are presented as a single category. For more information, see footnote 8.
Source: Based on data in Hawkins et al., 2013.
Production stage
27 Electric vehicles from life cycle and circular economy perspectives
The high impact of battery production is to a certain extent due to the location of battery manufacture in countries with fossil fuel-rich energy mixes, such as China. The findings of most LCAs show that release of NOx, SO2 and PM from electricity production contributes the largest fraction of production phase air pollutant emissions. However, the fraction of the total life cycle impacts attributable to the production phase depends strongly on the electricity mix in the use stage. For example, BEV production makes up around 70 % of life cycle terrestrial acidification potential when use stage electricity is generated from natural gas, compared with only around 30 % when use stage electricity is generated from coal (Hawkins et al., 2013). This is discussed in more detail in Section 3.3 and Chapter 4.
3.3 Factors affecting the environmental impacts of production
While the conclusions of many LCAs are qualitatively similar when putting production impacts into the context of the life cycle or comparing BEVs and ICEVs, the quantitative results of LCAs are dependent on a variety of (uncertain) factors. Some of these are methodological, such as the assumptions made regarding vehicle lifetime (IEA, 2017a), while others are due to inherent differences in the vehicles and systems being studied, such as the type of vehicle and electricity source used (Hawkins et al., 2013; Nordelöf et al., 2014; Nealer and Hendrickson, 2015).
Some key characteristics affecting assessments of the environmental impacts of BEV production are briefly described below.
3.3.1 Vehicle and battery size
As with ICEVs, larger BEVs tend to require more energy during the manufacturing phase and so have a larger environmental impact. Over the whole production process (including raw material supply), Ellingsen et al. (2016) found that production of a typical luxury segment car creates over twice the GHG emissions of a typical mini-segment car, at 14.9 and 7 tonnes of CO2, respectively. Vehicle size also has implications for raw material demand and for use stage energy consumption, and these are discussed in Chapters 2 and 4, respectively.
However, while LCAs tend to compare vehicle types with a fixed lifetime mileage, it is possible that larger BEVs may have higher a lifetime mileage than smaller
vehicles, as is observed for ICEVs (Ricardo-AEA, 2015). This would systematically reduce the difference in raw materials (and production stage) impact per kilometre driven between large and small vehicles. As yet, little data are available on BEV lifetime mileages with which to evaluate this.
As well as differences across car segments, there are also large differences in battery capacity within vehicle segments to cater for demand for large vehicle ranges from some consumers (see Section 2.3.1). Larger battery capacity to boost driving range significantly increases the environmental impacts of production (UBA-DE, 2016; IEA, 2017a). However, current evidence suggests that range anxiety causes people to over-estimate the range required for their usual travel patterns (see Box 4.4). In the future, it seems likely that range anxiety will be reduced as charging infrastructure becomes denser and drivers adjust to using BEVs, so that vehicle choice may better reflect day-to-day travel needs. If the right incentives are provided for consumers and manufacturers, improvements in battery energy density can be harnessed to reduce environmental impacts from battery production while maintaining vehicle range.
3.3.2 Lifetime mileage
Many lifecycle assessments express production-related environmental impacts per kilometre driven by assuming a particular lifetime mileage of the vehicle (or battery). This allows fair comparisons among vehicles with differing expected lifetime mileages, as the functional unit is no longer the vehicle but the mobility service it provides. The assumed lifetime varies between around 150 000 to 250 000 km (Hawkins et al., 2013) depending on the assessment, which leads to estimates of per kilometre GHG emissions from production varying by up to 70 % because of this factor alone. The longer the lifetime mileage of a vehicle, the lower the influence of production-related emissions on the total life cycle impacts, as use stage impacts become more dominant. This is especially relevant for the comparison between BEVs and ICEVs, because the higher production-related impacts of BEVs can be offset only in the use stage if a sufficient distance is driven (the so-called 'break-even' point; Egede, 2017). In one study focusing on GHG emissions, the break-even point was estimated at between only 44 000 and 70 000 km (Ellingsen et al., 2016) — much lower than the lifetime mileages expected for BEVs. The potential lifetime mileage of BEVs is discussed further in Section 4.6, which covers the role of BEVs in personal mobility.
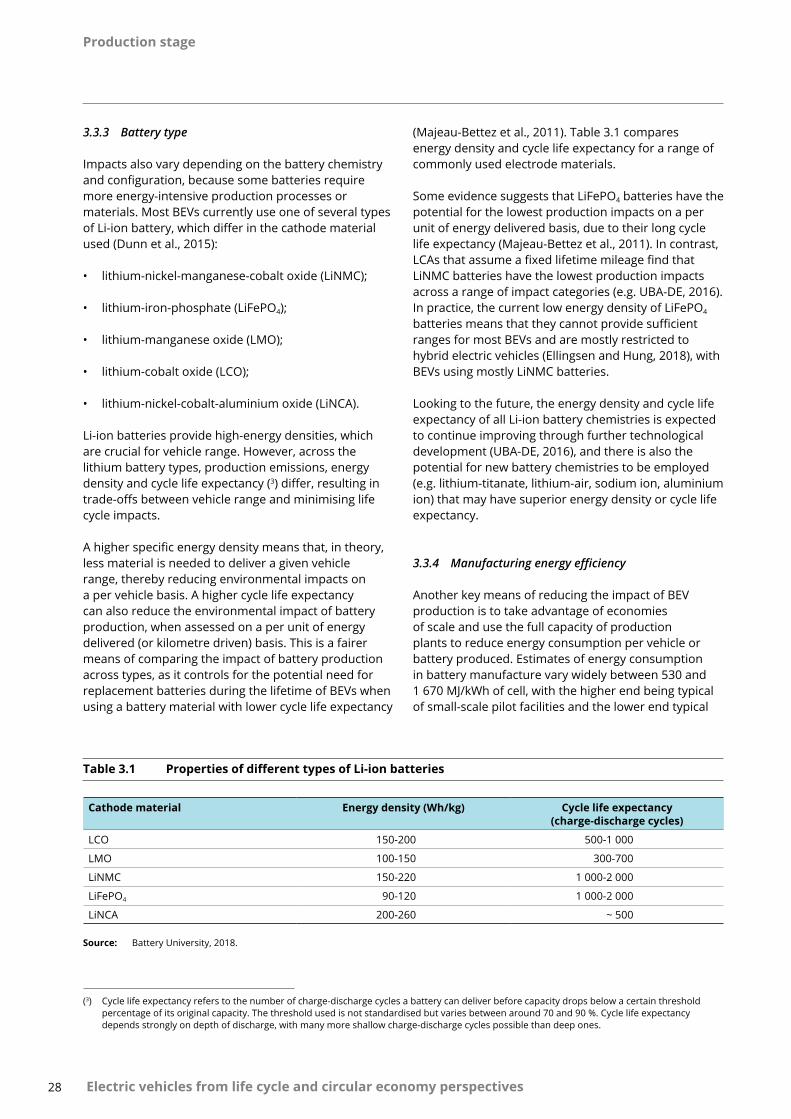
Production stage
28 Electric vehicles from life cycle and circular economy perspectives
3.3.3 Battery type
Impacts also vary depending on the battery chemistry and configuration, because some batteries require more energy-intensive production processes or materials. Most BEVs currently use one of several types of Li-ion battery, which differ in the cathode material used (Dunn et al., 2015):
• lithium-nickel-manganese-cobalt oxide (LiNMC);
• lithium-iron-phosphate (LiFePO4);
• lithium-manganese oxide (LMO);
• lithium-cobalt oxide (LCO);
• lithium-nickel-cobalt-aluminium oxide (LiNCA).
Li-ion batteries provide high-energy densities, which are crucial for vehicle range. However, across the lithium battery types, production emissions, energy density and cycle life expectancy (3) differ, resulting in trade-offs between vehicle range and minimising life cycle impacts.
A higher specific energy density means that, in theory, less material is needed to deliver a given vehicle range, thereby reducing environmental impacts on a per vehicle basis. A higher cycle life expectancy can also reduce the environmental impact of battery production, when assessed on a per unit of energy delivered (or kilometre driven) basis. This is a fairer means of comparing the impact of battery production across types, as it controls for the potential need for replacement batteries during the lifetime of BEVs when using a battery material with lower cycle life expectancy
(3) Cycle life expectancy refers to the number of charge-discharge cycles a battery can deliver before capacity drops below a certain threshold percentage of its original capacity. The threshold used is not standardised but varies between around 70 and 90 %. Cycle life expectancy depends strongly on depth of discharge, with many more shallow charge-discharge cycles possible than deep ones.
Table 3.1 Properties of different types of Li-ion batteries
Cathode material Energy density (Wh/kg) Cycle life expectancy (charge-discharge cycles)
LCO 150-200 500-1 000
LMO 100-150 300-700
LiNMC 150-220 1 000-2 000
LiFePO4 90-120 1 000-2 000
LiNCA 200-260 ~ 500
(Majeau-Bettez et al., 2011). Table 3.1 compares energy density and cycle life expectancy for a range of commonly used electrode materials.
Some evidence suggests that LiFePO4 batteries have the potential for the lowest production impacts on a per unit of energy delivered basis, due to their long cycle life expectancy (Majeau-Bettez et al., 2011). In contrast, LCAs that assume a fixed lifetime mileage find that LiNMC batteries have the lowest production impacts across a range of impact categories (e.g. UBA-DE, 2016). In practice, the current low energy density of LiFePO4 batteries means that they cannot provide sufficient ranges for most BEVs and are mostly restricted to hybrid electric vehicles (Ellingsen and Hung, 2018), with BEVs using mostly LiNMC batteries.
Looking to the future, the energy density and cycle life expectancy of all Li-ion battery chemistries is expected to continue improving through further technological development (UBA-DE, 2016), and there is also the potential for new battery chemistries to be employed (e.g. lithium-titanate, lithium-air, sodium ion, aluminium ion) that may have superior energy density or cycle life expectancy.
3.3.4 Manufacturing energy efficiency
Another key means of reducing the impact of BEV production is to take advantage of economies of scale and use the full capacity of production plants to reduce energy consumption per vehicle or battery produced. Estimates of energy consumption in battery manufacture vary widely between 530 and 1 670 MJ/kWh of cell, with the higher end being typical of small-scale pilot facilities and the lower end typical
Source: Battery University, 2018.
Production stage
29 Electric vehicles from life cycle and circular economy perspectives
of a large-scale state-of-the-art production facility (Ellingsen and Hung, 2018). In particular, maximising the throughput of particularly energy-intensive processes, such as electrode drying, will help make sure facilities are being used at full capacity (Dunn et al., 2015). Such improvements in efficiency over time through economies of scale have been observed recently in the production of photovoltaic cells and nanomaterials, and so they can also be expected to occur for batteries (Kim et al., 2016).
3.3.5 Electricity generation mix
A large proportion of the emissions from BEV production result from production of electricity to power energy-intensive processes (Ellingsen and Hung, 2018). For example, for battery manufacture in China, 35-50 % of total GHG emissions arise from electricity consumption (Hao et al., 2017).
The GHG and air pollution emissions associated with electricity production depend on the generation mix available in the place and at the time of vehicle manufacture, which offers scope for abating GHG emissions through decarbonisation of the electricity grid. Currently, different parts of BEVs are manufactured in different locations, but most battery manufacture (the most energy-intensive step) occurs in China, South Korea and Japan, where the carbon intensity of electricity production is relatively high (Ellingsen and Hung, 2018). One study estimated that GHG emissions from battery production in China were up to three times higher than in the United States (Hao et al., 2017). In a hypothetical situation in which electricity generation would come from wind power alone, Ellingsen et al. (2016) estimated that this would result in a roughly 50 % drop in GHG emissions from the production phase compared with the EU electricity grid mix.
In the near term, an expected ~ 30 % fall in the carbon intensity of electricity generation worldwide would be likely to result in a reduction in GHG emissions from battery production of around 17 % by 2030 (ICCT, 2018b). In China, where most Li-ion batteries are currently manufactured, the proportion of renewable energy in the electricity mix is projected to rise sharply
between now and 2025, with a corresponding reduction in the carbon intensity of the generation mix. Over the same period, installation of emissions abatement technology is expected to substantially reduce the emissions of NOx, SO2 and PM from electricity generation in China (Huo et al., 2015).
Differences in emissions of GHG and air pollutants related to the electricity mix are discussed in more detail in Chapter 4.
3.4 Summary: minimising the environmental impacts of BEV production
In summary, a large proportion of the GHG and air pollutant emissions associated with BEV manufacture arise from energy-intensive processes associated with battery manufacture.
The negative environmental impacts could be minimised by:
• increasing the use of renewable electricity to provide energy for BEV production and improved abatement of air pollutant emissions in battery production locations; this could be achieved by a shift in the key battery manufacturing locations towards countries where such conditions already exist, as well as through projected changes in terms of increased use of low-carbon electricity and emissions abatement in current battery manufacturing locations (China, South Korea and Japan);
• consumers choosing the smallest BEV category with the smallest battery required to meet their needs (potentially including non-passenger car options);
• taking advantage of economies of scale and new techniques in battery and vehicle production to minimise energy use per vehicle produced;
• choosing the battery type with the lowest impact per unit of energy provided, while considering weight-related trade-offs with impacts on the use stage.
Use stage
3030
Use stage
Electric vehicles from life cycle and circular economy perspectives
4 Use stage
Life-cycle perspective
• In the use stage, BEVs do not emit GHG or air pollutants through the exhaust. However, emissions occur instead from electricity generation, in addition to local noise and some PM pollution from, for example, tyre wear.
• On a per kilometre basis, GHG and air pollutant emissions of BEVs tend to be lower than those of ICEVs during the use phase due to energy efficiency advantages and the use of low carbon intensity electricity sources.
• At low speeds, BEVs tend to be quieter than ICEVs, but at higher speeds there is little difference in terms of noise pollution.
However, the per kilometre use stage GHG and air pollutant emissions of BEVs depend strongly on patterns of consumption, use and electricity generation.
Renewable energy perspectives
The GHG and air pollutant emissions arising from using BEVs can be minimised by:
• increasing the proportion of low-carbon electricity in the grid mix;
• encouraging flexible charging to take advantage of low-carbon electricity and to avoid creating or exacerbating peaks in demand.
Use patterns
• The in-use impacts of BEVs have to take into account the way they fit into overall mobility patterns. A small number of studies suggest a potential short term 'rebound effect', whereby BEVs are used more intensively than ICEVs, offsetting some of their per kilometre environmental advantage. To avoid this effect, continuing to incentivise using public transport and active travel will be key.
• Consumers choosing the smallest vehicle suitable for their day-to-day needs will reduce the environmental impact. Shared mobility could play a key role here.
4.1 Introduction
4.1.1 Which environmental impacts arise from the in-use stage of the battery electric vehicle life cycle?
This chapter focuses on the environmental impacts arising from the in-use stage of BEVs. These vehicles have zero tailpipe emissions of air pollutants and GHGs
and low engine noise. However, there are some local and off-site impacts, such as emissions from electricity generation. Local impacts of driving a BEV include:
• noise generated from tyre-road interaction, airflow and electric motor operation;
• PM pollution from mechanical braking, tyres, the road surface and resuspension of road dust.
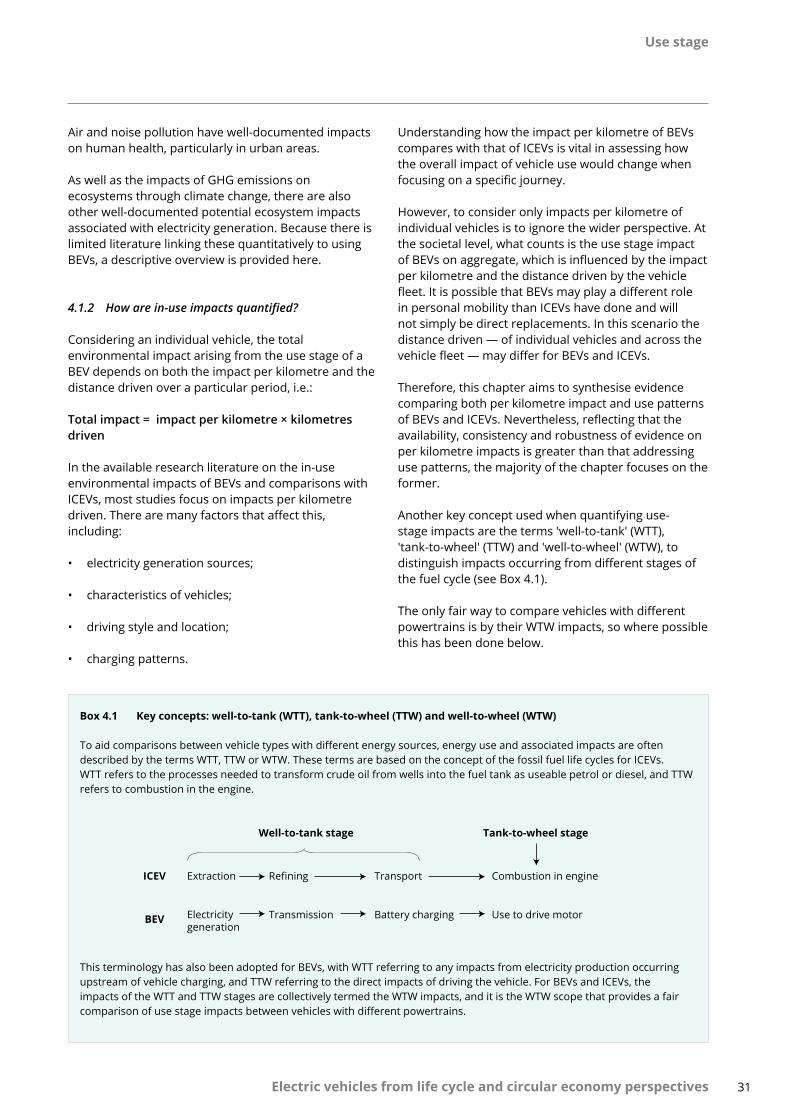
Use stage
31 Electric vehicles from life cycle and circular economy perspectives
Air and noise pollution have well-documented impacts on human health, particularly in urban areas.
As well as the impacts of GHG emissions on ecosystems through climate change, there are also other well-documented potential ecosystem impacts associated with electricity generation. Because there is limited literature linking these quantitatively to using BEVs, a descriptive overview is provided here.
4.1.2 How are in-use impacts quantified?
Considering an individual vehicle, the total environmental impact arising from the use stage of a BEV depends on both the impact per kilometre and the distance driven over a particular period, i.e.:
Total impact = impact per kilometre × kilometres driven
In the available research literature on the in-use environmental impacts of BEVs and comparisons with ICEVs, most studies focus on impacts per kilometre driven. There are many factors that affect this, including:
• electricity generation sources;
• characteristics of vehicles;
• driving style and location;
• charging patterns.
Understanding how the impact per kilometre of BEVs compares with that of ICEVs is vital in assessing how the overall impact of vehicle use would change when focusing on a specific journey.
However, to consider only impacts per kilometre of individual vehicles is to ignore the wider perspective. At the societal level, what counts is the use stage impact of BEVs on aggregate, which is influenced by the impact per kilometre and the distance driven by the vehicle fleet. It is possible that BEVs may play a different role in personal mobility than ICEVs have done and will not simply be direct replacements. In this scenario the distance driven — of individual vehicles and across the vehicle fleet — may differ for BEVs and ICEVs.
Therefore, this chapter aims to synthesise evidence comparing both per kilometre impact and use patterns of BEVs and ICEVs. Nevertheless, reflecting that the availability, consistency and robustness of evidence on per kilometre impacts is greater than that addressing use patterns, the majority of the chapter focuses on the former.
Another key concept used when quantifying use-stage impacts are the terms 'well-to-tank' (WTT), 'tank-to-wheel' (TTW) and 'well-to-wheel' (WTW), to distinguish impacts occurring from different stages of the fuel cycle (see Box 4.1).
The only fair way to compare vehicles with different powertrains is by their WTW impacts, so where possible this has been done below.
Box 4.1 Key concepts: well-to-tank (WTT), tank-to-wheel (TTW) and well-to-wheel (WTW)
To aid comparisons between vehicle types with different energy sources, energy use and associated impacts are often described by the terms WTT, TTW or WTW. These terms are based on the concept of the fossil fuel life cycles for ICEVs. WTT refers to the processes needed to transform crude oil from wells into the fuel tank as useable petrol or diesel, and TTW refers to combustion in the engine.
This terminology has also been adopted for BEVs, with WTT referring to any impacts from electricity production occurring upstream of vehicle charging, and TTW referring to the direct impacts of driving the vehicle. For BEVs and ICEVs, the impacts of the WTT and TTW stages are collectively termed the WTW impacts, and it is the WTW scope that provides a fair comparison of use stage impacts between vehicles with different powertrains.
ICEV Extraction
Electricitygeneration
Refining
Transmission
Transport
Battery charging
Combustion in engine
Use to drive motorBEV
Well-to-tank stage Tank-to-wheel stage
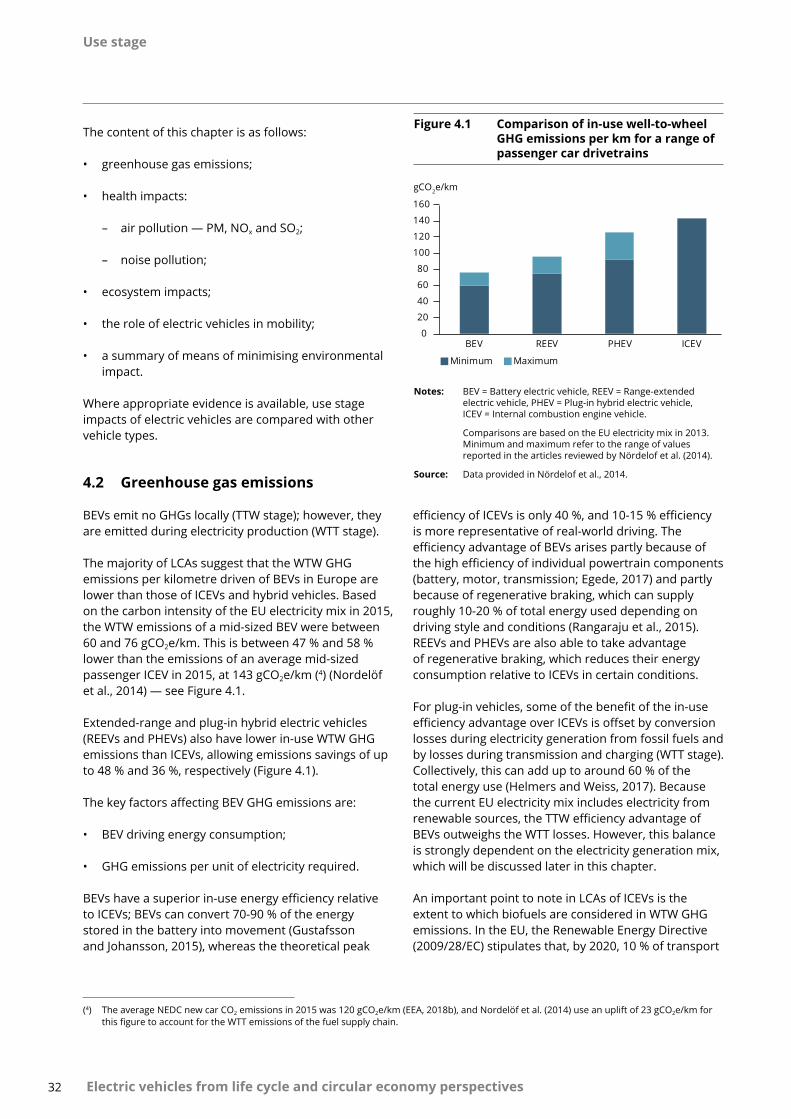
Use stage
32 Electric vehicles from life cycle and circular economy perspectives
The content of this chapter is as follows:
• greenhouse gas emissions;
• health impacts:
– air pollution — PM, NOx and SO2;
– noise pollution;
• ecosystem impacts;
• the role of electric vehicles in mobility;
• a summary of means of minimising environmental impact.
Where appropriate evidence is available, use stage impacts of electric vehicles are compared with other vehicle types.
4.2 Greenhouse gas emissions
BEVs emit no GHGs locally (TTW stage); however, they are emitted during electricity production (WTT stage).
The majority of LCAs suggest that the WTW GHG emissions per kilometre driven of BEVs in Europe are lower than those of ICEVs and hybrid vehicles. Based on the carbon intensity of the EU electricity mix in 2015, the WTW emissions of a mid-sized BEV were between 60 and 76 gCO2e/km. This is between 47 % and 58 % lower than the emissions of an average mid-sized passenger ICEV in 2015, at 143 gCO2e/km (4) (Nordelöf et al., 2014) — see Figure 4.1.
Extended-range and plug-in hybrid electric vehicles (REEVs and PHEVs) also have lower in-use WTW GHG emissions than ICEVs, allowing emissions savings of up to 48 % and 36 %, respectively (Figure 4.1).
The key factors affecting BEV GHG emissions are:
• BEV driving energy consumption;
• GHG emissions per unit of electricity required.
BEVs have a superior in-use energy efficiency relative to ICEVs; BEVs can convert 70-90 % of the energy stored in the battery into movement (Gustafsson and Johansson, 2015), whereas the theoretical peak
Figure 4.1 Comparison of in-use well-to-wheel GHG emissions per km for a range of passenger car drivetrains
0
20
40
60
80
100
120
140
160
BEV REEV PHEV ICEV
gCO2e/km
Minimum Maximum
Notes: BEV = Battery electric vehicle, REEV = Range-extended electric vehicle, PHEV = Plug-in hybrid electric vehicle, ICEV = Internal combustion engine vehicle.
Comparisons are based on the EU electricity mix in 2013. Minimum and maximum refer to the range of values reported in the articles reviewed by Nördelof et al. (2014).
Source: Data provided in Nördelof et al., 2014.
(4) The average NEDC new car CO2 emissions in 2015 was 120 gCO2e/km (EEA, 2018b), and Nordelöf et al. (2014) use an uplift of 23 gCO2e/km for this figure to account for the WTT emissions of the fuel supply chain.
efficiency of ICEVs is only 40 %, and 10-15 % efficiency is more representative of real-world driving. The efficiency advantage of BEVs arises partly because of the high efficiency of individual powertrain components (battery, motor, transmission; Egede, 2017) and partly because of regenerative braking, which can supply roughly 10-20 % of total energy used depending on driving style and conditions (Rangaraju et al., 2015). REEVs and PHEVs are also able to take advantage of regenerative braking, which reduces their energy consumption relative to ICEVs in certain conditions.
For plug-in vehicles, some of the benefit of the in-use efficiency advantage over ICEVs is offset by conversion losses during electricity generation from fossil fuels and by losses during transmission and charging (WTT stage). Collectively, this can add up to around 60 % of the total energy use (Helmers and Weiss, 2017). Because the current EU electricity mix includes electricity from renewable sources, the TTW efficiency advantage of BEVs outweighs the WTT losses. However, this balance is strongly dependent on the electricity generation mix, which will be discussed later in this chapter.
An important point to note in LCAs of ICEVs is the extent to which biofuels are considered in WTW GHG emissions. In the EU, the Renewable Energy Directive (2009/28/EC) stipulates that, by 2020, 10 % of transport
Use stage
33 Electric vehicles from life cycle and circular economy perspectives
energy consumption will come from renewable sources, and biofuels are expected to play a key role in achieving this. Biofuels are currently blended into petrol and diesel for use in ICEVs. Assuming that the biofuel is sustainably produced, this would reduce the in-use GHG emissions of ICEVs relative to pure fossil fuel petrol or diesel. In most cases, LCA methodology does not specify whether the biofuel content of automotive fuel is taken into account. As the proportion of biofuels in petrol and diesel increases, this is therefore a key area for improvement in LCA transparency.
4.3 Health impacts
In Europe, road transport is the largest source of air and noise pollution in most urban areas. From a health perspective, PM, NOx and ground-level ozone are considered the pollutants of most concern, the last more so in rural areas. The impacts of long-term and peak exposure to these pollutants range from impairing the respiratory system to premature death. A high percentage of people living in urban areas in Europe are exposed to pollutant concentrations above air quality standards, i.e. to levels deemed harmful to health (EEA, 2017c).
Long-term exposure to road noise is linked to a wide range of health issues including sleep disturbance, annoyance and negative effects on the cardiovascular system and metabolism. In Europe, around one in four people are exposed to long-term average road noise levels of at least over 55 dB(A), sufficient to cause annoyance, and one in six to night-time road noise levels of at least over 50 dB, sufficient to cause sleep disturbance (Blanes et al., 2016).
At first sight, BEVs appear to be ideally suited to addressing both of these issues, having zero tailpipe emissions of air pollutants and reduced engine noise. However, there are some key considerations that influence the net outcome for human health, such as:
• local emissions of non-exhaust PM caused by all motor vehicles;
• emissions of air pollutants elsewhere for electricity generation; and
• road safety impacts of reduced engine noise.
This section describes the key features of electric vehicles with regard to air pollution and noise in the
use stage and summarises how the maximum potential benefit of BEVs relative to ICEVs can be realised.
4.3.1 Local air pollution
BEVs have zero emissions of air pollutants through tailpipe exhaust, but non-exhaust PM is still emitted as the vehicle moves, and electricity generation to power the vehicles is responsible for emissions of PM, NOx, SO2 and other air pollutants.
ICEVs emit PM2.5 and PM10 (5) from the exhaust, the abrasion of brake pads, release from both tyres and the road surface due to abrasion between them and also resuspension of existing road dust due to the contact with tyres and turbulent air as the vehicle travels. BEVs also emit PM from tyre-road abrasion and resuspension but emit zero PM from exhaust, and emissions from brake pad abrasion are reduced thanks to their use of regenerative braking where possible.
Estimates of local PM emissions from BEVs, and the comparison with those of ICEVs, vary considerably because of the difficulty of measuring them reliably in real-life conditions. Using emission factors used in a range of national emission inventories, Timmers and Achten (2016) concluded that BEVs likely produce levels of PM10 and PM2.5 pollution similar to or only slightly lower than those of ICEVs. The rationale for this is that tyre and road wear and resuspension combined make up around 80 % of PM emissions from Euro 6 petrol and diesel vehicles, and that BEVs tend on average to be heavier than the equivalent ICEVs, causing greater rates of road and tyre wear. In contrast Hooftman et al. (2016) found that, when using data on real-world exhaust emissions of PM from ICEVs, BEVs emit only around half and one eighth the total amount of local PM10 compared with Euro 6 petrol and diesel vehicles, respectively.
A further consideration is the effect of driving conditions. For example, in stop-start urban driving where speeds are low, brake wear particles can constitute up to 55 % of total PM10 emissions from ICEVs, so regenerative braking by BEVs is likely to provide a large reduction in local PM emissions relative to ICEVs in these conditions (Hooftman et al., 2016). In contrast, on motorways brake wear particles may account for only 3 % of total PM10 emissions from ICEVs (Hooftman et al., 2016), so the advantage of BEVs over ICEVs is smaller, being based mainly on their having zero exhaust emissions.
(5) PM10 is particulate matter with a diameter of 10 μm or less, and PM2.5 is particulate matter with a diameter of 2.5 μm or less.
Use stage
34 Electric vehicles from life cycle and circular economy perspectives
Finally, it is worth noting that resuspension of PM requires existing PM to be present on the road surface. If the input of 'new' particles from brake wear and exhaust reduces over time as exhaust emissions continue to decrease and BEVs become more common, then emissions from resuspension may also decline in tandem.
4.3.2 Air pollutant emissions from electricity production
Electricity production to charge BEV batteries results in emissions of air pollutants from power stations. For SO2 and NOx, electricity production is the only source of emissions in the use stage, whereas PM (PM10 and PM2.5) is also released locally during driving (see Section 4.3.1).
As with GHG emissions, the quantity of NOx, SO2 and PM emissions attributable to BEV electricity demand varies according to the energy consumption of the vehicle and electricity generation source. However, for air pollutants the use of emissions abatement technology and fuel quality in power stations play an additional role in determining the per kilometre emissions of BEVs. Based on the 2013 EU-28 electricity mix, WTW SO2 and PM10 emissions per kilometre in the use stage were similar to those from petrol ICEVs and slightly greater than those from diesel ICEVs (Hawkins et al., 2013). This is because of the large amount of these substances emitted from coal-fired power stations.
However, the situation differs depending on the country, according to the electricity generation type and abatement technology installed. For example, a study of regions in China and the United States found that in those regions with a high proportion of coal-based electricity, WTW NOx, PM10 and SO2 emissions of BEVs were up to two, three to four and four times, respectively, those of an ICEV (Huo et al., 2015). However, the same study highlighted the important role of abatement technology; by 2025, expected reductions in the emissions from electricity generation will mean that BEVs will deliver reductions in NOx, PM10 and SO2 emissions even with coal-dominated electricity generation.
In contrast, a case study based on the 2011 electricity mix for Belgium showed that the WTW emissions of NOx and SO2 of a typical BEV were considerably lower
than those of comparable petrol and diesel cars, whereas WTW PM emissions were only slightly lower (Rangaraju et al., 2015). Related to this, in Belgium, around 60 % of electricity is generated from nuclear power, and gas is the second most important source of electricity.
The importance of the electricity mix in determining impacts is discussed further in Section 4.5.
4.3.3 Air quality, exposure and health impacts
To understand the impact of ICEVs and BEVs on human health the location of emissions is relevant. In urban centres, street-level emissions of NOx, PM, hydrocarbons and other pollutants from ICEVs and other sources can lead to very high local concentrations in areas close to where people live and work, thus having a substantial health impact. In contrast, emissions from power stations tend to occur away from densely populated areas, contributing to the background concentration over a large area. In other words, a shift from mainly urban to mainly extra-urban emissions is likely to lead to lower overall human exposure in most urban areas, albeit with an increase in exposure in some extra-urban areas.
For example, a modelling study in Barcelona and Madrid found that, compared with the current vehicle fleet, electrifying 40 % of vehicles would reduce peak hourly NO2 concentrations by up to 16 % (30 and 35 µg/m3 in Barcelona and Madrid, respectively). The additional emissions from power stations caused a downwind increase in concentration of less than 3 µg/m3 (Soret et al., 2014).
A study in Belgium found that using BEVs has lower human health impacts than using even the least polluting ICEVs (Euro 6 petrol vehicles) and considerably lower impacts than all diesel vehicles (Hooftman et al., 2016). Because of Belgium's nuclear power-dominated electricity mix, the impact of emissions produced through electricity generation for BEVs was smaller than the impact avoided from ICEV exhaust emissions.
However, in locations where electricity generation is based on coal burning and that are close to population centres (e.g. in some Chinese regions), urban concentrations of NOx, SO2 and PM10 may be increased by replacing ICEVs with BEVs (Huo et al., 2015).
Use stage
35 Electric vehicles from life cycle and circular economy perspectives
4.3.4 Noise pollution
Components of traffic noise
Road traffic noise is a combination of propulsion noise (the engine, exhaust and associated systems), tyre-road noise and aerodynamic noise. The contribution of each of these components depends strongly on vehicle speed, as well as on the road surface texture and gradient.
At very low speeds (< 10 km/h), noise from passenger ICEVs is dominated by propulsion noise. BEV electric motors (and associated power electronics) are estimated to be around 10 dB quieter than ICEV engines (RIVM, 2010), so at low speeds each ICEV is roughly as loud as 10 BEVs. In addition, the sound emitted from BEV drivetrains is higher pitched than that from ICEV engines. Higher pitched sounds attenuate more quickly with increasing distance than lower pitched sounds, although they may be perceived as more annoying (UBA-DE, 2013).
With increasing speed, noise generated by the interaction between the tyres and the road becomes more important, and it dominates from around 25-30 km/h (UBA-DE, 2013; Campello-Vicente et al., 2017). Unlike engine noise, tyre-road noise does not differ systematically between BEVs and ICEVs. At 50 km/h, the noise reduction potential of a BEV relative to an ICEV is only around 1 dB (RIVM, 2010; Campello-Vicente et al., 2017) — a difference barely perceptible to the human ear. At very high speeds, aerodynamic noise also plays a part, but again there is no large systematic difference between BEVs and ICEVs.
Therefore, the impact of BEVs on passenger car noise is expected to be significant in urban areas where speeds are low and stationary traffic is common (RIVM, 2010; Campello-Vicente et al., 2017), while on major roads and motorways it will be negligible. Although not the focus of this report, it is worth noting that for other vehicle types (such as scooters and motorcycles), engine noise dominates up to higher speeds, so electrification would also bring benefits outside urban areas (UBA-DE, 2013).
Impact on noise exposure
Given the difficulty of conducting real noise measurements with controlled experiments (e.g. changing the fleet in certain streets of a city for a certain period), most of the approaches used to study the effect of BEVs on traffic noise have used models in combination with limited observational measurements in real conditions.
For example, Campello-Vicente et al. (2017) provided an in-depth assessment of the potential impact of BEVs on noise exposure. Considering a representative low speed, e.g. 30 km/h, noise levels were 2 dB higher next to a traffic lane of ICEVs than in the same lane containing only BEVs. This difference is greater if it is evaluated at a lower traffic speed, but it is not common to simulate a traffic street on a noise map with a velocity lower than 30 km/h. In contrast, the difference approaches zero at speeds above 50 km/h. A similar modelling study simulating 90 % electrification of the light vehicle fleet in the city of Utrecht (Netherlands) found that the number of people severely annoyed and seriously annoyed by traffic noise fell by over one third (RIVM, 2010).
While a very significant noise reduction can be achieved for a single electric vehicle, there will be a marked impact for traffic as a whole only if it contains a high proportion of low-noise passenger cars. In Germany, UBA-DE (2013) estimated that replacing 1 million ICEVs with BEVs by 2020 (~ 2 % of the passenger car fleet) would result in a noise reduction of only around 0.1 dB on urban roads (30 km/h).
Noise and road safety
A key policy influence on noise emissions from electric vehicles over the coming years is Regulation (EU) No 540/2014 on the sound level of motor vehicles, which includes a requirement for electric and hybrid electric vehicles to be fitted with acoustic vehicle alerting systems or AVASs. These are intended to compensate for reduced audible signals at low speeds (up to 20 km/h). They are for the safety of those who currently, to some extent, rely on acoustic signals from vehicles, in particular blind and visually impaired road users.
Campello-Vicente et al. (2017) simulated the impact of replacing ICEVs with BEVs, with and without AVASs, on overall noise exposure in the Elche urban area of Spain. Their findings show that without AVASs, a light-duty vehicle fleet comprising only BEVs would reduce the percentage of people exposed to road noise above 65 dB (the local maximum permitted level) by 10 points compared with a wholly ICEV fleet. With the addition of AVASs in all BEVs, the reduction would still be 6 percentage points.
Although AVASs are required to produce a continuous sound 'similar to the sound of a vehicle of the same category equipped with an internal combustion engine', there may be potential to specify the acoustic properties of AVASs such that the impact of noise on people is reduced compared with that of an ICEV.
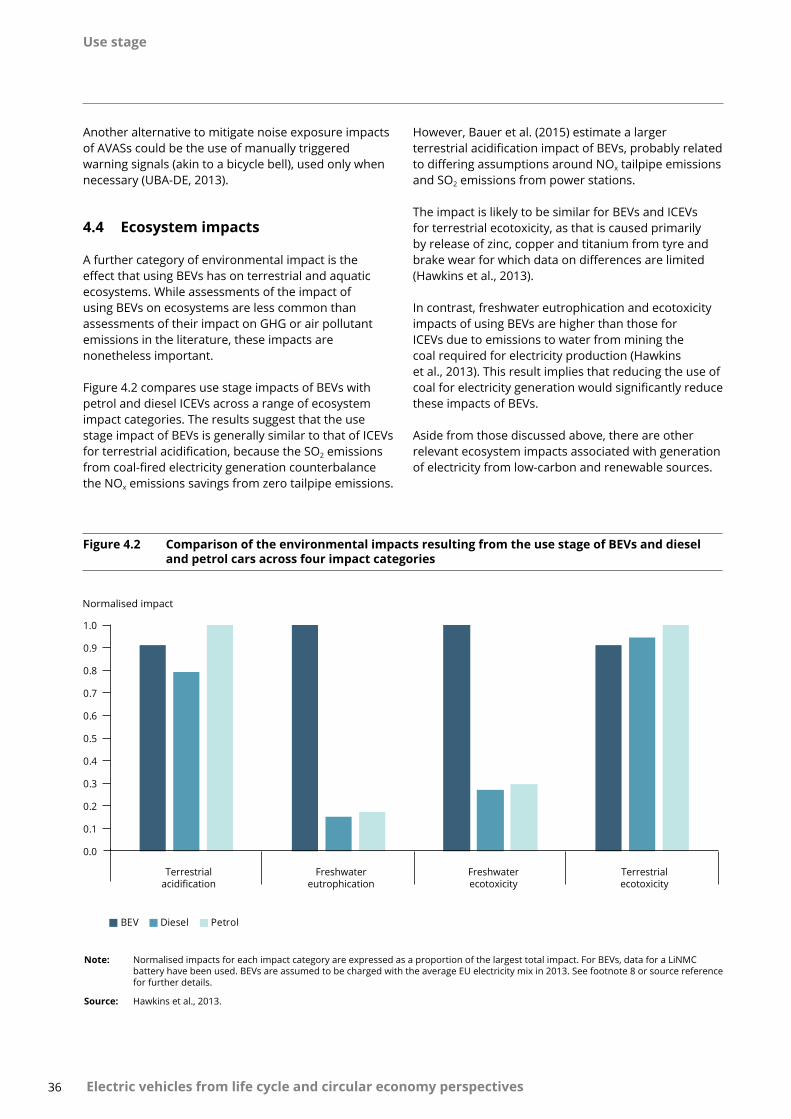
Use stage
36 Electric vehicles from life cycle and circular economy perspectives
Figure 4.2 Comparison of the environmental impacts resulting from the use stage of BEVs and diesel and petrol cars across four impact categories
0.0
0.1
0.2
0.3
0.4
0.5
0.6
0.7
0.8
0.9
1.0
Normalised impact
BEV Diesel Petrol
Terrestrialacidification
Freshwatereutrophication
Freshwaterecotoxicity
Terrestrialecotoxicity
Note: Normalised impacts for each impact category are expressed as a proportion of the largest total impact. For BEVs, data for a LiNMC battery have been used. BEVs are assumed to be charged with the average EU electricity mix in 2013. See footnote 8 or source reference for further details.
Source: Hawkins et al., 2013.
Another alternative to mitigate noise exposure impacts of AVASs could be the use of manually triggered warning signals (akin to a bicycle bell), used only when necessary (UBA-DE, 2013).
4.4 Ecosystem impacts
A further category of environmental impact is the effect that using BEVs has on terrestrial and aquatic ecosystems. While assessments of the impact of using BEVs on ecosystems are less common than assessments of their impact on GHG or air pollutant emissions in the literature, these impacts are nonetheless important.
Figure 4.2 compares use stage impacts of BEVs with petrol and diesel ICEVs across a range of ecosystem impact categories. The results suggest that the use stage impact of BEVs is generally similar to that of ICEVs for terrestrial acidification, because the SO2 emissions from coal-fired electricity generation counterbalance the NOx emissions savings from zero tailpipe emissions.
However, Bauer et al. (2015) estimate a larger terrestrial acidification impact of BEVs, probably related to differing assumptions around NOx tailpipe emissions and SO2 emissions from power stations.
The impact is likely to be similar for BEVs and ICEVs for terrestrial ecotoxicity, as that is caused primarily by release of zinc, copper and titanium from tyre and brake wear for which data on differences are limited (Hawkins et al., 2013).
In contrast, freshwater eutrophication and ecotoxicity impacts of using BEVs are higher than those for ICEVs due to emissions to water from mining the coal required for electricity production (Hawkins et al., 2013). This result implies that reducing the use of coal for electricity generation would significantly reduce these impacts of BEVs.
Aside from those discussed above, there are other relevant ecosystem impacts associated with generation of electricity from low-carbon and renewable sources.
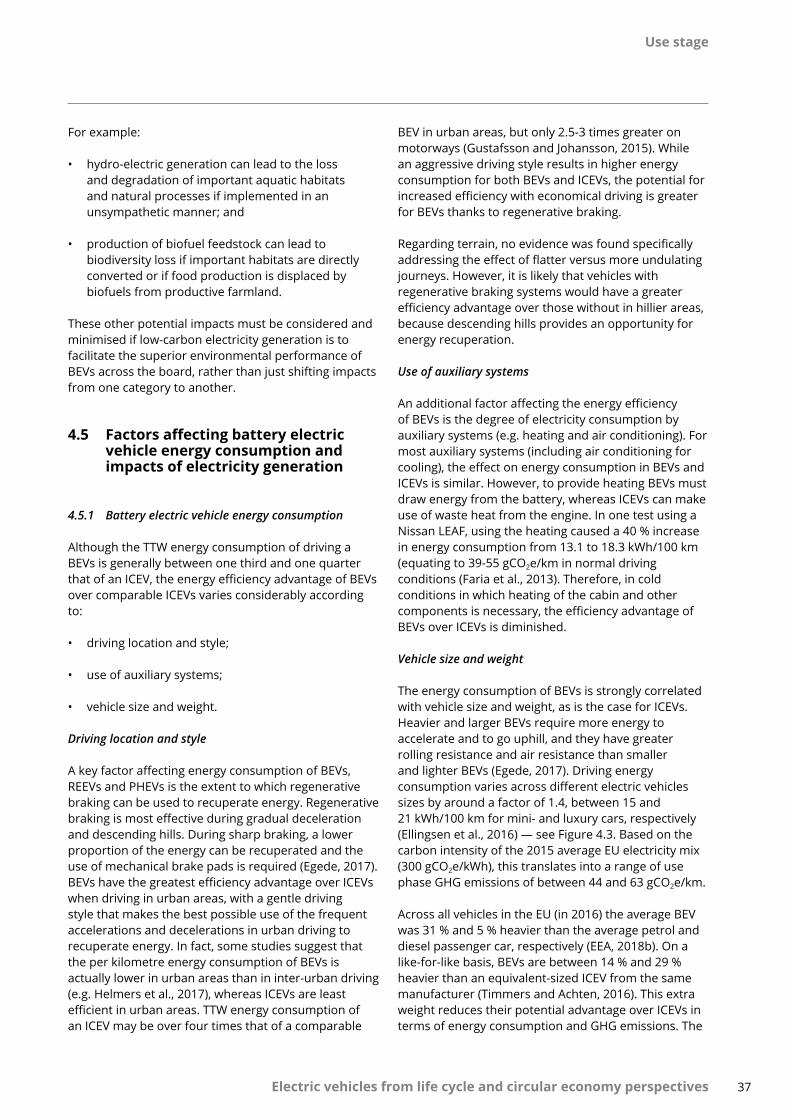
Use stage
37 Electric vehicles from life cycle and circular economy perspectives
For example:
• hydro-electric generation can lead to the loss and degradation of important aquatic habitats and natural processes if implemented in an unsympathetic manner; and
• production of biofuel feedstock can lead to biodiversity loss if important habitats are directly converted or if food production is displaced by biofuels from productive farmland.
These other potential impacts must be considered and minimised if low-carbon electricity generation is to facilitate the superior environmental performance of BEVs across the board, rather than just shifting impacts from one category to another.
4.5 Factors affecting battery electric vehicle energy consumption and impacts of electricity generation
4.5.1 Battery electric vehicle energy consumption
Although the TTW energy consumption of driving a BEVs is generally between one third and one quarter that of an ICEV, the energy efficiency advantage of BEVs over comparable ICEVs varies considerably according to:
• driving location and style;
• use of auxiliary systems;
• vehicle size and weight.
Driving location and style
A key factor affecting energy consumption of BEVs, REEVs and PHEVs is the extent to which regenerative braking can be used to recuperate energy. Regenerative braking is most effective during gradual deceleration and descending hills. During sharp braking, a lower proportion of the energy can be recuperated and the use of mechanical brake pads is required (Egede, 2017). BEVs have the greatest efficiency advantage over ICEVs when driving in urban areas, with a gentle driving style that makes the best possible use of the frequent accelerations and decelerations in urban driving to recuperate energy. In fact, some studies suggest that the per kilometre energy consumption of BEVs is actually lower in urban areas than in inter-urban driving (e.g. Helmers et al., 2017), whereas ICEVs are least efficient in urban areas. TTW energy consumption of an ICEV may be over four times that of a comparable
BEV in urban areas, but only 2.5-3 times greater on motorways (Gustafsson and Johansson, 2015). While an aggressive driving style results in higher energy consumption for both BEVs and ICEVs, the potential for increased efficiency with economical driving is greater for BEVs thanks to regenerative braking.
Regarding terrain, no evidence was found specifically addressing the effect of flatter versus more undulating journeys. However, it is likely that vehicles with regenerative braking systems would have a greater efficiency advantage over those without in hillier areas, because descending hills provides an opportunity for energy recuperation.
Use of auxiliary systems
An additional factor affecting the energy efficiency of BEVs is the degree of electricity consumption by auxiliary systems (e.g. heating and air conditioning). For most auxiliary systems (including air conditioning for cooling), the effect on energy consumption in BEVs and ICEVs is similar. However, to provide heating BEVs must draw energy from the battery, whereas ICEVs can make use of waste heat from the engine. In one test using a Nissan LEAF, using the heating caused a 40 % increase in energy consumption from 13.1 to 18.3 kWh/100 km (equating to 39-55 gCO2e/km in normal driving conditions (Faria et al., 2013). Therefore, in cold conditions in which heating of the cabin and other components is necessary, the efficiency advantage of BEVs over ICEVs is diminished.
Vehicle size and weight
The energy consumption of BEVs is strongly correlated with vehicle size and weight, as is the case for ICEVs. Heavier and larger BEVs require more energy to accelerate and to go uphill, and they have greater rolling resistance and air resistance than smaller and lighter BEVs (Egede, 2017). Driving energy consumption varies across different electric vehicles sizes by around a factor of 1.4, between 15 and 21 kWh/100 km for mini- and luxury cars, respectively (Ellingsen et al., 2016) — see Figure 4.3. Based on the carbon intensity of the 2015 average EU electricity mix (300 gCO2e/kWh), this translates into a range of use phase GHG emissions of between 44 and 63 gCO2e/km.
Across all vehicles in the EU (in 2016) the average BEV was 31 % and 5 % heavier than the average petrol and diesel passenger car, respectively (EEA, 2018b). On a like-for-like basis, BEVs are between 14 % and 29 % heavier than an equivalent-sized ICEV from the same manufacturer (Timmers and Achten, 2016). This extra weight reduces their potential advantage over ICEVs in terms of energy consumption and GHG emissions. The
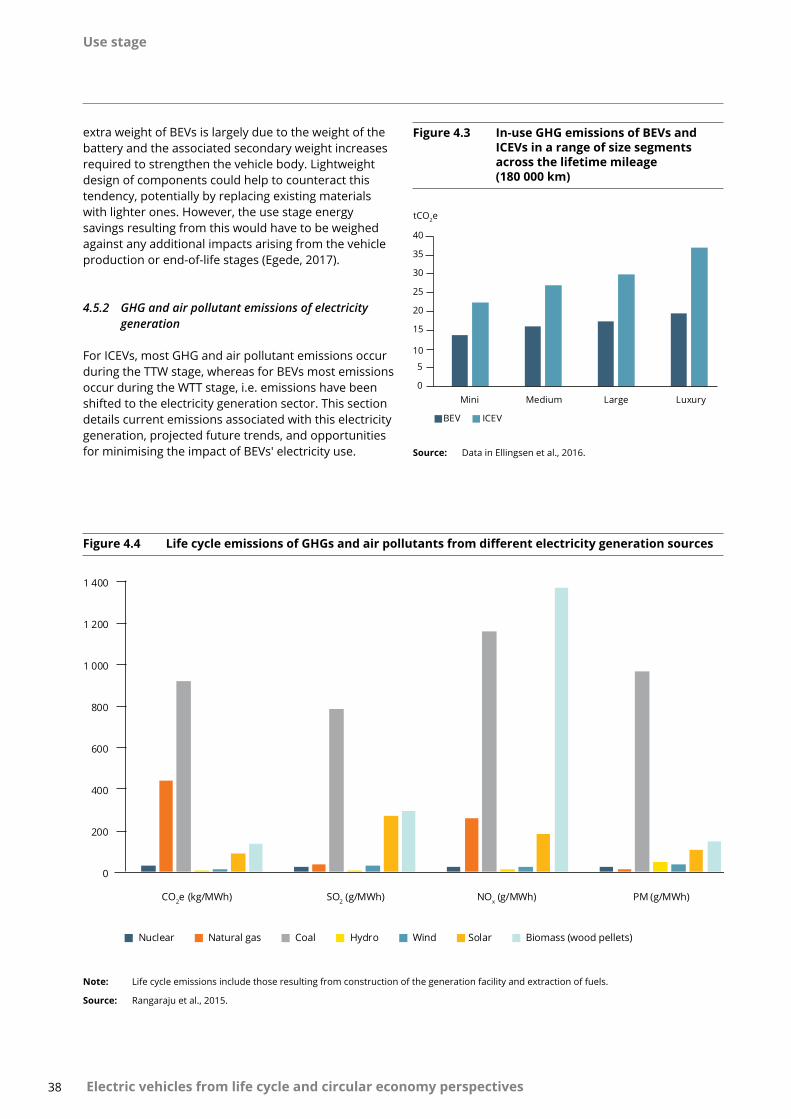
Use stage
38 Electric vehicles from life cycle and circular economy perspectives
Figure 4.3 In-use GHG emissions of BEVs and ICEVs in a range of size segments across the lifetime mileage (180 000 km)
0
5
10
ICEV
15
20
25
30
35
40
Mini Medium Large Luxury
BEV
tCO2e
Source: Data in Ellingsen et al., 2016.
extra weight of BEVs is largely due to the weight of the battery and the associated secondary weight increases required to strengthen the vehicle body. Lightweight design of components could help to counteract this tendency, potentially by replacing existing materials with lighter ones. However, the use stage energy savings resulting from this would have to be weighed against any additional impacts arising from the vehicle production or end-of-life stages (Egede, 2017).
4.5.2 GHG and air pollutant emissions of electricity generation
For ICEVs, most GHG and air pollutant emissions occur during the TTW stage, whereas for BEVs most emissions occur during the WTT stage, i.e. emissions have been shifted to the electricity generation sector. This section details current emissions associated with this electricity generation, projected future trends, and opportunities for minimising the impact of BEVs' electricity use.
Figure 4.4 Life cycle emissions of GHGs and air pollutants from different electricity generation sources
0
200
400
600
800
1 000
1 200
1 400
CO2e (kg/MWh) SO2 (g/MWh) NOx (g/MWh) PM (g/MWh)
Nuclear Natural gas Coal Hydro Wind Solar Biomass (wood pellets)
Note: Life cycle emissions include those resulting from construction of the generation facility and extraction of fuels.
Source: Rangaraju et al., 2015.
Use stage
39 Electric vehicles from life cycle and circular economy perspectives
Current emissions
Different types of electricity generation are currently associated with very different GHG and air pollutant emissions per unit of electricity produced (Figure 4.4).
Coal-fired power stations have the highest life cycle GHG emission intensity, at more than twice that of natural gas-fired power stations. Coal-fired power stations also have the highest emission intensities for SO2 and PM. Non-biomass renewable energy sources and nuclear power have the lowest carbon intensity, although it is not zero because of the emissions from constructing the generating facilities. Hydro- and wind power have low emissions for all pollutants (Rangaraju et al., 2015).
Due to the high carbon intensity of coal, WTW GHG emissions of typical BEVs charged exclusively with coal-generated electricity are at least as high as for an equivalent ICEV, at between 139 and 175 gCO2e/km, whereas charging with other fossil fuel generation types results in slightly lower GHG emissions for BEVs than ICEVs (Nördelof et al., 2014). In contrast, a BEV charged exclusively with wind power would have WTW GHG emissions of only 1-2 gCO2e/km.
(6) Based on the 2012 electricity mix presented in Wu and Zhang (2017).
Based on average electricity mixes across Europe in 2013, the GHG emissions per kilometre of BEVs charged in different countries across Europe varies considerably. Estimated use stage GHG emissions of a typical BEV ranged between 9 gCO2/km in Sweden, where nuclear and hydro-electric generation dominate, and 234 gCO2/km in Latvia, which imports electricity largely from coal from neighbouring countries (Moro and Lonza, 2017). Box 4.2 provides more detail on how grid generation mix affects the intensity of CO2 emissions.
Variation between countries can be observed for air pollutant emissions. For example, one study found that in Germany (6) a BEV had 32 % greater WTW per kilometre emissions of PM10 than an ICEV, whereas in France BEV emissions were 17 % lower (Wu and Zhang, 2017).
Globally, the electricity mix in vehicle and component manufacturing locations also has a large impact on the life cycle emissions of BEVs (see Chapter 3). In China — the largest producer of Li-ion batteries (see Figure 3.1) — coal power dominates electricity generation (75 % in 2014) and the current abatement of emissions is low (Huo et al., 2015; Wu and Zhang, 2017). This results
Box 4.2 Grid mix
The average grid mix for a country or the EU as a whole represents the total amount of electrical energy fed into the grid from each generation source over the course of the entire year, 24 hours per day. This determines the average GHG and air pollutant emissions of the electricity supply.
However, the GHG and air pollutant emissions of the instantaneous grid mix varies across months of the year, days of the week and time of day according to fluctuations in electricity demand, the intermittent supply of electricity from renewable sources and the type of generation used to respond to peaks in demand. Across the EU, renewable electricity has priority access to the grid, guaranteed by the Renewable Energy Directive (2009/28/EC), with other forms of generation feeding in electricity in order of price until demand is met (the 'merit order' principle).
In some countries, after renewable generation, nuclear and coal generation provide an inflexible 'base load' of continuous generation (e.g. France and Poland, respectively); additional demand above the base load may need to be met through dispatchable gas- and oil-fired power stations, imports or release for storage. In other countries, the generation capacity of renewables is high (e.g. Germany and Denmark), and other generation sources must operate very flexibly to ramp supply up or down to adapt to the intermittent supply of electricity from renewables.
In a case study of the Belgian electricity mix in 2011, GHG emissions were on average 13 % higher during daytime peak periods than during off-peak periods and varied by 56-57 % across months of the year, being highest in February and lowest in August (Rangaraju et al., 2015). The emissions intensity of SO2, NOx and PM showed similar variability between peak and off-peak periods and even greater variability across months of the year, being around 2, 1.7 and 2.4 times higher in February than in August.
Flexible charging of BEVs can help to balance supply and demand in all cases, either by shifting demand to off-peak periods where supply is less flexible or by absorbing excess generation where supply is variable.
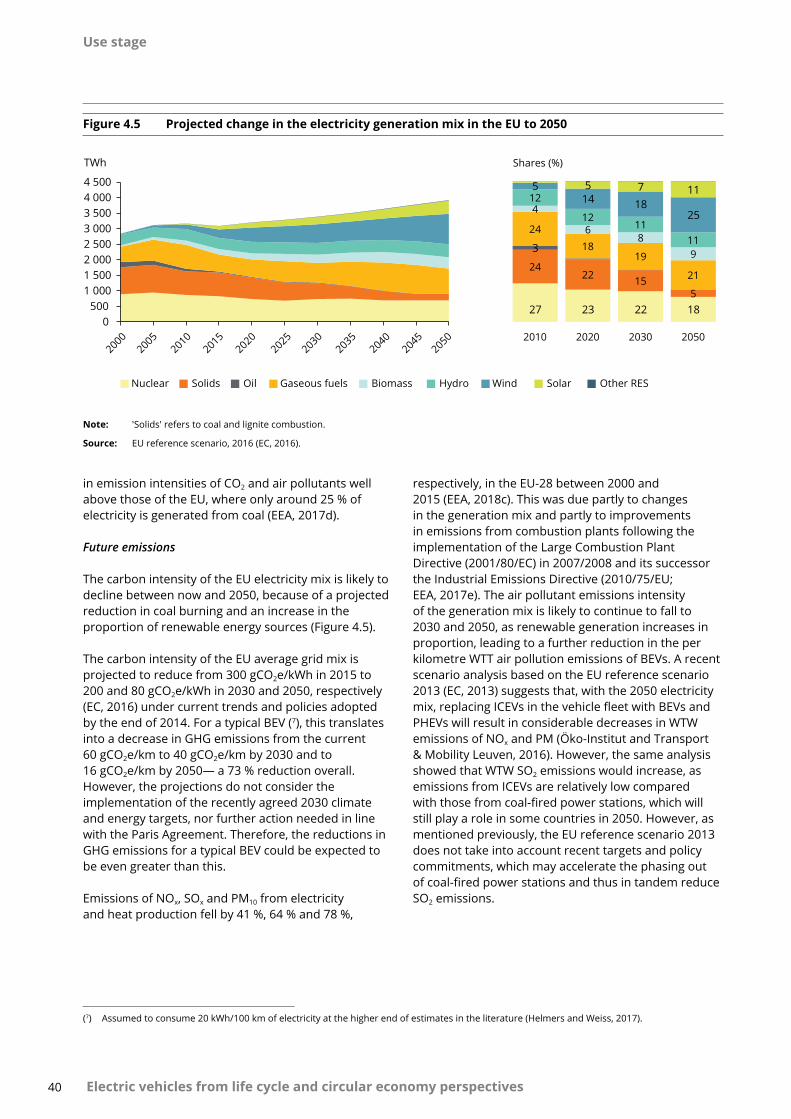
Use stage
40 Electric vehicles from life cycle and circular economy perspectives
in emission intensities of CO2 and air pollutants well above those of the EU, where only around 25 % of electricity is generated from coal (EEA, 2017d).
Future emissions
The carbon intensity of the EU electricity mix is likely to decline between now and 2050, because of a projected reduction in coal burning and an increase in the proportion of renewable energy sources (Figure 4.5).
The carbon intensity of the EU average grid mix is projected to reduce from 300 gCO2e/kWh in 2015 to 200 and 80 gCO2e/kWh in 2030 and 2050, respectively (EC, 2016) under current trends and policies adopted by the end of 2014. For a typical BEV (7), this translates into a decrease in GHG emissions from the current 60 gCO2e/km to 40 gCO2e/km by 2030 and to 16 gCO2e/km by 2050— a 73 % reduction overall. However, the projections do not consider the implementation of the recently agreed 2030 climate and energy targets, nor further action needed in line with the Paris Agreement. Therefore, the reductions in GHG emissions for a typical BEV could be expected to be even greater than this.
Emissions of NOx, SOx and PM10 from electricity and heat production fell by 41 %, 64 % and 78 %,
Figure 4.5 Projected change in the electricity generation mix in the EU to 2050
0500
1 0001 5002 0002 5003 0003 5004 0004 500
TWh
Other RESSolarWindHydroBiomassGaseous fuelsOilSolidsNuclear
27 23 22 18
2422 15
5
3
24
1819
21
4
68
9
12
1211
11
514 18
25
5 7 11
2010 2020 2030 2050
Shares (%)
20002005
20102015
20202025
20302035
20452040
2050
Note: 'Solids' refers to coal and lignite combustion.
Source: EU reference scenario, 2016 (EC, 2016).
respectively, in the EU-28 between 2000 and 2015 (EEA, 2018c). This was due partly to changes in the generation mix and partly to improvements in emissions from combustion plants following the implementation of the Large Combustion Plant Directive (2001/80/EC) in 2007/2008 and its successor the Industrial Emissions Directive (2010/75/EU; EEA, 2017e). The air pollutant emissions intensity of the generation mix is likely to continue to fall to 2030 and 2050, as renewable generation increases in proportion, leading to a further reduction in the per kilometre WTT air pollution emissions of BEVs. A recent scenario analysis based on the EU reference scenario 2013 (EC, 2013) suggests that, with the 2050 electricity mix, replacing ICEVs in the vehicle fleet with BEVs and PHEVs will result in considerable decreases in WTW emissions of NOx and PM (Öko-Institut and Transport & Mobility Leuven, 2016). However, the same analysis showed that WTW SO2 emissions would increase, as emissions from ICEVs are relatively low compared with those from coal-fired power stations, which will still play a role in some countries in 2050. However, as mentioned previously, the EU reference scenario 2013 does not take into account recent targets and policy commitments, which may accelerate the phasing out of coal-fired power stations and thus in tandem reduce SO2 emissions.
(7) Assumed to consume 20 kWh/100 km of electricity at the higher end of estimates in the literature (Helmers and Weiss, 2017).
Use stage
41 Electric vehicles from life cycle and circular economy perspectives
The effect of charging patterns on battery electric vehicle greenhouse gas and air pollutant emissions
While the average grid mix is a useful approximation for the likely GHG emissions of BEV charging, it fails to take into account the influence that the dynamics of electricity supply and demand can have on the GHG emissions at a specific moment in time (Nealer and Hendrickson, 2015). The exact WTW GHG and air pollutant emissions for any given charging event depend on the instantaneous grid mix, which varies according to time of year, time of day and the level of electricity demand (see Box 4.2).
The key point is that the grid mix is not independent of demand; the additional demand created by BEV charging may result in a shift in the grid mix of electricity, resulting in either an increase or a decrease in the GHG and air pollutant emissions intensity of the mix, depending on the type of generation available to meet the additional demand (Öko-Institut and Transport & Mobility Leuven, 2016). For example:
• BEV charging during times when supply of renewable electricity outstrips demand (e.g. during the middle of the day when solar photovoltaic (PV) generation is available) will help to integrate this excess into the grid, resulting in a grid mix with lower GHG and air pollutant emissions on average.
• BEV charging in the evening, coinciding with peaks in other energy use, will often have high GHG emissions, as the extra demand is often met using carbon-intensive sources of electricity such as gas- and oil-fired power stations (Öko-Institut and Transport & Mobility Leuven, 2016).
Charging management
Currently, most BEV owners charge their vehicles at home in the evening and overnight (Haugneland, 2016). Charging commences immediately, which coincides with and adds to peak household demand whereby high-carbon-intensity dispatchable generation sources
are likely to be required in many countries to meet demand.
As the number of BEVs increases in the future, management of charging patterns to minimise the GHG emissions of electricity generation (as well as stress on distribution networks) will become ever more important. For example, in the United Kingdom scenario modelling indicates that the additional peak electricity consumption could be as much as 18 GW higher in 2050 than at present (roughly 30 % of the 2016 peak consumption of around 60 GW) if electric vehicle penetration is high, cars large and charging occurs during peak times (National Grid, 2017). In contrast, if charging times are managed, the additional peak electricity consumption would be much lower — around 6 GW (10 % of current peak consumption). Box 4.2 discusses future mobility and charging patterns.
A strong policy incentive to minimise GHG emissions from using BEVs will be provided by the EU Emissions Trading Scheme (ETS), which covers total electricity generation. As the total number of emission allowances is capped, additional electricity demand from BEVs should not cause an increase in GHG emissions (CE Delft et al., 2011).
In order to minimise the WTW GHG emissions of BEVs, charging must:
• promote integration of low-carbon electricity into the grid; and
• avoid causing or exacerbating peaks in demand that would require high-carbon electricity to be brought online.
A key means of managing charging is through so-called 'smart charging', whereby charging timing is controlled by the network operator directly or via an intermediary to achieve goals such as grid stability, low electricity cost or renewable energy use. Smart charging is discussed further in Box 4.3.
Use stage
42 Electric vehicles from life cycle and circular economy perspectives
Box 4.3 Smart charging and the vehicle-to-grid concept
Smart charging
The concept of 'smart charging' involves technology enabling the remote management of battery charging times. Smart charging technology has not yet been adopted into the mainstream, but Directive 2014/94/EU on the deployment of alternative fuelling infrastructure includes requirements to make charging points 'smart', making this a key priority for EU Member States over the coming years.
Considering night-time charging at home, a pilot study in the United Kingdom found that BEVs are plugged in on average for 12 hours each night but are only charging for around 2 hours (WPD, 2017). Smart charging would allow charging of each individual BEV in a fleet to be staggered throughout the night, so that sharp peaks in electricity demand are avoided. Furthermore, charging could be automatically concentrated during periods of predictably high renewable electricity availability, such as during the middle of the day from solar PV generation (Öko-Institut and Transport & Mobility Leuven, 2016).
To be effective in taking advantage of generation of electricity from renewable sources, smart charging also requires a daytime charging infrastructure. Workplace charging points are therefore very important, and daytime charging may also be facilitated by alternative mobility models (see Box 4.4). Solar PV generation has a relatively predictable daily cycle, whereas wind generation is more unpredictable. This mean that BEVs would need to be connected to the grid for as long a period as possible to ensure charging occurs at the optimum time, while achieving an acceptable level of charge before the next use.
A significant challenge is behavioural flexibility. Smart charging requires vehicle owners to relinquish some control over the charging process and flexibility in vehicle use times to benefit the system as a whole.
The vehicle-to-grid concept (V2G)
Smart charging technology also opens up the possibility of two-way transfer of electricity, whereby plugged-in vehicles are able to feed energy back into the grid (V2G) when it is needed, potentially in return for a financial reward. Two broad types of use have been considered for V2G:
1. bulk storage of electricity — charging when demand is low then feeding it back to the grid when required;
2. providing so-called 'system services', to enhance grid stability by releasing small amounts of power instantaneously to regulate voltage and frequency.
While bulk storage is attractive, the approach would involve increasing the frequency of deep charge-discharge cycles and have a significant impact on battery lifetime and therefore vehicle costs (Öko-Institut and Transport & Mobility Leuven, 2016). Deep charge-discharge cycles required for bulk storage would also complicate the management of vehicle charging to ensure that vehicles are charged when needed by the owner.
Currently, providing system services seems to be a more viable application of V2G than bulk storage. Batteries have extremely fast response times, making them well suited to the task, and providing system services would require only shallow charge-discharge cycles, having a much lower impact on battery lifetime and thus vehicle costs (Noori et al., 2016).

Use stage
43 Electric vehicles from life cycle and circular economy perspectives
However, there are other approaches to minimising the GHG emissions from BEV charging, which could be taken alongside smart charging. These include:
• Upgrades to grid infrastructure — including additional grid energy storage capacity and integrating electricity grids across larger areas to reduce variation in supply from renewables.
• Battery swapping — removing a discharged battery and replacing it with a fully charged one to decouple the timing of vehicle use from battery charging, so that batteries can be charged at any time of day.
• Minimise charging demand — to reduce the need to operate high-carbon-intensity dispatchable power stations to cover the peak demand periods. Choosing vehicles with smaller batteries (including smaller vehicle categories such as e-mopeds and e-bikes) and using less powerful charging points when feasible will help to achieve this.
4.6 The role of electric vehicles in personal mobility
In the previous sections of this chapter we have discussed environmental impacts of BEVs, and made comparisons with ICEVs, on a per kilometre basis. There is a substantial body of evidence showing that, per kilometre, driving a BEV tends to have lower environmental impacts than driving an ICEV on the same journey. However, the other important factor is the level of use of BEVs in comparison to ICEVs, in terms of the number of car trips and distance driven over a year and the types and locations of trips. This section summarises recent evidence on how consumers are using BEVs and how this may affect their overall environmental impact.
The market share of electric and plug-in hybrid electric vehicles has risen rapidly in the EU-28 in recent years, rising from a combined total of 0.01 % of new car registrations in 2010 to around 1.5 % in 2017 (EEA, 2018a). However, in spite of this rapid rise in sales — or perhaps partly because it has been so rapid — there is relatively little known about how electric vehicles are used. There are currently only limited data available from administrative sources or statistical surveys on use patterns for BEVs.
Because of this evidence gap, most research on the life cycle environmental impacts of BEVs focus on per kilometre impacts, which implicitly assumes that they are a direct replacement for an ICEV, i.e. they have identical annual mileage and trip types. However, in reality there may be feedback and interactions between
BEV ownership and trip-making behaviour, which modify the environmental impacts of BEV ownership vis-à-vis ICEV ownership (Langbroek et al., 2017).
Some studies have taken the approach of analysing the distribution of trip length using ICEV owners or use personal vehicle trials in which ICEVs were replaced by BEVs. This approach shows that the majority of journeys undertaken by ICEVs could be achieved within the driving range of currently available BEVs without additional charging (e.g. Greaves et al., 2014). This would suggest that the daily driving distance of BEVs would be similar to that of the ICEVs they replace, or slightly lower if range anxiety causes some of the longer trips not to be undertaken using a BEV (Jensen and Mabit, 2017). However, these studies do not take into account long-term behavioural feedback that may result from real-life BEV ownership.
The small number of studies that analysed the trip-making behaviour and driving distances of real-life BEV owners suggest that 'rebound effects' may be important especially in the shorter term. In Norway, self-reported car use data show that BEVs are generally bought as an additional vehicle, rather than to substitute an ICEV, and that owners tend to use their cars for a greater proportion of trips than ICEV owners (Klöckner et al., 2013). Travel surveys in Norway have shown that, while BEV trips mostly replace ICEV trips, 10 to 20 % of trips replace those made by public or non-motorised modes of transport. This is likely to be related to provision of local incentives such as free parking, exemption from toll roads and ferries and public charging points for BEVs (Figenbaum et al., 2015; EAFO et a., 2017). Evidence from Sweden has revealed similar patterns, showing that BEV owners make more trips than non-BEV owners and use a car for a greater proportion of the distance travelled (Langbroek et al., 2017). Potential drivers of a rebound effect may include:
• The running cost of driving a BEV is much lower than that for an ICEV.
• The initial financial investment is higher, so owners may drive BEVs more to justify or recoup the costs of the investment.
• The novelty of BEV ownership may encourage use.
• Local incentives, such as exemptions for parking fees, charging zones and road/ferry tolls, in some areas may encourage BEV use.
If uptake of BEVs results in higher rates of car ownership and substitution of using public transport or active modes of travel with trips made in BEVs, then
Use stage
44 Electric vehicles from life cycle and circular economy perspectives
this will offset some of the environmental advantage that BEVs have over ICEVs on a per kilometre basis.
However, it is important to note that so far the evidence on real-life BEV use comes from relatively few countries and has some methodological issues that makes it difficult to isolate the before/after effect of purchasing a BEV from other socio-economic differences between
BEV owners and non-BEV owners that also affect their travel behaviour (Langbroek et al., 2017). Higher rates of car ownership and replacement of public transport or active modes of travel may be a transitional phenomenon, while BEVs are purchased mainly as a second or third car in higher income households. It is also important to consider the rise of shared mobility in this context (Box 4.4).
Box 4.4 Shared mobility and consumer behaviour
What is shared mobility?
In recent decades, the most common model of car use in Europe has been based around car ownership, whereby households have exclusive use of one or more cars. In contrast, in a shared mobility scenario, a pool of cars (which may be owned by individuals, companies or governments) are used 'as needed', operating through taxis, car clubs, short-term rental and ride-sharing schemes. Shared mobility is being facilitated through the advent of apps such as 'CarAmigo', 'Zipcar', 'DriveNow' and 'Green Mobility', which operate effectively in densely populated areas. The continued development of connected and autonomous vehicles (CAVs) — also known as 'self-driving cars' — also has the potential to revolutionise car-sharing by removing the need to learn to drive or depend on a limited supply of professional drivers.
Shared mobility and consumer behaviour
How might shared mobility affect car ownership and use?
A recent review of relevant studies found that car-sharing reduces total vehicle kilometres driven compared with privately owned cars for the same number of passenger journeys (Transport and Environment, 2017b). This is due to higher vehicle occupancy per trip and much less time when vehicles are idle each day. One modelling study in Lisbon found that replacing all private car trips with a shared-mobility alternative would result in a 37 % decrease in total vehicle kilometres driven, with a 97 % reduction in the size of the car fleet alongside a 10-fold increase in daily vehicle kilometres driven per car (ITF, 2016). This scenario of few, intensively used vehicles would help to maximise the environmental advantages of BEVs over ICEVs across the whole life cycle, as the large lifetime mileage per vehicle would enable the reduced impact per kilometre of BEVs to compensate for the higher environmental impact of vehicle production (see Section 3.3 for more on the importance of lifetime mileage).
In terms of ownership, consumers often purchase vehicles that meet both their day-to-day and peak needs (Sprei and Ginnebaugh, 2018). A vehicle that meets both sets of needs will typically be larger, have more features and involve higher energy use than a vehicle that would meet only the daily needs (Sprei and Ginnebaugh, 2018). This reflects the fact that peak needs typically involve requirements for additional seating, four-wheel drive and extra storage. Shared mobility could allow consumers to access cars, without owning them, to meet their peak needs, thereby allowing the use of smaller, less energy-intensive vehicles for day-to-day use. This in turn could have positive impacts in terms of the vehicle fleet, with greater numbers of smaller, less energy-intensive, vehicles.
Shared mobility can also allow consumers to trial vehicles. Research suggests that real-life driving of BEVs can reduce range anxiety (Rauh et al., 2015). Reflecting the impacts that range anxiety has in terms of BEV requirements, this may encourage consumers to, in the longer term, purchase BEVs with a lower range and smaller battery than they would initially have considered.
How might shared mobility affect BEV charging patterns?
BEV charging locations and timing are likely to be strongly influenced by shared mobility. The current emphasis on home charging in the evening is partly a reflection of the current vehicle ownership regime, in which the same vehicle is owned and used by a person or family and parked at home overnight. Given the limited range of BEVs, such use patterns are likely to necessitate repeated use of high-power rapid chargers during the day. Equally, CAV technology would create other opportunities for flexible charging, such as allowing vehicles to move to charging locations during the day when not being used. These influences will provide both challenges and opportunities for minimising the environmental impact of BEVs.
Use stage
45 Electric vehicles from life cycle and circular economy perspectives
The drivers of a potential rebound effect may also be reduced in future as BEVs become more mainstream. For example, many national and local incentive schemes are designed to offer decreasing incentives for BEVs over time as the market develops.
Further evidence on vehicle mileage and use is needed from a greater range of countries as BEV ownership continues to increase and become more mainstream and vehicle driving ranges and charging technology continue to improve. Here, data from annual roadworthiness tests could provide valuable information in the coming years if the powertrain of the vehicle type can be distinguished. This approach has been used previously to understand differences in the use of petrol versus diesel vehicles (e.g. Cairns et al., 2017). National travel surveys could also offer more robust insights into vehicle use if relevant information on household vehicle types can be established.
4.7 Summary: minimising the environmental impacts of BEV use
In the use stage, WTW emissions of GHGs and human health impacts tend to be lower for BEVs than for
ICEVs. However, coal-fired electricity generation in Europe contributes to a variety of other impacts, which can cause the use stage impact of BEVs to be greater than that of ICEVs for some impact categories. Across all types of impact, the environmental performance of BEVs in the use stage is affected by various aspects of vehicle design and use and the electricity grid.
The key provisions for minimising the environmental impact of BEVs in the use stage, and their advantage over ICEVs, are:
• Electricity is generated to as large an extent as possible from low-carbon and renewable sources (which also meet other sustainability criteria), and charging patterns are optimised to take advantage of this renewable energy.
• The smallest and lightest vehicles sufficient for the user's needs are used, and these are driven in an economical style.
• As BEV ownership becomes more mainstream, this does not lead to greater car use overall through a rebound effect.
End-of-life stage
4646
End-of-life stage
Electric vehicles from life cycle and circular economy perspectives
5 End-of-life stage
• The end-of-life stage, if considered in isolation, has the smallest impact in terms of total life cycle emissions. However, this stage has an important role to play in reducing environmental impacts in the other life cycle stages.
• From a circular economy perspective:
– Battery reuse, particularly for energy storage systems, has the potential to significantly reduce the short- to medium-term environmental impact of the end-of-life stage as well as offering synergies with renewable energy development.
– Recycling provides benefits in terms of resource efficiency and raw material availability.
5.1 Introduction
BEVs are becoming increasingly popular in Europe and this will have associated end-of-life challenges. Rates of recycling and reuse of electric vehicles in Europe are currently low, reflecting, in part, the historically small numbers of electric vehicles on the market (Elwert et al., 2016; Jiao and Evans, 2016; Liu and Wang, 2017). This has meant that, so far, there has been little incentive for the development of infrastructure and processes for recycling and reuse (Elwert et al., 2016; Jiao and Evans, 2016; Liu and Wang, 2017).
By 2025, there will be between 40 and 70 million BEVs globally (IEA, 2017b). Changes will need to be made to meet these future requirements for end-of-life processing. Reuse and recycling of batteries has the potential to reduce emissions across the life cycle and provide significant opportunities to promote a circular economy. This section will focus mainly on the recycling and reuse of electric vehicle batteries and will investigate the following:
• current end-of-life processes in Europe;
• future end-of-life needs in the context of projected use of BEVs;
• future reuse and recycling of electric vehicles;
• environmental impacts of the end-of-life stage.
5.2 Current end-of-life processes
Within current end-of-life processes, an important question is to identify and analyse the key challenges associated with electric vehicle recycling today and in the future (Romare and Dahllöf, 2017).
The End of Life Vehicles Directive (2000/53/EC) requires vehicle manufacturers to take extended responsibility for their vehicles and components after use (Ramoni and Zhang, 2013). Under this responsibility vehicle manufacturers are financially or physically responsible for either taking back their products, with the end goal of reusing, recycling or remanufacturing, or alternatively obliged to delegate the responsibility to a third party (Ellingsen and Hung, 2018).
By 2015, 95 % of end-of-life vehicles (in terms of vehicle weight) were required to be reused and recovered and 85 % reused and recycled. These targets have been implemented by each Member State through national regulations (Despeisse et al., 2015; Elwert et al., 2016). The Directive gives the following definitions:
• Reuse — any operation in which an end-of-life vehicle component is used for the same purpose for which it was originally made.
• Recovery — any operation provided for in Annex IIB to Directive 75/442/EEC. This includes reclamation
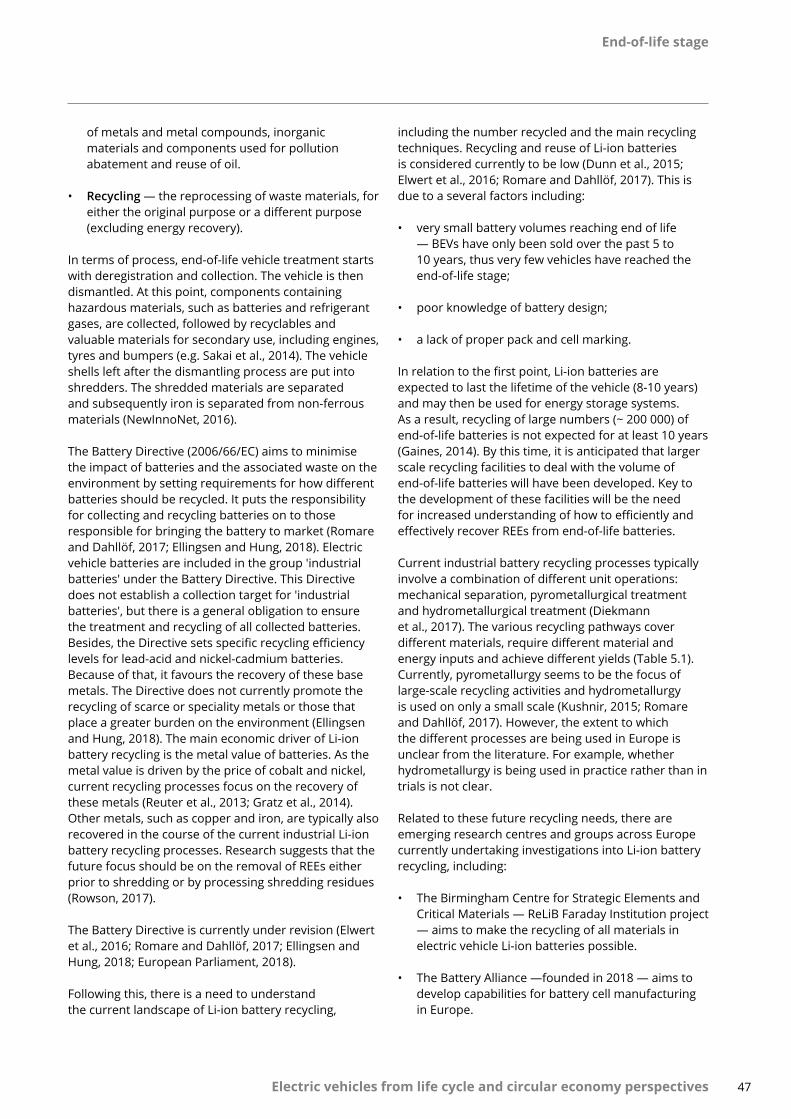
End-of-life stage
47 Electric vehicles from life cycle and circular economy perspectives
of metals and metal compounds, inorganic materials and components used for pollution abatement and reuse of oil.
• Recycling — the reprocessing of waste materials, for either the original purpose or a different purpose (excluding energy recovery).
In terms of process, end-of-life vehicle treatment starts with deregistration and collection. The vehicle is then dismantled. At this point, components containing hazardous materials, such as batteries and refrigerant gases, are collected, followed by recyclables and valuable materials for secondary use, including engines, tyres and bumpers (e.g. Sakai et al., 2014). The vehicle shells left after the dismantling process are put into shredders. The shredded materials are separated and subsequently iron is separated from non-ferrous materials (NewInnoNet, 2016).
The Battery Directive (2006/66/EC) aims to minimise the impact of batteries and the associated waste on the environment by setting requirements for how different batteries should be recycled. It puts the responsibility for collecting and recycling batteries on to those responsible for bringing the battery to market (Romare and Dahllöf, 2017; Ellingsen and Hung, 2018). Electric vehicle batteries are included in the group 'industrial batteries' under the Battery Directive. This Directive does not establish a collection target for 'industrial batteries', but there is a general obligation to ensure the treatment and recycling of all collected batteries. Besides, the Directive sets specific recycling efficiency levels for lead-acid and nickel-cadmium batteries. Because of that, it favours the recovery of these base metals. The Directive does not currently promote the recycling of scarce or speciality metals or those that place a greater burden on the environment (Ellingsen and Hung, 2018). The main economic driver of Li-ion battery recycling is the metal value of batteries. As the metal value is driven by the price of cobalt and nickel, current recycling processes focus on the recovery of these metals (Reuter et al., 2013; Gratz et al., 2014). Other metals, such as copper and iron, are typically also recovered in the course of the current industrial Li-ion battery recycling processes. Research suggests that the future focus should be on the removal of REEs either prior to shredding or by processing shredding residues (Rowson, 2017).
The Battery Directive is currently under revision (Elwert et al., 2016; Romare and Dahllöf, 2017; Ellingsen and Hung, 2018; European Parliament, 2018).
Following this, there is a need to understand the current landscape of Li-ion battery recycling,
including the number recycled and the main recycling techniques. Recycling and reuse of Li-ion batteries is considered currently to be low (Dunn et al., 2015; Elwert et al., 2016; Romare and Dahllӧf, 2017). This is due to a several factors including:
• very small battery volumes reaching end of life — BEVs have only been sold over the past 5 to 10 years, thus very few vehicles have reached the end-of-life stage;
• poor knowledge of battery design;
• a lack of proper pack and cell marking.
In relation to the first point, Li-ion batteries are expected to last the lifetime of the vehicle (8-10 years) and may then be used for energy storage systems. As a result, recycling of large numbers (~ 200 000) of end-of-life batteries is not expected for at least 10 years (Gaines, 2014). By this time, it is anticipated that larger scale recycling facilities to deal with the volume of end-of-life batteries will have been developed. Key to the development of these facilities will be the need for increased understanding of how to efficiently and effectively recover REEs from end-of-life batteries.
Current industrial battery recycling processes typically involve a combination of different unit operations: mechanical separation, pyrometallurgical treatment and hydrometallurgical treatment (Diekmann et al., 2017). The various recycling pathways cover different materials, require different material and energy inputs and achieve different yields (Table 5.1). Currently, pyrometallurgy seems to be the focus of large-scale recycling activities and hydrometallurgy is used on only a small scale (Kushnir, 2015; Romare and Dahllӧf, 2017). However, the extent to which the different processes are being used in Europe is unclear from the literature. For example, whether hydrometallurgy is being used in practice rather than in trials is not clear.
Related to these future recycling needs, there are emerging research centres and groups across Europe currently undertaking investigations into Li-ion battery recycling, including:
• The Birmingham Centre for Strategic Elements and Critical Materials — ReLiB Faraday Institution project — aims to make the recycling of all materials in electric vehicle Li-ion batteries possible.
• The Battery Alliance —founded in 2018 — aims to develop capabilities for battery cell manufacturing in Europe.
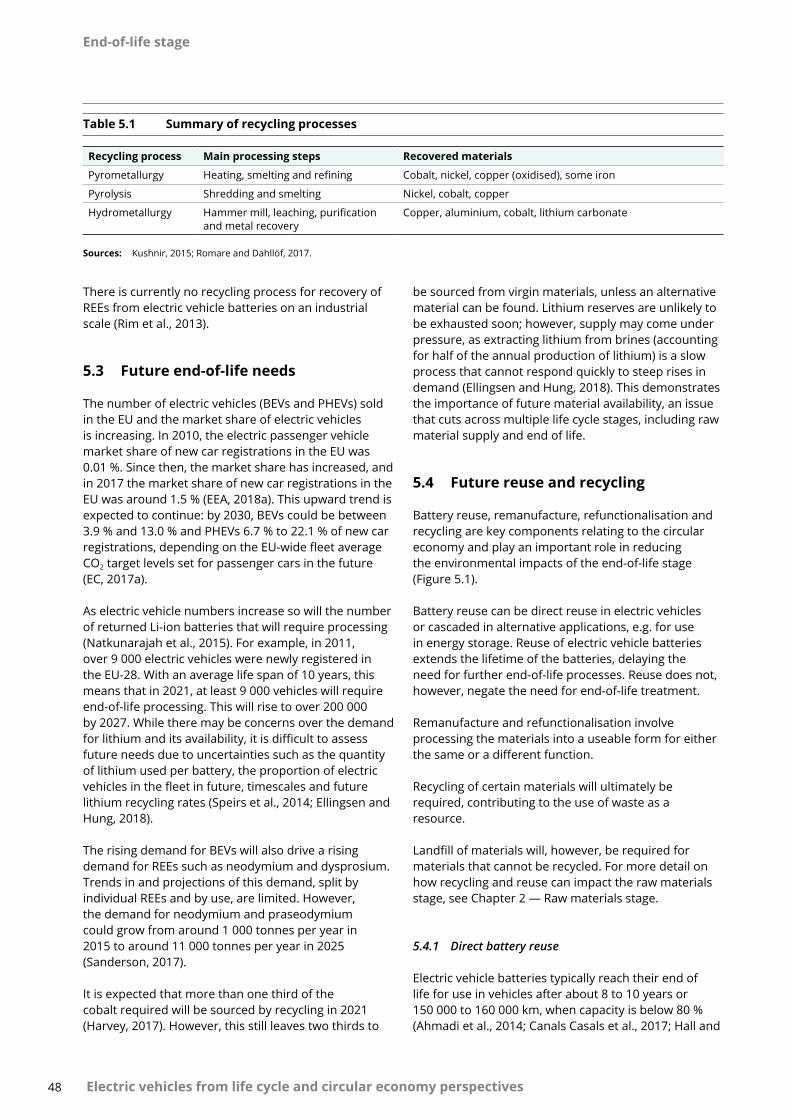
End-of-life stage
48 Electric vehicles from life cycle and circular economy perspectives
There is currently no recycling process for recovery of REEs from electric vehicle batteries on an industrial scale (Rim et al., 2013).
5.3 Future end-of-life needs
The number of electric vehicles (BEVs and PHEVs) sold in the EU and the market share of electric vehicles is increasing. In 2010, the electric passenger vehicle market share of new car registrations in the EU was 0.01 %. Since then, the market share has increased, and in 2017 the market share of new car registrations in the EU was around 1.5 % (EEA, 2018a). This upward trend is expected to continue: by 2030, BEVs could be between 3.9 % and 13.0 % and PHEVs 6.7 % to 22.1 % of new car registrations, depending on the EU-wide fleet average CO2 target levels set for passenger cars in the future (EC, 2017a).
As electric vehicle numbers increase so will the number of returned Li-ion batteries that will require processing (Natkunarajah et al., 2015). For example, in 2011, over 9 000 electric vehicles were newly registered in the EU-28. With an average life span of 10 years, this means that in 2021, at least 9 000 vehicles will require end-of-life processing. This will rise to over 200 000 by 2027. While there may be concerns over the demand for lithium and its availability, it is difficult to assess future needs due to uncertainties such as the quantity of lithium used per battery, the proportion of electric vehicles in the fleet in future, timescales and future lithium recycling rates (Speirs et al., 2014; Ellingsen and Hung, 2018).
The rising demand for BEVs will also drive a rising demand for REEs such as neodymium and dysprosium. Trends in and projections of this demand, split by individual REEs and by use, are limited. However, the demand for neodymium and praseodymium could grow from around 1 000 tonnes per year in 2015 to around 11 000 tonnes per year in 2025 (Sanderson, 2017).
It is expected that more than one third of the cobalt required will be sourced by recycling in 2021 (Harvey, 2017). However, this still leaves two thirds to
Table 5.1 Summary of recycling processes
Recycling process Main processing steps Recovered materials
Pyrometallurgy Heating, smelting and refining Cobalt, nickel, copper (oxidised), some iron
Pyrolysis Shredding and smelting Nickel, cobalt, copper
Hydrometallurgy Hammer mill, leaching, purification and metal recovery
Copper, aluminium, cobalt, lithium carbonate
Sources: Kushnir, 2015; Romare and Dahllӧf, 2017.
be sourced from virgin materials, unless an alternative material can be found. Lithium reserves are unlikely to be exhausted soon; however, supply may come under pressure, as extracting lithium from brines (accounting for half of the annual production of lithium) is a slow process that cannot respond quickly to steep rises in demand (Ellingsen and Hung, 2018). This demonstrates the importance of future material availability, an issue that cuts across multiple life cycle stages, including raw material supply and end of life.
5.4 Future reuse and recycling
Battery reuse, remanufacture, refunctionalisation and recycling are key components relating to the circular economy and play an important role in reducing the environmental impacts of the end-of-life stage (Figure 5.1).
Battery reuse can be direct reuse in electric vehicles or cascaded in alternative applications, e.g. for use in energy storage. Reuse of electric vehicle batteries extends the lifetime of the batteries, delaying the need for further end-of-life processes. Reuse does not, however, negate the need for end-of-life treatment.
Remanufacture and refunctionalisation involve processing the materials into a useable form for either the same or a different function.
Recycling of certain materials will ultimately be required, contributing to the use of waste as a resource.
Landfill of materials will, however, be required for materials that cannot be recycled. For more detail on how recycling and reuse can impact the raw materials stage, see Chapter 2 — Raw materials stage.
5.4.1 Direct battery reuse
Electric vehicle batteries typically reach their end of life for use in vehicles after about 8 to 10 years or 150 000 to 160 000 km, when capacity is below 80 % (Ahmadi et al., 2014; Canals Casals et al., 2017; Hall and
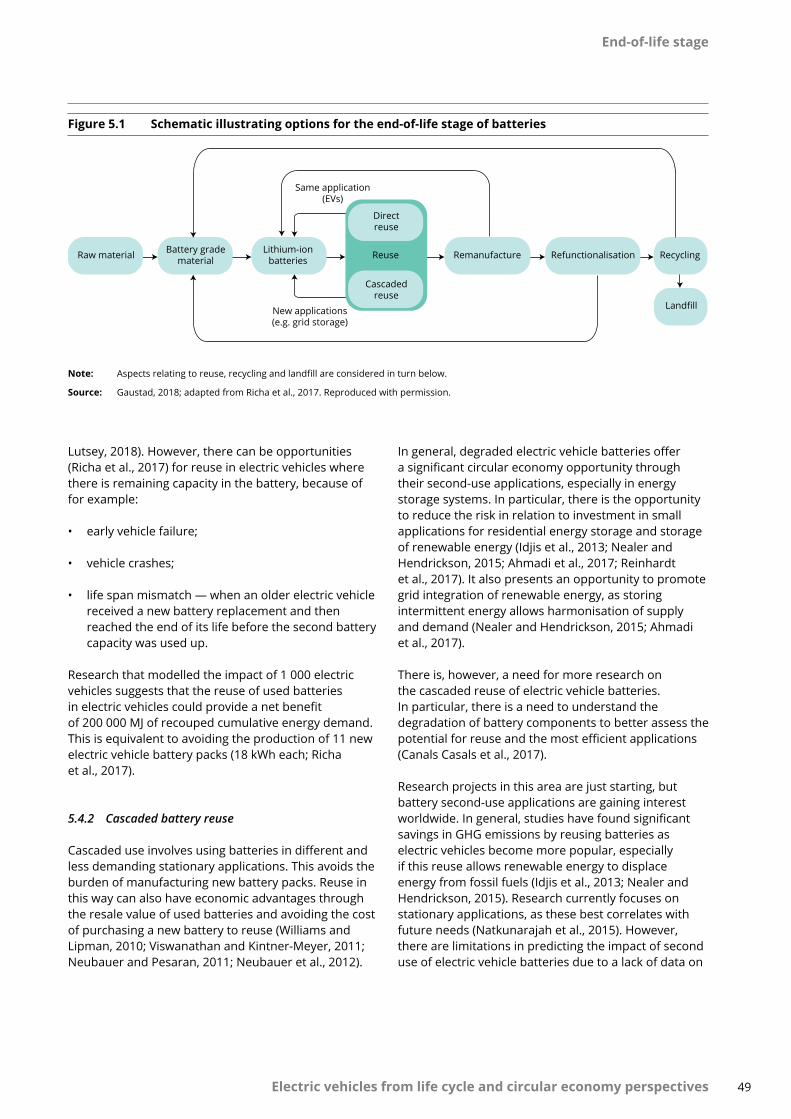
End-of-life stage
49 Electric vehicles from life cycle and circular economy perspectives
Lutsey, 2018). However, there can be opportunities (Richa et al., 2017) for reuse in electric vehicles where there is remaining capacity in the battery, because of for example:
• early vehicle failure;
• vehicle crashes;
• life span mismatch — when an older electric vehicle received a new battery replacement and then reached the end of its life before the second battery capacity was used up.
Research that modelled the impact of 1 000 electric vehicles suggests that the reuse of used batteries in electric vehicles could provide a net benefit of 200 000 MJ of recouped cumulative energy demand. This is equivalent to avoiding the production of 11 new electric vehicle battery packs (18 kWh each; Richa et al., 2017).
5.4.2 Cascaded battery reuse
Cascaded use involves using batteries in different and less demanding stationary applications. This avoids the burden of manufacturing new battery packs. Reuse in this way can also have economic advantages through the resale value of used batteries and avoiding the cost of purchasing a new battery to reuse (Williams and Lipman, 2010; Viswanathan and Kintner-Meyer, 2011; Neubauer and Pesaran, 2011; Neubauer et al., 2012).
Figure 5.1 Schematic illustrating options for the end-of-life stage of batteries
Raw material Battery gradematerial
Lithium-ionbatteries
Directreuse
Reuse Remanufacture Refunctionalisation Recycling
Landfill
Cascadedreuse
New applications(e.g. grid storage)
Same application(EVs)
Note: Aspects relating to reuse, recycling and landfill are considered in turn below.
Source: Gaustad, 2018; adapted from Richa et al., 2017. Reproduced with permission.
In general, degraded electric vehicle batteries offer a significant circular economy opportunity through their second-use applications, especially in energy storage systems. In particular, there is the opportunity to reduce the risk in relation to investment in small applications for residential energy storage and storage of renewable energy (Idjis et al., 2013; Nealer and Hendrickson, 2015; Ahmadi et al., 2017; Reinhardt et al., 2017). It also presents an opportunity to promote grid integration of renewable energy, as storing intermittent energy allows harmonisation of supply and demand (Nealer and Hendrickson, 2015; Ahmadi et al., 2017).
There is, however, a need for more research on the cascaded reuse of electric vehicle batteries. In particular, there is a need to understand the degradation of battery components to better assess the potential for reuse and the most efficient applications (Canals Casals et al., 2017).
Research projects in this area are just starting, but battery second-use applications are gaining interest worldwide. In general, studies have found significant savings in GHG emissions by reusing batteries as electric vehicles become more popular, especially if this reuse allows renewable energy to displace energy from fossil fuels (Idjis et al., 2013; Nealer and Hendrickson, 2015). Research currently focuses on stationary applications, as these best correlates with future needs (Natkunarajah et al., 2015). However, there are limitations in predicting the impact of second use of electric vehicle batteries due to a lack of data on
End-of-life stage
50 Electric vehicles from life cycle and circular economy perspectives
battery degradation following use in vehicles and the regional variations in energy mixes that are displaced by renewable energy (Nealer and Hendrickson, 2015).
Box 5.1 provides an example of cascaded use, while Box 5.2 describes one way in which innovation in battery reuse is being encouraged in Europe.
5.4.3 Battery remanufacturing
The remanufacturing of spent Li-ion batteries from electric vehicles is a relatively new approach to end-of-life treatment and one that is not currently deployed on a large scale. This process involves the return of active cathode and anode materials to their original state for reuse in new Li-ion battery cells (Ramoni and Zhang, 2012; Hailey and Kepler, 2015; Gaustad, 2018). This creates a closed loop in which high-value materials are remanufactured into new batteries, while the remaining materials are fed into recycling streams (Gaustad, 2018). This is considered to be the most environmentally friendly end-of-life option (Ramoni and Zhang, 2013).
Some active anode and cathode materials remain functioning to almost full capacity, despite the rest of the cell degrading to the point of replacement. This demonstrates that remanufacturing could be an efficient and practical solution to increasing volumes of waste from electric vehicles (Gaustad, 2018). Remanufacturing can also be referred to as direct
recycling, the materials are remanufactured for reuse without changing their chemical form. This has environmental and economic benefits, as recovered materials need not go through resource-intensive processing. Research in this area is therefore, and should remain, ongoing. Box 5.3 gives an example of remanufacturing used electric vehicle batteries for reuse in electric vehicles.
5.4.4 Recycling
There are key differences between the recycling processes for BEVs and ICEVs due to differences in vehicle composition:
• Electric vehicles contain a larger quantity of high-power/low-weight motors.
• Electric vehicles typically contain four times more REEs than equivalent diesel and petrol vehicles (Rowson, 2017).
• Separation of REEs from electric vehicle magnets, although possible, has not yet been widely adopted by industry.
• An increase in future in the use of composite materials such as carbon fibre reinforced plastic for lightweighting may make recycling more challenging.
Box 5.1 E-STOR — an example of second use electric vehicle batteries
E-STOR energy storage technology uses second life electric vehicle batteries to store and supply energy. The batteries are recharged at low power, store the energy and then release it at high power.
Connect Energy and Renault have used E-STOR technology to provide quick charging stations for electric vehicles on highways in Belgium and Germany. The technology allows quick charging in areas where it is not possible, or is very costly, to have a high-power connection to the grid.
The reuse of electric vehicle batteries in charging points provides a circular economy solution by reducing waste and providing an economic solution to promoting renewable technologies.
Sources: Connected Energy, 2017; Renault, 2017.
End-of-life stage
51 Electric vehicles from life cycle and circular economy perspectives
Box 5.2 European Commission innovation deal — from e-mobility to recycling: the virtuous loop of electric vehicles
What are the innovation deals?
Innovation deals are voluntary agreements between the EU, innovators and authorities at national, regional and local levels. They aim to allow innovators to overcome legislative obstacles and decrease the time taken to bring innovation to the market.
What is the e-mobility innovation deal?
The e-mobility innovation deal focuses on electric vehicles and aims to assess whether existing EU legislation impedes the second-life use of batteries. There are two elements to the assessment:
• waste management — definitions of waste, roles and responsibilities for reuse, waste hierarchy and life cycle thinking, second-life products and safety of reuse;
• energy — grid integration, batteries as energy storage, self-consumption and smart metering.
Who is currently involved?
Current stakeholders include innovators and authorities at national, regional and local levels:
• Renault Nissan Alliance (vehicle industry);
• Lomboxnet (IT and renewable energy);
• Bouygues (sustainable city energy systems);
• French Ministry of Environment and Ministry of Industry (national authorities);
• Dutch Ministry of Environment and Ministry of Economic Affairs (national authorities);
• Dutch Province of Utrecht (regional authority).
Sources: EC, 2017c, 2017d.
Box 5.3 Remanufacture of electric vehicle batteries for reuse in Nissan LEAF cars
In March 2018, Nissan opened a small facility in Namie, Japan, where used Li-ion batteries are remanufactured as replacement packs for first-generation Nissan LEAF vehicles. The plant is run as a joint venture between Nissan and Sumitomo Corporation, called the 4R Energy Corporation. At the plant, used battery packs are disassembled and any modules that have lost more than 20 % of their capacity are replaced from other batteries. The discarded modules are repurposed for cascaded reuse (e.g. energy storage systems).
The remanufactured batteries will be sold at about half the price of a new replacement battery. The facility is capable of processing 2 250 battery packs per year, although will initially process only a few hundred. There will also be further investigation into whether the plant could be capable of processing replacement battery packs for the latest LEAF vehicles, as these use a different battery chemistry.
End-of-life stage
52 Electric vehicles from life cycle and circular economy perspectives
Box 5.4 Recycling processes for Li-ion batteries
Pyrolysis — means the melting and reducing of battery materials to obtain metals. Batteries are shredded and smelted in a furnace where limestone is added as a slag forming agent. In terms of advantages, pyrolysis is highly effective at recovering nickel, cobalt and copper in a concentrated and relatively clean alloy, with high efficiency. Other toxic solvents are burned, providing much of the process energy and removing their toxicity. Pyrolysis also exists at an industrial scale. In terms of disadvantages, lithium and manganese are trapped in the slag and can be difficult to recover.
Pyrometallurgy — Li-ion batteries are processed in a high-temperature smelter, converting metal oxides to their metallic form (a molten metal alloy). This alloy is refined for use in new battery cathodes (e.g. cobalt and nickel). The slag contains lithium, which is often used in concrete applications.
Hydrometallurgy — once sorted by lithium battery chemistry, the paper and plastic are removed in a hammer mill. Lithium brine is then used to shred the cells further. Materials are separated, scrap metal recovered and other non-metallic minerals removed. This process recovers copper-cobalt product (copper, aluminium and cobalt), cobalt filter cake (cobalt and carbon), lithium fluff (plastics and steel) and lithium brine. The brine is further processed and recovered as lithium carbonate.
Hydrothermal — for hydrothermal processes, batteries are typically mechanically separated and the cathode materials are crushed and added to some form of solvent, such as N-methylpyrrolidone (NMP), which dissolves the binder from the cathode and leaves the aluminium foil to be recovered with the metal oxide suspended in solution. In terms of advantages, the chemistry and procedures are fairly mature due to their heritage in the mining industry and could be scaled up given financial incentives. In terms of disadvantages, many of the possible environmental and economic gains are offset by the use of hot water, acids and solvents.
Sources: US EPA, 2013; Kushnir, 2015.
The recycling techniques for Li-ion batteries are described in Box 5.4 and compared with recycling techniques for conventional vehicles in Box 5.5.
5.4.5 Processes to improve current operations
Standardisation
Recycling of Li-ion batteries from electric vehicles can be complex because of a lack of standardisation. There can be variations in materials used, design, location of the battery and the shape of the battery pack. There can also be variation between manufacturers (Gaines, 2014; Elwert et al., 2016). While complete standardisation is unrealistic, a set of basic standards could make the recycling of batteries less time consuming and less complex. For example, lifting parts (e.g. eyelets or mounting threads) could be installed as standard in future battery packs. This would allow standard lifting tools to be used for disassembling the battery pack (Ellingsen and Hung, 2018). This could also include standards for recycling processes.
The battery cells need to be designed in such a way that the material can be recovered in processed form. It is suggested that there needs to be a move from pyrometallurgy to hydrometallurgy so that further materials can be recovered.
Need for better data for analysis and research on efficient systems
Studies on the second use of electric vehicle batteries are currently limited in terms of the conclusions they can draw because of a lack of data. Second-use applications have not been thoroughly studied with respect to battery life (how long the battery can be used during its second life), discharge and charge rates and failure rates. The majority of studies are carried out for less than a year in laboratory conditions, and therefore there is a lack of real-world data on second-use performance (Ahmadi et al., 2017). These real-world data are critical for assessing the efficiency of batteries in their second use. There is a need for the further development of a reuse strategy but this needs to be seen in the context of future materials that could be used in electric vehicles, including greener, more sustainable replacement materials (Manzetti and Mariasiu, 2015).
As mentioned above, the recycling of REEs does not currently happen on an industrial scale. It is possible to recycle REEs from neodymium-iron-boron magnet manufacturing scraps. With the manufacture of magnets increasing in response to rising demand, a significant amount of scrap will be generated and a recycling system for neodymium would be beneficial (Rim et al., 2013).
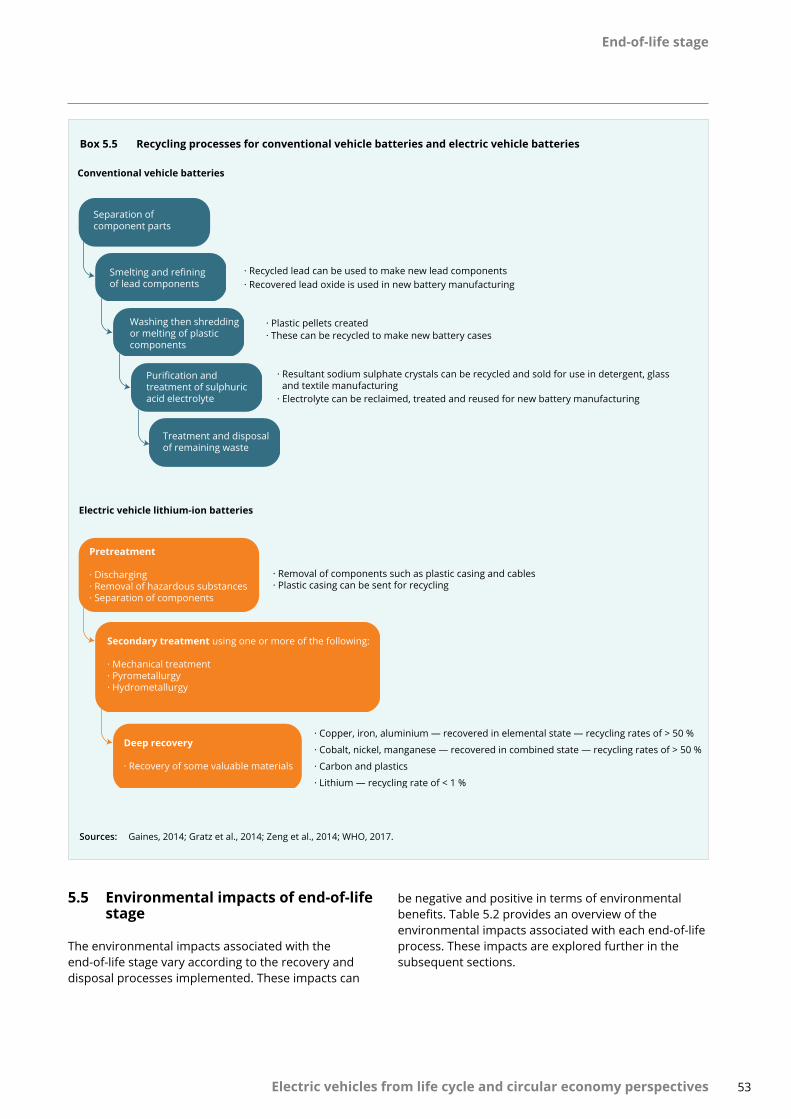
End-of-life stage
53 Electric vehicles from life cycle and circular economy perspectives
Box 5.5 Recycling processes for conventional vehicle batteries and electric vehicle batteries
Conventional vehicle batteries
Electric vehicle lithium-ion batteries
Separation ofcomponent parts
Pretreatment
· Discharging· Removal of hazardous substances· Separation of components
Secondary treatment using one or more of the following: · Mechanical treatment· Pyrometallurgy· Hydrometallurgy
Deep recovery · Recovery of some valuable materials
Smelting and refiningof lead components
Washing then shreddingor melting of plasticcomponents
Purification and treatment of sulphuricacid electrolyte
Treatment and disposalof remaining waste
· Plastic pellets created· These can be recycled to make new battery cases
· Electrolyte can be reclaimed, treated and reused for new battery manufacturing
· Removal of components such as plastic casing and cables · Plastic casing can be sent for recycling
· Resultant sodium sulphate crystals can be recycled and sold for use in detergent, glass and textile manufacturing
· Copper, iron, aluminium — recovered in elemental state — recycling rates of > 50 %
· Cobalt, nickel, manganese — recovered in combined state — recycling rates of > 50 %
· Carbon and plastics
· Lithium — recycling rate of < 1 %
· Recycled lead can be used to make new lead components· Recovered lead oxide is used in new battery manufacturing
Sources: Gaines, 2014; Gratz et al., 2014; Zeng et al., 2014; WHO, 2017.
5.5 Environmental impacts of end-of-life stage
The environmental impacts associated with the end-of-life stage vary according to the recovery and disposal processes implemented. These impacts can
be negative and positive in terms of environmental benefits. Table 5.2 provides an overview of the environmental impacts associated with each end-of-life process. These impacts are explored further in the subsequent sections.
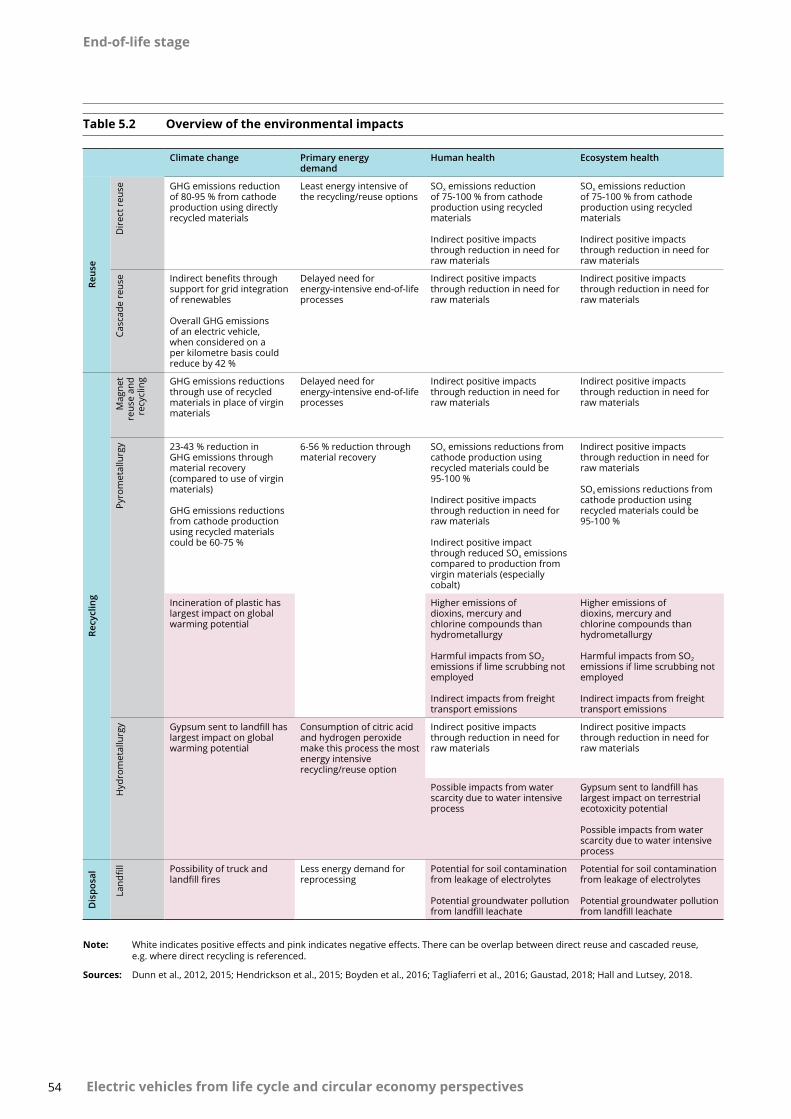
End-of-life stage
54 Electric vehicles from life cycle and circular economy perspectives
Table 5.2 Overview of the environmental impacts
Climate change Primary energy demand
Human health Ecosystem health
Reus
e
Dir
ect r
euse GHG emissions reduction
of 80-95 % from cathode production using directly recycled materials
Least energy intensive of the recycling/reuse options
SOx emissions reduction of 75-100 % from cathode production using recycled materials
Indirect positive impacts through reduction in need for raw materials
SOx emissions reduction of 75-100 % from cathode production using recycled materials
Indirect positive impacts through reduction in need for raw materials
Casc
ade
reus
e Indirect benefits through support for grid integration of renewables
Overall GHG emissions of an electric vehicle, when considered on a per kilometre basis could reduce by 42 %
Delayed need for energy-intensive end-of-life processes
Indirect positive impacts through reduction in need for raw materials
Indirect positive impacts through reduction in need for raw materials
Recy
clin
g
Mag
net
reus
e an
d re
cycl
ing GHG emissions reductions
through use of recycled materials in place of virgin materials
Delayed need for energy-intensive end-of-life processes
Indirect positive impacts through reduction in need for raw materials
Indirect positive impacts through reduction in need for raw materials
Pyro
met
allu
rgy 23-43 % reduction in
GHG emissions through material recovery (compared to use of virgin materials)
GHG emissions reductions from cathode production using recycled materials could be 60-75 %
6-56 % reduction through material recovery
SOx emissions reductions from cathode production using recycled materials could be 95-100 %
Indirect positive impacts through reduction in need for raw materials
Indirect positive impact through reduced SOx emissions compared to production from virgin materials (especially cobalt)
Indirect positive impacts through reduction in need for raw materials
SOx emissions reductions from cathode production using recycled materials could be 95-100 %
Incineration of plastic has largest impact on global warming potential
Higher emissions of dioxins, mercury and chlorine compounds than hydrometallurgy
Harmful impacts from SO2 emissions if lime scrubbing not employed
Indirect impacts from freight transport emissions
Higher emissions of dioxins, mercury and chlorine compounds than hydrometallurgy
Harmful impacts from SO2 emissions if lime scrubbing not employed
Indirect impacts from freight transport emissions
Hyd
rom
etal
lurg
y Gypsum sent to landfill has largest impact on global warming potential
Consumption of citric acid and hydrogen peroxide make this process the most energy intensive recycling/reuse option
Indirect positive impacts through reduction in need for raw materials
Indirect positive impacts through reduction in need for raw materials
Possible impacts from water scarcity due to water intensive process
Gypsum sent to landfill has largest impact on terrestrial ecotoxicity potential
Possible impacts from water scarcity due to water intensive process
Dis
posa
l
Land
fill Possibility of truck and
landfill firesLess energy demand for reprocessing
Potential for soil contamination from leakage of electrolytes
Potential groundwater pollution from landfill leachate
Potential for soil contamination from leakage of electrolytes
Potential groundwater pollution from landfill leachate
Note: White indicates positive effects and pink indicates negative effects. There can be overlap between direct reuse and cascaded reuse, e.g. where direct recycling is referenced.
Sources: Dunn et al., 2012, 2015; Hendrickson et al., 2015; Boyden et al., 2016; Tagliaferri et al., 2016; Gaustad, 2018; Hall and Lutsey, 2018.
End-of-life stage
55 Electric vehicles from life cycle and circular economy perspectives
5.5.1 Overview of environmental impacts
The end-of-life phase of vehicles whether BEV or ICEV, is not the largest contributor to the overall environmental impact. However, end-of-life processing and opportunities for reuse and recycling have significant benefits in terms of the other life stages, in particular the sourcing of raw materials. For example, improved waste management and higher efficiencies through increased levels of reuse and recycling could reduce the high toxicological impacts associated with the intensive use of base metals such as copper and nickel in electric vehicles (Tagliaferri et al., 2016; Van Mierlo et al., 2017). The end-of-life stage therefore contributes to the overall environmental impact of a vehicle (Tagliaferri et al., 2016; Van Mierlo et al., 2017).
The climate change impacts for the end-of-life stage are similar for BEVs and ICEVs (Tagliaferri et al., 2016). Research suggests that the impact of battery disposal on end-of-life GHG emissions for electric vehicles equates to between 14 and 23 % (Ellingsen et al., 2016). However, studies of end-of-life emissions for battery vehicles are also associated with high uncertainties due to low data availability (Ellingsen et al., 2016; Ellingsen and Hung, 2018).
5.5.2 Environmental impacts of reuse
Direct reuse
Direct reuse is the only current electric vehicle battery end-of-life process that allows material to re-enter the Li-ion battery market directly. It is the approach that causes the least detrimental environmental impacts, as no reprocessing techniques need to be employed on the recovered materials (Hailey and Kepler, 2015). This technique also has a much smaller waste stream in comparison with other recycling techniques, as only a small amount of polymer components (e.g. separators and binder) need to be disposed of (Hailey and Kepler, 2015). However, direct reuse of batteries is limited to those with sufficient capacity.
Cascaded reuse
Cascaded reuse of Li-ion batteries from electric vehicles allows the benefits before disposal to be maximised, delaying the need for recycling and end-of-life treatment. One of the main environmental benefits of cascaded reuse is aiding grid integration of renewables. The use of electric vehicle batteries in renewable energy storage systems could increase the lifetime of the battery by 72 % and result in a reduction in GHG emissions of 42 % for whole vehicle emissions, based on emissions per kilometre (Hall and
Lutsey, 2018). This application could also have indirect environmental benefits, as the development of a second-hand battery market could reduce the cost of electric vehicles. In turn this could increase uptake with associated greenhouse gas emissions and air quality benefits (Elkind, 2014).
Battery remanufacture
The remanufacturing of used electric vehicle batteries into new batteries establishes a closed loop system as materials are either regenerated or directed into existing recycling streams. This system has small volumes of waste (Hailey and Kepler, 2015). This has environmental benefits across the life cycle stages, especially in the raw materials, production and end-of-life stages through reducing the need for and use of virgin materials (Ramoni and Zhang, 2013; Hailey and Kepler, 2015). Many of the benefits achieved through this end-of-life option are shared with direct reuse.
5.5.3 Environmental impacts of recycling
Magnets
The recycling of used magnets into new magnets can reduce the overall environmental impact of magnet production by between 64 and 96 % (Jin et al., 2018). REEs in batteries are not currently recovered on an industrial scale. There are, however, environmental benefits to doing so (Rim et al., 2013, Yang et al., 2016; Jin et al., 2018). Recycling of magnets reduces the amount of waste generated from electric vehicles and can start to address challenges in resource depletion. This also has benefits for human and ecosystem health through a reduced need for mining REEs (Jin et al., 2018). The environmental impacts of REE sourcing is covered in Chapter 2 — Raw materials stage.
Lithium ion batteries
Recycling of Li-ion batteries from electric vehicles has the potential to reduce the overall environmental impact of electric vehicles by reducing the need for virgin materials. For example, material recovery through the pyrometallurgical process can lead to a primary energy demand reduction of 6-56 % and a reduction in GHG emissions of 23 % compared with virgin material production (Hendrickson et al., 2015).
The pyrometallurgical process involves the incineration of plastic and this has the largest impact on global warming potential of all the process stages. The largest impact on human and terrestrial ecosystem toxicity potential comes from electricity generation (Boyden
End-of-life stage
56 Electric vehicles from life cycle and circular economy perspectives
et al., 2016). Compared with the hydrometallurgical process, this process has higher emissions of dioxins, mercury and chlorine compounds due to combustion and coke production processes, and therefore efficient air pollutant filtering systems are required to prevent harmful releases. Similarly, harmful human health impacts can occur from SO2 emissions from coke combustion if lime scrubbing is not implemented (Bankole et al., 2013; Hendrickson et al., 2015). Indirect impacts of human and ecosystem health can occur through releases of SO2, PM and volatile organic compounds from freight trucks transporting spent batteries from ships to recycling facilities (Hendrickson et al., 2015). This highlights the importance of considering facility location when planning new recycling infrastructure.
Through the hydrometallurgical process, gypsum and its residues are sent to landfill, and this has the largest impact on global warming potential and terrestrial ecotoxicity potential of all the stages in this process. The largest impact on human toxicity potential comes from the electricity generation stage (Boyden et al., 2016). Compared with pyrometallurgy, this process has fewer direct environmental burdens due to the absence of combustion. However, if the impacts of the chemical production supply chain required for this process are considered, these advantages are reduced (Hendrickson et al., 2015). Location of facilities could also be important with this process because of the amount of water required. This could have detrimental impacts on human and ecosystem health if facilities are located in water-scarce areas (Hendrickson et al., 2015).
As mentioned above, the recycling of electric vehicle Li-ion batteries could have beneficial environmental impacts when considering the entire life cycle. When considering the individual processes, these benefits could be maximised by increasing the proportion of renewable energy sources in the energy mix and through the treatment of gypsum residues to prevent them reaching landfill (Boyden et al., 2016).
5.5.4 Environmental impacts of landfill
Landfilling of electric vehicle batteries is the least desirable option for end-of-life treatment. Due to the substances used in electric vehicle batteries, they pose risks to the environment and communities through:
• risk of fire at landfill sites and in transport vehicles;
• soil and water contamination by hydrogen fluoride should the electrolyte be exposed to water;
• possible groundwater pollution through leaching of toxic substances (Despeisse et al., 2015; Heelan et al., 2016; Gaustad, 2018).
Residue from the shredding of vehicles during the end-of-life process is often sent to landfill. While it is classified as non-hazardous waste, there may still be components such as heavy metals that are hazardous and can cause pollution to groundwater (Sakai et al., 2014). However, it is not only the environmental impacts of landfill that need to be considered; the landfilling of materials excludes opportunities for savings in resources and energy across the lifecycle (Gaustad, 2018).
5.6 Summary: minimising environmental impacts of the end-of-life stage
The end-of-life stage, considered in isolation, has the smallest impact in terms of total life cycle emissions. However, encouraging sustainable practices during this stage could result in benefits across all life cycle stages. These include:
• a reduced need for virgin materials and hence a reduction in the impacts of mining and production;
• a reduced or delayed need for disposal and hence a reduction in impacts from landfilling;
• a move towards a more circular economy through the reuse and remanufacture of batteries or their components and from recycling or recovery of materials.
Further research and development is needed to make end-of-life processes more efficient and sustainable. Therefore, there is a need to:
• consider standardisation to encourage large-scale recycling and reuse processes;
• real-life testing of battery second-use applications and other end-of-life options;
• develop systems for REEs contained in magnets;
More broadly there is a need to consider a more standardised approach to terminology. For example, remanufacture, refunctionalisation and direct recycling are used interchangeably in the literature and this makes the assessment of their relative strengths and weaknesses more difficult.
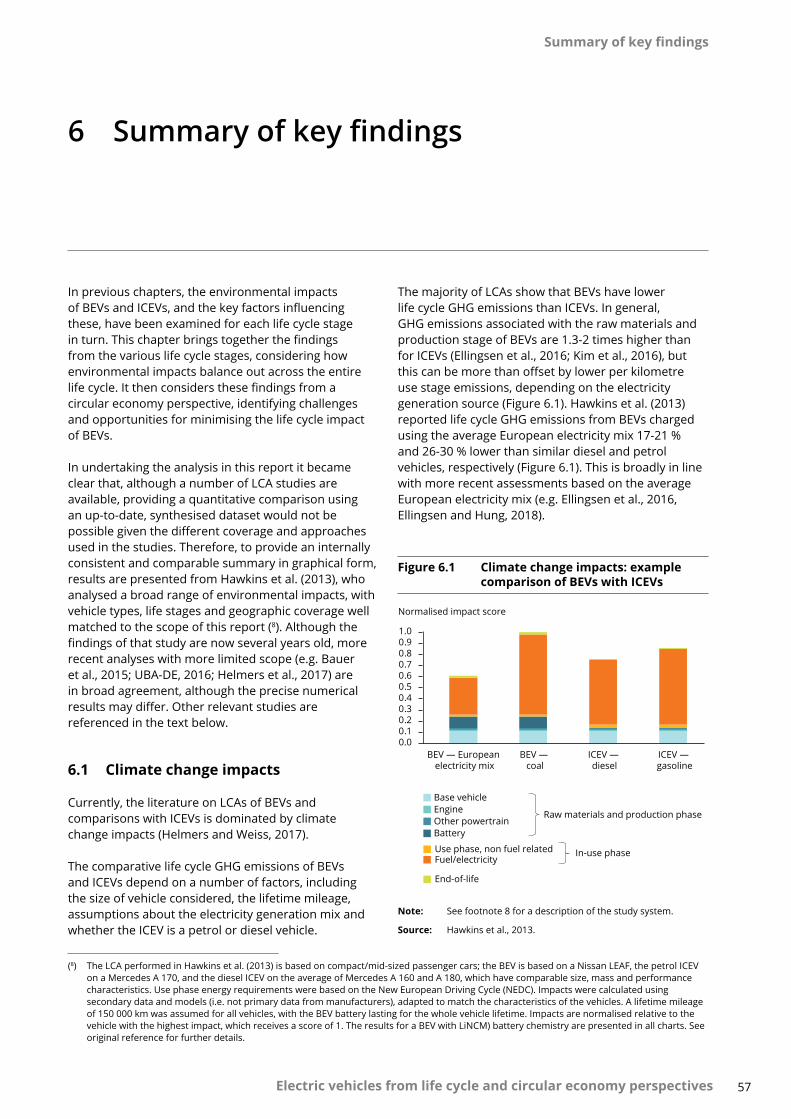
57
Summary of key findings
Electric vehicles from life cycle and circular economy perspectives
6 Summary of key findings
In previous chapters, the environmental impacts of BEVs and ICEVs, and the key factors influencing these, have been examined for each life cycle stage in turn. This chapter brings together the findings from the various life cycle stages, considering how environmental impacts balance out across the entire life cycle. It then considers these findings from a circular economy perspective, identifying challenges and opportunities for minimising the life cycle impact of BEVs.
In undertaking the analysis in this report it became clear that, although a number of LCA studies are available, providing a quantitative comparison using an up-to-date, synthesised dataset would not be possible given the different coverage and approaches used in the studies. Therefore, to provide an internally consistent and comparable summary in graphical form, results are presented from Hawkins et al. (2013), who analysed a broad range of environmental impacts, with vehicle types, life stages and geographic coverage well matched to the scope of this report (8). Although the findings of that study are now several years old, more recent analyses with more limited scope (e.g. Bauer et al., 2015; UBA-DE, 2016; Helmers et al., 2017) are in broad agreement, although the precise numerical results may differ. Other relevant studies are referenced in the text below.
6.1 Climate change impacts
Currently, the literature on LCAs of BEVs and comparisons with ICEVs is dominated by climate change impacts (Helmers and Weiss, 2017).
The comparative life cycle GHG emissions of BEVs and ICEVs depend on a number of factors, including the size of vehicle considered, the lifetime mileage, assumptions about the electricity generation mix and whether the ICEV is a petrol or diesel vehicle.
(8) The LCA performed in Hawkins et al. (2013) is based on compact/mid-sized passenger cars; the BEV is based on a Nissan LEAF, the petrol ICEV on a Mercedes A 170, and the diesel ICEV on the average of Mercedes A 160 and A 180, which have comparable size, mass and performance characteristics. Use phase energy requirements were based on the New European Driving Cycle (NEDC). Impacts were calculated using secondary data and models (i.e. not primary data from manufacturers), adapted to match the characteristics of the vehicles. A lifetime mileage of 150 000 km was assumed for all vehicles, with the BEV battery lasting for the whole vehicle lifetime. Impacts are normalised relative to the vehicle with the highest impact, which receives a score of 1. The results for a BEV with LiNCM) battery chemistry are presented in all charts. See original reference for further details.
The majority of LCAs show that BEVs have lower life cycle GHG emissions than ICEVs. In general, GHG emissions associated with the raw materials and production stage of BEVs are 1.3-2 times higher than for ICEVs (Ellingsen et al., 2016; Kim et al., 2016), but this can be more than offset by lower per kilometre use stage emissions, depending on the electricity generation source (Figure 6.1). Hawkins et al. (2013) reported life cycle GHG emissions from BEVs charged using the average European electricity mix 17-21 % and 26-30 % lower than similar diesel and petrol vehicles, respectively (Figure 6.1). This is broadly in line with more recent assessments based on the average European electricity mix (e.g. Ellingsen et al., 2016, Ellingsen and Hung, 2018).
Figure 6.1 Climate change impacts: example comparison of BEVs with ICEVs
0.00.10.20.30.40.50.60.70.80.91.0
BEV — European electricity mix
BEV — coal
ICEV — diesel
ICEV — gasoline
Normalised impact score
Base vehicleEngineOther powertrain
Raw materials and production phase
In-use phase
Battery
Use phase, non fuel relatedFuel/electricity
End-of-life
Note: See footnote 8 for a description of the study system.
Source: Hawkins et al., 2013.
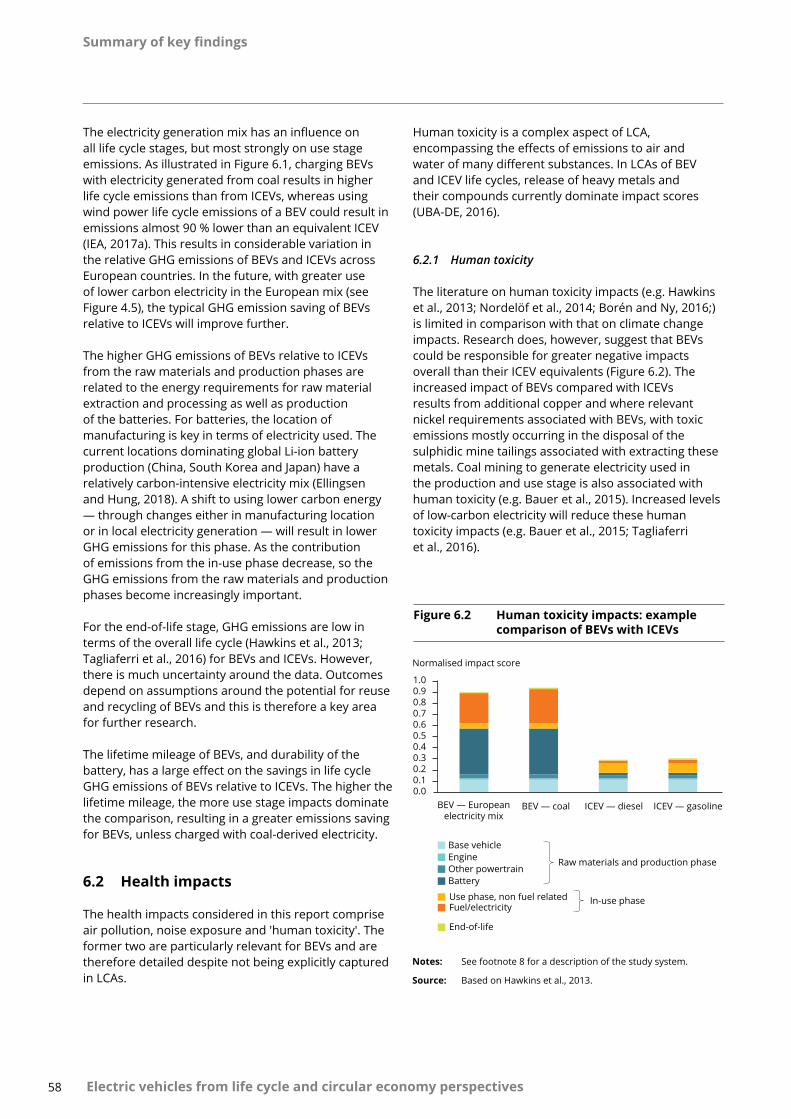
Summary of key findings
58 Electric vehicles from life cycle and circular economy perspectives
The electricity generation mix has an influence on all life cycle stages, but most strongly on use stage emissions. As illustrated in Figure 6.1, charging BEVs with electricity generated from coal results in higher life cycle emissions than from ICEVs, whereas using wind power life cycle emissions of a BEV could result in emissions almost 90 % lower than an equivalent ICEV (IEA, 2017a). This results in considerable variation in the relative GHG emissions of BEVs and ICEVs across European countries. In the future, with greater use of lower carbon electricity in the European mix (see Figure 4.5), the typical GHG emission saving of BEVs relative to ICEVs will improve further.
The higher GHG emissions of BEVs relative to ICEVs from the raw materials and production phases are related to the energy requirements for raw material extraction and processing as well as production of the batteries. For batteries, the location of manufacturing is key in terms of electricity used. The current locations dominating global Li-ion battery production (China, South Korea and Japan) have a relatively carbon-intensive electricity mix (Ellingsen and Hung, 2018). A shift to using lower carbon energy — through changes either in manufacturing location or in local electricity generation — will result in lower GHG emissions for this phase. As the contribution of emissions from the in-use phase decrease, so the GHG emissions from the raw materials and production phases become increasingly important.
For the end-of-life stage, GHG emissions are low in terms of the overall life cycle (Hawkins et al., 2013; Tagliaferri et al., 2016) for BEVs and ICEVs. However, there is much uncertainty around the data. Outcomes depend on assumptions around the potential for reuse and recycling of BEVs and this is therefore a key area for further research.
The lifetime mileage of BEVs, and durability of the battery, has a large effect on the savings in life cycle GHG emissions of BEVs relative to ICEVs. The higher the lifetime mileage, the more use stage impacts dominate the comparison, resulting in a greater emissions saving for BEVs, unless charged with coal-derived electricity.
6.2 Health impacts
The health impacts considered in this report comprise air pollution, noise exposure and 'human toxicity'. The former two are particularly relevant for BEVs and are therefore detailed despite not being explicitly captured in LCAs.
Human toxicity is a complex aspect of LCA, encompassing the effects of emissions to air and water of many different substances. In LCAs of BEV and ICEV life cycles, release of heavy metals and their compounds currently dominate impact scores (UBA-DE, 2016).
6.2.1 Human toxicity
The literature on human toxicity impacts (e.g. Hawkins et al., 2013; Nordelöf et al., 2014; Borén and Ny, 2016;) is limited in comparison with that on climate change impacts. Research does, however, suggest that BEVs could be responsible for greater negative impacts overall than their ICEV equivalents (Figure 6.2). The increased impact of BEVs compared with ICEVs results from additional copper and where relevant nickel requirements associated with BEVs, with toxic emissions mostly occurring in the disposal of the sulphidic mine tailings associated with extracting these metals. Coal mining to generate electricity used in the production and use stage is also associated with human toxicity (e.g. Bauer et al., 2015). Increased levels of low-carbon electricity will reduce these human toxicity impacts (e.g. Bauer et al., 2015; Tagliaferri et al., 2016).
Figure 6.2 Human toxicity impacts: example comparison of BEVs with ICEVs
0.00.10.20.30.40.50.60.70.80.91.0
BEV — Europeanelectricity mix
BEV — coal ICEV — diesel ICEV — gasoline
Normalised impact score
Base vehicleEngineOther powertrain
Raw materials and production phase
In-use phase
Battery
Use phase, non fuel relatedFuel/electricity
End-of-life
Notes: See footnote 8 for a description of the study system.
Source: Based on Hawkins et al., 2013.
Summary of key findings
59 Electric vehicles from life cycle and circular economy perspectives
6.2.2 Air pollution
BEVs potentially offer local air quality benefits due to zero exhaust emissions. However, BEVs still emit PM locally from road, tyre and brake wear. In addition, electricity generation also produces emissions.
In Europe, the savings of emissions of NOx from exhaust probably outweigh additional NOx released from electricity generation for BEVs (Öko-Institut and Transport & Mobility Leuven, 2016).
For PM, the literature suggests that emissions from raw materials and production are greater for BEVs than for ICEVs, largely due to the coal-generated electricity used in battery manufacture (Hawkins et al., 2013; Bauer et al., 2015). In the use stage, PM emissions of BEVs from electricity generation depend strongly on the electricity mix, with coal-generated electricity being associated with higher PM emissions than fuel combustion in ICEVs. For the average European electricity mix, studies report PM emissions from electricity generation similar or slightly higher than those from fuel combustion in ICEVs (Hawkins et al., 2013; Bauer et al., 2015). Focusing on local PM emissions, there is a great deal of uncertainty and variation in results, relating to use of type-approval versus real-world exhaust emissions for ICEVs and different estimation methods for non-exhaust emissions. Some studies show parity or a very slight reduction in local PM emissions from BEVs relative to ICEVs (e.g. Timmers and Achten, 2016), but others report a much larger reduction from BEVs (Hooftman et al., 2016).
Regarding local air quality impacts, the spatial location of emissions is important. Where power stations are located away from population centres, replacement of ICEVs with BEVs is likely to lead to an improvement in urban air quality, even in contexts in which the total emissions of the latter may be greater (e.g. Soret et al., 2014).
As the proportion of renewable electricity increases and coal combustion decreases in the European electricity mix over the next decades (EC, 2016; Figure 4.5), the air quality advantage of BEVs over ICEVs is likely to increase in tandem (e.g. Öko-Institut and Transport & Mobility Leuven, 2016).
6.2.3 Noise pollution
The available literature considered for this report relates only to differences in use stage noise pollution between BEVs and ICEVs.
The difference in noise emissions between BEVs and ICEVs strongly depends on vehicle speed. Considering passenger cars, engine noise from ICEVs is estimated to be around 10 dB higher than that of BEVs (RIVM, 2010) and is the main component of noise emissions when stationary or at very low speeds. However, with increasing speed, noise generated by interaction between the tyres and the road becomes more important and dominates from around 25-30 km/h (UBA-DE, 2013; Campello-Vicente et al., 2017). At 50 km/h, the noise reduction potential of a BEV relative to an ICEV is only around 1 dB (RIVM, 2010; Campello-Vicente et al., 2017); a difference barely perceptible to the human ear.
Reflecting this, modelling studies have shown benefits of passenger car fleet electrification on exposure to, and annoyance from, noise in urban areas where speeds are generally low and traffic is frequently stationary (RIVM, 2010; Campello-Vicente et al., 2017), whereas there is unlikely to be a large benefit on rural roads or motorways where speeds are higher. The extent of noise reduction will also depend strongly on the proportion of BEVs in the vehicle fleet (UBA-DE, 2013).
However, the requirement for AVASs on BEVs to mitigate road safety concerns might lower their potential to reduce traffic noise.
6.3 Ecosystem impacts
Aspects relevant to ecosystem impacts captured by LCAs relate to freshwater ecotoxicity, terrestrial ecotoxicity and terrestrial acidification potential.
For freshwater ecotoxicity (Figure 6.3), the evidence is mixed: some research (e.g. Szczechowicz et al., 2012; Hawkins et al., 2013; Helmers and Weiss, 2017) suggests that impacts are higher from BEVs than from ICEVs in Europe, whereas Borén and Ny (2016) suggest that they can be lower. Freshwater ecotoxicity impacts
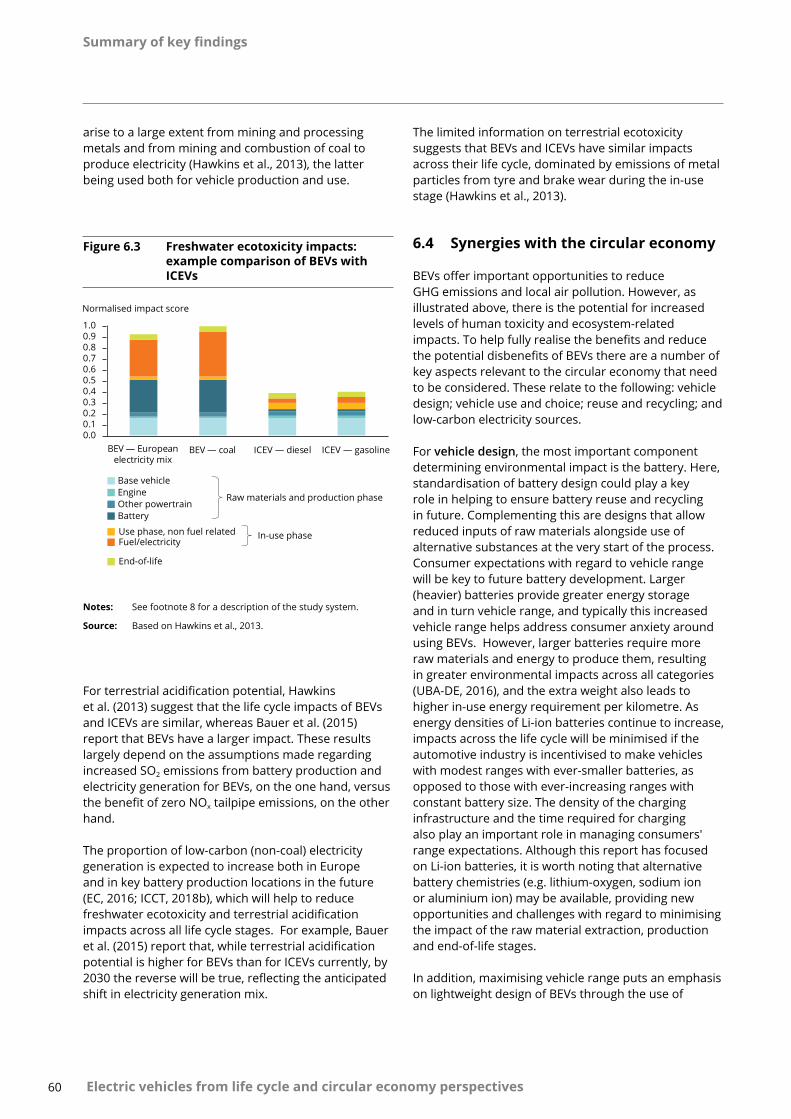
Summary of key findings
60 Electric vehicles from life cycle and circular economy perspectives
arise to a large extent from mining and processing metals and from mining and combustion of coal to produce electricity (Hawkins et al., 2013), the latter being used both for vehicle production and use.
Figure 6.3 Freshwater ecotoxicity impacts: example comparison of BEVs with ICEVs
0.00.10.20.30.40.50.60.70.80.91.0
BEV — Europeanelectricity mix
BEV — coal ICEV — diesel ICEV — gasoline
Normalised impact score
Base vehicleEngineOther powertrain
Raw materials and production phase
In-use phase
Battery
Use phase, non fuel relatedFuel/electricity
End-of-life
Notes: See footnote 8 for a description of the study system.
Source: Based on Hawkins et al., 2013.
For terrestrial acidification potential, Hawkins et al. (2013) suggest that the life cycle impacts of BEVs and ICEVs are similar, whereas Bauer et al. (2015) report that BEVs have a larger impact. These results largely depend on the assumptions made regarding increased SO2 emissions from battery production and electricity generation for BEVs, on the one hand, versus the benefit of zero NOx tailpipe emissions, on the other hand.
The proportion of low-carbon (non-coal) electricity generation is expected to increase both in Europe and in key battery production locations in the future (EC, 2016; ICCT, 2018b), which will help to reduce freshwater ecotoxicity and terrestrial acidification impacts across all life cycle stages. For example, Bauer et al. (2015) report that, while terrestrial acidification potential is higher for BEVs than for ICEVs currently, by 2030 the reverse will be true, reflecting the anticipated shift in electricity generation mix.
The limited information on terrestrial ecotoxicity suggests that BEVs and ICEVs have similar impacts across their life cycle, dominated by emissions of metal particles from tyre and brake wear during the in-use stage (Hawkins et al., 2013).
6.4 Synergies with the circular economy
BEVs offer important opportunities to reduce GHG emissions and local air pollution. However, as illustrated above, there is the potential for increased levels of human toxicity and ecosystem-related impacts. To help fully realise the benefits and reduce the potential disbenefits of BEVs there are a number of key aspects relevant to the circular economy that need to be considered. These relate to the following: vehicle design; vehicle use and choice; reuse and recycling; and low-carbon electricity sources.
For vehicle design, the most important component determining environmental impact is the battery. Here, standardisation of battery design could play a key role in helping to ensure battery reuse and recycling in future. Complementing this are designs that allow reduced inputs of raw materials alongside use of alternative substances at the very start of the process. Consumer expectations with regard to vehicle range will be key to future battery development. Larger (heavier) batteries provide greater energy storage and in turn vehicle range, and typically this increased vehicle range helps address consumer anxiety around using BEVs. However, larger batteries require more raw materials and energy to produce them, resulting in greater environmental impacts across all categories (UBA-DE, 2016), and the extra weight also leads to higher in-use energy requirement per kilometre. As energy densities of Li-ion batteries continue to increase, impacts across the life cycle will be minimised if the automotive industry is incentivised to make vehicles with modest ranges with ever-smaller batteries, as opposed to those with ever-increasing ranges with constant battery size. The density of the charging infrastructure and the time required for charging also play an important role in managing consumers' range expectations. Although this report has focused on Li-ion batteries, it is worth noting that alternative battery chemistries (e.g. lithium-oxygen, sodium ion or aluminium ion) may be available, providing new opportunities and challenges with regard to minimising the impact of the raw material extraction, production and end-of-life stages.
In addition, maximising vehicle range puts an emphasis on lightweight design of BEVs through the use of
Summary of key findings
61 Electric vehicles from life cycle and circular economy perspectives
lighter materials. This can reduce use stage energy consumption, but it can come at the cost of higher production impacts and lower recyclability of materials (Egede, 2017). In terms of overall impacts, when there is a trade-off between impacts in the use stage and other stages, the lifetime mileage of the BEV then becomes important. The higher the lifetime mileage of a vehicle, the lower the influence of production-related impacts.
Lifetime mileage is itself, in part, a question of vehicle design. Lifetime mileage will be maximised if durability and ease of maintenance are prioritised in the design of individual components (especially the battery) and of the vehicle as a whole.
For vehicle use, the research highlighted that robust evidence on annual mileage, trip purpose and lifetime mileage is currently limited, due to consumer uptake of BEVs being very low until relatively recently. Future research on this topic could make use of data from national travel surveys and periodic roadworthiness tests, the latter being mandatory across the EU. BEVs could help transition society to more sustainable mobility. Here, shared mobility could be key for a number of reasons. First, it enables trialling of electric vehicles, which has been shown to reduce range anxiety. This in turn could have impacts in terms of expectations of vehicle range and as a result allow the use of lighter, 'lower' energy batteries with associated reduction in GHG emissions in the production phase. Second, shared mobility, especially where it allows consumers access to a range of vehicles could help ensure the choice of the most appropriate car for their needs. Third, while BEVs have an important role to play in terms of future mobility, it is essential to consider the
role of BEVs alongside public transport and active travel (walking and cycling) modes.
Reuse and recycling need to be designed in from the start. New processes need to be considered in the context of future access to REEs and steps taken to fully understand the barriers and opportunities for second-use applications and remanufacturing of batteries. There is a need to better understand the use of carbon composites and future recycling needs.
The role of low-carbon electricity sources is important across all life cycle stages to achieve the full potential reduction in GHG emissions from the use of BEVs. Although this has the greatest impact in the in-use stage, it also relates to raw material extraction and production stages, which involve energy-intensive processes. Reducing the use of coal has further benefits, in terms of reducing human ecotoxicity and ecosystem impacts associated with coal mining and combustion. The proportion of renewable electricity generation sources in the electricity mix is expected to rise over the coming decades, both in the EU (where BEVs are used) and in key cell and battery manufacturing locations outside the EU (Huo et al., 2015; EC 2016). Furthermore, as the BEV fleet grows, it will be essential that BEV charging patterns are managed in a way that can take advantage of renewable and other low-carbon electricity sources and avoids causing high peak electricity demand. There is also ongoing research around the feasibility of BEV batteries playing an active role in the electricity grid to store excess renewable power and provide grid-stabilising services, either while BEVs are plugged in or as a 'second-life' use of the batteries.
Concluding remarks
6262
Concluding remarks
Electric vehicles from life cycle and circular economy perspectives
7 Concluding remarks
It is anticipated that electric vehicles will be a key future component of Europe's mobility system, helping reduce impacts on climate change and air quality. There is, therefore, an increasing requirement to view these vehicles from a systems perspective, as has been undertaken in this study. Recommendations and next steps relating to this understanding are detailed below. Three key themes are discussed: (1) the importance of data gathering and dissemination; (2) understanding of current and future policy levers; and (3) the increasing need to consider interactions between transport and energy systems.
The evidence base on electric vehicle LCA impacts needs to continue to be updated and developed. It should reflect the different electric vehicle makes and models increasingly available, emerging data on real-world use and how batteries are treated at the end-of-life stage. Furthermore, there is a need to ensure that the studies continue to account for full LCA impacts rather than the historical focus on GHG emissions. Developing an accessible database of studies and underpinning assumptions would be invaluable in disseminating this knowledge, which would in turn help to address the uncertainties identified in this report.
In this report we have shown that BEVs offer important opportunities to reduce GHG emissions and local air
pollution. Areas where BEVs could have potential negative impacts are, however, also identified, for example at the raw material extraction stage and because of the potential for a temporary rebound effect during vehicle adoption. Furthermore, there are also areas where there is uncertainty, for example in terms of end-of-life processing. Reflecting this, current and future policy levers and incentives could be reviewed, for example in terms of the increasing need for battery standardisation to facilitate recycling and reuse.
It is clear that with the adoption of electric vehicles the transport and energy systems will become increasingly intertwined. The importance of low-carbon electricity is a theme that has impacts across all life cycle stages. There will be a need to manage and optimise the increasing electricity needs associated with electric vehicle use and to better understand the impacts that biofuel use in ICEVs could have on LCA comparisons. Low-carbon electricity will also change the environmental impacts associated with raw material extraction and vehicle and battery production. Although the focus of this study was on BEVs, energy-related aspects will also be relevant for the production of hydrogen for FCEVs. It will be important for future systems perspectives and assessments to consider the transport and energy sectors more closely.
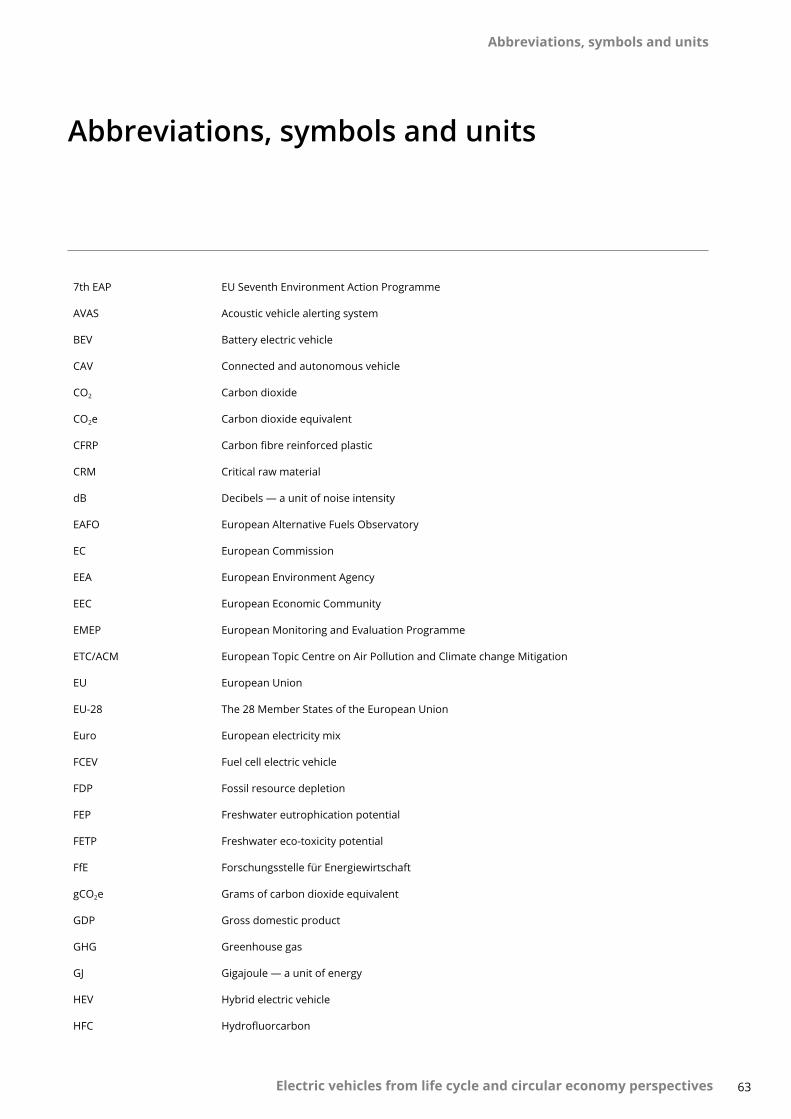
63
Abbreviations, symbols and units
Electric vehicles from life cycle and circular economy perspectives
Abbreviations, symbols and units
7th EAP EU Seventh Environment Action Programme
AVAS Acoustic vehicle alerting system
BEV Battery electric vehicle
CAV Connected and autonomous vehicle
CO2 Carbon dioxide
CO2e Carbon dioxide equivalent
CFRP Carbon fibre reinforced plastic
CRM Critical raw material
dB Decibels — a unit of noise intensity
EAFO European Alternative Fuels Observatory
EC European Commission
EEA European Environment Agency
EEC European Economic Community
EMEP European Monitoring and Evaluation Programme
ETC/ACM European Topic Centre on Air Pollution and Climate change Mitigation
EU European Union
EU-28 The 28 Member States of the European Union
Euro European electricity mix
FCEV Fuel cell electric vehicle
FDP Fossil resource depletion
FEP Freshwater eutrophication potential
FETP Freshwater eco-toxicity potential
FfE Forschungsstelle für Energiewirtschaft
gCO2e Grams of carbon dioxide equivalent
GDP Gross domestic product
GHG Greenhouse gas
GJ Gigajoule — a unit of energy
HEV Hybrid electric vehicle
HFC Hydrofluorcarbon
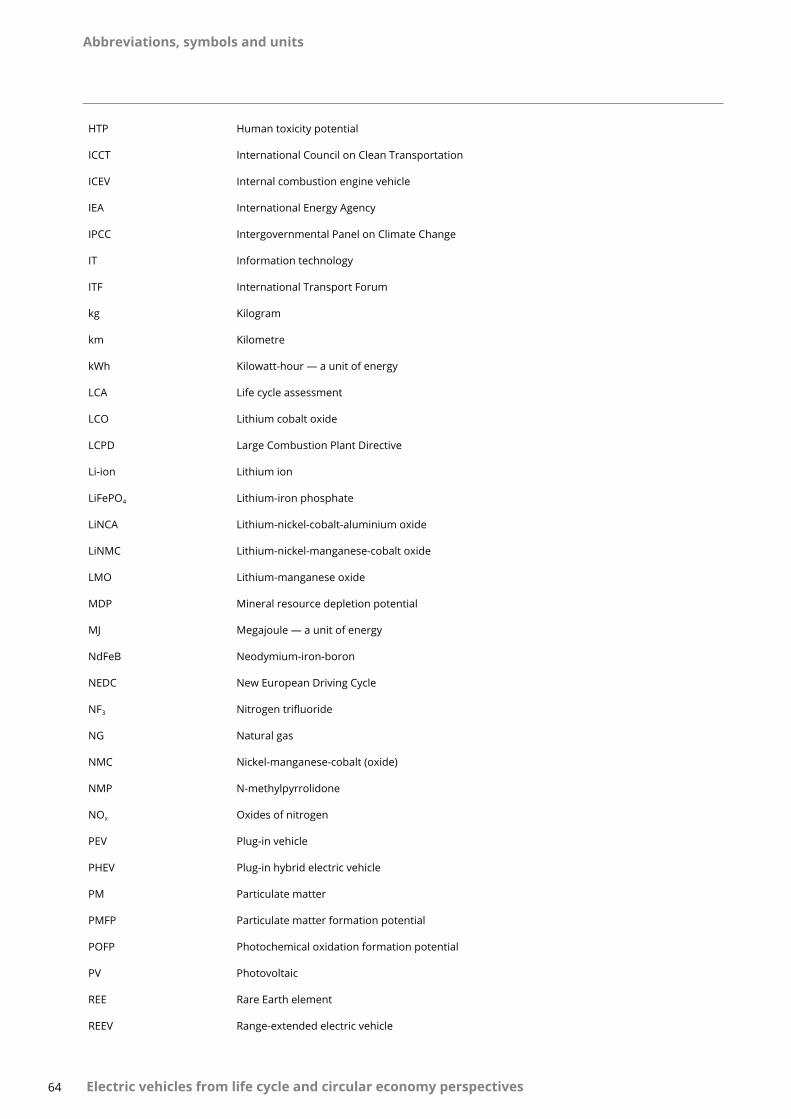
Abbreviations, symbols and units
64 Electric vehicles from life cycle and circular economy perspectives
HTP Human toxicity potential
ICCT International Council on Clean Transportation
ICEV Internal combustion engine vehicle
IEA International Energy Agency
IPCC Intergovernmental Panel on Climate Change
IT Information technology
ITF International Transport Forum
kg Kilogram
km Kilometre
kWh Kilowatt-hour — a unit of energy
LCA Life cycle assessment
LCO Lithium cobalt oxide
LCPD Large Combustion Plant Directive
Li-ion Lithium ion
LiFePO4 Lithium-iron phosphate
LiNCA Lithium-nickel-cobalt-aluminium oxide
LiNMC Lithium-nickel-manganese-cobalt oxide
LMO Lithium-manganese oxide
MDP Mineral resource depletion potential
MJ Megajoule — a unit of energy
NdFeB Neodymium-iron-boron
NEDC New European Driving Cycle
NF3 Nitrogen trifluoride
NG Natural gas
NMC Nickel-manganese-cobalt (oxide)
NMP N-methylpyrrolidone
NOx Oxides of nitrogen
PEV Plug-in vehicle
PHEV Plug-in hybrid electric vehicle
PM Particulate matter
PMFP Particulate matter formation potential
POFP Photochemical oxidation formation potential
PV Photovoltaic
REE Rare Earth element
REEV Range-extended electric vehicle
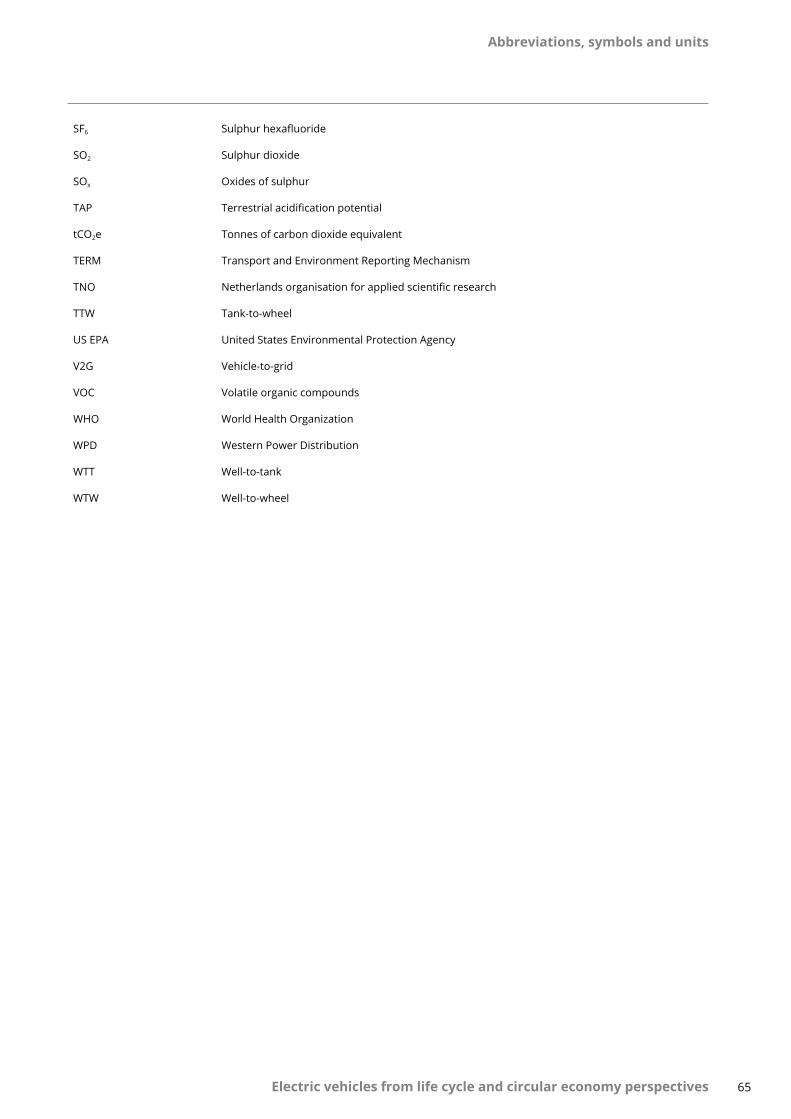
Abbreviations, symbols and units
65 Electric vehicles from life cycle and circular economy perspectives
SF6 Sulphur hexafluoride
SO2 Sulphur dioxide
SOx Oxides of sulphur
TAP Terrestrial acidification potential
tCO2e Tonnes of carbon dioxide equivalent
TERM Transport and Environment Reporting Mechanism
TNO Netherlands organisation for applied scientific research
TTW Tank-to-wheel
US EPA United States Environmental Protection Agency
V2G Vehicle-to-grid
VOC Volatile organic compounds
WHO World Health Organization
WPD Western Power Distribution
WTT Well-to-tank
WTW Well-to-wheel
Glossary
6666
Glossary
Electric vehicles from life cycle and circular economy perspectives
Glossary
Acidification A fall in the pH of soil or aquatic ecosystems, leading to loss of biodiversity and productivity.
Anode The electrode within a battery at which oxidation (loss of electrons) occurs.
Battery electric vehicle A vehicle that uses an electric motor powered by a rechargeable battery instead of the internal combustion engine.
Cathode The electrode within a battery at which reduction (gain of electrons) occurs.
Circular economy An alternative to the traditional linear economy, which focuses on make, use and dispose. The emphasis of the circular economy is to keep the value of materials and products as high as possible for as long as possible.
Climate change and global warming potential The trapping of carbon dioxide and other greenhouse gases in the Earth's atmosphere can lead to the 'greenhouse effect', contributing to an increase in average global temperature. The global warming potential is a measure of how much a chemical can contribute to this warming.
Ecotoxicity An impact category related to the potential harm a chemical could cause to terrestrial (on land) or aquatic environments were it to be released.
Eutrophication An excess of mineral nutrient availability in a terrestrial or aquatic ecosystem, which can cause a range of negative impacts leading to loss of biodiversity.
Human toxicity This measure reflects the harm to human health that a chemical could cause if released to the environment. This is based on the toxicity of the compound and the potential for human exposure.
Hybrid electric vehicle A vehicle that combines an electric motor with an internal combustion engine. A hybrid electric vehicle is able to charge its battery using the internal combustion engine.
Internal combustion engine vehicle A conventional vehicle that is powered by burning a fuel such as petrol or diesel.

Glossary
67 Electric vehicles from life cycle and circular economy perspectives
Life cycle assessment A means of assessing the environmental impact associated with all stages of a product's life: from raw material extraction and processing, to its production, to its use in day-to-day life, and finally to its end of life and related opportunities for reuse, recycling and disposal.
Plug-in hybrid electric vehicle Similar to a hybrid electric vehicle in that it combines an electric motor and an internal combustion engine; however, in this case, the battery can also be charged by plugging it in to the national grid via a cable.
Rebound effect Unintended consequences of an action that often reduce the benefits that can be achieved by taking that action. For example, the climate change benefits brought about by increasing vehicle efficiency could be reduced by people driving further or faster than before.
Tank-to-wheel Includes emissions and impacts from the combustion of fuel in a vehicle.
Vehicle-to-grid A system in which plug-in electric vehicles, including battery electric and plug-in hybrid electric vehicles, can feed energy back to the electricity grid.
Well-to-wheel A type of life cycle assessment for vehicles that focuses on the energy carrier used to drive the vehicle, e.g. electricity. This can be subdivided into categories such as well-to-tank and tank-to-wheel.
Well-to-tank Includes emissions and impacts up to and including delivery of a fuel (e.g. electricity or petrol) to a vehicle. This includes resource extraction and fuel production.
References
6868
References
Electric vehicles from life cycle and circular economy perspectives
References
Ahmadi, L., et al., 2014, 'Environmental feasibility of re-use of electric vehicle batteries', Sustainable Energy Technologies and Assessments 6, pp. 64-74.
Ahmadi, L., et al., 2017, 'A cascaded life cycle: reuse of electric vehicle lithium-ion battery packs in energy storage systems', International Journal of Life Cycle Assessment 22, pp. 111-124.
Battery University, 2018, 'Types of lithium-ion battery' (http://batteryuniversity.com/learn/article/types_of_lithium_ion) accessed 25 June 2018.
Bankole, O. E., et al., 2013, 'Battery recycling technologies: recycling waste lithium ion batteries with the impact on environment in-view', Journal of Environment and Ecology 4, pp. 14-28.
Bauer, C., et al., 2015, 'The environmental performance of current and future passenger vehicles: life cycle assessment based on a novel scenario analysis framework', Applied Energy 157, pp. 871-883.
Blagoeva, D., et al., 2016, Assessment of potential bottlenecks along the materials supply chain for the future deployment of low-carbon energy and transport technologies in the EU, European Commission, Brussels.
Blanes, N., et al., 2016, Noise in Europe 2017: updated assessment, European Topic Centre on Air Pollution and Climate Change Mitigation (ETC/ACM), Bilthoven, The Netherlands, (https://acm.eionet.europa.eu/reports/docs/ETCACM_TP_2016_13_NoiseInEurope2017.pdf).
Blengini, G., et al., 2017, Assessment of the methodology for establishing the EU list of critical raw materials, European Commission, Brussels.
Borén, S. and Ny, H., 2016, 'A strategic sustainability analysis of electric vehicles in EU today and towards 2050', World Academy of Science, Engineering and Technology: International Journal of Environmental and Ecological Engineering 10, pp. 294-302.
Boyden, A., et al., 2016, 'The environmental impacts of recycling portable lithium-ion batteries', Procedia CIRP 48, pp. 188-193.
Cairns, D. S., et al., 2017, The lives of cars seen through licensing and test data, RAC Foundation, London.
Campello-Vicente, H., et al., 2017, 'The effect of electric vehicles on urban noise maps', Applied Acoustics 116, pp. 59-64.
Canals Casals, L., et al., 2017, 'Second life of electric vehicle batteries: relation between materials degradation and environmental impact', International Journal of Life Cycle Assessment 22, pp. 82-93.
CE Delft, et al., 2011, Impacts of electric vehicles — Deliverable 3 Assessment of the future electricity sector (https://ec.europa.eu/clima/sites/clima/files/transport/vehicles/docs/d3_en.pdf).
Connected Energy, 2017, Global first as highway motorists benefit from rapid charging capability using 2nd life Renault batteries (https://www.c-e-int.com/resources/news-events/renault-global-first/) accessed 4 April 2018.
Despeisse, M., et al., 2015, 'Towards a circular economy for end-of-life vehicles: a comparative study UK — Japan', Procedia CIRP 29, pp. 668-673.
Delogu, M., et al., 2017, 'Innovative composites and hybrid materials for electric vehicles lightweight design in a sustainability perspective', Materials Today Communications 13, pp. 192-209.
Diekmann, J., et al., 2017, 'Ecological recycling of lithium-ion batteries from electric vehicles with focus on mechanical processes', Journal of the Electrochemical Society 164, pp. A6184-A6191.
Dunn, J., et al., 2012, 'Impact of recycling on cradle-to-gate energy consumption and greenhouse gas emissions of automotive lithium-ion batteries', Environmental Science and Technology 46, pp. 12704-12710.
Dunn, J., et al., 2015, 'The significance of Li-ion batteries in electric vehicle life-cycle energy and emissions and recycling's role in its reduction', Energy and Environmental Science 8, pp. 158-168.
References
69Electric vehicles from life cycle and circular economy perspectives
EAFO, et al., 2017, The transition to a zero emission vehicles fleet for cars in the EU by 2050. Pathways and impacts: an evaluation of forecasts and backcasting the COP21 commitments, European Commission (http://www.eafo.eu/sites/default/files/The%20transition%20to%20a%20ZEV%20fleet%20for%20cars%20in%20the%20EU%20by%202050%20EAFO%20study%20November%202017.pdf) accessed 24 May 2018.
EAFO, 2018, 'Electric vehicles market share', European Alternative Fuels Observatory (http://www.eafo.eu/eu#eu_fleet_pev_block_anchor) accessed 27 April 2018.
EC, 2003, Communication from the Commission to the European Parliament 'Integrated Product Policy — building on environmental life cycle thinking' (COM(2003) 302 final), European Commission.
EC, 2011, White paper — Roadmap to a Single European Transport Area — Towards a competitive and resource efficient transport system, European Commission (https://ec.europa.eu/transport/themes/strategies/2011_white_paper_en) accessed 24 May 2018.
EC, 2013, EU Reference scenario 2013: energy, transport and GHG emissions trends to 2050, European Commission (https://ec.europa.eu/transport/sites/transport/files/media/publications/doc/trends-to-2050-update-2013.pdf) accessed 24 May 2018.
EC, 2016, EU Reference scenario 2016: energy, transport and GHG emissions trends to 2050, European Commission. (https://ec.europa.eu/energy/sites/ener/files/documents/20160713%20draft_publication_REF2016_v13.pdf) accessed 24 May 2018.
EC, 2017a, Commission Staff Working Document 'Impact assessment accompanying the proposal for a Regulation of the European Parliament and of the Council setting emission performance standards for new passenger cars and for new light commercial vehicles as part of the Union's integrated approach to reduce CO2 emissions from light duty vehicles and amending Regulation (EC) No 715/2007 (recast)' European Commission (https://ec.europa.eu/clima/sites/clima/files/transport/vehicles/docs/swd_2017_650_p1_en.pdf) accessed 8 August 2018.
EC, 2017b, Study on the review of the list of critical raw materials, Critical raw materials factsheets, European Commission.
EC, 2017c, 'Innovation Deals', European Commission (https://ec.europa.eu/info/research-and-innovation/law-and-regulations/identifying-barriers-innovation_en) accessed 4 April 2018.
EC, 2017d, From E-mobility to recycling: the virtuous loop of electric vehicle (https://ec.europa.eu/research/innovation-deals/index.cfm?pg=emobility) accessed 4 April 2018.
EC, 2018a, Report on critical raw materials and the circular economy, European Commission (https://ec.europa.eu/docsroom/documents/27327) accessed 8 June 2018.
EC, 2018b, 'Raw Materials Information System', European Commission (http://rmis.jrc.ec.europa.eu/?page=context-182da4) accessed 8 June 2018.
EEA, 2016a, Electric vehicles in Europe, European Environment Agency (https://www.eea.europa.eu/publications/electric-vehicles-in-europe) accessed 24 May 2018.
EEA, 2016b, Electric vehicles and the energy sector — impacts on Europe's future emissions, European Environment Agency (https://www.eea.europa.eu/themes/transport/electric-vehicles/electric-vehicles-and-energy), accessed 25 June 2018.
EEA, 2017a, 'Driving to an electric future?', European Environment Agency.
EEA, 2017b, Circular by design — products in the circular economy, European Environment Agency (https://www.eea.europa.eu/publications/circular-by-design) accessed 24 June 2018.
EEA, 2017c, Air quality in Europe — 2017 report, EEA Report No 13/2017, European Environment Agency (https://www.eea.europa.eu/publications/air-quality-in-europe-2017).
EEA, 2017d, 'Overview of electricity production and use in Europe (IND 353)', European Environment Agency (https://www.eea.europa.eu/data-and-maps/indicators/overview-of-the-electricity-production-2/assessment) accessed 21 June 2018.
EEA, 2017e, European Union emission inventory report 1990-2015 under the UNECE Convention on Long-Range Transboundary Air Pollution (LRTAP), European Environment Agency.
EEA, 2018a, 'Electric vehicles as a proportion of the total fleet (IND 108)', European Environment Agency (https://www.eea.europa.eu/data-and-maps/indicators/proportion-of-vehicle-fleet-meeting-4/assessment-2).
EEA, 2018b, Monitoring CO2 emissions from new passenger cars and vans in 2016, EEA Report No 19/2017, European Environment Agency (https://www.eea.
References
70 Electric vehicles from life cycle and circular economy perspectives
europa.eu/publications/co2-emissions-new-cars-and-vans-2016).
EEA, 2018c, 'National emissions reported to the Convention on Long-Range Transboundary Air Pollution (LRTAP Convention), European Environment Agency (https://www.eea.europa.eu/data-and-maps/data/national-emissions-reported-to-the-convention-on-long-range-transboundary-air-pollution-lrtap-convention-12).
Egede, P., 2017, Environmental assessment of lightweight electric vehicles, Springer International Publishing, Basel, Switzerland.
Ellen MacArthur Foundation, 2018, What is a circular economy? (https://www.ellenmacarthurfoundation.org/circular-economy) accessed 24 May 2018.
Ellingsen, L., et al., 2016, 'The size and range effect: lifecycle greenhouse gas emissions of electric vehicles', Environmental Research Letters 11, pp. 1-8.
Ellingsen, L. and Hung, C., 2018, Research for TRAN committee — resources, energy, and lifecycle greenhouse gas emission aspects of electric vehicles, Policy Department for Structural and Cohesion Policies, European Parliament, Brussels.
Elwert, T., et al., 2016, 'Current developments and challenges in the recycling of key components of (hybrid) electric vehicles', Recycling 1, pp. 25-60.
EMEP/EEA, 2016, '2.C Metal production', in EMEP EEA Air pollutant emission inventory guidebook 2016, European Monitoring and Evaluation Programme and European Environment Agency.
Erdmann, L., et al., 2015, Roadmap for the substitution of critical raw materials in electric motors and drives, European Commission.
European Parliament, 2018, Provisional agreement resulting from interinstitutional negotiations. Proposal for a directive of the European Parliament and of the Council amending Directives 2000/53/EC on end-of-life vehicles, 2006/66/EC on batteries and accumulators and waste batteries and accumulators, and 2012/19/EU on waste electrical and electronic equipment, European Parliament, Brussels.
EU, 2013, Decision No 1386/2013/EU of the European Parliament and of the Council of 20 November 2013 on a General Union Environment Action Programme to 2020 'Living well, within the limits of our planet' (OJ L 354, 20.12.2013, pp. 171-200).
Faria, R., et al., 2013, 'Impact of the electricity mix and use profile in the life-cycle assessment of electric vehicles', Renewable and Sustainable Energy Reviews 24, pp. 271-287.
FfE, 2011, EFlott: Wissenschaftliche Analysen Zur Elektromobilität Langfassung, FfE, Munich.
Figenbaum, E., et al., 2015, 'Electromobility in Norway: experiences and opportunities'. Research in Transportation Economics 50(C), pp. 29-38.
Gaines, L., 2014, 'The future of automotive lithium-ion battery recycling: charting a sustainable course', Sustainable Materials and Technologies 1-2, pp. 2-7.
Gaustad, G., 2018, Life-cycles of lithium ion batteries: understanding impacts from extraction to end-of-life (https://www.iea.org/media/workshops/2018/Session4GaustadRIT.pdf) accessed 24 May 2018.
Gradin, K., et al., 2018, 'Scrutinising the electric vehicle material backpack', Journal of Cleaner Production 172, pp. 1699-1710.
Gratz, E., et al., 2014, 'A closed loop process for recycling spent lithium ion batteries', Journal of Power Sources 262, pp. 255-262.
Greaves, S., et al.., 2014, 'An empirical assessment of the feasibility of battery electric vehicles for day-to-day driving', Transportation Research Part A: Policy and Practice 66, pp. 226-237.
Gustafsson, T. and Johansson, A., 2015, Comparison between battery electric vehicles and internal combustion engine vehicles fueled by electrofuels — from an energy efficiency and cost perspective, Masters Thesis, Chalmers University of Technology, Göteborg, Sweden.
Hailey, P. and Keplar, K., 2015, Direct recycling technology for plug-in electric vehicle lithium-ion battery packs, California Energy Commission, Sacramento, CA.
Hall, D. and Lutsey, N., 2018, Effects of battery manufacturing on electric vehicle life-cycle greenhouse gas emissions, International Council on Clean Transportation (https://www.theicct.org/publications/EV-battery-manufacturing-emissions) accessed 22 July 2018.
Hao, H., et al., 2017, 'GHG emissions from the production of lithium-ion batteries for electric vehicles in China', Sustainability, 9(4), p. 504.
References
71 Electric vehicles from life cycle and circular economy perspectives
Haugneland, P., 2016, The Norwegian EV success story, Norwegian Electric Vehicle Association (https://www.a3ps.at/sites/default/files/conferences/2014/papers/1_0_3_elbil_haugneland.pdf).
Hawkins, T., et al., 2013, 'Comparative environmental life cycle assessment of conventional and electric vehicles', Journal of Industrial Ecology 17, pp. 53-64.
Harvey, J., 2017, 'Metal recyclers prepare for electric car revolution' (https://uk.reuters.com/article/us-batteries-recycling-analysis/metal-recyclers-prepare-for-electric-car-revolution-idUKKBN1DH1DS) accessed 3 May 2018.
Heelan, J., et al., 2016, 'Current and prospective li-ion battery recycling and recovery processes', Journal of the Minerals, Metals and Materials Society 68, pp. 2632-2638.
Helmers, E. and Weiss, M., 2017, 'Advances and critical aspects in the life-cycle assessment of battery electric cars', Energy and Emission Control Technologies 5, pp. 1-8.
Helmers, E., et al., 2017, 'Electric car life cycle assessment based on real-world mileage and the electric conversion scenario', International Journal of Life Cycle Assessment 22(1), pp. 15-30.
Hendrickson, T., et al., 2015, 'Life-cycle implications and supply chain logistics of electric vehicle battery recycling in California', Environmental Research Letters 10, pp. 1-10.
Hooftman, N., et al., 2016, 'Environmental analysis of petrol, diesel and electric passenger cars in a Belgian urban setting', Energies 9(2), p. 84.
Huo, H., et al., 2015, 'Life-cycle assessment of greenhouse gas and air emissions of electric vehicles: a comparison between China and the U.S.', Atmospheric Environment 108, pp. 107-116.
ICCT, 2018a, Power play: how governments are spurring the electric vehicle industry, International Council on Clean Transportation, Washington, DC.
ICCT, 2018b, Effects of battery manufacturing on electric vehicle life-cycle greenhouse gas emissions, International Council on Clean Transportation, Washington, DC.
Idjis, H., et al., 2013, 'Designing a sustainable recycling network for batteries from electric vehicles. Development and optimization of scenarios', in: Camarinha-Matos, L. and Scherer, R. (eds), Collaborative systems for reindustrialization, PRO-VE 2013, IFIP Advances in Information and Communication Technology, Springer, Berlin, pp. 609-618.
IEA, 2000a, Greenhouse gas emissions from major industrial sources — IV the aluminium industry, Report No PH3/23, International Energy Agency, Paris.
IEA, 2000b, Greenhouse gas emissions from major industrial sources — III iron and steel production, Report No PH3/30, International Energy Agency, Paris.
IEA, 2017a, 'Task 31: Fuels and Energy Carriers for Transport. Hybrid and Electric Vehicle Technology Collaboration Programme', International Energy Agency (http://www.ieahev.org/tasks/task-31-fuels-and-energy-carriers-for-transport/) accessed 24 September 2018.
IEA, 2017b, Global EV outlook 2017, International Energy Agency, Paris.
ITF, 2016, Shared mobility: innovation for liveable cities, International Transport Forum (https://www.itf-oecd.org/sites/default/files/docs/shared-mobility-liveable-cities.pdf).
Jackson, T., 2017, Prosperity without growth: foundations for the economy, 2nd edition, Routledge, Abingdon, United Kingdom.
Jensen, A. F. and Mabit, S. L., 2017, 'The use of electric vehicles: a case study on adding an electric car to a household', Transportation Research Part A: Policy and Practice 106(C), pp. 89-99.
Jiao, N. and Evans, S., 2016, 'Business models for sustainability: the case of second-life electric vehicle batteries', Procedia CIRP 40, pp. 250-255.
Jin, H., et al., 2018, 'Life cycle assessment of neodymium-iron-boron magnet-to-magnet recycling for electric vehicle motors', Environmental Science and Technology 52, pp. 3796-3802.
Kim, H. C. and Wallington, T. J., 2013, 'Life-cycle energy and greenhouse gas emission benefits of lightweighting in automobiles: review and harmonization', Environmental Science and Technology 47(12), pp. 6089-6097.
Kim, H. C., et al., 2016, 'Cradle-to-gate emissions from a commercial electric vehicle Li-ion battery: a comparative analysis', Environmental Science and Technology 50(14), pp. 7715-7722.
Klöckner, C. A., et al., 2013, 'Positive and negative spillover effects from electric car purchase to car use', Transportation Research Part D: Transport and Environment 21, pp. 32-38.
References
72 Electric vehicles from life cycle and circular economy perspectives
Kopnina, H. 2017, 'European renewable energy. Applying circular economy thinking to policymaking', Visions for Sustainability, 8, pp. 7-19.
Kushnir, D., 2015, Lithium-ion battery recycling technology 2015. Current state and future prospects (http://publications.lib.chalmers.se/records/fulltext/230991/local_230991.pdf) accessed 4 May 2018.
Langbroek, J. H. M., et al., 2017, 'Electric vehicle users and their travel patterns in Greater Stockholm', Transportation Research Part D: Transport and Environment 52, pp. 98-111.
Larcher, D. and Tarascon, J.-M., 2014, 'Towards greener and more sustainable batteries for electrical energy storage', Nature Chemistry 7, pp. 19-29.
Liu, C. and Wang, Y., 2017, 'Problems and strategies of electric vehicle recycling', Boletín Técnico 55, pp. 569-575.
MacMillan, G. A., et al., 2017, 'Rare earth elements (REE) in freshwater, marine, and terrestrial ecosystems in the eastern Canadian Arctic', Environmental Science: Processes and Impacts 10, pp. 1336-1345.
Majeau-Bettez, G., et al., 2011, 'Life cycle environmental assessment of lithium-ion and nickel metal hydride batteries for plug-in hybrid and battery electric vehicles', Environmental Science and Technology 45, pp. 4548-4554.
Manzetti, S. and Mariasiu, F., 2015, 'Electric vehicle battery technologies: from present state to future systems', Renewable and Sustainable Energy Reviews 51, pp. 1004-1012.
Massari, S. and Ruberti, M., 2013, 'Rare earth elements as critical raw materials: focus on international markets and future strategies', Resources Policy 38, pp. 36-43.
Mathieux, F., et al., 2017, Critical raw materials and the circular economy, European Commission Joint Research Centre, Ispra, Italy.
Mayyas, A., et al., 2017, 'Vehicle's lightweight design vs. electrification from life cycle assessment perspective', Journal of Cleaner Production 167, pp. 687-701.
Moro, A. and Lonza, L., 2017, 'Electricity carbon intensity in European Member States: impacts on GHG emissions of electric vehicles', Transportation Research Part D: Transport and Environment (https://doi.org/10.1016/j.trd.2017.07.012) accessed 15 May 2018.
National Grid, 2017, Future energy scenarios, National Grid PLC, London.
Natkunarajah, N., et al., 2015, 'Scenarios for the return of lithium-ion batteries out of electric cars for recycling', Procedia CIRP 29, pp. 740-745.
Nealer, R. and Hendrickson, T., 2015, 'Review of recent lifecycle assessments of energy and greenhouse gas emissions for electric vehicles', Current Sustainable/Renewable Energy Reports 2, pp. 66-73.
Neubauer, J. and Pesaran, A., 2011, 'The ability of battery second use strategies to impact plug-in electric vehicle prices and serve utility energy storage applications', Journal of Power Sources 196, pp. 10351-10358.
Neubauer, J., et al., 2012, A techno-economic analysis of PEV battery second use: repurposed-battery selling price and commercial and industrial end-user value, SAE International, Warrendale, PA.
NewInnoNet, 2016, Analysis of the end of life vehicle value chain (http://www.newinnonet.eu/downloads/D%202.3_RP_Report%20summarising%20the%20analysis%20of%20the%20End-of-Life%20Vehicle%20chain.pdf) accessed 12 June 2018.
Noori, M., et al., 2016, 'Light-duty electric vehicles to improve the integrity of the electricity grid through Vehicle-to-Grid technology: Analysis of regional net revenue and emissions savings', Applied Energy 168, pp. 146-158.
Nordelöf, A., et al., 2014, 'Environmental impacts of hybrid, plug-in hybrid, and battery electric vehicles — what can we learn from life cycle assessment?', International Journal of Life Cycle Assessment 19, pp. 1866-1890.
Öko-Institut and Transport & Mobility Leuven, 2016, Electric mobility in Europe — future impact on the emissions and the energy systems, Öko-Institut e.V. (https://www.oeko.de/fileadmin/oekodoc/Assessing-the-status-of-electrification-of-the-road-transport-passenger-vehicles.pdf) accessed 24 June 2018.
Öko-Institut, 2018, Ensuring a sustainable supply of raw materials for electric vehicles: a synthesis paper on raw material needs for batteries and fuel cells, Öko-Institut, Berlin.
Pathan, A., et al., 2013, Tracking environmental impacts in global product chains — rare earth metals and other
References
73 Electric vehicles from life cycle and circular economy perspectives
critical metals used in the cleantech industry, Nordic Council of Ministers, Copenhagen.
Pavel, C., et al., 2016, Substitution of critical raw materials in low-carbon technologies: lighting, wind turbines and electric vehicles, European Commission.
Preston, F., 2012, A global redesign? Shaping the circular economy, Chatham House (https://www.chathamhouse.org/publications/papers/view/182376) accessed 24 May 2018.
Ramoni, M. O. and Zhang, H-C., 2013, 'End-of-life (EOL) issues and options for electric vehicle batteries', Clean Technologies and Environmental Policy 15, pp. 881-891.
Rangaraju, S., et al., 2015, 'Impacts of electricity mix, charging profile, and driving behavior on the emissions performance of battery electric vehicles: a Belgian case study', Applied Energy 148, pp. 496-505.
Rauh N., et al., 2015, 'Understanding the impact of electric vehicle driving experience on range anxiety', Human Factors 57(1), pp. 177-187.
RECHARGE, 2013, E-mobility roadmap for the EU battery industry, RECHARGE aisbl, Brussels.
Reinhardt, R., et al., 2017, Macro environmental analysis of the electric vehicle battery second use market, Institute of Electrical and Electronics Engineers, Dresden.
Renault, 2017, Electric vehicle charging on highways with second-life batteries (https://media.group.renault.com/global/en-gb/groupe-renault/media/pressreleases/21194120/les-vehicules-electriques-pourront-se-recharger-sur-lautoroute-grace-aux-batteries-seconde-vie) accessed 4 April 2018.
Reuter, M., et al., 2013, Metal recycling: opportunities, limits, infrastructure. A report of the Working Group on the Global Metal Flows to the International Resource Panel, United Nations Environment Programme, Nairobi.
Riba, J., et al., 2016, 'Rare-earth-free propulsion motors for electric vehicles: a technology review', Renewable and Sustainable Energy Reviews 57, pp. 367-379.
Ricardo-AEA, 2015, Improvements to the definition of lifetime mileage of light duty vehicles, Report to the European Commission (DG CLIMA) (https://ec.europa.eu/clima/sites/clima/files/transport/vehicles/docs/ldv_mileage_improvement_en.pdf).
Richa, K., et al., 2017, 'Eco-efficiency analysis of a lithium-ion battery waste hierarchy inspired by circular economy', Journal of Industrial Ecology 21, pp. 715-730.
Rim, K., et al., 2013, 'Toxicological evaluations of rare earths and their health impacts to workers: a literature review', Safety and Health at Work 4, pp. 12-26.
Rim, K., 2016, 'Effects of rare Earth elements on the environment and human health: a literature review', Toxicology and Environmental Health Sciences 8, pp. 189-200.
RIVM, 2010, Effect of electric cars on traffic noise and safety, National Institute for Public Health and the Environment (Netherlands) (https://www.rivm.nl/en/Documents_and_publications/Scientific/Reports/2010/maart/Effect_of_electric_cars_on_traffic_noise_and_safety).
Romare, M. and Dahllöf, L., 2017, The life cycle energy consumption and greenhouse gas emissions from lithium-ion batteries, IVL Swedish Environmental Research Institute, Stockholm.
Rowson, N., 2017, Processing options and future possibilities for sustainable recycling of hybrid electric vehicles and internal combustion engine vehicles at vehicle recycling sites, EREAN/DEMETER Policy Brief (https://etn-demeter.eu/wp-content/uploads/2017/05/DEMETER-EREAN-Policy-Brief.pdf) accessed 4 April 2018.
Sakai, S.-I., et al., 2014, 'An international comparative study of end-of-life vehicle (ELV) recycling systems'. Journal of Material Cycles Waste Management 16, pp. 1-20.
Sala, S., et al., 2016, Life cycle assessment for the impact assessment of policies. Life thinking and assessment in the European policies and for evaluating policy options. JRC Technical Reports (https://ec.europa.eu/jrc/en/publication/life-cycle-assessment-impact-assessment-policies) accessed 24 May 2018.
Sala S., et al., 2017, Global normalisation factors for the environment footprint and life cycle assessment, JRC Technical Papers, European Commission Joint Research Centre, Ispra, Italy.
Sanderson, H., 2017, 'Rare earths make electric comeback after bust' (https://www.ft.com/content/44acde0a-81a2-11e7-a4ce-15b2513cb3ff) accessed 24 May 2018.
Szczechowicz, E., et al., 2012, 'Regional assessment of local emissions of EV using traffic simulations for a use case in Germany', International Journal of Life Cycle Assessment 17(9), pp. 1131-1141.
Skinner, I., et al., 2010, Towards the decarbonisation of EU's transport sector by 2050. Final report of the EU
References
74 Electric vehicles from life cycle and circular economy perspectives
Routes to 2050 project for the European Commission (DG CLIMA) (http://eutransportghg2050.eu/cms/eu-transport-ghg-routes-to-2050-project-reports/) accessed 24 May 2018.
Soret, A., et al., 2014, 'The potential impacts of electric vehicles on air quality in the urban areas of Barcelona and Madrid (Spain)', Atmospheric Environment 99, pp. 51-63.
Speirs, J., et al., 2014, 'The future of lithium availability for electric vehicle batteries', Renewable and Sustainable Energy Reviews 35, pp. 183-193.
Sprei, F. and Ginnebaugh, D., 2018, 'Unbundling cars to daily use and infrequent use vehicles — the potential role of car sharing', Energy Efficiency (https://doi.org/10.1007/s12053-018-9636-6).
Tagliaferri, C., et al., 2016, 'Life cycle assessment of future electric and hybrid vehicles: a cradle-to-grave systems engineering approach', Chemical Engineering Research and Design 112, pp. 298-309.
Timmers, V. R. J. H. and Achten, P., 2016, 'Non-exhaust PM emissions from electric vehicles', Atmospheric Environment 134, pp. 10-17.
Transport and Environment, 2017a, Electric vehicle life cycle analysis and raw material availability (https://www.transportenvironment.org/sites/te/files/publications/2017_10_EV_LCA_briefing_final.pdf) accessed 22 June 2018.
Transport and Environment, 2017b, Does car sharing really reduce car use?, Briefing Note (https://www.transportenvironment.org/publications/does-sharing-cars-really-reduce-car-use).
Tsamis, A. and Coyne, M., 2015, Recovery of rare earths from electronic wastes: an opportunity for high-tech SMEs, Report on a study for the ITRE committee IP/A/ITRE/2014-09, European Parliament.
UBA-DE, 2013, Kurzfristig Kaum Lärmminderung Durch Elektroautos, Umweltbundesamt (https://www.umweltbundesamt.de/dokument/kurzfristig-kaum-laermminderung-durch-elektroautos).
UBA-DE, 2016, Weiterentwicklung Und Vertiefte Analyse Der Umweltbilanz von Elektrofahrzeugen, Umweltbundesamt (https://www.umweltbundesamt.de/publikationen/weiterentwicklung-vertiefte-analyse-der).
US EPA, 2013, Application of life-cycle assessment to nanoscale technology: lithium-ion batteries for electric vehicles, United States Environmental Protection Agency, Washington, DC.
Van Mierlo, J., et al., 2017, 'Comparative environmental assessment of alternative fueled vehicles using a life cycle assessment', Transportation Research Procedia 25, pp. 3435-3445.
Viswanathan, V. V. and Kintner-Meyer, M., 2011, 'Second use of transportation batteries: maximising the value of batteries for transportation and grid services', IEEE Transactions on Vehicular Technology 60, pp. 2963-2970.
Widmer, J., et al., 2015, 'Electric vehicle traction motors without rare earth magnets', Sustainable Materials and Technologies 3, pp. 7-13.
WHO, 2017, Recycling used lead-acid batteries: health considerations, World Health Organization, Geneva.
Williams, B. D. and Lipman, T. E., 2010, 'Strategy for overcoming cost hurdles of plug-in-hybrid battery in California', Transportation Research Record: Journal of the Transportation Research Board 2191, pp. 59-66.
WPD, 2017, Electric nation: vehicle to grid, Western Power Distribution, Bristol, United Kingdom.
Wu, Y. and Zhang, L., 2017, 'Can the development of electric vehicles reduce the emission of air pollutants and greenhouse gases in developing countries?', Transportation Research Part D: Transport and Environment 51, pp. 129-145.
Yang, Y., et al., 2017, 'REE recovery from end of life NdFeB permanent magnet scrap: a critical review', Journal of Sustainable Metallurgy 3, pp. 122-149.
Zeng, X., et al., 2014, 'Recycling of spent lithium-ion battery: a critical review', Critical Reviews in Environmental Science and Technology 44, pp. 1129-1165.

European Environment Agency
Electric vehicles from life cycle and circular economy perspectives TERM 2018: Transport and Environment Reporting Mechanism (TERM) report
2018 — 74 pp. — 21 x 29.7 cm
ISBN 978-92-9213-985-8doi:10.2800/77428
HOW TO OBTAIN EU PUBLICATIONS
Free publications:
• one copy: via EU Bookshop (http://bookshop.europa.eu);
• more than one copy or posters/maps: from the European Union's representations (http://ec.europa.eu/represent_en.htm); from the delegations in non-EU countries (http://eeas.europa.eu/delegations/index_en.htm); by contacting the Europe Direct service (http://europa.eu/europedirect/index_en.htm) or calling 00 800 6 7 8 9 10 11 (freephone number from anywhere in the EU) (*).
(*) The information given is free, as are most calls (though some operators, phone boxes or hotels may charge you).
Priced publications:
• via EU Bookshop (http://bookshop.europa.eu).


TH-AL-18-012-EN
-Ndoi:10.2800/77428
European Environment AgencyKongens Nytorv 61050 Copenhagen KDenmark
Tel.: +45 33 36 71 00Web: eea.europa.euEnquiries: eea.europa.eu/enquiries


![FOR RENT Economy Circular Economy Infographic.pdf · the framework of a circular economy."[5] Global Partners Many major companies are embracing the circular economy shift by partnering](https://img.pdfslide.net/doc/110x75/6013459c7f9b4e43ae74bad4/for-rent-economy-circular-economy-the-framework-of-a-circular-economy5.jpg)