Embed Size (px)
Citation preview

Electrical and Mechanical Characterizationof BladeRunner™ Tips on Reflowed
Eutectic Bumps
Dr. Rod MartensSr. Principal Engineer
FormFactor, Inc.
Scott MitchellProgram Manager
Strategic Probe Development TeamTexas Instruments, Inc.
Southwest Test Workshop June 9, 2002
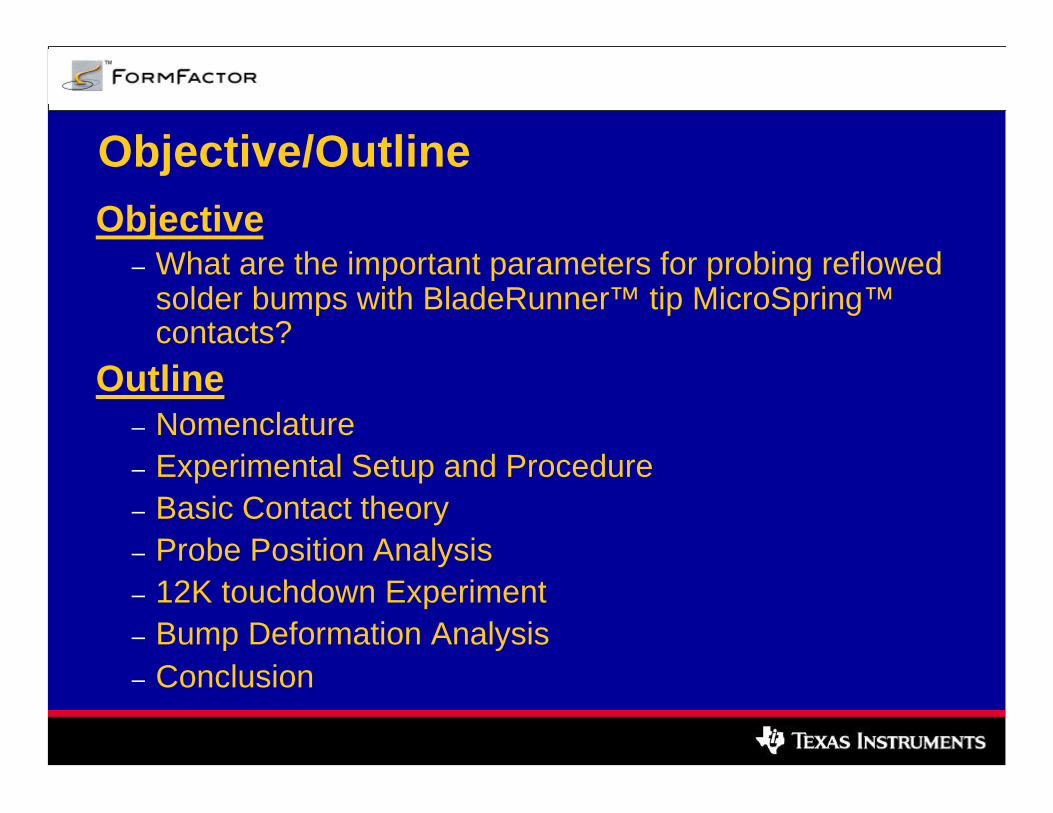
Objective/OutlineObjective
– What are the important parameters for probing reflowedsolder bumps with BladeRunner™ tip MicroSpring™contacts?
Outline– Nomenclature– Experimental Setup and Procedure– Basic Contact theory– Probe Position Analysis– 12K touchdown Experiment– Bump Deformation Analysis– Conclusion

NomenclatureBlade
HeelToe Apex of bumpSpring
Scrub
ReflowedSolderBump

Experimental Setup - Single SpringProbing Schematic
Force/ DisplacementFixture
Test Spring
Test Wafer
Micro-ohmmeter(4-wire)
Data Acquisition
Force,Displacement
Resistance

Experimental SetupF/δ fixture
Data AcquisitionSystem
Micro-ohmmeter
BladeRunner™ tip MicroSpring™ contact
Test Wafer
Au Check plate

Experimental Procedure§ Resistance
– Keithley 580 Micro-ohmmeter– 100µΩ resolution– Dry circuit conditions (20mV/100mA max)
§ Force– 0.2g resolution
§ Displacement– 0.001 mil resolution in Z
§ Single spring probing performed in displacementcontrol (2 mil overdrive past first touch)§ No cleaning operations performed
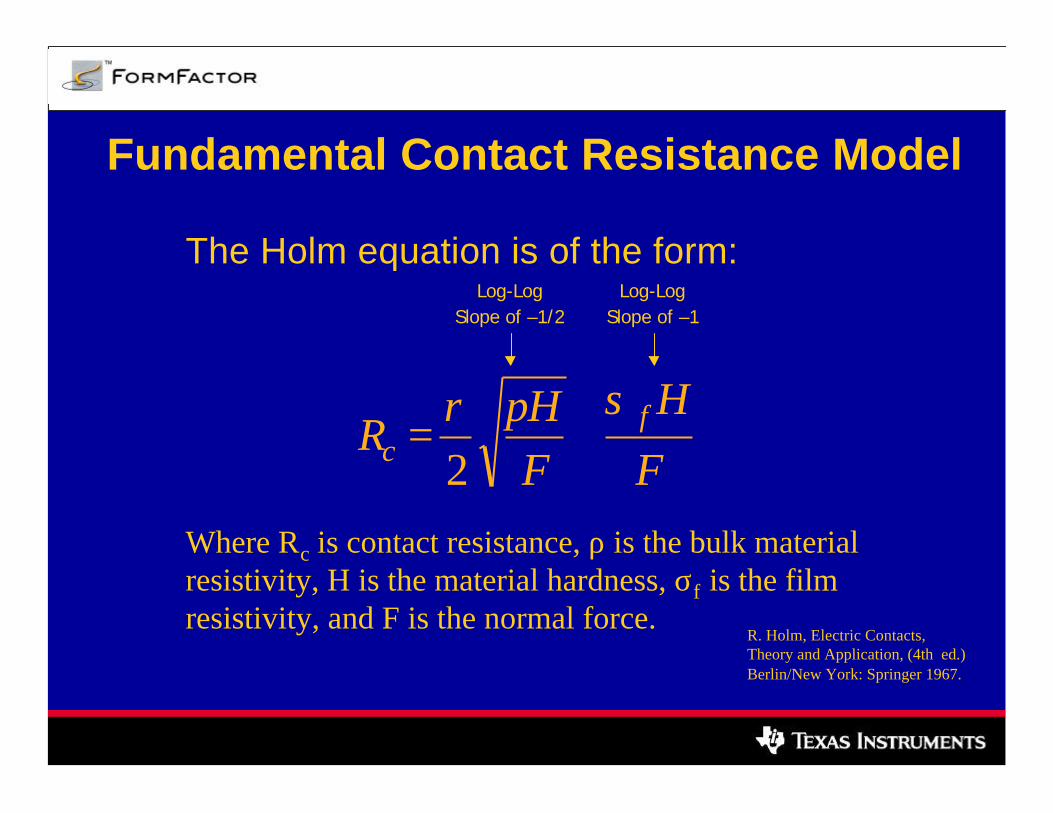
Fundamental Contact Resistance Model
The Holm equation is of the form:
F
H
FH
R fc
σπρ+=
2Where Rc is contact resistance, ρ is the bulk materialresistivity, H is the material hardness, σf is the film resistivity, and F is the normal force.
R. Holm, Electric Contacts,Theory and Application, (4th ed.)Berlin/New York: Springer 1967.
Log-LogSlope of –1/2
Log-LogSlope of –1

Force vs. Resistance – Film Free Case
§ Data shown for cleangold contacting cleangold
§ Log-Log slope ~-1/2,indicates metalliccontact from first termof Holm equation
§ Film resistancenegligible
ρ =11.5 e-8 Ωmσf = 8.6 e-13 Ωm2
H = 5 e10 g/m2
Holm Model
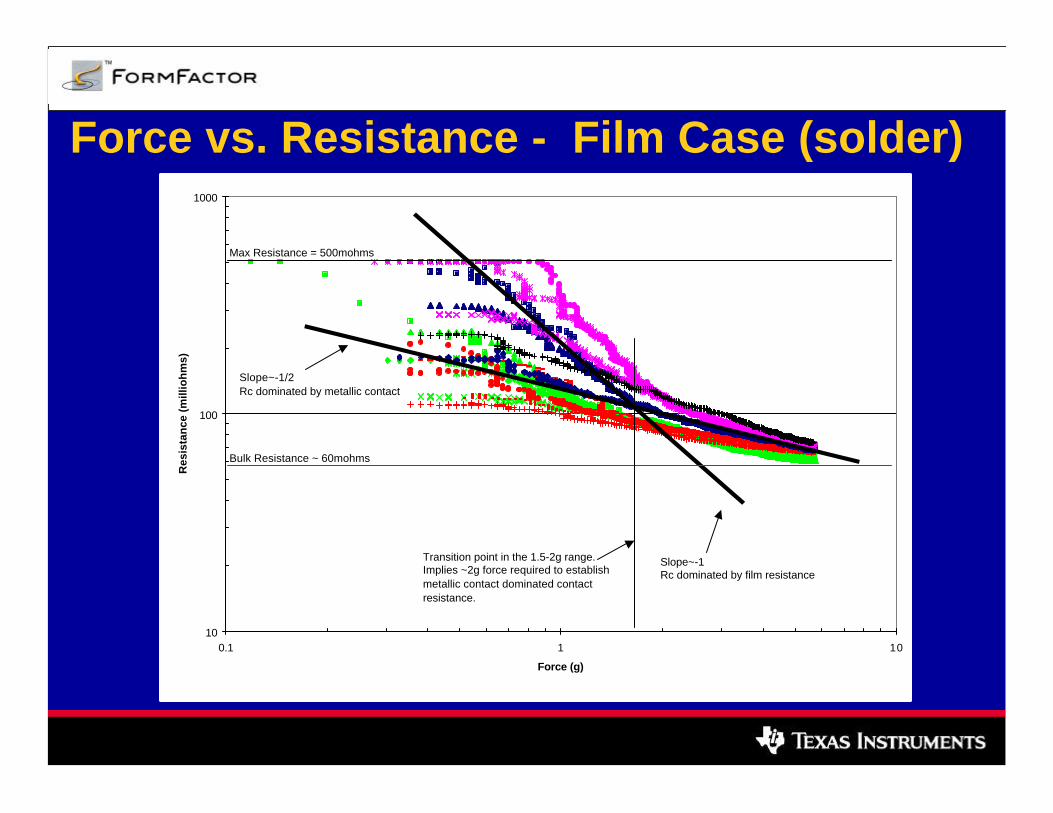
Force vs. Resistance - Film Case (solder)
10
100
1000
0.1 1 10
Force (g)
Res
ista
nce
(m
illio
hm
s)
Max Resistance = 500mohms
Slope~-1Rc dominated by film resistance
Bulk Resistance ~ 60mohms
Slope~-1/2Rc dominated by metallic contact
Transition point in the 1.5-2g range.Implies ~2g force required to establishmetallic contact dominated contactresistance.

Scrub Position Analysis
§ Same spring usedfor both bumps.
§ Same overtravelused for bothbumps. (2 mils)
§ Top touchdown wasbefore the apex ofthe bump.
§ Bottom touchdownwas after the apexof the bump.
Optical SEM

Case 1. First Touch Prior to Bump Apex§ Wiping action was
limited§ Forces in 10-12g
range§ Steep slope
indicates contact isin film dominatedregime (2nd term ofHolm equation)
Data from ~900 touchdowns.

Case 2. First Touch After Bump Apex§ Wiping action
maximized§ Forces in 1-3g range§ Slope transition
indicates shift from filmto metallic dominatedcontact (2nd to 1st termof Holm equation)
Data from ~900 touchdowns.

Case Comparison§ Same MicroSpring™
contact§ Same overdrive (2 mil
past first touch)§ Difference is scrub
– Accelerates transitionto metallic contact
– Allows stable Cres atlower forces

Scrub Position SummaryFor the same overtravel,
– First touch prior to apex:§ Higher force§ Less wipe§ More volume displacement§ Cres decrease by
increasing amount of filmarea in contact
– First touch after apex:§ Lower force§ More wipe§ Less volume displacement§ Cres decrease by cutting
through films to makemetallic contact

Optimal “Targeting” for First TouchScrub Direction
Contact in thisarea (past theapex) is optimal

Probed Bumps

Load/Cres over 12,000 Touchdowns

Tip Before/After 12K Touchdowns
No cleaning performed.
Accumulated Solder

Bump Deformation§ Diameter of bumps measured before and after
probing– August NSX-95 bump inspection tool.
§ Change in diameter of bump was less thanresolution of the measurement tool productionsettings– 2.5µm/pixel

Conclusions§ An experimental setup has been designed to quickly
evaluate new spring/wafer interactions§ Optimal probe placement has been defined as targeting
first MicrospringTM contact past the apex of the reflowedbump
– Minimizes force, resistance, and displaced volume– Maximizes scrub
§ Proper targeting in conjunction with wiping on the reflowedbump produces lower contact resistance and reducesprobe force§ 12K touchdowns were performed
– Measured increase in bump diameter was less than the resolution ofthe measurement tool
– Monitored Cres did not increase beyond experimental error

Acknowledgements
FormFactorSusan Fan - Senior EngineerTim Cooper – C4 Program ManagerCarl Reynolds - Vice President, New Product Development
Texas InstrumentsGonzalo Amador – Senior Member Technical StaffSabrena Ferguson - Process Engineering Technician