Embed Size (px)
Citation preview

1
Paper Number 2004-01-1565
Electrical Arcing and Material Ignition Levels
Jerome K. Hastings, P.E. Joseph C. Zuercher, Ph.D.
Engelbert Hetzmannseder Ph.D. EATON Corp., Innovation Center
4201 N. 27th Street, Milwaukee, WI 53216, USA Copyright © 2004 SAE International
ABSTRACT
Experimental data and analysis show the relationship between arcing watts, the time of the arc exposure and the degree to which common polymers experience damage. Arcing test apparatus for 125V DC and 48 volt DC are shown. Arc gap control allows 125-volts to mimic arcs in lower voltage systems. Arcing current waveforms depict the chaotic behavior of arcs and differences due to anode / cathode materials. Levels of degradation are defined and used for “Constant Damage Contours” for Vinyl, Carpeting and Sound insulation. The polymers were exposed to conditions of constant arcing watts for increasing times. Connecting the points of “first flame” establishes a “contour of constant damage”. The data indicates that a “3 second flame free” limit is between 50 and 100 watts. 4000 watts of arcing takes 1/4 to ½ second to cause burning. The influence of circuit resistance on the maximum arc power transfer is presented.
INTRODUCTION
Electrical arcing produces local temperatures in excess of 6000 deg C and causes splattering of molten materials with ejection of bits of metal near melt temperatures. Nearby polymers can ignite, melt and drip onto other combustible material in the vicinity. It is therefore reasonable to theorize that limiting the energy delivered during arcing will reduce the likelihood of igniting the surrounding materials. In order to prove or disprove the theory, several types of material would have to be exposed to an increasing amount of energy whilst observing the degree to which the material is degraded.
A hypothesis that would describe the point at which material will ignite from exposure to arcing would have to include the thermal contribution of the plasma, splattering of molten metal and the ejection of hot metal particles. Hypothetically, these three factors could be encompassed using the total energy contribution to the arcing event.
The empirical data shows the relationship between the arc watts, the time of exposure, the material type and the level of degradation. The approach was first suggested at the 2001 42V Automotive System Intertech Conference in Chicago [1] and described in greater detail in the 2002 Conference [2].
Data presented in this paper addresses several materials, with arc exposure levels from 1000 watts to 5000 watts, and times up to 6 seconds. Constant damage contour lines are drawn on the graphical representation of the test data, showing melt points, flame points and the continuous burn points. A continuous burning state is defined as a flame for more than 3 seconds. The 3-second rule was adopted from material standards [3].
The objective of the work was to confirm the hypothesis stated in ref [1] and [2] and empirically demonstrate the relationship between arc watts, time and level of degradation.
Results: The “constant damage contour lines” confirm the hypothesis and the utility of the rating level assignments. Arc exposure times can be predicted for the 5 levels. The work cannot be extended to other polymers without confirmation tests. Additional information is included regarding waveforms for different electrode materials, confirmation of test methods using 125V DC supplies, and concurrence between the knife blade apparatus and the opposing electrode apparatus.
COMMON POLYMER TYPES AND TYPICAL USES IN VEHICLES
Plastics are polymers that can be classified into 4 major groups. See table T1. Polymers used in vehicles commonly come from Group No.1 (carpets and housings, Group No. 3 (connectors, panels, and molded parts), Group No. 4 (elastic, rubber like, materials). The characteristics that give a polymer robustness against arcing are heavy chains, cross-linked with flame-retardants, low volatile out-gassing. Light chains
producing volatiles from disassociated molecules are expected to be the least robust.
TABLE T1 Common Polymer types and typical uses [ 4 ] 1. Multipurpose Polymers
Typical Use
Polyethylene terephthalates
Carpets and fibers
Polyvinyl Chlorides PVC
Cables, Tubes, structures, housings
Ethylene acrylics and methacrylics
Sheet packaging
Ethylene vinyl acetates
Tough clear films
Polytetrafluoroethylene
Non stick coatings
Ethylene Styrene
Copolymers are flexible
2. Polyolefins
Polyethylenes
Films, vacuum molded parts
Polypropylenes
Carpets fibers, engineered parts
Ethylene vinyl copolymers
Food containers
3. Styrenics - Engineering Plastics Polystyrenes and ABS
Auto parts Molded / extruded,
insulation Polycarbonates
Instrument panels, under hood
components Nylons
Elec connectors, U-hood
parts, cabin parts Poly-methyl methacrylate
(acrylate) Instrument panels, bezels
Acetal Polyoxymethylene(Formaldehyde)
Size stable parts and solvent resistant
4. Elastomers Polyorganosiloxanes
Silicones Gaskets/seals/flexible
membranes Chlorinated Polyethylenes Auto hoses and under hood
parts Polyolefin elastomers
Wide use, low load
elastomers. Polyurethane + cross-linked Auto cables connectors
fascias fittings Ethylene propylene Dien
Terpolymers Formed cross-linked
jacketing, hoses .
2
ARC INFORMATION BACKGROUND [5]
ELECTRODE MATERIALS, CONTAMINANTS AND GAP INFLUENCE ARC PROPERTIES - Electrode material characteristics determine the minimum voltage at which arcing can be stable, the minimum arcing current, and the amount of molten material ejected. Variations in the parameters set the level of chaotic arc behavior. Arcing metals have evaporation temperatures from 2000C to 6000 C, minimum arc voltages from 13 to 30 V and minimum arc currents from 30 milliamps to 1 amp. Chaotic behavior is further stimulated by the violent thermal environment of the “plasma-jet” that develops on the surface of the electrodes.
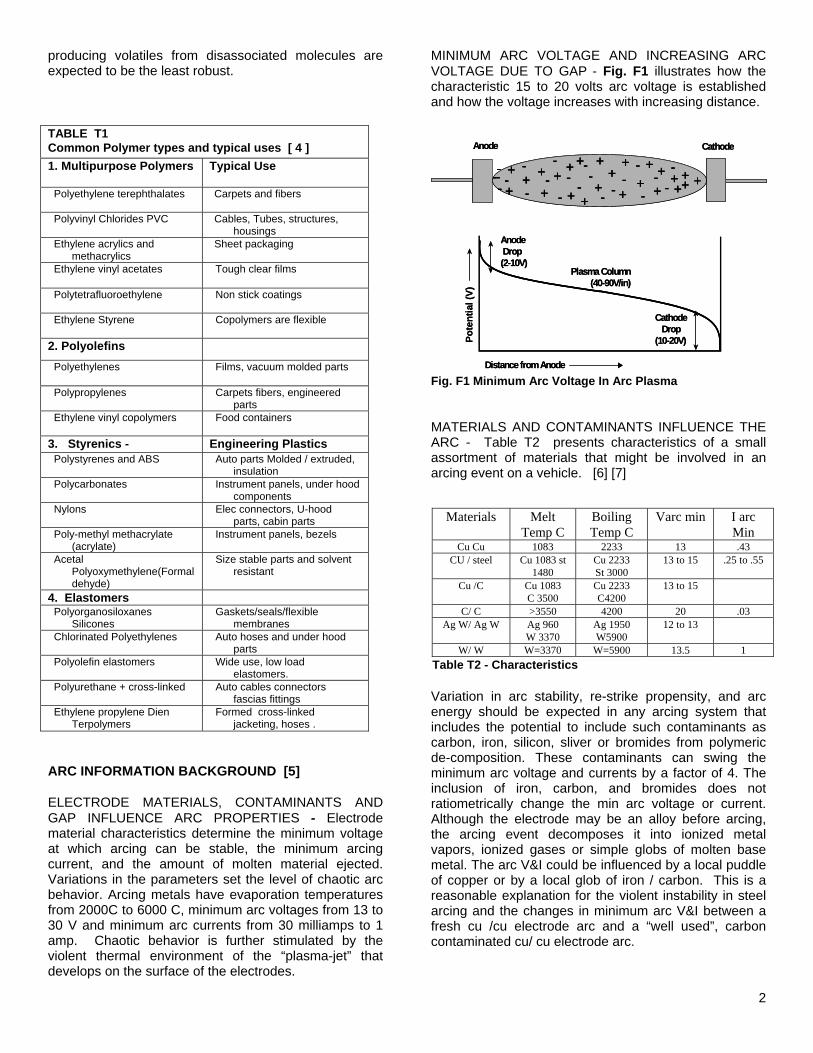
MINIMUM ARC VOLTAGE AND INCREASING ARC VOLTAGE DUE TO GAP - Fig. F1 illustrates how the characteristic 15 to 20 volts arc voltage is established and how the voltage increases with increasing distance.
Distance from Anode
AnodeDrop(2-10V)
Pote
ntia
l (V)
Plasma Column(40-90V/in)
CathodeDrop
(10-20V)
CathodeAnode
- ++---
-- ++
+++
+++
+++
+
++
---
-
- --
--
--
- ++
++ +
+-
--
-++
-
Distance from Anode
AnodeDrop(2-10V)
Pote
ntia
l (V)
Plasma Column(40-90V/in)
CathodeDrop
(10-20V)
CathodeAnode
- ++---
-- ++
+++
+++
+++
+
++
---
-
- --
--
--
- ++
++ +
+-
--
-++
-- ++---
-- ++
+++
+++
+++
+
++
---
-
- --
--
--
- ++
++ +
+-
--
-++
+---
-- ++
+++
+++
+++
+
++
---
-
- --
--
--
- ++
++ +
+-
--
-++
-
Fig. F1 Minimum Arc Voltage In Arc Plasma
MATERIALS AND CONTAMINANTS INFLUENCE THE ARC - Table T2 presents characteristics of a small assortment of materials that might be involved in an arcing event on a vehicle. [6] [7]
Materials Melt Temp C
Boiling Temp C
Varc min I arc Min
Cu Cu 1083 2233 13 .43 CU / steel Cu 1083 st
1480 Cu 2233 St 3000
13 to 15 .25 to .55
Cu /C Cu 1083 C 3500
Cu 2233 C4200
13 to 15
C/ C >3550 4200 20 .03 Ag W/ Ag W Ag 960
W 3370 Ag 1950 W5900
12 to 13
W/ W W=3370 W=5900 13.5 1 Table T2 - Characteristics
Variation in arc stability, re-strike propensity, and arc energy should be expected in any arcing system that includes the potential to include such contaminants as carbon, iron, silicon, sliver or bromides from polymeric de-composition. These contaminants can swing the minimum arc voltage and currents by a factor of 4. The inclusion of iron, carbon, and bromides does not ratiometrically change the min arc voltage or current. Although the electrode may be an alloy before arcing, the arcing event decomposes it into ionized metal vapors, ionized gases or simple globs of molten base metal. The arc V&I could be influenced by a local puddle of copper or by a local glob of iron / carbon. This is a reasonable explanation for the violent instability in steel arcing and the changes in minimum arc V&I between a fresh cu /cu electrode arc and a “well used”, carbon contaminated cu/ cu electrode arc.

ARC VOLTAGE DEPENDS ON CURRENT, GAP AND ELECTRODE MATERIALS - Fig. F2 shows the relationship for copper. It predicts a decrease in the minimum arc voltage for stable arcing as current increases. It predicts an increase in arc voltage, as gap increases. And because the arc voltage limits the current, the current should be inversely related to arc voltage. Trace TR1 confirms the relationship. Appendix A provides a graph with the engineering numbers to the gap/current/voltage relationship. [5]
Figure F2 – Electrical Load Parameters Associated with Stable Arcing
TRACE TR1 Relationship Between Arc Current And Arc Voltage As Arc Gap Increases.
Test Apparatus
PHOTO P1 125 V Dc Knife Blade Apparatus - The knife blade draws the arc adjacent to the exposed material. Gaps are controlled to achieve arc voltages from 20 to 35 VDC
PHOTO P2 48 VDC Air Operated Apparatus - The air cylinder open and closes the cylindrical electrodes. Gap is controlled to achieve arc voltages from 20 to 35 VDC. Typical gaps are .090 inches. Time to open is typically 20 msec
BANDS OF PERFORMANCE DUE TO CHAOTIC ARC BEHAVIOR - The duration, stability and location of arcing can be generalized, but the arcing event is chaotic and as such, a statistical distribution of arc behavior should be expected. Ignition events for materials will also have a statistical spread due to compounding of different polymers or blending of recycled plastics (as in packing or insulating materials). These realities would lead an observer to expect “bands” of ignition response rather than precisely repeatable points of ignition. Bands of ignition levels were observed and are reported.
Alloys and dissimilar metals tend to be more chaotic than homogeneous electrodes. (See Trace TR 2.) Steel produces more splatter than copper. Stranded cable produces more splatter than wrought copper bars. Evidence of this increased activity shows up in the
3
following V-I traces. Data is taken at 48VDC using the air cylinder apparatus.
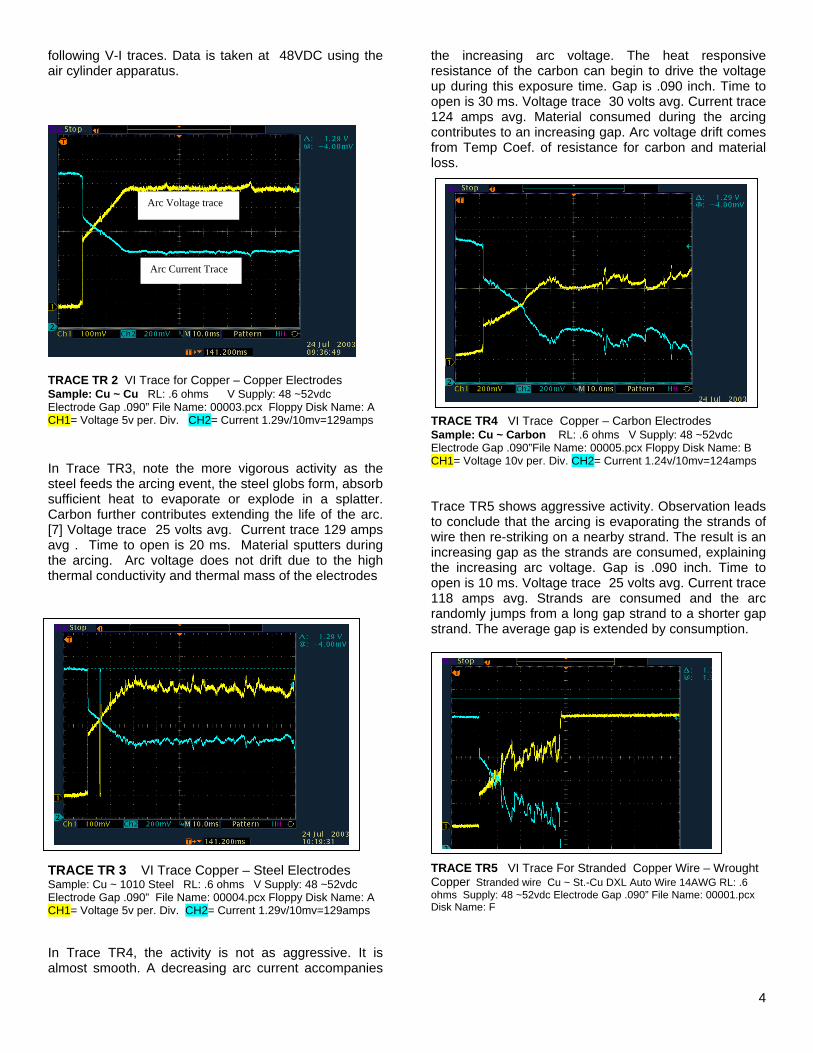
TRACE TR 2 VI Trace for Copper – Copper Electrodes Sample: Cu ~ Cu RL: .6 ohms V Supply: 48 ~52vdc Electrode Gap .090” File Name: 00003.pcx Floppy Disk Name: A CH1= Voltage 5v per. Div. CH2= Current 1.29v/10mv=129amps In Trace TR3, note the more vigorous activity as the steel feeds the arcing event, the steel globs form, absorb sufficient heat to evaporate or explode in a splatter. Carbon further contributes extending the life of the arc. [7] Voltage trace 25 volts avg. Current trace 129 amps avg . Time to open is 20 ms. Material sputters during the arcing. Arc voltage does not drift due to the high thermal conductivity and thermal mass of the electrodes
the increasing arc voltage. The heat responsive resistance of the carbon can begin to drive the voltage up during this exposure time. Gap is .090 inch. Time to open is 30 ms. Voltage trace 30 volts avg. Current trace 124 amps avg. Material consumed during the arcing contributes to an increasing gap. Arc voltage drift comes from Temp Coef. of resistance for carbon and material loss.
Arc Voltage trace
Arc Current Trace
TRACE TR4 VI Trace Copper – Carbon Electrodes Sample: Cu ~ Carbon RL: .6 ohms V Supply: 48 ~52vdc Electrode Gap .090”File Name: 00005.pcx Floppy Disk Name: B CH1= Voltage 10v per. Div. CH2= Current 1.24v/10mv=124amps
Trace TR5 shows aggressive activity. Observation leads to conclude that the arcing is evaporating the strands of wire then re-striking on a nearby strand. The result is an increasing gap as the strands are consumed, explaining the increasing arc voltage. Gap is .090 inch. Time to open is 10 ms. Voltage trace 25 volts avg. Current trace 118 amps avg. Strands are consumed and the arc randomly jumps from a long gap strand to a shorter gap strand. The average gap is extended by consumption.
TRACE TR 3 VI Trace Copper – Steel Electrodes Sample: Cu ~ 1010 Steel RL: .6 ohms V Supply: 48 ~52vdc Electrode Gap .090” File Name: 00004.pcx Floppy Disk Name: A CH1= Voltage 5v per. Div. CH2= Current 1.29v/10mv=129amps In Trace TR4, the activity is not as aggressive. It is almost smooth. A decreasing arc current accompanies
TCoD
4
RACE TR5 VI Trace For Stranded Copper Wire – Wrought opper Stranded wire Cu ~ St.-Cu DXL Auto Wire 14AWG RL: .6 hms Supply: 48 ~52vdc Electrode Gap .090” File Name: 00001.pcx isk Name: F

DEFINING LEVELS OF ARCING-INDUCED DEGRADATION
This work is limited to the evaluation of common construction materials used in vehicles. It does not apply to the ignition of fuels or accelerants. The definition presented is intended to accommodate variability in materials and additives, and to be general enough to apply to other material testing. The materials were selected to achieve a cross section bracketed by highly variable composition mats, to homogeneous vinyls and styrenes, and may include various levels of self-extinguishing additives (typically bromides). The proposed scale has 5 ranks, from no-damage to rapid combustion. Rapid combustion was not achieved. All lower levels were observed. Table T3 presents the levels.
Numeric Code
Abbreviation Description
0 ND No Damage 1 C Carbonization 2 M Melting of Material 3 F Flame/Flash – Self Extinguishing 4 CB Continuous Burn > 3 sec after arc
is extinguished. 5 RC Rapid Combustion
5
TABLE T3 - Coded Levels Of Thermal Degradation For simplification three of the five levels were chosen to represent generalized “constant damage contour lines”. Melting, Flame and Continuous Burn bracket the ignition levels adequately. These have been used to characterize the results in graphical exhibits.
Constant damage contour levels selected:
No. 2 M Melting presents no risk of fire.
No. 3 F Flame is the first level of fire safety concern, but does not propagate
No. 4 CB is a fire safety concern. It continues for more than 3 seconds and could propagate.
A QUANTITATIVE MEASUREMENT OF AN ARC FAULT FIRE HAZARD
To test the theory, experiments exposed common polymers to arcs at constant arc watts, for increasing times of exposure whilst observing the point in time when melting begins, a first flame is present, and burning continues for more than 3 seconds (after the arc is removed). These parameters are believed to define arc robustness of polymers. The no damage level and carbonization level were also noted and reported.
Initial testing was performed at low currents and proved to be a good predictor of higher power results. 48 Volt DC testing confirmed results observed at 125V DC. The low current tests indicated good robustness for cross-linked PVC (cable insulation) at currents of 7 amps,
exposure time of 5 to 10 seconds, 210 watts, energy levels between 1000J and 2000J. Material carbonized and degraded but did not reach the flame state. Similar results were observed on Polyolefin carpeting. Using the same test method, observations of Cyclohexane dimethanol (light chain interior bezel material) concluded that it was less robust. It exhibited carbonization, decomposition and flames for more than 3 seconds.
The following are photos of the arcing and post-arcing observations.
Notice that the light chain Cycoloy produces a flame and was recorded as “F”.
The Heavy chain cross-linked and bromide loaded cable insulation melted and was recorded as “M”.

CONSTANT DAMAGE CONTOURS FROM ARC TESTING MATERIALS
Sound mat material, Vinyl and Carpeting were selected for a full investigation and graphical analysis. A 125 Volt DC supply was used with a resistor bank to set currents. The Arc voltages were between 20 and 50 VDC depending on gap. 125VDC was selected for the convenience of the setup. 48 VDC runs were made later and confirmed the correctness of the 125DVC results.
The sound mat is a composition of many recycled polymers and some natural fibers. (See Fig. F3.) This would explain the widest variance in flame points. However, the shape of the flame curve can be inferred and drawn in as shown by the contour lines. Green M = Melting threshold, Yellow F = First Flame threshold, Red CB = Continuous Burn Threshold. The material reached the CB level after exposure to 800 Joules of arc energy, 800 watts for 1 sec.
FIG. F3 Constant Damage Data For Sound Mat
The vinyl material (Fig. F4) is uniform in composition but it is layered. The layering would explain the observed improved robustness of up to 4 to 6 seconds. It was observed that the backing on materials was less robust than the facing. The shape of the flame curve can be inferred and drawn in as shown by the contour lines. Green M = Melting threshold, Yellow F = First Flame threshold, Red CB = Continuous Burn Threshold. The material reached the CB level after exposure to 1750 Joules of arc energy, 390 Watts for 4 ½ seconds
FIG. F4 Constant Damage Data for Vinyl
The carpet material with Elastomer backing (Fig. F5) is uniform in composition but it has 3 layers. It was observed that the backing on materials was less robust than the facing. Typically, carpeting is treated with bromides to provide a self-extinguish character. The shape of the flame curve can be inferred and drawn in as shown by the contour lines. Green M = Melting threshold, Yellow F = First Flame threshold, Red CB = Continuous Burn Threshold. This material reached the CB state only after exposure to 1,000 Joules of arc energy, 4 k watts for ¼ second.
FIG. F5 Constant Damage Data for Carpeting
6

DISCUSSION
A. The joules and time to reach the first flame point can be plotted. The data for carpeting is shown in Fig. F5. This is a generalized “ Constant Damage Contour Line”. Plotting watts and time to reach the first flame point for carpeting is shown in Fig. F6
Observational Joules vs. time to f irst f lame - Carpet
0
500
1000
1500
2000
0 1 2 3 4 5 6Seconds
Joul
es
FIG. F5 Observational Joules vs. Time to First Flame
Observational Watts Vs time to First Flame - Carpet
0
2000
4000
6000
0 2 4 6
Seconds
Wat
ts
FIG. F6 Observational Watts vs. Time to First Flame B. Power Transfer To The Arc
Modeling the circuit includes the source, cable, connectors and the arc resistance for parallel faults (Fig. F7).
Faults in series with the load require the addition of the load resistance (Fig F8).
Using the models in Fig 7 and F8, and values from Table T4, the watts delivered to the arc are plotted for increasing arc resistance values. (See Fig. F9, F10.) The maximum power transfer is reached when the system resistance equals the arc resistance. The maximum watts deliverable to the arc is plotted in Fig 11 for three voltages.
Fig. F9 – Parallel Arc Watts Using System Model Fig 7
7

Fig. F10 Series Arc Watts Using System Model Fig F8
Fig. F11 Maximum Power Deliverable to the Arc
8
Table T4 Ohm Values for Circuit Configurations
CONCLUSION
1. At the extreme of low arc watts, there exists a point where there is insufficient arc power to ignite common materials. This data, taken over a few seconds, suggests that limit is below 100 watts and possibly as low as 50 watts.
2. Above 50 to 100 watts, continued exposure over time will lead to a flame in the material.
3. The time to ignite material is very dependant on the material. The data suggests that limiting the time of exposure to 1/2 second at 3000 watts would be sufficient to avoid igniting the rag based insulation material. Limiting the exposure time to ¼ second at 4000 watts would be sufficient to avoid ignition of carpeting. Vinyl material can tolerate 3000 watts up to ¾ of a second and perhaps more.
4. Limiting exposure times to ¼ second would protect the broad assortment of material selected for this study.
5. Limiting the material selection to self-extinguishing material, homogeneous materials with known arc robustness properties could extend the exposure time up to 1 second.
6. As the arc watts rise, the time of exposure to reach the “Flame” point becomes shorter.
7. The data suggests a DC offset which is material dependent.
8. Composition material such as layered vinyl or carpets with backing, add a threshold feature to the relationship.
9. Compounded materials, such as rag based sound insulation, increase the deviation of the “First Flame“ point.
10. Reaction time of protection products can be deduced from plots like this. These plots indicate protection times of 1/4 second to ½ second might be a reasonable goal. Other materials may indicate faster or slower times.
11. The constant damage contour lines exhibit the existence of energy minimums and maximums for a given damage level for differing power levels.

REFERENCES CONTACT
1. J. Zuercher, E. Hetzmannseder, (Eaton Corporation) “Testing Arc Faults in Automotive 42V Applications”, 42 Volt Automotive Systems (Intertech), Chicago, Illinois, September, 2001
Jerome K. Hastings, P.E., leads the Electric Power Management research program at Eaton’s Innovation Center. He has a B.S. in Electrical Engineering from the University of Wisconsin/Mil. He holds 44 patents , has published several papers on magnetics, power management, sensors and polymers. He has lead R&D and Innovation for control and protection products in Automotive, Industrial, Aerospace and Commercial areas. His current expertise is in Electric Power
2. Zuercher, Hetzmannseder, McNeill, and Hastings (Eaton Corporation) "Method for Realistic Evaluation of Arc Fault Detection Performance"
3. Underwriters Laboratory, Standard 746 A “Polymeric Materials – Short Term Property Evaluations”; 5th edition Dated November 1, 2000
Management & Arc Fault Detection. [email protected] 4. J.Brandrup,E. Immergut, E. Grulke “Polymer Hand
Book”, Pub: John Wiley Dr. Joe Zuercher earned his Ph.D. from M.I.T., and his B.S. and M.S. from Marquette, all in Electrical Engineering. He is a Senior Principal Engineer at Eaton's Innovation Center, a leading authority on arc fault detection and chairman of the MIT committee on arcing. He has done leading work in simulating circuits, algorithms and physical systems, including a variety of sensors. He holds over 20 patents with publications on arcing, acoustic modeling, microwave moisture sensing, vehicle navigation, integrated actuators, and electrohydrodynamics.
5. Xin Zhou, “Electrical Arcs: A Technical Challenge for 42 Volt Systems”, SAE Seminar Note ID# C0121, September 26, 2003
6. Zhou, X., Evaluation of Gassing Materials in Switching Devices Using Monochromatic High Speed Imaging Technique, IEEE Transactions: Components, Packaging and Manufacturing Technology Part A, 25(3), 2002.
[email protected]. Zhou, X., B. Ding, and J. Heberlein, Metallurgical Study and Temperature Measurement of Cathodes in DC Arcs, IEEE Transactions: Components, Packaging and Manufacturing Technology Part A, 19(3), 1996.
Dr. Engelbert Hetzmannseder Ph.D. received his Dipl.-Ing. (B.S., M.S., 1990) and Dr. techn. (Ph.D., 1994) degree in Electrical Engineering from the Technical University of Vienna, Austria. At Eaton’s Innovation Center , he did leading work in fundamental and applied research on contacts, switching arc phenomena, and arc faults for industrial control, aerospace, and automotive products. He holds 5 patents and published 16 papers at international conferences. Since 2000 he has been Technology Manager of the Power Systems Technology department at the Eaton Innovation Center in Milwaukee.
8. Easley,Sheehan,Sargent,Caloggero,Croushore NEC 2002 Handbook Ninth Edition NFPA press No. 70HB20
Appendix A [email protected]
9