Embed Size (px)
Citation preview

Electrical Conductivity (EC) and Sodium Adsorption Ratio (SAR) Assessment Method for Rosebud Creek, the Tongue, Powder, and Little Powder Rivers, and the Tongue River Reservoir
Final January 2021 WQDMASCM-01 Prepared by: Montana Department of Environmental Quality Water Quality Division Water Quality Planning Bureau Monitoring and Assessment Section

EC and SAR Assessment Method for Rosebud Cr, Tongue, Powder, Little Powder rivers, and Tongue River Reservoir
i
Suggested citation: Bell, C., Kron, D. 2021. Electrical Conductivity (EC) and Sodium Adsorption Ratio (SAR) Assessment Method for Rosebud Creek, the Tongue, Powder, and Little Powder Rivers, and the Tongue River Reservoir. Helena, MT: Montana Department of Environmental Quality, Water Quality Planning Bureau.
Authors: Chace Bell, Monitoring and Assessment Section Darrin Kron, Monitoring and Assessment Section
Contributor:
Katie Makarowski, Monitoring and Assessment Section
REVISION HISTORY
Version Number
Date Modified By Sections Modified
Description of Changes
1.0 Jan 2021 Chace Bell All Initial document

EC and SAR Assessment Method for Rosebud Cr, Tongue, Powder, Little Powder rivers, and Tongue River Reservoir
ii
TABLE OF CONTENTS
Table of Contents ............................................................................................................................... ii
Acronyms ......................................................................................................................................... iv
1.0 Introduction .................................................................................................................................1
1.1 Applicability ......................................................................................................................................... 1
2.0 Montana Water Quality Standards................................................................................................1
2.1 Montana Numeric EC and SAR Water Quality Standards ................................................................... 1
2.2 Electrical Conductivity and Specific Conductance .............................................................................. 2
2.3 Sodium Adsorption Ratio .................................................................................................................... 2
3.0 Data Considerations for Beneficial Use Assessment .......................................................................3
3.1 Data Currency ..................................................................................................................................... 3
3.2 Time of Year (seasonality) ................................................................................................................... 3
3.3 Time of Day ......................................................................................................................................... 3
3.4 Spatial and Temporal Requirements .................................................................................................. 3
3.4.1 Prioritization, Assessment Units and Assessment Reaches ......................................................... 4
3.4.2 Sample Location Requirements and Number of Sites within an Assessment Unit or Reach ...... 4
3.5 Parameter Requirements and Minimum Data Requirements ............................................................ 5
3.5.1 Required Parameters ................................................................................................................... 5
3.5.2 Minimum Data Requirements...................................................................................................... 6
3.5.3 Recommended Sample Sizes ....................................................................................................... 6
4.0 Data Quality .................................................................................................................................7
4.1 Data Quality Requirements for EC Field Instruments ......................................................................... 7
4.2 Field Blanks ......................................................................................................................................... 8
4.3 Field Duplicates ................................................................................................................................... 8
5.0 Data Analysis to Support Water Quality Standards Attainment ......................................................9
5.1 Preparing Data for Assessment ........................................................................................................... 9
5.1.1 Preparing Stream Data for Assessments ...................................................................................... 9
5.1.2 Preparing Tongue River Reservoir Data for Assessments .......................................................... 10
5.2 Handling Non-Detects and Greater-Than-Detect Values .................................................................. 10
5.3 Calculating Monthly Averages .......................................................................................................... 10
5.3.1 Calculating the Average of Monthly Continuous SC datasets .................................................... 10
5.3.2 Calculating Monthly Average of Non-Continuous Data (SC or SAR) .......................................... 11

EC and SAR Assessment Method for Rosebud Cr, Tongue, Powder, Little Powder rivers, and Tongue River Reservoir
iii
6.0 Assessment Decisions and Documentation .................................................................................. 12
6.1 Impairment Listing and Delisting ................................................................................................. 12
6.1.1 Specific Conductance (SC) .......................................................................................................... 12
6.1.2 Sodium Adsorption Ratio (SAR) ................................................................................................. 13
6.2 Documenting Assessment Decisions and Review ............................................................................. 13
6.2.1 Decision Error ............................................................................................................................. 13
6.2.2 Source Assessment and Supplemental Information .................................................................. 14
7.0 Public Information ...................................................................................................................... 14
8.0 Monitoring and Sample Designs Recommendations .................................................................... 14
8.1 Site selection and spatial independence .......................................................................................... 15
8.2 Sample Size ....................................................................................................................................... 15
9.0 References ................................................................................................................................. 16

EC and SAR Assessment Method for Rosebud Cr, Tongue, Powder, Little Powder rivers, and Tongue River Reservoir
iv
ACRONYMS
ARM Administrative Rules of Montana CBM Coalbed Methane CFR Code of Federal Regulations DEQ Department of Environmental Quality EC Electrical Conductivity MAR Montana Administrative Record MCA Montana Code Annotated QA Quality Assurance QAPP Quality Assurance Project Plan RPD Relative Percent Difference SAP Sampling and Analysis Plan SAR Sodium Adsorption Ratio SC Specific Conductance TDS Total Dissolved Solids TMDL Total Maximum Daily Load WARD Water Quality Assessment and Reporting Documentation

EC and SAR Assessment Method for Rosebud Cr, Tongue, Powder, Little Powder rivers, and Tongue River Reservoir
1
1.0 INTRODUCTION
This document details the Montana Department of Environmental Quality (DEQ) assessment method for determining attainment of electrical conductivity (EC) and sodium adsorption ratio (SAR) numeric water quality standards. Results from this method are used in the overarching process of Beneficial Use Assessment for Montana’s Surface Waters (Makarowski, 2020). This assessment method pertains only to the mainstems of Rosebud Creek, the Tongue, Powder, and Little Powder rivers, and the Tongue River Reservoir, and specifically to the agriculture beneficial use. EC and SAR numeric water quality standards for the waterbodies named in this assessment method were developed and adopted by the Board of Environmental Review (BER) in the early 2000s to protect the agriculture beneficial use. Anthropogenic sources of salt loading in this area of Montana may include but are not limited to coalbed methane production, dryland crop-fallow farming, irrigated crop production and coal production (EPA, 2013; McFarlane, George, Barrett-Lennard, Gilfedder 2016). Natural salinity in this region is present in geological strata influenced by a prehistoric inland sea (Bhattacharya and Willis, 2001).
1.1 APPLICABILITY
This assessment method is only applicable to Rosebud Creek, the Tongue, Powder, Little Powder rivers, and the Tongue River Reservoir for EC and SAR under state of Montana jurisdiction. State waters are defined in the Montana Water Quality Act (75-5-103(34), MCA).
2.0 MONTANA WATER QUALITY STANDARDS
Montana water quality standards are developed to protect water resources, to identify polluted waters or healthy waters in need of protection, as well as to establish limits for discharges from regulated facilities. The state of Montana designates beneficial uses for all state waters and establishes numeric or narrative water quality standards. Beneficial uses, and water quality standards provide the framework for achieving Federal Clean Water Act and Montana Water Quality Act goals and protections for Montana’s water resources.
2.1 MONTANA NUMERIC EC AND SAR WATER QUALITY STANDARDS
In 2003, the BER adopted EC and SAR numeric water quality standards for Rosebud Creek, the Tongue, Powder, and Little Powder rivers, and the Tongue River Reservoir. The numeric standards established for EC and SAR which apply to these waters are contained in the Administrative Rules of Montana (ARM 17.30.670). Administrative rules are agency regulations, standards or statements of applicability that implement, interpret or set law or policy. The BER determined that rules were necessary to ensure that the designated beneficial uses of these waters for agricultural purposes would be protected during the development of Coalbed Methane (CBM) and future land use changes. For Rosebud Creek and the Tongue, Powder and Little Powder rivers, numeric water quality standards for EC and SAR are categorized into two distinct seasons: the irrigation season (March 2nd – October 31st) and the non-irrigation season (November 1st – March 1st) (ARM 17.30.670(1)). For the Tongue River Reservior, a single standard applies year-round (ARM 17.30.670(5)). These standards are set to protect

EC and SAR Assessment Method for Rosebud Cr, Tongue, Powder, Little Powder rivers, and Tongue River Reservoir
2
the agriculture beneficial use during irrigation season, and to protect grazable riparian vegetation during the non-irrigation season. Numeric water quality standards for EC and SAR for these waters are provided in Table 2-1.
Table 2-1. Numeric EC and SAR Water Quality Standards
Waterbody
Irrigation Season (3/2 – 10/31) Non-Irrigation Season (11/1 – 3/1)
EC (µS/cm)
(monthly average)
EC (µS/cm)
(no sample
may exceed)
SAR (monthly average)
SAR (no
sample may
exceed)
EC (µS/cm)
(monthly average)
EC (µS/cm)
(no sample
may exceed)
SAR (monthly average)
SAR (no
sample may
exceed)
Tongue River 1000 1500 3.0 4.5 1500
2500 5.0 7.5
Powder River 2000 2500 5.0 7.5 2500 2500 6.5 9.75
Little Powder River
2000 2500 5.0 7.5 2500 2500 6.5 9.75
Rosebud Creek
1000 1500 3.0 4.5 1500 2500 5.0 7.5
Tongue River Reservoir
1000 1500 3.0 4.5 1000 1500 3.0 4.5
Be aware that when analyzing March data, March 1 will have a different applicable “not to exceed” standard than all other days. When comparing data to an average monthly standard for March, DEQ will apply the irrigation season standard.
2.2 ELECTRICAL CONDUCTIVITY AND SPECIFIC CONDUCTANCE
Specific conductance or conductivity (SC) is a measurement of the ability of water to conduct an electrical current at or corrected to 25 oC (Miller, Bradford, and Peters, 1986). State law defines another term, electrical conductivity: “Electrical conductivity (EC) means the ability of water to conduct an electrical current at 25oC” (ARM 17.30.602(7)). From these definitions, it is assumed EC and SC can be used interchangeably for this assessment method. Throughout this document, EC and SC are used interchangeably, but each term is used within the appropriate context: EC is used when referencing Montana’s standard whereas SC is used when referencing monitoring and data analysis. EC and SC are related to the total amount of dissolved solids in water. The more ions in the water, the more easily it conducts electricity. Excessive amounts of salts in water can reduce overall crop production.
2.3 SODIUM ADSORPTION RATIO
Sodium adsorption ratio (SAR) means a value representing the relative amount of sodium ions to the combined amount of calcium and magnesium ions in water using the following formula: SAR = [Na]/(([Ca]+[Mg])/2)1/2, where all concentrations are expressed as milliequivalents of charge per liter. (ARM 17.30.602(25)). Specifically, it is the ratio of the Na concentration divided by the square root of one half of the Ca + Mg concentration (Soil Survey Staff, 2017). SAR is important in supporting

EC and SAR Assessment Method for Rosebud Cr, Tongue, Powder, Little Powder rivers, and Tongue River Reservoir
3
agricultural crop production as high SAR values in clay and loam soils will reduce soil permeability, thereby concentrating salts near the surface and inhibiting plant growth (Fipps, 1996).
3.0 DATA CONSIDERATIONS FOR BENEFICIAL USE ASSESSMENT
Waterbody condition must be evaluated based on all existing and readily available data (75-5-702, MCA; 40 CFR 130.7(b)(5)). This section describes an important process for determining SC and SAR data quality and currency when performing beneficial use assessments. These considerations apply to discrete data (ambient water grab samples or instantaneous field meter measure) or continuous data (instrument deployed to collect data systematically over time).
3.1 DATA CURRENCY
Data collected within the past ten years are considered current and may be used in making assessment decisions (Makarowski, 2020). If during this period, significant changes in sources during the past decade have been documented, the assessor may use best professional judgement when determining which data are appropriate to include or not in the assessment. The assessor should document the specific changes in sources and determine which years’ data are appropriate to include in the assessment process when using less than a decade’s data. To proceed with assessment, the resulting dataset must represent conditions after the documented changes in the source(s).
3.2 TIME OF YEAR (SEASONALITY)
The EC and SAR numeric water quality standards are applicable year-round but have variable thresholds depending on the season (Table 2-1). Therefore, samples may be collected during all times of the year. For any type of data collection, the assessor must evaluate the time of year samples were collected and reference Table 2-1 to determine which standards are appropriate for the assessment. March’s monthly average analysis will use the irrigation season threshold. For all types of data collection (discrete SC and SAR and continuous SC), it is required that the early season crop production timeframe is targeted (March-May).
3.3 TIME OF DAY
SC and SAR samples may be collected at any time of the day. Significant intra-daily fluctuations are uncommon unless there is significant precipitation or snowmelt.
3.4 SPATIAL AND TEMPORAL REQUIREMENTS
This assessment method does not require a minimum distance between sites to attain spatial independence because DEQ assumes that there is usually no spatial independence within an assessment unit or reach (Section 3.4.1). This is unlike other methods, particularly nutrients, because EC and the analytes used to calculate SAR are very conservative as they move within a waterbody. DEQ understands that data are likely to be temporally dependent, especially data collected from continuous data loggers. The method for calculating monthly average conditions accounts for spatial and temporal data dependencies that are likely to occur. Further guidance is provided for deriving monthly averages in section 5.3.

EC and SAR Assessment Method for Rosebud Cr, Tongue, Powder, Little Powder rivers, and Tongue River Reservoir
4
3.4.1 Prioritization, Assessment Units and Assessment Reaches EC and SAR assessment decisions are made for assessment units (i.e., waterbody segments). Monitoring and Assessment Program prioritization criteria may include waters that have been previously identified as impaired for EC, SAR or both, in areas identified for TMDL completion, or for waters considered at higher risk of EC or SAR impairment due to human sources in the watershed. Assessment Units (AUs) are delineated using various factors, such as by minimum and maximum length (streams only); along hydrologic or watershed boundaries; or by use classification, geomorphology, or surrounding land use. AUs are intended to represent relatively homogeneous segments and have endpoint criteria to keep them manageable for reporting. Assessment reaches consist of a homogenous portion of an AU. Based on assessment method requirements, the assessor develops a sampling design to define the assessment reach and determine when stratification is warranted. For example, an AU can be stratified into reaches when a portion differs substantially from other parts of the AU (i.e., it is not homogeneous) (Makarowski, 2020). DEQ uses reach breaks to prevent over segmentation of our waters. If an assessment unit exhibits one or more significant shifts in type and intensity of potential SC or SAR sources such that clear breaks could be made to designate new homogenous reaches, a reach break may be justified (Makarowski, 2020). For example, if a relatively un-impacted upstream reach can be isolated and its condition is likely substantially different from other downstream parts of the assessment unit, the assessment unit may be split into two reaches for assessment purposes. Reaches should be considered when an AU may have a portion that is above the standards and other portions below standards. Assessors should consider this because all areas of an assessment unit should meet assessment criteria and support beneficial uses. When contemplating assessment reaches, consider:
• Each reach should have the same general data requirements (e.g., dataset minimums) as the parent assessment unit would have had if it hadn’t been divided. If resources are a consideration, a reach that has the most source contributions should be targeted.
• If one reach indicates impairment, the entire assessment unit receives the impairment determination.
• It is better to limit the number of reaches to avoid excessive reaches and the consequential administrative and sampling requirements that result.
• With some exceptions (Section 3.4.2), an assessor must decide whether to split an assessment unit into multiple assessment reaches before data collection and identify the proposed reaches in a sampling and analysis plan; this will help ensure that reach breaks are based on considerations of land use and sources rather than on differences in concentrations among sites discovered after monitoring.
3.4.2 Sample Location Requirements and Number of Sites within an Assessment Unit or Reach Assessment decisions are made using data pooled for an entire assessment unit (or reach), not for individual sites. This applies to both continuous and discrete SC and SAR data sets. Best professional judgment may be applied to determine how many sites are needed to adequately represent the range of potential human sources influencing each assessment unit or reach. Assessment decisions can be based on data collected at a single sampling location only if that single sampling location is in an area that represents the heaviest sources, or it is an integrator site that likely

EC and SAR Assessment Method for Rosebud Cr, Tongue, Powder, Little Powder rivers, and Tongue River Reservoir
5
represents conditions along a unit or reach. During assessment, it is recommended to incorporate data collected at multiple sites to better capture potential variability of SC and SAR throughout the assessment unit or reach. Data collected at multiple sites enables a multifaceted approach to data analysis. For example, in addition to pooling data from the entire assessment unit to make impairment determinations, an assessor may compare data from site to site after monitoring is completed. Site comparison will help determine if the segment is homogenous or if sources affect EC and SAR and thus different reaches should be assessed. The dispersed data can also be used by the Total Maximum Daily Load (TMDL) program. Multiple sites are recommended for all assessment units, including the Tongue River Reservoir. During the site comparison process, if one or a few sites data are not similar to the others in the assessment unit, especially if standards are exceeded there, a further reach break may be called for after data has already been collected. This could be due to previously unknown sources, especially those that are associated with groundwater. Because this is an assessment for agricultural use only, Tongue River Reservoir data should be collected near the outlet structure and near any irrigation use points, if present. If more complex depth profile data are available, the assessor may weight data more heavily if it is located near the outlet or an irrigation diversion point if it is justified.
3.5 PARAMETER REQUIREMENTS AND MINIMUM DATA REQUIREMENTS
This section describes the parameters required for this assessment method, and the minimum data requirements for each parameter.
3.5.1 Required Parameters SC and SAR are the only parameters needed for assessing an EC caused impairment, but it is also highly recommended to collect total dissolved solids (TDS). Water temperature should be recorded along with these parameters. Assessors must search for, document, and use all readily available data at the onset of data analysis; if there is enough data for one parameter but not the other, the assessor continues with data analysis for the parameter that meets data requirements. Both parameters are evaluated independently during data analysis to determine if there is an impairment based on the EC and/or SAR numeric water quality standards (Table 2-1). It is recommended to collect both EC and SAR at the same time. SC can be measured in three acceptable ways: 1) instantaneous measure with a hand-held field meter, 2) using a continuous data logger, or 3) via ambient water collected and sent to a laboratory for SC measurement. For SAR, ambient water sample collection and laboratory results for sodium (Na), magnesium (Mg), and calcium (Ca) is necessary. SAR is a calculated value based on these three elements. When sampling plans are developed to address this assessment method, ambient water samples collected for any EC or SAR assessment project must also be analyzed for total dissolved solids (TDS). TDS is used for calculating salt loads during TMDL modeling and development. Additionally, correlations between TDS and SC may need to be developed so that, if needed, future SC data can be extrapolated from TDS estimates (and vis-versa) for the watershed or waterbody. In Montana’s prairie streams, SC and TDS data are highly correlated in a linear relationship (Rusydi, 2018; Walton, 1989) Because of this relationship, assessors may convert TDS to SC data for assessment purposes. For this assessment method, SC data takes primacy for assessment purposes. Yet, staff may

EC and SAR Assessment Method for Rosebud Cr, Tongue, Powder, Little Powder rivers, and Tongue River Reservoir
6
convert TDS to SC only if minimum data requirements are not met for direct SC measures and additional TDS data without paired SC data is available. For this correlative analysis, assessors must use local, paired data from adjacent segments or from the watershed. Before assessors start this analysis, they must consult with the section manager. All converted data must be flagged as such and tracked throughout the data analysis. Converted data may be used to support an EC listing. TDS listings would be redundant and are unnecessary, especially since there is not a numeric TDS standard. All parameters collected for this assessment method must adhere to all applicable DEQ standard operating procedures (e.g. sample collection, handling and analysis, and field instruments use and maintenance) or other procedures from other approved entities by WQPB DEQ (Makarowski, 2020).
3.5.2 Minimum Data Requirements This section outlines the general minimum data requirements for performing attainment assessments for the numeric EC and SAR water quality standards. The same minimum data requirements apply to both EC and SAR assessments. Minimum data requirements are provided for situations where readily available, quality, data may exist that was not collected specifically for the assessment process. Recommended amounts of data are provided for data collection efforts that are designed for an EC and SAR assessment method. If the waterbody is not currently listed for EC and/or SAR the following are minimum data requirements. Only one sample from the irrigation high flow season (March-May) that meets data quality objectives is needed to perform an evaluation of the not to exceed standards for listing EC and SAR. To perform an assessment for EC and/or SAR to list an assessment unit (AU) based on the monthly average standards, at least four samples must have been collected. The four samples must be spaced approximately one week apart over one month. One sample must be collected within each full week of a calendar month. Partial weeks of 3 days or less at the beginning and end of each month should be considered part of the first or last full week unless they are treated as whole week (example: February would need representation from 4 weeks so treat a week with more than 3 days in it as a full week). The available month of data must be from irrigation season high flow timeframe (March-May). It is highly recommended that April be monitored to capture high flow irrigation season conditions if only one month is sampled. When planning for a monitoring project to address this assessment method, additional months of data are strongly encouraged (Section 3.5.4). The following are minimum sample requirements to perform an assessment for EC and/or SAR for a previously listed assessment unit. Twenty-four total samples must be available for delisting both monthly and the not to exceed standard. Samples collected to delist an AU must represent two years, each year must include at least three months, with at least one high flow (March-May) and low flow (June-February) month represented. Each month sampled must include four samples spread approximately one week apart and adhere to monthly representation in the preceding paragraph. The minimum data requirements are more robust for delisting to prevent an EC or SAR listing to continuously alternate between impaired and supporting conditions.
3.5.3 Recommended Sample Sizes Minimum data requirements are provided to assessors for guidance while looking at any readily available data. The requirements provide assessors the minimum amount of information needed to

EC and SAR Assessment Method for Rosebud Cr, Tongue, Powder, Little Powder rivers, and Tongue River Reservoir
7
make a decision. When planning a monitoring effort geared toward the objectives of an EC or SAR assessment, DEQ recommends collecting more information than the minimum data requirements. Plan to collect full monthly continuous EC data sets for each month sampled if equipment is available. It’s recommended, but not essential, that three months of data are collected for any planned monitoring effort designed for an EC and SAR assessment for a given year. One month each should be targeted to: 1) high flow irrigation season (March-May), 2) low flow irrigation season, 3) and non-irrigation season if feasible with weather conditions. If non-irrigation season monitoring is not feasible, this month should be moved to high flow irrigation season timeframe. Always plan to meet minimum monthly data requirements during SC and SAR monitoring. Plan to collect full monthly continuous EC data sets for each month sampled if equipment is available. Sondes should be set to collect equal intervals across the day (example: 12, 24 or 48/day). Visit sites once each full calendar week of the month to collect discrete samples for SAR, SC and TDS and to verify the sondes’ functionality. More than one site per segment is recommended. Minimum and recommended sample sizes also apply to the Tongue River Reservoir. While a full depth profile may not be used for assessment purposes, temperature and SC profiles should be measured to see if a thermocline or chemocline is present to help others understand reservoir dynamics. Because this is an assessment for agricultural use only, Tongue River Reservoir data should be collected near the reservoir outlet and near any irrigation use points, if present. If more complex depth profile data are available, the assessor may average water column conditions or provide justification to weight data more heavily if it is located near the outlet or an irrigation diversion point.
4.0 DATA QUALITY
Established policies and procedures used by DEQ’s Water Quality Planning Bureau for quality assurance and quality control, beneficial use assessment, and data management apply to this assessment method. Data quality requirements apply to all data incorporated while making assessment decisions, whether collected internally (by DEQ) or externally. All data will go through established procedures for quality assurance to ensure data are acceptable for making decisions. For inclusion in assessment decision making, data must represent ambient conditions of the waterbody being assessed and therefore cannot be collected within the mixing zone of permitted point source discharges and must be collected directly from the assessment unit itself. Do not use data from a mixing area downstream of a tributary. Assessors should thoroughly review continuous SC data to ensure all data are accurate, especially if result values exceed the not to exceed standards. For further details on general data quality requirements see Section 5.0 of Makarowski (2020). All data that is not used due to data quality issues must be justified and documented during assessment.
4.1 DATA QUALITY REQUIREMENTS FOR EC FIELD INSTRUMENTS
In addition to the general data quality requirements outlined or referenced above, SC data collection has additional data quality requirements. Continuous data loggers must adhere to the manufacturer’s calibration and maintenance requirements if the data are to be considered useable for assessment. Continuous data must also be corrected for drift if necessary. It is mandatory that handheld field meters are used to compare against continuous data logger values to ensure data quality.

EC and SAR Assessment Method for Rosebud Cr, Tongue, Powder, Little Powder rivers, and Tongue River Reservoir
8
4.2 FIELD BLANKS
Field blanks are samples collected and handled following the same methods as routine samples except that laboratory-grade deionized or distilled water is used rather than ambient water. Field blanks represent total ambient conditions during sampling, transport, and laboratory sources of contamination (EPA, 2009). Field blanks must be prepared during each sampling event and at least one field blank is analyzed along with each batch of routine discrete samples. Blanks should include all analytes that were collected on the sampling trip. Field blanks are not necessary to incorporate into a sample design when only continuous data or in-situ samples are being used, although appropriate equipment calibration and maintenance must be completed per each instrument’s user manual and recorded to ensure data quality. Assessors may decide to reject discrete samples collected during a sampling event in which a field blank returns detectable levels of SC or SAR. If field blank detections are found, assessors should attempt to identify the probable source of contamination and report it to the Project Manager and QA officer. Corrective measures include but are not limited to laboratory re-analyzing the samples and evaluating processes for collecting, handling, storing, and delivering or collecting field blanks.
4.3 FIELD DUPLICATES
Field duplicates are discrete samples collected as close as possible to the same point in space and time; duplicates should be collected by the same person and using the same collection method, though they are stored in separate bottles and analyzed independently. For discrete water samples to be analyzed by a lab, duplicate samples should be collected for at least 10% of the total number of samples collected per parameter. Duplicate sampling should be documented in a QAPP or SAP. Relative percent difference (RPD) is used to evaluate results between two duplicate discrete samples:
𝑅𝑃𝐷 = |(𝑟𝑒𝑠𝑢𝑙𝑡 1 − 𝑟𝑒𝑠𝑢𝑙𝑡 2)|
(𝑟𝑒𝑠𝑢𝑙𝑡 1+𝑟𝑒𝑠𝑢𝑙𝑡 2)/2 X 100
Field duplicates should generally be within 25% RPD of one another. If RPD greater than 25% is found among field duplicates, the assessor should verify data quality to confirm that the routine result values are valid for inclusion in assessment. For continuous SC data, a field duplicate should be obtained by placing a handheld field meter probe as near to the deployed instrument as possible and recording the SC value and time. These data can later be compared to the deployed instrument’s data using the RPD method. Data accuracy checks, calibration and equipment maintenance should be performed for continuous and hand-held SC meters throughout deployment to validate the quality of the data.

EC and SAR Assessment Method for Rosebud Cr, Tongue, Powder, Little Powder rivers, and Tongue River Reservoir
9
5.0 DATA ANALYSIS TO SUPPORT WATER QUALITY STANDARDS
ATTAINMENT
5.1 PREPARING DATA FOR ASSESSMENT
Preparing data for assessment should take into consideration the minimum data requirements that are described in Section 3.5.2. It is important for the assessor to evaluate data quality for every available result and document any that cannot be used (Section 4). This is especially important when comparing results to the “no sample may exceed” standards.
5.1.1 Preparing Stream Data for Assessments Steps should be followed when organizing and preparing data for assessment to determine attainment of the monthly average standards for Rosebud Creek, and the Tongue, Powder and Little Powder rivers. This process includes a step where the assessor determines if the data suggest there is a reason to further subdivide the assessment unit into reaches. These steps apply to both EC and SAR independently.
1. Perform data quality assessment to identify the usable dataset for the project (Section 4.0); document all data that is excluded from assessment and justify the exclusion. Carry this information forward to each assessment units’ documentation during step 2
2. Compile all SC and SAR data for an assessment unit or reach. Compare data from site to site to see if there should be a previously unfound need for a reach break (Section 3.4.1). Review data site by site to see if any spatial patterns emerge. At any given time, DEQ would generally expect relatively consistent values throughout an assessment unit. If one or some sites are likely above assessment thresholds for monthly or the “not to exceed” standards, but others are not, consult the section manager and technical lead for guidance. This step may result in a reach break(s) of the assessment unit. Assessors may need to complete steps 3-8 below by site. The assessor will need to document justification for reach breaks in consultation with the section manager.
3. For each assessment unit or reach, organize data by year.
4. For each assessment unit or reach, organize data by season according to Montana’s EC and SAR standards (Table 2-1).
5. Group continuous SC and discrete SC and SAR values for the whole assessment unit or reach by calendar month, sorted by date/time.
6. Pair data that has been collected at the same time on the assessment unit or reach by each timeframe (Example: every half hour or hour). This may include pairing data from multiple sites or from both continuous and discrete samples from the same site, or both. All discrete data should be paired to the nearest continuous datum when both are available and collected within an hour of each other.
7. Review data to see if the “not to exceed” standard has been exceeded (Table 2-1). If there are any exceedances of any sample, document them and proceed to section 6 for further guidance about interpreting exceedances into a decision. Additionally, continue with step 8.
8. Determine if minimum data requirements for calculating monthly averages are met. Complete steps 8 and 9 for any month with data.

EC and SAR Assessment Method for Rosebud Cr, Tongue, Powder, Little Powder rivers, and Tongue River Reservoir
10
a. For each month with data, is a full month (or months) of equally spaced continuous data compiled from step 6? If yes, go to step 9. If no go to 8b.
b. Is each full calendar week of the month(s) represented by at least one sample with about a week’s spacing? If at least 4 samples that represent each week of the month are available for analysis, then go to step 9. If not, the month does not pass DQA to calculate a monthly average. See further guidance in section 5.3.2. Compare monthly average(s) to applicable standards from table 2.1 and document any exceedances by month.
9. Calculate the monthly average(s) according to section 5.3.1. Compare monthly average(s) to applicable standards from table 2.1 and document any exceedances by month.
Section 6 provides further guidance about listing decision and documentation.
5.1.2 Preparing Tongue River Reservoir Data for Assessments Preparing Tongue River Reservoir data for assessment should take into consideration the minimum data requirements that are described in Section 3. Preparing reservoir data for assessments is largely the same as for the streams except for cases where the lake is stratified. This process includes a step where the assessor determines if the data suggest there is a reason to justify a need to utilize the data near the outlet structure or points of water diversion or if averaging of all data is appropriate. If the assessor needs to use only data near water use points or the outlet structure because of stratification or other EC or SAR variability in the reservoir, work with the section manager to do so. Justification to only use data near points of use or conveyance will need to be justified in the assessment record. All areas of the lake, outside of mixing zones, have an expectation to meet standards and support existing and future uses.
5.2 HANDLING NON-DETECTS AND GREATER-THAN-DETECT VALUES
For all parameters mentioned in section 3.5.1 all historical data are at detectable levels. If non-detects or greater-than-detect results are attained, be suspect of data and any associated meters.
5.3 CALCULATING MONTHLY AVERAGES
There are two distinct scenarios for calculating monthly averages depending on the type of data available. The first involves a simple method to calculate an average based on a full, equally timed, month long, data set. A second scenario for calculating a monthly average condition arises when data is not collected on a constantly timed interval.
5.3.1 Calculating the Average of Monthly Continuous SC datasets This monthly calculation should be used when an assessor has compiled all credible data at an assessment unit or reach scale and has an equally spaced dataset that represents equally timed measures for each day of the month. This data meets the monthly data requirements (Section 3.5.2). All continuous and discrete sampling from an assessment unit or reach should be compiled and averaged by date and time according to step 6 in the data preparation process (Section 5.1.1). This combined and averaged data set must have equally spaced results on all days of a month (Examples: 1,6, 12, 24, 48 samples/day). This will be termed a full monthly continuous data set. This will only be feasible for SC data because of automated in-situ sondes that collect data at pre-programed intervals. To calculate the monthly average condition of this data set, the assessor should calculate the average of all of the equally timed averaged results from the assessment unit or reach from section 5.1.1 step 6.
EC and SAR Assessment Method for Rosebud Cr, Tongue, Powder, Little Powder rivers, and Tongue River Reservoir
11
This simplified averaging approach can be used because the data is available over an equal time interval throughout the whole month. The month is represented equally over time.
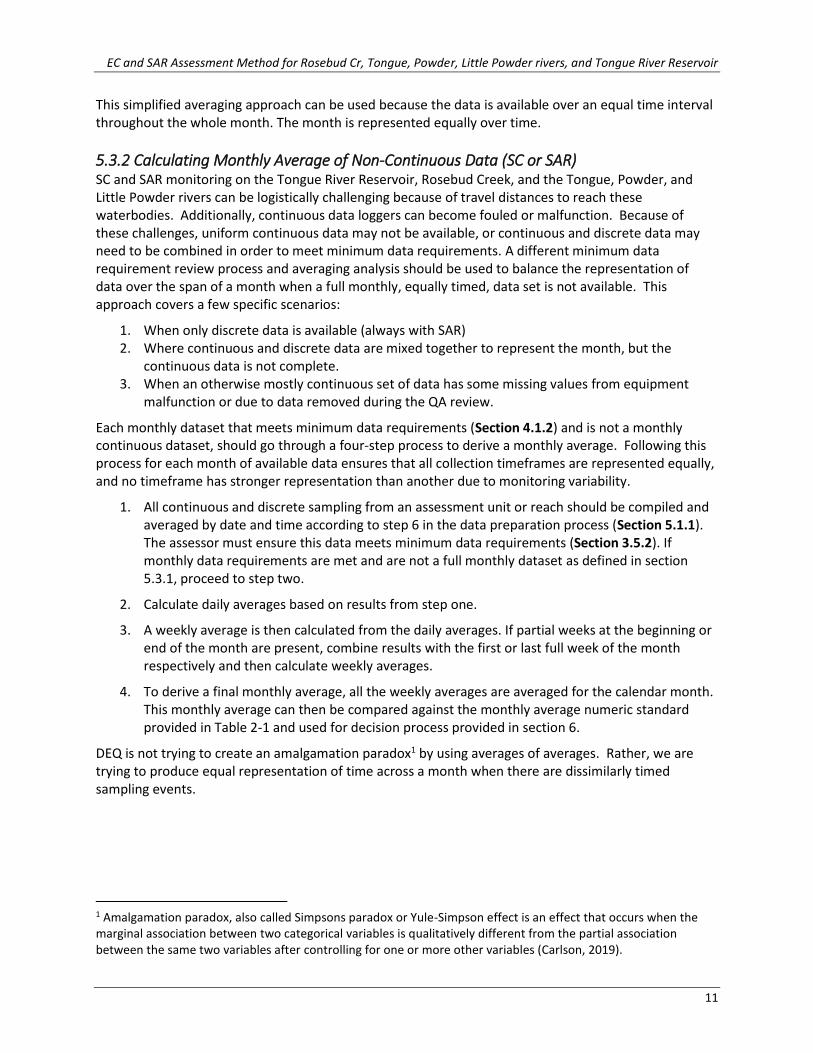
5.3.2 Calculating Monthly Average of Non-Continuous Data (SC or SAR) SC and SAR monitoring on the Tongue River Reservoir, Rosebud Creek, and the Tongue, Powder, and Little Powder rivers can be logistically challenging because of travel distances to reach these waterbodies. Additionally, continuous data loggers can become fouled or malfunction. Because of these challenges, uniform continuous data may not be available, or continuous and discrete data may need to be combined in order to meet minimum data requirements. A different minimum data requirement review process and averaging analysis should be used to balance the representation of data over the span of a month when a full monthly, equally timed, data set is not available. This approach covers a few specific scenarios:
1. When only discrete data is available (always with SAR) 2. Where continuous and discrete data are mixed together to represent the month, but the
continuous data is not complete. 3. When an otherwise mostly continuous set of data has some missing values from equipment
malfunction or due to data removed during the QA review.
Each monthly dataset that meets minimum data requirements (Section 4.1.2) and is not a monthly continuous dataset, should go through a four-step process to derive a monthly average. Following this process for each month of available data ensures that all collection timeframes are represented equally, and no timeframe has stronger representation than another due to monitoring variability.
1. All continuous and discrete sampling from an assessment unit or reach should be compiled and averaged by date and time according to step 6 in the data preparation process (Section 5.1.1). The assessor must ensure this data meets minimum data requirements (Section 3.5.2). If monthly data requirements are met and are not a full monthly dataset as defined in section 5.3.1, proceed to step two.
2. Calculate daily averages based on results from step one.
3. A weekly average is then calculated from the daily averages. If partial weeks at the beginning or end of the month are present, combine results with the first or last full week of the month respectively and then calculate weekly averages.
4. To derive a final monthly average, all the weekly averages are averaged for the calendar month. This monthly average can then be compared against the monthly average numeric standard provided in Table 2-1 and used for decision process provided in section 6.
DEQ is not trying to create an amalgamation paradox1 by using averages of averages. Rather, we are trying to produce equal representation of time across a month when there are dissimilarly timed sampling events.
1 Amalgamation paradox, also called Simpsons paradox or Yule-Simpson effect is an effect that occurs when the marginal association between two categorical variables is qualitatively different from the partial association between the same two variables after controlling for one or more other variables (Carlson, 2019).
EC and SAR Assessment Method for Rosebud Cr, Tongue, Powder, Little Powder rivers, and Tongue River Reservoir
12
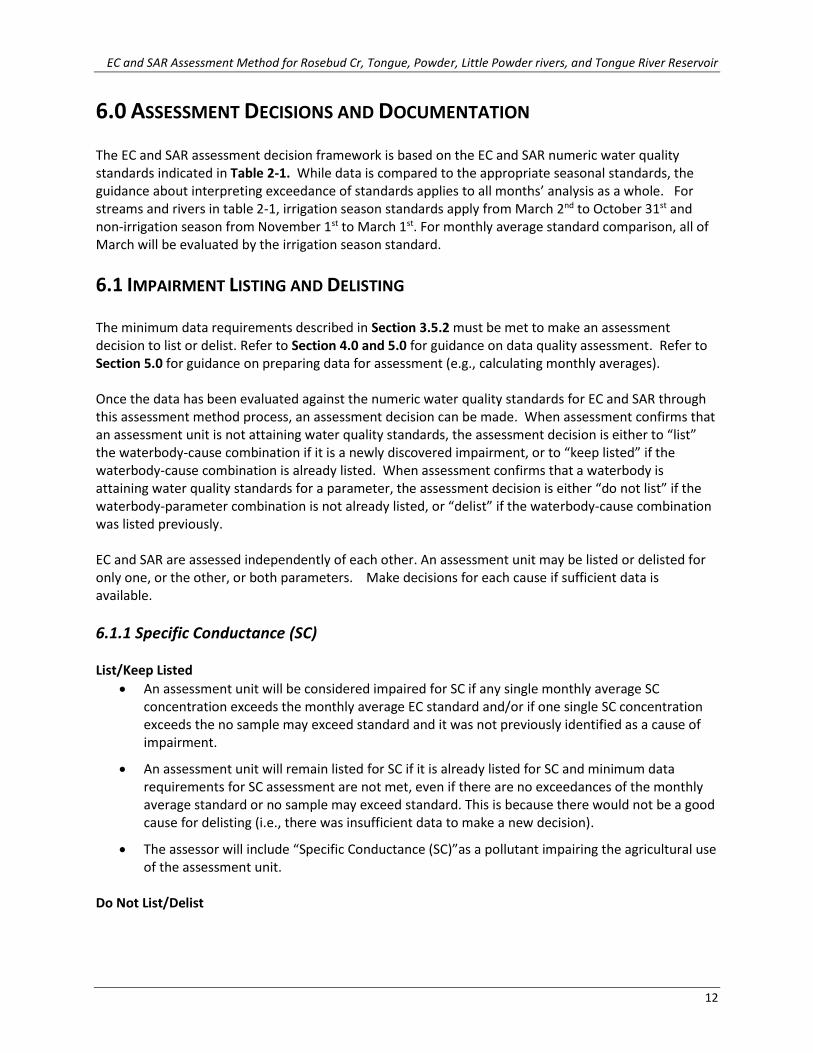
6.0 ASSESSMENT DECISIONS AND DOCUMENTATION
The EC and SAR assessment decision framework is based on the EC and SAR numeric water quality standards indicated in Table 2-1. While data is compared to the appropriate seasonal standards, the guidance about interpreting exceedance of standards applies to all months’ analysis as a whole. For streams and rivers in table 2-1, irrigation season standards apply from March 2nd to October 31st and non-irrigation season from November 1st to March 1st. For monthly average standard comparison, all of March will be evaluated by the irrigation season standard.
6.1 IMPAIRMENT LISTING AND DELISTING
The minimum data requirements described in Section 3.5.2 must be met to make an assessment decision to list or delist. Refer to Section 4.0 and 5.0 for guidance on data quality assessment. Refer to Section 5.0 for guidance on preparing data for assessment (e.g., calculating monthly averages). Once the data has been evaluated against the numeric water quality standards for EC and SAR through this assessment method process, an assessment decision can be made. When assessment confirms that an assessment unit is not attaining water quality standards, the assessment decision is either to “list” the waterbody-cause combination if it is a newly discovered impairment, or to “keep listed” if the waterbody-cause combination is already listed. When assessment confirms that a waterbody is attaining water quality standards for a parameter, the assessment decision is either “do not list” if the waterbody-parameter combination is not already listed, or “delist” if the waterbody-cause combination was listed previously. EC and SAR are assessed independently of each other. An assessment unit may be listed or delisted for only one, or the other, or both parameters. Make decisions for each cause if sufficient data is available.
6.1.1 Specific Conductance (SC) List/Keep Listed
• An assessment unit will be considered impaired for SC if any single monthly average SC concentration exceeds the monthly average EC standard and/or if one single SC concentration exceeds the no sample may exceed standard and it was not previously identified as a cause of impairment.
• An assessment unit will remain listed for SC if it is already listed for SC and minimum data requirements for SC assessment are not met, even if there are no exceedances of the monthly average standard or no sample may exceed standard. This is because there would not be a good cause for delisting (i.e., there was insufficient data to make a new decision).
• The assessor will include “Specific Conductance (SC)”as a pollutant impairing the agricultural use of the assessment unit.
Do Not List/Delist

EC and SAR Assessment Method for Rosebud Cr, Tongue, Powder, Little Powder rivers, and Tongue River Reservoir
13
• An assessment unit will be considered not impaired for EC if no month’s monthly average SC concentration exceeds the monthly average EC standard and if no single SC concentration exceeds the no sample may exceed EC standard.
• An assessment unit will be delisted for EC if there are no exceedances of either the monthly average EC standard or the no sample may exceed standard over the last decade if sources have not changed, or at least the most recent two-year period if there have been documented changes in sources.
6.1.2 Sodium Adsorption Ratio (SAR) List/Keep Listed
• An assessment unit will be considered impaired for SAR if any single monthly average SAR exceeds the monthly average SAR standard and/or if one single SAR value exceeds the do not exceed standard.
• An assessment unit will remain listed for SAR if it is already listed for SAR and minimum data requirements for SAR assessment are not met, even if there are no exceedances of the monthly average standard or do not exceed standard. Without minimum data requirements there is not a good cause to delist.
• Include “Sodium Adsorption Ratio” as a pollutant impairing the agricultural use of the assessment unit.
Do Not List/Delist
• An assessment unit will be considered not impaired for SAR if no month’s monthly average SAR exceeds the monthly average SAR standard and if no single SAR value exceeds the do not exceed SAR standard.
• An assessment unit will be delisted for SAR if there are no exceedances of either the monthly average EC standard or the no sample may exceed standard over the last decade if sources have not changed, or at least the most recent two-year period if there have been documented changes in sources.
6.2 DOCUMENTING ASSESSMENT DECISIONS AND REVIEW
The assessor must document all data and decisions pertaining to SC and SAR impairment and agriculture beneficial use support determinations for the applicable assessment units. Assessment outcomes for individual assessment units, including data summaries, impairment determinations, and beneficial use support determinations are documented by assessors using the Water Quality Assessment and Reporting Documentation (WARD) system. Waterbodies identified as impaired due to SC and/or SAR are included in Montana’s biennial Water Quality Integrated Report and list of impaired waters. Assessment decisions are reviewed by the Monitoring and Assessment Section Supervisor and may be reviewed by the QA Officer and managers and staff from other programs (e.g., Watershed Management (TMDL) Program).
6.2.1 Decision Error Following the guidelines in this document will produce consistent results and ensure decisions are accurate.

EC and SAR Assessment Method for Rosebud Cr, Tongue, Powder, Little Powder rivers, and Tongue River Reservoir
14
6.2.2 Source Assessment and Supplemental Information Probable sources of impairment must be placed in the WARD database, and may include the activities, facilities, or conditions that generate the pollutants that prevent waters from meeting water quality standards. The following sources that are extracted from EPA ATTAINS database, and available in DEQs WARD database, are most commonly associated with SC and SAR impairment listings in this region of Montana:
• Natural Sources
• Coal Mining, Coal Mining (Subsurface), or Coal Mining Discharges (Permitted)
• Crop Production (Irrigated)
• Crop Production (non-irrigated)
• Petroleum/natural Gas Production Activities (Permitted). This source includes coalbed methane (CBM) production, as CBM is not an available source in WARD.
Additional probable source options are available in the WARD system, if needed. If other probable sources not listed in this section are used in an assessment, the assessor must first confer with the section manager before entry into WARD. Probable sources are only provided to help during initiation of TMDL planning and should only be used for this purpose. Not all probable sources are verified. When an assessor identifies any probable sources, they must provide evidence of the use of the probable source. The assessor must include a brief description and justification of probable sources in the overall condition of the waterbody summary in WARD. The assessor will need to identify if the probable source is confirmed or not by checking a Source Confirmed box or Source Not Confirmed box. If the assessor documents only the presence of a source in the assessment unit documentation, the Source Not Confirmed box should be checked. If water quality data are available that prove a probable source is contributing loads or increasing concentrations, the assessor should check the Source Confirmed box in WARD.
7.0 PUBLIC INFORMATION
SC and SAR data collected by DEQ are stored in DEQ’s MT-eWQX Enterprise (EQuIS) database and are uploaded weekly to the Water Quality Portal (EPA, USGS and NWQMC, 2018). Assessment outcomes for individual assessment units, including data summaries, impairment determinations, and beneficial use support determinations, are documented and accessible to the public in Montana DEQ’s Clean Water Act Information Center (CWAIC) (available at http://deq.mt.gov/Water/Resources/cwaic). Waterbodies identified as impaired due to SC and SAR are included in Montana’s biennial Water Quality Integrated Report and list of impaired waters submitted to EPA every two years.
8.0 MONITORING AND SAMPLE DESIGNS RECOMMENDATIONS
This section includes considerations for designing a project where new data is collected specifically for assessment purposes. Water quality sample collection for evaluating EC and SAR standards attainment must adhere to DEQ’s standard operating procedures for chemistry sample collection, handling, and analysis (Makarowski, 2019).

EC and SAR Assessment Method for Rosebud Cr, Tongue, Powder, Little Powder rivers, and Tongue River Reservoir
15
8.1 SITE SELECTION AND SPATIAL INDEPENDENCE
Sampling designs for SC and SAR assessment should apply a targeted sampling approach that is intended to spatially represent ambient water quality conditions throughout the assessment unit. The applicable assessment units are considered relatively homogenous with respect to geology and major tributary inflows which are two factors likely to influence SC and/or SAR conditions. Also, SC and SAR are not influenced by cycling and uptake like some other pollutants are (e.g., nutrients), so longitudinal spatial variability is generally expected to be low between sites within a single assessment unit or reach. However, human activities, significant tributaries and land uses that modify SC and SAR can increase variability among sites and must therefore be considered when selecting sites. The following guidance aims to help ensure spatial representativeness of datasets (including continuous datalogger deployment):
• Bracket potentially significant human sources (e.g., irrigation return flows, MPDES permit discharges).
• Always collect samples outside of mixing zones of permitted discharges, tributary mixing areas or just downstream of irrigation return. These influences may not represent the condition of the assessment unit well.
• Select sites to represent areas of water agricultural water conveyance or water use. Select reservoir sites that represent distinct bays, especially those with inflows or sources. Include a site near the dam and near the inflow.
• Coordinate with the TMDL group when creating a sampling plan, source assessment sites may be requested.
Any SC or SAR sampling design intended for assessing water quality standards attainment should incorporate field blanks and the frequency should be documented in a Quality Assurance Project Plan (QAPP) or Sampling and Analysis Plan (SAP)
8.2 SAMPLE SIZE
Data quality requirements including minimum sample size should be reviewed prior to designing a monitoring strategy for SC and SAR assessment. Minimum sample sizes are specified in Section 3.5. It is desirable to surpass these minimum requirements as resources allow to obtain better spatial and temporal representation and a more robust data set. Although a minimum sample size can be met by sampling at a single representative site location, it is generally preferable to strategically collect samples at multiple sites that represent a range of conditions along an assessment unit. Coordinate with the TMDL program to include source assessment site locations. It is preferable to use continuous data loggers for SC data collection. Winter conditions usually preclude the use of continuous data loggers, and at times, data loggers may not be available. If continuous data loggers are not a feasible approach to data collection, then the goal would be to meet minimum discrete sample size requirements for each month. Sampling plans should clarify that sampling efforts start as soon as ice-off occurs for continuous data collection, and potentially earlier with discrete sampling. Sampling should include at least a month in the high flow irrigation season, a month in the low flow irrigation season and include the non-irrigation season if possible.

EC and SAR Assessment Method for Rosebud Cr, Tongue, Powder, Little Powder rivers, and Tongue River Reservoir
16
9.0 REFERENCES
Bhattacharya, J.P. and Willis, B.J., 2001. Lowstand Deltas in the Frontier Formation, Powder River basin, Wyoming: Implications for Sequence stratigraphic models. The American Association of Petroleum Geologists, Volume 85 Number 2:261-294
Carlson, B.W. 2019. Simpson’s Paradox. Encyclopedia Britannica. Encyclopedia Britannica Inc.
https://www.britannica.com/topic/Simpsons-paradox. Accessed 04/03/2020 Fipps, G., 1996. Irrigation Water Quality Standards and Salinity Management Strategies. Agriculturea
Communications, The Texas A&M University System. Clean Water Act (CWA). 2002. 33 U.S.C. 1251 et seq. EPA Website. Report Federal Water Pollution
Control Act [As Amended Through P.L. 107-303, November 27, 2002]. Makarowski, Kathryn. 2019. Standard Operating Procedure for Sample Collection for Chemistry Analysis:
Water, Sediment, and Biological Tissue. WQDWQPBFM-02, Version 1.0. Helena, MT: Montana Department of Environmental Quality, Water Quality Planning Bureau.
Makarowski, K. 2020. Water Quality Assessment Method: Beneficial Use Support and Impairment
Listing Methodology for Montana’s Surface Waters. Helena, MT: Montana Department of Environmental Quality. Document WQPBWQM-001, Version 4.0.
McFarlane, D.J., George, R.J.., Barrett-Lennard, E.G., Gilfedder, M., 2016. Salinity in Dryland Agricultural
Systems: Challenges and Opportunities. Innovations in Dryland Agriculture: 521-547. Miller, R.L., Bradford, W.L., and Peters, N.E. 1986. Specific Conductance: Theoretical Considerations
and Application to Analytical Quality Control. U.S. Geological Survey Water-Supply Paper 2311 Montana Administrative Register (MAR). 2003. MAR Notice No. 17-303 Notice of public hearing on
proposed amendment. Montana Department of Environmental Quality (DEQ). 2010. Notice of Public Hearing on Proposed
Amendment Before the Board of Environmental Review and the Department of Environmental Quality. MAR Notice No. 17-303.
Rusydi, A.F., 2018. Correlation between conductivity and total dissolved solid in various types of water:
A review. IOP Conference Series: Earth and Environmental Science. Savin, N.E., and K. J. White. 1977. The Durbin-Watson Test for Serial Correlation with Extreme Sample
Sizes or Many Regressors. Econometrica 45: 1989-1996. Soil Survey Staff. 2017. Natural Resources Conservation Service, United States Department of
Agriculture. Web Soul Survey. Available online at http://websoilsurvey.nrcs.usda.gov/. Accessed 12/12/2019.

EC and SAR Assessment Method for Rosebud Cr, Tongue, Powder, Little Powder rivers, and Tongue River Reservoir
17
Suplee, M.W., Sada, R., and D. Feldman. 2019. Aquatic Plant and Dissolved Oxygen Changes in a Reference-Condition Prairie Stream Subjected to Experimental Nutrient Enrichments. Journal of the American Water Resources Association 55: 700-719.
U.S Environmental Protection Agency (EPA). 2013. Technical Development for the Coalbed Methane
Extraction Industry U.S. Environmental Protection Agency (EPA) and United States Geological Survey (USGS) and the
National Water Quality Monitoring Council (NWQMC). 2018. Water Quality Portal. Available at https://www.waterqualitydata.us/.
Walton, N.G.R., 1989. Electrical Conductivity and Total Dissolved Solids – What is Their Precise
Relationship?. Delalination, Volume 72 Issue 3: 275-292. Warrence, N.J., Bauder, J.W., Pearson, K.E., 2002. Basics of Salinity and Sodicity Effects on Soil
Properties. Department of Land Resources and Environmental Sciences, Montana State University-Bozeman. Available online at http://citeseerx.ist.psu.edu. Accessed 3/29/2020.