Embed Size (px)
Citation preview
Home ELECTRICAL FIRES
John R. Hall, Jr. April 2013
National Fire Protection Association Fire Analysis and Research Division

Home ELECTRICAL FIRES
John R. Hall, Jr. April 2013
National Fire Protection Association Fire Analysis and Research Division
Abstract Electrical fires In 2011, an estimated 47,700 home structure fires reported to U.S. fire departments involved some type of electrical failure or malfunction as a factor contributing to ignition. These fires resulted in 418 civilian deaths, 1,570 civilian injuries, and $1.4 billion in direct property damage. Non-home electrical fires in 2011 were estimated at 16,400, with associated losses of 13 civilian deaths, 243 civilian injuries, and $501 million in direct property damage. Home electrical distribution or lighting equipment fires In 2011, an estimated 21,300 reported U.S. non-confined home structure fires involving electrical distribution or lighting equipment resulted in 295 civilian deaths, 840 civilian injuries, and $822 million in direct property damage. These estimates are based on data from the U.S. Fire Administration’s (USFA’s) National Fire Incident Reporting System (NFIRS) and the National Fire Protection Association’s (NFPA’s) annual fire department experience survey. Keywords: Electrical fire, wiring, lamp, light, cord, plug, fuse, circuit breaker, transformer, outlet, receptacle, switch, generator, battery, fire statistics, home fires, residential fires. Acknowledgements The National Fire Protection Association thanks all the fire departments and state fire authorities who participate in the National Fire Incident Reporting System (NFIRS) and the annual NFPA fire experience survey. These firefighters are the original sources of the detailed data that make this analysis possible. Their contributions allow us to estimate the size of the fire problem. We are also grateful to the U.S. Fire Administration for its work in developing, coordinating, and maintaining NFIRS. For more information about the National Fire Protection Association, visit www.nfpa.org or call 617-770-3000. To learn more about the One-Stop Data Shop go to www.nfpa.org/osds or call 617-984-7443. Copies of this analysis are available from: National Fire Protection Association One-Stop Data Shop 1 Batterymarch Park Quincy, MA 02169-7471 NFPA No. USS37
Copyright © 2013, National Fire Protection Association, Quincy, MA
Home Electrical Fires, 4/13 i NFPA Fire Analysis & Research, Quincy, MA
Executive Summary
Electrical fires
The most inclusive and direct interpretation of “electrical fire” is a fire involving some type of electrical failure or malfunction. Any equipment powered by electricity can have such a failure. In 2011, an estimated 47,700 home structure fires reported to U.S. fire departments involved some type of electrical failure or malfunction as a factor contributing to ignition. These fires resulted in 418 civilian deaths, 1,570 civilian injuries, and $1.4 billion in direct property damage. In 2007-2011, home electrical fires represented 13% of total home structure fires, 18% of associated civilian deaths, 11% of associated civilian injuries, and 20% of associated direct property damage. In 2011, an estimated 16,400 non-home structure fires reported to U.S. fire departments involved some type of electrical failure or malfunction as a factor contributing to ignition. These fires resulted in 13 civilian deaths, 243 civilian injuries, and $501 million in direct property damage. In 2007-2011, non-home electrical fires represented 13% of total non-home structure fires, 5% of associated civilian deaths, 13% of associated civilian injuries, and 21% of associated direct property damage. The national estimates in this report are derived from data reported to the U.S. Fire Administration’s National Fire Incident Reporting System (NFIRS). These statistics include fires reported as “confined fires,” for which detailed reporting is not required. Estimates of detailed characteristics for confined fires require statistical allocation of a large share of unknowns and so involve less confidence.
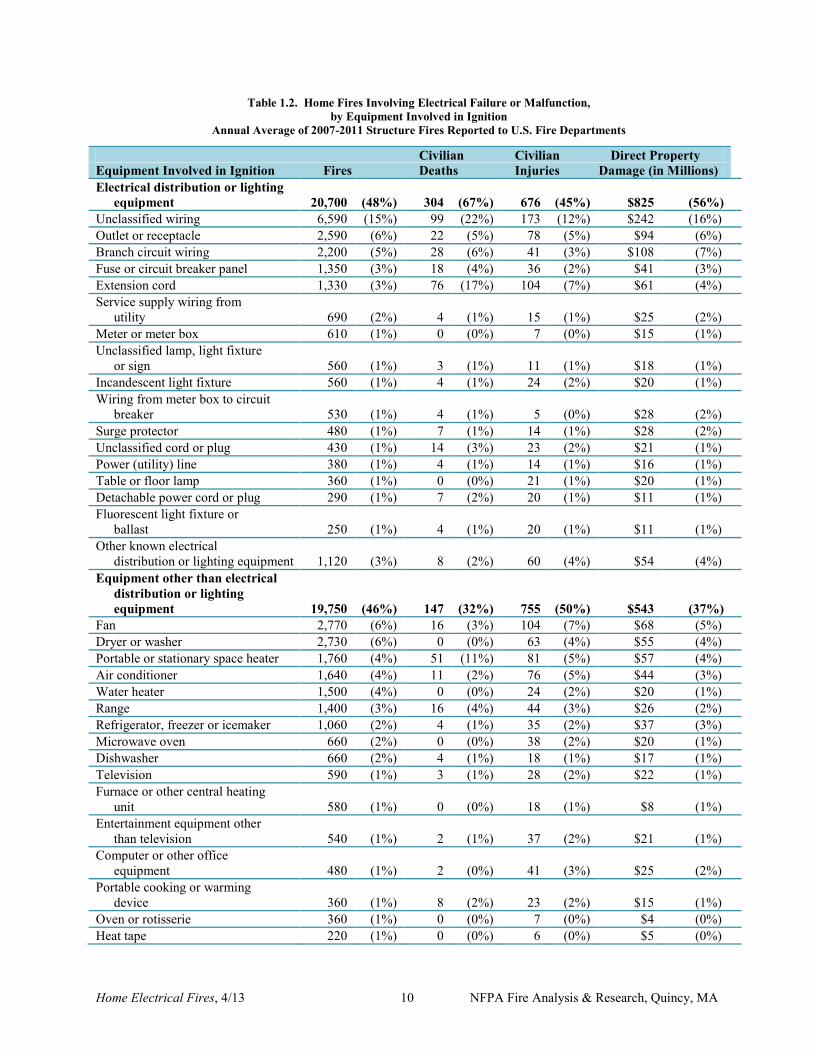
Half (48%) of 2007-2011 reported non-confined U.S. home structure fires involving electrical failure or malfunction had some type of electrical distribution or lighting equipment as equipment involved in ignition. The leading other types of equipment involved in ignition were fan (6%), washer or dryer (6%), space heater (4%), air conditioning equipment (4%), water heater (3%), and range (3%). Home electrical distribution or lighting
equipment fires
In 2011, an estimated 21,300 reported U.S. non-confined home structure fires involving electrical distribution or lighting equipment resulted in 295 civilian deaths, 840 civilian injuries, and $822 million in direct property damage. Fires reported as confined fires would add only 2.1% to the estimated non-confined fires and less than 2% to associated losses. Therefore, they are not included in this analysis. Home electrical distribution or lighting equipment fires declined by about one-third from 1980 to 1998. Version 5.0 of NFIRS, introduced in 1999, contained numerous changes in data categories, definitions, and rules. After the transition period of 1999-2001, when NFIRS Version 5.0 was being phased in, the estimates settled into a level about one-half lower than the levels of the late 1990s, a much larger decline than would have been expected if the 1980-1998 trend had continued unchanged. Associated losses also showed large declines coinciding with the shift to NFIRS Version 5.0. As with other types of equipment cited as equipment involved in ignition, all that we know from this designation is that the equipment provided the heat leading to ignition. That does not mean that there was electrical or any other type of failure or malfunction. For example, a hot light bulb
Home Electrical Fires, 4/13 ii NFPA Fire Analysis & Research, Quincy, MA
might have been too close to combustibles. Such a fire would not be included in the estimates of home electrical fires but would be included in the estimates of home electrical distribution or lighting equipment fires. Electrical distribution or lighting equipment accounted for 6% of 2007-2011 home structure fires, ranking fourth among major causes behind cooking equipment, heating equipment, and intentional. Electrical distribution or lighting equipment also accounted for 13% of associated civilian deaths (ranking behind smoking materials, heating equipment, and cooking equipment, and tied with intentional), 7% of associated civilian injuries (ranking fourth), and 11% of associated direct property damage (ranking fourth). Wiring and related equipment accounted for the largest share (63%) of 2007-2011 home structure fires involving electrical distribution or lighting equipment, followed by lamps, light fixtures, and light bulbs (20%), cords and plugs (11%), and transformers and power supplies (6%). Cords and plugs accounted for larger shares of civilian deaths (30%) and injuries (21%) than of fire incidents (11%) associated with home electrical distribution or lighting equipment fires. Three-fourths (74%) of 2007-2011 home structure fires involving electrical distribution or lighting equipment cited some type of electrical failure or malfunction as a factor contributing to ignition. The majority of 2007-2011 home structure fires involving electrical distribution or lighting equipment began with ignition of products and materials often found in structural areas, including wire or cable insulation (32%), structural member or framing (16%), insulation within structural area (6%), and exterior wall covering (5%). Nearly half (44%) of deaths in 2007-2011 home structure fires involving electrical
distribution or lighting equipment resulted from fires that began in a living room, family room, or den (23%) or bedroom (21%). Nearly two-thirds (64%) of deaths in 2007-2011 home structure fires involving electrical distribution or lighting equipment involved victims who were outside the area of origin when injured. By comparison 47% of fatal victims for all home structure fires were outside the area of origin when injured. Home structure fires involving electrical distribution or lighting equipment, in 2007-2011, show a winter peak similar to that for heating equipment but less pronounced. Based on special reports by the U.S. Consumer Product Safety Commission, analyzing data from the death certificate data base, in 1999 to 2011, 58 people died per year of injuries from unvented carbon monoxide from generators. Generators are the only electrical distribution or lighting equipment that burn fuel, which makes them the only electrical distribution or lighting equipment that generates carbon monoxide. Halogen lights have a higher risk of fire than incandescent lights, which have a higher risk than fluorescent lights. Compact fluorescent lights now account for more than two-thirds of all fluorescent lights in residential usage. Incandescent lights are due to be phased out in favor of fluorescent lights, but as of 2010, incandescent lights still outnumbered fluorescent lights by nearly 2-to-1 in residential usage. Safety Tips Home electrical safety begins with NFPA 70, National Electrical Code®, and related documents with special relevance to homes, notably NFPA 73, Electrical Inspection Code for Existing Dwellings. However, work on home electrical distribution or lighting equipment should only be conducted by someone qualified as an electrician. When
Home Electrical Fires, 4/13 iii NFPA Fire Analysis & Research, Quincy, MA
you are buying, selling or remodeling a home, have it inspected by a professional electrician.
Call a qualified electrician or landlord if you have
recurring problems with blowing fuses or tripping circuit breakers,
a tingling feeling when you touch an electrical appliance,
discolored or warm wall outlets, a burning smell or rubbery odor
coming from an appliance, flickering lights, sparks from an outlet. cracked or broken outlets
Arc fault circuit interrupters (AFCIs) are a type of circuit breaker that shuts off electricity when a dangerous arcing condition occurs. Consider having them installed in your home. Use a qualified electrician. Use extension cords for temporary wiring only. Consider having additional circuits or outlets added by a qualified electrician.

Home Electrical Fires, 4/13 iv NFPA Fire Analysis & Research, Quincy, MA
Home Electrical Fires, 4/13 v NFPA Fire Analysis & Research, Quincy, MA
Contents
Page Abstract Executive Summary i Table of Contents v List of Tables and Figures vii Fact Sheet xi Section 1. Electrical Fires 1 Section 2. Non-Home Electrical Fires 19 Section 3. Home Electrical Distribution or Lighting Equipment 31 Section 4. Home Wiring and Related Equipment 49 Section 5. Home Lamps, Light Fixtures, and Light Bulbs 83 Section 6. Home Cords and Plugs 119 Section 7. Home Transformers and Power Supplies 139 Section 8. Non-Home Electrical Distribution or Lighting Equipment 159 Appendix A: How National Estimates Statistics are Calculated 163 Appendix B: What Is an Electrical Fire? 171

Home Electrical Fires, 4/13 vi NFPA Fire Analysis & Research, Quincy, MA
Home Electrical Fires, 4/13 vii NFPA Fire Analysis & Research, Quincy, MA
List of Table and Figures
Page Figure 1.1 Home Fires Involving Electrical Failure or Malfunction 1 as Factor Contributing to Ignition, by Year Table 1.A Home Fires Involving Electrical Failure or Malfunction as Factor 3 Contributing to Ignition, by Factor Contributing to Ignition Table 1.B Risk Ratios for Rate of Electrical Distribution or Lighting Equipment 5 per Million Dwellings, by Age of Dwelling Table 1.1 Home Fires Involving Electrical Failure or Malfunction as 9 Factor Contributing to Ignition, by Year Table 1.2 Home Fires Involving Electrical Failure or Malfunction, 10 by Equipment Involved in Ignition Table 1.3 Home Fires Involving Electrical Failure or Malfunction, by Item First Ignited 12 Table 1.4 Home Fires Involving Electrical Failure or Malfunction, by Area of Origin 13 Table 1.5 Civilian Deaths and Injuries in Home Fires Involving Electrical Failure or 15 Malfunction vs. All Home Fires, by Victim Location Table 1.6 Civilian Deaths and Injuries in Home Fires Involving Electrical Failure or 16 Malfunction vs. All Home Fires, by Victim Activity When Injured Table 1.7 Home Fires Involving Electrical Failure or Malfunction, by Time of Day 17 Table 1.8 Home Fires Involving Electrical Failure or Malfunction, by Month 18 Figure 2.1 Non-Home Fires Involving Electrical Failure or Malfunction, 19 as Factor Contributing to Ignition, by Year Table 2.1 Non-Home Fires Involving Electrical Failure or Malfunction, 23 as Factor Contributing to Ignition, by Year Table 2.2 Non-Home Fires Involving Electrical Failure or Malfunction, 24 by Equipment Involved in Ignition Table 2.3 Non-Home Fires Involving Electrical Failure or Malfunction, 26 by Item First Ignited Table 2.4 Non-Home Fires Involving Electrical Failure or Malfunction, 27 by Area of Origin Table 2.5 Non-Home Fires Involving Electrical Failure or Malfunction, 29 by Time of Day Table 2.6 Non-Home Fires Involving Electrical Failure or Malfunction, 30 by Month Figure 3.1 Home Fires Involving Electrical Distribution or Lighting 31 Equipment, by Year Table 3.A Home Fires Involving Electrical Distribution or Lighting Equipment, 32 by Major Equipment Group Table 3.B Electrical Distribution Equipment, by Location in Path of Electricity 33 from Power Source to End Use in Home Figure 3.2 Non-Confined Home Fires and Deaths Involving 34 Electrical Distribution or Lighting Equipment, by Time of Day Figure 3.3 Non-Confined Home Fires and Deaths Involving Electrical 34 Distribution or Lighting Equipment, by Month
Home Electrical Fires, 4/13 ix NFPA Fire Analysis & Research, Quincy, MA
List of Table and Figures (Continued)
Page Table 5.B Injuries Involving Lamps, Light Fixtures, and Light Bulbs Reported to 87 Hospital Emergency Rooms Table 5.1 Home Fires Involving Lamps, Light Fixtures, and Light Bulbs, by Year 89 Table 5.2 Home Fires Involving Lamps, Light Fixtures, and Light Bulbs, by Factor 90 Contributing to Ignition Table 5.3 Home Fires Involving Lamps, Light Fixtures, and Light Bulbs, by Item 102 First Ignited Table 5.4 Home Fires Involving Lamps, Light Fixtures, and Light Bulbs, by Area of 110 Origin Figure 6.1 Home Fires Involving Cords and Plugs, by Year 119 Table 6.A Home Fires Involving Cords and Plugs, by Specific Type of Equipment 120 Table 6.1 Home Fires Involving Cords and Plugs, by Year 122 Table 6.2 Home Fires Involving Cords and Plugs, by Factor Contributing to Ignition 123 Table 6.3 Home Fires Involving Cords and Plugs, by Item First Ignited 128 Table 6.4 Home Fires Involving Cords and Plugs, by Area of Origin 133 Figure 7.1 Home Fires Involving Transformers and Power Supplies, by Year 139 Table 7.A Home Fires Involving Transformers and Power Supplies, by Specific 140 Type of Equipment Table 7.1 Home Fires Involving Transformers and Power Supplies, by Year 143 Table 7.2 Home Fires Involving Transformers and Power Supplies, by Factor 144 Contributing to Ignition Table 7.3 Home Fires Involving Transformers and Power Supplies, by Item First 149 Ignited Table 7.4 Home Fires Involving Transformers and Power Supplies, by Area of Origin 153 Table 8.1 Non-Home Fires Involving Electrical Distribution or Lighting Equipment, 160 by Type of Equipment Figure A.1. Fires Originally Collected in NFIRS 5.0, by Year 165

Home Electrical Fires, 4/13 x NFPA Fire Analysis & Research, Quincy, MA
NFPA Fire Analysis &Research
Home Electrical Fires, 4/13 xi NFPA Fire Analysis and Research, Quincy, MA.
Home Electrical Fires Fact Sheet
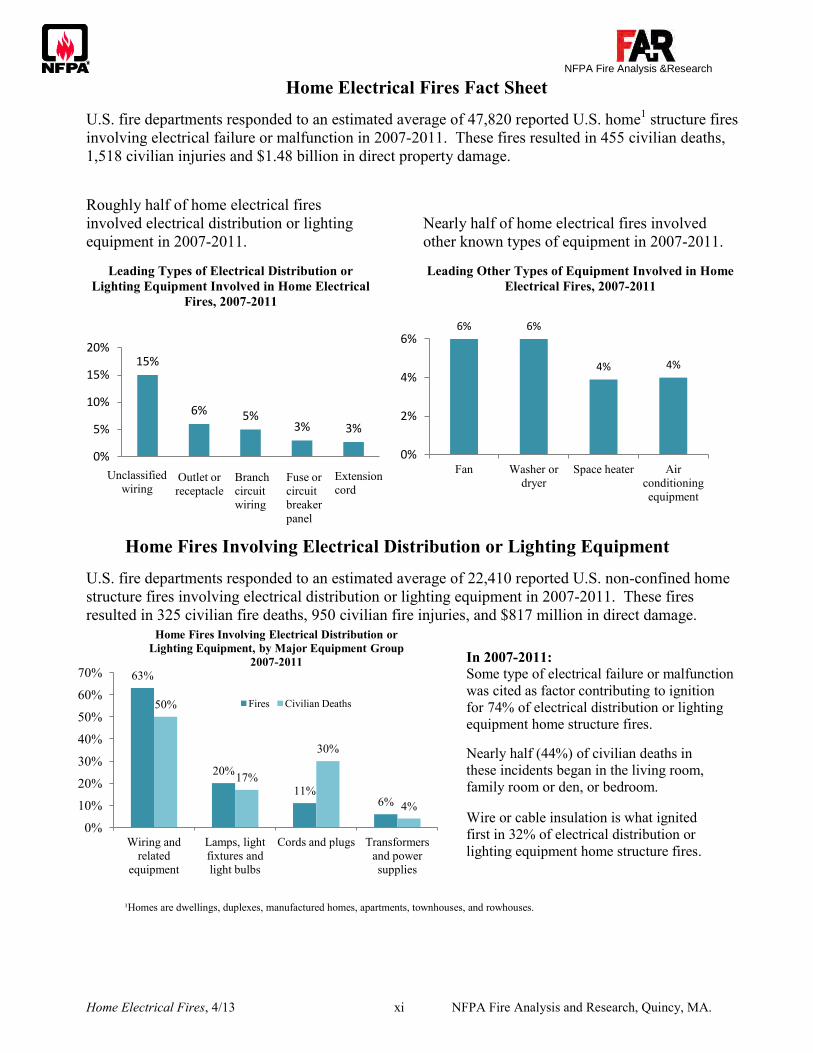
U.S. fire departments responded to an estimated average of 47,820 reported U.S. home1 structure fires involving electrical failure or malfunction in 2007-2011. These fires resulted in 455 civilian deaths, 1,518 civilian injuries and $1.48 billion in direct property damage. Roughly half of home electrical fires involved electrical distribution or lighting equipment in 2007-2011.
Leading Types of Electrical Distribution or Lighting Equipment Involved in Home Electrical
Fires, 2007-2011 .
Nearly half of home electrical fires involved other known types of equipment in 2007-2011. Leading Other Types of Equipment Involved in Home
Electrical Fires, 2007-2011
Home Fires Involving Electrical Distribution or Lighting Equipment U.S. fire departments responded to an estimated average of 22,410 reported U.S. non-confined home
structure fires involving electrical distribution or lighting equipment in 2007-2011. These fires resulted in 325 civilian fire deaths, 950 civilian fire injuries, and $817 million in direct damage.
In 2007-2011: Some type of electrical failure or malfunction was cited as factor contributing to ignition for 74% of electrical distribution or lighting equipment home structure fires. Nearly half (44%) of civilian deaths in these incidents began in the living room, family room or den, or bedroom. Wire or cable insulation is what ignited first in 32% of electrical distribution or lighting equipment home structure fires.
¹Homes are dwellings, duplexes, manufactured homes, apartments, townhouses, and rowhouses.
63%
20%
11% 6%
50%
17%
30%
4%
0%
10%
20%
30%
40%
50%
60%
70%
Wiring and related
equipment
Lamps, light fixtures and light bulbs
Cords and plugs Transformers and power supplies
Home Fires Involving Electrical Distribution or Lighting Equipment, by Major Equipment Group
2007-2011
Fires Civilian Deaths
6% 6%
4% 4%
0%
2%
4%
6%
Fan Washer or dryer
Space heater Air conditioning equipment
15%
6% 5% 3% 3%
0%
5%
10%
15%
20%
Unclassified wiring
Outlet or receptacle
Branch circuit wiring
Fuse or circuit breaker panel
Extension cord
NFPA’s Fire Safety Resources
Home Electrical Fires, 4/13 xii NFPA Fire Analysis and Research, Quincy, MA
Advocacy
Public Education
Codes & Standards
Research
Properly installed and maintained smoke alarms are necessary to provide a warning of any fire to all occupants. You can find out more information about smoke alarms here: NFPA Smoke Alarm Information Home fire sprinkler systems provide even greater protection. These systems respond quickly to reduce the heat, flames, and smoke from a fire until help arrives. More information about home fire sprinklers may be found at www.firesprinklerinitiative.org Simply put, smoke alarms and fire sprinklers save lives.
For consumers: NFPA has consumer safety information regarding causes, escape planning, fire & safety equipment, and many other topics. Sparky.org has important For Kids for kids delivered via fun games, activities, and cartoons. For public educators: Resources on fire safety education programs, educational messaging, grants & awards, and many other topics.
NFPA also develops, publishes, and disseminates more than 300 consensus codes and standards intended to minimize the possibility and effects of fire and other risks. Among these are: NFPA1: Fire Code: NFPA 101: Life Safety Code®:
NFPA 72, National Fire Alarm Code®
NFPA´s wealth of fire-related research includes investigations of technically significant fire incidents, fire data analysis, and the Charles S. Morgan Technical Library, one of the most comprehensive fire literature collections in the world. In addition, NFPA´s Fire Protection Research Foundation is a source of independent fire test data. Find out more at: www.nfpa.org/research
Home Electrical Fires, 4/13 1 NFPA Fire Analysis & Research, Quincy, MA
Section 1. Home Electrical Fires
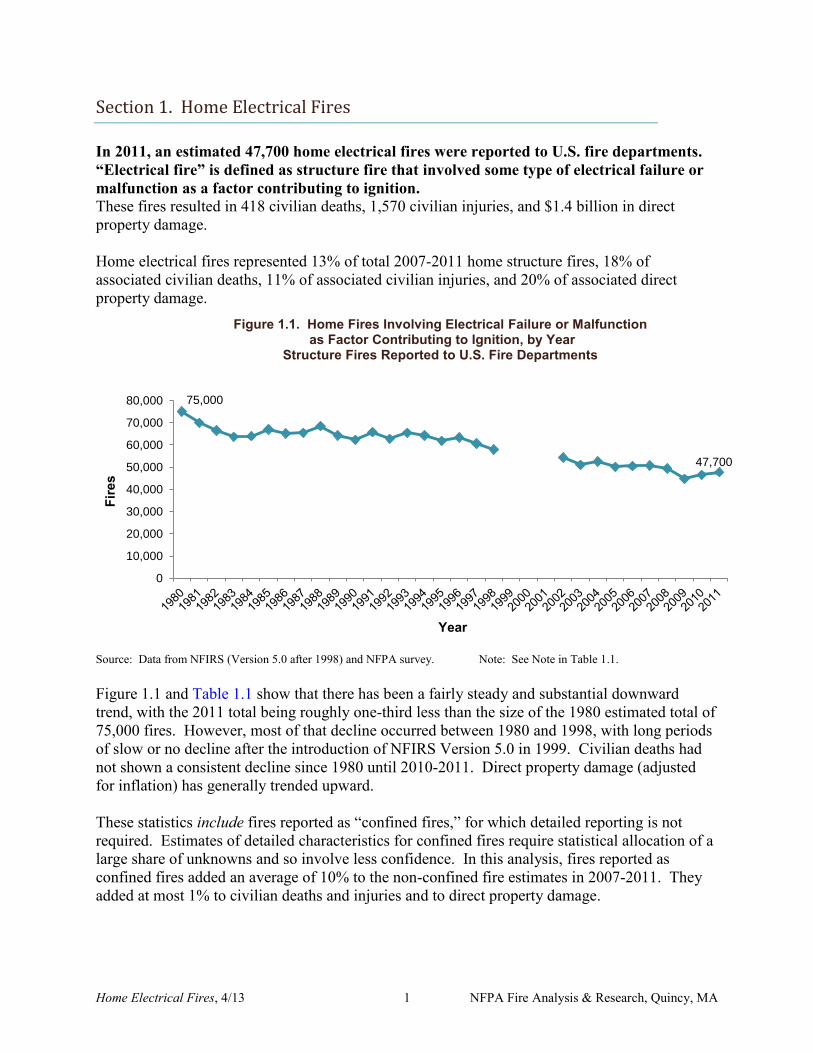
In 2011, an estimated 47,700 home electrical fires were reported to U.S. fire departments. “Electrical fire” is defined as structure fire that involved some type of electrical failure or malfunction as a factor contributing to ignition. These fires resulted in 418 civilian deaths, 1,570 civilian injuries, and $1.4 billion in direct property damage. Home electrical fires represented 13% of total 2007-2011 home structure fires, 18% of associated civilian deaths, 11% of associated civilian injuries, and 20% of associated direct property damage.
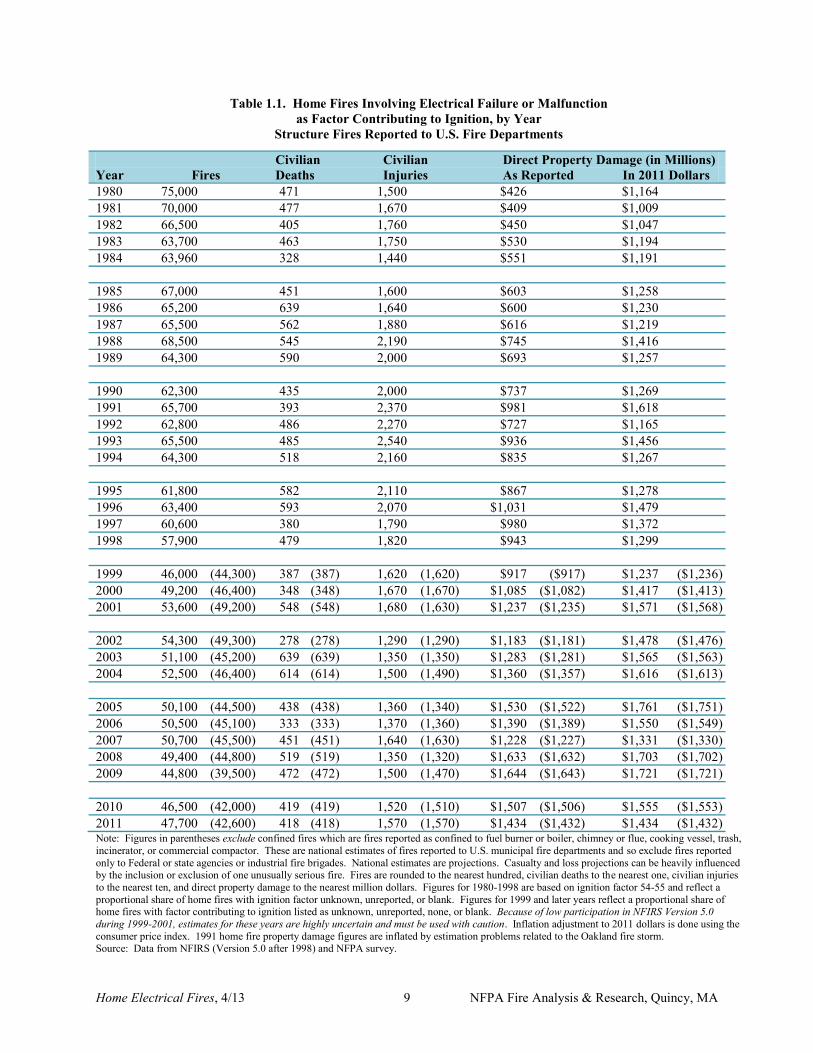
Source: Data from NFIRS (Version 5.0 after 1998) and NFPA survey. Note: See Note in Table 1.1. Figure 1.1 and Table 1.1 show that there has been a fairly steady and substantial downward trend, with the 2011 total being roughly one-third less than the size of the 1980 estimated total of 75,000 fires. However, most of that decline occurred between 1980 and 1998, with long periods of slow or no decline after the introduction of NFIRS Version 5.0 in 1999. Civilian deaths had not shown a consistent decline since 1980 until 2010-2011. Direct property damage (adjusted for inflation) has generally trended upward. These statistics include fires reported as “confined fires,” for which detailed reporting is not required. Estimates of detailed characteristics for confined fires require statistical allocation of a large share of unknowns and so involve less confidence. In this analysis, fires reported as confined fires added an average of 10% to the non-confined fire estimates in 2007-2011. They added at most 1% to civilian deaths and injuries and to direct property damage.
75,000
47,700
0
10,000
20,000
30,000
40,000
50,000
60,000
70,000
80,000
Fire
s
Year
Figure 1.1. Home Fires Involving Electrical Failure or Malfunction as Factor Contributing to Ignition, by Year
Structure Fires Reported to U.S. Fire Departments
Home Electrical Fires, 4/13 2 NFPA Fire Analysis & Research, Quincy, MA
Data Sources, Definitions and Conventions Used in this Report
Unless otherwise specified, the statistics in this analysis are national estimates of fires reported to U.S. municipal fire departments and so exclude fires reported only to federal or state agencies or industrial fire brigades. The 2007-2011 estimates are projections based on the detailed information collected in Version 5.0 of the U.S. Fire Administration’s National Fire Incident Reporting System (NFIRS 5.0) and the National Fire Protection Association’s (NFPA’s) annual fire department experience survey. Except for property use and incident type, fires with unknown or unreported data were allocated proportionally in calculations of national estimates. What is included in NFPA’s definition of “home?”
detached dwellings, duplexes, and manufactured housing, and apartments, tenements, and flats, townhouses, rowhouses, and other multi-family
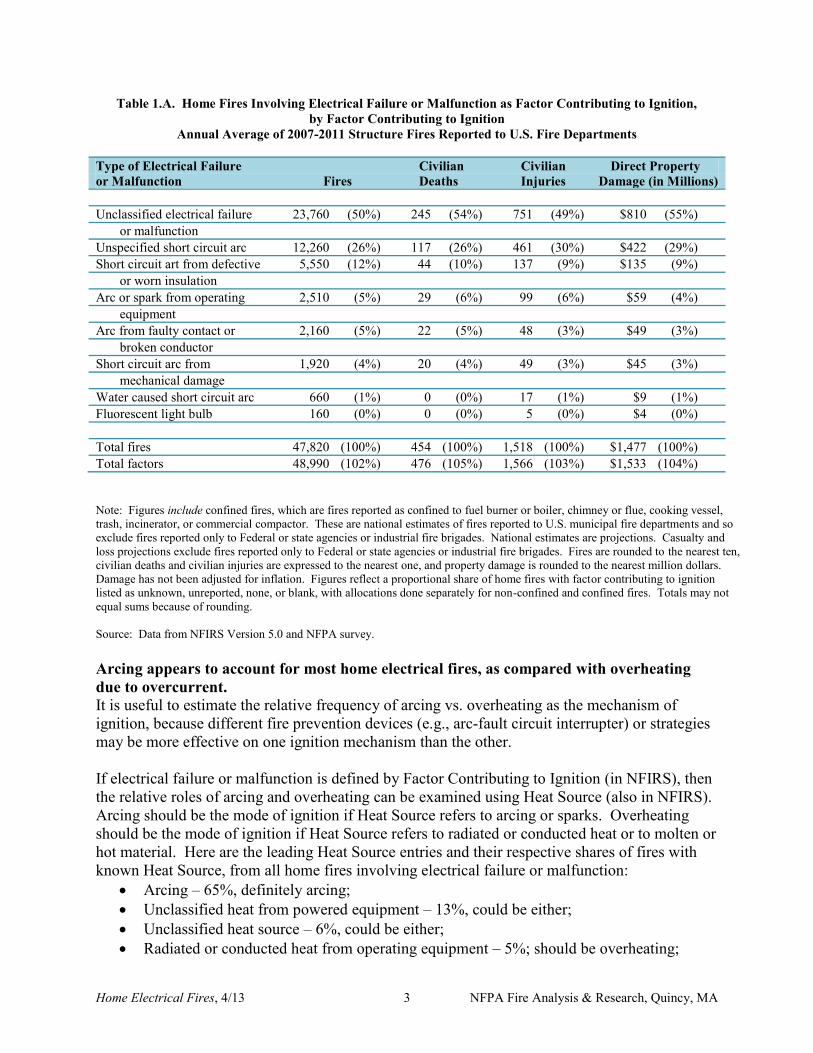
housing, regardless of ownership. In general, any fire that occurs in or on a structure is considered a structure fire, even if the fire was limited to contents and the building itself was not damaged. What are” confined” and “non-confined” fires? NFIRS 5.0 includes a category of structure fires collectively referred to as “confined fires,” identified by incident type. These include confined cooking fires, confined chimney or flue fires, confined trash fires, confined fuel burner or boiler fires, confined commercial compactor fires, and confined incinerator fires (incident type 113-118). Losses are generally minimal in these fires, which by definition, are assumed to have been limited to the object of origin. Although causal data is not required for these fires, it is sometimes present. Confined and non-confined fires are analyzed separately and then summed in any analysis where both types of fires are included in the estimates. Additional information Casualty and loss projections can be heavily influenced by the inclusion or exclusion of one unusually serious fire. Except for trend tables, property damage has not been adjusted for inflation. Fires are rounded to the nearest hundred, civilian deaths and injuries are generally rounded to the nearest one and direct property damage is rounded to the nearest million dollars. Additional details on the methodology may be found in Appendix A. Most (76%) reported home structure fires involving electrical failure or malfunction were reported with few or no details on failure mode. Table 1.A shows the estimates for different types of electrical failure or malfunction. The two leading types were unclassified electrical failure or malfunction (50%) and unspecified short circuit arc (26%). The leading factor with specific details was short circuit arc from defective or worn insulation (12%).
Home Electrical Fires, 4/13 3 NFPA Fire Analysis & Research, Quincy, MA
Table 1.A. Home Fires Involving Electrical Failure or Malfunction as Factor Contributing to Ignition, by Factor Contributing to Ignition
Annual Average of 2007-2011 Structure Fires Reported to U.S. Fire Departments
Type of Electrical Failure Civilian Civilian Direct Property or Malfunction Fires Deaths Injuries Damage (in Millions) Unclassified electrical failure 23,760 (50%) 245 (54%) 751 (49%) $810 (55%) or malfunction Unspecified short circuit arc 12,260 (26%) 117 (26%) 461 (30%) $422 (29%) Short circuit art from defective 5,550 (12%) 44 (10%) 137 (9%) $135 (9%) or worn insulation Arc or spark from operating 2,510 (5%) 29 (6%) 99 (6%) $59 (4%) equipment Arc from faulty contact or 2,160 (5%) 22 (5%) 48 (3%) $49 (3%) broken conductor Short circuit arc from 1,920 (4%) 20 (4%) 49 (3%) $45 (3%) mechanical damage Water caused short circuit arc 660 (1%) 0 (0%) 17 (1%) $9 (1%) Fluorescent light bulb 160 (0%) 0 (0%) 5 (0%) $4 (0%) Total fires 47,820 (100%) 454 (100%) 1,518 (100%) $1,477 (100%) Total factors 48,990 (102%) 476 (105%) 1,566 (103%) $1,533 (104%) Note: Figures include confined fires, which are fires reported as confined to fuel burner or boiler, chimney or flue, cooking vessel, trash, incinerator, or commercial compactor. These are national estimates of fires reported to U.S. municipal fire departments and so exclude fires reported only to Federal or state agencies or industrial fire brigades. National estimates are projections. Casualty and loss projections exclude fires reported only to Federal or state agencies or industrial fire brigades. Fires are rounded to the nearest ten, civilian deaths and civilian injuries are expressed to the nearest one, and property damage is rounded to the nearest million dollars. Damage has not been adjusted for inflation. Figures reflect a proportional share of home fires with factor contributing to ignition listed as unknown, unreported, none, or blank, with allocations done separately for non-confined and confined fires. Totals may not equal sums because of rounding. Source: Data from NFIRS Version 5.0 and NFPA survey. Arcing appears to account for most home electrical fires, as compared with overheating due to overcurrent. It is useful to estimate the relative frequency of arcing vs. overheating as the mechanism of ignition, because different fire prevention devices (e.g., arc-fault circuit interrupter) or strategies may be more effective on one ignition mechanism than the other. If electrical failure or malfunction is defined by Factor Contributing to Ignition (in NFIRS), then the relative roles of arcing and overheating can be examined using Heat Source (also in NFIRS). Arcing should be the mode of ignition if Heat Source refers to arcing or sparks. Overheating should be the mode of ignition if Heat Source refers to radiated or conducted heat or to molten or hot material. Here are the leading Heat Source entries and their respective shares of fires with known Heat Source, from all home fires involving electrical failure or malfunction:
Arcing – 65%, definitely arcing; Unclassified heat from powered equipment – 13%, could be either; Unclassified heat source – 6%, could be either; Radiated or conducted heat from operating equipment – 5%; should be overheating;
Home Electrical Fires, 4/13 4 NFPA Fire Analysis & Research, Quincy, MA
Spark, ember or flame from operating equipment – 4%, could be either; Unclassified hot or smoldering object – 4%, probably overheating; Heat or spark from friction – 1%, could be either; Molten or hot material – 1%, very probably overheating.
These statistics suggest a 6- or 7-to-1 ratio of arcing fires to overheating fires based on heat sources that appear likely to be one or the other. If everything that is not specifically arcing is overheating, then the ratio is still 2-to-1 arcing versus overheating. Fires due to overheating caused by overcurrent can be prevented by overcurrent protection devices, principally circuit breakers and fuses, while fires due to arcing can be prevented by arc fault circuit interrupters (AFCIs). The former has been present in all, or nearly all, homes with electrical service since electrical service has been available. The latter is a technology developed more recently and is still in very limited use. A 1983 special study by the National Institute of Standards and Technology (then still called the National Bureau of Standards) examined 80 cases of one- and two-family dwelling electrical distribution or lighting equipment fires for which the type and performance of overcurrent protection was known and reported.1 None of the 43 cases with circuit breakers and 11% of the cases with fuses were deemed to involve circumstances where the overcurrent protection device should have operated to prevent ignition. The U.S. Consumer Product Safety Commission which had arranged and sponsored the collection of the data analyzed by NIST, arranged and sponsored a second phase of data collection in the late 1980s and performed the analysis themselves. One finding was a strong relationship between age of dwelling and the rate of electrical distribution and lighting equipment fires per million dwellings, as shown in Table 1.B. The two analyses identified three primary factors in relationship between age of dwelling and risk.
In the 1990 CPSC analysis, no dwelling built later than 1965 used fuses rather than circuit breakers, whereas about half the dwellings built before 1965 used fuses. As of 2011, roughly 41% of the nation’s occupied detached single-family dwellings had been built before 1965, which suggests dwellings with fuses now account for at most one-fifth of total dwellings. 2
In the 1983 NIST analysis, no dwelling built later than 1950 used knob and tube wiring whereas about one-third of dwellings built before 1950 used knob and tube wiring. As of 2011, 22% of the nation’s occupied detached single-family dwellings were built before 1950, which suggests dwellings with knob and tube wiring now account for less than one-tenth of total dwellings.
1 CPSC analysis of 141 fires, as reported in Linda E. Smith and Dennis McCoskrie, “What Causes Wiring Fires in Residences?,” Fire Journal, January/February 1990, pp. 19-24, 69; NIST analysis of 101 fires, as reported in John R. Hall, Jr., Richard Bukowski, and Alan Gomberg, Analysis of Electrical Fire Investigations in Ten Cities, NBSIR 83-2803, National Bureau of Standards, December 1983. 2 American Housing Survey 2011, U.S. Department of Commerce and U.S. Department of Housing and Urban Development, 2012, Table C-12-AO, accessed at http://www.census.gov/housing/ahs/data/national.html.
Home Electrical Fires, 4/13 5 NFPA Fire Analysis & Research, Quincy, MA
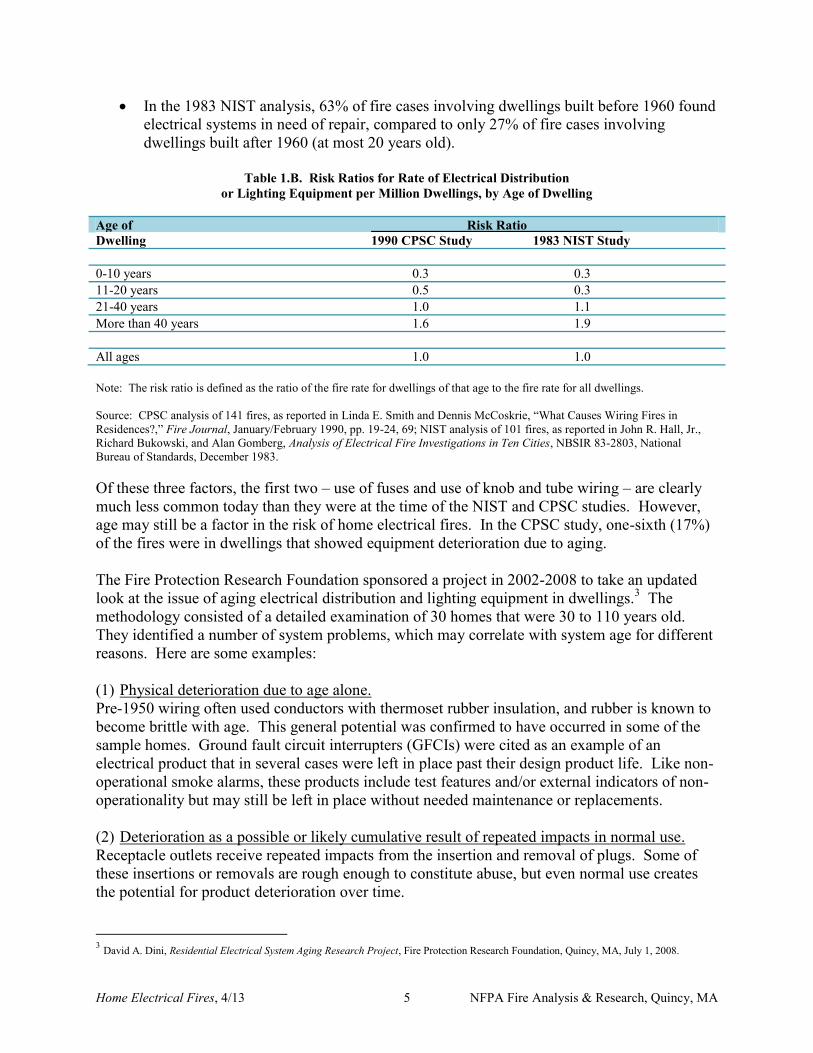
In the 1983 NIST analysis, 63% of fire cases involving dwellings built before 1960 found electrical systems in need of repair, compared to only 27% of fire cases involving dwellings built after 1960 (at most 20 years old).
Table 1.B. Risk Ratios for Rate of Electrical Distribution
or Lighting Equipment per Million Dwellings, by Age of Dwelling
Age of Risk Ratio Dwelling 1990 CPSC Study 1983 NIST Study 0-10 years 0.3 0.3 11-20 years 0.5 0.3 21-40 years 1.0 1.1 More than 40 years 1.6 1.9 All ages 1.0 1.0 Note: The risk ratio is defined as the ratio of the fire rate for dwellings of that age to the fire rate for all dwellings. Source: CPSC analysis of 141 fires, as reported in Linda E. Smith and Dennis McCoskrie, “What Causes Wiring Fires in Residences?,” Fire Journal, January/February 1990, pp. 19-24, 69; NIST analysis of 101 fires, as reported in John R. Hall, Jr., Richard Bukowski, and Alan Gomberg, Analysis of Electrical Fire Investigations in Ten Cities, NBSIR 83-2803, National Bureau of Standards, December 1983. Of these three factors, the first two – use of fuses and use of knob and tube wiring – are clearly much less common today than they were at the time of the NIST and CPSC studies. However, age may still be a factor in the risk of home electrical fires. In the CPSC study, one-sixth (17%) of the fires were in dwellings that showed equipment deterioration due to aging. The Fire Protection Research Foundation sponsored a project in 2002-2008 to take an updated look at the issue of aging electrical distribution and lighting equipment in dwellings.3 The methodology consisted of a detailed examination of 30 homes that were 30 to 110 years old. They identified a number of system problems, which may correlate with system age for different reasons. Here are some examples: (1) Physical deterioration due to age alone. Pre-1950 wiring often used conductors with thermoset rubber insulation, and rubber is known to become brittle with age. This general potential was confirmed to have occurred in some of the sample homes. Ground fault circuit interrupters (GFCIs) were cited as an example of an electrical product that in several cases were left in place past their design product life. Like non-operational smoke alarms, these products include test features and/or external indicators of non-operationality but may still be left in place without needed maintenance or replacements.
(2) Deterioration as a possible or likely cumulative result of repeated impacts in normal use. Receptacle outlets receive repeated impacts from the insertion and removal of plugs. Some of these insertions or removals are rough enough to constitute abuse, but even normal use creates the potential for product deterioration over time. 3 David A. Dini, Residential Electrical System Aging Research Project, Fire Protection Research Foundation, Quincy, MA, July 1, 2008.
Home Electrical Fires, 4/13 6 NFPA Fire Analysis & Research, Quincy, MA
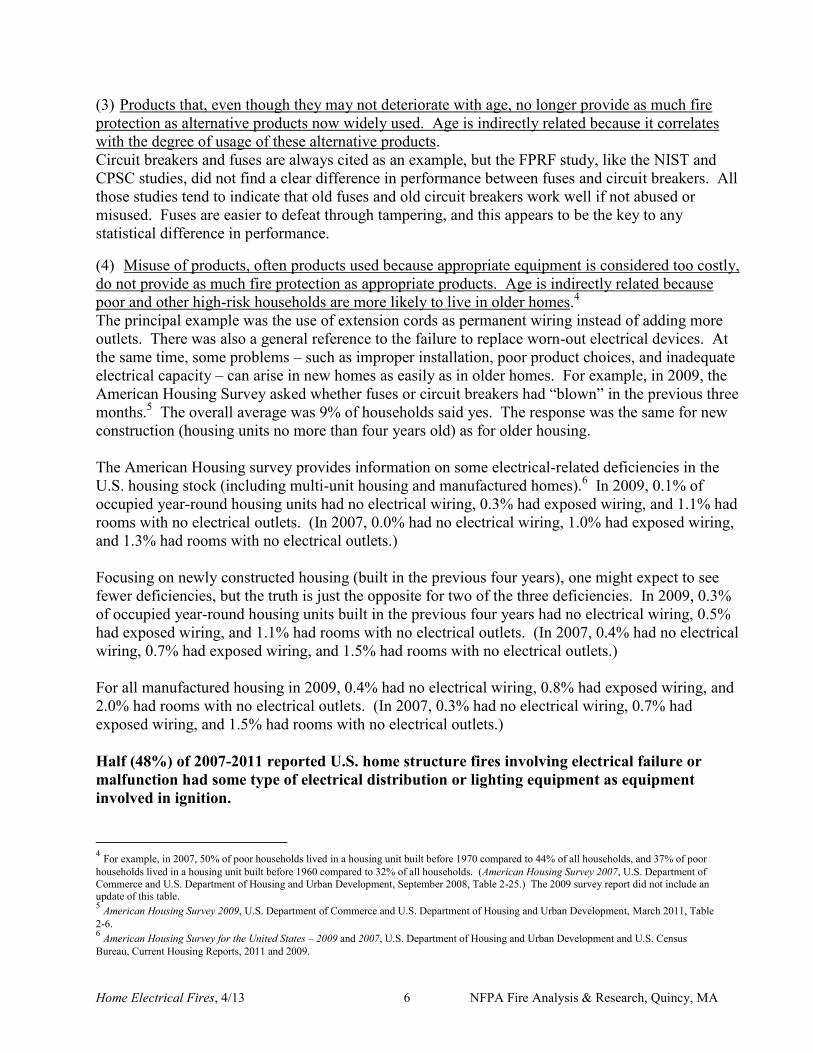
(3) Products that, even though they may not deteriorate with age, no longer provide as much fire protection as alternative products now widely used. Age is indirectly related because it correlates with the degree of usage of these alternative products. Circuit breakers and fuses are always cited as an example, but the FPRF study, like the NIST and CPSC studies, did not find a clear difference in performance between fuses and circuit breakers. All those studies tend to indicate that old fuses and old circuit breakers work well if not abused or misused. Fuses are easier to defeat through tampering, and this appears to be the key to any statistical difference in performance.
(4) Misuse of products, often products used because appropriate equipment is considered too costly, do not provide as much fire protection as appropriate products. Age is indirectly related because poor and other high-risk households are more likely to live in older homes.4 The principal example was the use of extension cords as permanent wiring instead of adding more outlets. There was also a general reference to the failure to replace worn-out electrical devices. At the same time, some problems – such as improper installation, poor product choices, and inadequate electrical capacity – can arise in new homes as easily as in older homes. For example, in 2009, the American Housing Survey asked whether fuses or circuit breakers had “blown” in the previous three months.5 The overall average was 9% of households said yes. The response was the same for new construction (housing units no more than four years old) as for older housing. The American Housing survey provides information on some electrical-related deficiencies in the U.S. housing stock (including multi-unit housing and manufactured homes).6 In 2009, 0.1% of occupied year-round housing units had no electrical wiring, 0.3% had exposed wiring, and 1.1% had rooms with no electrical outlets. (In 2007, 0.0% had no electrical wiring, 1.0% had exposed wiring, and 1.3% had rooms with no electrical outlets.) Focusing on newly constructed housing (built in the previous four years), one might expect to see fewer deficiencies, but the truth is just the opposite for two of the three deficiencies. In 2009, 0.3% of occupied year-round housing units built in the previous four years had no electrical wiring, 0.5% had exposed wiring, and 1.1% had rooms with no electrical outlets. (In 2007, 0.4% had no electrical wiring, 0.7% had exposed wiring, and 1.5% had rooms with no electrical outlets.) For all manufactured housing in 2009, 0.4% had no electrical wiring, 0.8% had exposed wiring, and 2.0% had rooms with no electrical outlets. (In 2007, 0.3% had no electrical wiring, 0.7% had exposed wiring, and 1.5% had rooms with no electrical outlets.) Half (48%) of 2007-2011 reported U.S. home structure fires involving electrical failure or malfunction had some type of electrical distribution or lighting equipment as equipment involved in ignition.
4 For example, in 2007, 50% of poor households lived in a housing unit built before 1970 compared to 44% of all households, and 37% of poor households lived in a housing unit built before 1960 compared to 32% of all households. (American Housing Survey 2007, U.S. Department of Commerce and U.S. Department of Housing and Urban Development, September 2008, Table 2-25.) The 2009 survey report did not include an update of this table. 5 American Housing Survey 2009, U.S. Department of Commerce and U.S. Department of Housing and Urban Development, March 2011, Table 2-6. 6 American Housing Survey for the United States – 2009 and 2007, U.S. Department of Housing and Urban Development and U.S. Census Bureau, Current Housing Reports, 2011 and 2009.
Home Electrical Fires, 4/13 7 NFPA Fire Analysis & Research, Quincy, MA
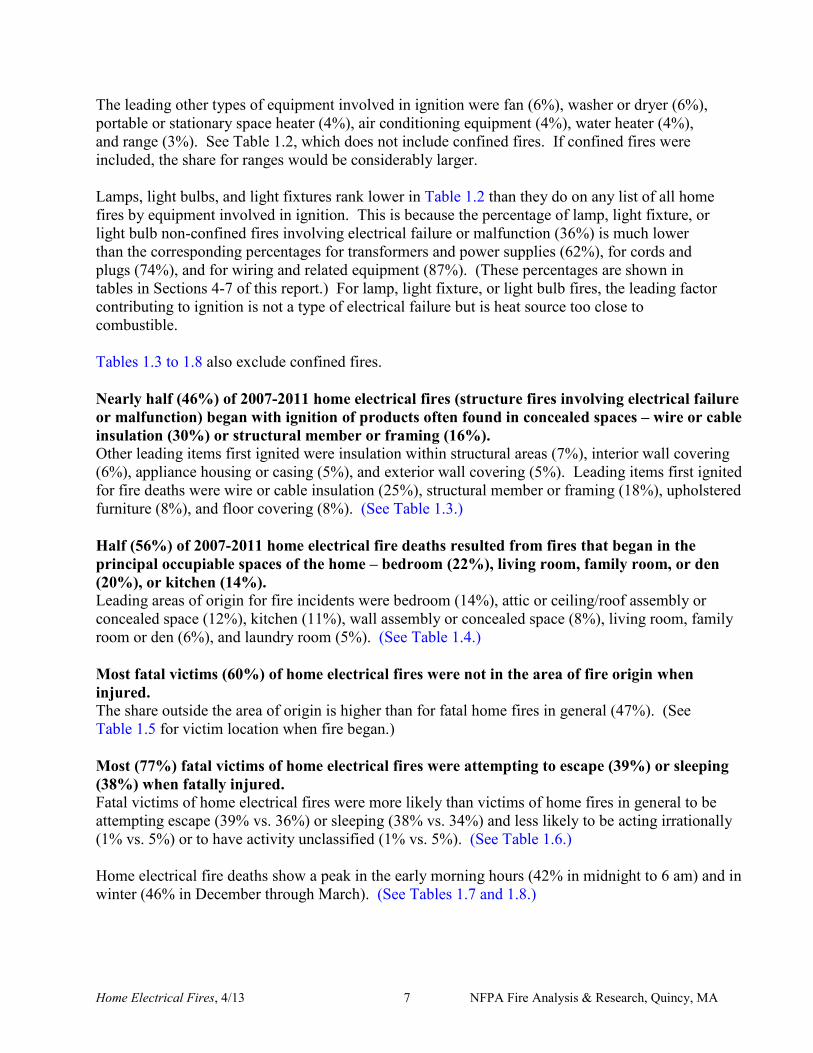
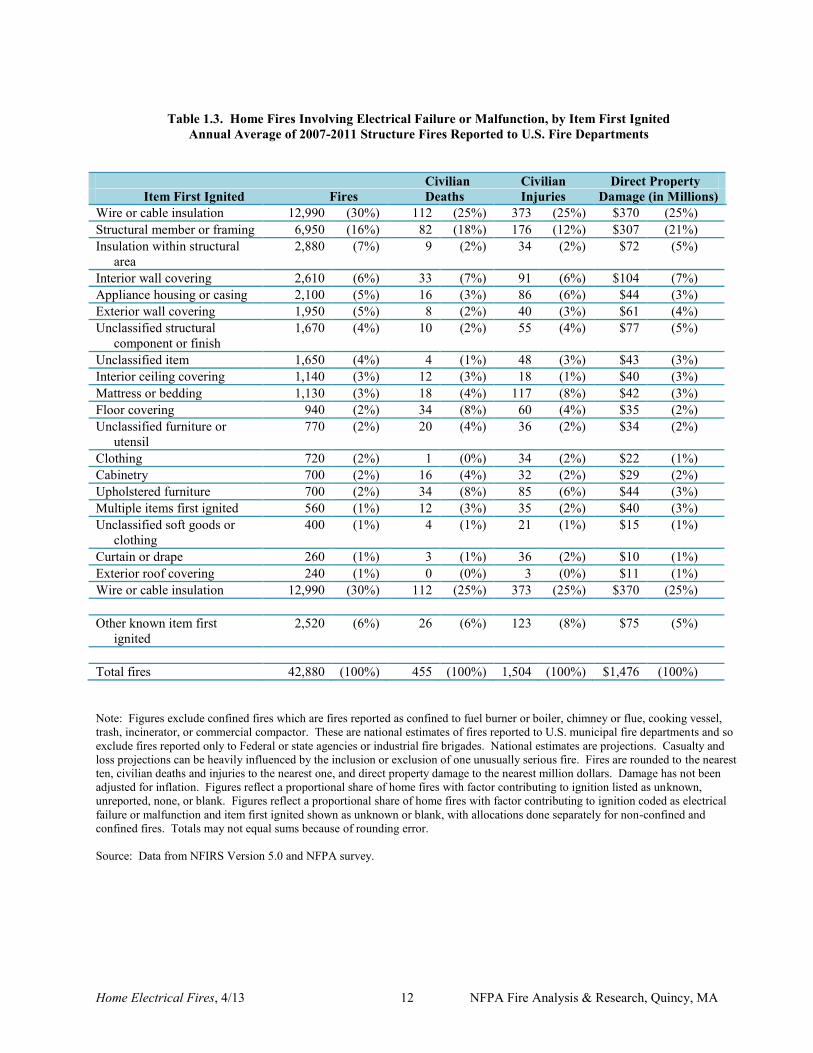
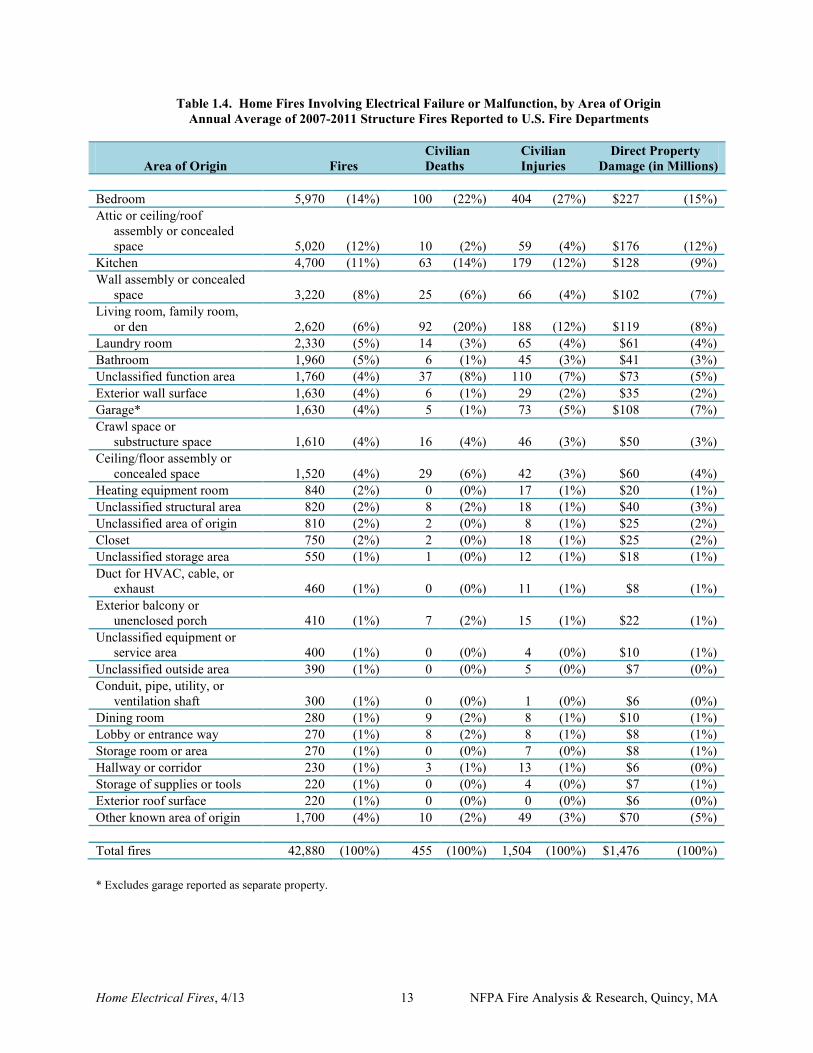
The leading other types of equipment involved in ignition were fan (6%), washer or dryer (6%), portable or stationary space heater (4%), air conditioning equipment (4%), water heater (4%), and range (3%). See Table 1.2, which does not include confined fires. If confined fires were included, the share for ranges would be considerably larger. Lamps, light bulbs, and light fixtures rank lower in Table 1.2 than they do on any list of all home fires by equipment involved in ignition. This is because the percentage of lamp, light fixture, or light bulb non-confined fires involving electrical failure or malfunction (36%) is much lower than the corresponding percentages for transformers and power supplies (62%), for cords and plugs (74%), and for wiring and related equipment (87%). (These percentages are shown in tables in Sections 4-7 of this report.) For lamp, light fixture, or light bulb fires, the leading factor contributing to ignition is not a type of electrical failure but is heat source too close to combustible. Tables 1.3 to 1.8 also exclude confined fires. Nearly half (46%) of 2007-2011 home electrical fires (structure fires involving electrical failure or malfunction) began with ignition of products often found in concealed spaces – wire or cable insulation (30%) or structural member or framing (16%). Other leading items first ignited were insulation within structural areas (7%), interior wall covering (6%), appliance housing or casing (5%), and exterior wall covering (5%). Leading items first ignited for fire deaths were wire or cable insulation (25%), structural member or framing (18%), upholstered furniture (8%), and floor covering (8%). (See Table 1.3.) Half (56%) of 2007-2011 home electrical fire deaths resulted from fires that began in the principal occupiable spaces of the home – bedroom (22%), living room, family room, or den (20%), or kitchen (14%). Leading areas of origin for fire incidents were bedroom (14%), attic or ceiling/roof assembly or concealed space (12%), kitchen (11%), wall assembly or concealed space (8%), living room, family room or den (6%), and laundry room (5%). (See Table 1.4.) Most fatal victims (60%) of home electrical fires were not in the area of fire origin when injured. The share outside the area of origin is higher than for fatal home fires in general (47%). (See Table 1.5 for victim location when fire began.) Most (77%) fatal victims of home electrical fires were attempting to escape (39%) or sleeping (38%) when fatally injured. Fatal victims of home electrical fires were more likely than victims of home fires in general to be attempting escape (39% vs. 36%) or sleeping (38% vs. 34%) and less likely to be acting irrationally (1% vs. 5%) or to have activity unclassified (1% vs. 5%). (See Table 1.6.) Home electrical fire deaths show a peak in the early morning hours (42% in midnight to 6 am) and in winter (46% in December through March). (See Tables 1.7 and 1.8.)
Home Electrical Fires, 4/13 8 NFPA Fire Analysis & Research, Quincy, MA
Other reports provide statistics on non-fire incidents and harm due to electricity. See the following reports:
Jennifer D. Flynn, Non-Fire Electrical Wiring and Equipment Problem Incidents Reported to U.S. Fire Departments, NFPA Fire Analysis and Research Division, Quincy, MA, August 2007 – Analyzes 316,000 reported 2003 incidents, such as power line down, that did not involve fire or rescue.
Jennifer D. Flynn, Non-Fire Electrical Rescue Incidents Reported to Fire Departments in 2003, NFPA Fire Analysis and Research Division, Quincy, MA, August 2007 – Analyzes 2,800 reported incidents, including electrocutions and people trapped by power lines.
John R. Hall, Jr., Deaths and Injuries Due to Non-Fire Burns, NFPA Fire Analysis and Research Division, Quincy, MA, April 2009 – Estimates 1991-2007 electrical burn injuries reported to U.S. hospital emergency rooms and 1980-2005 unintentional-injury deaths by electrical current, including deaths specifically attributable to electric transmission lines or to lightning.
Also of interest is the following:
Robert Garrett and Susan B. Kyle, An Evaluation of the U.S. Consumer Product Safety Commission’s Electrocution Reduction Program, CPSC Office of Planning and Evaluation, Bethesda, MD, November 2002.
Safety Tips
Home electrical safety begins with NFPA 70, National Electrical Code® and related documents with special relevance to homes, notable NFPA 73, Electrical Inspection Code for Existing Dwellings. However, work on home electrical distribution or lighting equipment should only be conducted by someone qualified as an electrician. When you are buying, selling or remodeling a home, have it inspected by a professional electrician.
Call a qualified electrician or landlord if you have recurring problems with blowing fuses or tripping circuit breakers, a tingling feeling when you touch an electrical appliance, discolored or warm wall outlets, a burning smell or rubbery odor coming from an appliance, flickering lights, sparks from an outlet, cracked or broken outlets.
Arc fault circuit interrupters (AFCIs) are a type of circuit breaker that shuts off electricity
when a dangerous arcing condition occurs. Consider having them installed in your home. Use a qualified electrician.
More of NFPA’s electrical safety information is available on our website at www.nfpa.org/electricalfires.
Home Electrical Fires, 4/13 9 NFPA Fire Analysis & Research, Quincy, MA
Table 1.1. Home Fires Involving Electrical Failure or Malfunction as Factor Contributing to Ignition, by Year
Structure Fires Reported to U.S. Fire Departments
Civilian Civilian Direct Property Damage (in Millions) Year Fires Deaths Injuries As Reported In 2011 Dollars 1980 75,000 471 1,500 $426 $1,164 1981 70,000 477 1,670 $409 $1,009 1982 66,500 405 1,760 $450 $1,047 1983 63,700 463 1,750 $530 $1,194 1984 63,960 328 1,440 $551 $1,191 1985 67,000 451 1,600 $603 $1,258 1986 65,200 639 1,640 $600 $1,230 1987 65,500 562 1,880 $616 $1,219 1988 68,500 545 2,190 $745 $1,416 1989 64,300 590 2,000 $693 $1,257 1990 62,300 435 2,000 $737 $1,269 1991 65,700 393 2,370 $981 $1,618 1992 62,800 486 2,270 $727 $1,165 1993 65,500 485 2,540 $936 $1,456 1994 64,300 518 2,160 $835 $1,267 1995 61,800 582 2,110 $867 $1,278 1996 63,400 593 2,070 $1,031 $1,479 1997 60,600 380 1,790 $980 $1,372 1998 57,900 479 1,820 $943 $1,299 1999 46,000 (44,300) 387 (387) 1,620 (1,620) $917 ($917) $1,237 ($1,236) 2000 49,200 (46,400) 348 (348) 1,670 (1,670) $1,085 ($1,082) $1,417 ($1,413) 2001 53,600 (49,200) 548 (548) 1,680 (1,630) $1,237 ($1,235) $1,571 ($1,568) 2002 54,300 (49,300) 278 (278) 1,290 (1,290) $1,183 ($1,181) $1,478 ($1,476) 2003 51,100 (45,200) 639 (639) 1,350 (1,350) $1,283 ($1,281) $1,565 ($1,563) 2004 52,500 (46,400) 614 (614) 1,500 (1,490) $1,360 ($1,357) $1,616 ($1,613) 2005 50,100 (44,500) 438 (438) 1,360 (1,340) $1,530 ($1,522) $1,761 ($1,751) 2006 50,500 (45,100) 333 (333) 1,370 (1,360) $1,390 ($1,389) $1,550 ($1,549) 2007 50,700 (45,500) 451 (451) 1,640 (1,630) $1,228 ($1,227) $1,331 ($1,330) 2008 49,400 (44,800) 519 (519) 1,350 (1,320) $1,633 ($1,632) $1,703 ($1,702) 2009 44,800 (39,500) 472 (472) 1,500 (1,470) $1,644 ($1,643) $1,721 ($1,721) 2010 46,500 (42,000) 419 (419) 1,520 (1,510) $1,507 ($1,506) $1,555 ($1,553) 2011 47,700 (42,600) 418 (418) 1,570 (1,570) $1,434 ($1,432) $1,434 ($1,432) Note: Figures in parentheses exclude confined fires which are fires reported as confined to fuel burner or boiler, chimney or flue, cooking vessel, trash, incinerator, or commercial compactor. These are national estimates of fires reported to U.S. municipal fire departments and so exclude fires reported only to Federal or state agencies or industrial fire brigades. National estimates are projections. Casualty and loss projections can be heavily influenced by the inclusion or exclusion of one unusually serious fire. Fires are rounded to the nearest hundred, civilian deaths to the nearest one, civilian injuries to the nearest ten, and direct property damage to the nearest million dollars. Figures for 1980-1998 are based on ignition factor 54-55 and reflect a proportional share of home fires with ignition factor unknown, unreported, or blank. Figures for 1999 and later years reflect a proportional share of home fires with factor contributing to ignition listed as unknown, unreported, none, or blank. Because of low participation in NFIRS Version 5.0 during 1999-2001, estimates for these years are highly uncertain and must be used with caution. Inflation adjustment to 2011 dollars is done using the consumer price index. 1991 home fire property damage figures are inflated by estimation problems related to the Oakland fire storm. Source: Data from NFIRS (Version 5.0 after 1998) and NFPA survey.
Home Electrical Fires, 4/13 10 NFPA Fire Analysis & Research, Quincy, MA
Table 1.2. Home Fires Involving Electrical Failure or Malfunction, by Equipment Involved in Ignition
Annual Average of 2007-2011 Structure Fires Reported to U.S. Fire Departments
Civilian Civilian Direct Property Equipment Involved in Ignition Fires Deaths Injuries Damage (in Millions) Electrical distribution or lighting equipment 20,700 (48%) 304 (67%) 676 (45%) $825 (56%) Unclassified wiring 6,590 (15%) 99 (22%) 173 (12%) $242 (16%) Outlet or receptacle 2,590 (6%) 22 (5%) 78 (5%) $94 (6%) Branch circuit wiring 2,200 (5%) 28 (6%) 41 (3%) $108 (7%) Fuse or circuit breaker panel 1,350 (3%) 18 (4%) 36 (2%) $41 (3%) Extension cord 1,330 (3%) 76 (17%) 104 (7%) $61 (4%) Service supply wiring from utility 690 (2%) 4 (1%) 15 (1%) $25 (2%) Meter or meter box 610 (1%) 0 (0%) 7 (0%) $15 (1%) Unclassified lamp, light fixture or sign 560 (1%) 3 (1%) 11 (1%) $18 (1%) Incandescent light fixture 560 (1%) 4 (1%) 24 (2%) $20 (1%) Wiring from meter box to circuit breaker 530 (1%) 4 (1%) 5 (0%) $28 (2%) Surge protector 480 (1%) 7 (1%) 14 (1%) $28 (2%) Unclassified cord or plug 430 (1%) 14 (3%) 23 (2%) $21 (1%) Power (utility) line 380 (1%) 4 (1%) 14 (1%) $16 (1%) Table or floor lamp 360 (1%) 0 (0%) 21 (1%) $20 (1%) Detachable power cord or plug 290 (1%) 7 (2%) 20 (1%) $11 (1%) Fluorescent light fixture or ballast 250 (1%) 4 (1%) 20 (1%) $11 (1%) Other known electrical distribution or lighting equipment 1,120 (3%) 8 (2%) 60 (4%) $54 (4%) Equipment other than electrical distribution or lighting equipment 19,750 (46%) 147 (32%) 755 (50%) $543 (37%) Fan 2,770 (6%) 16 (3%) 104 (7%) $68 (5%) Dryer or washer 2,730 (6%) 0 (0%) 63 (4%) $55 (4%) Portable or stationary space heater 1,760 (4%) 51 (11%) 81 (5%) $57 (4%) Air conditioner 1,640 (4%) 11 (2%) 76 (5%) $44 (3%) Water heater 1,500 (4%) 0 (0%) 24 (2%) $20 (1%) Range 1,400 (3%) 16 (4%) 44 (3%) $26 (2%) Refrigerator, freezer or icemaker 1,060 (2%) 4 (1%) 35 (2%) $37 (3%) Microwave oven 660 (2%) 0 (0%) 38 (2%) $20 (1%) Dishwasher 660 (2%) 4 (1%) 18 (1%) $17 (1%) Television 590 (1%) 3 (1%) 28 (2%) $22 (1%) Furnace or other central heating unit 580 (1%) 0 (0%) 18 (1%) $8 (1%) Entertainment equipment other than television 540 (1%) 2 (1%) 37 (2%) $21 (1%) Computer or other office equipment 480 (1%) 2 (0%) 41 (3%) $25 (2%) Portable cooking or warming device 360 (1%) 8 (2%) 23 (2%) $15 (1%) Oven or rotisserie 360 (1%) 0 (0%) 7 (0%) $4 (0%) Heat tape 220 (1%) 0 (0%) 6 (0%) $5 (0%)
Home Electrical Fires, 4/13 11 NFPA Fire Analysis & Research, Quincy, MA
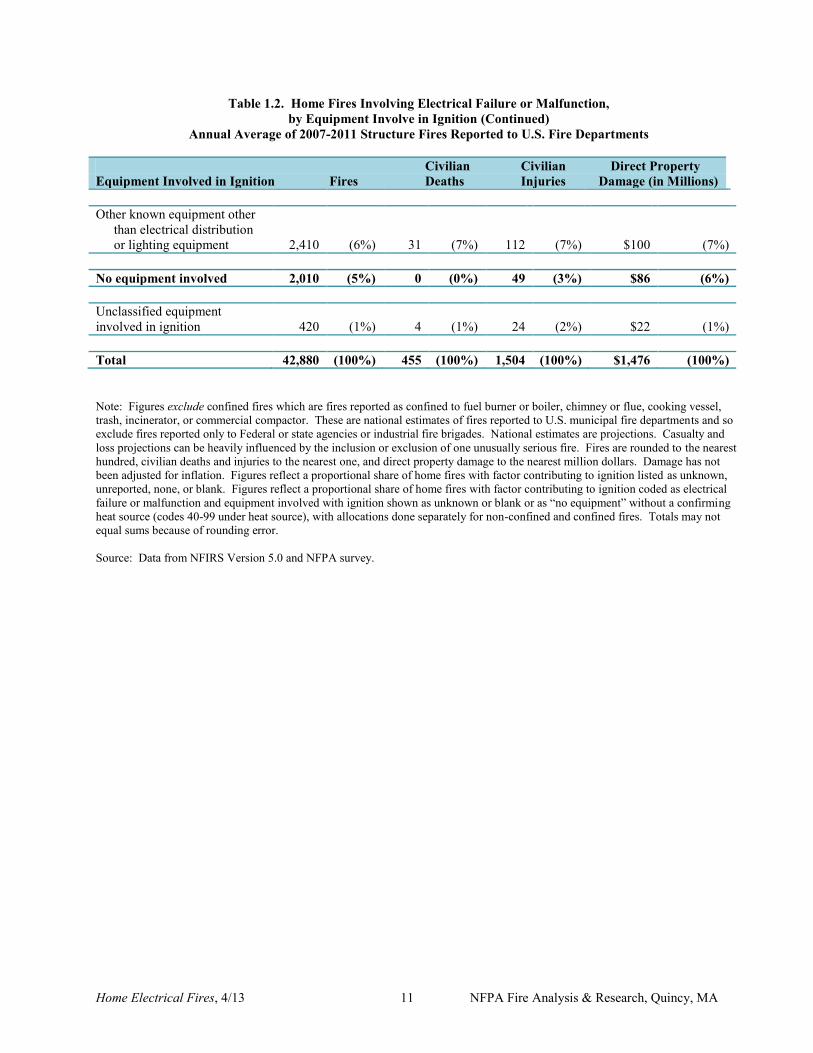
Table 1.2. Home Fires Involving Electrical Failure or Malfunction, by Equipment Involve in Ignition (Continued)
Annual Average of 2007-2011 Structure Fires Reported to U.S. Fire Departments Civilian Civilian Direct Property Equipment Involved in Ignition Fires Deaths Injuries Damage (in Millions) Other known equipment other than electrical distribution or lighting equipment 2,410 (6%) 31 (7%) 112 (7%) $100 (7%) No equipment involved 2,010 (5%) 0 (0%) 49 (3%) $86 (6%) Unclassified equipment involved in ignition 420 (1%) 4 (1%) 24 (2%) $22 (1%) Total 42,880 (100%) 455 (100%) 1,504 (100%) $1,476 (100%) Note: Figures exclude confined fires which are fires reported as confined to fuel burner or boiler, chimney or flue, cooking vessel, trash, incinerator, or commercial compactor. These are national estimates of fires reported to U.S. municipal fire departments and so exclude fires reported only to Federal or state agencies or industrial fire brigades. National estimates are projections. Casualty and loss projections can be heavily influenced by the inclusion or exclusion of one unusually serious fire. Fires are rounded to the nearest hundred, civilian deaths and injuries to the nearest one, and direct property damage to the nearest million dollars. Damage has not been adjusted for inflation. Figures reflect a proportional share of home fires with factor contributing to ignition listed as unknown, unreported, none, or blank. Figures reflect a proportional share of home fires with factor contributing to ignition coded as electrical failure or malfunction and equipment involved with ignition shown as unknown or blank or as “no equipment” without a confirming heat source (codes 40-99 under heat source), with allocations done separately for non-confined and confined fires. Totals may not equal sums because of rounding error. Source: Data from NFIRS Version 5.0 and NFPA survey.
Home Electrical Fires, 4/13 12 NFPA Fire Analysis & Research, Quincy, MA
Table 1.3. Home Fires Involving Electrical Failure or Malfunction, by Item First Ignited
Annual Average of 2007-2011 Structure Fires Reported to U.S. Fire Departments
Civilian Civilian Direct Property Item First Ignited Fires Deaths Injuries Damage (in Millions) Wire or cable insulation 12,990 (30%) 112 (25%) 373 (25%) $370 (25%) Structural member or framing 6,950 (16%) 82 (18%) 176 (12%) $307 (21%) Insulation within structural area
2,880 (7%) 9 (2%) 34 (2%) $72 (5%)
Interior wall covering 2,610 (6%) 33 (7%) 91 (6%) $104 (7%) Appliance housing or casing 2,100 (5%) 16 (3%) 86 (6%) $44 (3%) Exterior wall covering 1,950 (5%) 8 (2%) 40 (3%) $61 (4%) Unclassified structural component or finish
1,670 (4%) 10 (2%) 55 (4%) $77 (5%)
Unclassified item 1,650 (4%) 4 (1%) 48 (3%) $43 (3%) Interior ceiling covering 1,140 (3%) 12 (3%) 18 (1%) $40 (3%) Mattress or bedding 1,130 (3%) 18 (4%) 117 (8%) $42 (3%) Floor covering 940 (2%) 34 (8%) 60 (4%) $35 (2%) Unclassified furniture or utensil
770 (2%) 20 (4%) 36 (2%) $34 (2%)
Clothing 720 (2%) 1 (0%) 34 (2%) $22 (1%) Cabinetry 700 (2%) 16 (4%) 32 (2%) $29 (2%) Upholstered furniture 700 (2%) 34 (8%) 85 (6%) $44 (3%) Multiple items first ignited 560 (1%) 12 (3%) 35 (2%) $40 (3%) Unclassified soft goods or clothing
400 (1%) 4 (1%) 21 (1%) $15 (1%)
Curtain or drape 260 (1%) 3 (1%) 36 (2%) $10 (1%) Exterior roof covering 240 (1%) 0 (0%) 3 (0%) $11 (1%) Wire or cable insulation 12,990 (30%) 112 (25%) 373 (25%) $370 (25%) Other known item first ignited
2,520 (6%) 26 (6%) 123 (8%) $75 (5%)
Total fires 42,880 (100%) 455 (100%) 1,504 (100%) $1,476 (100%) Note: Figures exclude confined fires which are fires reported as confined to fuel burner or boiler, chimney or flue, cooking vessel, trash, incinerator, or commercial compactor. These are national estimates of fires reported to U.S. municipal fire departments and so exclude fires reported only to Federal or state agencies or industrial fire brigades. National estimates are projections. Casualty and loss projections can be heavily influenced by the inclusion or exclusion of one unusually serious fire. Fires are rounded to the nearest ten, civilian deaths and injuries to the nearest one, and direct property damage to the nearest million dollars. Damage has not been adjusted for inflation. Figures reflect a proportional share of home fires with factor contributing to ignition listed as unknown, unreported, none, or blank. Figures reflect a proportional share of home fires with factor contributing to ignition coded as electrical failure or malfunction and item first ignited shown as unknown or blank, with allocations done separately for non-confined and confined fires. Totals may not equal sums because of rounding error. Source: Data from NFIRS Version 5.0 and NFPA survey.
Home Electrical Fires, 4/13 13 NFPA Fire Analysis & Research, Quincy, MA
Table 1.4. Home Fires Involving Electrical Failure or Malfunction, by Area of Origin Annual Average of 2007-2011 Structure Fires Reported to U.S. Fire Departments
Civilian Civilian Direct Property Area of Origin Fires Deaths Injuries Damage (in Millions) Bedroom 5,970 (14%) 100 (22%) 404 (27%) $227 (15%) Attic or ceiling/roof assembly or concealed space 5,020 (12%) 10 (2%) 59 (4%) $176 (12%) Kitchen 4,700 (11%) 63 (14%) 179 (12%) $128 (9%) Wall assembly or concealed space 3,220 (8%) 25 (6%) 66 (4%) $102 (7%) Living room, family room, or den 2,620 (6%) 92 (20%) 188 (12%) $119 (8%) Laundry room 2,330 (5%) 14 (3%) 65 (4%) $61 (4%) Bathroom 1,960 (5%) 6 (1%) 45 (3%) $41 (3%) Unclassified function area 1,760 (4%) 37 (8%) 110 (7%) $73 (5%) Exterior wall surface 1,630 (4%) 6 (1%) 29 (2%) $35 (2%) Garage* 1,630 (4%) 5 (1%) 73 (5%) $108 (7%) Crawl space or substructure space 1,610 (4%) 16 (4%) 46 (3%) $50 (3%) Ceiling/floor assembly or concealed space 1,520 (4%) 29 (6%) 42 (3%) $60 (4%) Heating equipment room 840 (2%) 0 (0%) 17 (1%) $20 (1%) Unclassified structural area 820 (2%) 8 (2%) 18 (1%) $40 (3%) Unclassified area of origin 810 (2%) 2 (0%) 8 (1%) $25 (2%) Closet 750 (2%) 2 (0%) 18 (1%) $25 (2%) Unclassified storage area 550 (1%) 1 (0%) 12 (1%) $18 (1%) Duct for HVAC, cable, or exhaust 460 (1%) 0 (0%) 11 (1%) $8 (1%) Exterior balcony or unenclosed porch 410 (1%) 7 (2%) 15 (1%) $22 (1%) Unclassified equipment or service area 400 (1%) 0 (0%) 4 (0%) $10 (1%) Unclassified outside area 390 (1%) 0 (0%) 5 (0%) $7 (0%) Conduit, pipe, utility, or ventilation shaft 300 (1%) 0 (0%) 1 (0%) $6 (0%) Dining room 280 (1%) 9 (2%) 8 (1%) $10 (1%) Lobby or entrance way 270 (1%) 8 (2%) 8 (1%) $8 (1%) Storage room or area 270 (1%) 0 (0%) 7 (0%) $8 (1%) Hallway or corridor 230 (1%) 3 (1%) 13 (1%) $6 (0%) Storage of supplies or tools 220 (1%) 0 (0%) 4 (0%) $7 (1%) Exterior roof surface 220 (1%) 0 (0%) 0 (0%) $6 (0%) Other known area of origin 1,700 (4%) 10 (2%) 49 (3%) $70 (5%) Total fires 42,880 (100%) 455 (100%) 1,504 (100%) $1,476 (100%) * Excludes garage reported as separate property.
Home Electrical Fires, 4/13 14 NFPA Fire Analysis & Research, Quincy, MA
Table 1.4. Home Fires Involving Electrical Failure or Malfunction, by Area of Origin Annual Average of 2007-2011 Structure Fires Reported to U.S. Fire Departments (Continued)
Note: Figures exclude confined fires which are fires reported as confined to fuel burner or boiler, chimney or flue, cooking vessel, trash, incinerator, or commercial compactor. These are national estimates of fires reported to U.S. municipal fire departments and so exclude fires reported only to Federal or state agencies or industrial fire brigades. National estimates are projections. Casualty and loss projections can be heavily influenced by the inclusion or exclusion of one unusually serious fire. Fires are rounded to the nearest ten, civilian deaths and injuries to the nearest one, and direct property damage to the nearest million dollars. Damage has not been adjusted for inflation. Figures reflect a proportional share of home fires with factor contributing to ignition listed as unknown, unreported, none, or blank. Figures reflect a proportional share of home fires with factor contributing to ignition coded as electrical failure or malfunction and area of origin shown as unknown or blank, with allocations done separately for non-confined and confined fires Totals may not equal sums because of rounding error. Source: Data from NFIRS Version 5.0 and NFPA survey.
Home Electrical Fires, 4/13 15 NFPA Fire Analysis & Research, Quincy, MA
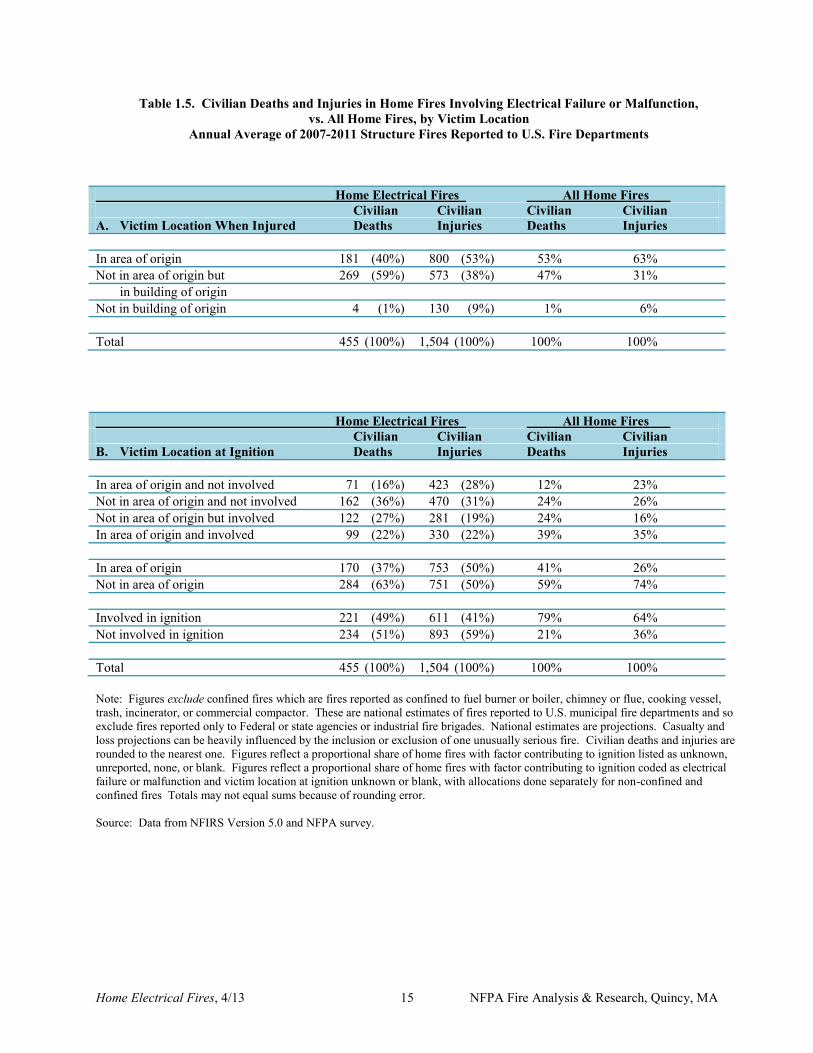
Table 1.5. Civilian Deaths and Injuries in Home Fires Involving Electrical Failure or Malfunction, vs. All Home Fires, by Victim Location
Annual Average of 2007-2011 Structure Fires Reported to U.S. Fire Departments
Home Electrical Fires All Home Fires Civilian Civilian Civilian Civilian A. Victim Location When Injured Deaths Injuries Deaths Injuries In area of origin 181 (40%) 800 (53%) 53% 63% Not in area of origin but 269 (59%) 573 (38%) 47% 31% in building of origin Not in building of origin 4 (1%) 130 (9%) 1% 6% Total 455 (100%) 1,504 (100%) 100% 100% Home Electrical Fires All Home Fires Civilian Civilian Civilian Civilian B. Victim Location at Ignition Deaths Injuries Deaths Injuries In area of origin and not involved 71 (16%) 423 (28%) 12% 23% Not in area of origin and not involved 162 (36%) 470 (31%) 24% 26% Not in area of origin but involved 122 (27%) 281 (19%) 24% 16% In area of origin and involved 99 (22%) 330 (22%) 39% 35% In area of origin 170 (37%) 753 (50%) 41% 26% Not in area of origin 284 (63%) 751 (50%) 59% 74% Involved in ignition 221 (49%) 611 (41%) 79% 64% Not involved in ignition 234 (51%) 893 (59%) 21% 36% Total 455 (100%) 1,504 (100%) 100% 100% Note: Figures exclude confined fires which are fires reported as confined to fuel burner or boiler, chimney or flue, cooking vessel, trash, incinerator, or commercial compactor. These are national estimates of fires reported to U.S. municipal fire departments and so exclude fires reported only to Federal or state agencies or industrial fire brigades. National estimates are projections. Casualty and loss projections can be heavily influenced by the inclusion or exclusion of one unusually serious fire. Civilian deaths and injuries are rounded to the nearest one. Figures reflect a proportional share of home fires with factor contributing to ignition listed as unknown, unreported, none, or blank. Figures reflect a proportional share of home fires with factor contributing to ignition coded as electrical failure or malfunction and victim location at ignition unknown or blank, with allocations done separately for non-confined and confined fires Totals may not equal sums because of rounding error. Source: Data from NFIRS Version 5.0 and NFPA survey.
Home Electrical Fires, 4/13 16 NFPA Fire Analysis & Research, Quincy, MA
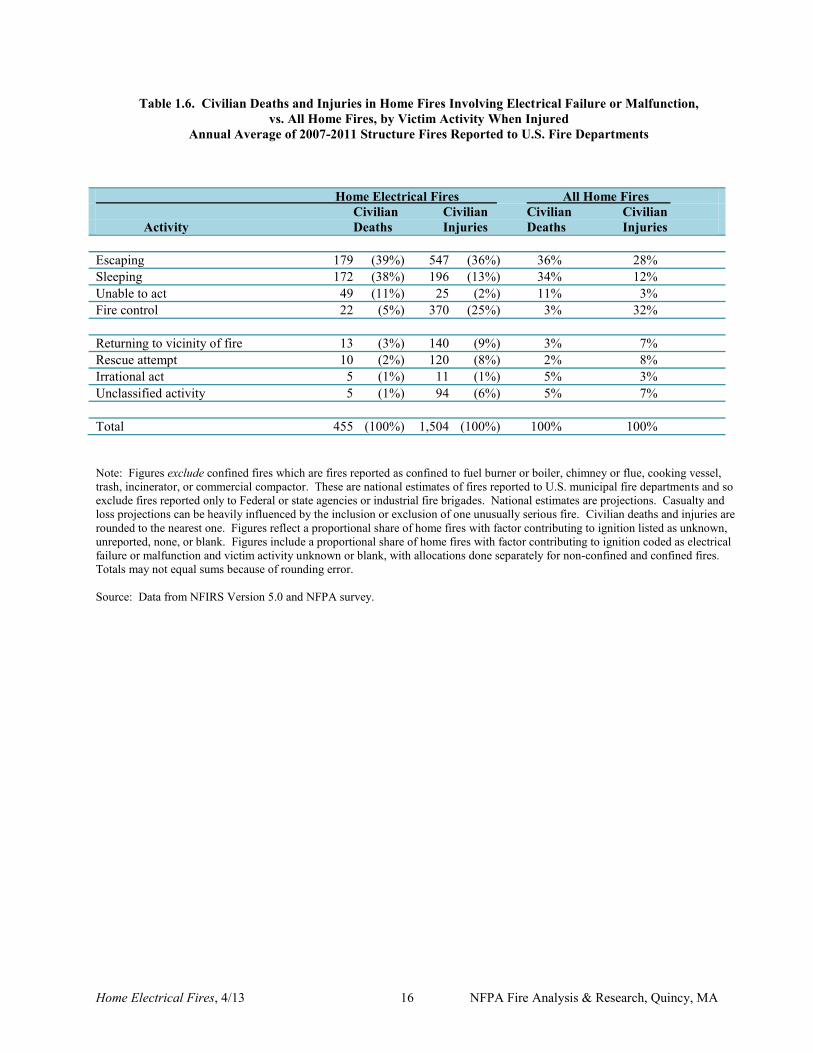
Table 1.6. Civilian Deaths and Injuries in Home Fires Involving Electrical Failure or Malfunction, vs. All Home Fires, by Victim Activity When Injured
Annual Average of 2007-2011 Structure Fires Reported to U.S. Fire Departments
Home Electrical Fires All Home Fires Civilian Civilian Civilian Civilian Activity Deaths Injuries Deaths Injuries Escaping 179 (39%) 547 (36%) 36% 28% Sleeping 172 (38%) 196 (13%) 34% 12% Unable to act 49 (11%) 25 (2%) 11% 3% Fire control 22 (5%) 370 (25%) 3% 32% Returning to vicinity of fire 13 (3%) 140 (9%) 3% 7% Rescue attempt 10 (2%) 120 (8%) 2% 8% Irrational act 5 (1%) 11 (1%) 5% 3% Unclassified activity 5 (1%) 94 (6%) 5% 7% Total 455 (100%) 1,504 (100%) 100% 100% Note: Figures exclude confined fires which are fires reported as confined to fuel burner or boiler, chimney or flue, cooking vessel, trash, incinerator, or commercial compactor. These are national estimates of fires reported to U.S. municipal fire departments and so exclude fires reported only to Federal or state agencies or industrial fire brigades. National estimates are projections. Casualty and loss projections can be heavily influenced by the inclusion or exclusion of one unusually serious fire. Civilian deaths and injuries are rounded to the nearest one. Figures reflect a proportional share of home fires with factor contributing to ignition listed as unknown, unreported, none, or blank. Figures include a proportional share of home fires with factor contributing to ignition coded as electrical failure or malfunction and victim activity unknown or blank, with allocations done separately for non-confined and confined fires. Totals may not equal sums because of rounding error. Source: Data from NFIRS Version 5.0 and NFPA survey.
Home Electrical Fires, 4/13 17 NFPA Fire Analysis & Research, Quincy, MA
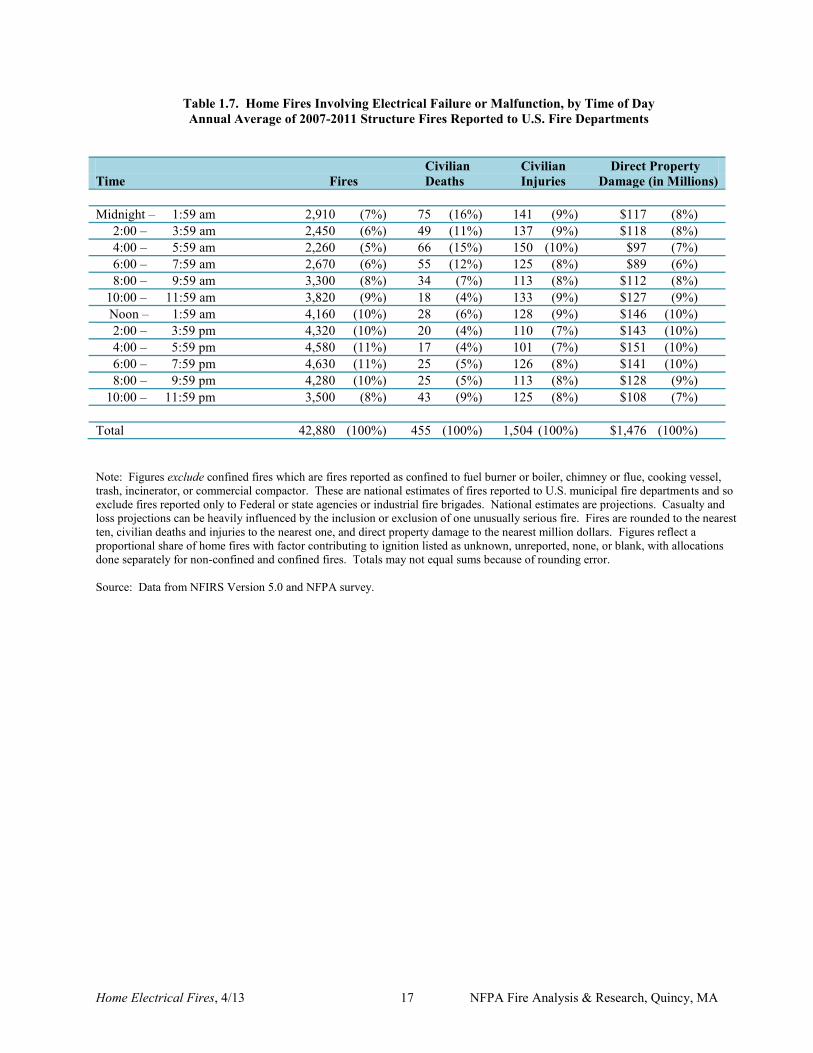
Table 1.7. Home Fires Involving Electrical Failure or Malfunction, by Time of Day Annual Average of 2007-2011 Structure Fires Reported to U.S. Fire Departments
Civilian Civilian Direct Property Time Fires Deaths Injuries Damage (in Millions) Midnight – 1:59 am 2,910 (7%) 75 (16%) 141 (9%) $117 (8%) 2:00 – 3:59 am 2,450 (6%) 49 (11%) 137 (9%) $118 (8%) 4:00 – 5:59 am 2,260 (5%) 66 (15%) 150 (10%) $97 (7%) 6:00 – 7:59 am 2,670 (6%) 55 (12%) 125 (8%) $89 (6%) 8:00 – 9:59 am 3,300 (8%) 34 (7%) 113 (8%) $112 (8%) 10:00 – 11:59 am 3,820 (9%) 18 (4%) 133 (9%) $127 (9%) Noon – 1:59 am 4,160 (10%) 28 (6%) 128 (9%) $146 (10%) 2:00 – 3:59 pm 4,320 (10%) 20 (4%) 110 (7%) $143 (10%) 4:00 – 5:59 pm 4,580 (11%) 17 (4%) 101 (7%) $151 (10%) 6:00 – 7:59 pm 4,630 (11%) 25 (5%) 126 (8%) $141 (10%) 8:00 – 9:59 pm 4,280 (10%) 25 (5%) 113 (8%) $128 (9%) 10:00 – 11:59 pm 3,500 (8%) 43 (9%) 125 (8%) $108 (7%) Total 42,880 (100%) 455 (100%) 1,504 (100%) $1,476 (100%) Note: Figures exclude confined fires which are fires reported as confined to fuel burner or boiler, chimney or flue, cooking vessel, trash, incinerator, or commercial compactor. These are national estimates of fires reported to U.S. municipal fire departments and so exclude fires reported only to Federal or state agencies or industrial fire brigades. National estimates are projections. Casualty and loss projections can be heavily influenced by the inclusion or exclusion of one unusually serious fire. Fires are rounded to the nearest ten, civilian deaths and injuries to the nearest one, and direct property damage to the nearest million dollars. Figures reflect a proportional share of home fires with factor contributing to ignition listed as unknown, unreported, none, or blank, with allocations done separately for non-confined and confined fires. Totals may not equal sums because of rounding error. Source: Data from NFIRS Version 5.0 and NFPA survey.
Home Electrical Fires, 4/13 18 NFPA Fire Analysis & Research, Quincy, MA
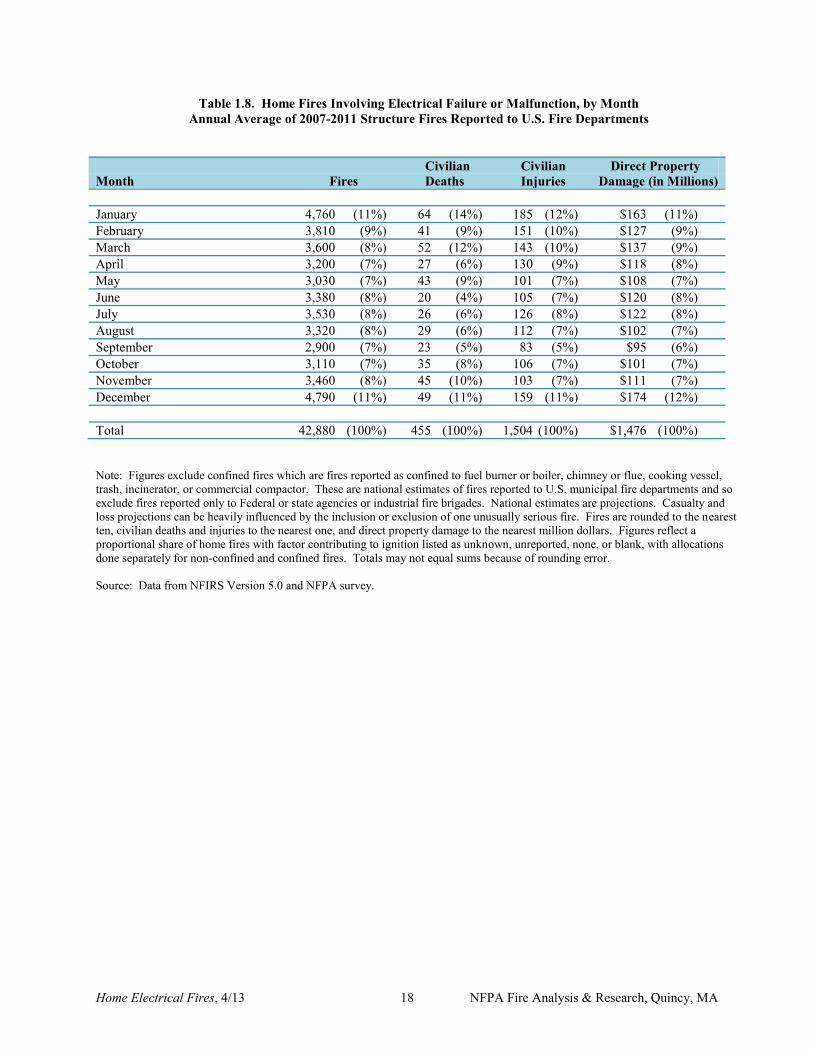
Table 1.8. Home Fires Involving Electrical Failure or Malfunction, by Month Annual Average of 2007-2011 Structure Fires Reported to U.S. Fire Departments
Civilian Civilian Direct Property Month Fires Deaths Injuries Damage (in Millions) January 4,760 (11%) 64 (14%) 185 (12%) $163 (11%) February 3,810 (9%) 41 (9%) 151 (10%) $127 (9%) March 3,600 (8%) 52 (12%) 143 (10%) $137 (9%) April 3,200 (7%) 27 (6%) 130 (9%) $118 (8%) May 3,030 (7%) 43 (9%) 101 (7%) $108 (7%) June 3,380 (8%) 20 (4%) 105 (7%) $120 (8%) July 3,530 (8%) 26 (6%) 126 (8%) $122 (8%) August 3,320 (8%) 29 (6%) 112 (7%) $102 (7%) September 2,900 (7%) 23 (5%) 83 (5%) $95 (6%) October 3,110 (7%) 35 (8%) 106 (7%) $101 (7%) November 3,460 (8%) 45 (10%) 103 (7%) $111 (7%) December 4,790 (11%) 49 (11%) 159 (11%) $174 (12%) Total 42,880 (100%) 455 (100%) 1,504 (100%) $1,476 (100%) Note: Figures exclude confined fires which are fires reported as confined to fuel burner or boiler, chimney or flue, cooking vessel, trash, incinerator, or commercial compactor. These are national estimates of fires reported to U.S. municipal fire departments and so exclude fires reported only to Federal or state agencies or industrial fire brigades. National estimates are projections. Casualty and loss projections can be heavily influenced by the inclusion or exclusion of one unusually serious fire. Fires are rounded to the nearest ten, civilian deaths and injuries to the nearest one, and direct property damage to the nearest million dollars. Figures reflect a proportional share of home fires with factor contributing to ignition listed as unknown, unreported, none, or blank, with allocations done separately for non-confined and confined fires. Totals may not equal sums because of rounding error. Source: Data from NFIRS Version 5.0 and NFPA survey.
Home Electrical Fires, 4/13 19 NFPA Fire Analysis & Research, Quincy, MA
Section 2. Non-Home Electrical Fires
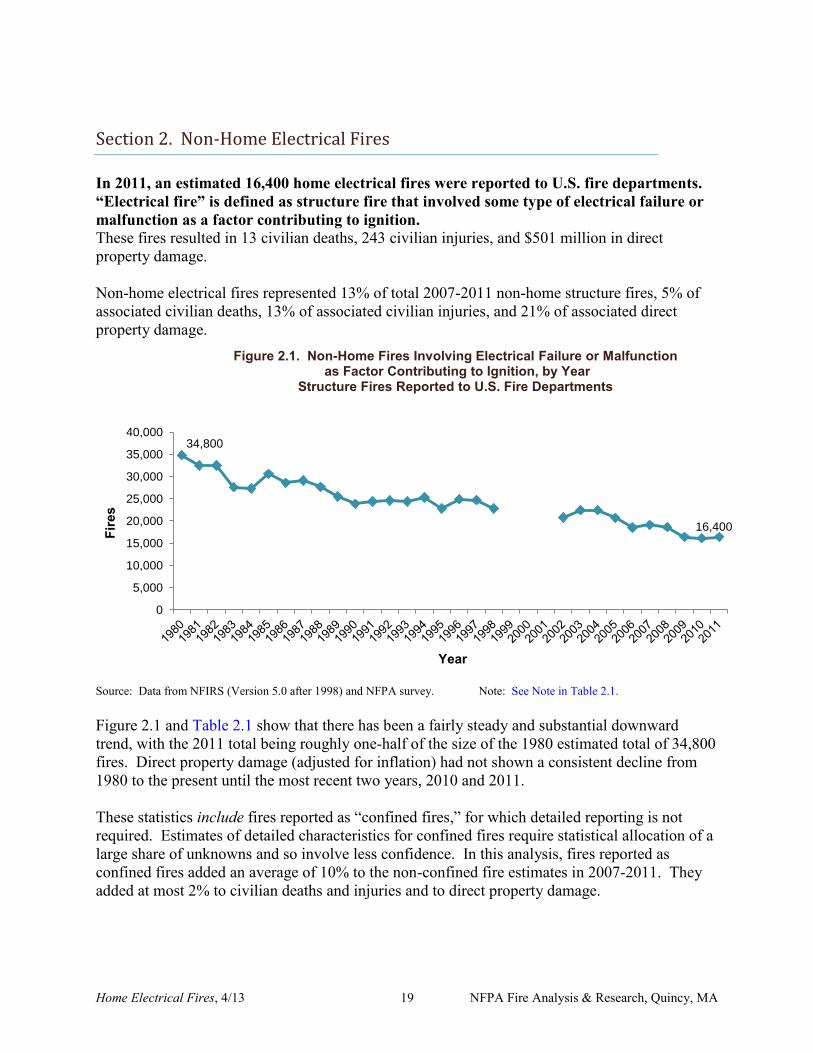
In 2011, an estimated 16,400 home electrical fires were reported to U.S. fire departments. “Electrical fire” is defined as structure fire that involved some type of electrical failure or malfunction as a factor contributing to ignition. These fires resulted in 13 civilian deaths, 243 civilian injuries, and $501 million in direct property damage. Non-home electrical fires represented 13% of total 2007-2011 non-home structure fires, 5% of associated civilian deaths, 13% of associated civilian injuries, and 21% of associated direct property damage.
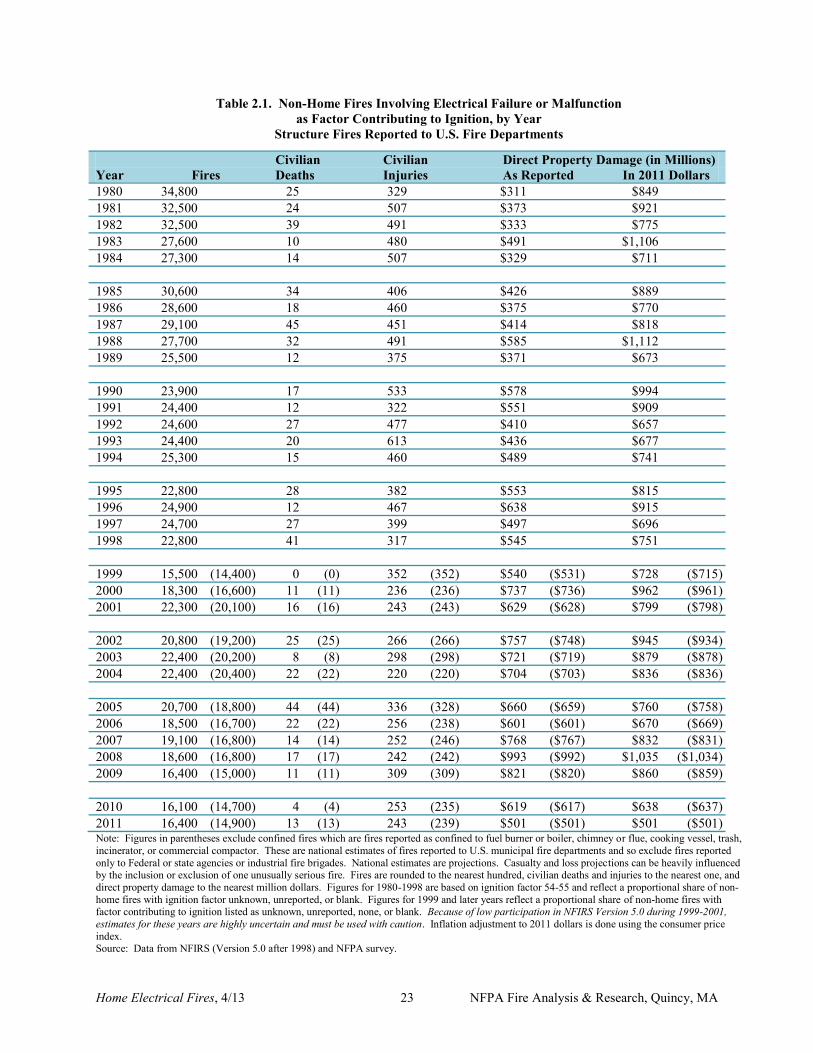
Source: Data from NFIRS (Version 5.0 after 1998) and NFPA survey. Note: See Note in Table 2.1. Figure 2.1 and Table 2.1 show that there has been a fairly steady and substantial downward trend, with the 2011 total being roughly one-half of the size of the 1980 estimated total of 34,800 fires. Direct property damage (adjusted for inflation) had not shown a consistent decline from 1980 to the present until the most recent two years, 2010 and 2011. These statistics include fires reported as “confined fires,” for which detailed reporting is not required. Estimates of detailed characteristics for confined fires require statistical allocation of a large share of unknowns and so involve less confidence. In this analysis, fires reported as confined fires added an average of 10% to the non-confined fire estimates in 2007-2011. They added at most 2% to civilian deaths and injuries and to direct property damage.
34,800
16,400
0
5,000
10,000
15,000
20,000
25,000
30,000
35,000
40,000
Fire
s
Year
Figure 2.1. Non-Home Fires Involving Electrical Failure or Malfunction as Factor Contributing to Ignition, by Year
Structure Fires Reported to U.S. Fire Departments
Home Electrical Fires, 4/13 20 NFPA Fire Analysis & Research, Quincy, MA
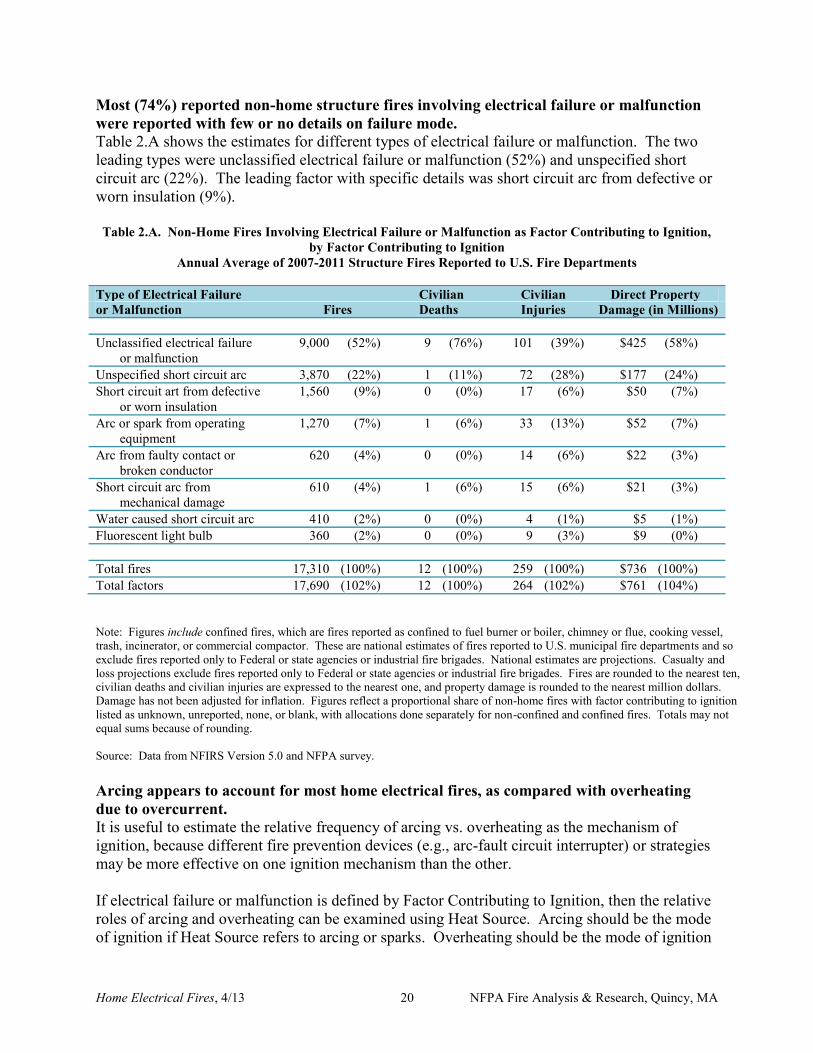
Most (74%) reported non-home structure fires involving electrical failure or malfunction were reported with few or no details on failure mode. Table 2.A shows the estimates for different types of electrical failure or malfunction. The two leading types were unclassified electrical failure or malfunction (52%) and unspecified short circuit arc (22%). The leading factor with specific details was short circuit arc from defective or worn insulation (9%). Table 2.A. Non-Home Fires Involving Electrical Failure or Malfunction as Factor Contributing to Ignition,
by Factor Contributing to Ignition Annual Average of 2007-2011 Structure Fires Reported to U.S. Fire Departments
Type of Electrical Failure Civilian Civilian Direct Property or Malfunction Fires Deaths Injuries Damage (in Millions) Unclassified electrical failure 9,000 (52%) 9 (76%) 101 (39%) $425 (58%) or malfunction Unspecified short circuit arc 3,870 (22%) 1 (11%) 72 (28%) $177 (24%) Short circuit art from defective 1,560 (9%) 0 (0%) 17 (6%) $50 (7%) or worn insulation Arc or spark from operating 1,270 (7%) 1 (6%) 33 (13%) $52 (7%) equipment Arc from faulty contact or 620 (4%) 0 (0%) 14 (6%) $22 (3%) broken conductor Short circuit arc from 610 (4%) 1 (6%) 15 (6%) $21 (3%) mechanical damage Water caused short circuit arc 410 (2%) 0 (0%) 4 (1%) $5 (1%) Fluorescent light bulb 360 (2%) 0 (0%) 9 (3%) $9 (0%) Total fires 17,310 (100%) 12 (100%) 259 (100%) $736 (100%) Total factors 17,690 (102%) 12 (100%) 264 (102%) $761 (104%) Note: Figures include confined fires, which are fires reported as confined to fuel burner or boiler, chimney or flue, cooking vessel, trash, incinerator, or commercial compactor. These are national estimates of fires reported to U.S. municipal fire departments and so exclude fires reported only to Federal or state agencies or industrial fire brigades. National estimates are projections. Casualty and loss projections exclude fires reported only to Federal or state agencies or industrial fire brigades. Fires are rounded to the nearest ten, civilian deaths and civilian injuries are expressed to the nearest one, and property damage is rounded to the nearest million dollars. Damage has not been adjusted for inflation. Figures reflect a proportional share of non-home fires with factor contributing to ignition listed as unknown, unreported, none, or blank, with allocations done separately for non-confined and confined fires. Totals may not equal sums because of rounding. Source: Data from NFIRS Version 5.0 and NFPA survey. Arcing appears to account for most home electrical fires, as compared with overheating due to overcurrent. It is useful to estimate the relative frequency of arcing vs. overheating as the mechanism of ignition, because different fire prevention devices (e.g., arc-fault circuit interrupter) or strategies may be more effective on one ignition mechanism than the other. If electrical failure or malfunction is defined by Factor Contributing to Ignition, then the relative roles of arcing and overheating can be examined using Heat Source. Arcing should be the mode of ignition if Heat Source refers to arcing or sparks. Overheating should be the mode of ignition
Home Electrical Fires, 4/13 21 NFPA Fire Analysis & Research, Quincy, MA
if Heat Source refers to radiated or conducted heat or to molten or hot material. Here are the leading Heat Source entries and their respective shares of fires with known Heat Source, from all non-home fires involving electrical failure or malfunction:
Arcing – 60%, definitely arcing; Unclassified heat from powered equipment – 16%, could be either; Unclassified heat source – 6%, could be either; Spark, ember or flame from operating equipment – 5%, could be either; Radiated or conducted heat from operating equipment – 5%; should be overheating; Unclassified hot or smoldering object – 4%, probably overheating; Heat or spark from friction – 1%, could be either; Molten or hot material – 1%, very probably overheating.
These statistics suggest a 6-to-1 ratio of arcing fires to overheating fires based on heat sources that appear likely to be one or the other. If everything that is not specifically arcing is overheating, then the ratio is still 2-to-1 arcing versus overheating. Fires due to overheating caused by overcurrent can be prevented by overcurrent protection devices, principally circuit breakers and fuses, while fires due to arcing can be prevented by arc fault circuit interrupters (AFCIs). The former has been present in all, or nearly all, homes with electrical service since electrical service has been available. The latter is a technology developed more recently and is still in very limited use. Half (52%) of 2007-2011 reported U.S. non-home structure fires involving electrical failure or malfunction had some type of electrical distribution or lighting equipment as equipment involved in ignition. The leading other types of equipment involved in ignition were fan (8%), refrigerator, freezer or icemaker (4%), washer or dryer (2%), and computer or other office equipment (2%). See Table 2.2, which does not include confined fires. Tables 2.3 to 2.6 also exclude confined fires. Nearly half (47%) of 2007-2011 non-home electrical fires (structure fires involving electrical failure or malfunction) began with ignition of products often found in concealed spaces – wire or cable insulation (36%) or structural member or framing (11%). Other leading items first ignited were unclassified item (6%), exterior wall covering (4%), interior wall covering (4%), unclassified structural component or finish (4%), insulation within structural area (4%), and appliance housing or casing (4%). (See Table 2.3.) Leading areas of origin for 2007-2011 non-home fire incidents were kitchen (5%), unclassified storage area (5%), wall assembly or concealed space (5%), garage (5%), and attic or ceiling/roof assembly or concealed space (5%). (See Table 2.4.) Non-home electrical fires are less common between midnight and 6:00 a.m., but are slightly more common in winter (37% of fires in December through March). (See Tables 2.5 and 2.6.)
Home Electrical Fires, 4/13 22 NFPA Fire Analysis & Research, Quincy, MA
Other reports provide statistics on non-fire incidents and harm due to electricity. See the following reports:
Jennifer D. Flynn, Non-Fire Electrical Wiring and Equipment Problem Incidents Reported to U.S. Fire Departments, NFPA Fire Analysis and Research Division, Quincy, MA, August 2007 – Analyzes 316,000 reported 2003 incidents, such as power line down, that did not involve fire or rescue.
Jennifer D. Flynn, Non-Fire Electrical Rescue Incidents Reported to Fire Departments in 2003, NFPA Fire Analysis and Research Division, Quincy, MA, August 2007 – Analyzes 2,800 reported incidents, including electrocutions and people trapped by power lines.
John R. Hall, Jr., Deaths and Injuries Due to Non-Fire Burns, NFPA Fire Analysis and Research Division, Quincy, MA, March 2009 – Estimates 1991-2007 electrical burn injuries reported to U.S. hospital emergency rooms and 1980-2005 unintentional-injury deaths by electrical current, including deaths specifically attributable to electric transmission lines or to lightning.
Safety Tips
Electrical safety begins with NFPA 70, National Electrical Code®, and NFPA 70E, Standard for Electrical Safety in the Workplace®. However, work on electrical distribution or lighting equipment should only be conducted by someone qualified as an electrician. When you are buying, selling or remodeling a building, have it inspected by a professional electrician.
Call a qualified electrician or landlord if you have recurring problems with blowing fuses or tripping circuit breakers, a tingling feeling when you touch an electrical appliance, discolored or warm wall outlets, a burning smell or rubbery odor coming from an appliance, flickering lights, sparks from an outlet, cracked or broken outlets.
Arc fault circuit interrupters (AFCIs) are a type of circuit breaker that shuts off electricity
when a dangerous arcing condition occurs. Consider having them installed in your building. Use a qualified electrician.
More of NFPA’s electrical safety information is available on our website at www.nfpa.org/electricalfires.
Home Electrical Fires, 4/13 23 NFPA Fire Analysis & Research, Quincy, MA
Table 2.1. Non-Home Fires Involving Electrical Failure or Malfunction as Factor Contributing to Ignition, by Year
Structure Fires Reported to U.S. Fire Departments
Civilian Civilian Direct Property Damage (in Millions) Year Fires Deaths Injuries As Reported In 2011 Dollars 1980 34,800 25 329 $311 $849 1981 32,500 24 507 $373 $921 1982 32,500 39 491 $333 $775 1983 27,600 10 480 $491 $1,106 1984 27,300 14 507 $329 $711 1985 30,600 34 406 $426 $889 1986 28,600 18 460 $375 $770 1987 29,100 45 451 $414 $818 1988 27,700 32 491 $585 $1,112 1989 25,500 12 375 $371 $673 1990 23,900 17 533 $578 $994 1991 24,400 12 322 $551 $909 1992 24,600 27 477 $410 $657 1993 24,400 20 613 $436 $677 1994 25,300 15 460 $489 $741 1995 22,800 28 382 $553 $815 1996 24,900 12 467 $638 $915 1997 24,700 27 399 $497 $696 1998 22,800 41 317 $545 $751 1999 15,500 (14,400) 0 (0) 352 (352) $540 ($531) $728 ($715) 2000 18,300 (16,600) 11 (11) 236 (236) $737 ($736) $962 ($961) 2001 22,300 (20,100) 16 (16) 243 (243) $629 ($628) $799 ($798) 2002 20,800 (19,200) 25 (25) 266 (266) $757 ($748) $945 ($934) 2003 22,400 (20,200) 8 (8) 298 (298) $721 ($719) $879 ($878) 2004 22,400 (20,400) 22 (22) 220 (220) $704 ($703) $836 ($836) 2005 20,700 (18,800) 44 (44) 336 (328) $660 ($659) $760 ($758) 2006 18,500 (16,700) 22 (22) 256 (238) $601 ($601) $670 ($669) 2007 19,100 (16,800) 14 (14) 252 (246) $768 ($767) $832 ($831) 2008 18,600 (16,800) 17 (17) 242 (242) $993 ($992) $1,035 ($1,034) 2009 16,400 (15,000) 11 (11) 309 (309) $821 ($820) $860 ($859) 2010 16,100 (14,700) 4 (4) 253 (235) $619 ($617) $638 ($637) 2011 16,400 (14,900) 13 (13) 243 (239) $501 ($501) $501 ($501) Note: Figures in parentheses exclude confined fires which are fires reported as confined to fuel burner or boiler, chimney or flue, cooking vessel, trash, incinerator, or commercial compactor. These are national estimates of fires reported to U.S. municipal fire departments and so exclude fires reported only to Federal or state agencies or industrial fire brigades. National estimates are projections. Casualty and loss projections can be heavily influenced by the inclusion or exclusion of one unusually serious fire. Fires are rounded to the nearest hundred, civilian deaths and injuries to the nearest one, and direct property damage to the nearest million dollars. Figures for 1980-1998 are based on ignition factor 54-55 and reflect a proportional share of non-home fires with ignition factor unknown, unreported, or blank. Figures for 1999 and later years reflect a proportional share of non-home fires with factor contributing to ignition listed as unknown, unreported, none, or blank. Because of low participation in NFIRS Version 5.0 during 1999-2001, estimates for these years are highly uncertain and must be used with caution. Inflation adjustment to 2011 dollars is done using the consumer price index. Source: Data from NFIRS (Version 5.0 after 1998) and NFPA survey.
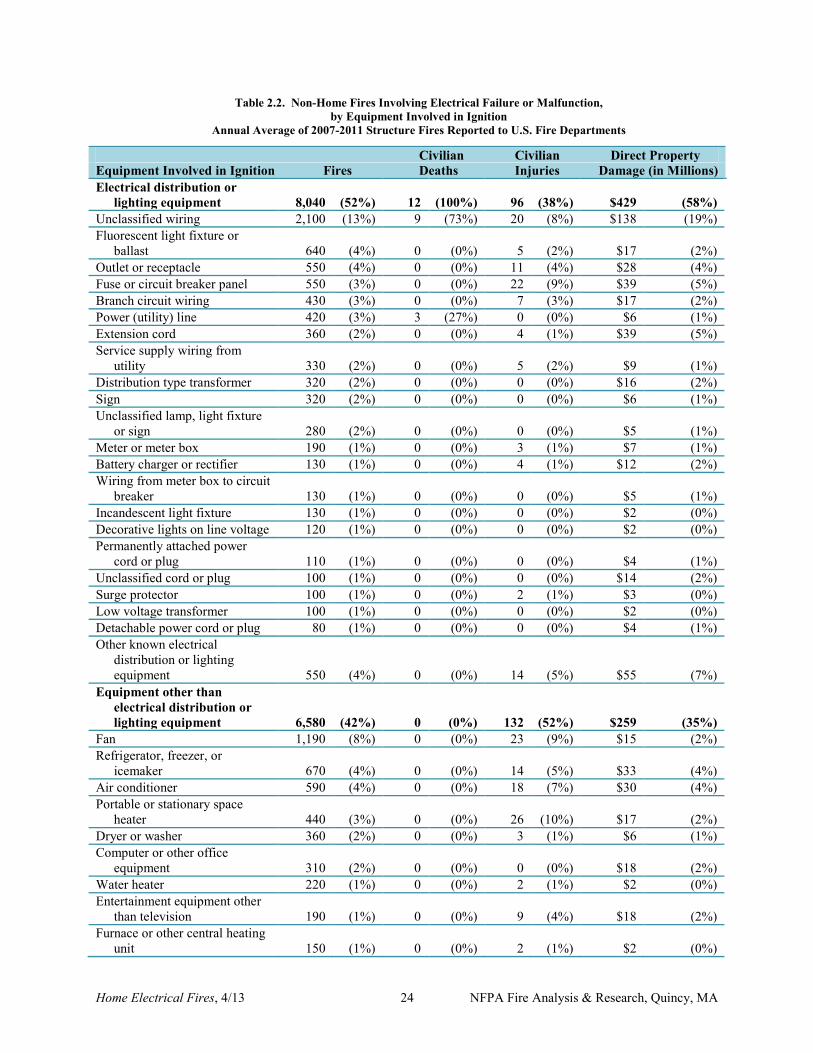
Home Electrical Fires, 4/13 24 NFPA Fire Analysis & Research, Quincy, MA
Table 2.2. Non-Home Fires Involving Electrical Failure or Malfunction, by Equipment Involved in Ignition
Annual Average of 2007-2011 Structure Fires Reported to U.S. Fire Departments
Civilian Civilian Direct Property Equipment Involved in Ignition Fires Deaths Injuries Damage (in Millions) Electrical distribution or lighting equipment 8,040 (52%) 12 (100%) 96 (38%) $429 (58%) Unclassified wiring 2,100 (13%) 9 (73%) 20 (8%) $138 (19%) Fluorescent light fixture or ballast 640 (4%) 0 (0%) 5 (2%) $17 (2%) Outlet or receptacle 550 (4%) 0 (0%) 11 (4%) $28 (4%) Fuse or circuit breaker panel 550 (3%) 0 (0%) 22 (9%) $39 (5%) Branch circuit wiring 430 (3%) 0 (0%) 7 (3%) $17 (2%) Power (utility) line 420 (3%) 3 (27%) 0 (0%) $6 (1%) Extension cord 360 (2%) 0 (0%) 4 (1%) $39 (5%) Service supply wiring from utility 330 (2%) 0 (0%) 5 (2%) $9 (1%) Distribution type transformer 320 (2%) 0 (0%) 0 (0%) $16 (2%) Sign 320 (2%) 0 (0%) 0 (0%) $6 (1%) Unclassified lamp, light fixture or sign 280 (2%) 0 (0%) 0 (0%) $5 (1%) Meter or meter box 190 (1%) 0 (0%) 3 (1%) $7 (1%) Battery charger or rectifier 130 (1%) 0 (0%) 4 (1%) $12 (2%) Wiring from meter box to circuit breaker 130 (1%) 0 (0%) 0 (0%) $5 (1%) Incandescent light fixture 130 (1%) 0 (0%) 0 (0%) $2 (0%) Decorative lights on line voltage 120 (1%) 0 (0%) 0 (0%) $2 (0%) Permanently attached power cord or plug 110 (1%) 0 (0%) 0 (0%) $4 (1%) Unclassified cord or plug 100 (1%) 0 (0%) 0 (0%) $14 (2%) Surge protector 100 (1%) 0 (0%) 2 (1%) $3 (0%) Low voltage transformer 100 (1%) 0 (0%) 0 (0%) $2 (0%) Detachable power cord or plug 80 (1%) 0 (0%) 0 (0%) $4 (1%) Other known electrical distribution or lighting equipment 550 (4%) 0 (0%) 14 (5%) $55 (7%) Equipment other than electrical distribution or lighting equipment 6,580 (42%) 0 (0%) 132 (52%) $259 (35%) Fan 1,190 (8%) 0 (0%) 23 (9%) $15 (2%) Refrigerator, freezer, or icemaker 670 (4%) 0 (0%) 14 (5%) $33 (4%) Air conditioner 590 (4%) 0 (0%) 18 (7%) $30 (4%) Portable or stationary space heater 440 (3%) 0 (0%) 26 (10%) $17 (2%) Dryer or washer 360 (2%) 0 (0%) 3 (1%) $6 (1%) Computer or other office equipment 310 (2%) 0 (0%) 0 (0%) $18 (2%) Water heater 220 (1%) 0 (0%) 2 (1%) $2 (0%) Entertainment equipment other than television 190 (1%) 0 (0%) 9 (4%) $18 (2%) Furnace or other central heating unit 150 (1%) 0 (0%) 2 (1%) $2 (0%)
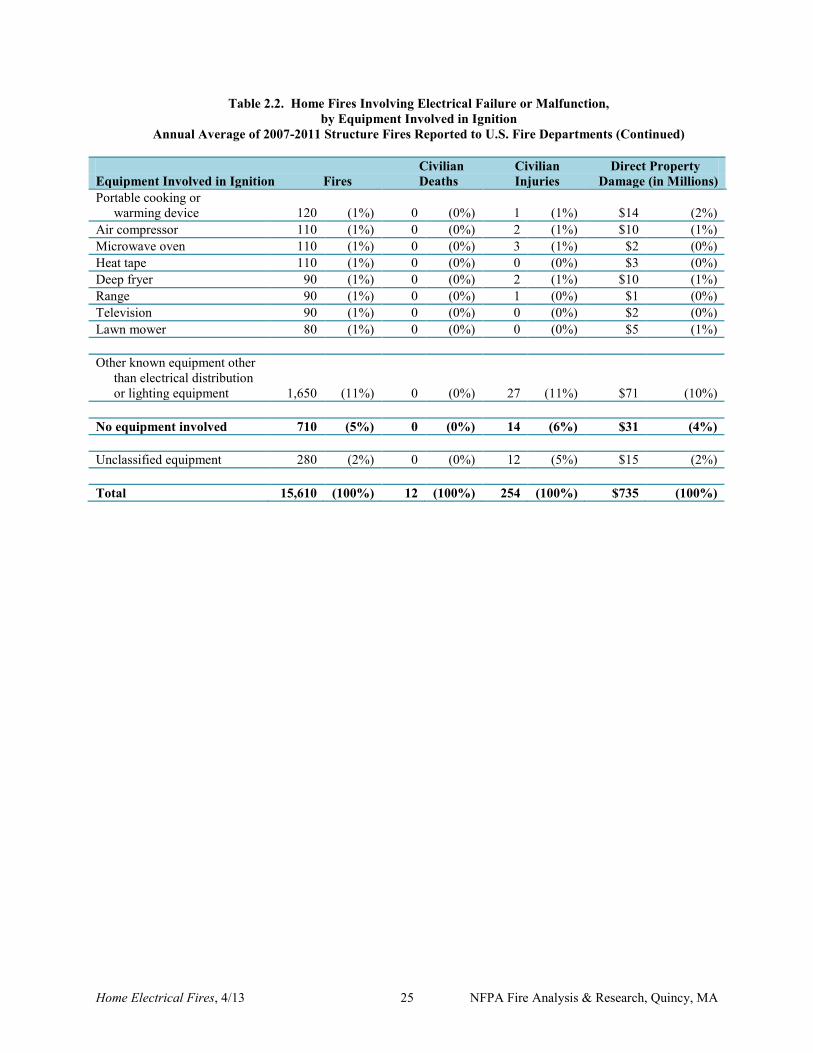
Home Electrical Fires, 4/13 25 NFPA Fire Analysis & Research, Quincy, MA
Table 2.2. Home Fires Involving Electrical Failure or Malfunction, by Equipment Involved in Ignition
Annual Average of 2007-2011 Structure Fires Reported to U.S. Fire Departments (Continued) Civilian Civilian Direct Property Equipment Involved in Ignition Fires Deaths Injuries Damage (in Millions) Portable cooking or warming device 120 (1%) 0 (0%) 1 (1%) $14 (2%) Air compressor 110 (1%) 0 (0%) 2 (1%) $10 (1%) Microwave oven 110 (1%) 0 (0%) 3 (1%) $2 (0%) Heat tape 110 (1%) 0 (0%) 0 (0%) $3 (0%) Deep fryer 90 (1%) 0 (0%) 2 (1%) $10 (1%) Range 90 (1%) 0 (0%) 1 (0%) $1 (0%) Television 90 (1%) 0 (0%) 0 (0%) $2 (0%) Lawn mower 80 (1%) 0 (0%) 0 (0%) $5 (1%) Other known equipment other than electrical distribution or lighting equipment 1,650 (11%) 0 (0%) 27 (11%) $71 (10%) No equipment involved 710 (5%) 0 (0%) 14 (6%) $31 (4%) Unclassified equipment 280 (2%) 0 (0%) 12 (5%) $15 (2%) Total 15,610 (100%) 12 (100%) 254 (100%) $735 (100%)
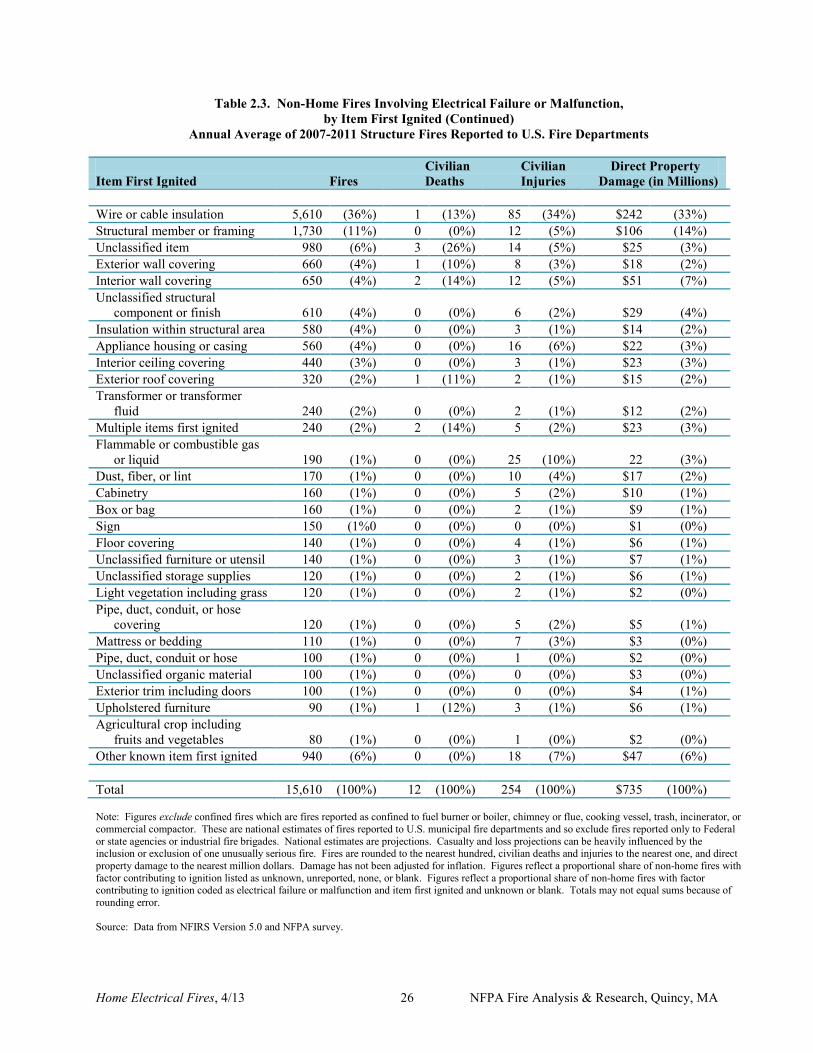
Home Electrical Fires, 4/13 26 NFPA Fire Analysis & Research, Quincy, MA
Table 2.3. Non-Home Fires Involving Electrical Failure or Malfunction, by Item First Ignited (Continued)
Annual Average of 2007-2011 Structure Fires Reported to U.S. Fire Departments Civilian Civilian Direct Property Item First Ignited Fires Deaths Injuries Damage (in Millions) Wire or cable insulation 5,610 (36%) 1 (13%) 85 (34%) $242 (33%) Structural member or framing 1,730 (11%) 0 (0%) 12 (5%) $106 (14%) Unclassified item 980 (6%) 3 (26%) 14 (5%) $25 (3%) Exterior wall covering 660 (4%) 1 (10%) 8 (3%) $18 (2%) Interior wall covering 650 (4%) 2 (14%) 12 (5%) $51 (7%) Unclassified structural component or finish 610 (4%) 0 (0%) 6 (2%) $29 (4%) Insulation within structural area 580 (4%) 0 (0%) 3 (1%) $14 (2%) Appliance housing or casing 560 (4%) 0 (0%) 16 (6%) $22 (3%) Interior ceiling covering 440 (3%) 0 (0%) 3 (1%) $23 (3%) Exterior roof covering 320 (2%) 1 (11%) 2 (1%) $15 (2%) Transformer or transformer fluid 240 (2%) 0 (0%) 2 (1%) $12 (2%) Multiple items first ignited 240 (2%) 2 (14%) 5 (2%) $23 (3%) Flammable or combustible gas or liquid 190 (1%) 0 (0%) 25 (10%) 22 (3%) Dust, fiber, or lint 170 (1%) 0 (0%) 10 (4%) $17 (2%) Cabinetry 160 (1%) 0 (0%) 5 (2%) $10 (1%) Box or bag 160 (1%) 0 (0%) 2 (1%) $9 (1%) Sign 150 (1%0 0 (0%) 0 (0%) $1 (0%) Floor covering 140 (1%) 0 (0%) 4 (1%) $6 (1%) Unclassified furniture or utensil 140 (1%) 0 (0%) 3 (1%) $7 (1%) Unclassified storage supplies 120 (1%) 0 (0%) 2 (1%) $6 (1%) Light vegetation including grass 120 (1%) 0 (0%) 2 (1%) $2 (0%) Pipe, duct, conduit, or hose covering 120 (1%) 0 (0%) 5 (2%) $5 (1%) Mattress or bedding 110 (1%) 0 (0%) 7 (3%) $3 (0%) Pipe, duct, conduit or hose 100 (1%) 0 (0%) 1 (0%) $2 (0%) Unclassified organic material 100 (1%) 0 (0%) 0 (0%) $3 (0%) Exterior trim including doors 100 (1%) 0 (0%) 0 (0%) $4 (1%) Upholstered furniture 90 (1%) 1 (12%) 3 (1%) $6 (1%) Agricultural crop including fruits and vegetables 80 (1%) 0 (0%) 1 (0%) $2 (0%) Other known item first ignited 940 (6%) 0 (0%) 18 (7%) $47 (6%) Total 15,610 (100%) 12 (100%) 254 (100%) $735 (100%) Note: Figures exclude confined fires which are fires reported as confined to fuel burner or boiler, chimney or flue, cooking vessel, trash, incinerator, or commercial compactor. These are national estimates of fires reported to U.S. municipal fire departments and so exclude fires reported only to Federal or state agencies or industrial fire brigades. National estimates are projections. Casualty and loss projections can be heavily influenced by the inclusion or exclusion of one unusually serious fire. Fires are rounded to the nearest hundred, civilian deaths and injuries to the nearest one, and direct property damage to the nearest million dollars. Damage has not been adjusted for inflation. Figures reflect a proportional share of non-home fires with factor contributing to ignition listed as unknown, unreported, none, or blank. Figures reflect a proportional share of non-home fires with factor contributing to ignition coded as electrical failure or malfunction and item first ignited and unknown or blank. Totals may not equal sums because of rounding error. Source: Data from NFIRS Version 5.0 and NFPA survey.
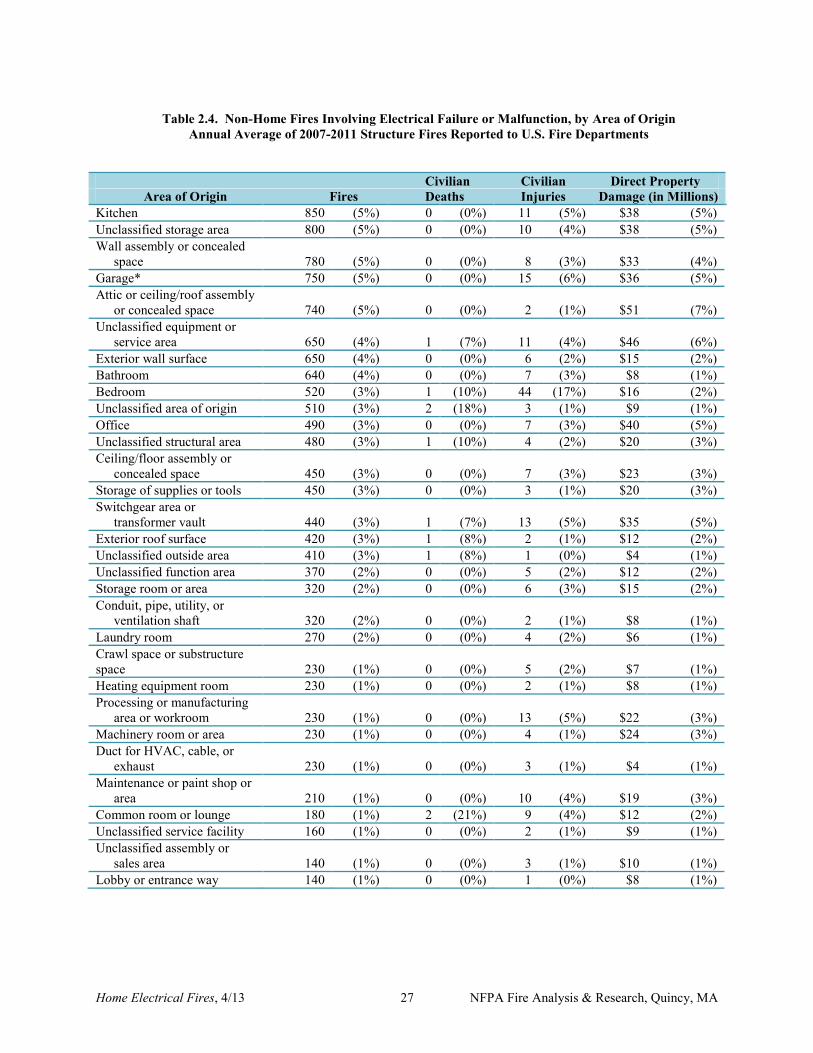
Home Electrical Fires, 4/13 27 NFPA Fire Analysis & Research, Quincy, MA
Table 2.4. Non-Home Fires Involving Electrical Failure or Malfunction, by Area of Origin
Annual Average of 2007-2011 Structure Fires Reported to U.S. Fire Departments
Civilian Civilian Direct Property Area of Origin Fires Deaths Injuries Damage (in Millions) Kitchen 850 (5%) 0 (0%) 11 (5%) $38 (5%) Unclassified storage area 800 (5%) 0 (0%) 10 (4%) $38 (5%) Wall assembly or concealed space 780 (5%) 0 (0%) 8 (3%) $33 (4%) Garage* 750 (5%) 0 (0%) 15 (6%) $36 (5%) Attic or ceiling/roof assembly or concealed space 740 (5%) 0 (0%) 2 (1%) $51 (7%) Unclassified equipment or service area 650 (4%) 1 (7%) 11 (4%) $46 (6%) Exterior wall surface 650 (4%) 0 (0%) 6 (2%) $15 (2%) Bathroom 640 (4%) 0 (0%) 7 (3%) $8 (1%) Bedroom 520 (3%) 1 (10%) 44 (17%) $16 (2%) Unclassified area of origin 510 (3%) 2 (18%) 3 (1%) $9 (1%) Office 490 (3%) 0 (0%) 7 (3%) $40 (5%) Unclassified structural area 480 (3%) 1 (10%) 4 (2%) $20 (3%) Ceiling/floor assembly or concealed space 450 (3%) 0 (0%) 7 (3%) $23 (3%) Storage of supplies or tools 450 (3%) 0 (0%) 3 (1%) $20 (3%) Switchgear area or transformer vault 440 (3%) 1 (7%) 13 (5%) $35 (5%) Exterior roof surface 420 (3%) 1 (8%) 2 (1%) $12 (2%) Unclassified outside area 410 (3%) 1 (8%) 1 (0%) $4 (1%) Unclassified function area 370 (2%) 0 (0%) 5 (2%) $12 (2%) Storage room or area 320 (2%) 0 (0%) 6 (3%) $15 (2%) Conduit, pipe, utility, or ventilation shaft 320 (2%) 0 (0%) 2 (1%) $8 (1%) Laundry room 270 (2%) 0 (0%) 4 (2%) $6 (1%) Crawl space or substructure space 230 (1%) 0 (0%) 5 (2%) $7 (1%) Heating equipment room 230 (1%) 0 (0%) 2 (1%) $8 (1%) Processing or manufacturing area or workroom 230 (1%) 0 (0%) 13 (5%) $22 (3%) Machinery room or area 230 (1%) 0 (0%) 4 (1%) $24 (3%) Duct for HVAC, cable, or exhaust 230 (1%) 0 (0%) 3 (1%) $4 (1%) Maintenance or paint shop or area 210 (1%) 0 (0%) 10 (4%) $19 (3%) Common room or lounge 180 (1%) 2 (21%) 9 (4%) $12 (2%) Unclassified service facility 160 (1%) 0 (0%) 2 (1%) $9 (1%) Unclassified assembly or sales area 140 (1%) 0 (0%) 3 (1%) $10 (1%) Lobby or entrance way 140 (1%) 0 (0%) 1 (0%) $8 (1%)
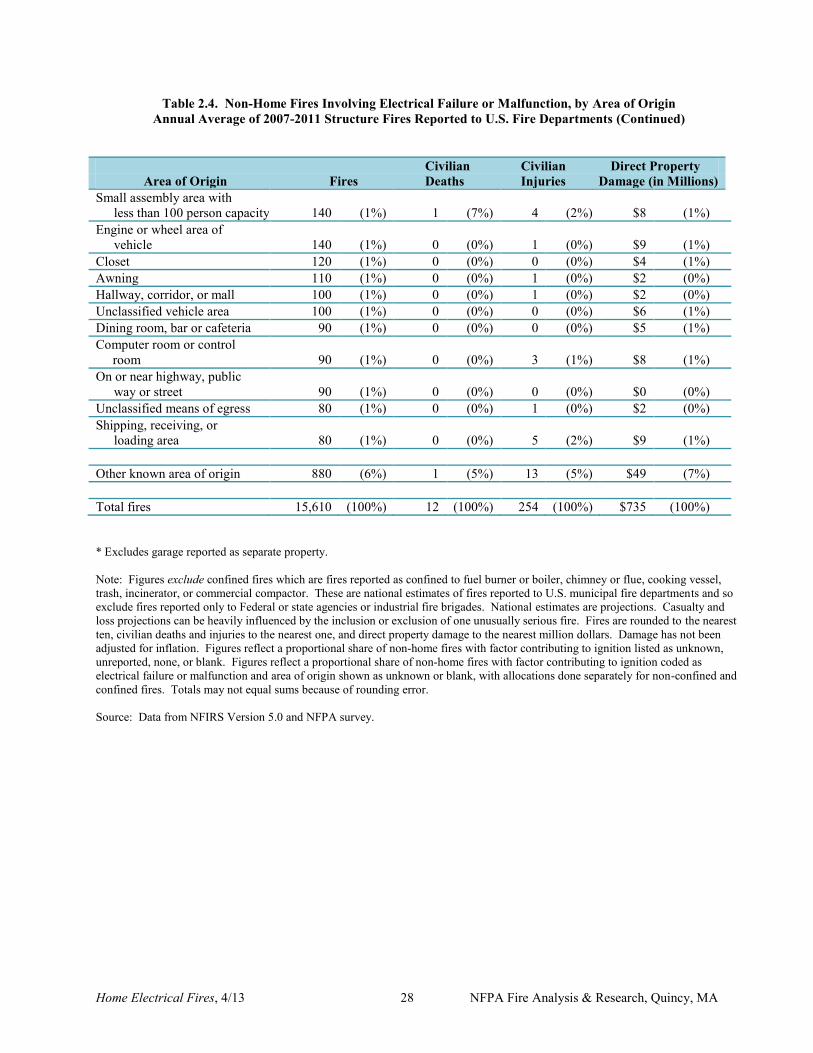
Home Electrical Fires, 4/13 28 NFPA Fire Analysis & Research, Quincy, MA
Table 2.4. Non-Home Fires Involving Electrical Failure or Malfunction, by Area of Origin Annual Average of 2007-2011 Structure Fires Reported to U.S. Fire Departments (Continued)
Civilian Civilian Direct Property Area of Origin Fires Deaths Injuries Damage (in Millions) Small assembly area with less than 100 person capacity 140 (1%) 1 (7%) 4 (2%) $8 (1%) Engine or wheel area of vehicle 140 (1%) 0 (0%) 1 (0%) $9 (1%) Closet 120 (1%) 0 (0%) 0 (0%) $4 (1%) Awning 110 (1%) 0 (0%) 1 (0%) $2 (0%) Hallway, corridor, or mall 100 (1%) 0 (0%) 1 (0%) $2 (0%) Unclassified vehicle area 100 (1%) 0 (0%) 0 (0%) $6 (1%) Dining room, bar or cafeteria 90 (1%) 0 (0%) 0 (0%) $5 (1%) Computer room or control room 90 (1%) 0 (0%) 3 (1%) $8 (1%) On or near highway, public way or street 90 (1%) 0 (0%) 0 (0%) $0 (0%) Unclassified means of egress 80 (1%) 0 (0%) 1 (0%) $2 (0%) Shipping, receiving, or loading area 80 (1%) 0 (0%) 5 (2%) $9 (1%) Other known area of origin 880 (6%) 1 (5%) 13 (5%) $49 (7%) Total fires 15,610 (100%) 12 (100%) 254 (100%) $735 (100%) * Excludes garage reported as separate property. Note: Figures exclude confined fires which are fires reported as confined to fuel burner or boiler, chimney or flue, cooking vessel, trash, incinerator, or commercial compactor. These are national estimates of fires reported to U.S. municipal fire departments and so exclude fires reported only to Federal or state agencies or industrial fire brigades. National estimates are projections. Casualty and loss projections can be heavily influenced by the inclusion or exclusion of one unusually serious fire. Fires are rounded to the nearest ten, civilian deaths and injuries to the nearest one, and direct property damage to the nearest million dollars. Damage has not been adjusted for inflation. Figures reflect a proportional share of non-home fires with factor contributing to ignition listed as unknown, unreported, none, or blank. Figures reflect a proportional share of non-home fires with factor contributing to ignition coded as electrical failure or malfunction and area of origin shown as unknown or blank, with allocations done separately for non-confined and confined fires. Totals may not equal sums because of rounding error. Source: Data from NFIRS Version 5.0 and NFPA survey.
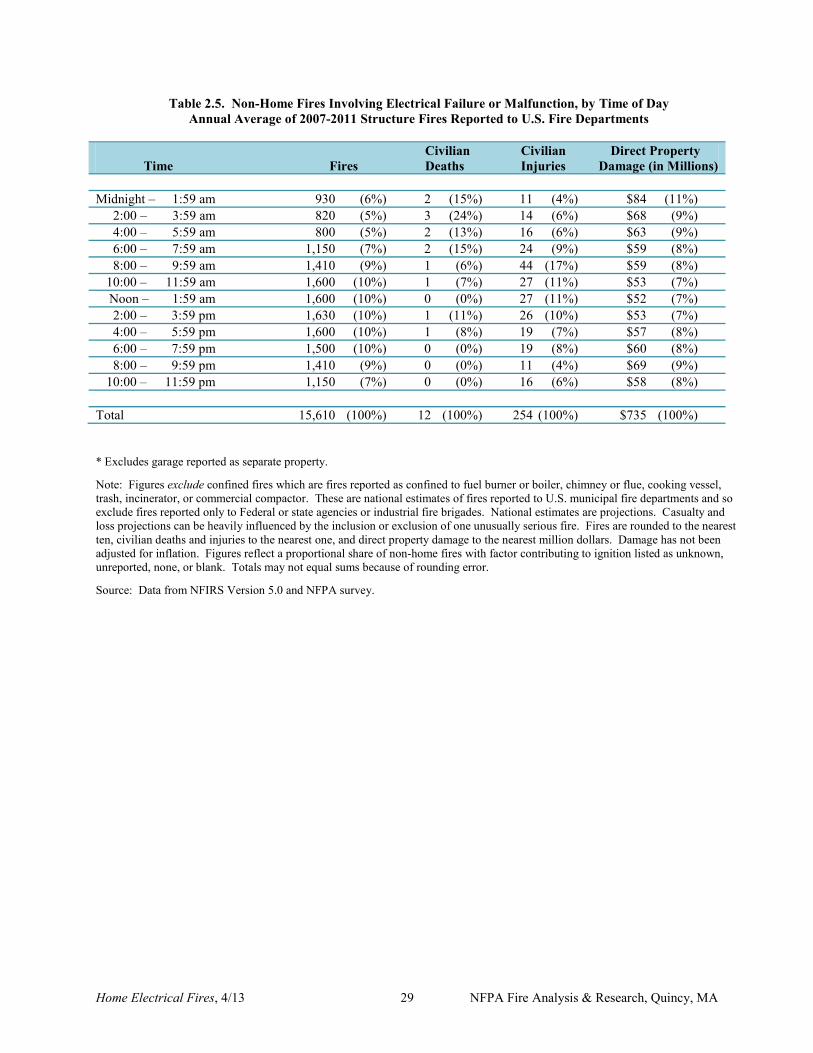
Home Electrical Fires, 4/13 29 NFPA Fire Analysis & Research, Quincy, MA
Table 2.5. Non-Home Fires Involving Electrical Failure or Malfunction, by Time of Day Annual Average of 2007-2011 Structure Fires Reported to U.S. Fire Departments
Civilian Civilian Direct Property Time Fires Deaths Injuries Damage (in Millions) Midnight – 1:59 am 930 (6%) 2 (15%) 11 (4%) $84 (11%) 2:00 – 3:59 am 820 (5%) 3 (24%) 14 (6%) $68 (9%) 4:00 – 5:59 am 800 (5%) 2 (13%) 16 (6%) $63 (9%) 6:00 – 7:59 am 1,150 (7%) 2 (15%) 24 (9%) $59 (8%) 8:00 – 9:59 am 1,410 (9%) 1 (6%) 44 (17%) $59 (8%) 10:00 – 11:59 am 1,600 (10%) 1 (7%) 27 (11%) $53 (7%) Noon – 1:59 am 1,600 (10%) 0 (0%) 27 (11%) $52 (7%) 2:00 – 3:59 pm 1,630 (10%) 1 (11%) 26 (10%) $53 (7%) 4:00 – 5:59 pm 1,600 (10%) 1 (8%) 19 (7%) $57 (8%) 6:00 – 7:59 pm 1,500 (10%) 0 (0%) 19 (8%) $60 (8%) 8:00 – 9:59 pm 1,410 (9%) 0 (0%) 11 (4%) $69 (9%) 10:00 – 11:59 pm 1,150 (7%) 0 (0%) 16 (6%) $58 (8%) Total 15,610 (100%) 12 (100%) 254 (100%) $735 (100%) * Excludes garage reported as separate property. Note: Figures exclude confined fires which are fires reported as confined to fuel burner or boiler, chimney or flue, cooking vessel, trash, incinerator, or commercial compactor. These are national estimates of fires reported to U.S. municipal fire departments and so exclude fires reported only to Federal or state agencies or industrial fire brigades. National estimates are projections. Casualty and loss projections can be heavily influenced by the inclusion or exclusion of one unusually serious fire. Fires are rounded to the nearest ten, civilian deaths and injuries to the nearest one, and direct property damage to the nearest million dollars. Damage has not been adjusted for inflation. Figures reflect a proportional share of non-home fires with factor contributing to ignition listed as unknown, unreported, none, or blank. Totals may not equal sums because of rounding error. Source: Data from NFIRS Version 5.0 and NFPA survey.
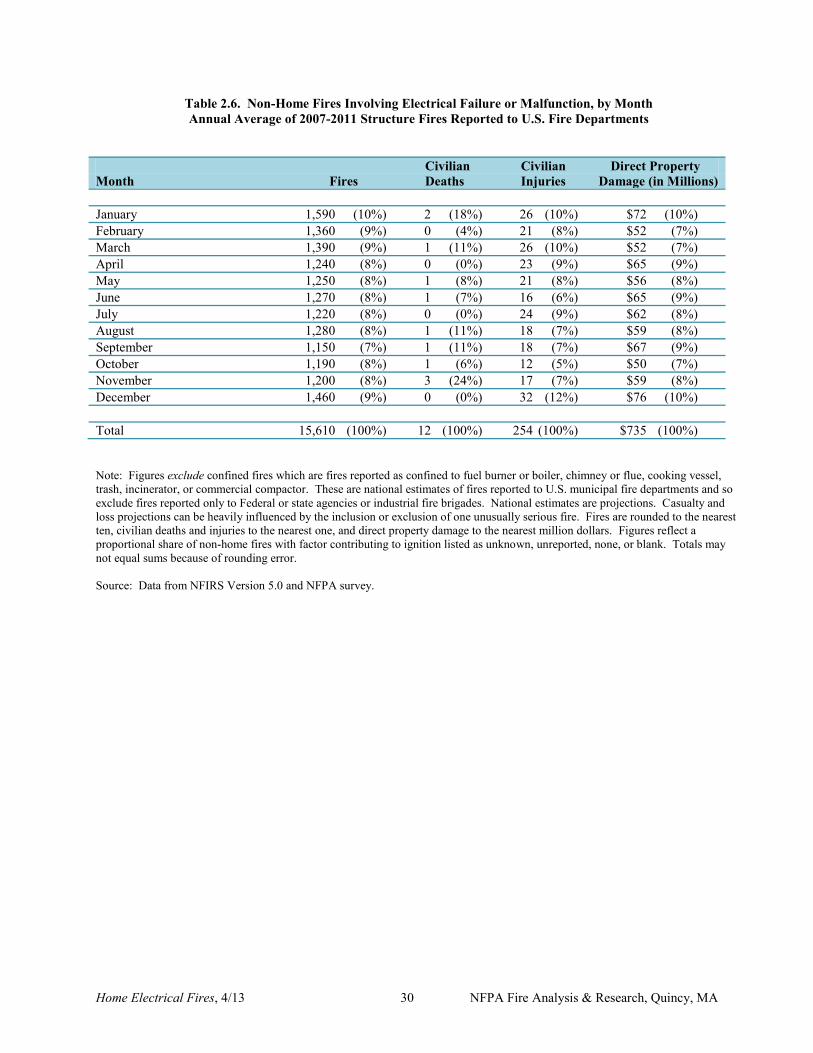
Home Electrical Fires, 4/13 30 NFPA Fire Analysis & Research, Quincy, MA
Table 2.6. Non-Home Fires Involving Electrical Failure or Malfunction, by Month Annual Average of 2007-2011 Structure Fires Reported to U.S. Fire Departments
Civilian Civilian Direct Property Month Fires Deaths Injuries Damage (in Millions) January 1,590 (10%) 2 (18%) 26 (10%) $72 (10%) February 1,360 (9%) 0 (4%) 21 (8%) $52 (7%) March 1,390 (9%) 1 (11%) 26 (10%) $52 (7%) April 1,240 (8%) 0 (0%) 23 (9%) $65 (9%) May 1,250 (8%) 1 (8%) 21 (8%) $56 (8%) June 1,270 (8%) 1 (7%) 16 (6%) $65 (9%) July 1,220 (8%) 0 (0%) 24 (9%) $62 (8%) August 1,280 (8%) 1 (11%) 18 (7%) $59 (8%) September 1,150 (7%) 1 (11%) 18 (7%) $67 (9%) October 1,190 (8%) 1 (6%) 12 (5%) $50 (7%) November 1,200 (8%) 3 (24%) 17 (7%) $59 (8%) December 1,460 (9%) 0 (0%) 32 (12%) $76 (10%) Total 15,610 (100%) 12 (100%) 254 (100%) $735 (100%) Note: Figures exclude confined fires which are fires reported as confined to fuel burner or boiler, chimney or flue, cooking vessel, trash, incinerator, or commercial compactor. These are national estimates of fires reported to U.S. municipal fire departments and so exclude fires reported only to Federal or state agencies or industrial fire brigades. National estimates are projections. Casualty and loss projections can be heavily influenced by the inclusion or exclusion of one unusually serious fire. Fires are rounded to the nearest ten, civilian deaths and injuries to the nearest one, and direct property damage to the nearest million dollars. Figures reflect a proportional share of non-home fires with factor contributing to ignition listed as unknown, unreported, none, or blank. Totals may not equal sums because of rounding error. Source: Data from NFIRS Version 5.0 and NFPA survey.
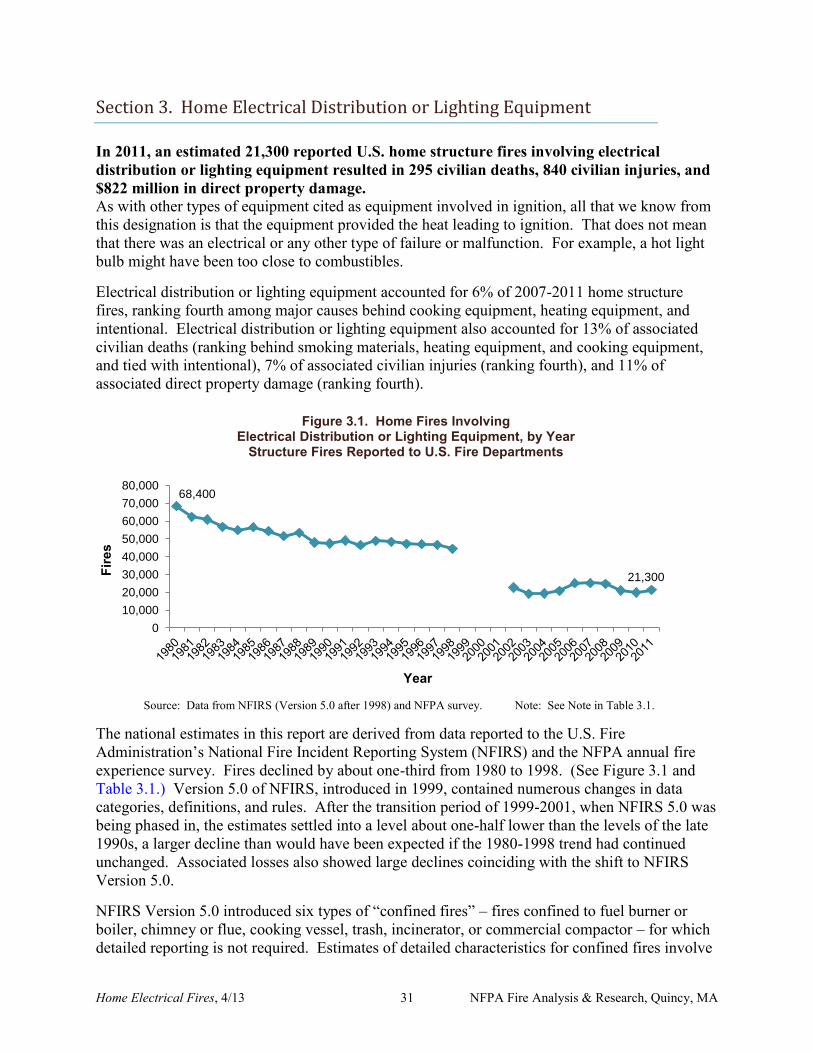
Home Electrical Fires, 4/13 31 NFPA Fire Analysis & Research, Quincy, MA
Section 3. Home Electrical Distribution or Lighting Equipment
In 2011, an estimated 21,300 reported U.S. home structure fires involving electrical distribution or lighting equipment resulted in 295 civilian deaths, 840 civilian injuries, and $822 million in direct property damage. As with other types of equipment cited as equipment involved in ignition, all that we know from this designation is that the equipment provided the heat leading to ignition. That does not mean that there was an electrical or any other type of failure or malfunction. For example, a hot light bulb might have been too close to combustibles. Electrical distribution or lighting equipment accounted for 6% of 2007-2011 home structure fires, ranking fourth among major causes behind cooking equipment, heating equipment, and intentional. Electrical distribution or lighting equipment also accounted for 13% of associated civilian deaths (ranking behind smoking materials, heating equipment, and cooking equipment, and tied with intentional), 7% of associated civilian injuries (ranking fourth), and 11% of associated direct property damage (ranking fourth).
Source: Data from NFIRS (Version 5.0 after 1998) and NFPA survey. Note: See Note in Table 3.1. The national estimates in this report are derived from data reported to the U.S. Fire Administration’s National Fire Incident Reporting System (NFIRS) and the NFPA annual fire experience survey. Fires declined by about one-third from 1980 to 1998. (See Figure 3.1 and Table 3.1.) Version 5.0 of NFIRS, introduced in 1999, contained numerous changes in data categories, definitions, and rules. After the transition period of 1999-2001, when NFIRS 5.0 was being phased in, the estimates settled into a level about one-half lower than the levels of the late 1990s, a larger decline than would have been expected if the 1980-1998 trend had continued unchanged. Associated losses also showed large declines coinciding with the shift to NFIRS Version 5.0. NFIRS Version 5.0 introduced six types of “confined fires” – fires confined to fuel burner or boiler, chimney or flue, cooking vessel, trash, incinerator, or commercial compactor – for which detailed reporting is not required. Estimates of detailed characteristics for confined fires involve
68,400
21,300
0
10,000
20,000
30,000
40,000
50,000
60,000
70,000
80,000
Fire
s
Year
Figure 3.1. Home Fires Involving Electrical Distribution or Lighting Equipment, by Year
Structure Fires Reported to U.S. Fire Departments
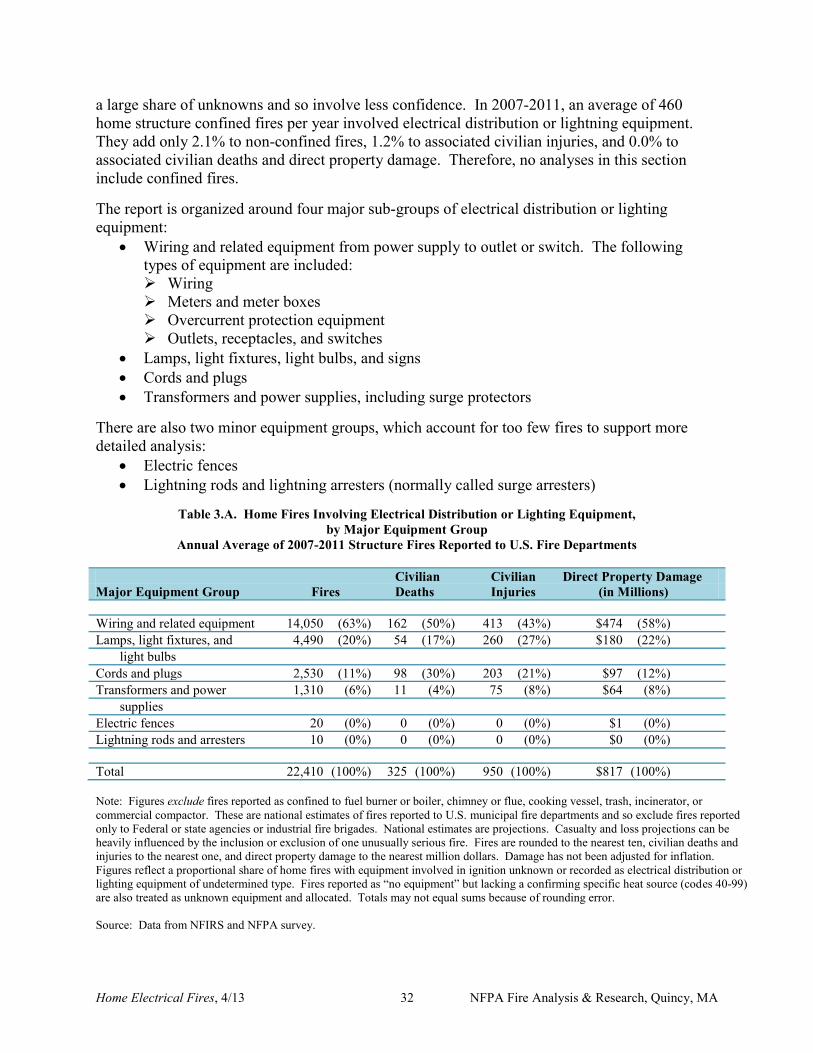
Home Electrical Fires, 4/13 32 NFPA Fire Analysis & Research, Quincy, MA
a large share of unknowns and so involve less confidence. In 2007-2011, an average of 460 home structure confined fires per year involved electrical distribution or lightning equipment. They add only 2.1% to non-confined fires, 1.2% to associated civilian injuries, and 0.0% to associated civilian deaths and direct property damage. Therefore, no analyses in this section include confined fires. The report is organized around four major sub-groups of electrical distribution or lighting equipment:
Wiring and related equipment from power supply to outlet or switch. The following types of equipment are included: Wiring Meters and meter boxes Overcurrent protection equipment Outlets, receptacles, and switches
Lamps, light fixtures, light bulbs, and signs Cords and plugs Transformers and power supplies, including surge protectors
There are also two minor equipment groups, which account for too few fires to support more detailed analysis:
Electric fences Lightning rods and lightning arresters (normally called surge arresters)
Table 3.A. Home Fires Involving Electrical Distribution or Lighting Equipment,
by Major Equipment Group Annual Average of 2007-2011 Structure Fires Reported to U.S. Fire Departments
Civilian Civilian Direct Property Damage Major Equipment Group Fires Deaths Injuries (in Millions) Wiring and related equipment 14,050 (63%) 162 (50%) 413 (43%) $474 (58%) Lamps, light fixtures, and 4,490 (20%) 54 (17%) 260 (27%) $180 (22%) light bulbs Cords and plugs 2,530 (11%) 98 (30%) 203 (21%) $97 (12%) Transformers and power 1,310 (6%) 11 (4%) 75 (8%) $64 (8%) supplies Electric fences 20 (0%) 0 (0%) 0 (0%) $1 (0%) Lightning rods and arresters 10 (0%) 0 (0%) 0 (0%) $0 (0%) Total 22,410 (100%) 325 (100%) 950 (100%) $817 (100%) Note: Figures exclude fires reported as confined to fuel burner or boiler, chimney or flue, cooking vessel, trash, incinerator, or commercial compactor. These are national estimates of fires reported to U.S. municipal fire departments and so exclude fires reported only to Federal or state agencies or industrial fire brigades. National estimates are projections. Casualty and loss projections can be heavily influenced by the inclusion or exclusion of one unusually serious fire. Fires are rounded to the nearest ten, civilian deaths and injuries to the nearest one, and direct property damage to the nearest million dollars. Damage has not been adjusted for inflation. Figures reflect a proportional share of home fires with equipment involved in ignition unknown or recorded as electrical distribution or lighting equipment of undetermined type. Fires reported as “no equipment” but lacking a confirming specific heat source (codes 40-99) are also treated as unknown equipment and allocated. Totals may not equal sums because of rounding error. Source: Data from NFIRS and NFPA survey.
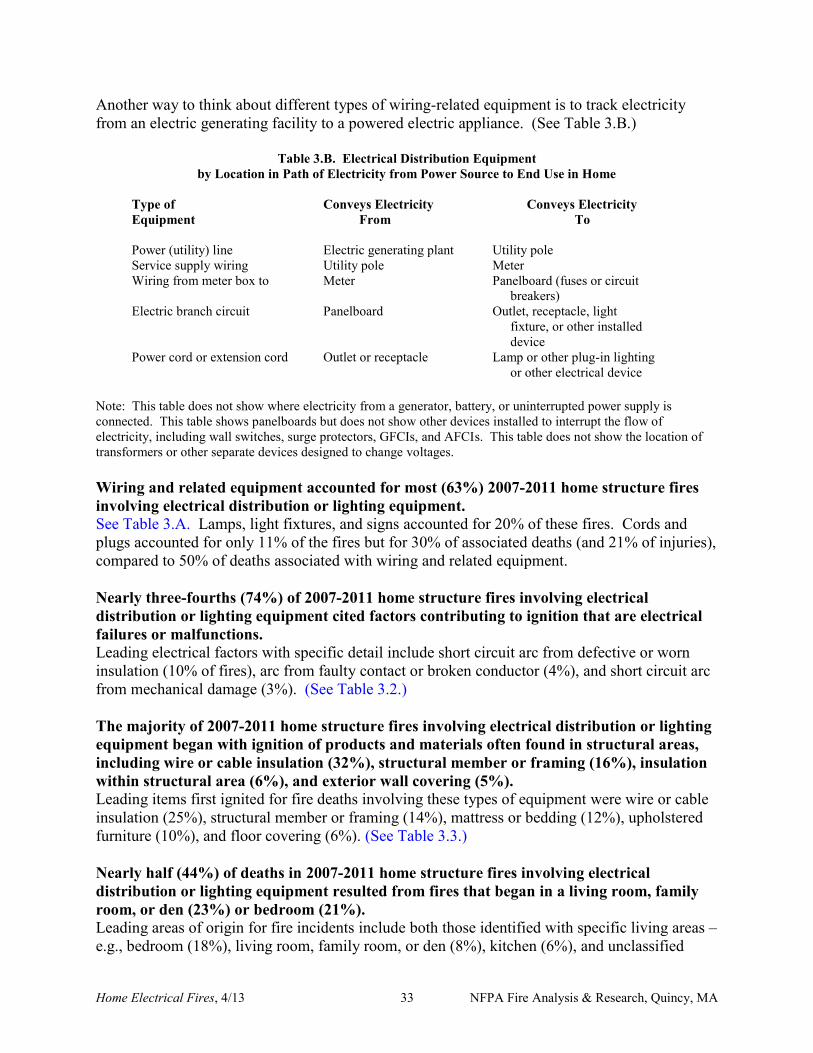
Home Electrical Fires, 4/13 33 NFPA Fire Analysis & Research, Quincy, MA
Another way to think about different types of wiring-related equipment is to track electricity from an electric generating facility to a powered electric appliance. (See Table 3.B.)
Table 3.B. Electrical Distribution Equipment by Location in Path of Electricity from Power Source to End Use in Home
Type of Conveys Electricity Conveys Electricity Equipment From To Power (utility) line Electric generating plant Utility pole Service supply wiring Utility pole Meter Wiring from meter box to panelboard
Meter Panelboard (fuses or circuit breakers)
Electric branch circuit Panelboard Outlet, receptacle, light fixture, or other installed device
Power cord or extension cord Outlet or receptacle Lamp or other plug-in lighting or other electrical device
Note: This table does not show where electricity from a generator, battery, or uninterrupted power supply is connected. This table shows panelboards but does not show other devices installed to interrupt the flow of electricity, including wall switches, surge protectors, GFCIs, and AFCIs. This table does not show the location of transformers or other separate devices designed to change voltages. Wiring and related equipment accounted for most (63%) 2007-2011 home structure fires involving electrical distribution or lighting equipment. See Table 3.A. Lamps, light fixtures, and signs accounted for 20% of these fires. Cords and plugs accounted for only 11% of the fires but for 30% of associated deaths (and 21% of injuries), compared to 50% of deaths associated with wiring and related equipment. Nearly three-fourths (74%) of 2007-2011 home structure fires involving electrical distribution or lighting equipment cited factors contributing to ignition that are electrical failures or malfunctions. Leading electrical factors with specific detail include short circuit arc from defective or worn insulation (10% of fires), arc from faulty contact or broken conductor (4%), and short circuit arc from mechanical damage (3%). (See Table 3.2.) The majority of 2007-2011 home structure fires involving electrical distribution or lighting equipment began with ignition of products and materials often found in structural areas, including wire or cable insulation (32%), structural member or framing (16%), insulation within structural area (6%), and exterior wall covering (5%). Leading items first ignited for fire deaths involving these types of equipment were wire or cable insulation (25%), structural member or framing (14%), mattress or bedding (12%), upholstered furniture (10%), and floor covering (6%). (See Table 3.3.) Nearly half (44%) of deaths in 2007-2011 home structure fires involving electrical distribution or lighting equipment resulted from fires that began in a living room, family room, or den (23%) or bedroom (21%). Leading areas of origin for fire incidents include both those identified with specific living areas – e.g., bedroom (18%), living room, family room, or den (8%), kitchen (6%), and unclassified
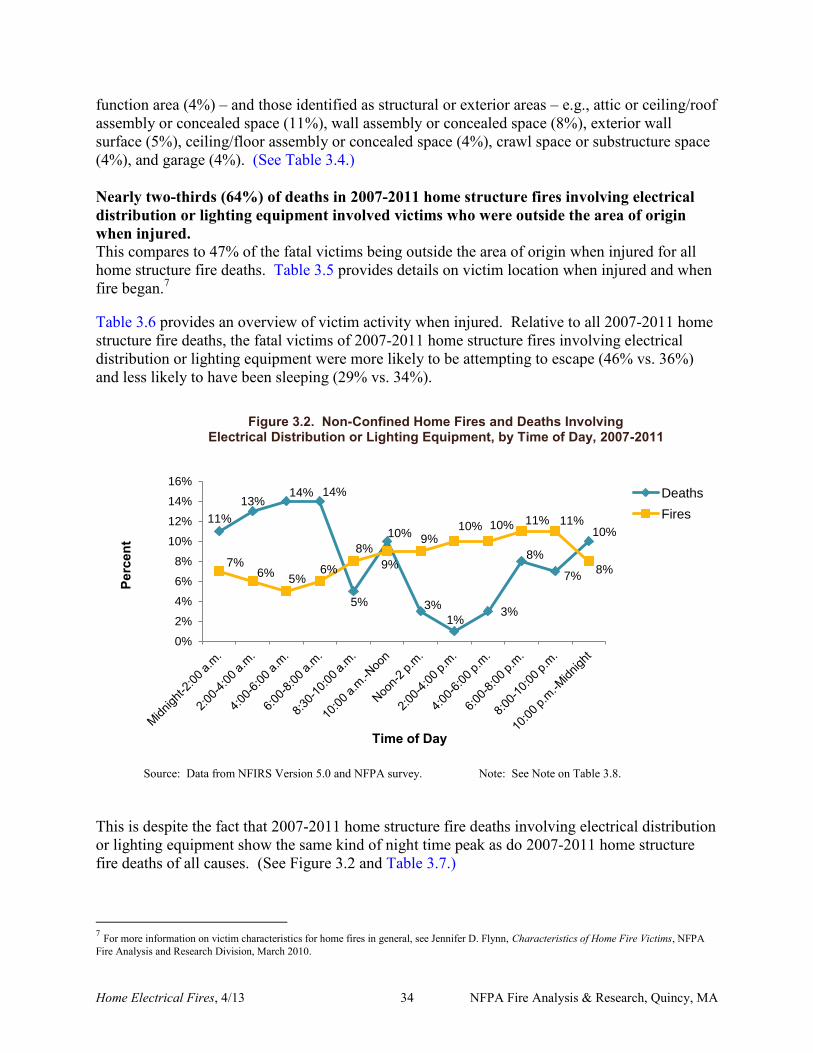
Home Electrical Fires, 4/13 34 NFPA Fire Analysis & Research, Quincy, MA
function area (4%) – and those identified as structural or exterior areas – e.g., attic or ceiling/roof assembly or concealed space (11%), wall assembly or concealed space (8%), exterior wall surface (5%), ceiling/floor assembly or concealed space (4%), crawl space or substructure space (4%), and garage (4%). (See Table 3.4.) Nearly two-thirds (64%) of deaths in 2007-2011 home structure fires involving electrical distribution or lighting equipment involved victims who were outside the area of origin when injured. This compares to 47% of the fatal victims being outside the area of origin when injured for all home structure fire deaths. Table 3.5 provides details on victim location when injured and when fire began.7 Table 3.6 provides an overview of victim activity when injured. Relative to all 2007-2011 home structure fire deaths, the fatal victims of 2007-2011 home structure fires involving electrical distribution or lighting equipment were more likely to be attempting to escape (46% vs. 36%) and less likely to have been sleeping (29% vs. 34%).
Source: Data from NFIRS Version 5.0 and NFPA survey. Note: See Note on Table 3.8.
This is despite the fact that 2007-2011 home structure fire deaths involving electrical distribution or lighting equipment show the same kind of night time peak as do 2007-2011 home structure fire deaths of all causes. (See Figure 3.2 and Table 3.7.)
7 For more information on victim characteristics for home fires in general, see Jennifer D. Flynn, Characteristics of Home Fire Victims, NFPA Fire Analysis and Research Division, March 2010.
11%
13% 14% 14%
5%
10%
3%
1% 3%
8%
7%
10%
7% 6%
5% 6%
8%
9%
9% 10% 10% 11% 11%
8%
0%
2%
4%
6%
8%
10%
12%
14%
16%
Perc
ent
Time of Day
Figure 3.2. Non-Confined Home Fires and Deaths Involving Electrical Distribution or Lighting Equipment, by Time of Day, 2007-2011
Deaths
Fires
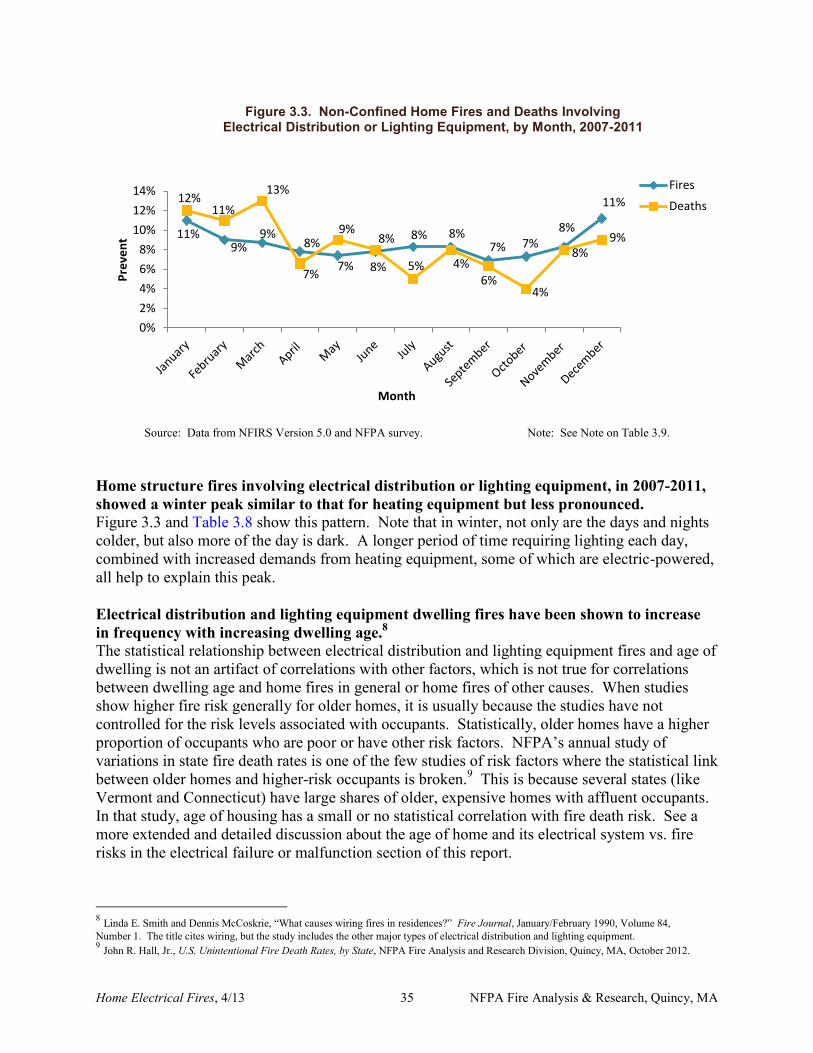
Home Electrical Fires, 4/13 35 NFPA Fire Analysis & Research, Quincy, MA
Source: Data from NFIRS Version 5.0 and NFPA survey. Note: See Note on Table 3.9. Home structure fires involving electrical distribution or lighting equipment, in 2007-2011, showed a winter peak similar to that for heating equipment but less pronounced. Figure 3.3 and Table 3.8 show this pattern. Note that in winter, not only are the days and nights colder, but also more of the day is dark. A longer period of time requiring lighting each day, combined with increased demands from heating equipment, some of which are electric-powered, all help to explain this peak. Electrical distribution and lighting equipment dwelling fires have been shown to increase in frequency with increasing dwelling age.8 The statistical relationship between electrical distribution and lighting equipment fires and age of dwelling is not an artifact of correlations with other factors, which is not true for correlations between dwelling age and home fires in general or home fires of other causes. When studies show higher fire risk generally for older homes, it is usually because the studies have not controlled for the risk levels associated with occupants. Statistically, older homes have a higher proportion of occupants who are poor or have other risk factors. NFPA’s annual study of variations in state fire death rates is one of the few studies of risk factors where the statistical link between older homes and higher-risk occupants is broken.9 This is because several states (like Vermont and Connecticut) have large shares of older, expensive homes with affluent occupants. In that study, age of housing has a small or no statistical correlation with fire death risk. See a more extended and detailed discussion about the age of home and its electrical system vs. fire risks in the electrical failure or malfunction section of this report.
8 Linda E. Smith and Dennis McCoskrie, “What causes wiring fires in residences?” Fire Journal, January/February 1990, Volume 84, Number 1. The title cites wiring, but the study includes the other major types of electrical distribution and lighting equipment. 9 John R. Hall, Jr., U.S. Unintentional Fire Death Rates, by State, NFPA Fire Analysis and Research Division, Quincy, MA, October 2012.
11% 9%
9%
7% 7%
8% 8% 8% 7% 7%
8%
11% 12% 11%
13%
8% 9%
8% 5% 4%
6% 4%
8% 9%
0%
2%
4%
6%
8%
10%
12%
14%
Pre
ven
t
Month
Figure 3.3. Non-Confined Home Fires and Deaths Involving Electrical Distribution or Lighting Equipment, by Month, 2007-2011
Fires
Deaths
Home Electrical Fires, 4/13 36 NFPA Fire Analysis & Research, Quincy, MA
In 1999 to 2011, 695 people died of non-fire injuries from unvented carbon monoxide from generators, or 58 deaths per year.10 Generators are the only electrical distribution or lighting equipment that burn fuel, which makes them the only electrical distribution or lighting equipment that generates carbon monoxide. (Fueled lighting devices are not included in the scope of this report.) The death toll from carbon monoxide produced by generators has increased sharply in recent years until 2007, from less than 10 per year on average in 1999 and prior years to 19 per year in 2000-2001, 47 per year in 2002-2004, peaking at 92 per year in 2005-2006, then falling to 72 per year in 2007-2009, down to 39 in 2010, and back up to 73 in 2011. The large jump in deaths involving generators in 2000 may reflect the fact that roughly half the total generators in use in 2000 had been purchased in 1999 because of concerns over Y2K (year 2000) problems with the nation’s power grid.11 This meant a large number of generator users had no experience in safe generator use. Disasters like Hurricane Katrina and a series of Florida hurricanes have added to the demand for generators and probably added to the number of inexperienced users. The U.S. Consumer Product Safety Commission examined the circumstances of the 695 non-fire carbon monoxide generator deaths in 1999-2011. One-eighth (84 deaths) of the 687 deaths in known locations occurred in temporary shelters. Of the 755 deaths where the reason for generator use was known:
30% involved generator usage because of a weather-related power outage (29%) or because of preparation for a coming storm (1%),
30% involved generator usage because power had been shut off because of non-payment (19%) or because power had not been turned on in a building still under construction (11%),
22% involved generator use in either a building that does normally have power (7%) or a property separate from the main housing unit (15%), such as a storage shed, trailer, boat, camper, cabin, or campsite, and
19% involved generator use in a power outage due to unknown reasons (16%) or for miscellaneous other reasons (3%).
CPSC analyzed the 310 deaths in incidents where it was known whether a carbon monoxide detector was present. Of these deaths, 287 (93%) were in locations with no CO detector and 23 (7%) were in locations with a CO detector. Of the 18 deaths in locations with CO detectors and where it was known whether the CO detector alarmed, 14 did not alarm because of no power (7 plug-in types that were not connected to power and 7 battery-powered types with batteries removed or incorrectly inserted), 2 did not alarm for unknown reasons, and 2 alarmed.
10 Matthew V. Hnatov, Incidents, deaths and in-depth investigations associated with non-fire carbon monoxide from engine-driven generators and other engine-driven tools, 1999-2011, U.S. Consumer Product Safety Commission, July 2012, accessed at www.cpsc.gov. 11 Portable Generators, U.S. Consumer Product Safety Commission, May 20, 2004, accessed at www.cpsc.gov.
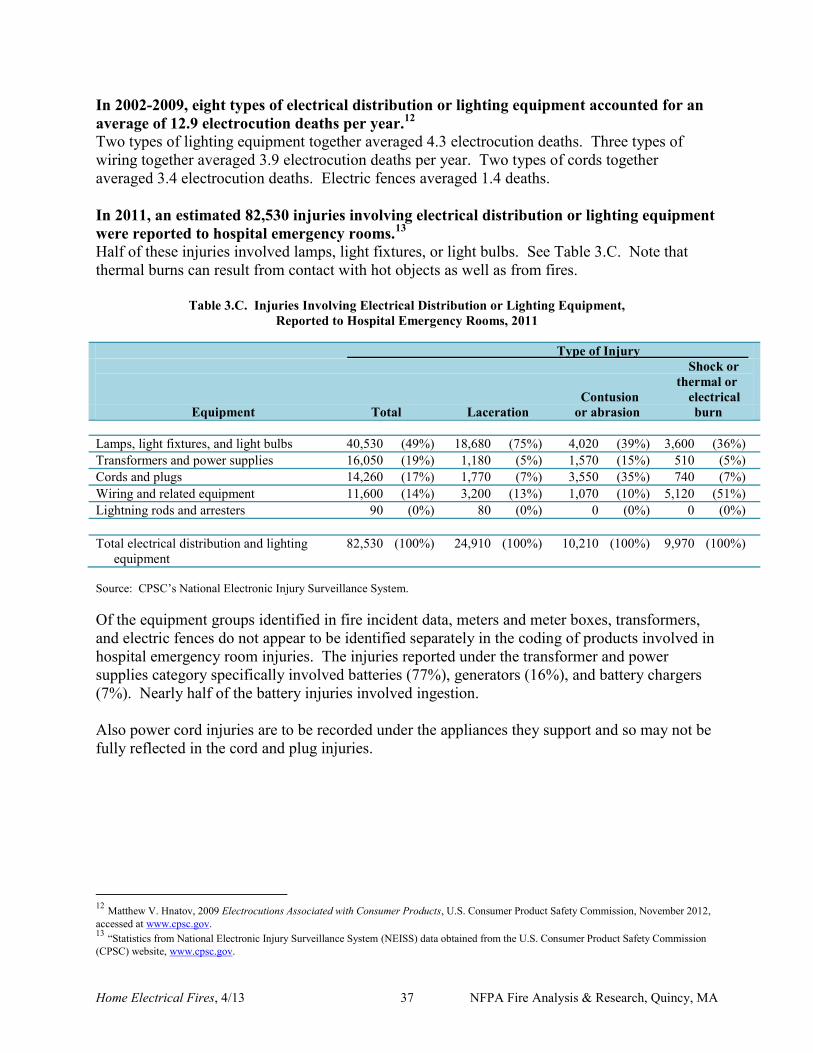
Home Electrical Fires, 4/13 37 NFPA Fire Analysis & Research, Quincy, MA
In 2002-2009, eight types of electrical distribution or lighting equipment accounted for an average of 12.9 electrocution deaths per year.12 Two types of lighting equipment together averaged 4.3 electrocution deaths. Three types of wiring together averaged 3.9 electrocution deaths per year. Two types of cords together averaged 3.4 electrocution deaths. Electric fences averaged 1.4 deaths. In 2011, an estimated 82,530 injuries involving electrical distribution or lighting equipment were reported to hospital emergency rooms.13 Half of these injuries involved lamps, light fixtures, or light bulbs. See Table 3.C. Note that thermal burns can result from contact with hot objects as well as from fires.
Table 3.C. Injuries Involving Electrical Distribution or Lighting Equipment, Reported to Hospital Emergency Rooms, 2011
Type of Injury Shock or thermal or Contusion electrical Equipment Total Laceration or abrasion burn Lamps, light fixtures, and light bulbs 40,530 (49%) 18,680 (75%) 4,020 (39%) 3,600 (36%) Transformers and power supplies 16,050 (19%) 1,180 (5%) 1,570 (15%) 510 (5%) Cords and plugs 14,260 (17%) 1,770 (7%) 3,550 (35%) 740 (7%) Wiring and related equipment 11,600 (14%) 3,200 (13%) 1,070 (10%) 5,120 (51%) Lightning rods and arresters 90 (0%) 80 (0%) 0 (0%) 0 (0%) Total electrical distribution and lighting 82,530 (100%) 24,910 (100%) 10,210 (100%) 9,970 (100%) equipment Source: CPSC’s National Electronic Injury Surveillance System. Of the equipment groups identified in fire incident data, meters and meter boxes, transformers, and electric fences do not appear to be identified separately in the coding of products involved in hospital emergency room injuries. The injuries reported under the transformer and power supplies category specifically involved batteries (77%), generators (16%), and battery chargers (7%). Nearly half of the battery injuries involved ingestion. Also power cord injuries are to be recorded under the appliances they support and so may not be fully reflected in the cord and plug injuries.
12 Matthew V. Hnatov, 2009 Electrocutions Associated with Consumer Products, U.S. Consumer Product Safety Commission, November 2012, accessed at www.cpsc.gov. 13 “Statistics from National Electronic Injury Surveillance System (NEISS) data obtained from the U.S. Consumer Product Safety Commission (CPSC) website, www.cpsc.gov.
Home Electrical Fires, 4/13 38 NFPA Fire Analysis & Research, Quincy, MA
Safety Tips
Home electrical safety begins with NFPA 70, National Electrical Code® and related documents with special relevance to homes, notably NFPA 73, Electrical Inspection Code for Existing Dwellings. However, work on home electrical distribution or lighting equipment should only be conducted by someone qualified as an electrician. When you are buying, selling or remodeling a home, have it inspected by a professional electrician.
Call a qualified electrician or landlord if you have recurring problems with blowing fuses or tripping circuit breakers, a tingling feeling when you touch an electrical appliance, discolored or warm wall outlets, a burning smell or rubbery odor coming from an appliance, flickering lights, sparks from an outlet, cracked or broken outlets.
Keep lamps, light fixtures, and light bulbs away from anything that can burn, including
lamp shades, furniture, bedding, curtains, clothing, and flammable or combustible gases and liquids.
Never place clothing over a lamp or a cloth over a light bulb. Place lamps away from where people and pets walk or where things might fall against
them. Use light bulbs that match the recommended wattage on the lamp or fixture.
If a fuse blows or a circuit breaker trips often, find out why and correct the problem. Replace fuses with the proper rating for the circuit they protect. Never replace a fuse with a higher rated fuse. If the problem continues, call an electrician.
Only plug one heat-producing appliance (such as a coffee maker, toaster, space heater,
etc.) into a receptacle outlet at a time. Never plug a major appliance into an extension cord. Buy only appliances that have the label of a recognized testing laboratory. Replace cracked electrical cords. If you have older cords with cloth covering, check for
fraying as well, and replace any frayed cords. Pinching cords against walls or furniture or running them under carpets or across
doorways can cause a fire. Use extension cords for temporary wiring only. Consider having additional circuits or receptacles added by a qualified electrician. Receptacle outlets and switches should have wall plates to prevent shocks. Homes with young children should have tamper-resistant electrical receptacles.
If an appliance is malfunctioning, unplug it if it is safe to do so. If necessary, cut off
power by unscrewing a fuse or turning off the circuit breaker.
Home Electrical Fires, 4/13 39 NFPA Fire Analysis & Research, Quincy, MA
Arc fault circuit interrupters (AFCIs) are a type of circuit breaker that shuts off electricity when a dangerous arcing condition occurs. Consider having them installed in your home. Use a qualified electrician.
Ground fault circuit interrupters (GFCIs) reduce the risk of shock. Test AFCIs and GFCIs once a month to make sure they are working properly.
Keep ladders at least 10 feet away from overhead power lines including the electrical
service into your home. Never touch a power line. Stay at a safe distance – you could be electrocuted. Report downed power lines to authorities. Some power lines are underground. Call your local utility before digging.
More of NFPA’s electrical safety information is available on our website at www.nfpa.org/electricalfires.
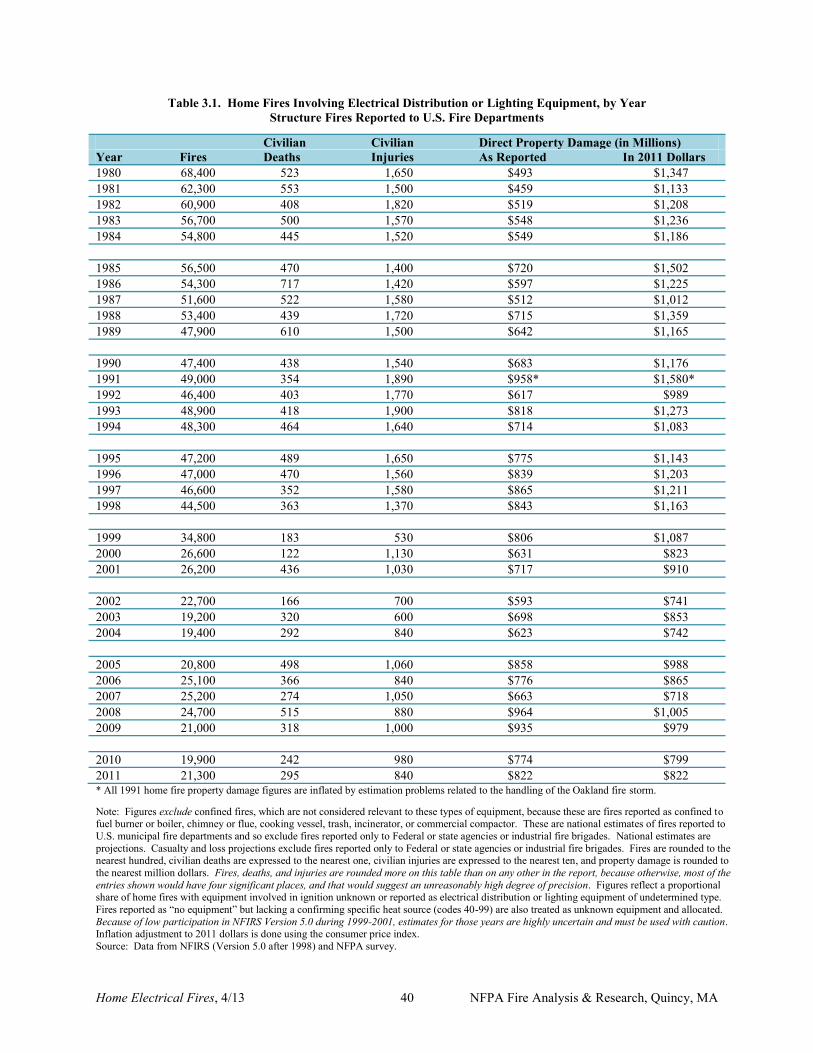
Home Electrical Fires, 4/13 40 NFPA Fire Analysis & Research, Quincy, MA
Table 3.1. Home Fires Involving Electrical Distribution or Lighting Equipment, by Year Structure Fires Reported to U.S. Fire Departments
Civilian Civilian Direct Property Damage (in Millions) Year Fires Deaths Injuries As Reported In 2011 Dollars 1980 68,400 523 1,650 $493 $1,347 1981 62,300 553 1,500 $459 $1,133 1982 60,900 408 1,820 $519 $1,208 1983 56,700 500 1,570 $548 $1,236 1984 54,800 445 1,520 $549 $1,186 1985 56,500 470 1,400 $720 $1,502 1986 54,300 717 1,420 $597 $1,225 1987 51,600 522 1,580 $512 $1,012 1988 53,400 439 1,720 $715 $1,359 1989 47,900 610 1,500 $642 $1,165 1990 47,400 438 1,540 $683 $1,176 1991 49,000 354 1,890 $958* $1,580* 1992 46,400 403 1,770 $617 $989 1993 48,900 418 1,900 $818 $1,273 1994 48,300 464 1,640 $714 $1,083 1995 47,200 489 1,650 $775 $1,143 1996 47,000 470 1,560 $839 $1,203 1997 46,600 352 1,580 $865 $1,211 1998 44,500 363 1,370 $843 $1,163 1999 34,800 183 530 $806 $1,087 2000 26,600 122 1,130 $631 $823 2001 26,200 436 1,030 $717 $910 2002 22,700 166 700 $593 $741 2003 19,200 320 600 $698 $853 2004 19,400 292 840 $623 $742 2005 20,800 498 1,060 $858 $988 2006 25,100 366 840 $776 $865 2007 25,200 274 1,050 $663 $718 2008 24,700 515 880 $964 $1,005 2009 21,000 318 1,000 $935 $979 2010 19,900 242 980 $774 $799 2011 21,300 295 840 $822 $822 * All 1991 home fire property damage figures are inflated by estimation problems related to the handling of the Oakland fire storm. Note: Figures exclude confined fires, which are not considered relevant to these types of equipment, because these are fires reported as confined to fuel burner or boiler, chimney or flue, cooking vessel, trash, incinerator, or commercial compactor. These are national estimates of fires reported to U.S. municipal fire departments and so exclude fires reported only to Federal or state agencies or industrial fire brigades. National estimates are projections. Casualty and loss projections exclude fires reported only to Federal or state agencies or industrial fire brigades. Fires are rounded to the nearest hundred, civilian deaths are expressed to the nearest one, civilian injuries are expressed to the nearest ten, and property damage is rounded to the nearest million dollars. Fires, deaths, and injuries are rounded more on this table than on any other in the report, because otherwise, most of the entries shown would have four significant places, and that would suggest an unreasonably high degree of precision. Figures reflect a proportional share of home fires with equipment involved in ignition unknown or reported as electrical distribution or lighting equipment of undetermined type. Fires reported as “no equipment” but lacking a confirming specific heat source (codes 40-99) are also treated as unknown equipment and allocated. Because of low participation in NFIRS Version 5.0 during 1999-2001, estimates for those years are highly uncertain and must be used with caution. Inflation adjustment to 2011 dollars is done using the consumer price index. Source: Data from NFIRS (Version 5.0 after 1998) and NFPA survey.
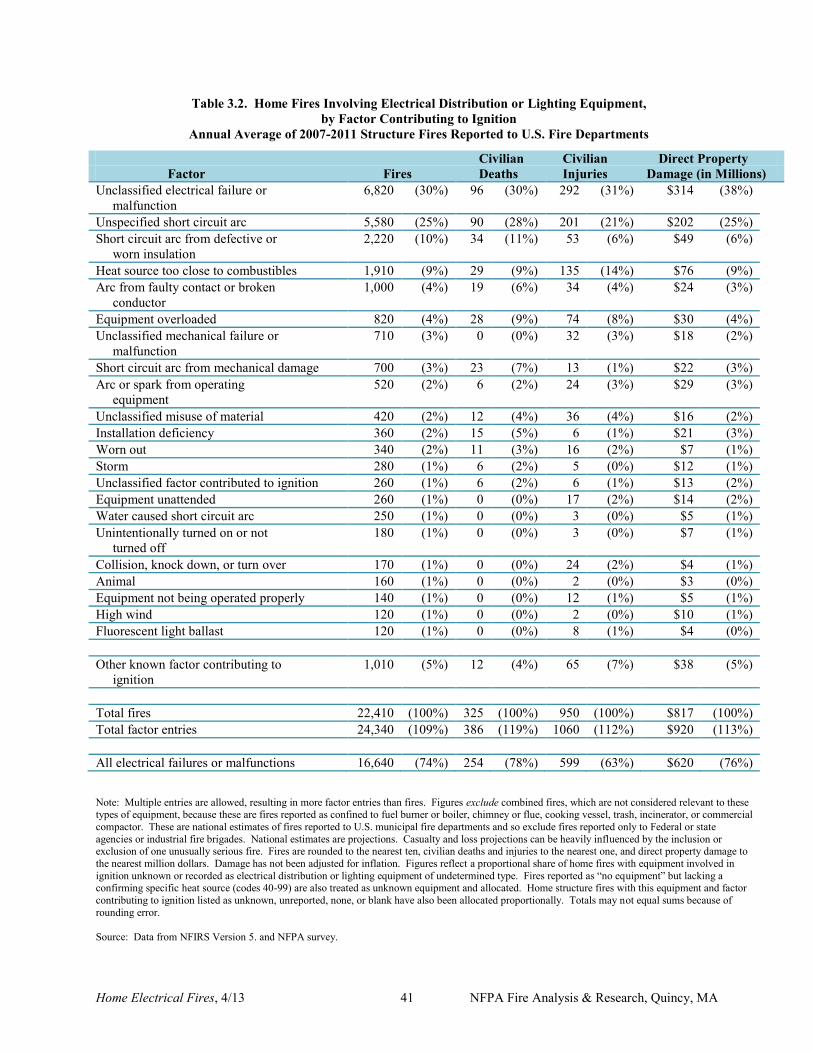
Home Electrical Fires, 4/13 41 NFPA Fire Analysis & Research, Quincy, MA
Table 3.2. Home Fires Involving Electrical Distribution or Lighting Equipment, by Factor Contributing to Ignition
Annual Average of 2007-2011 Structure Fires Reported to U.S. Fire Departments
Civilian Civilian Direct Property Factor Fires Deaths Injuries Damage (in Millions) Unclassified electrical failure or malfunction
6,820 (30%) 96 (30%) 292 (31%) $314 (38%)
Unspecified short circuit arc 5,580 (25%) 90 (28%) 201 (21%) $202 (25%) Short circuit arc from defective or worn insulation
2,220 (10%) 34 (11%) 53 (6%) $49 (6%)
Heat source too close to combustibles 1,910 (9%) 29 (9%) 135 (14%) $76 (9%) Arc from faulty contact or broken conductor
1,000 (4%) 19 (6%) 34 (4%) $24 (3%)
Equipment overloaded 820 (4%) 28 (9%) 74 (8%) $30 (4%) Unclassified mechanical failure or malfunction
710 (3%) 0 (0%) 32 (3%) $18 (2%)
Short circuit arc from mechanical damage 700 (3%) 23 (7%) 13 (1%) $22 (3%) Arc or spark from operating equipment
520 (2%) 6 (2%) 24 (3%) $29 (3%)
Unclassified misuse of material 420 (2%) 12 (4%) 36 (4%) $16 (2%) Installation deficiency 360 (2%) 15 (5%) 6 (1%) $21 (3%) Worn out 340 (2%) 11 (3%) 16 (2%) $7 (1%) Storm 280 (1%) 6 (2%) 5 (0%) $12 (1%) Unclassified factor contributed to ignition 260 (1%) 6 (2%) 6 (1%) $13 (2%) Equipment unattended 260 (1%) 0 (0%) 17 (2%) $14 (2%) Water caused short circuit arc 250 (1%) 0 (0%) 3 (0%) $5 (1%) Unintentionally turned on or not turned off
180 (1%) 0 (0%) 3 (0%) $7 (1%)
Collision, knock down, or turn over 170 (1%) 0 (0%) 24 (2%) $4 (1%) Animal 160 (1%) 0 (0%) 2 (0%) $3 (0%) Equipment not being operated properly 140 (1%) 0 (0%) 12 (1%) $5 (1%) High wind 120 (1%) 0 (0%) 2 (0%) $10 (1%) Fluorescent light ballast 120 (1%) 0 (0%) 8 (1%) $4 (0%) Other known factor contributing to ignition
1,010 (5%) 12 (4%) 65 (7%) $38 (5%)
Total fires 22,410 (100%) 325 (100%) 950 (100%) $817 (100%) Total factor entries 24,340 (109%) 386 (119%) 1060 (112%) $920 (113%) All electrical failures or malfunctions 16,640 (74%) 254 (78%) 599 (63%) $620 (76%) Note: Multiple entries are allowed, resulting in more factor entries than fires. Figures exclude combined fires, which are not considered relevant to these types of equipment, because these are fires reported as confined to fuel burner or boiler, chimney or flue, cooking vessel, trash, incinerator, or commercial compactor. These are national estimates of fires reported to U.S. municipal fire departments and so exclude fires reported only to Federal or state agencies or industrial fire brigades. National estimates are projections. Casualty and loss projections can be heavily influenced by the inclusion or exclusion of one unusually serious fire. Fires are rounded to the nearest ten, civilian deaths and injuries to the nearest one, and direct property damage to the nearest million dollars. Damage has not been adjusted for inflation. Figures reflect a proportional share of home fires with equipment involved in ignition unknown or recorded as electrical distribution or lighting equipment of undetermined type. Fires reported as “no equipment” but lacking a confirming specific heat source (codes 40-99) are also treated as unknown equipment and allocated. Home structure fires with this equipment and factor contributing to ignition listed as unknown, unreported, none, or blank have also been allocated proportionally. Totals may not equal sums because of rounding error. Source: Data from NFIRS Version 5. and NFPA survey.
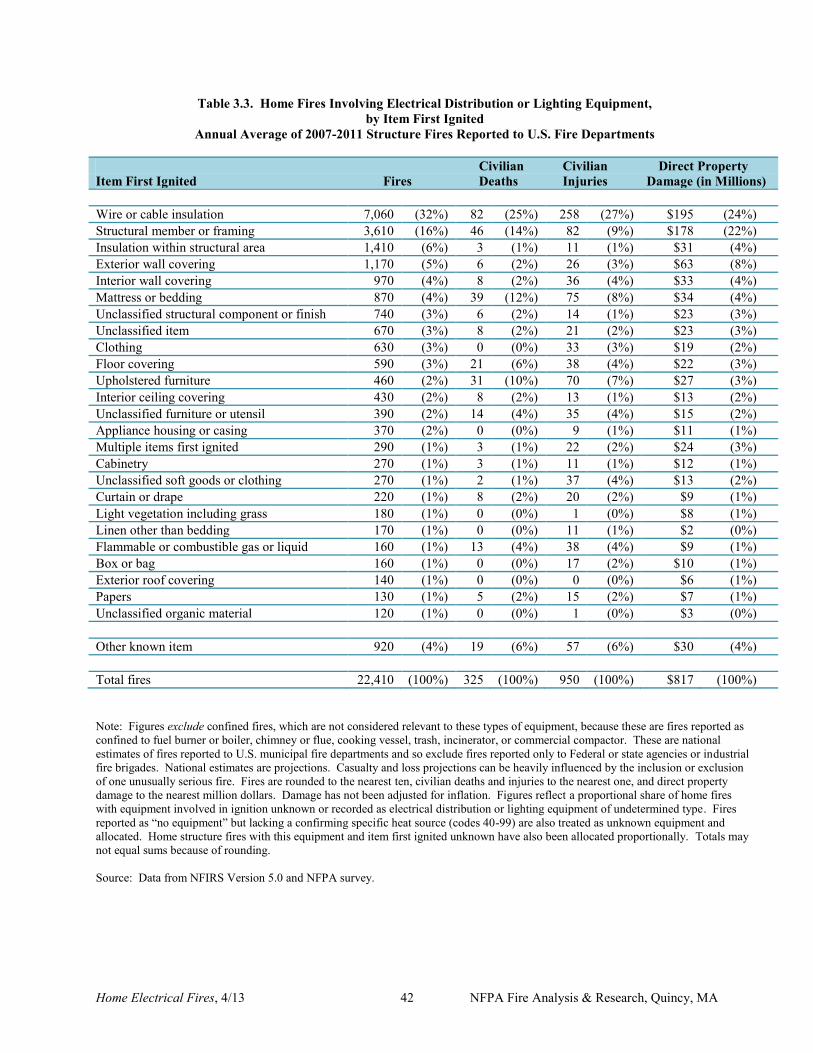
Home Electrical Fires, 4/13 42 NFPA Fire Analysis & Research, Quincy, MA
Table 3.3. Home Fires Involving Electrical Distribution or Lighting Equipment, by Item First Ignited
Annual Average of 2007-2011 Structure Fires Reported to U.S. Fire Departments Civilian Civilian Direct Property Item First Ignited Fires Deaths Injuries Damage (in Millions) Wire or cable insulation 7,060 (32%) 82 (25%) 258 (27%) $195 (24%) Structural member or framing 3,610 (16%) 46 (14%) 82 (9%) $178 (22%) Insulation within structural area 1,410 (6%) 3 (1%) 11 (1%) $31 (4%) Exterior wall covering 1,170 (5%) 6 (2%) 26 (3%) $63 (8%) Interior wall covering 970 (4%) 8 (2%) 36 (4%) $33 (4%) Mattress or bedding 870 (4%) 39 (12%) 75 (8%) $34 (4%) Unclassified structural component or finish 740 (3%) 6 (2%) 14 (1%) $23 (3%) Unclassified item 670 (3%) 8 (2%) 21 (2%) $23 (3%) Clothing 630 (3%) 0 (0%) 33 (3%) $19 (2%) Floor covering 590 (3%) 21 (6%) 38 (4%) $22 (3%) Upholstered furniture 460 (2%) 31 (10%) 70 (7%) $27 (3%) Interior ceiling covering 430 (2%) 8 (2%) 13 (1%) $13 (2%) Unclassified furniture or utensil 390 (2%) 14 (4%) 35 (4%) $15 (2%) Appliance housing or casing 370 (2%) 0 (0%) 9 (1%) $11 (1%) Multiple items first ignited 290 (1%) 3 (1%) 22 (2%) $24 (3%) Cabinetry 270 (1%) 3 (1%) 11 (1%) $12 (1%) Unclassified soft goods or clothing 270 (1%) 2 (1%) 37 (4%) $13 (2%) Curtain or drape 220 (1%) 8 (2%) 20 (2%) $9 (1%) Light vegetation including grass 180 (1%) 0 (0%) 1 (0%) $8 (1%) Linen other than bedding 170 (1%) 0 (0%) 11 (1%) $2 (0%) Flammable or combustible gas or liquid 160 (1%) 13 (4%) 38 (4%) $9 (1%) Box or bag 160 (1%) 0 (0%) 17 (2%) $10 (1%) Exterior roof covering 140 (1%) 0 (0%) 0 (0%) $6 (1%) Papers 130 (1%) 5 (2%) 15 (2%) $7 (1%) Unclassified organic material 120 (1%) 0 (0%) 1 (0%) $3 (0%) Other known item 920 (4%) 19 (6%) 57 (6%) $30 (4%) Total fires 22,410 (100%) 325 (100%) 950 (100%) $817 (100%) Note: Figures exclude confined fires, which are not considered relevant to these types of equipment, because these are fires reported as confined to fuel burner or boiler, chimney or flue, cooking vessel, trash, incinerator, or commercial compactor. These are national estimates of fires reported to U.S. municipal fire departments and so exclude fires reported only to Federal or state agencies or industrial fire brigades. National estimates are projections. Casualty and loss projections can be heavily influenced by the inclusion or exclusion of one unusually serious fire. Fires are rounded to the nearest ten, civilian deaths and injuries to the nearest one, and direct property damage to the nearest million dollars. Damage has not been adjusted for inflation. Figures reflect a proportional share of home fires with equipment involved in ignition unknown or recorded as electrical distribution or lighting equipment of undetermined type. Fires reported as “no equipment” but lacking a confirming specific heat source (codes 40-99) are also treated as unknown equipment and allocated. Home structure fires with this equipment and item first ignited unknown have also been allocated proportionally. Totals may not equal sums because of rounding. Source: Data from NFIRS Version 5.0 and NFPA survey.
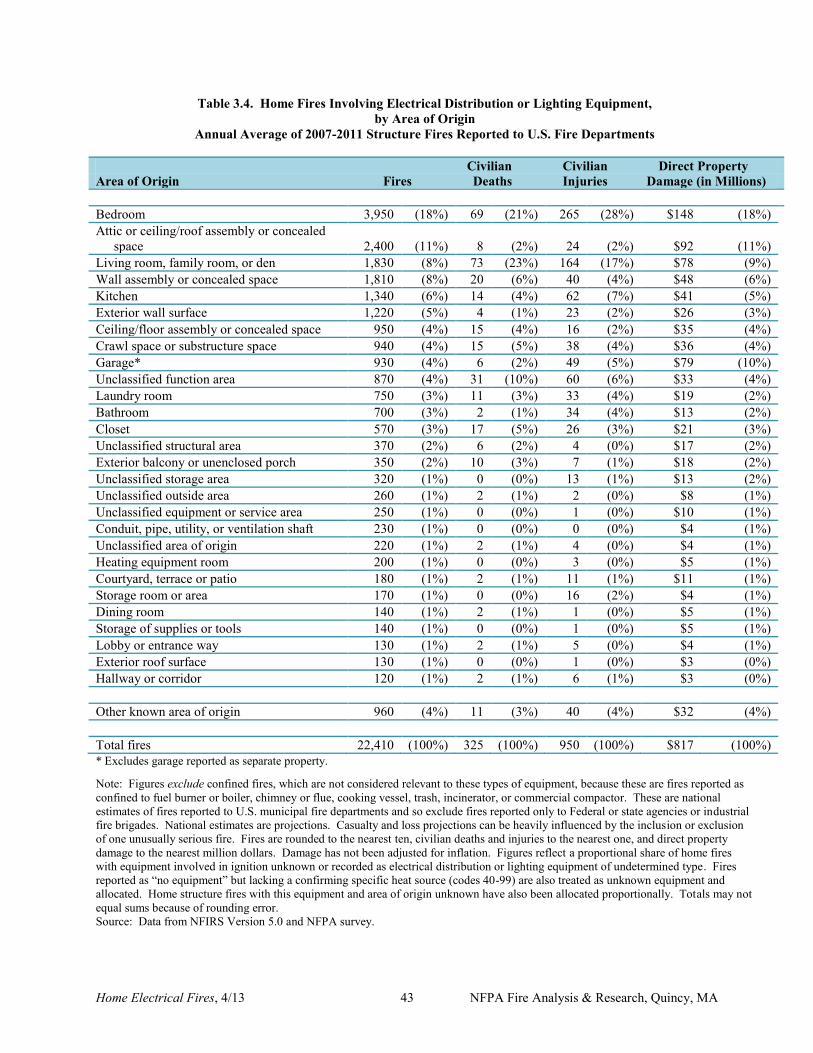
Home Electrical Fires, 4/13 43 NFPA Fire Analysis & Research, Quincy, MA
Table 3.4. Home Fires Involving Electrical Distribution or Lighting Equipment, by Area of Origin
Annual Average of 2007-2011 Structure Fires Reported to U.S. Fire Departments
Civilian Civilian Direct Property Area of Origin Fires Deaths Injuries Damage (in Millions) Bedroom 3,950 (18%) 69 (21%) 265 (28%) $148 (18%) Attic or ceiling/roof assembly or concealed space 2,400 (11%) 8 (2%) 24 (2%) $92 (11%) Living room, family room, or den 1,830 (8%) 73 (23%) 164 (17%) $78 (9%) Wall assembly or concealed space 1,810 (8%) 20 (6%) 40 (4%) $48 (6%) Kitchen 1,340 (6%) 14 (4%) 62 (7%) $41 (5%) Exterior wall surface 1,220 (5%) 4 (1%) 23 (2%) $26 (3%) Ceiling/floor assembly or concealed space 950 (4%) 15 (4%) 16 (2%) $35 (4%) Crawl space or substructure space 940 (4%) 15 (5%) 38 (4%) $36 (4%) Garage* 930 (4%) 6 (2%) 49 (5%) $79 (10%) Unclassified function area 870 (4%) 31 (10%) 60 (6%) $33 (4%) Laundry room 750 (3%) 11 (3%) 33 (4%) $19 (2%) Bathroom 700 (3%) 2 (1%) 34 (4%) $13 (2%) Closet 570 (3%) 17 (5%) 26 (3%) $21 (3%) Unclassified structural area 370 (2%) 6 (2%) 4 (0%) $17 (2%) Exterior balcony or unenclosed porch 350 (2%) 10 (3%) 7 (1%) $18 (2%) Unclassified storage area 320 (1%) 0 (0%) 13 (1%) $13 (2%) Unclassified outside area 260 (1%) 2 (1%) 2 (0%) $8 (1%) Unclassified equipment or service area 250 (1%) 0 (0%) 1 (0%) $10 (1%) Conduit, pipe, utility, or ventilation shaft 230 (1%) 0 (0%) 0 (0%) $4 (1%) Unclassified area of origin 220 (1%) 2 (1%) 4 (0%) $4 (1%) Heating equipment room 200 (1%) 0 (0%) 3 (0%) $5 (1%) Courtyard, terrace or patio 180 (1%) 2 (1%) 11 (1%) $11 (1%) Storage room or area 170 (1%) 0 (0%) 16 (2%) $4 (1%) Dining room 140 (1%) 2 (1%) 1 (0%) $5 (1%) Storage of supplies or tools 140 (1%) 0 (0%) 1 (0%) $5 (1%) Lobby or entrance way 130 (1%) 2 (1%) 5 (0%) $4 (1%) Exterior roof surface 130 (1%) 0 (0%) 1 (0%) $3 (0%) Hallway or corridor 120 (1%) 2 (1%) 6 (1%) $3 (0%) Other known area of origin 960 (4%) 11 (3%) 40 (4%) $32 (4%) Total fires 22,410 (100%) 325 (100%) 950 (100%) $817 (100%) * Excludes garage reported as separate property. Note: Figures exclude confined fires, which are not considered relevant to these types of equipment, because these are fires reported as confined to fuel burner or boiler, chimney or flue, cooking vessel, trash, incinerator, or commercial compactor. These are national estimates of fires reported to U.S. municipal fire departments and so exclude fires reported only to Federal or state agencies or industrial fire brigades. National estimates are projections. Casualty and loss projections can be heavily influenced by the inclusion or exclusion of one unusually serious fire. Fires are rounded to the nearest ten, civilian deaths and injuries to the nearest one, and direct property damage to the nearest million dollars. Damage has not been adjusted for inflation. Figures reflect a proportional share of home fires with equipment involved in ignition unknown or recorded as electrical distribution or lighting equipment of undetermined type. Fires reported as “no equipment” but lacking a confirming specific heat source (codes 40-99) are also treated as unknown equipment and allocated. Home structure fires with this equipment and area of origin unknown have also been allocated proportionally. Totals may not equal sums because of rounding error. Source: Data from NFIRS Version 5.0 and NFPA survey.
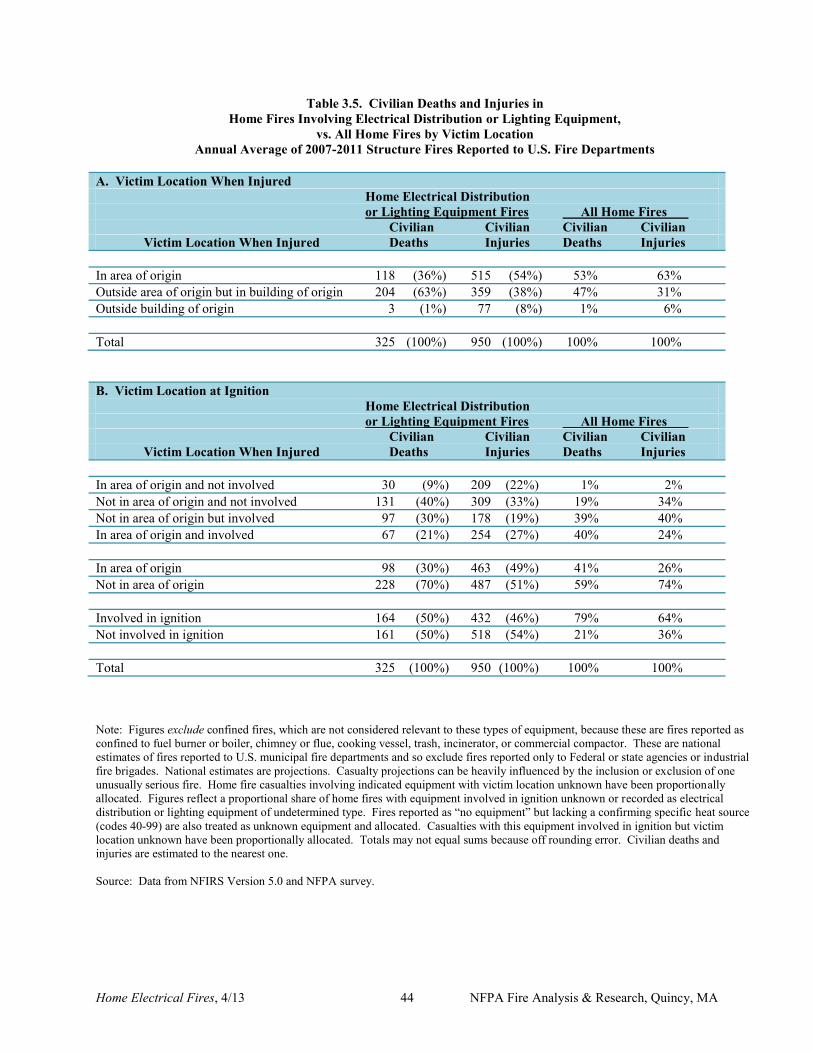
Home Electrical Fires, 4/13 44 NFPA Fire Analysis & Research, Quincy, MA
Table 3.5. Civilian Deaths and Injuries in Home Fires Involving Electrical Distribution or Lighting Equipment,
vs. All Home Fires by Victim Location Annual Average of 2007-2011 Structure Fires Reported to U.S. Fire Departments
A. Victim Location When Injured Home Electrical Distribution or Lighting Equipment Fires All Home Fires Civilian Civilian Civilian Civilian Victim Location When Injured Deaths Injuries Deaths Injuries In area of origin 118 (36%) 515 (54%) 53% 63% Outside area of origin but in building of origin 204 (63%) 359 (38%) 47% 31% Outside building of origin 3 (1%) 77 (8%) 1% 6% Total 325 (100%) 950 (100%) 100% 100% B. Victim Location at Ignition Home Electrical Distribution or Lighting Equipment Fires All Home Fires Civilian Civilian Civilian Civilian Victim Location When Injured Deaths Injuries Deaths Injuries In area of origin and not involved 30 (9%) 209 (22%) 1% 2% Not in area of origin and not involved 131 (40%) 309 (33%) 19% 34% Not in area of origin but involved 97 (30%) 178 (19%) 39% 40% In area of origin and involved 67 (21%) 254 (27%) 40% 24% In area of origin 98 (30%) 463 (49%) 41% 26% Not in area of origin 228 (70%) 487 (51%) 59% 74% Involved in ignition 164 (50%) 432 (46%) 79% 64% Not involved in ignition 161 (50%) 518 (54%) 21% 36% Total 325 (100%) 950 (100%) 100% 100% Note: Figures exclude confined fires, which are not considered relevant to these types of equipment, because these are fires reported as confined to fuel burner or boiler, chimney or flue, cooking vessel, trash, incinerator, or commercial compactor. These are national estimates of fires reported to U.S. municipal fire departments and so exclude fires reported only to Federal or state agencies or industrial fire brigades. National estimates are projections. Casualty projections can be heavily influenced by the inclusion or exclusion of one unusually serious fire. Home fire casualties involving indicated equipment with victim location unknown have been proportionally allocated. Figures reflect a proportional share of home fires with equipment involved in ignition unknown or recorded as electrical distribution or lighting equipment of undetermined type. Fires reported as “no equipment” but lacking a confirming specific heat source (codes 40-99) are also treated as unknown equipment and allocated. Casualties with this equipment involved in ignition but victim location unknown have been proportionally allocated. Totals may not equal sums because off rounding error. Civilian deaths and injuries are estimated to the nearest one. Source: Data from NFIRS Version 5.0 and NFPA survey.
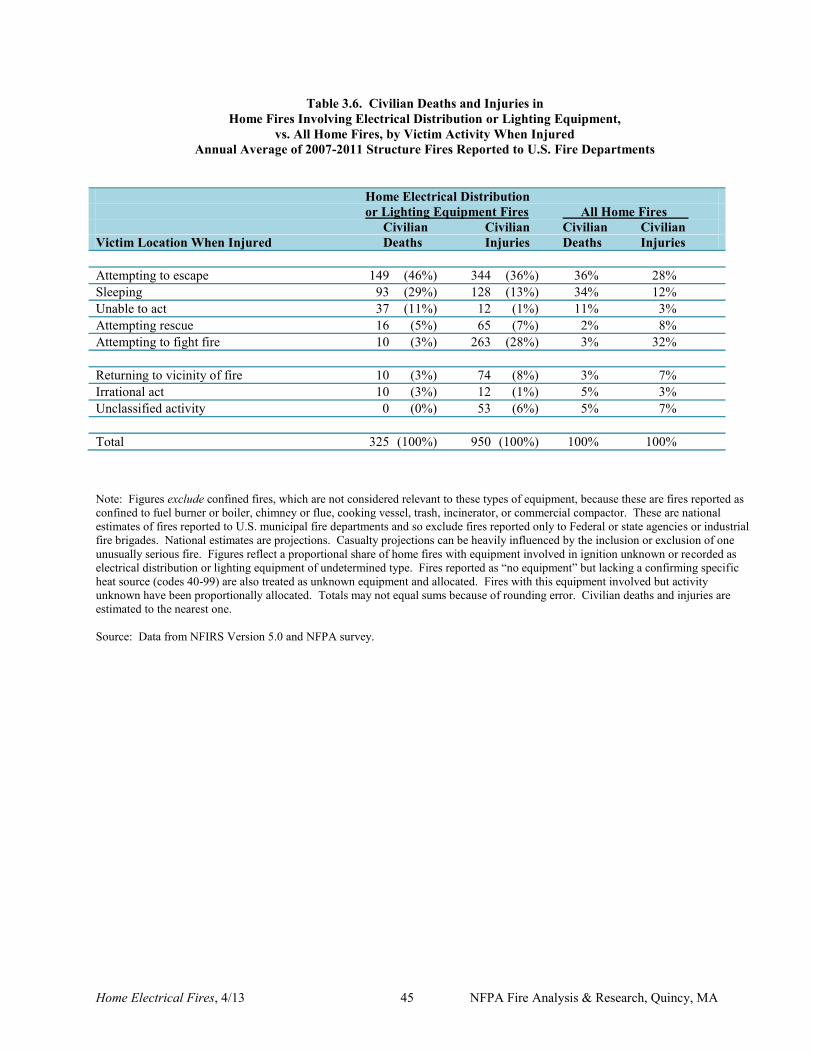
Home Electrical Fires, 4/13 45 NFPA Fire Analysis & Research, Quincy, MA
Table 3.6. Civilian Deaths and Injuries in Home Fires Involving Electrical Distribution or Lighting Equipment,
vs. All Home Fires, by Victim Activity When Injured Annual Average of 2007-2011 Structure Fires Reported to U.S. Fire Departments
Home Electrical Distribution or Lighting Equipment Fires All Home Fires Civilian Civilian Civilian Civilian Victim Location When Injured Deaths Injuries Deaths Injuries Attempting to escape 149 (46%) 344 (36%) 36% 28% Sleeping 93 (29%) 128 (13%) 34% 12% Unable to act 37 (11%) 12 (1%) 11% 3% Attempting rescue 16 (5%) 65 (7%) 2% 8% Attempting to fight fire 10 (3%) 263 (28%) 3% 32% Returning to vicinity of fire 10 (3%) 74 (8%) 3% 7% Irrational act 10 (3%) 12 (1%) 5% 3% Unclassified activity 0 (0%) 53 (6%) 5% 7% Total 325 (100%) 950 (100%) 100% 100% Note: Figures exclude confined fires, which are not considered relevant to these types of equipment, because these are fires reported as confined to fuel burner or boiler, chimney or flue, cooking vessel, trash, incinerator, or commercial compactor. These are national estimates of fires reported to U.S. municipal fire departments and so exclude fires reported only to Federal or state agencies or industrial fire brigades. National estimates are projections. Casualty projections can be heavily influenced by the inclusion or exclusion of one unusually serious fire. Figures reflect a proportional share of home fires with equipment involved in ignition unknown or recorded as electrical distribution or lighting equipment of undetermined type. Fires reported as “no equipment” but lacking a confirming specific heat source (codes 40-99) are also treated as unknown equipment and allocated. Fires with this equipment involved but activity unknown have been proportionally allocated. Totals may not equal sums because of rounding error. Civilian deaths and injuries are estimated to the nearest one. Source: Data from NFIRS Version 5.0 and NFPA survey.
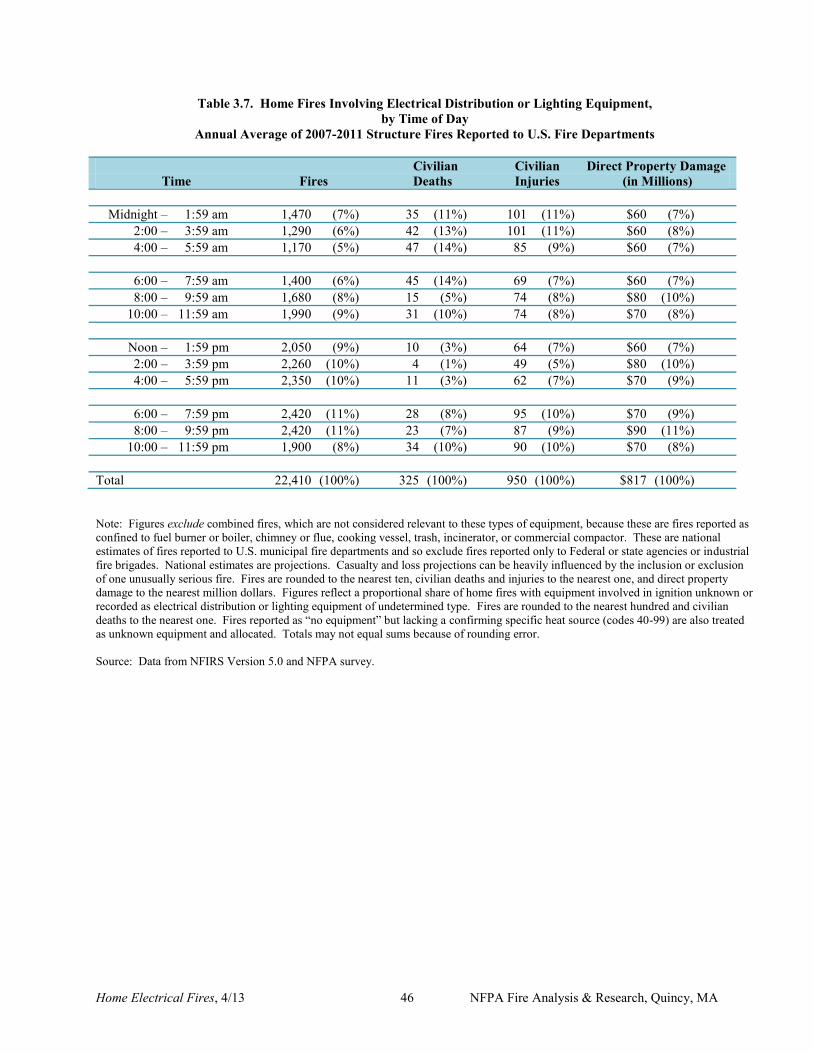
Home Electrical Fires, 4/13 46 NFPA Fire Analysis & Research, Quincy, MA
Table 3.7. Home Fires Involving Electrical Distribution or Lighting Equipment, by Time of Day
Annual Average of 2007-2011 Structure Fires Reported to U.S. Fire Departments
Civilian Civilian Direct Property Damage Time Fires Deaths Injuries (in Millions) Midnight – 1:59 am 1,470 (7%) 35 (11%) 101 (11%) $60 (7%) 2:00 – 3:59 am 1,290 (6%) 42 (13%) 101 (11%) $60 (8%) 4:00 – 5:59 am 1,170 (5%) 47 (14%) 85 (9%) $60 (7%) 6:00 – 7:59 am 1,400 (6%) 45 (14%) 69 (7%) $60 (7%) 8:00 – 9:59 am 1,680 (8%) 15 (5%) 74 (8%) $80 (10%) 10:00 – 11:59 am 1,990 (9%) 31 (10%) 74 (8%) $70 (8%) Noon – 1:59 pm 2,050 (9%) 10 (3%) 64 (7%) $60 (7%) 2:00 – 3:59 pm 2,260 (10%) 4 (1%) 49 (5%) $80 (10%) 4:00 – 5:59 pm 2,350 (10%) 11 (3%) 62 (7%) $70 (9%) 6:00 – 7:59 pm 2,420 (11%) 28 (8%) 95 (10%) $70 (9%) 8:00 – 9:59 pm 2,420 (11%) 23 (7%) 87 (9%) $90 (11%) 10:00 – 11:59 pm 1,900 (8%) 34 (10%) 90 (10%) $70 (8%) Total 22,410 (100%) 325 (100%) 950 (100%) $817 (100%) Note: Figures exclude combined fires, which are not considered relevant to these types of equipment, because these are fires reported as confined to fuel burner or boiler, chimney or flue, cooking vessel, trash, incinerator, or commercial compactor. These are national estimates of fires reported to U.S. municipal fire departments and so exclude fires reported only to Federal or state agencies or industrial fire brigades. National estimates are projections. Casualty and loss projections can be heavily influenced by the inclusion or exclusion of one unusually serious fire. Fires are rounded to the nearest ten, civilian deaths and injuries to the nearest one, and direct property damage to the nearest million dollars. Figures reflect a proportional share of home fires with equipment involved in ignition unknown or recorded as electrical distribution or lighting equipment of undetermined type. Fires are rounded to the nearest hundred and civilian deaths to the nearest one. Fires reported as “no equipment” but lacking a confirming specific heat source (codes 40-99) are also treated as unknown equipment and allocated. Totals may not equal sums because of rounding error. Source: Data from NFIRS Version 5.0 and NFPA survey.
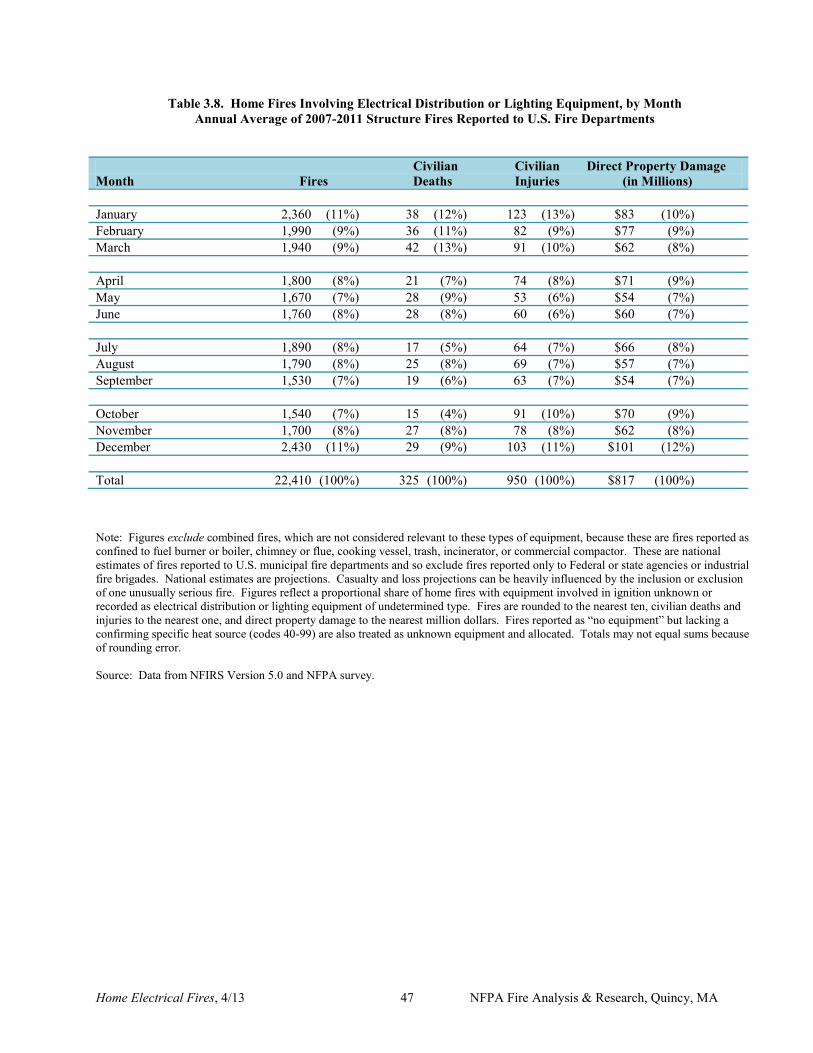
Home Electrical Fires, 4/13 47 NFPA Fire Analysis & Research, Quincy, MA
Table 3.8. Home Fires Involving Electrical Distribution or Lighting Equipment, by Month Annual Average of 2007-2011 Structure Fires Reported to U.S. Fire Departments
Civilian Civilian Direct Property Damage Month Fires Deaths Injuries (in Millions) January 2,360 (11%) 38 (12%) 123 (13%) $83 (10%) February 1,990 (9%) 36 (11%) 82 (9%) $77 (9%) March 1,940 (9%) 42 (13%) 91 (10%) $62 (8%) April 1,800 (8%) 21 (7%) 74 (8%) $71 (9%) May 1,670 (7%) 28 (9%) 53 (6%) $54 (7%) June 1,760 (8%) 28 (8%) 60 (6%) $60 (7%) July 1,890 (8%) 17 (5%) 64 (7%) $66 (8%) August 1,790 (8%) 25 (8%) 69 (7%) $57 (7%) September 1,530 (7%) 19 (6%) 63 (7%) $54 (7%) October 1,540 (7%) 15 (4%) 91 (10%) $70 (9%) November 1,700 (8%) 27 (8%) 78 (8%) $62 (8%) December 2,430 (11%) 29 (9%) 103 (11%) $101 (12%) Total 22,410 (100%) 325 (100%) 950 (100%) $817 (100%) Note: Figures exclude combined fires, which are not considered relevant to these types of equipment, because these are fires reported as confined to fuel burner or boiler, chimney or flue, cooking vessel, trash, incinerator, or commercial compactor. These are national estimates of fires reported to U.S. municipal fire departments and so exclude fires reported only to Federal or state agencies or industrial fire brigades. National estimates are projections. Casualty and loss projections can be heavily influenced by the inclusion or exclusion of one unusually serious fire. Figures reflect a proportional share of home fires with equipment involved in ignition unknown or recorded as electrical distribution or lighting equipment of undetermined type. Fires are rounded to the nearest ten, civilian deaths and injuries to the nearest one, and direct property damage to the nearest million dollars. Fires reported as “no equipment” but lacking a confirming specific heat source (codes 40-99) are also treated as unknown equipment and allocated. Totals may not equal sums because of rounding error. Source: Data from NFIRS Version 5.0 and NFPA survey.

Home Electrical Fires, 4/13 48 NFPA Fire Analysis & Research, Quincy, MA
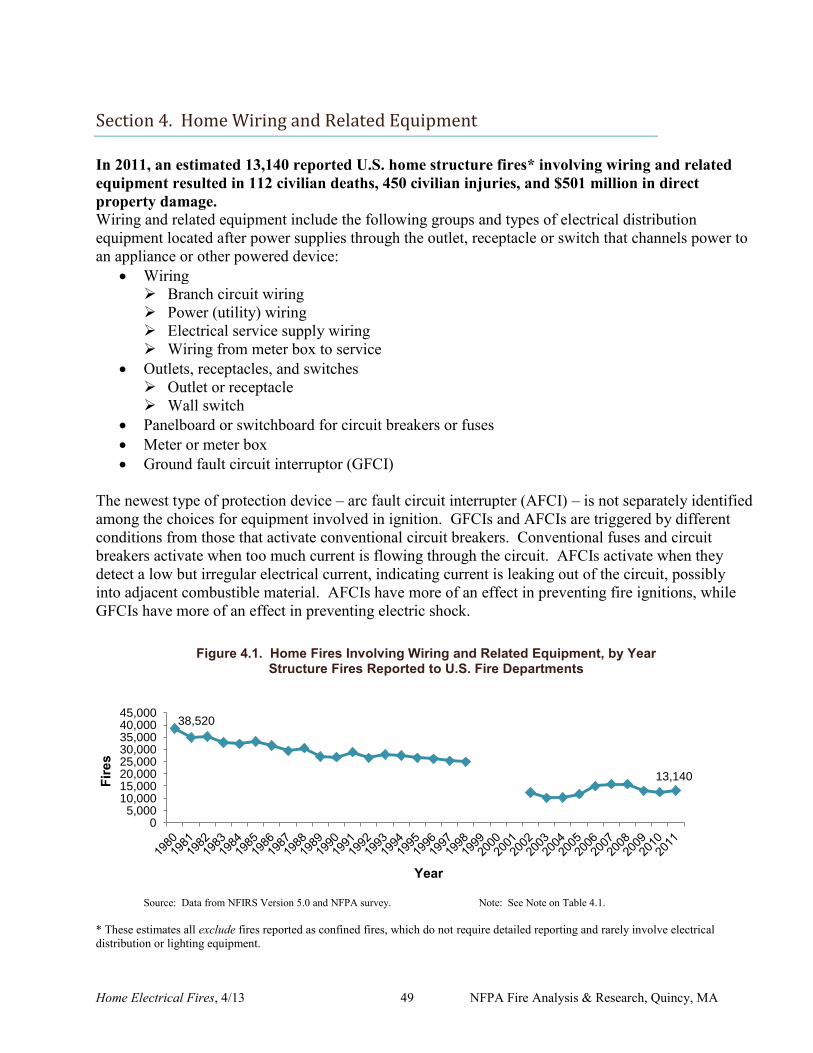
Home Electrical Fires, 4/13 49 NFPA Fire Analysis & Research, Quincy, MA
Section 4. Home Wiring and Related Equipment
In 2011, an estimated 13,140 reported U.S. home structure fires* involving wiring and related equipment resulted in 112 civilian deaths, 450 civilian injuries, and $501 million in direct property damage. Wiring and related equipment include the following groups and types of electrical distribution equipment located after power supplies through the outlet, receptacle or switch that channels power to an appliance or other powered device:
Wiring Branch circuit wiring Power (utility) wiring Electrical service supply wiring Wiring from meter box to service
Outlets, receptacles, and switches Outlet or receptacle Wall switch
Panelboard or switchboard for circuit breakers or fuses Meter or meter box Ground fault circuit interruptor (GFCI)
The newest type of protection device – arc fault circuit interrupter (AFCI) – is not separately identified among the choices for equipment involved in ignition. GFCIs and AFCIs are triggered by different conditions from those that activate conventional circuit breakers. Conventional fuses and circuit breakers activate when too much current is flowing through the circuit. AFCIs activate when they detect a low but irregular electrical current, indicating current is leaking out of the circuit, possibly into adjacent combustible material. AFCIs have more of an effect in preventing fire ignitions, while GFCIs have more of an effect in preventing electric shock.
Source: Data from NFIRS Version 5.0 and NFPA survey. Note: See Note on Table 4.1. * These estimates all exclude fires reported as confined fires, which do not require detailed reporting and rarely involve electrical distribution or lighting equipment.
38,520
13,140
0 5,000
10,000 15,000 20,000 25,000 30,000 35,000 40,000 45,000
Fire
s
Year
Figure 4.1. Home Fires Involving Wiring and Related Equipment, by Year Structure Fires Reported to U.S. Fire Departments
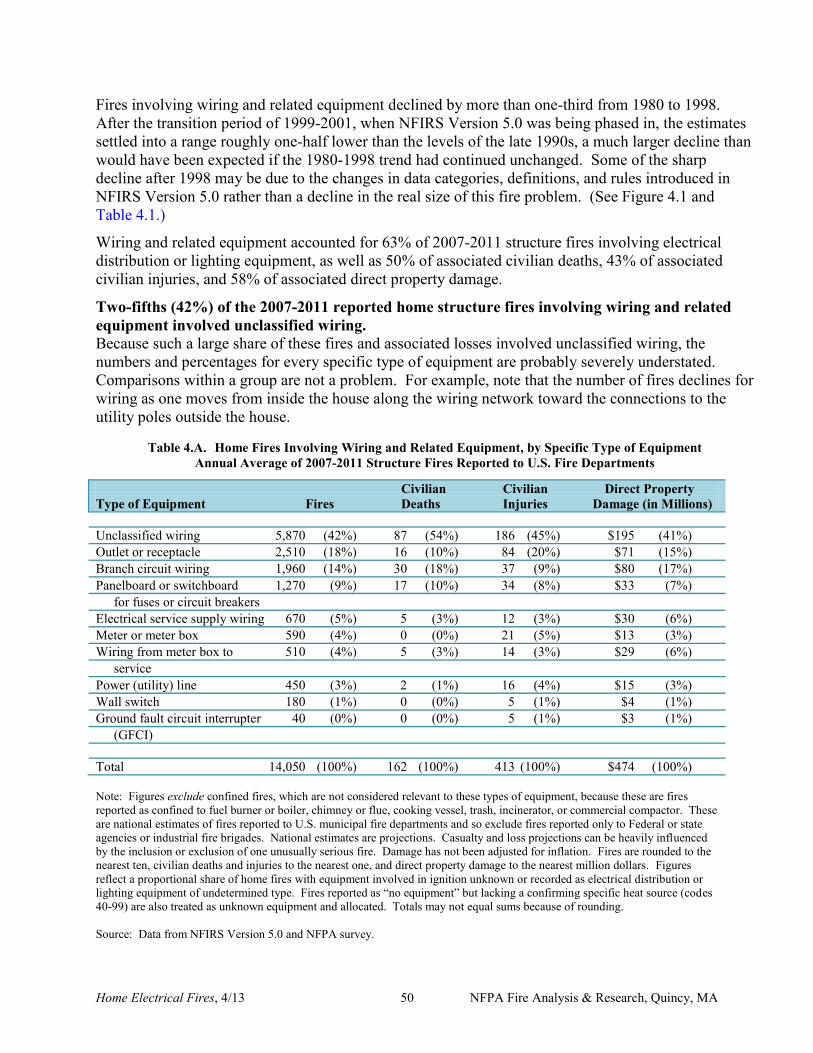
Home Electrical Fires, 4/13 50 NFPA Fire Analysis & Research, Quincy, MA
Fires involving wiring and related equipment declined by more than one-third from 1980 to 1998. After the transition period of 1999-2001, when NFIRS Version 5.0 was being phased in, the estimates settled into a range roughly one-half lower than the levels of the late 1990s, a much larger decline than would have been expected if the 1980-1998 trend had continued unchanged. Some of the sharp decline after 1998 may be due to the changes in data categories, definitions, and rules introduced in NFIRS Version 5.0 rather than a decline in the real size of this fire problem. (See Figure 4.1 and Table 4.1.)
Wiring and related equipment accounted for 63% of 2007-2011 structure fires involving electrical distribution or lighting equipment, as well as 50% of associated civilian deaths, 43% of associated civilian injuries, and 58% of associated direct property damage.
Two-fifths (42%) of the 2007-2011 reported home structure fires involving wiring and related equipment involved unclassified wiring. Because such a large share of these fires and associated losses involved unclassified wiring, the numbers and percentages for every specific type of equipment are probably severely understated. Comparisons within a group are not a problem. For example, note that the number of fires declines for wiring as one moves from inside the house along the wiring network toward the connections to the utility poles outside the house.
Table 4.A. Home Fires Involving Wiring and Related Equipment, by Specific Type of Equipment Annual Average of 2007-2011 Structure Fires Reported to U.S. Fire Departments
Civilian Civilian Direct Property Type of Equipment Fires Deaths Injuries Damage (in Millions) Unclassified wiring 5,870 (42%) 87 (54%) 186 (45%) $195 (41%) Outlet or receptacle 2,510 (18%) 16 (10%) 84 (20%) $71 (15%) Branch circuit wiring 1,960 (14%) 30 (18%) 37 (9%) $80 (17%) Panelboard or switchboard 1,270 (9%) 17 (10%) 34 (8%) $33 (7%) for fuses or circuit breakers Electrical service supply wiring 670 (5%) 5 (3%) 12 (3%) $30 (6%) Meter or meter box 590 (4%) 0 (0%) 21 (5%) $13 (3%) Wiring from meter box to 510 (4%) 5 (3%) 14 (3%) $29 (6%) service Power (utility) line 450 (3%) 2 (1%) 16 (4%) $15 (3%) Wall switch 180 (1%) 0 (0%) 5 (1%) $4 (1%) Ground fault circuit interrupter 40 (0%) 0 (0%) 5 (1%) $3 (1%) (GFCI) Total 14,050 (100%) 162 (100%) 413 (100%) $474 (100%) Note: Figures exclude confined fires, which are not considered relevant to these types of equipment, because these are fires reported as confined to fuel burner or boiler, chimney or flue, cooking vessel, trash, incinerator, or commercial compactor. These are national estimates of fires reported to U.S. municipal fire departments and so exclude fires reported only to Federal or state agencies or industrial fire brigades. National estimates are projections. Casualty and loss projections can be heavily influenced by the inclusion or exclusion of one unusually serious fire. Damage has not been adjusted for inflation. Fires are rounded to the nearest ten, civilian deaths and injuries to the nearest one, and direct property damage to the nearest million dollars. Figures reflect a proportional share of home fires with equipment involved in ignition unknown or recorded as electrical distribution or lighting equipment of undetermined type. Fires reported as “no equipment” but lacking a confirming specific heat source (codes 40-99) are also treated as unknown equipment and allocated. Totals may not equal sums because of rounding. Source: Data from NFIRS Version 5.0 and NFPA survey.
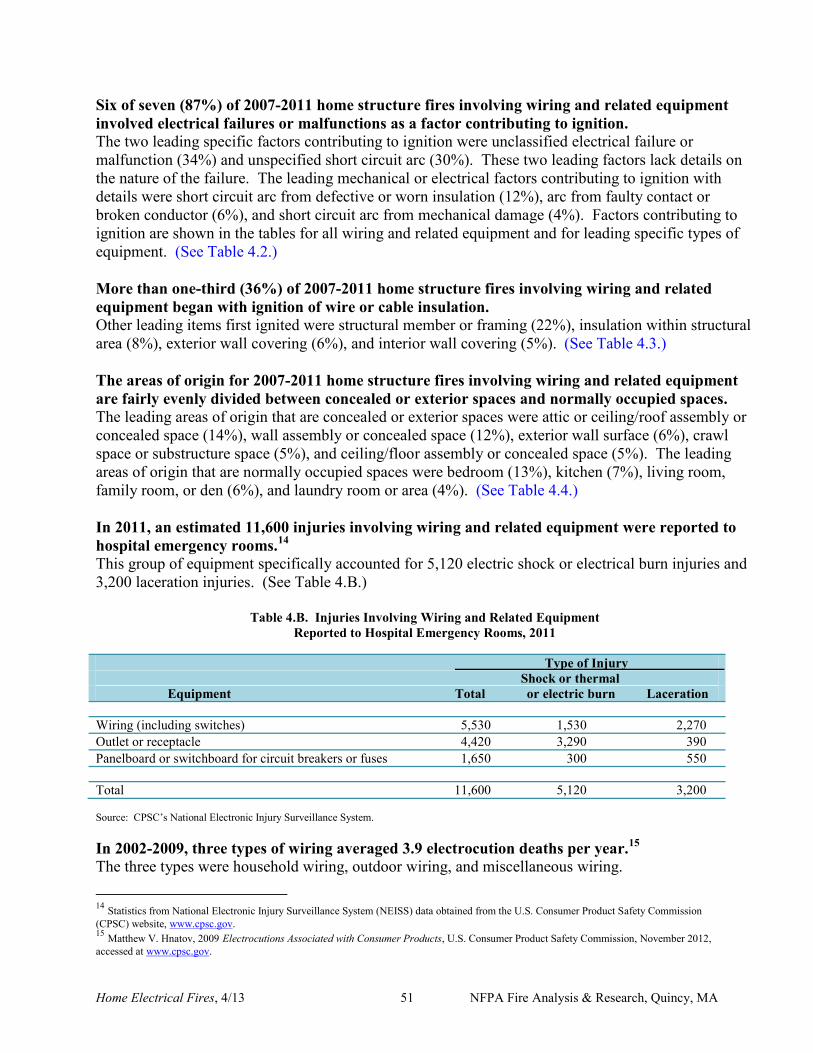
Home Electrical Fires, 4/13 51 NFPA Fire Analysis & Research, Quincy, MA
Six of seven (87%) of 2007-2011 home structure fires involving wiring and related equipment involved electrical failures or malfunctions as a factor contributing to ignition. The two leading specific factors contributing to ignition were unclassified electrical failure or malfunction (34%) and unspecified short circuit arc (30%). These two leading factors lack details on the nature of the failure. The leading mechanical or electrical factors contributing to ignition with details were short circuit arc from defective or worn insulation (12%), arc from faulty contact or broken conductor (6%), and short circuit arc from mechanical damage (4%). Factors contributing to ignition are shown in the tables for all wiring and related equipment and for leading specific types of equipment. (See Table 4.2.) More than one-third (36%) of 2007-2011 home structure fires involving wiring and related equipment began with ignition of wire or cable insulation. Other leading items first ignited were structural member or framing (22%), insulation within structural area (8%), exterior wall covering (6%), and interior wall covering (5%). (See Table 4.3.) The areas of origin for 2007-2011 home structure fires involving wiring and related equipment are fairly evenly divided between concealed or exterior spaces and normally occupied spaces. The leading areas of origin that are concealed or exterior spaces were attic or ceiling/roof assembly or concealed space (14%), wall assembly or concealed space (12%), exterior wall surface (6%), crawl space or substructure space (5%), and ceiling/floor assembly or concealed space (5%). The leading areas of origin that are normally occupied spaces were bedroom (13%), kitchen (7%), living room, family room, or den (6%), and laundry room or area (4%). (See Table 4.4.) In 2011, an estimated 11,600 injuries involving wiring and related equipment were reported to hospital emergency rooms.14 This group of equipment specifically accounted for 5,120 electric shock or electrical burn injuries and 3,200 laceration injuries. (See Table 4.B.)
Table 4.B. Injuries Involving Wiring and Related Equipment Reported to Hospital Emergency Rooms, 2011
Type of Injury Shock or thermal Equipment Total or electric burn Laceration Wiring (including switches) 5,530 1,530 2,270 Outlet or receptacle 4,420 3,290 390 Panelboard or switchboard for circuit breakers or fuses 1,650 300 550 Total 11,600 5,120 3,200 Source: CPSC’s National Electronic Injury Surveillance System. In 2002-2009, three types of wiring averaged 3.9 electrocution deaths per year.15 The three types were household wiring, outdoor wiring, and miscellaneous wiring.
14 Statistics from National Electronic Injury Surveillance System (NEISS) data obtained from the U.S. Consumer Product Safety Commission (CPSC) website, www.cpsc.gov. 15 Matthew V. Hnatov, 2009 Electrocutions Associated with Consumer Products, U.S. Consumer Product Safety Commission, November 2012, accessed at www.cpsc.gov.
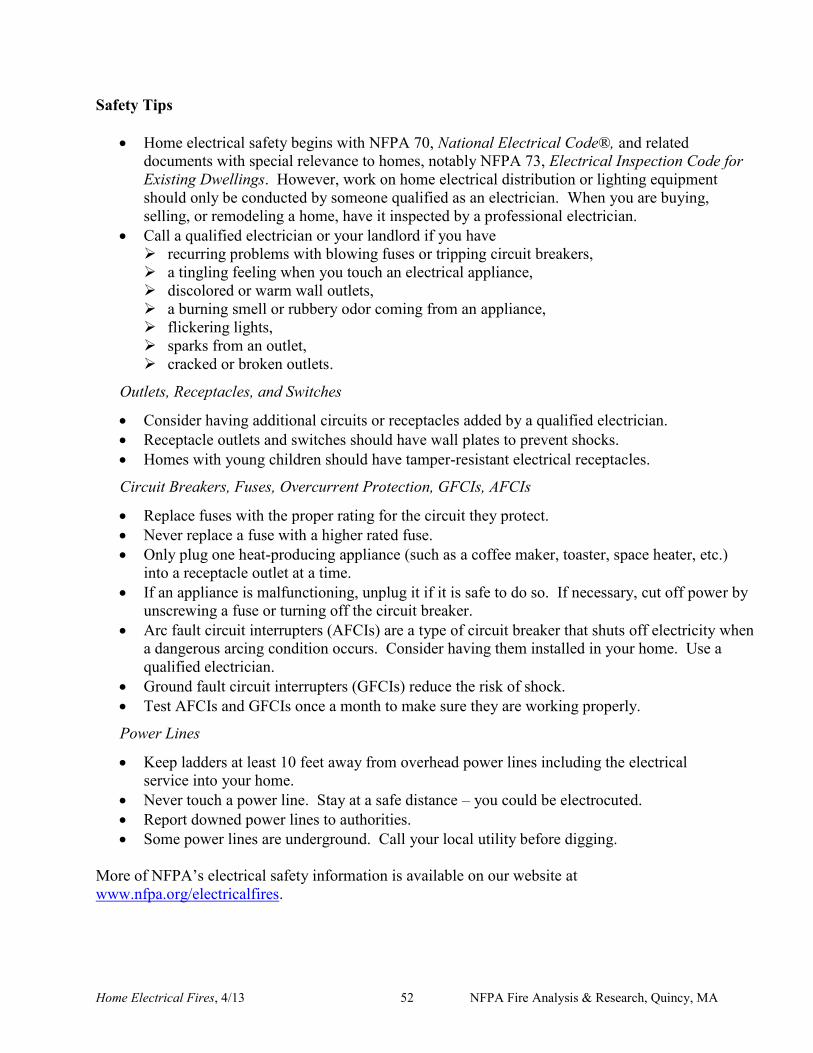
Home Electrical Fires, 4/13 52 NFPA Fire Analysis & Research, Quincy, MA
Safety Tips
Home electrical safety begins with NFPA 70, National Electrical Code®, and related documents with special relevance to homes, notably NFPA 73, Electrical Inspection Code for Existing Dwellings. However, work on home electrical distribution or lighting equipment should only be conducted by someone qualified as an electrician. When you are buying, selling, or remodeling a home, have it inspected by a professional electrician.
Call a qualified electrician or your landlord if you have recurring problems with blowing fuses or tripping circuit breakers, a tingling feeling when you touch an electrical appliance, discolored or warm wall outlets, a burning smell or rubbery odor coming from an appliance, flickering lights, sparks from an outlet, cracked or broken outlets.
Outlets, Receptacles, and Switches
Consider having additional circuits or receptacles added by a qualified electrician. Receptacle outlets and switches should have wall plates to prevent shocks. Homes with young children should have tamper-resistant electrical receptacles.
Circuit Breakers, Fuses, Overcurrent Protection, GFCIs, AFCIs
Replace fuses with the proper rating for the circuit they protect. Never replace a fuse with a higher rated fuse. Only plug one heat-producing appliance (such as a coffee maker, toaster, space heater, etc.)
into a receptacle outlet at a time. If an appliance is malfunctioning, unplug it if it is safe to do so. If necessary, cut off power by
unscrewing a fuse or turning off the circuit breaker. Arc fault circuit interrupters (AFCIs) are a type of circuit breaker that shuts off electricity when
a dangerous arcing condition occurs. Consider having them installed in your home. Use a qualified electrician.
Ground fault circuit interrupters (GFCIs) reduce the risk of shock. Test AFCIs and GFCIs once a month to make sure they are working properly.
Power Lines
Keep ladders at least 10 feet away from overhead power lines including the electrical service into your home.
Never touch a power line. Stay at a safe distance – you could be electrocuted. Report downed power lines to authorities. Some power lines are underground. Call your local utility before digging.
More of NFPA’s electrical safety information is available on our website at www.nfpa.org/electricalfires.
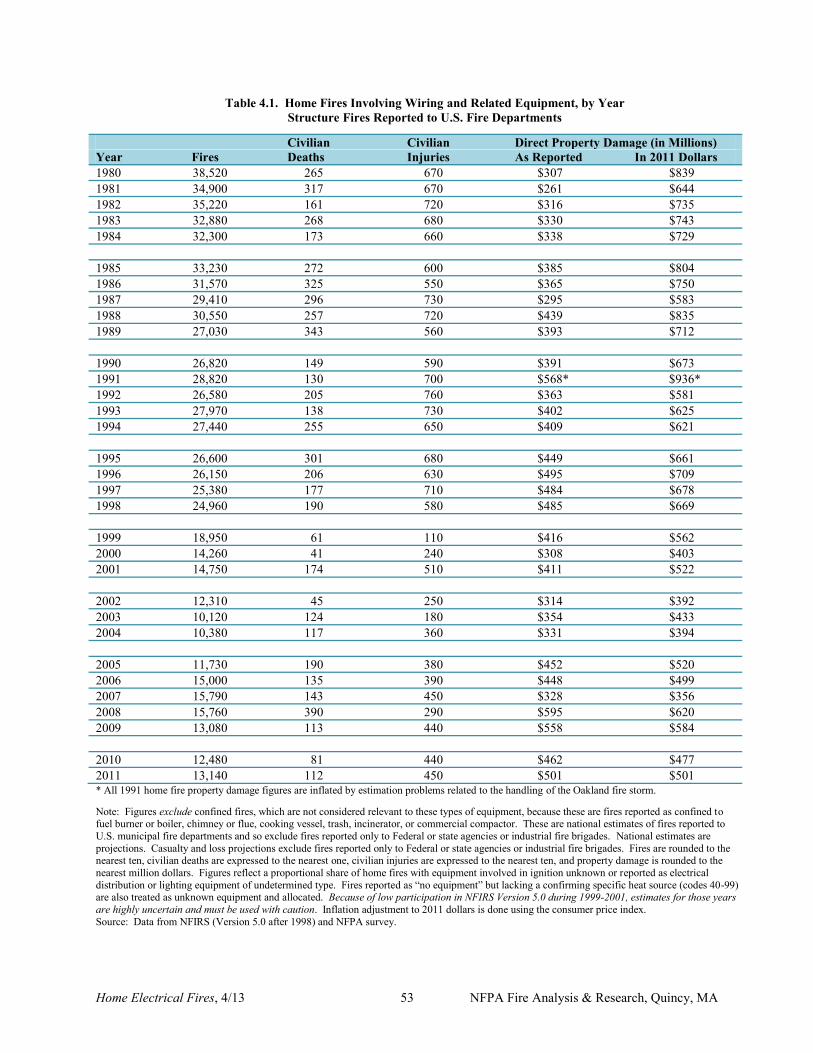
Home Electrical Fires, 4/13 53 NFPA Fire Analysis & Research, Quincy, MA
Table 4.1. Home Fires Involving Wiring and Related Equipment, by Year Structure Fires Reported to U.S. Fire Departments
Civilian Civilian Direct Property Damage (in Millions) Year Fires Deaths Injuries As Reported In 2011 Dollars 1980 38,520 265 670 $307 $839 1981 34,900 317 670 $261 $644 1982 35,220 161 720 $316 $735 1983 32,880 268 680 $330 $743 1984 32,300 173 660 $338 $729 1985 33,230 272 600 $385 $804 1986 31,570 325 550 $365 $750 1987 29,410 296 730 $295 $583 1988 30,550 257 720 $439 $835 1989 27,030 343 560 $393 $712 1990 26,820 149 590 $391 $673 1991 28,820 130 700 $568* $936* 1992 26,580 205 760 $363 $581 1993 27,970 138 730 $402 $625 1994 27,440 255 650 $409 $621 1995 26,600 301 680 $449 $661 1996 26,150 206 630 $495 $709 1997 25,380 177 710 $484 $678 1998 24,960 190 580 $485 $669 1999 18,950 61 110 $416 $562 2000 14,260 41 240 $308 $403 2001 14,750 174 510 $411 $522 2002 12,310 45 250 $314 $392 2003 10,120 124 180 $354 $433 2004 10,380 117 360 $331 $394 2005 11,730 190 380 $452 $520 2006 15,000 135 390 $448 $499 2007 15,790 143 450 $328 $356 2008 15,760 390 290 $595 $620 2009 13,080 113 440 $558 $584 2010 12,480 81 440 $462 $477 2011 13,140 112 450 $501 $501 * All 1991 home fire property damage figures are inflated by estimation problems related to the handling of the Oakland fire storm. Note: Figures exclude confined fires, which are not considered relevant to these types of equipment, because these are fires reported as confined to fuel burner or boiler, chimney or flue, cooking vessel, trash, incinerator, or commercial compactor. These are national estimates of fires reported to U.S. municipal fire departments and so exclude fires reported only to Federal or state agencies or industrial fire brigades. National estimates are projections. Casualty and loss projections exclude fires reported only to Federal or state agencies or industrial fire brigades. Fires are rounded to the nearest ten, civilian deaths are expressed to the nearest one, civilian injuries are expressed to the nearest ten, and property damage is rounded to the nearest million dollars. Figures reflect a proportional share of home fires with equipment involved in ignition unknown or reported as electrical distribution or lighting equipment of undetermined type. Fires reported as “no equipment” but lacking a confirming specific heat source (codes 40-99) are also treated as unknown equipment and allocated. Because of low participation in NFIRS Version 5.0 during 1999-2001, estimates for those years are highly uncertain and must be used with caution. Inflation adjustment to 2011 dollars is done using the consumer price index. Source: Data from NFIRS (Version 5.0 after 1998) and NFPA survey.
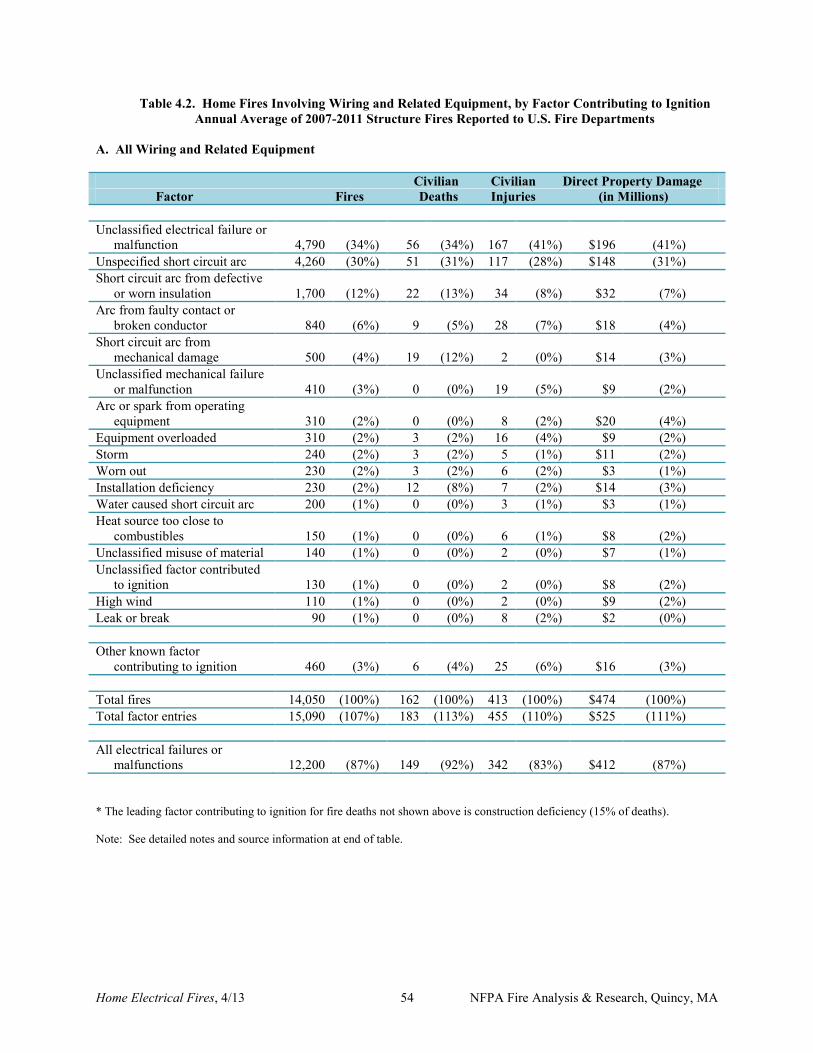
Home Electrical Fires, 4/13 54 NFPA Fire Analysis & Research, Quincy, MA
Table 4.2. Home Fires Involving Wiring and Related Equipment, by Factor Contributing to Ignition Annual Average of 2007-2011 Structure Fires Reported to U.S. Fire Departments
A. All Wiring and Related Equipment Civilian Civilian Direct Property Damage Factor Fires Deaths Injuries (in Millions) Unclassified electrical failure or malfunction 4,790 (34%) 56 (34%) 167 (41%) $196 (41%) Unspecified short circuit arc 4,260 (30%) 51 (31%) 117 (28%) $148 (31%) Short circuit arc from defective or worn insulation 1,700 (12%) 22 (13%) 34 (8%) $32 (7%) Arc from faulty contact or broken conductor 840 (6%) 9 (5%) 28 (7%) $18 (4%) Short circuit arc from mechanical damage 500 (4%) 19 (12%) 2 (0%) $14 (3%) Unclassified mechanical failure or malfunction 410 (3%) 0 (0%) 19 (5%) $9 (2%) Arc or spark from operating equipment 310 (2%) 0 (0%) 8 (2%) $20 (4%) Equipment overloaded 310 (2%) 3 (2%) 16 (4%) $9 (2%) Storm 240 (2%) 3 (2%) 5 (1%) $11 (2%) Worn out 230 (2%) 3 (2%) 6 (2%) $3 (1%) Installation deficiency 230 (2%) 12 (8%) 7 (2%) $14 (3%) Water caused short circuit arc 200 (1%) 0 (0%) 3 (1%) $3 (1%) Heat source too close to combustibles 150 (1%) 0 (0%) 6 (1%) $8 (2%) Unclassified misuse of material 140 (1%) 0 (0%) 2 (0%) $7 (1%) Unclassified factor contributed to ignition 130 (1%) 0 (0%) 2 (0%) $8 (2%) High wind 110 (1%) 0 (0%) 2 (0%) $9 (2%) Leak or break 90 (1%) 0 (0%) 8 (2%) $2 (0%) Other known factor contributing to ignition 460 (3%) 6 (4%) 25 (6%) $16 (3%) Total fires 14,050 (100%) 162 (100%) 413 (100%) $474 (100%) Total factor entries 15,090 (107%) 183 (113%) 455 (110%) $525 (111%) All electrical failures or malfunctions 12,200 (87%) 149 (92%) 342 (83%) $412 (87%) * The leading factor contributing to ignition for fire deaths not shown above is construction deficiency (15% of deaths). Note: See detailed notes and source information at end of table.
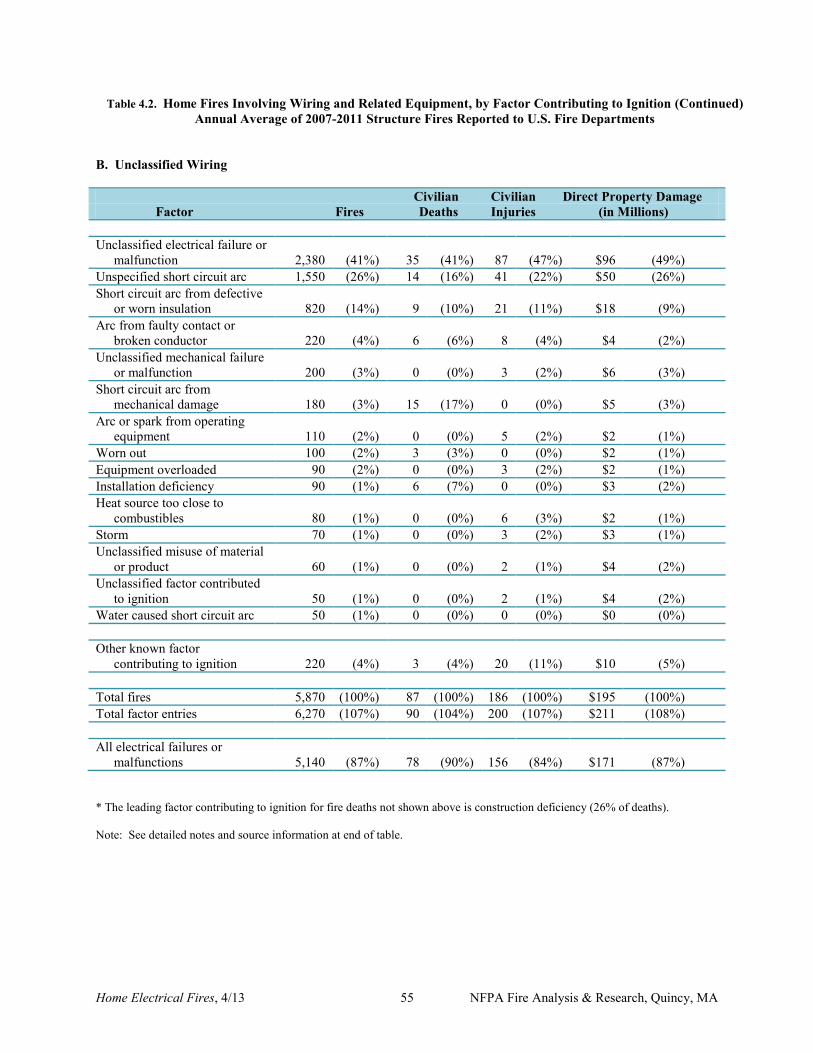
Home Electrical Fires, 4/13 55 NFPA Fire Analysis & Research, Quincy, MA
Table 4.2. Home Fires Involving Wiring and Related Equipment, by Factor Contributing to Ignition (Continued) Annual Average of 2007-2011 Structure Fires Reported to U.S. Fire Departments
B. Unclassified Wiring Civilian Civilian Direct Property Damage Factor Fires Deaths Injuries (in Millions) Unclassified electrical failure or malfunction 2,380 (41%) 35 (41%) 87 (47%) $96 (49%) Unspecified short circuit arc 1,550 (26%) 14 (16%) 41 (22%) $50 (26%) Short circuit arc from defective or worn insulation 820 (14%) 9 (10%) 21 (11%) $18 (9%) Arc from faulty contact or broken conductor 220 (4%) 6 (6%) 8 (4%) $4 (2%) Unclassified mechanical failure or malfunction 200 (3%) 0 (0%) 3 (2%) $6 (3%) Short circuit arc from mechanical damage 180 (3%) 15 (17%) 0 (0%) $5 (3%) Arc or spark from operating equipment 110 (2%) 0 (0%) 5 (2%) $2 (1%) Worn out 100 (2%) 3 (3%) 0 (0%) $2 (1%) Equipment overloaded 90 (2%) 0 (0%) 3 (2%) $2 (1%) Installation deficiency 90 (1%) 6 (7%) 0 (0%) $3 (2%) Heat source too close to combustibles 80 (1%) 0 (0%) 6 (3%) $2 (1%) Storm 70 (1%) 0 (0%) 3 (2%) $3 (1%) Unclassified misuse of material or product 60 (1%) 0 (0%) 2 (1%) $4 (2%) Unclassified factor contributed to ignition 50 (1%) 0 (0%) 2 (1%) $4 (2%) Water caused short circuit arc 50 (1%) 0 (0%) 0 (0%) $0 (0%) Other known factor contributing to ignition 220 (4%) 3 (4%) 20 (11%) $10 (5%) Total fires 5,870 (100%) 87 (100%) 186 (100%) $195 (100%) Total factor entries 6,270 (107%) 90 (104%) 200 (107%) $211 (108%) All electrical failures or malfunctions 5,140 (87%) 78 (90%) 156 (84%) $171 (87%) * The leading factor contributing to ignition for fire deaths not shown above is construction deficiency (26% of deaths). Note: See detailed notes and source information at end of table.
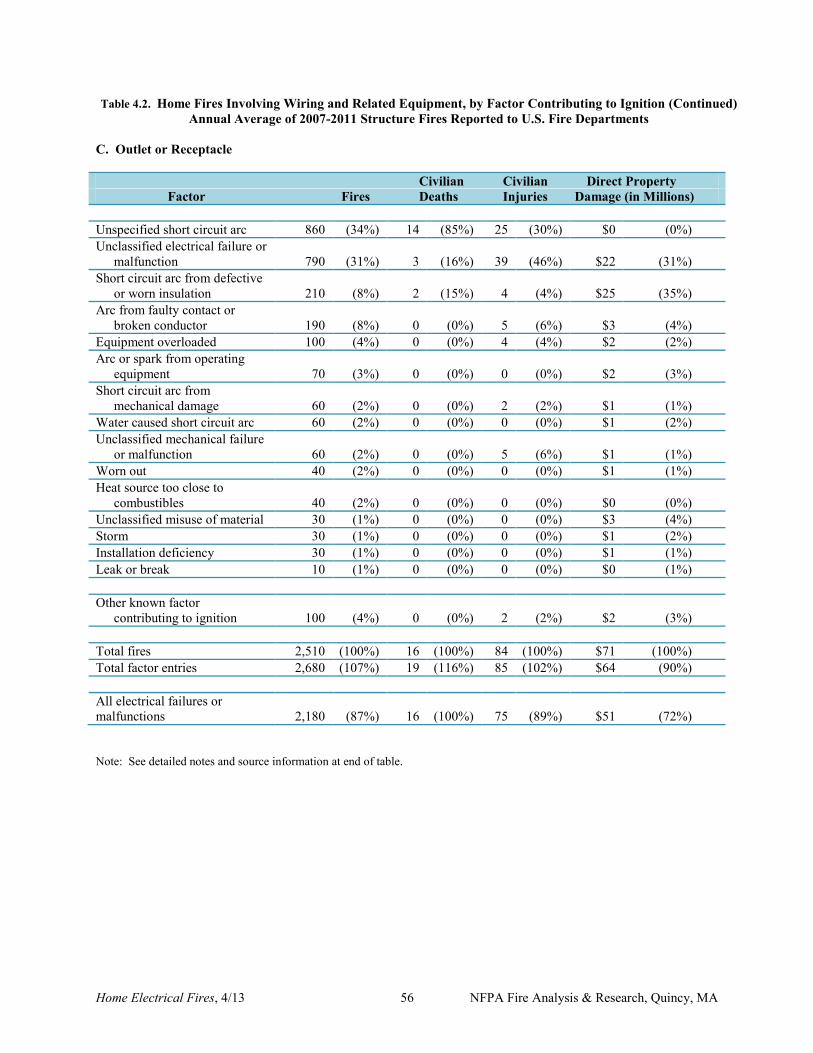
Home Electrical Fires, 4/13 56 NFPA Fire Analysis & Research, Quincy, MA
Table 4.2. Home Fires Involving Wiring and Related Equipment, by Factor Contributing to Ignition (Continued) Annual Average of 2007-2011 Structure Fires Reported to U.S. Fire Departments
C. Outlet or Receptacle Civilian Civilian Direct Property Factor Fires Deaths Injuries Damage (in Millions) Unspecified short circuit arc 860 (34%) 14 (85%) 25 (30%) $0 (0%) Unclassified electrical failure or malfunction 790 (31%) 3 (16%) 39 (46%) $22 (31%) Short circuit arc from defective or worn insulation 210 (8%) 2 (15%) 4 (4%) $25 (35%) Arc from faulty contact or broken conductor 190 (8%) 0 (0%) 5 (6%) $3 (4%) Equipment overloaded 100 (4%) 0 (0%) 4 (4%) $2 (2%) Arc or spark from operating equipment 70 (3%) 0 (0%) 0 (0%) $2 (3%) Short circuit arc from mechanical damage 60 (2%) 0 (0%) 2 (2%) $1 (1%) Water caused short circuit arc 60 (2%) 0 (0%) 0 (0%) $1 (2%) Unclassified mechanical failure or malfunction 60 (2%) 0 (0%) 5 (6%) $1 (1%) Worn out 40 (2%) 0 (0%) 0 (0%) $1 (1%) Heat source too close to combustibles 40 (2%) 0 (0%) 0 (0%) $0 (0%) Unclassified misuse of material 30 (1%) 0 (0%) 0 (0%) $3 (4%) Storm 30 (1%) 0 (0%) 0 (0%) $1 (2%) Installation deficiency 30 (1%) 0 (0%) 0 (0%) $1 (1%) Leak or break 10 (1%) 0 (0%) 0 (0%) $0 (1%) Other known factor contributing to ignition 100 (4%) 0 (0%) 2 (2%) $2 (3%) Total fires 2,510 (100%) 16 (100%) 84 (100%) $71 (100%) Total factor entries 2,680 (107%) 19 (116%) 85 (102%) $64 (90%) All electrical failures or malfunctions 2,180 (87%) 16 (100%) 75 (89%) $51 (72%) Note: See detailed notes and source information at end of table.
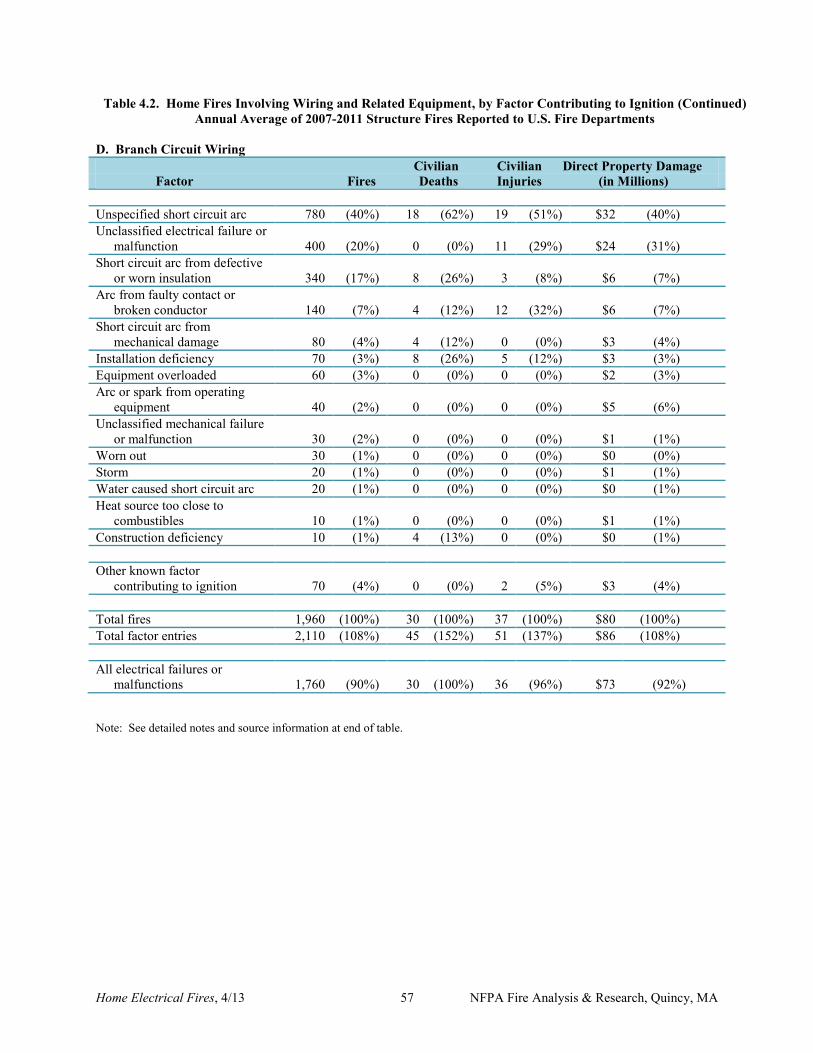
Home Electrical Fires, 4/13 57 NFPA Fire Analysis & Research, Quincy, MA
Table 4.2. Home Fires Involving Wiring and Related Equipment, by Factor Contributing to Ignition (Continued) Annual Average of 2007-2011 Structure Fires Reported to U.S. Fire Departments
D. Branch Circuit Wiring Civilian Civilian Direct Property Damage Factor Fires Deaths Injuries (in Millions) Unspecified short circuit arc 780 (40%) 18 (62%) 19 (51%) $32 (40%) Unclassified electrical failure or malfunction 400 (20%) 0 (0%) 11 (29%) $24 (31%) Short circuit arc from defective or worn insulation 340 (17%) 8 (26%) 3 (8%) $6 (7%) Arc from faulty contact or broken conductor 140 (7%) 4 (12%) 12 (32%) $6 (7%) Short circuit arc from mechanical damage 80 (4%) 4 (12%) 0 (0%) $3 (4%) Installation deficiency 70 (3%) 8 (26%) 5 (12%) $3 (3%) Equipment overloaded 60 (3%) 0 (0%) 0 (0%) $2 (3%) Arc or spark from operating equipment 40 (2%) 0 (0%) 0 (0%) $5 (6%) Unclassified mechanical failure or malfunction 30 (2%) 0 (0%) 0 (0%) $1 (1%) Worn out 30 (1%) 0 (0%) 0 (0%) $0 (0%) Storm 20 (1%) 0 (0%) 0 (0%) $1 (1%) Water caused short circuit arc 20 (1%) 0 (0%) 0 (0%) $0 (1%) Heat source too close to combustibles 10 (1%) 0 (0%) 0 (0%) $1 (1%) Construction deficiency 10 (1%) 4 (13%) 0 (0%) $0 (1%) Other known factor contributing to ignition 70 (4%) 0 (0%) 2 (5%) $3 (4%) Total fires 1,960 (100%) 30 (100%) 37 (100%) $80 (100%) Total factor entries 2,110 (108%) 45 (152%) 51 (137%) $86 (108%) All electrical failures or malfunctions 1,760 (90%) 30 (100%) 36 (96%) $73 (92%) Note: See detailed notes and source information at end of table.
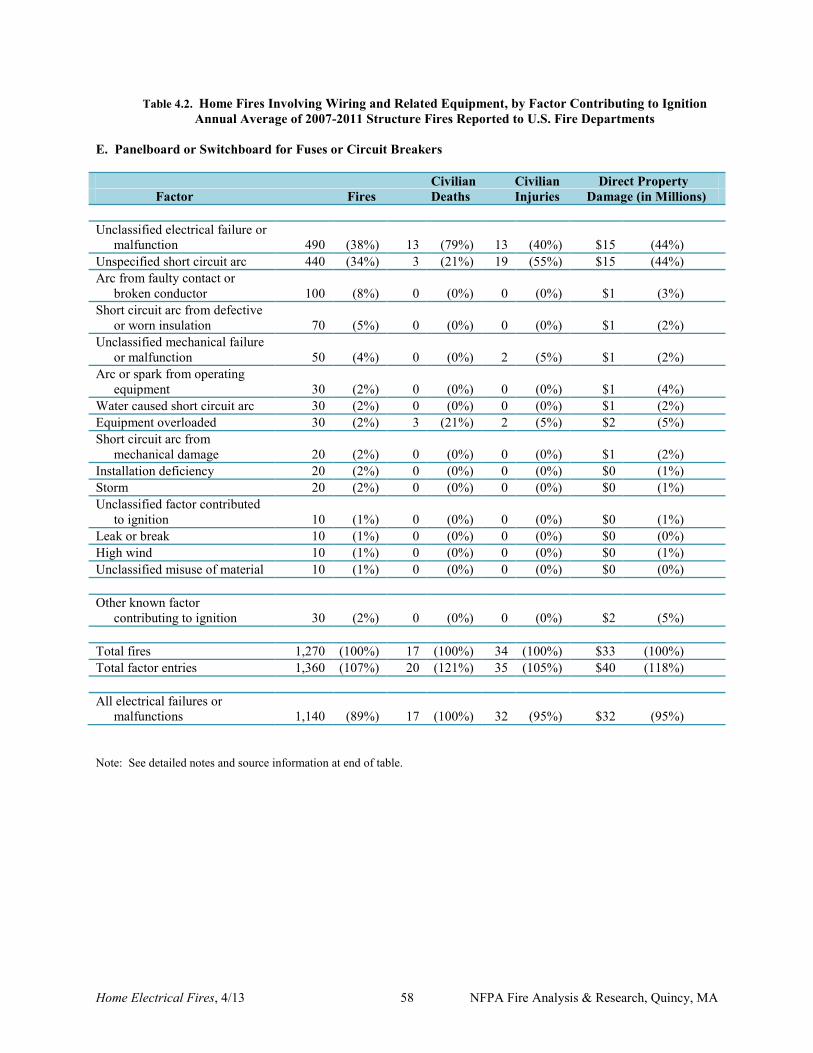
Home Electrical Fires, 4/13 58 NFPA Fire Analysis & Research, Quincy, MA
Table 4.2. Home Fires Involving Wiring and Related Equipment, by Factor Contributing to Ignition Annual Average of 2007-2011 Structure Fires Reported to U.S. Fire Departments
E. Panelboard or Switchboard for Fuses or Circuit Breakers Civilian Civilian Direct Property Factor Fires Deaths Injuries Damage (in Millions) Unclassified electrical failure or malfunction 490 (38%) 13 (79%) 13 (40%) $15 (44%) Unspecified short circuit arc 440 (34%) 3 (21%) 19 (55%) $15 (44%) Arc from faulty contact or broken conductor 100 (8%) 0 (0%) 0 (0%) $1 (3%) Short circuit arc from defective or worn insulation 70 (5%) 0 (0%) 0 (0%) $1 (2%) Unclassified mechanical failure or malfunction 50 (4%) 0 (0%) 2 (5%) $1 (2%) Arc or spark from operating equipment 30 (2%) 0 (0%) 0 (0%) $1 (4%) Water caused short circuit arc 30 (2%) 0 (0%) 0 (0%) $1 (2%) Equipment overloaded 30 (2%) 3 (21%) 2 (5%) $2 (5%) Short circuit arc from mechanical damage 20 (2%) 0 (0%) 0 (0%) $1 (2%) Installation deficiency 20 (2%) 0 (0%) 0 (0%) $0 (1%) Storm 20 (2%) 0 (0%) 0 (0%) $0 (1%) Unclassified factor contributed to ignition 10 (1%) 0 (0%) 0 (0%) $0 (1%) Leak or break 10 (1%) 0 (0%) 0 (0%) $0 (0%) High wind 10 (1%) 0 (0%) 0 (0%) $0 (1%) Unclassified misuse of material 10 (1%) 0 (0%) 0 (0%) $0 (0%) Other known factor contributing to ignition 30 (2%) 0 (0%) 0 (0%) $2 (5%) Total fires 1,270 (100%) 17 (100%) 34 (100%) $33 (100%) Total factor entries 1,360 (107%) 20 (121%) 35 (105%) $40 (118%) All electrical failures or malfunctions 1,140 (89%) 17 (100%) 32 (95%) $32 (95%) Note: See detailed notes and source information at end of table.
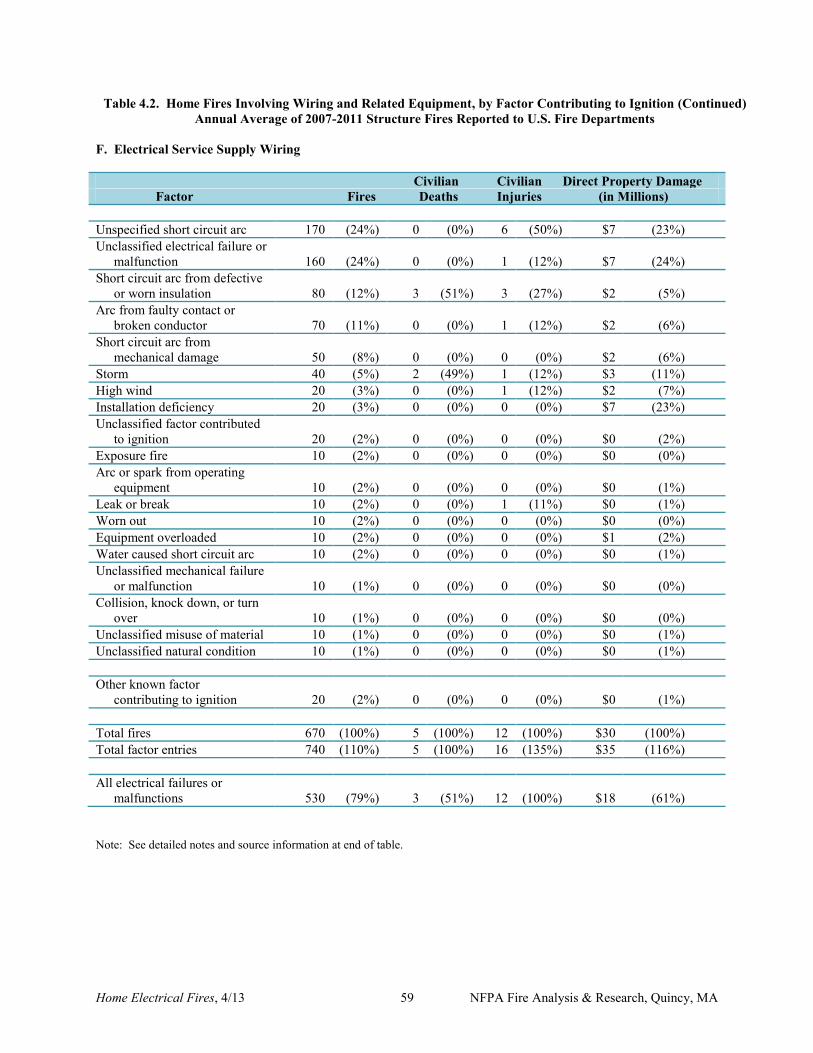
Home Electrical Fires, 4/13 59 NFPA Fire Analysis & Research, Quincy, MA
Table 4.2. Home Fires Involving Wiring and Related Equipment, by Factor Contributing to Ignition (Continued) Annual Average of 2007-2011 Structure Fires Reported to U.S. Fire Departments
F. Electrical Service Supply Wiring Civilian Civilian Direct Property Damage Factor Fires Deaths Injuries (in Millions) Unspecified short circuit arc 170 (24%) 0 (0%) 6 (50%) $7 (23%) Unclassified electrical failure or malfunction 160 (24%) 0 (0%) 1 (12%) $7 (24%) Short circuit arc from defective or worn insulation 80 (12%) 3 (51%) 3 (27%) $2 (5%) Arc from faulty contact or broken conductor 70 (11%) 0 (0%) 1 (12%) $2 (6%) Short circuit arc from mechanical damage 50 (8%) 0 (0%) 0 (0%) $2 (6%) Storm 40 (5%) 2 (49%) 1 (12%) $3 (11%) High wind 20 (3%) 0 (0%) 1 (12%) $2 (7%) Installation deficiency 20 (3%) 0 (0%) 0 (0%) $7 (23%) Unclassified factor contributed to ignition 20 (2%) 0 (0%) 0 (0%) $0 (2%) Exposure fire 10 (2%) 0 (0%) 0 (0%) $0 (0%) Arc or spark from operating equipment 10 (2%) 0 (0%) 0 (0%) $0 (1%) Leak or break 10 (2%) 0 (0%) 1 (11%) $0 (1%) Worn out 10 (2%) 0 (0%) 0 (0%) $0 (0%) Equipment overloaded 10 (2%) 0 (0%) 0 (0%) $1 (2%) Water caused short circuit arc 10 (2%) 0 (0%) 0 (0%) $0 (1%) Unclassified mechanical failure or malfunction 10 (1%) 0 (0%) 0 (0%) $0 (0%) Collision, knock down, or turn over 10 (1%) 0 (0%) 0 (0%) $0 (0%) Unclassified misuse of material 10 (1%) 0 (0%) 0 (0%) $0 (1%) Unclassified natural condition 10 (1%) 0 (0%) 0 (0%) $0 (1%) Other known factor contributing to ignition 20 (2%) 0 (0%) 0 (0%) $0 (1%) Total fires 670 (100%) 5 (100%) 12 (100%) $30 (100%) Total factor entries 740 (110%) 5 (100%) 16 (135%) $35 (116%) All electrical failures or malfunctions 530 (79%) 3 (51%) 12 (100%) $18 (61%) Note: See detailed notes and source information at end of table.
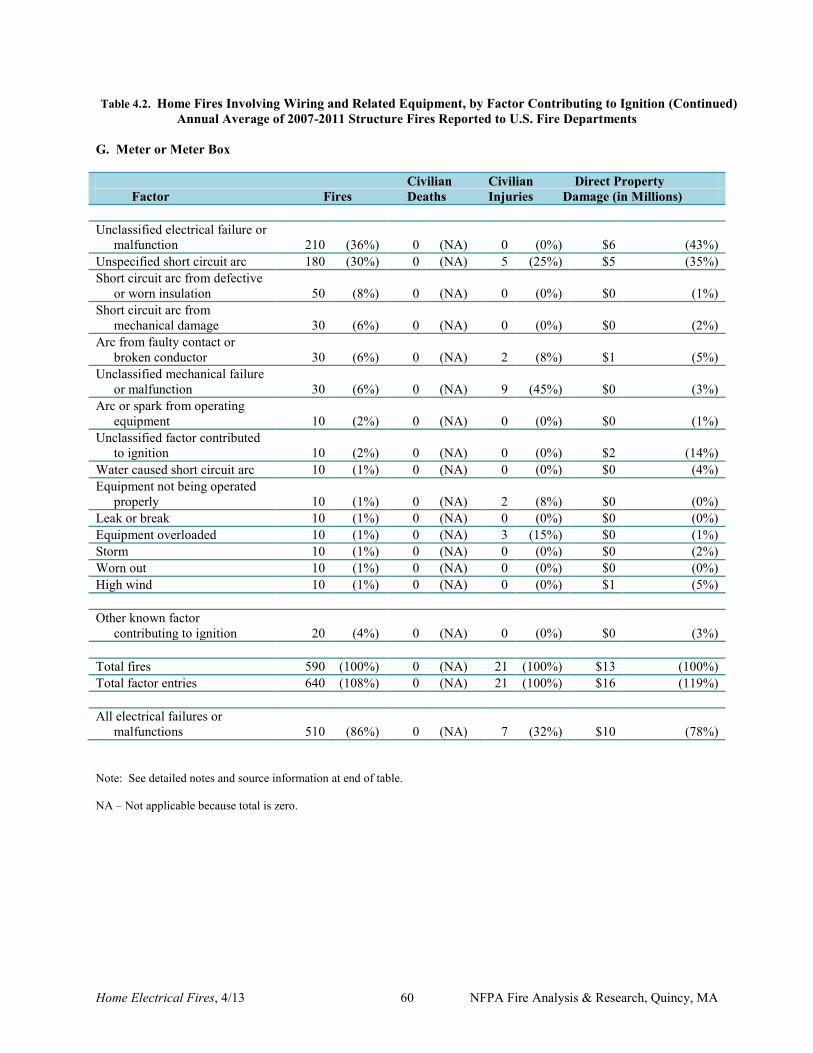
Home Electrical Fires, 4/13 60 NFPA Fire Analysis & Research, Quincy, MA
Table 4.2. Home Fires Involving Wiring and Related Equipment, by Factor Contributing to Ignition (Continued) Annual Average of 2007-2011 Structure Fires Reported to U.S. Fire Departments
G. Meter or Meter Box Civilian Civilian Direct Property Factor Fires Deaths Injuries Damage (in Millions) Unclassified electrical failure or malfunction 210 (36%) 0 (NA) 0 (0%) $6 (43%) Unspecified short circuit arc 180 (30%) 0 (NA) 5 (25%) $5 (35%) Short circuit arc from defective or worn insulation 50 (8%) 0 (NA) 0 (0%) $0 (1%) Short circuit arc from mechanical damage 30 (6%) 0 (NA) 0 (0%) $0 (2%) Arc from faulty contact or broken conductor 30 (6%) 0 (NA) 2 (8%) $1 (5%) Unclassified mechanical failure or malfunction 30 (6%) 0 (NA) 9 (45%) $0 (3%) Arc or spark from operating equipment 10 (2%) 0 (NA) 0 (0%) $0 (1%) Unclassified factor contributed to ignition 10 (2%) 0 (NA) 0 (0%) $2 (14%) Water caused short circuit arc 10 (1%) 0 (NA) 0 (0%) $0 (4%) Equipment not being operated properly 10 (1%) 0 (NA) 2 (8%) $0 (0%) Leak or break 10 (1%) 0 (NA) 0 (0%) $0 (0%) Equipment overloaded 10 (1%) 0 (NA) 3 (15%) $0 (1%) Storm 10 (1%) 0 (NA) 0 (0%) $0 (2%) Worn out 10 (1%) 0 (NA) 0 (0%) $0 (0%) High wind 10 (1%) 0 (NA) 0 (0%) $1 (5%) Other known factor contributing to ignition 20 (4%) 0 (NA) 0 (0%) $0 (3%) Total fires 590 (100%) 0 (NA) 21 (100%) $13 (100%) Total factor entries 640 (108%) 0 (NA) 21 (100%) $16 (119%) All electrical failures or malfunctions 510 (86%) 0 (NA) 7 (32%) $10 (78%) Note: See detailed notes and source information at end of table. NA – Not applicable because total is zero.
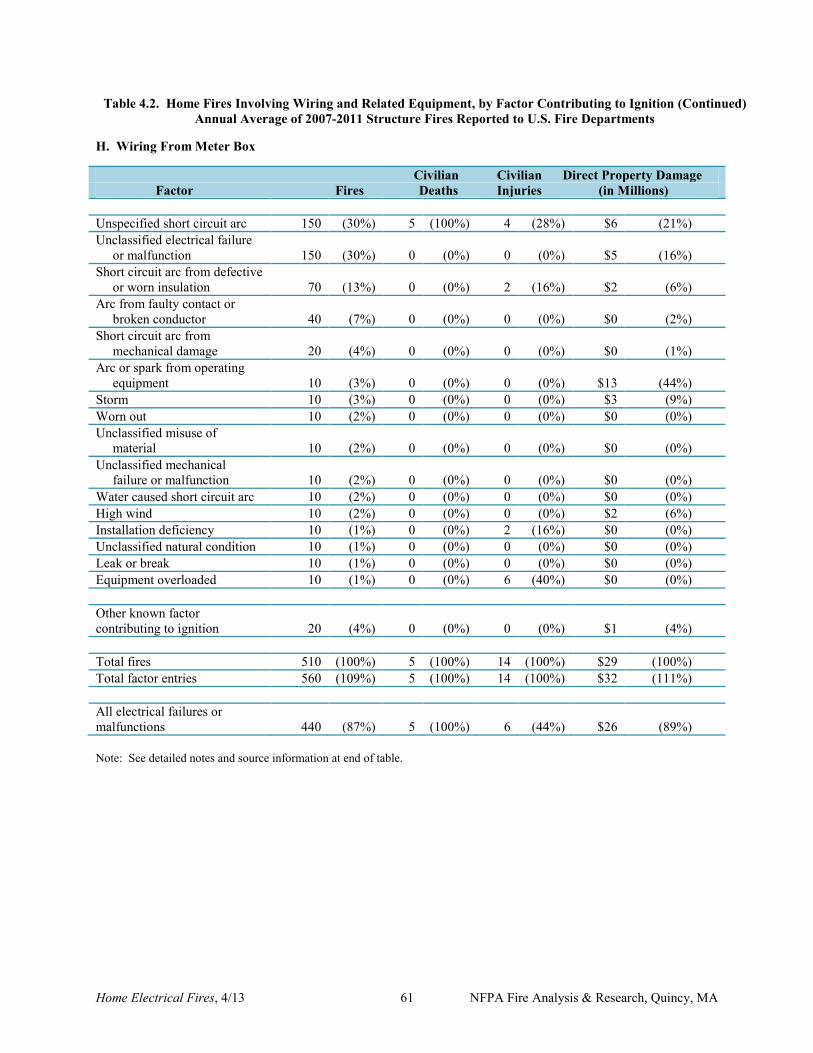
Home Electrical Fires, 4/13 61 NFPA Fire Analysis & Research, Quincy, MA
Table 4.2. Home Fires Involving Wiring and Related Equipment, by Factor Contributing to Ignition (Continued) Annual Average of 2007-2011 Structure Fires Reported to U.S. Fire Departments
H. Wiring From Meter Box Civilian Civilian Direct Property Damage Factor Fires Deaths Injuries (in Millions) Unspecified short circuit arc 150 (30%) 5 (100%) 4 (28%) $6 (21%) Unclassified electrical failure or malfunction 150 (30%) 0 (0%) 0 (0%) $5 (16%) Short circuit arc from defective or worn insulation 70 (13%) 0 (0%) 2 (16%) $2 (6%) Arc from faulty contact or broken conductor 40 (7%) 0 (0%) 0 (0%) $0 (2%) Short circuit arc from mechanical damage 20 (4%) 0 (0%) 0 (0%) $0 (1%) Arc or spark from operating equipment 10 (3%) 0 (0%) 0 (0%) $13 (44%) Storm 10 (3%) 0 (0%) 0 (0%) $3 (9%) Worn out 10 (2%) 0 (0%) 0 (0%) $0 (0%) Unclassified misuse of material 10 (2%) 0 (0%) 0 (0%) $0 (0%) Unclassified mechanical failure or malfunction 10 (2%) 0 (0%) 0 (0%) $0 (0%) Water caused short circuit arc 10 (2%) 0 (0%) 0 (0%) $0 (0%) High wind 10 (2%) 0 (0%) 0 (0%) $2 (6%) Installation deficiency 10 (1%) 0 (0%) 2 (16%) $0 (0%) Unclassified natural condition 10 (1%) 0 (0%) 0 (0%) $0 (0%) Leak or break 10 (1%) 0 (0%) 0 (0%) $0 (0%) Equipment overloaded 10 (1%) 0 (0%) 6 (40%) $0 (0%) Other known factor contributing to ignition 20 (4%) 0 (0%) 0 (0%) $1 (4%) Total fires 510 (100%) 5 (100%) 14 (100%) $29 (100%) Total factor entries 560 (109%) 5 (100%) 14 (100%) $32 (111%) All electrical failures or malfunctions 440 (87%) 5 (100%) 6 (44%) $26 (89%) Note: See detailed notes and source information at end of table.
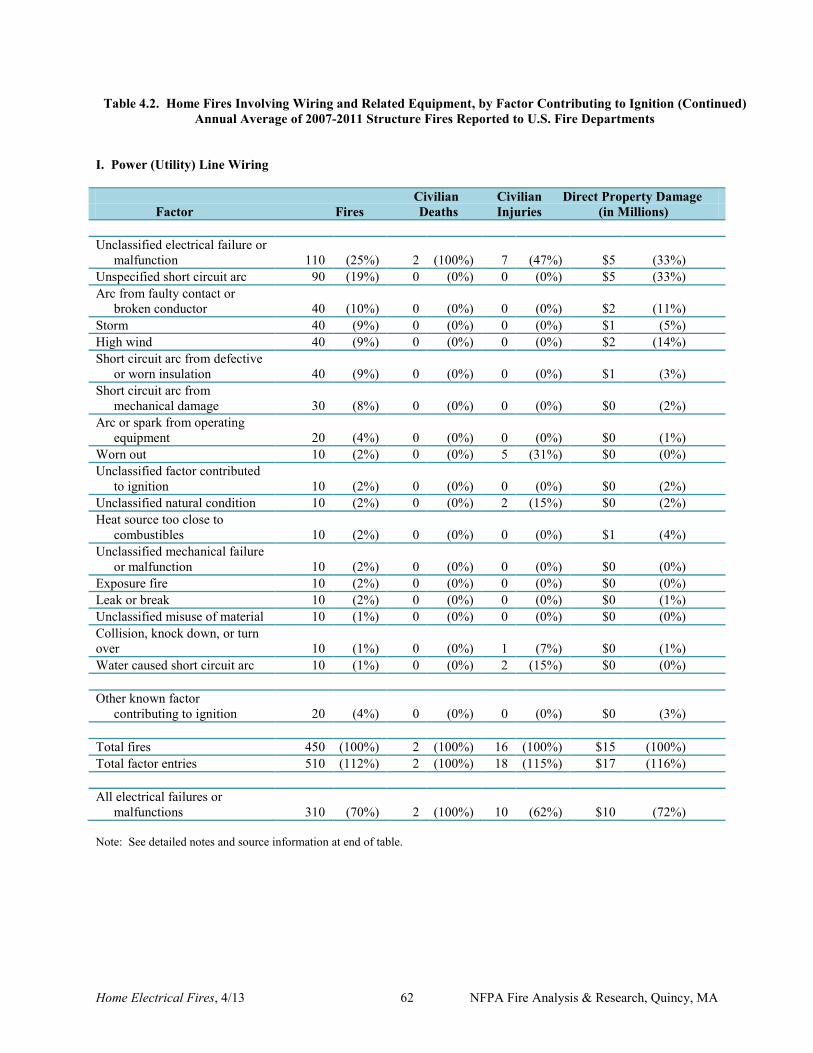
Home Electrical Fires, 4/13 62 NFPA Fire Analysis & Research, Quincy, MA
Table 4.2. Home Fires Involving Wiring and Related Equipment, by Factor Contributing to Ignition (Continued) Annual Average of 2007-2011 Structure Fires Reported to U.S. Fire Departments
I. Power (Utility) Line Wiring Civilian Civilian Direct Property Damage Factor Fires Deaths Injuries (in Millions) Unclassified electrical failure or malfunction 110 (25%) 2 (100%) 7 (47%) $5 (33%) Unspecified short circuit arc 90 (19%) 0 (0%) 0 (0%) $5 (33%) Arc from faulty contact or broken conductor 40 (10%) 0 (0%) 0 (0%) $2 (11%) Storm 40 (9%) 0 (0%) 0 (0%) $1 (5%) High wind 40 (9%) 0 (0%) 0 (0%) $2 (14%) Short circuit arc from defective or worn insulation 40 (9%) 0 (0%) 0 (0%) $1 (3%) Short circuit arc from mechanical damage 30 (8%) 0 (0%) 0 (0%) $0 (2%) Arc or spark from operating equipment 20 (4%) 0 (0%) 0 (0%) $0 (1%) Worn out 10 (2%) 0 (0%) 5 (31%) $0 (0%) Unclassified factor contributed to ignition 10 (2%) 0 (0%) 0 (0%) $0 (2%) Unclassified natural condition 10 (2%) 0 (0%) 2 (15%) $0 (2%) Heat source too close to combustibles 10 (2%) 0 (0%) 0 (0%) $1 (4%) Unclassified mechanical failure or malfunction 10 (2%) 0 (0%) 0 (0%) $0 (0%) Exposure fire 10 (2%) 0 (0%) 0 (0%) $0 (0%) Leak or break 10 (2%) 0 (0%) 0 (0%) $0 (1%) Unclassified misuse of material 10 (1%) 0 (0%) 0 (0%) $0 (0%) Collision, knock down, or turn over 10 (1%) 0 (0%) 1 (7%) $0 (1%) Water caused short circuit arc 10 (1%) 0 (0%) 2 (15%) $0 (0%) Other known factor contributing to ignition 20 (4%) 0 (0%) 0 (0%) $0 (3%) Total fires 450 (100%) 2 (100%) 16 (100%) $15 (100%) Total factor entries 510 (112%) 2 (100%) 18 (115%) $17 (116%) All electrical failures or malfunctions 310 (70%) 2 (100%) 10 (62%) $10 (72%) Note: See detailed notes and source information at end of table.
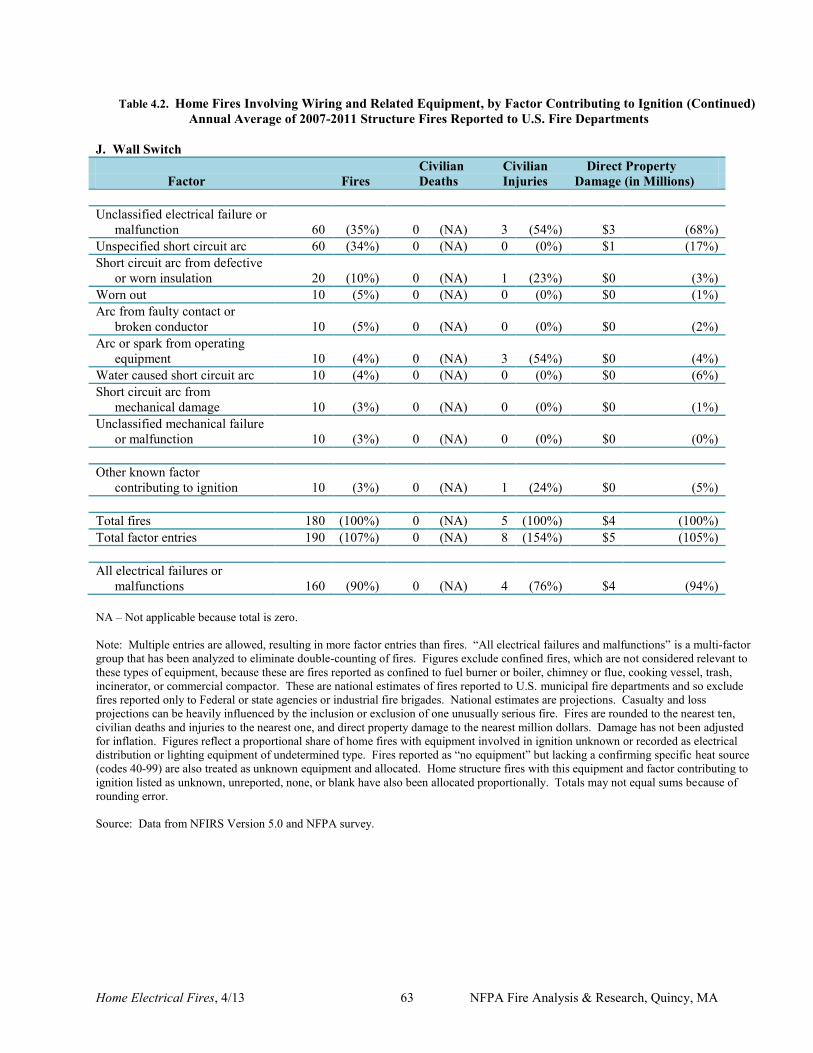
Home Electrical Fires, 4/13 63 NFPA Fire Analysis & Research, Quincy, MA
Table 4.2. Home Fires Involving Wiring and Related Equipment, by Factor Contributing to Ignition (Continued) Annual Average of 2007-2011 Structure Fires Reported to U.S. Fire Departments
J. Wall Switch Civilian Civilian Direct Property Factor Fires Deaths Injuries Damage (in Millions) Unclassified electrical failure or malfunction 60 (35%) 0 (NA) 3 (54%) $3 (68%) Unspecified short circuit arc 60 (34%) 0 (NA) 0 (0%) $1 (17%) Short circuit arc from defective or worn insulation 20 (10%) 0 (NA) 1 (23%) $0 (3%) Worn out 10 (5%) 0 (NA) 0 (0%) $0 (1%) Arc from faulty contact or broken conductor 10 (5%) 0 (NA) 0 (0%) $0 (2%) Arc or spark from operating equipment 10 (4%) 0 (NA) 3 (54%) $0 (4%) Water caused short circuit arc 10 (4%) 0 (NA) 0 (0%) $0 (6%) Short circuit arc from mechanical damage 10 (3%) 0 (NA) 0 (0%) $0 (1%) Unclassified mechanical failure or malfunction 10 (3%) 0 (NA) 0 (0%) $0 (0%) Other known factor contributing to ignition 10 (3%) 0 (NA) 1 (24%) $0 (5%) Total fires 180 (100%) 0 (NA) 5 (100%) $4 (100%) Total factor entries 190 (107%) 0 (NA) 8 (154%) $5 (105%) All electrical failures or malfunctions 160 (90%) 0 (NA) 4 (76%) $4 (94%) NA – Not applicable because total is zero. Note: Multiple entries are allowed, resulting in more factor entries than fires. “All electrical failures and malfunctions” is a multi-factor group that has been analyzed to eliminate double-counting of fires. Figures exclude confined fires, which are not considered relevant to these types of equipment, because these are fires reported as confined to fuel burner or boiler, chimney or flue, cooking vessel, trash, incinerator, or commercial compactor. These are national estimates of fires reported to U.S. municipal fire departments and so exclude fires reported only to Federal or state agencies or industrial fire brigades. National estimates are projections. Casualty and loss projections can be heavily influenced by the inclusion or exclusion of one unusually serious fire. Fires are rounded to the nearest ten, civilian deaths and injuries to the nearest one, and direct property damage to the nearest million dollars. Damage has not been adjusted for inflation. Figures reflect a proportional share of home fires with equipment involved in ignition unknown or recorded as electrical distribution or lighting equipment of undetermined type. Fires reported as “no equipment” but lacking a confirming specific heat source (codes 40-99) are also treated as unknown equipment and allocated. Home structure fires with this equipment and factor contributing to ignition listed as unknown, unreported, none, or blank have also been allocated proportionally. Totals may not equal sums because of rounding error. Source: Data from NFIRS Version 5.0 and NFPA survey.
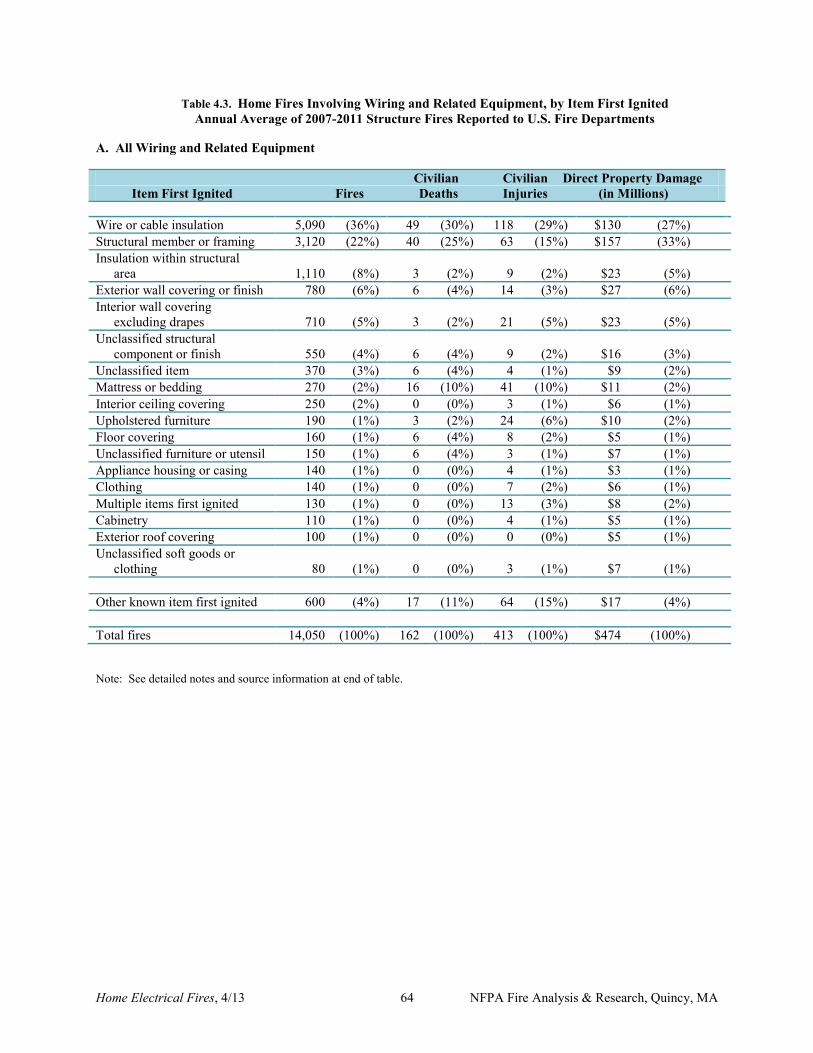
Home Electrical Fires, 4/13 64 NFPA Fire Analysis & Research, Quincy, MA
Table 4.3. Home Fires Involving Wiring and Related Equipment, by Item First Ignited Annual Average of 2007-2011 Structure Fires Reported to U.S. Fire Departments
A. All Wiring and Related Equipment Civilian Civilian Direct Property Damage Item First Ignited Fires Deaths Injuries (in Millions) Wire or cable insulation 5,090 (36%) 49 (30%) 118 (29%) $130 (27%) Structural member or framing 3,120 (22%) 40 (25%) 63 (15%) $157 (33%) Insulation within structural area 1,110 (8%) 3 (2%) 9 (2%) $23 (5%) Exterior wall covering or finish 780 (6%) 6 (4%) 14 (3%) $27 (6%) Interior wall covering excluding drapes 710 (5%) 3 (2%) 21 (5%) $23 (5%) Unclassified structural component or finish 550 (4%) 6 (4%) 9 (2%) $16 (3%) Unclassified item 370 (3%) 6 (4%) 4 (1%) $9 (2%) Mattress or bedding 270 (2%) 16 (10%) 41 (10%) $11 (2%) Interior ceiling covering 250 (2%) 0 (0%) 3 (1%) $6 (1%) Upholstered furniture 190 (1%) 3 (2%) 24 (6%) $10 (2%) Floor covering 160 (1%) 6 (4%) 8 (2%) $5 (1%) Unclassified furniture or utensil 150 (1%) 6 (4%) 3 (1%) $7 (1%) Appliance housing or casing 140 (1%) 0 (0%) 4 (1%) $3 (1%) Clothing 140 (1%) 0 (0%) 7 (2%) $6 (1%) Multiple items first ignited 130 (1%) 0 (0%) 13 (3%) $8 (2%) Cabinetry 110 (1%) 0 (0%) 4 (1%) $5 (1%) Exterior roof covering 100 (1%) 0 (0%) 0 (0%) $5 (1%) Unclassified soft goods or clothing 80 (1%) 0 (0%) 3 (1%) $7 (1%) Other known item first ignited 600 (4%) 17 (11%) 64 (15%) $17 (4%) Total fires 14,050 (100%) 162 (100%) 413 (100%) $474 (100%) Note: See detailed notes and source information at end of table.
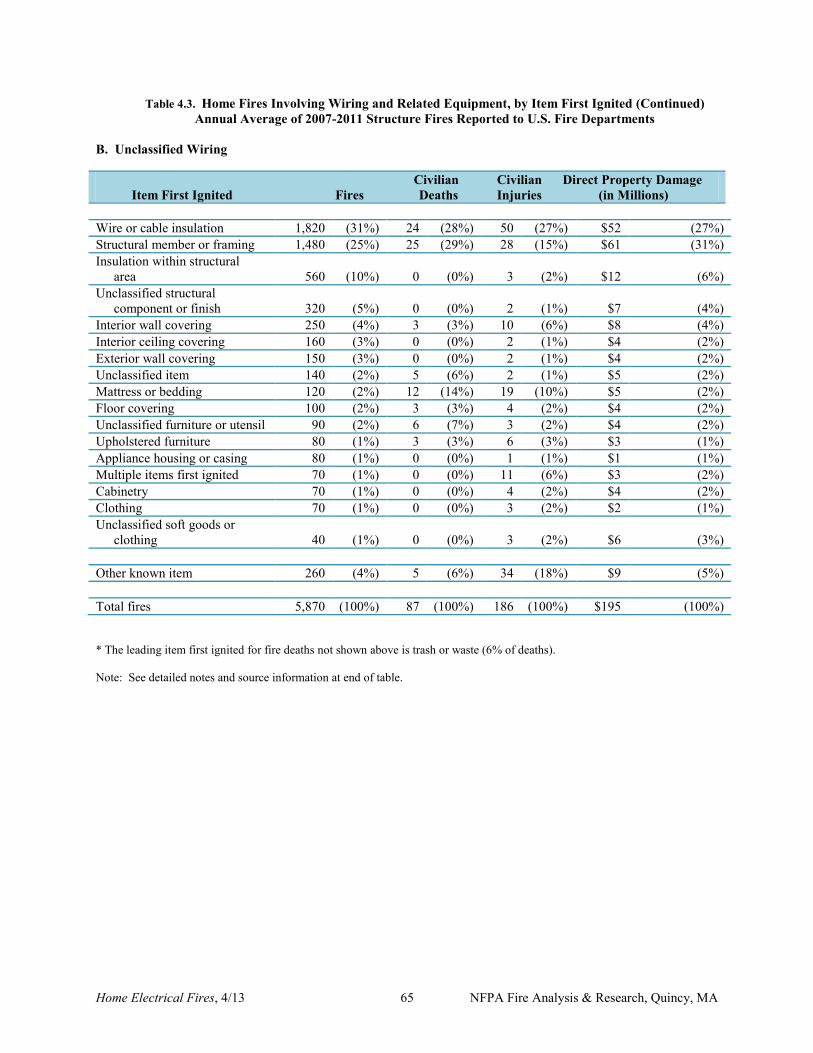
Home Electrical Fires, 4/13 65 NFPA Fire Analysis & Research, Quincy, MA
Table 4.3. Home Fires Involving Wiring and Related Equipment, by Item First Ignited (Continued) Annual Average of 2007-2011 Structure Fires Reported to U.S. Fire Departments
B. Unclassified Wiring Civilian Civilian Direct Property Damage Item First Ignited Fires Deaths Injuries (in Millions) Wire or cable insulation 1,820 (31%) 24 (28%) 50 (27%) $52 (27%) Structural member or framing 1,480 (25%) 25 (29%) 28 (15%) $61 (31%) Insulation within structural area 560 (10%) 0 (0%) 3 (2%) $12 (6%) Unclassified structural component or finish 320 (5%) 0 (0%) 2 (1%) $7 (4%) Interior wall covering 250 (4%) 3 (3%) 10 (6%) $8 (4%) Interior ceiling covering 160 (3%) 0 (0%) 2 (1%) $4 (2%) Exterior wall covering 150 (3%) 0 (0%) 2 (1%) $4 (2%) Unclassified item 140 (2%) 5 (6%) 2 (1%) $5 (2%) Mattress or bedding 120 (2%) 12 (14%) 19 (10%) $5 (2%) Floor covering 100 (2%) 3 (3%) 4 (2%) $4 (2%) Unclassified furniture or utensil 90 (2%) 6 (7%) 3 (2%) $4 (2%) Upholstered furniture 80 (1%) 3 (3%) 6 (3%) $3 (1%) Appliance housing or casing 80 (1%) 0 (0%) 1 (1%) $1 (1%) Multiple items first ignited 70 (1%) 0 (0%) 11 (6%) $3 (2%) Cabinetry 70 (1%) 0 (0%) 4 (2%) $4 (2%) Clothing 70 (1%) 0 (0%) 3 (2%) $2 (1%) Unclassified soft goods or clothing 40 (1%) 0 (0%) 3 (2%) $6 (3%) Other known item 260 (4%) 5 (6%) 34 (18%) $9 (5%) Total fires 5,870 (100%) 87 (100%) 186 (100%) $195 (100%) * The leading item first ignited for fire deaths not shown above is trash or waste (6% of deaths). Note: See detailed notes and source information at end of table.
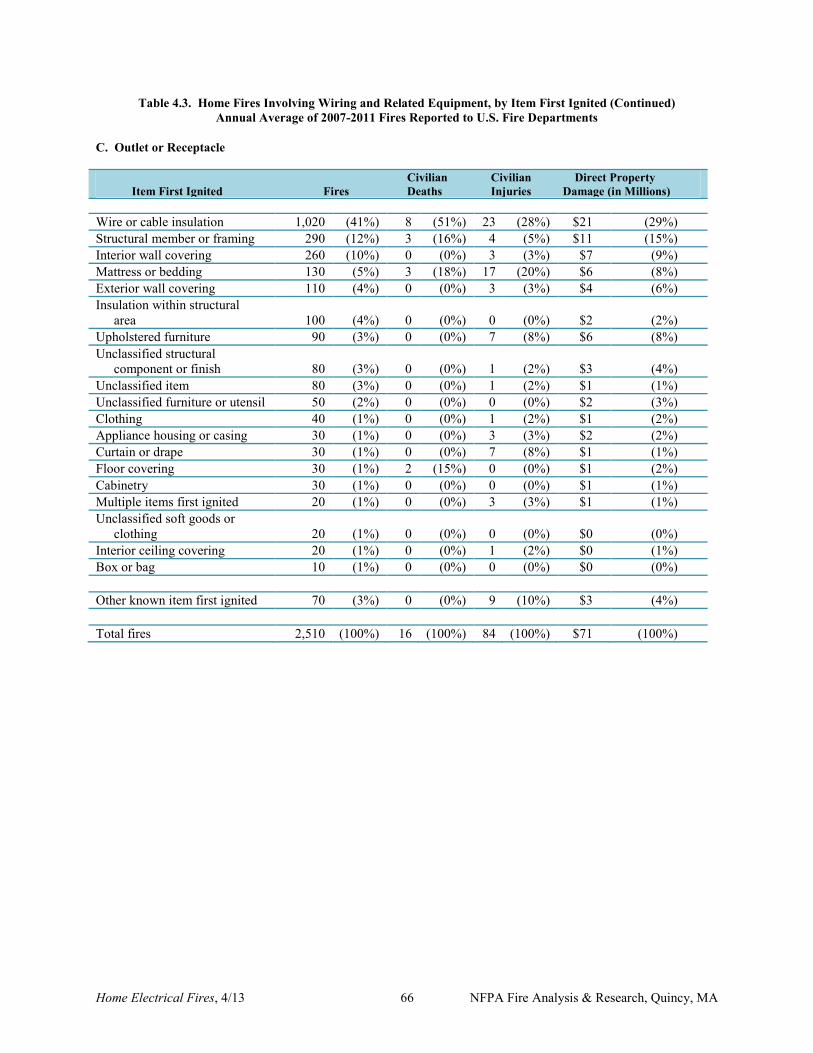
Home Electrical Fires, 4/13 66 NFPA Fire Analysis & Research, Quincy, MA
Table 4.3. Home Fires Involving Wiring and Related Equipment, by Item First Ignited (Continued) Annual Average of 2007-2011 Fires Reported to U.S. Fire Departments
C. Outlet or Receptacle Civilian Civilian Direct Property Item First Ignited Fires Deaths Injuries Damage (in Millions) Wire or cable insulation 1,020 (41%) 8 (51%) 23 (28%) $21 (29%) Structural member or framing 290 (12%) 3 (16%) 4 (5%) $11 (15%) Interior wall covering 260 (10%) 0 (0%) 3 (3%) $7 (9%) Mattress or bedding 130 (5%) 3 (18%) 17 (20%) $6 (8%) Exterior wall covering 110 (4%) 0 (0%) 3 (3%) $4 (6%) Insulation within structural area 100 (4%) 0 (0%) 0 (0%) $2 (2%) Upholstered furniture 90 (3%) 0 (0%) 7 (8%) $6 (8%) Unclassified structural component or finish 80 (3%) 0 (0%) 1 (2%) $3 (4%) Unclassified item 80 (3%) 0 (0%) 1 (2%) $1 (1%) Unclassified furniture or utensil 50 (2%) 0 (0%) 0 (0%) $2 (3%) Clothing 40 (1%) 0 (0%) 1 (2%) $1 (2%) Appliance housing or casing 30 (1%) 0 (0%) 3 (3%) $2 (2%) Curtain or drape 30 (1%) 0 (0%) 7 (8%) $1 (1%) Floor covering 30 (1%) 2 (15%) 0 (0%) $1 (2%) Cabinetry 30 (1%) 0 (0%) 0 (0%) $1 (1%) Multiple items first ignited 20 (1%) 0 (0%) 3 (3%) $1 (1%) Unclassified soft goods or clothing 20 (1%) 0 (0%) 0 (0%) $0 (0%) Interior ceiling covering 20 (1%) 0 (0%) 1 (2%) $0 (1%) Box or bag 10 (1%) 0 (0%) 0 (0%) $0 (0%) Other known item first ignited 70 (3%) 0 (0%) 9 (10%) $3 (4%) Total fires 2,510 (100%) 16 (100%) 84 (100%) $71 (100%)
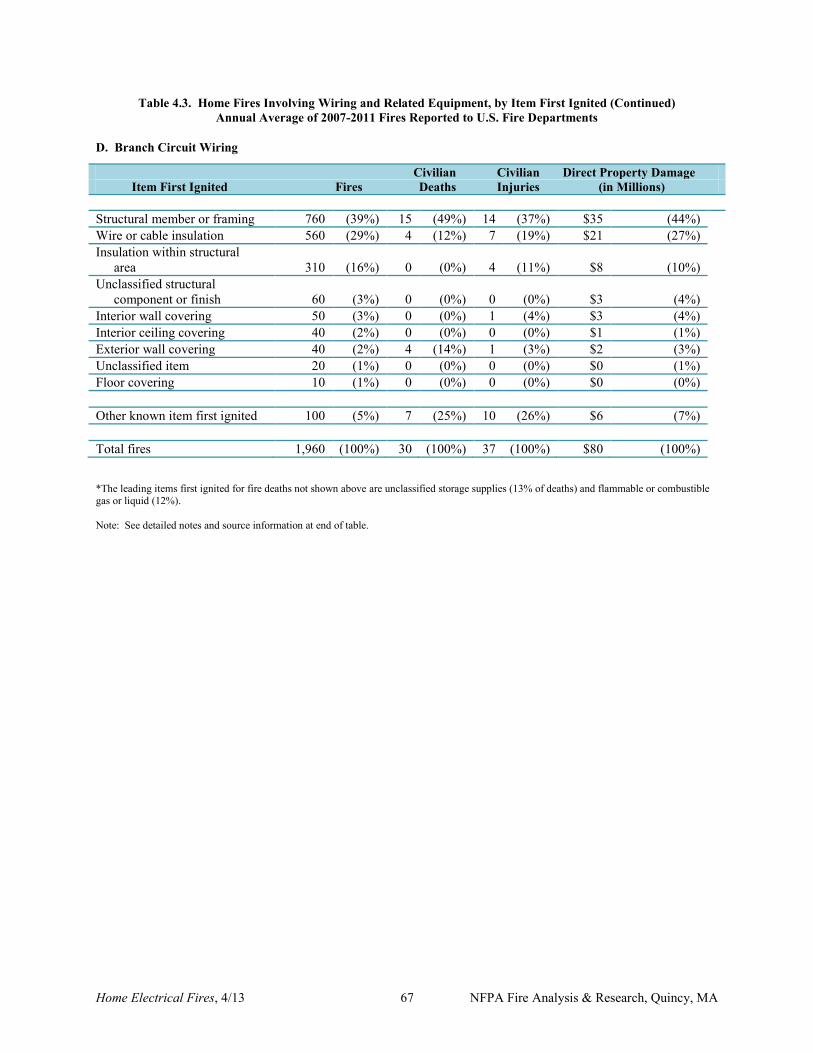
Home Electrical Fires, 4/13 67 NFPA Fire Analysis & Research, Quincy, MA
Table 4.3. Home Fires Involving Wiring and Related Equipment, by Item First Ignited (Continued) Annual Average of 2007-2011 Fires Reported to U.S. Fire Departments
D. Branch Circuit Wiring
Civilian Civilian Direct Property Damage Item First Ignited Fires Deaths Injuries (in Millions) Structural member or framing 760 (39%) 15 (49%) 14 (37%) $35 (44%) Wire or cable insulation 560 (29%) 4 (12%) 7 (19%) $21 (27%) Insulation within structural area 310 (16%) 0 (0%) 4 (11%) $8 (10%) Unclassified structural component or finish 60 (3%) 0 (0%) 0 (0%) $3 (4%) Interior wall covering 50 (3%) 0 (0%) 1 (4%) $3 (4%) Interior ceiling covering 40 (2%) 0 (0%) 0 (0%) $1 (1%) Exterior wall covering 40 (2%) 4 (14%) 1 (3%) $2 (3%) Unclassified item 20 (1%) 0 (0%) 0 (0%) $0 (1%) Floor covering 10 (1%) 0 (0%) 0 (0%) $0 (0%) Other known item first ignited 100 (5%) 7 (25%) 10 (26%) $6 (7%) Total fires 1,960 (100%) 30 (100%) 37 (100%) $80 (100%) *The leading items first ignited for fire deaths not shown above are unclassified storage supplies (13% of deaths) and flammable or combustible gas or liquid (12%). Note: See detailed notes and source information at end of table.
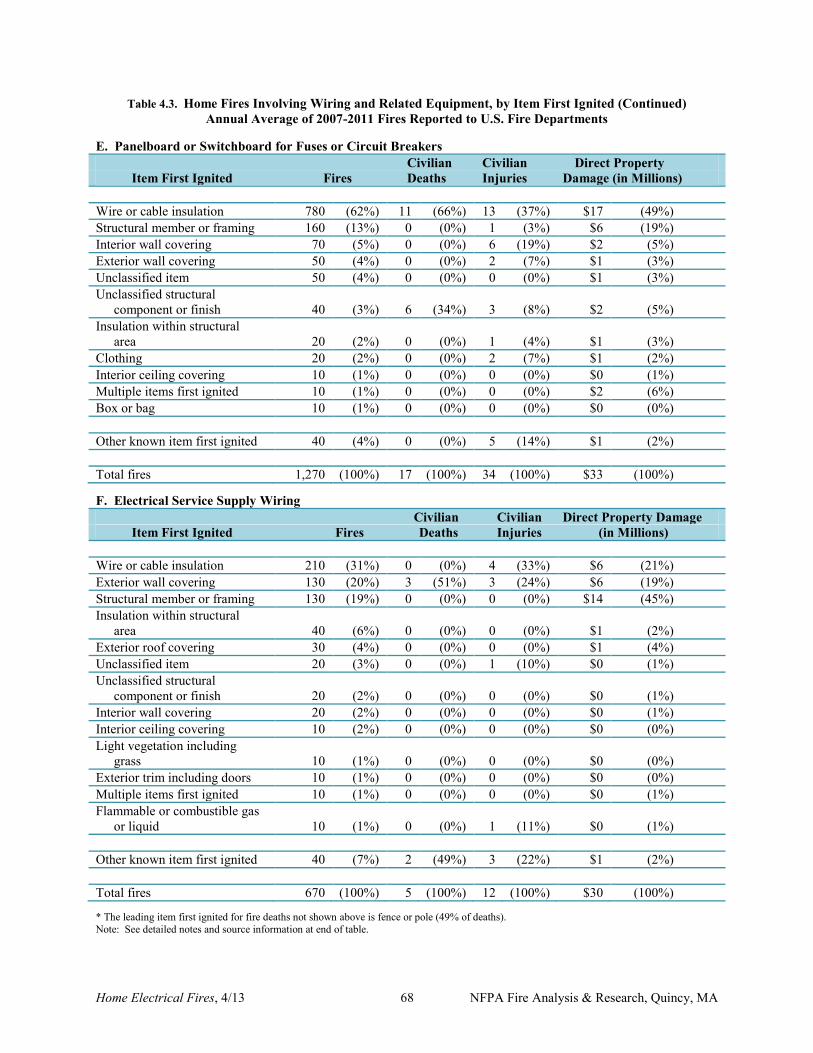
Home Electrical Fires, 4/13 68 NFPA Fire Analysis & Research, Quincy, MA
Table 4.3. Home Fires Involving Wiring and Related Equipment, by Item First Ignited (Continued) Annual Average of 2007-2011 Fires Reported to U.S. Fire Departments
E. Panelboard or Switchboard for Fuses or Circuit Breakers Civilian Civilian Direct Property Item First Ignited Fires Deaths Injuries Damage (in Millions) Wire or cable insulation 780 (62%) 11 (66%) 13 (37%) $17 (49%) Structural member or framing 160 (13%) 0 (0%) 1 (3%) $6 (19%) Interior wall covering 70 (5%) 0 (0%) 6 (19%) $2 (5%) Exterior wall covering 50 (4%) 0 (0%) 2 (7%) $1 (3%) Unclassified item 50 (4%) 0 (0%) 0 (0%) $1 (3%) Unclassified structural component or finish 40 (3%) 6 (34%) 3 (8%) $2 (5%) Insulation within structural area 20 (2%) 0 (0%) 1 (4%) $1 (3%) Clothing 20 (2%) 0 (0%) 2 (7%) $1 (2%) Interior ceiling covering 10 (1%) 0 (0%) 0 (0%) $0 (1%) Multiple items first ignited 10 (1%) 0 (0%) 0 (0%) $2 (6%) Box or bag 10 (1%) 0 (0%) 0 (0%) $0 (0%) Other known item first ignited 40 (4%) 0 (0%) 5 (14%) $1 (2%) Total fires 1,270 (100%) 17 (100%) 34 (100%) $33 (100%)
F. Electrical Service Supply Wiring Civilian Civilian Direct Property Damage Item First Ignited Fires Deaths Injuries (in Millions) Wire or cable insulation 210 (31%) 0 (0%) 4 (33%) $6 (21%) Exterior wall covering 130 (20%) 3 (51%) 3 (24%) $6 (19%) Structural member or framing 130 (19%) 0 (0%) 0 (0%) $14 (45%) Insulation within structural area 40 (6%) 0 (0%) 0 (0%) $1 (2%) Exterior roof covering 30 (4%) 0 (0%) 0 (0%) $1 (4%) Unclassified item 20 (3%) 0 (0%) 1 (10%) $0 (1%) Unclassified structural component or finish 20 (2%) 0 (0%) 0 (0%) $0 (1%) Interior wall covering 20 (2%) 0 (0%) 0 (0%) $0 (1%) Interior ceiling covering 10 (2%) 0 (0%) 0 (0%) $0 (0%) Light vegetation including grass 10 (1%) 0 (0%) 0 (0%) $0 (0%) Exterior trim including doors 10 (1%) 0 (0%) 0 (0%) $0 (0%) Multiple items first ignited 10 (1%) 0 (0%) 0 (0%) $0 (1%) Flammable or combustible gas or liquid 10 (1%) 0 (0%) 1 (11%) $0 (1%) Other known item first ignited 40 (7%) 2 (49%) 3 (22%) $1 (2%) Total fires 670 (100%) 5 (100%) 12 (100%) $30 (100%) * The leading item first ignited for fire deaths not shown above is fence or pole (49% of deaths). Note: See detailed notes and source information at end of table.
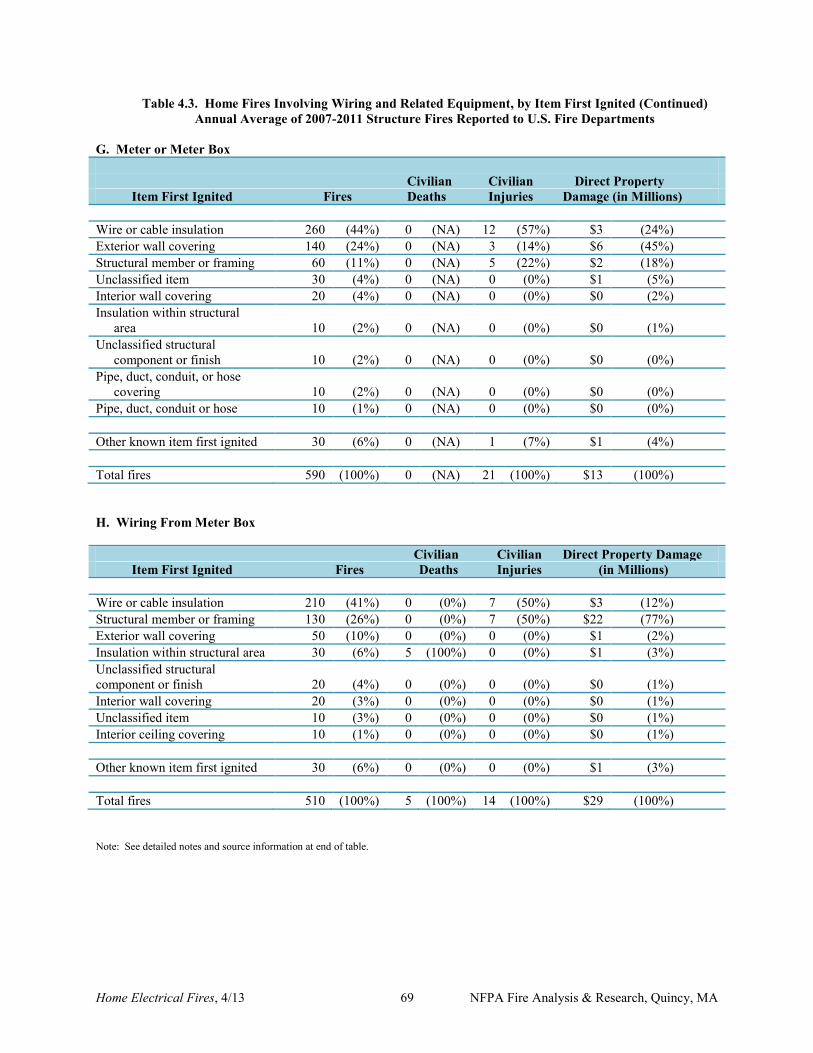
Home Electrical Fires, 4/13 69 NFPA Fire Analysis & Research, Quincy, MA
Table 4.3. Home Fires Involving Wiring and Related Equipment, by Item First Ignited (Continued) Annual Average of 2007-2011 Structure Fires Reported to U.S. Fire Departments
G. Meter or Meter Box
Civilian Civilian Direct Property Item First Ignited Fires Deaths Injuries Damage (in Millions) Wire or cable insulation 260 (44%) 0 (NA) 12 (57%) $3 (24%) Exterior wall covering 140 (24%) 0 (NA) 3 (14%) $6 (45%) Structural member or framing 60 (11%) 0 (NA) 5 (22%) $2 (18%) Unclassified item 30 (4%) 0 (NA) 0 (0%) $1 (5%) Interior wall covering 20 (4%) 0 (NA) 0 (0%) $0 (2%) Insulation within structural area 10 (2%) 0 (NA) 0 (0%) $0 (1%) Unclassified structural component or finish 10 (2%) 0 (NA) 0 (0%) $0 (0%) Pipe, duct, conduit, or hose covering 10 (2%) 0 (NA) 0 (0%) $0 (0%) Pipe, duct, conduit or hose 10 (1%) 0 (NA) 0 (0%) $0 (0%) Other known item first ignited 30 (6%) 0 (NA) 1 (7%) $1 (4%) Total fires 590 (100%) 0 (NA) 21 (100%) $13 (100%) H. Wiring From Meter Box Civilian Civilian Direct Property Damage Item First Ignited Fires Deaths Injuries (in Millions) Wire or cable insulation 210 (41%) 0 (0%) 7 (50%) $3 (12%) Structural member or framing 130 (26%) 0 (0%) 7 (50%) $22 (77%) Exterior wall covering 50 (10%) 0 (0%) 0 (0%) $1 (2%) Insulation within structural area 30 (6%) 5 (100%) 0 (0%) $1 (3%) Unclassified structural component or finish 20 (4%) 0 (0%) 0 (0%) $0 (1%) Interior wall covering 20 (3%) 0 (0%) 0 (0%) $0 (1%) Unclassified item 10 (3%) 0 (0%) 0 (0%) $0 (1%) Interior ceiling covering 10 (1%) 0 (0%) 0 (0%) $0 (1%) Other known item first ignited 30 (6%) 0 (0%) 0 (0%) $1 (3%) Total fires 510 (100%) 5 (100%) 14 (100%) $29 (100%) Note: See detailed notes and source information at end of table.
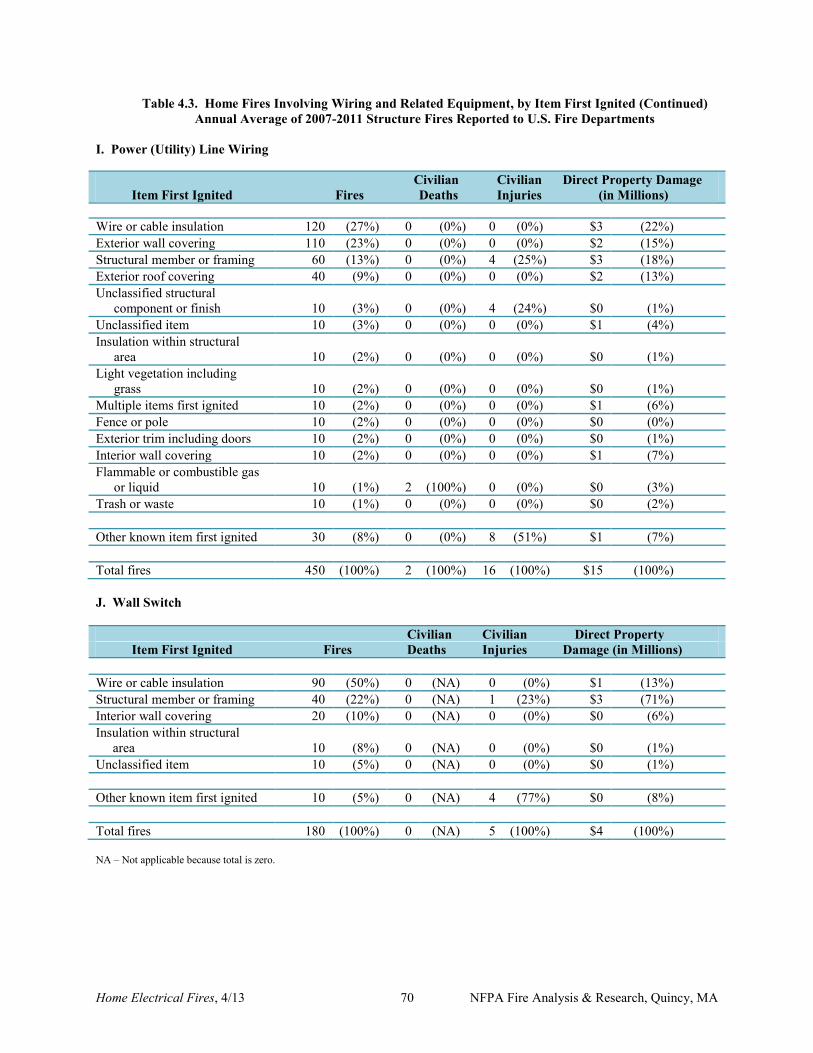
Home Electrical Fires, 4/13 70 NFPA Fire Analysis & Research, Quincy, MA
Table 4.3. Home Fires Involving Wiring and Related Equipment, by Item First Ignited (Continued) Annual Average of 2007-2011 Structure Fires Reported to U.S. Fire Departments
I. Power (Utility) Line Wiring Civilian Civilian Direct Property Damage Item First Ignited Fires Deaths Injuries (in Millions) Wire or cable insulation 120 (27%) 0 (0%) 0 (0%) $3 (22%) Exterior wall covering 110 (23%) 0 (0%) 0 (0%) $2 (15%) Structural member or framing 60 (13%) 0 (0%) 4 (25%) $3 (18%) Exterior roof covering 40 (9%) 0 (0%) 0 (0%) $2 (13%) Unclassified structural component or finish 10 (3%) 0 (0%) 4 (24%) $0 (1%) Unclassified item 10 (3%) 0 (0%) 0 (0%) $1 (4%) Insulation within structural area 10 (2%) 0 (0%) 0 (0%) $0 (1%) Light vegetation including grass 10 (2%) 0 (0%) 0 (0%) $0 (1%) Multiple items first ignited 10 (2%) 0 (0%) 0 (0%) $1 (6%) Fence or pole 10 (2%) 0 (0%) 0 (0%) $0 (0%) Exterior trim including doors 10 (2%) 0 (0%) 0 (0%) $0 (1%) Interior wall covering 10 (2%) 0 (0%) 0 (0%) $1 (7%) Flammable or combustible gas or liquid 10 (1%) 2 (100%) 0 (0%) $0 (3%) Trash or waste 10 (1%) 0 (0%) 0 (0%) $0 (2%) Other known item first ignited 30 (8%) 0 (0%) 8 (51%) $1 (7%) Total fires 450 (100%) 2 (100%) 16 (100%) $15 (100%) J. Wall Switch Civilian Civilian Direct Property Item First Ignited Fires Deaths Injuries Damage (in Millions) Wire or cable insulation 90 (50%) 0 (NA) 0 (0%) $1 (13%) Structural member or framing 40 (22%) 0 (NA) 1 (23%) $3 (71%) Interior wall covering 20 (10%) 0 (NA) 0 (0%) $0 (6%) Insulation within structural area 10 (8%) 0 (NA) 0 (0%) $0 (1%) Unclassified item 10 (5%) 0 (NA) 0 (0%) $0 (1%) Other known item first ignited 10 (5%) 0 (NA) 4 (77%) $0 (8%) Total fires 180 (100%) 0 (NA) 5 (100%) $4 (100%) NA – Not applicable because total is zero.
Home Electrical Fires, 4/13 71 NFPA Fire Analysis & Research, Quincy, MA
Table 4.3. Home Fires Involving Wiring and Related Equipment, by Item First Ignited (Continued) Annual Average of 2007-2011 Structure Fires Reported to U.S. Fire Departments
Note: Figures exclude confined fires, which are not considered relevant to these types of equipment, because these are fires reported as confined to fuel burner or boiler, chimney or flue, cooking vessel, trash, incinerator, or commercial compactor. These are national estimates of fires reported to U.S. municipal fire departments and so exclude fires reported only to Federal or state agencies or industrial fire brigades. National estimates are projections. Casualty and loss projections can be heavily influenced by the inclusion or exclusion of one unusually serious fire. Fires are rounded to the nearest ten, civilian deaths and injuries to the nearest one, and direct property damage to the nearest million dollars. Damage has not been adjusted for inflation. Figures reflect a proportional share of home fires with equipment involved in ignition unknown or recorded as electrical distribution or lighting equipment of undetermined type. Fires reported as “no equipment” but lacking a confirming specific heat source (codes 40-99) are also treated as unknown equipment and allocated. Home structure fires with this equipment and item first ignited unknown have also been allocated proportionally. Totals may not equal sums because of rounding. Source: Data from NFIRS Version 5.0 and NFPA survey.
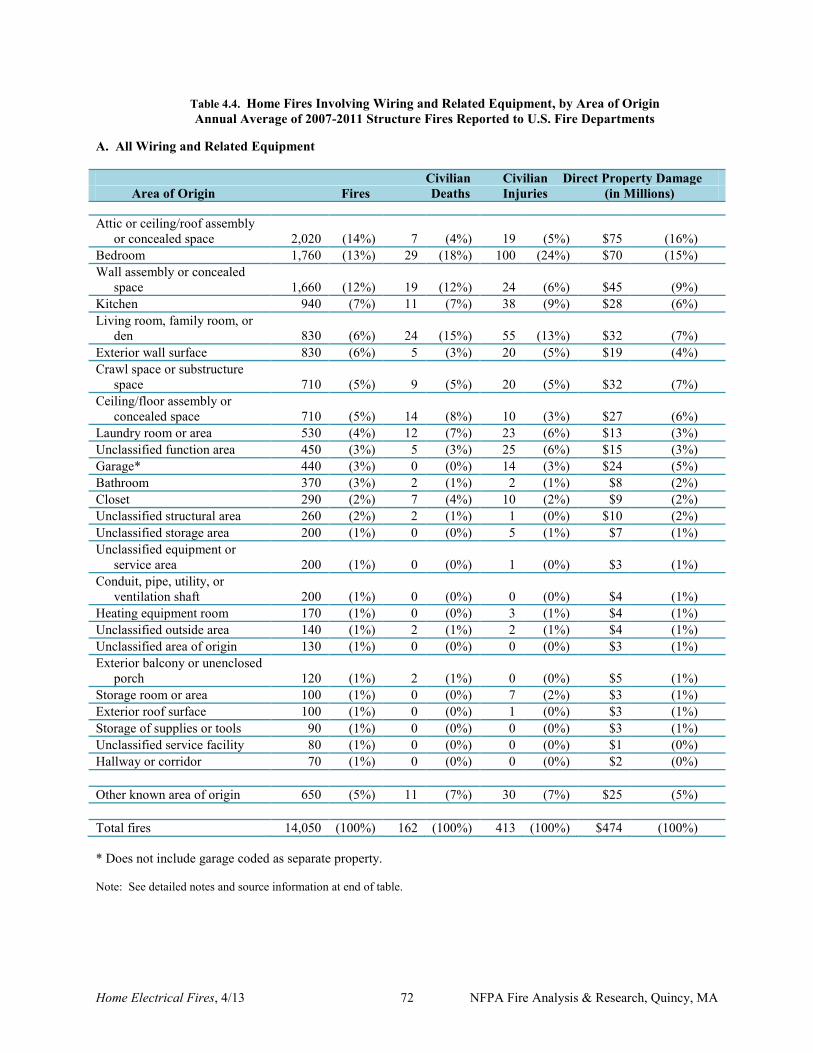
Home Electrical Fires, 4/13 72 NFPA Fire Analysis & Research, Quincy, MA
Table 4.4. Home Fires Involving Wiring and Related Equipment, by Area of Origin Annual Average of 2007-2011 Structure Fires Reported to U.S. Fire Departments
A. All Wiring and Related Equipment Civilian Civilian Direct Property Damage Area of Origin Fires Deaths Injuries (in Millions) Attic or ceiling/roof assembly or concealed space 2,020 (14%) 7 (4%) 19 (5%) $75 (16%) Bedroom 1,760 (13%) 29 (18%) 100 (24%) $70 (15%) Wall assembly or concealed space 1,660 (12%) 19 (12%) 24 (6%) $45 (9%) Kitchen 940 (7%) 11 (7%) 38 (9%) $28 (6%) Living room, family room, or den 830 (6%) 24 (15%) 55 (13%) $32 (7%) Exterior wall surface 830 (6%) 5 (3%) 20 (5%) $19 (4%) Crawl space or substructure space 710 (5%) 9 (5%) 20 (5%) $32 (7%) Ceiling/floor assembly or concealed space 710 (5%) 14 (8%) 10 (3%) $27 (6%) Laundry room or area 530 (4%) 12 (7%) 23 (6%) $13 (3%) Unclassified function area 450 (3%) 5 (3%) 25 (6%) $15 (3%) Garage* 440 (3%) 0 (0%) 14 (3%) $24 (5%) Bathroom 370 (3%) 2 (1%) 2 (1%) $8 (2%) Closet 290 (2%) 7 (4%) 10 (2%) $9 (2%) Unclassified structural area 260 (2%) 2 (1%) 1 (0%) $10 (2%) Unclassified storage area 200 (1%) 0 (0%) 5 (1%) $7 (1%) Unclassified equipment or service area 200 (1%) 0 (0%) 1 (0%) $3 (1%) Conduit, pipe, utility, or ventilation shaft 200 (1%) 0 (0%) 0 (0%) $4 (1%) Heating equipment room 170 (1%) 0 (0%) 3 (1%) $4 (1%) Unclassified outside area 140 (1%) 2 (1%) 2 (1%) $4 (1%) Unclassified area of origin 130 (1%) 0 (0%) 0 (0%) $3 (1%) Exterior balcony or unenclosed porch 120 (1%) 2 (1%) 0 (0%) $5 (1%) Storage room or area 100 (1%) 0 (0%) 7 (2%) $3 (1%) Exterior roof surface 100 (1%) 0 (0%) 1 (0%) $3 (1%) Storage of supplies or tools 90 (1%) 0 (0%) 0 (0%) $3 (1%) Unclassified service facility 80 (1%) 0 (0%) 0 (0%) $1 (0%) Hallway or corridor 70 (1%) 0 (0%) 0 (0%) $2 (0%) Other known area of origin 650 (5%) 11 (7%) 30 (7%) $25 (5%) Total fires 14,050 (100%) 162 (100%) 413 (100%) $474 (100%) * Does not include garage coded as separate property. Note: See detailed notes and source information at end of table.
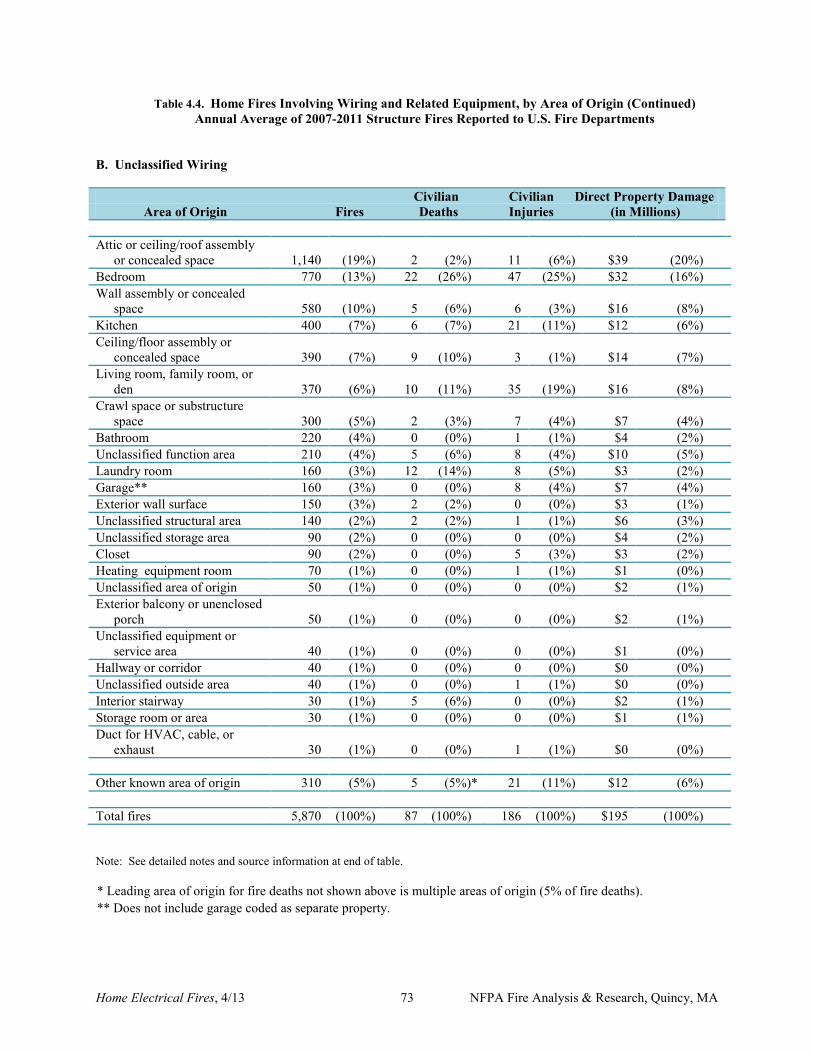
Home Electrical Fires, 4/13 73 NFPA Fire Analysis & Research, Quincy, MA
Table 4.4. Home Fires Involving Wiring and Related Equipment, by Area of Origin (Continued) Annual Average of 2007-2011 Structure Fires Reported to U.S. Fire Departments
B. Unclassified Wiring Civilian Civilian Direct Property Damage Area of Origin Fires Deaths Injuries (in Millions) Attic or ceiling/roof assembly or concealed space 1,140 (19%) 2 (2%) 11 (6%) $39 (20%) Bedroom 770 (13%) 22 (26%) 47 (25%) $32 (16%) Wall assembly or concealed space 580 (10%) 5 (6%) 6 (3%) $16 (8%) Kitchen 400 (7%) 6 (7%) 21 (11%) $12 (6%) Ceiling/floor assembly or concealed space 390 (7%) 9 (10%) 3 (1%) $14 (7%) Living room, family room, or den 370 (6%) 10 (11%) 35 (19%) $16 (8%) Crawl space or substructure space 300 (5%) 2 (3%) 7 (4%) $7 (4%) Bathroom 220 (4%) 0 (0%) 1 (1%) $4 (2%) Unclassified function area 210 (4%) 5 (6%) 8 (4%) $10 (5%) Laundry room 160 (3%) 12 (14%) 8 (5%) $3 (2%) Garage** 160 (3%) 0 (0%) 8 (4%) $7 (4%) Exterior wall surface 150 (3%) 2 (2%) 0 (0%) $3 (1%) Unclassified structural area 140 (2%) 2 (2%) 1 (1%) $6 (3%) Unclassified storage area 90 (2%) 0 (0%) 0 (0%) $4 (2%) Closet 90 (2%) 0 (0%) 5 (3%) $3 (2%) Heating equipment room 70 (1%) 0 (0%) 1 (1%) $1 (0%) Unclassified area of origin 50 (1%) 0 (0%) 0 (0%) $2 (1%) Exterior balcony or unenclosed porch 50 (1%) 0 (0%) 0 (0%) $2 (1%) Unclassified equipment or service area 40 (1%) 0 (0%) 0 (0%) $1 (0%) Hallway or corridor 40 (1%) 0 (0%) 0 (0%) $0 (0%) Unclassified outside area 40 (1%) 0 (0%) 1 (1%) $0 (0%) Interior stairway 30 (1%) 5 (6%) 0 (0%) $2 (1%) Storage room or area 30 (1%) 0 (0%) 0 (0%) $1 (1%) Duct for HVAC, cable, or exhaust 30 (1%) 0 (0%) 1 (1%) $0 (0%) Other known area of origin 310 (5%) 5 (5%)* 21 (11%) $12 (6%) Total fires 5,870 (100%) 87 (100%) 186 (100%) $195 (100%) Note: See detailed notes and source information at end of table. * Leading area of origin for fire deaths not shown above is multiple areas of origin (5% of fire deaths). ** Does not include garage coded as separate property.
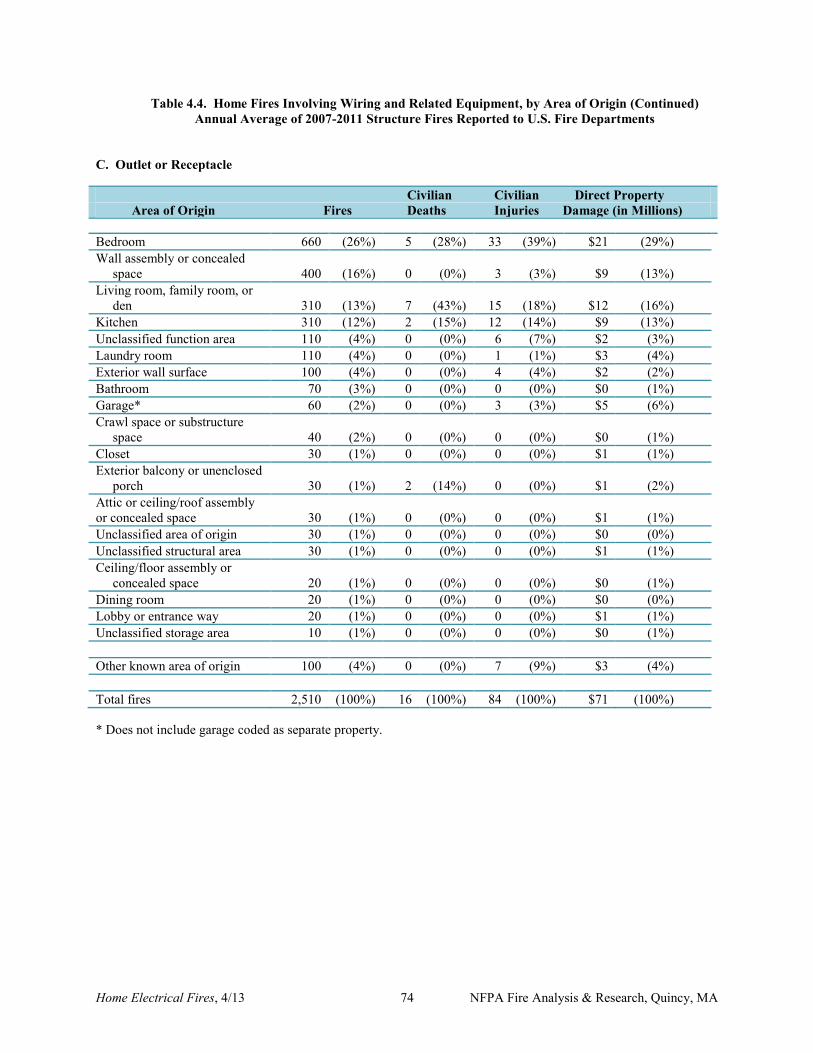
Home Electrical Fires, 4/13 74 NFPA Fire Analysis & Research, Quincy, MA
Table 4.4. Home Fires Involving Wiring and Related Equipment, by Area of Origin (Continued) Annual Average of 2007-2011 Structure Fires Reported to U.S. Fire Departments
C. Outlet or Receptacle Civilian Civilian Direct Property Area of Origin Fires Deaths Injuries Damage (in Millions) Bedroom 660 (26%) 5 (28%) 33 (39%) $21 (29%) Wall assembly or concealed space 400 (16%) 0 (0%) 3 (3%) $9 (13%) Living room, family room, or den 310 (13%) 7 (43%) 15 (18%) $12 (16%) Kitchen 310 (12%) 2 (15%) 12 (14%) $9 (13%) Unclassified function area 110 (4%) 0 (0%) 6 (7%) $2 (3%) Laundry room 110 (4%) 0 (0%) 1 (1%) $3 (4%) Exterior wall surface 100 (4%) 0 (0%) 4 (4%) $2 (2%) Bathroom 70 (3%) 0 (0%) 0 (0%) $0 (1%) Garage* 60 (2%) 0 (0%) 3 (3%) $5 (6%) Crawl space or substructure space 40 (2%) 0 (0%) 0 (0%) $0 (1%) Closet 30 (1%) 0 (0%) 0 (0%) $1 (1%) Exterior balcony or unenclosed porch 30 (1%) 2 (14%) 0 (0%) $1 (2%) Attic or ceiling/roof assembly or concealed space 30 (1%) 0 (0%) 0 (0%) $1 (1%) Unclassified area of origin 30 (1%) 0 (0%) 0 (0%) $0 (0%) Unclassified structural area 30 (1%) 0 (0%) 0 (0%) $1 (1%) Ceiling/floor assembly or concealed space 20 (1%) 0 (0%) 0 (0%) $0 (1%) Dining room 20 (1%) 0 (0%) 0 (0%) $0 (0%) Lobby or entrance way 20 (1%) 0 (0%) 0 (0%) $1 (1%) Unclassified storage area 10 (1%) 0 (0%) 0 (0%) $0 (1%) Other known area of origin 100 (4%) 0 (0%) 7 (9%) $3 (4%) Total fires 2,510 (100%) 16 (100%) 84 (100%) $71 (100%) * Does not include garage coded as separate property.
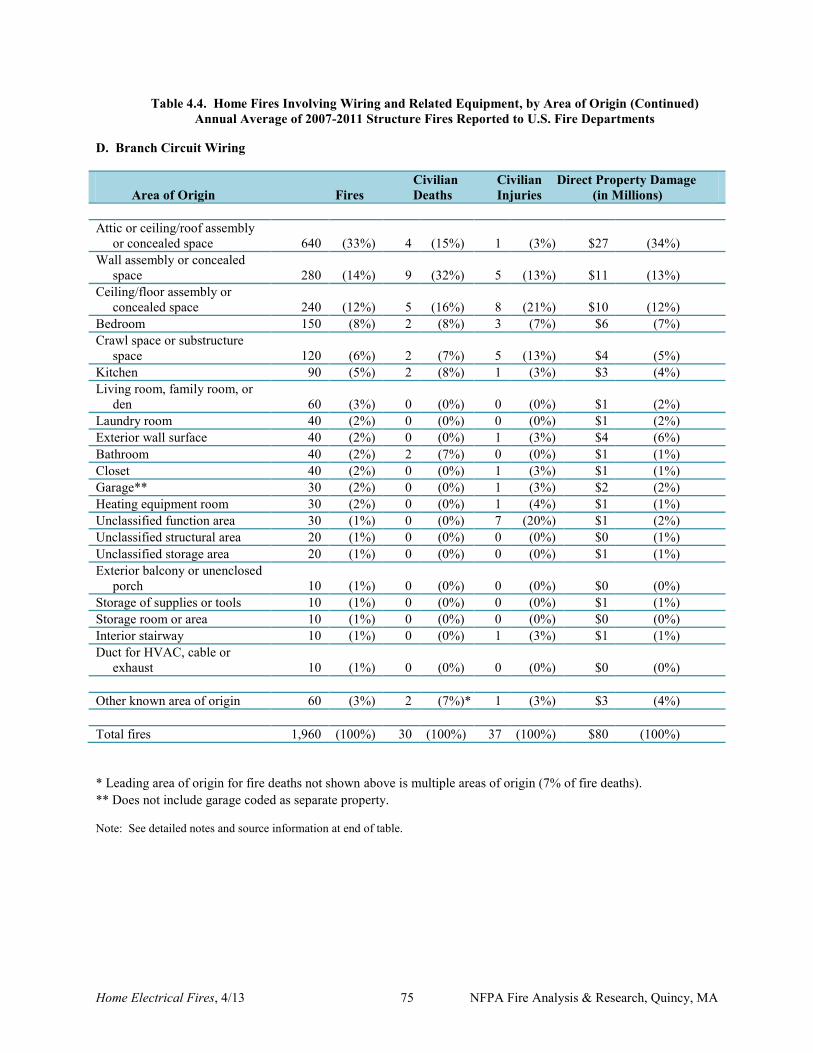
Home Electrical Fires, 4/13 75 NFPA Fire Analysis & Research, Quincy, MA
Table 4.4. Home Fires Involving Wiring and Related Equipment, by Area of Origin (Continued) Annual Average of 2007-2011 Structure Fires Reported to U.S. Fire Departments
D. Branch Circuit Wiring Civilian Civilian Direct Property Damage Area of Origin Fires Deaths Injuries (in Millions) Attic or ceiling/roof assembly or concealed space 640 (33%) 4 (15%) 1 (3%) $27 (34%) Wall assembly or concealed space 280 (14%) 9 (32%) 5 (13%) $11 (13%) Ceiling/floor assembly or concealed space 240 (12%) 5 (16%) 8 (21%) $10 (12%) Bedroom 150 (8%) 2 (8%) 3 (7%) $6 (7%) Crawl space or substructure space 120 (6%) 2 (7%) 5 (13%) $4 (5%) Kitchen 90 (5%) 2 (8%) 1 (3%) $3 (4%) Living room, family room, or den 60 (3%) 0 (0%) 0 (0%) $1 (2%) Laundry room 40 (2%) 0 (0%) 0 (0%) $1 (2%) Exterior wall surface 40 (2%) 0 (0%) 1 (3%) $4 (6%) Bathroom 40 (2%) 2 (7%) 0 (0%) $1 (1%) Closet 40 (2%) 0 (0%) 1 (3%) $1 (1%) Garage** 30 (2%) 0 (0%) 1 (3%) $2 (2%) Heating equipment room 30 (2%) 0 (0%) 1 (4%) $1 (1%) Unclassified function area 30 (1%) 0 (0%) 7 (20%) $1 (2%) Unclassified structural area 20 (1%) 0 (0%) 0 (0%) $0 (1%) Unclassified storage area 20 (1%) 0 (0%) 0 (0%) $1 (1%) Exterior balcony or unenclosed porch 10 (1%) 0 (0%) 0 (0%) $0 (0%) Storage of supplies or tools 10 (1%) 0 (0%) 0 (0%) $1 (1%) Storage room or area 10 (1%) 0 (0%) 0 (0%) $0 (0%) Interior stairway 10 (1%) 0 (0%) 1 (3%) $1 (1%) Duct for HVAC, cable or exhaust 10 (1%) 0 (0%) 0 (0%) $0 (0%) Other known area of origin 60 (3%) 2 (7%)* 1 (3%) $3 (4%) Total fires 1,960 (100%) 30 (100%) 37 (100%) $80 (100%) * Leading area of origin for fire deaths not shown above is multiple areas of origin (7% of fire deaths). ** Does not include garage coded as separate property.
Note: See detailed notes and source information at end of table.
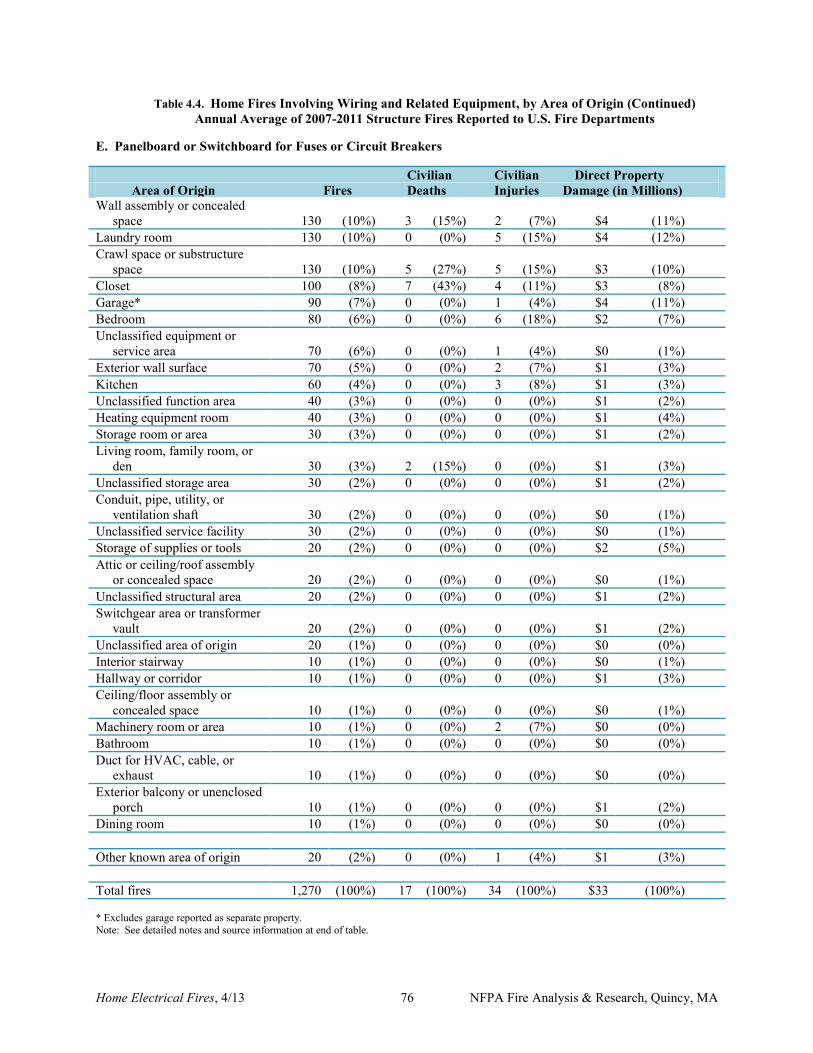
Home Electrical Fires, 4/13 76 NFPA Fire Analysis & Research, Quincy, MA
Table 4.4. Home Fires Involving Wiring and Related Equipment, by Area of Origin (Continued) Annual Average of 2007-2011 Structure Fires Reported to U.S. Fire Departments
E. Panelboard or Switchboard for Fuses or Circuit Breakers Civilian Civilian Direct Property Area of Origin Fires Deaths Injuries Damage (in Millions) Wall assembly or concealed space 130 (10%) 3 (15%) 2 (7%) $4 (11%) Laundry room 130 (10%) 0 (0%) 5 (15%) $4 (12%) Crawl space or substructure space 130 (10%) 5 (27%) 5 (15%) $3 (10%) Closet 100 (8%) 7 (43%) 4 (11%) $3 (8%) Garage* 90 (7%) 0 (0%) 1 (4%) $4 (11%) Bedroom 80 (6%) 0 (0%) 6 (18%) $2 (7%) Unclassified equipment or service area 70 (6%) 0 (0%) 1 (4%) $0 (1%) Exterior wall surface 70 (5%) 0 (0%) 2 (7%) $1 (3%) Kitchen 60 (4%) 0 (0%) 3 (8%) $1 (3%) Unclassified function area 40 (3%) 0 (0%) 0 (0%) $1 (2%) Heating equipment room 40 (3%) 0 (0%) 0 (0%) $1 (4%) Storage room or area 30 (3%) 0 (0%) 0 (0%) $1 (2%) Living room, family room, or den 30 (3%) 2 (15%) 0 (0%) $1 (3%) Unclassified storage area 30 (2%) 0 (0%) 0 (0%) $1 (2%) Conduit, pipe, utility, or ventilation shaft 30 (2%) 0 (0%) 0 (0%) $0 (1%) Unclassified service facility 30 (2%) 0 (0%) 0 (0%) $0 (1%) Storage of supplies or tools 20 (2%) 0 (0%) 0 (0%) $2 (5%) Attic or ceiling/roof assembly or concealed space 20 (2%) 0 (0%) 0 (0%) $0 (1%) Unclassified structural area 20 (2%) 0 (0%) 0 (0%) $1 (2%) Switchgear area or transformer vault 20 (2%) 0 (0%) 0 (0%) $1 (2%) Unclassified area of origin 20 (1%) 0 (0%) 0 (0%) $0 (0%) Interior stairway 10 (1%) 0 (0%) 0 (0%) $0 (1%) Hallway or corridor 10 (1%) 0 (0%) 0 (0%) $1 (3%) Ceiling/floor assembly or concealed space 10 (1%) 0 (0%) 0 (0%) $0 (1%) Machinery room or area 10 (1%) 0 (0%) 2 (7%) $0 (0%) Bathroom 10 (1%) 0 (0%) 0 (0%) $0 (0%) Duct for HVAC, cable, or exhaust 10 (1%) 0 (0%) 0 (0%) $0 (0%) Exterior balcony or unenclosed porch 10 (1%) 0 (0%) 0 (0%) $1 (2%) Dining room 10 (1%) 0 (0%) 0 (0%) $0 (0%) Other known area of origin 20 (2%) 0 (0%) 1 (4%) $1 (3%) Total fires 1,270 (100%) 17 (100%) 34 (100%) $33 (100%) * Excludes garage reported as separate property. Note: See detailed notes and source information at end of table.
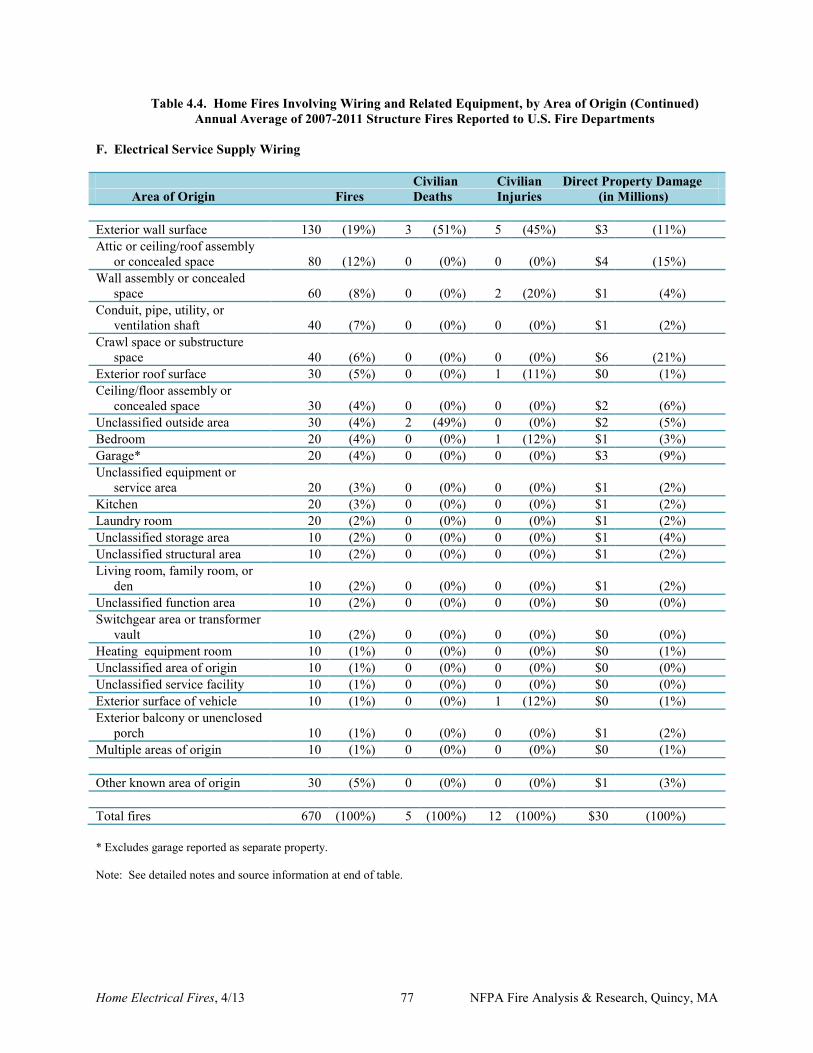
Home Electrical Fires, 4/13 77 NFPA Fire Analysis & Research, Quincy, MA
Table 4.4. Home Fires Involving Wiring and Related Equipment, by Area of Origin (Continued) Annual Average of 2007-2011 Structure Fires Reported to U.S. Fire Departments
F. Electrical Service Supply Wiring Civilian Civilian Direct Property Damage Area of Origin Fires Deaths Injuries (in Millions) Exterior wall surface 130 (19%) 3 (51%) 5 (45%) $3 (11%) Attic or ceiling/roof assembly or concealed space 80 (12%) 0 (0%) 0 (0%) $4 (15%) Wall assembly or concealed space 60 (8%) 0 (0%) 2 (20%) $1 (4%) Conduit, pipe, utility, or ventilation shaft 40 (7%) 0 (0%) 0 (0%) $1 (2%) Crawl space or substructure space 40 (6%) 0 (0%) 0 (0%) $6 (21%) Exterior roof surface 30 (5%) 0 (0%) 1 (11%) $0 (1%) Ceiling/floor assembly or concealed space 30 (4%) 0 (0%) 0 (0%) $2 (6%) Unclassified outside area 30 (4%) 2 (49%) 0 (0%) $2 (5%) Bedroom 20 (4%) 0 (0%) 1 (12%) $1 (3%) Garage* 20 (4%) 0 (0%) 0 (0%) $3 (9%) Unclassified equipment or service area 20 (3%) 0 (0%) 0 (0%) $1 (2%) Kitchen 20 (3%) 0 (0%) 0 (0%) $1 (2%) Laundry room 20 (2%) 0 (0%) 0 (0%) $1 (2%) Unclassified storage area 10 (2%) 0 (0%) 0 (0%) $1 (4%) Unclassified structural area 10 (2%) 0 (0%) 0 (0%) $1 (2%) Living room, family room, or den 10 (2%) 0 (0%) 0 (0%) $1 (2%) Unclassified function area 10 (2%) 0 (0%) 0 (0%) $0 (0%) Switchgear area or transformer vault 10 (2%) 0 (0%) 0 (0%) $0 (0%) Heating equipment room 10 (1%) 0 (0%) 0 (0%) $0 (1%) Unclassified area of origin 10 (1%) 0 (0%) 0 (0%) $0 (0%) Unclassified service facility 10 (1%) 0 (0%) 0 (0%) $0 (0%) Exterior surface of vehicle 10 (1%) 0 (0%) 1 (12%) $0 (1%) Exterior balcony or unenclosed porch 10 (1%) 0 (0%) 0 (0%) $1 (2%) Multiple areas of origin 10 (1%) 0 (0%) 0 (0%) $0 (1%) Other known area of origin 30 (5%) 0 (0%) 0 (0%) $1 (3%) Total fires 670 (100%) 5 (100%) 12 (100%) $30 (100%) * Excludes garage reported as separate property. Note: See detailed notes and source information at end of table.
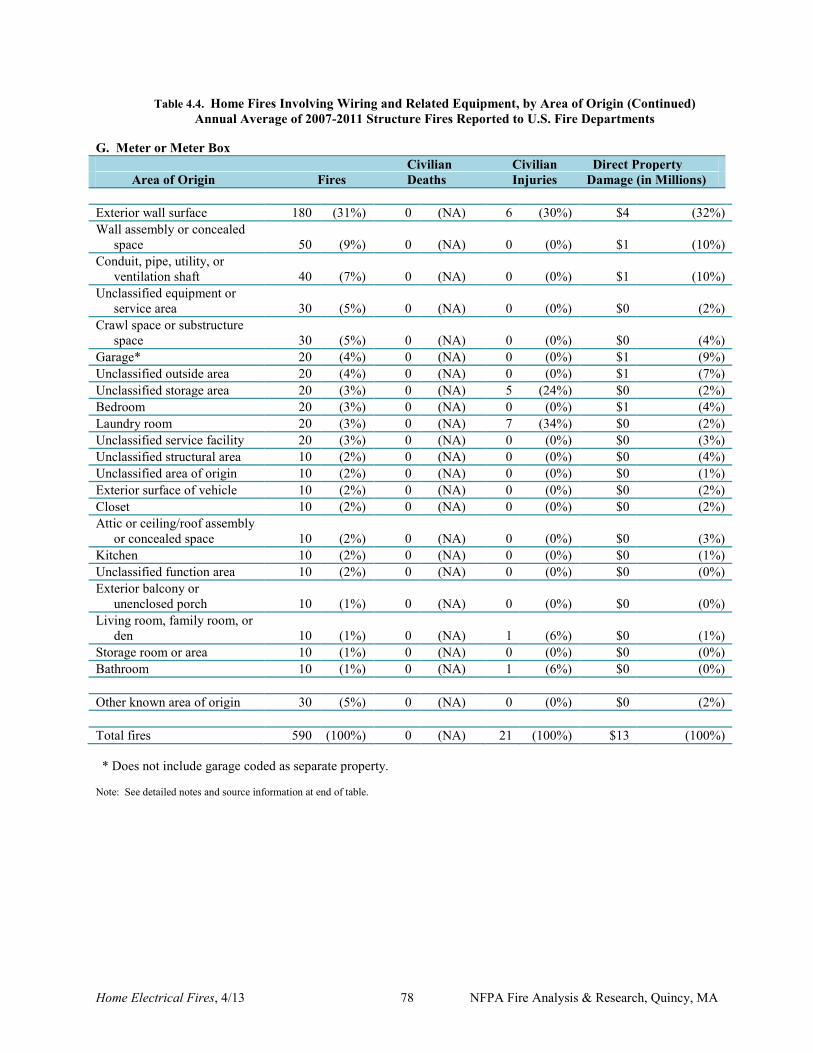
Home Electrical Fires, 4/13 78 NFPA Fire Analysis & Research, Quincy, MA
Table 4.4. Home Fires Involving Wiring and Related Equipment, by Area of Origin (Continued) Annual Average of 2007-2011 Structure Fires Reported to U.S. Fire Departments
G. Meter or Meter Box Civilian Civilian Direct Property Area of Origin Fires Deaths Injuries Damage (in Millions) Exterior wall surface 180 (31%) 0 (NA) 6 (30%) $4 (32%) Wall assembly or concealed space 50 (9%) 0 (NA) 0 (0%) $1 (10%) Conduit, pipe, utility, or ventilation shaft 40 (7%) 0 (NA) 0 (0%) $1 (10%) Unclassified equipment or service area 30 (5%) 0 (NA) 0 (0%) $0 (2%) Crawl space or substructure space 30 (5%) 0 (NA) 0 (0%) $0 (4%) Garage* 20 (4%) 0 (NA) 0 (0%) $1 (9%) Unclassified outside area 20 (4%) 0 (NA) 0 (0%) $1 (7%) Unclassified storage area 20 (3%) 0 (NA) 5 (24%) $0 (2%) Bedroom 20 (3%) 0 (NA) 0 (0%) $1 (4%) Laundry room 20 (3%) 0 (NA) 7 (34%) $0 (2%) Unclassified service facility 20 (3%) 0 (NA) 0 (0%) $0 (3%) Unclassified structural area 10 (2%) 0 (NA) 0 (0%) $0 (4%) Unclassified area of origin 10 (2%) 0 (NA) 0 (0%) $0 (1%) Exterior surface of vehicle 10 (2%) 0 (NA) 0 (0%) $0 (2%) Closet 10 (2%) 0 (NA) 0 (0%) $0 (2%) Attic or ceiling/roof assembly or concealed space 10 (2%) 0 (NA) 0 (0%) $0 (3%) Kitchen 10 (2%) 0 (NA) 0 (0%) $0 (1%) Unclassified function area 10 (2%) 0 (NA) 0 (0%) $0 (0%) Exterior balcony or unenclosed porch 10 (1%) 0 (NA) 0 (0%) $0 (0%) Living room, family room, or den 10 (1%) 0 (NA) 1 (6%) $0 (1%) Storage room or area 10 (1%) 0 (NA) 0 (0%) $0 (0%) Bathroom 10 (1%) 0 (NA) 1 (6%) $0 (0%) Other known area of origin 30 (5%) 0 (NA) 0 (0%) $0 (2%) Total fires 590 (100%) 0 (NA) 21 (100%) $13 (100%) * Does not include garage coded as separate property.
Note: See detailed notes and source information at end of table.
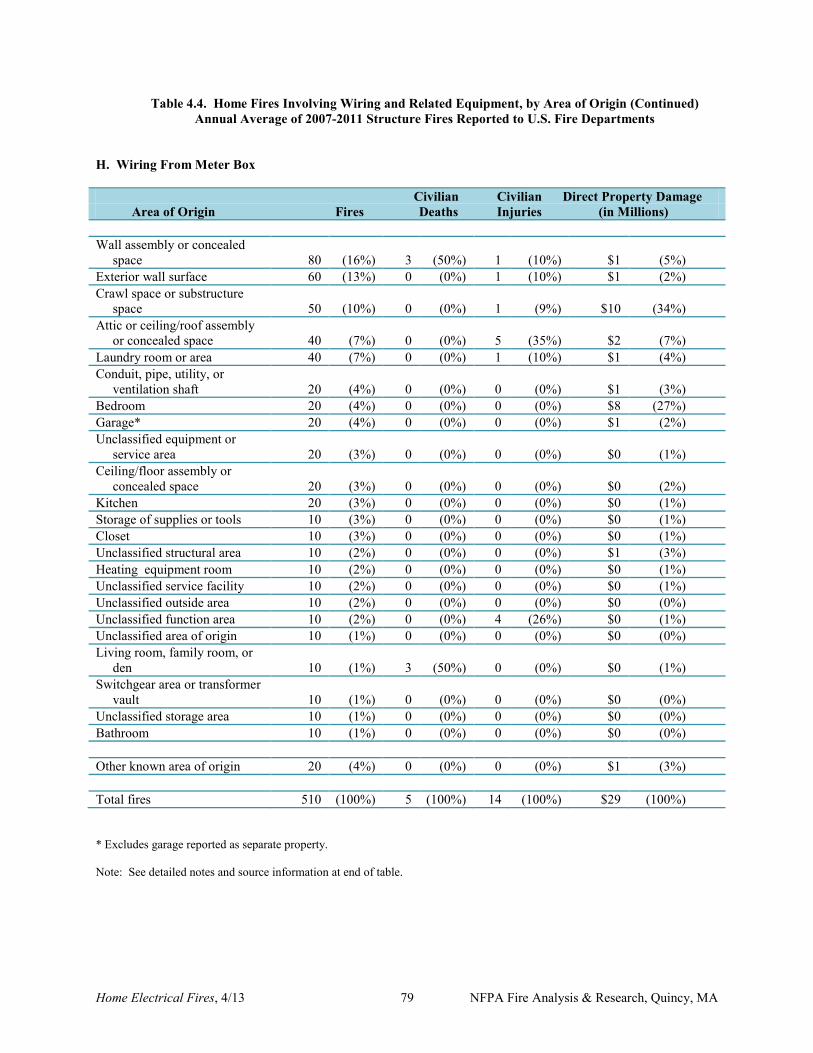
Home Electrical Fires, 4/13 79 NFPA Fire Analysis & Research, Quincy, MA
Table 4.4. Home Fires Involving Wiring and Related Equipment, by Area of Origin (Continued) Annual Average of 2007-2011 Structure Fires Reported to U.S. Fire Departments
H. Wiring From Meter Box Civilian Civilian Direct Property Damage Area of Origin Fires Deaths Injuries (in Millions) Wall assembly or concealed space 80 (16%) 3 (50%) 1 (10%) $1 (5%) Exterior wall surface 60 (13%) 0 (0%) 1 (10%) $1 (2%) Crawl space or substructure space 50 (10%) 0 (0%) 1 (9%) $10 (34%) Attic or ceiling/roof assembly or concealed space 40 (7%) 0 (0%) 5 (35%) $2 (7%) Laundry room or area 40 (7%) 0 (0%) 1 (10%) $1 (4%) Conduit, pipe, utility, or ventilation shaft 20 (4%) 0 (0%) 0 (0%) $1 (3%) Bedroom 20 (4%) 0 (0%) 0 (0%) $8 (27%) Garage* 20 (4%) 0 (0%) 0 (0%) $1 (2%) Unclassified equipment or service area 20 (3%) 0 (0%) 0 (0%) $0 (1%) Ceiling/floor assembly or concealed space 20 (3%) 0 (0%) 0 (0%) $0 (2%) Kitchen 20 (3%) 0 (0%) 0 (0%) $0 (1%) Storage of supplies or tools 10 (3%) 0 (0%) 0 (0%) $0 (1%) Closet 10 (3%) 0 (0%) 0 (0%) $0 (1%) Unclassified structural area 10 (2%) 0 (0%) 0 (0%) $1 (3%) Heating equipment room 10 (2%) 0 (0%) 0 (0%) $0 (1%) Unclassified service facility 10 (2%) 0 (0%) 0 (0%) $0 (1%) Unclassified outside area 10 (2%) 0 (0%) 0 (0%) $0 (0%) Unclassified function area 10 (2%) 0 (0%) 4 (26%) $0 (1%) Unclassified area of origin 10 (1%) 0 (0%) 0 (0%) $0 (0%) Living room, family room, or den 10 (1%) 3 (50%) 0 (0%) $0 (1%) Switchgear area or transformer vault 10 (1%) 0 (0%) 0 (0%) $0 (0%) Unclassified storage area 10 (1%) 0 (0%) 0 (0%) $0 (0%) Bathroom 10 (1%) 0 (0%) 0 (0%) $0 (0%) Other known area of origin 20 (4%) 0 (0%) 0 (0%) $1 (3%) Total fires 510 (100%) 5 (100%) 14 (100%) $29 (100%) * Excludes garage reported as separate property. Note: See detailed notes and source information at end of table.
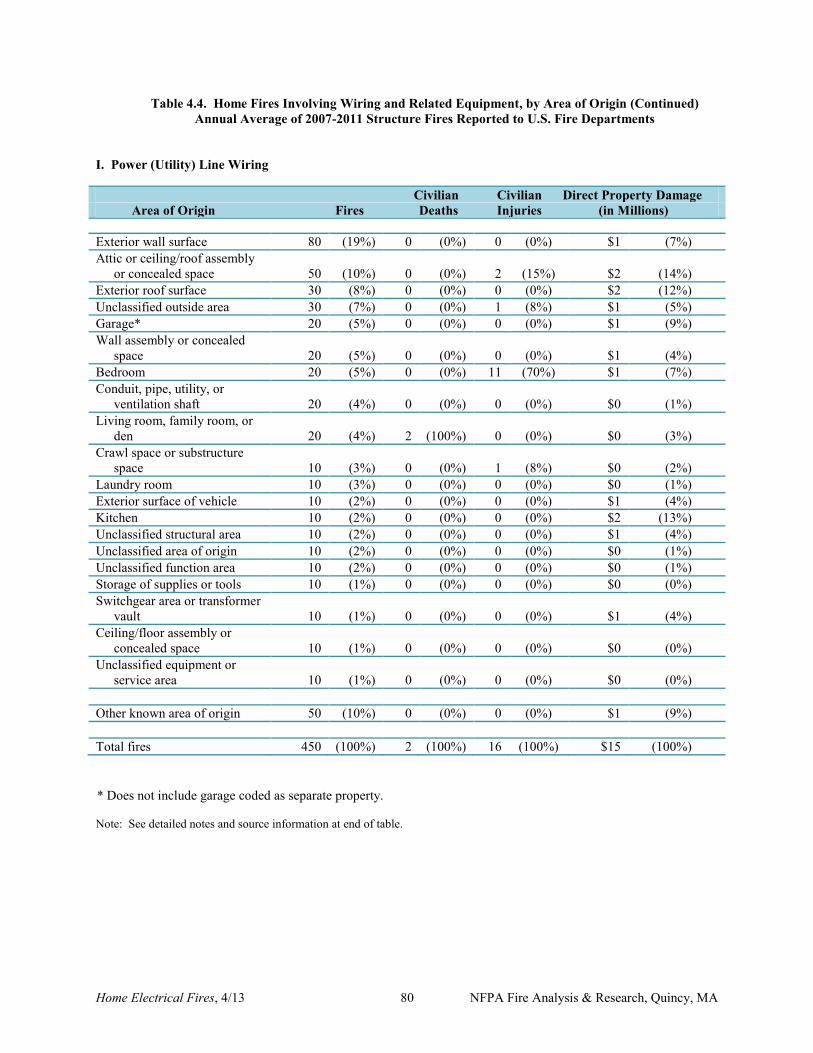
Home Electrical Fires, 4/13 80 NFPA Fire Analysis & Research, Quincy, MA
Table 4.4. Home Fires Involving Wiring and Related Equipment, by Area of Origin (Continued) Annual Average of 2007-2011 Structure Fires Reported to U.S. Fire Departments
I. Power (Utility) Line Wiring Civilian Civilian Direct Property Damage Area of Origin Fires Deaths Injuries (in Millions) Exterior wall surface 80 (19%) 0 (0%) 0 (0%) $1 (7%) Attic or ceiling/roof assembly or concealed space 50 (10%) 0 (0%) 2 (15%) $2 (14%) Exterior roof surface 30 (8%) 0 (0%) 0 (0%) $2 (12%) Unclassified outside area 30 (7%) 0 (0%) 1 (8%) $1 (5%) Garage* 20 (5%) 0 (0%) 0 (0%) $1 (9%) Wall assembly or concealed space 20 (5%) 0 (0%) 0 (0%) $1 (4%) Bedroom 20 (5%) 0 (0%) 11 (70%) $1 (7%) Conduit, pipe, utility, or ventilation shaft 20 (4%) 0 (0%) 0 (0%) $0 (1%) Living room, family room, or den 20 (4%) 2 (100%) 0 (0%) $0 (3%) Crawl space or substructure space 10 (3%) 0 (0%) 1 (8%) $0 (2%) Laundry room 10 (3%) 0 (0%) 0 (0%) $0 (1%) Exterior surface of vehicle 10 (2%) 0 (0%) 0 (0%) $1 (4%) Kitchen 10 (2%) 0 (0%) 0 (0%) $2 (13%) Unclassified structural area 10 (2%) 0 (0%) 0 (0%) $1 (4%) Unclassified area of origin 10 (2%) 0 (0%) 0 (0%) $0 (1%) Unclassified function area 10 (2%) 0 (0%) 0 (0%) $0 (1%) Storage of supplies or tools 10 (1%) 0 (0%) 0 (0%) $0 (0%) Switchgear area or transformer vault 10 (1%) 0 (0%) 0 (0%) $1 (4%) Ceiling/floor assembly or concealed space 10 (1%) 0 (0%) 0 (0%) $0 (0%) Unclassified equipment or service area 10 (1%) 0 (0%) 0 (0%) $0 (0%) Other known area of origin 50 (10%) 0 (0%) 0 (0%) $1 (9%) Total fires 450 (100%) 2 (100%) 16 (100%) $15 (100%) * Does not include garage coded as separate property.
Note: See detailed notes and source information at end of table.
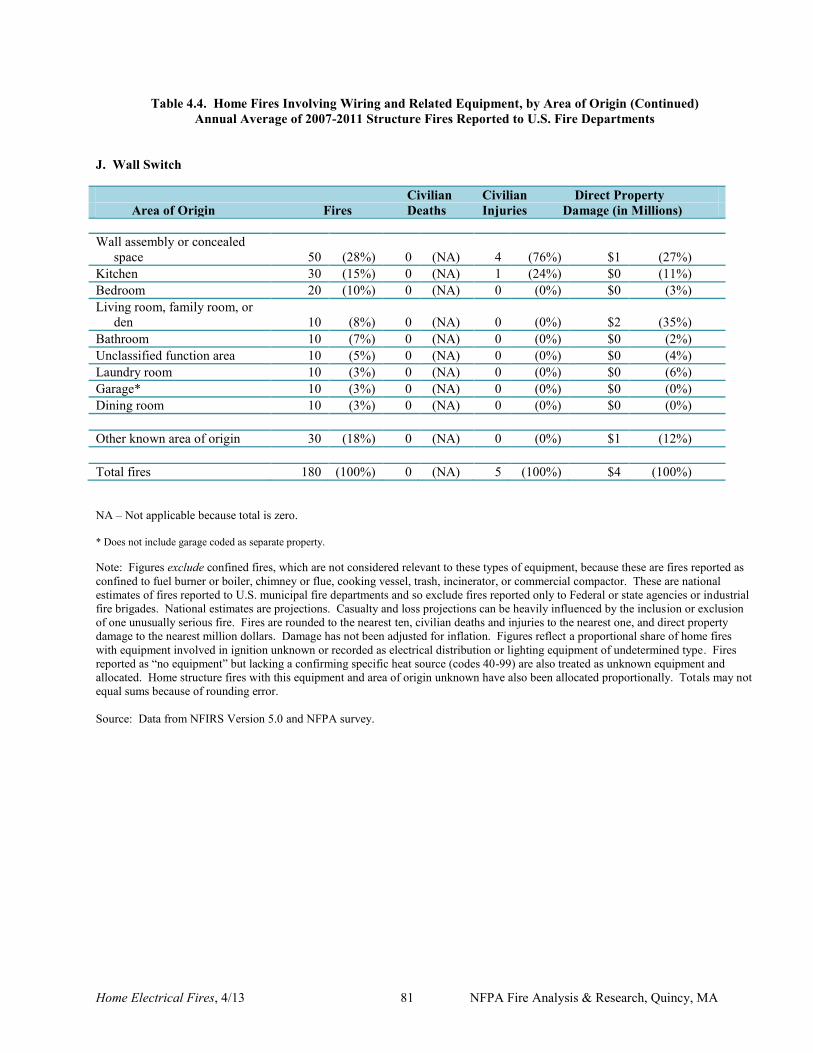
Home Electrical Fires, 4/13 81 NFPA Fire Analysis & Research, Quincy, MA
Table 4.4. Home Fires Involving Wiring and Related Equipment, by Area of Origin (Continued) Annual Average of 2007-2011 Structure Fires Reported to U.S. Fire Departments
J. Wall Switch Civilian Civilian Direct Property Area of Origin Fires Deaths Injuries Damage (in Millions) Wall assembly or concealed space 50 (28%) 0 (NA) 4 (76%) $1 (27%) Kitchen 30 (15%) 0 (NA) 1 (24%) $0 (11%) Bedroom 20 (10%) 0 (NA) 0 (0%) $0 (3%) Living room, family room, or den 10 (8%) 0 (NA) 0 (0%) $2 (35%) Bathroom 10 (7%) 0 (NA) 0 (0%) $0 (2%) Unclassified function area 10 (5%) 0 (NA) 0 (0%) $0 (4%) Laundry room 10 (3%) 0 (NA) 0 (0%) $0 (6%) Garage* 10 (3%) 0 (NA) 0 (0%) $0 (0%) Dining room 10 (3%) 0 (NA) 0 (0%) $0 (0%) Other known area of origin 30 (18%) 0 (NA) 0 (0%) $1 (12%) Total fires 180 (100%) 0 (NA) 5 (100%) $4 (100%) NA – Not applicable because total is zero. * Does not include garage coded as separate property. Note: Figures exclude confined fires, which are not considered relevant to these types of equipment, because these are fires reported as confined to fuel burner or boiler, chimney or flue, cooking vessel, trash, incinerator, or commercial compactor. These are national estimates of fires reported to U.S. municipal fire departments and so exclude fires reported only to Federal or state agencies or industrial fire brigades. National estimates are projections. Casualty and loss projections can be heavily influenced by the inclusion or exclusion of one unusually serious fire. Fires are rounded to the nearest ten, civilian deaths and injuries to the nearest one, and direct property damage to the nearest million dollars. Damage has not been adjusted for inflation. Figures reflect a proportional share of home fires with equipment involved in ignition unknown or recorded as electrical distribution or lighting equipment of undetermined type. Fires reported as “no equipment” but lacking a confirming specific heat source (codes 40-99) are also treated as unknown equipment and allocated. Home structure fires with this equipment and area of origin unknown have also been allocated proportionally. Totals may not equal sums because of rounding error. Source: Data from NFIRS Version 5.0 and NFPA survey.

Home Electrical Fires, 4/13 82 NFPA Fire Analysis & Research, Quincy, MA
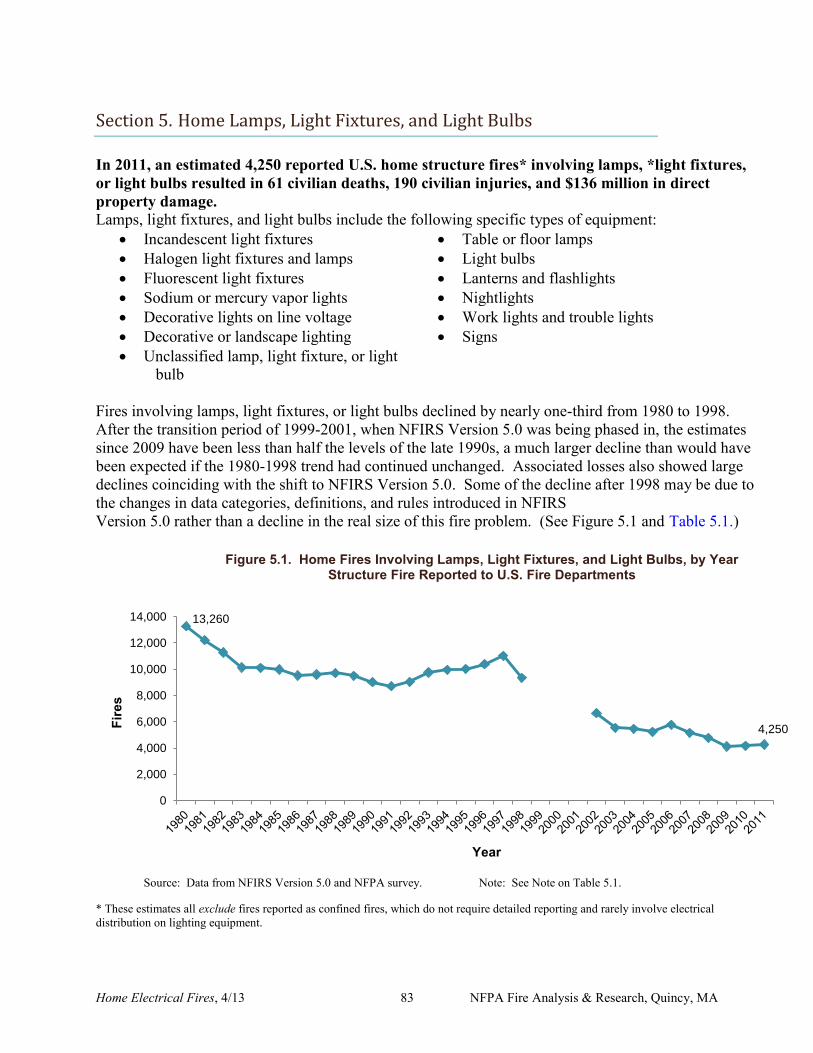
Home Electrical Fires, 4/13 83 NFPA Fire Analysis & Research, Quincy, MA
Section 5. Home Lamps, Light Fixtures, and Light Bulbs
In 2011, an estimated 4,250 reported U.S. home structure fires* involving lamps, *light fixtures, or light bulbs resulted in 61 civilian deaths, 190 civilian injuries, and $136 million in direct property damage. Lamps, light fixtures, and light bulbs include the following specific types of equipment:
Incandescent light fixtures Table or floor lamps Halogen light fixtures and lamps Light bulbs Fluorescent light fixtures Lanterns and flashlights Sodium or mercury vapor lights Nightlights Decorative lights on line voltage Work lights and trouble lights Decorative or landscape lighting Signs Unclassified lamp, light fixture, or light
bulb
Fires involving lamps, light fixtures, or light bulbs declined by nearly one-third from 1980 to 1998. After the transition period of 1999-2001, when NFIRS Version 5.0 was being phased in, the estimates since 2009 have been less than half the levels of the late 1990s, a much larger decline than would have been expected if the 1980-1998 trend had continued unchanged. Associated losses also showed large declines coinciding with the shift to NFIRS Version 5.0. Some of the decline after 1998 may be due to the changes in data categories, definitions, and rules introduced in NFIRS Version 5.0 rather than a decline in the real size of this fire problem. (See Figure 5.1 and Table 5.1.)
Source: Data from NFIRS Version 5.0 and NFPA survey. Note: See Note on Table 5.1. * These estimates all exclude fires reported as confined fires, which do not require detailed reporting and rarely involve electrical distribution on lighting equipment.
13,260
4,250
0
2,000
4,000
6,000
8,000
10,000
12,000
14,000
Fire
s
Year
Figure 5.1. Home Fires Involving Lamps, Light Fixtures, and Light Bulbs, by Year Structure Fire Reported to U.S. Fire Departments
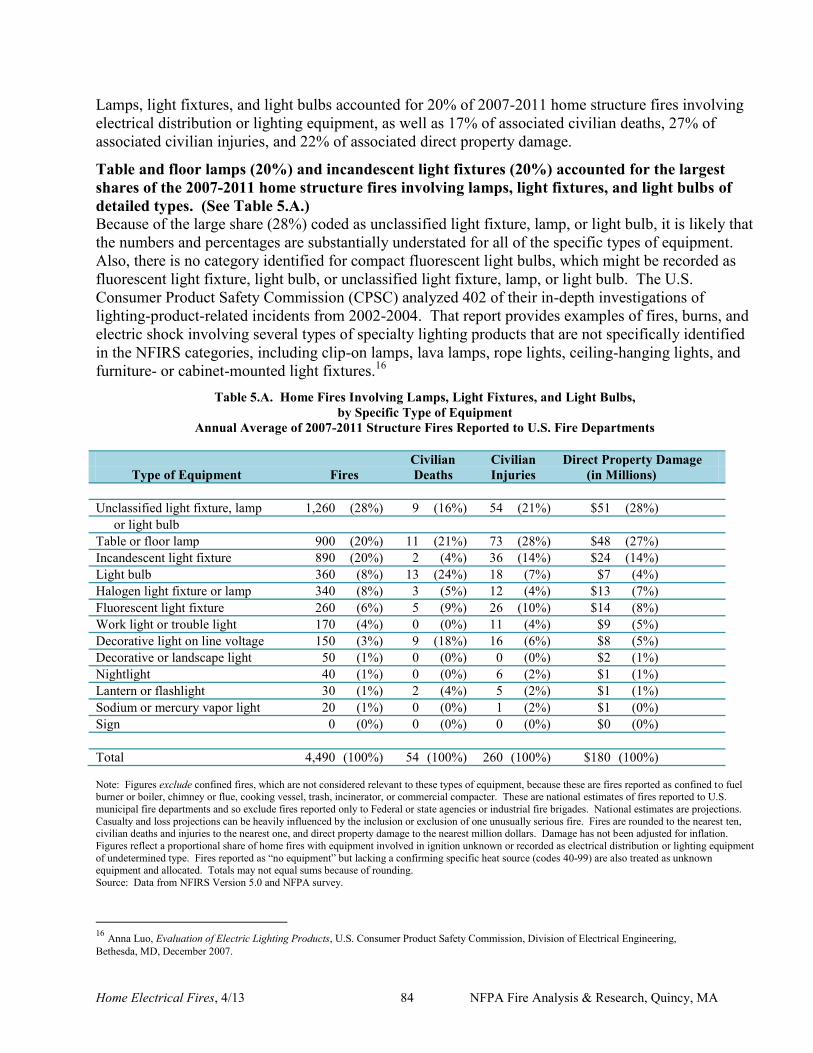
Home Electrical Fires, 4/13 84 NFPA Fire Analysis & Research, Quincy, MA
Lamps, light fixtures, and light bulbs accounted for 20% of 2007-2011 home structure fires involving electrical distribution or lighting equipment, as well as 17% of associated civilian deaths, 27% of associated civilian injuries, and 22% of associated direct property damage.
Table and floor lamps (20%) and incandescent light fixtures (20%) accounted for the largest shares of the 2007-2011 home structure fires involving lamps, light fixtures, and light bulbs of detailed types. (See Table 5.A.) Because of the large share (28%) coded as unclassified light fixture, lamp, or light bulb, it is likely that the numbers and percentages are substantially understated for all of the specific types of equipment. Also, there is no category identified for compact fluorescent light bulbs, which might be recorded as fluorescent light fixture, light bulb, or unclassified light fixture, lamp, or light bulb. The U.S. Consumer Product Safety Commission (CPSC) analyzed 402 of their in-depth investigations of lighting-product-related incidents from 2002-2004. That report provides examples of fires, burns, and electric shock involving several types of specialty lighting products that are not specifically identified in the NFIRS categories, including clip-on lamps, lava lamps, rope lights, ceiling-hanging lights, and furniture- or cabinet-mounted light fixtures.16
Table 5.A. Home Fires Involving Lamps, Light Fixtures, and Light Bulbs, by Specific Type of Equipment
Annual Average of 2007-2011 Structure Fires Reported to U.S. Fire Departments
Civilian Civilian Direct Property Damage Type of Equipment Fires Deaths Injuries (in Millions) Unclassified light fixture, lamp 1,260 (28%) 9 (16%) 54 (21%) $51 (28%) or light bulb Table or floor lamp 900 (20%) 11 (21%) 73 (28%) $48 (27%) Incandescent light fixture 890 (20%) 2 (4%) 36 (14%) $24 (14%) Light bulb 360 (8%) 13 (24%) 18 (7%) $7 (4%) Halogen light fixture or lamp 340 (8%) 3 (5%) 12 (4%) $13 (7%) Fluorescent light fixture 260 (6%) 5 (9%) 26 (10%) $14 (8%) Work light or trouble light 170 (4%) 0 (0%) 11 (4%) $9 (5%) Decorative light on line voltage 150 (3%) 9 (18%) 16 (6%) $8 (5%) Decorative or landscape light 50 (1%) 0 (0%) 0 (0%) $2 (1%) Nightlight 40 (1%) 0 (0%) 6 (2%) $1 (1%) Lantern or flashlight 30 (1%) 2 (4%) 5 (2%) $1 (1%) Sodium or mercury vapor light 20 (1%) 0 (0%) 1 (2%) $1 (0%) Sign 0 (0%) 0 (0%) 0 (0%) $0 (0%) Total 4,490 (100%) 54 (100%) 260 (100%) $180 (100%) Note: Figures exclude confined fires, which are not considered relevant to these types of equipment, because these are fires reported as confined to fuel burner or boiler, chimney or flue, cooking vessel, trash, incinerator, or commercial compacter. These are national estimates of fires reported to U.S. municipal fire departments and so exclude fires reported only to Federal or state agencies or industrial fire brigades. National estimates are projections. Casualty and loss projections can be heavily influenced by the inclusion or exclusion of one unusually serious fire. Fires are rounded to the nearest ten, civilian deaths and injuries to the nearest one, and direct property damage to the nearest million dollars. Damage has not been adjusted for inflation. Figures reflect a proportional share of home fires with equipment involved in ignition unknown or recorded as electrical distribution or lighting equipment of undetermined type. Fires reported as “no equipment” but lacking a confirming specific heat source (codes 40-99) are also treated as unknown equipment and allocated. Totals may not equal sums because of rounding. Source: Data from NFIRS Version 5.0 and NFPA survey.
16 Anna Luo, Evaluation of Electric Lighting Products, U.S. Consumer Product Safety Commission, Division of Electrical Engineering, Bethesda, MD, December 2007.
Home Electrical Fires, 4/13 85 NFPA Fire Analysis & Research, Quincy, MA
Halogen lights have a higher risk of fire than regular incandescent lights, which have a higher risk than fluorescent lights. Halogen lights are a type of incandescent light that provides 8% more lumens (more light) per watt than regular incandescent lights. Fluorescent lights are much more efficient but have until recently been much more expensive as well. Incandescent light fixtures accounted for more 2007-2011 non-confined home structure fires than halogen light fixtures (by a factor of 2.6-to-1) and fluorescent light fixtures (by a factor of 3.4-to-1). If the fires attributed to table or floor lamps and to light bulbs were all incandescent lighting equipment, then the ratio of fires involving incandescent lighting equipment to fires involving other types of lighting equipment could rise as high as 6.3-to-1 for halogen lights and 8.2-to-1 for fluorescent lights. Even if all the fires attributed to unclassified light fixture, lamp, or light bulb are also assigned to incandescent lighting equipment, the ratio of incandescent to halogen lighting equipment would only rise to 10.0-to-1. Usage estimates are available for 201017. The usage ratio for incandescent vs. halogen lights was 14.0-to-1. The usage ratio is higher than the highest incandescent vs. halogen fire incident ratio of 10.0-to-1. Therefore, the fire incident risk with halogen lights is estimated to be higher than the fire incident risk with incandescent lights. The usage ratio for incandescent vs. fluorescent lights was 1.9-to-1, with compact fluorescent bulbs now accounting for more than two-thirds of all fluorescent lights in residential usage. This usage ratio is lower than the ratio of fire incidents. Therefore, the fire incident risk with incandescent lights is estimated to be higher than the fire incident risk with fluorescent lights. It is worth noting that incandescent light bulbs are being phased out over the next few years in favor of energy-saving alternatives such as compact fluorescent light bulbs. More than one-third (37%) of 2007-2011 home structure fires involving lamps, light fixtures, or light bulbs cited heat source too close to combustibles as a factor contributing to ignition. This is a much higher percentage share for heat source too close to combustibles than is seen with wiring and related equipment (1%) and cords and plugs (3%). See Table 5.2. The percentage share for heat source too close to combustibles was:
33% for unclassified light fixture, lamp, or light bulb fires, 44% for table or floor lamp fires, 23% for incandescent light fixture fires, 59% for light bulb fires, 49% for halogen light fixture fires, 6% for fluorescent light fixture fires, 62% for work lights and trouble light fires, and 19% for decorative lights on line voltage fires.
The low percentage for fluorescent light fixtures probably reflects the fact that fluorescent lights emit only about 30% of their energy as heat compared to about 90% for halogen lights and regular
17 Navigant Consulting, Inc., 2010 U.S. Lighting Market Characterization, U.S. Department of Energy, January 2012, Table 4.1.
Home Electrical Fires, 4/13 86 NFPA Fire Analysis & Research, Quincy, MA
incandescent lights.18 The low percentage for decorative lights probably reflects the low wattage, hence low heat, associated with such lights. Halogen lights are hotter than comparable regular incandescent lights because the smaller bulbs concentrate heat on a smaller surface and place the bulb surface closer to the filament. This means there is a larger volume of space around a halogen light in which combustibles can be ignited and that would be considered too close to heat source. Half (49%) of civilian fire deaths in 2007-2011 home structure fires involving lamps, light fixtures, or light bulbs resulted from fires that started with ignition of mattress or bedding (26%) or upholstered furniture (23%). See Table 5.3. Ceiling covering accounted for 9% of the deaths. One-third (35%) of 2007-2011 home structure fires involving lamps, light fixtures, or light bulbs began in a bedroom (25%) or a living room, family room, or den (10%). See Table 5.4. These two areas of origin combined also accounted for:
32% for unclassified light fixture, lamp, or light bulb fires, 76% for table or floor lamp fires, 13% for incandescent light fixture fires, 21% for light bulb fires, 28% for halogen light fixture fires, 19% for fluorescent light fixture fires, 13% for work light or trouble light fires, and 39% for decorative light (on line voltage) fires,
The leading area of origin for light bulb was closet (18% of fires). The 2008 and later editions of the National Electrical Code do not allow “open or partially open incandescent type light fixtures” in closets. In this context, “open” would mean an exposed, unenclosed light bulb. In 2002-2009, two types of lamp, light fixture, or light bulb accounted for an average of 4.3 electrocution deaths per year.19 In 2011, an estimated 40,530 injuries involving lamps, light fixtures, or light bulbs were reported to hospital emergency rooms.20 See Table 5.B. Note that thermal burns can result from contact with a hot object as well as from fires. Note the large share of injuries involving Christmas tree lights, even though such lights are in heavy and widespread use only about one month out of 12 per year. If adjusted for usage, the Christmas tree light injury total would likely be a much larger share of the injuries. NFPA publishes a separate study of fires involving Christmas trees and related decorative lights and decorations.21
18 “FAQs – Halogen,” accessed at http://gelighting.com/na/business.lighting/faqs. 19 Matthew V. Hnatov, 2007 Electrocutions Associated with Consumer Products, U.S. Consumer Product Safety Commission, November 2010, accessed at www.cpsc.gov. 20 Statistics from National Electronic Injury Surveillance System (NEISS) data obtained from the U.S. Consumer Product Safety Commission website, www.cpsc.gov. 21 Marty Ahrens, Home Christmas Tree and Holiday Light Fires, NFPA Fire Analysis and Research Division, November 2011.
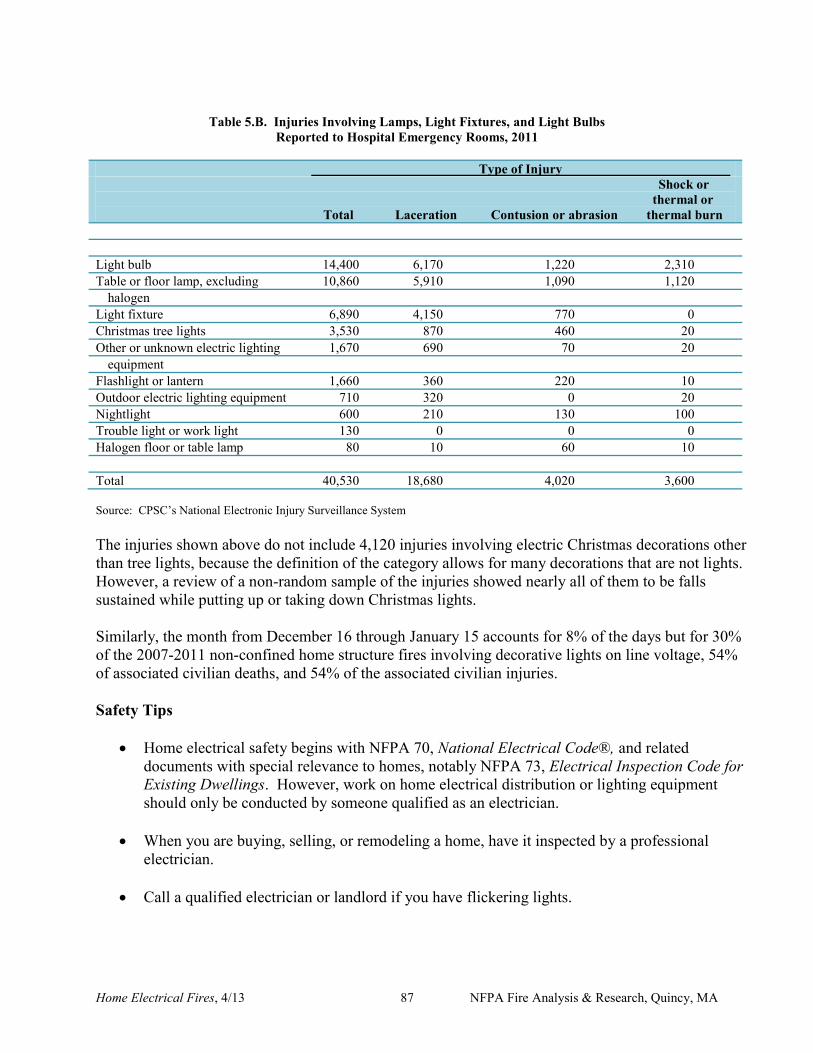
Home Electrical Fires, 4/13 87 NFPA Fire Analysis & Research, Quincy, MA
Table 5.B. Injuries Involving Lamps, Light Fixtures, and Light Bulbs
Reported to Hospital Emergency Rooms, 2011
Type of Injury Shock or thermal or Total Laceration Contusion or abrasion thermal burn Light bulb 14,400 6,170 1,220 2,310 Table or floor lamp, excluding 10,860 5,910 1,090 1,120 halogen Light fixture 6,890 4,150 770 0 Christmas tree lights 3,530 870 460 20 Other or unknown electric lighting 1,670 690 70 20 equipment Flashlight or lantern 1,660 360 220 10 Outdoor electric lighting equipment 710 320 0 20 Nightlight 600 210 130 100 Trouble light or work light 130 0 0 0 Halogen floor or table lamp 80 10 60 10 Total 40,530 18,680 4,020 3,600 Source: CPSC’s National Electronic Injury Surveillance System The injuries shown above do not include 4,120 injuries involving electric Christmas decorations other than tree lights, because the definition of the category allows for many decorations that are not lights. However, a review of a non-random sample of the injuries showed nearly all of them to be falls sustained while putting up or taking down Christmas lights. Similarly, the month from December 16 through January 15 accounts for 8% of the days but for 30% of the 2007-2011 non-confined home structure fires involving decorative lights on line voltage, 54% of associated civilian deaths, and 54% of the associated civilian injuries. Safety Tips
Home electrical safety begins with NFPA 70, National Electrical Code®, and related documents with special relevance to homes, notably NFPA 73, Electrical Inspection Code for Existing Dwellings. However, work on home electrical distribution or lighting equipment should only be conducted by someone qualified as an electrician.
When you are buying, selling, or remodeling a home, have it inspected by a professional
electrician.
Call a qualified electrician or landlord if you have flickering lights.
Home Electrical Fires, 4/13 88 NFPA Fire Analysis & Research, Quincy, MA
Keep lamps, light fixtures, and light bulbs away from anything that can burn, including lamp shades, furniture, bedding, curtains, clothing, and flammable or combustible gases and liquids.
Never place clothing over a lamp or a cloth over a light bulb.
Place lamps away from where people and pets walk or where things might fall against them.
Buy only appliances that have the label of a recognized testing laboratory.
Use light bulbs that match the recommended wattage on the lamp or fixture.
More of NFPA’s electrical safety information is available on our website at www.nfpa.org/electricalfires.
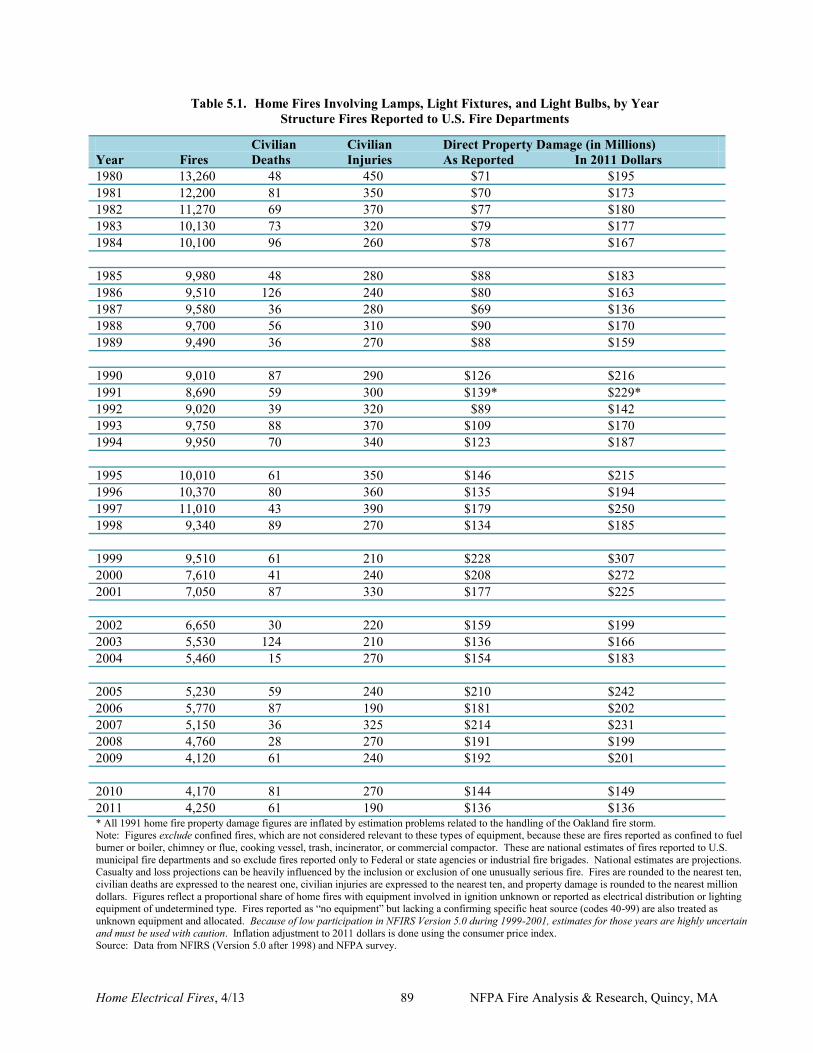
Home Electrical Fires, 4/13 89 NFPA Fire Analysis & Research, Quincy, MA
Table 5.1. Home Fires Involving Lamps, Light Fixtures, and Light Bulbs, by Year Structure Fires Reported to U.S. Fire Departments
Civilian Civilian Direct Property Damage (in Millions) Year Fires Deaths Injuries As Reported In 2011 Dollars 1980 13,260 48 450 $71 $195 1981 12,200 81 350 $70 $173 1982 11,270 69 370 $77 $180 1983 10,130 73 320 $79 $177 1984 10,100 96 260 $78 $167 1985 9,980 48 280 $88 $183 1986 9,510 126 240 $80 $163 1987 9,580 36 280 $69 $136 1988 9,700 56 310 $90 $170 1989 9,490 36 270 $88 $159 1990 9,010 87 290 $126 $216 1991 8,690 59 300 $139* $229* 1992 9,020 39 320 $89 $142 1993 9,750 88 370 $109 $170 1994 9,950 70 340 $123 $187 1995 10,010 61 350 $146 $215 1996 10,370 80 360 $135 $194 1997 11,010 43 390 $179 $250 1998 9,340 89 270 $134 $185 1999 9,510 61 210 $228 $307 2000 7,610 41 240 $208 $272 2001 7,050 87 330 $177 $225 2002 6,650 30 220 $159 $199 2003 5,530 124 210 $136 $166 2004 5,460 15 270 $154 $183 2005 5,230 59 240 $210 $242 2006 5,770 87 190 $181 $202 2007 5,150 36 325 $214 $231 2008 4,760 28 270 $191 $199 2009 4,120 61 240 $192 $201 2010 4,170 81 270 $144 $149 2011 4,250 61 190 $136 $136 * All 1991 home fire property damage figures are inflated by estimation problems related to the handling of the Oakland fire storm. Note: Figures exclude confined fires, which are not considered relevant to these types of equipment, because these are fires reported as confined to fuel burner or boiler, chimney or flue, cooking vessel, trash, incinerator, or commercial compactor. These are national estimates of fires reported to U.S. municipal fire departments and so exclude fires reported only to Federal or state agencies or industrial fire brigades. National estimates are projections. Casualty and loss projections can be heavily influenced by the inclusion or exclusion of one unusually serious fire. Fires are rounded to the nearest ten, civilian deaths are expressed to the nearest one, civilian injuries are expressed to the nearest ten, and property damage is rounded to the nearest million dollars. Figures reflect a proportional share of home fires with equipment involved in ignition unknown or reported as electrical distribution or lighting equipment of undetermined type. Fires reported as “no equipment” but lacking a confirming specific heat source (codes 40-99) are also treated as unknown equipment and allocated. Because of low participation in NFIRS Version 5.0 during 1999-2001, estimates for those years are highly uncertain and must be used with caution. Inflation adjustment to 2011 dollars is done using the consumer price index. Source: Data from NFIRS (Version 5.0 after 1998) and NFPA survey.
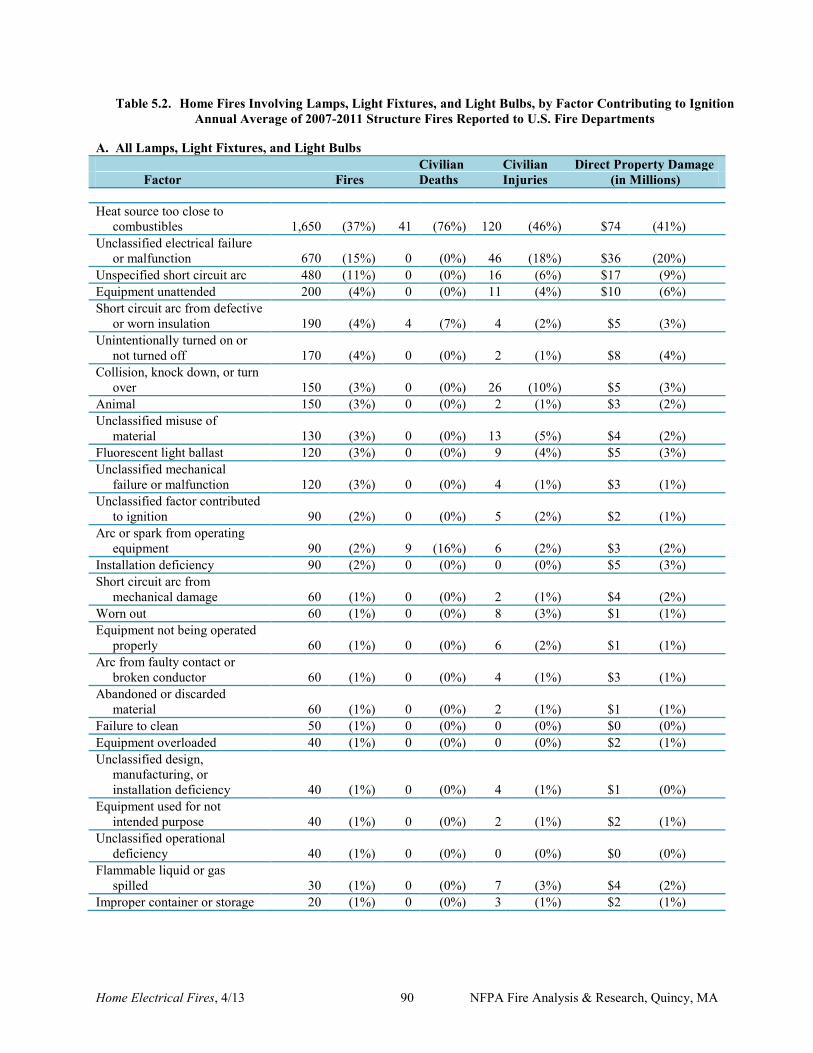
Home Electrical Fires, 4/13 90 NFPA Fire Analysis & Research, Quincy, MA
Table 5.2. Home Fires Involving Lamps, Light Fixtures, and Light Bulbs, by Factor Contributing to Ignition Annual Average of 2007-2011 Structure Fires Reported to U.S. Fire Departments
A. All Lamps, Light Fixtures, and Light Bulbs Civilian Civilian Direct Property Damage Factor Fires Deaths Injuries (in Millions) Heat source too close to combustibles 1,650 (37%) 41 (76%) 120 (46%) $74 (41%) Unclassified electrical failure or malfunction 670 (15%) 0 (0%) 46 (18%) $36 (20%) Unspecified short circuit arc 480 (11%) 0 (0%) 16 (6%) $17 (9%) Equipment unattended 200 (4%) 0 (0%) 11 (4%) $10 (6%) Short circuit arc from defective or worn insulation 190 (4%) 4 (7%) 4 (2%) $5 (3%) Unintentionally turned on or not turned off 170 (4%) 0 (0%) 2 (1%) $8 (4%) Collision, knock down, or turn over 150 (3%) 0 (0%) 26 (10%) $5 (3%) Animal 150 (3%) 0 (0%) 2 (1%) $3 (2%) Unclassified misuse of material 130 (3%) 0 (0%) 13 (5%) $4 (2%) Fluorescent light ballast 120 (3%) 0 (0%) 9 (4%) $5 (3%) Unclassified mechanical failure or malfunction 120 (3%) 0 (0%) 4 (1%) $3 (1%) Unclassified factor contributed to ignition 90 (2%) 0 (0%) 5 (2%) $2 (1%) Arc or spark from operating equipment 90 (2%) 9 (16%) 6 (2%) $3 (2%) Installation deficiency 90 (2%) 0 (0%) 0 (0%) $5 (3%) Short circuit arc from mechanical damage 60 (1%) 0 (0%) 2 (1%) $4 (2%) Worn out 60 (1%) 0 (0%) 8 (3%) $1 (1%) Equipment not being operated properly 60 (1%) 0 (0%) 6 (2%) $1 (1%) Arc from faulty contact or broken conductor 60 (1%) 0 (0%) 4 (1%) $3 (1%) Abandoned or discarded material 60 (1%) 0 (0%) 2 (1%) $1 (1%) Failure to clean 50 (1%) 0 (0%) 0 (0%) $0 (0%) Equipment overloaded 40 (1%) 0 (0%) 0 (0%) $2 (1%) Unclassified design, manufacturing, or installation deficiency 40 (1%) 0 (0%) 4 (1%) $1 (0%) Equipment used for not intended purpose 40 (1%) 0 (0%) 2 (1%) $2 (1%) Unclassified operational deficiency 40 (1%) 0 (0%) 0 (0%) $0 (0%) Flammable liquid or gas spilled 30 (1%) 0 (0%) 7 (3%) $4 (2%) Improper container or storage 20 (1%) 0 (0%) 3 (1%) $2 (1%)
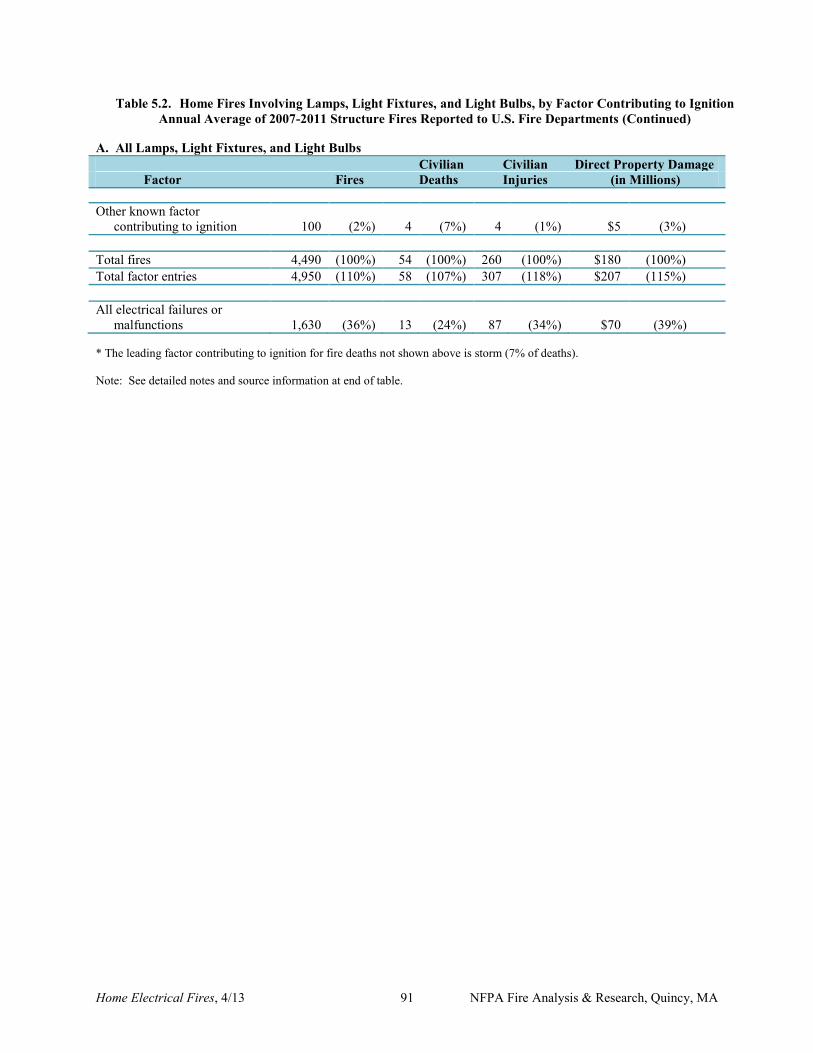
Home Electrical Fires, 4/13 91 NFPA Fire Analysis & Research, Quincy, MA
Table 5.2. Home Fires Involving Lamps, Light Fixtures, and Light Bulbs, by Factor Contributing to Ignition Annual Average of 2007-2011 Structure Fires Reported to U.S. Fire Departments (Continued)
A. All Lamps, Light Fixtures, and Light Bulbs Civilian Civilian Direct Property Damage Factor Fires Deaths Injuries (in Millions) Other known factor contributing to ignition 100 (2%) 4 (7%) 4 (1%) $5 (3%) Total fires 4,490 (100%) 54 (100%) 260 (100%) $180 (100%) Total factor entries 4,950 (110%) 58 (107%) 307 (118%) $207 (115%) All electrical failures or malfunctions 1,630 (36%) 13 (24%) 87 (34%) $70 (39%) * The leading factor contributing to ignition for fire deaths not shown above is storm (7% of deaths). Note: See detailed notes and source information at end of table.
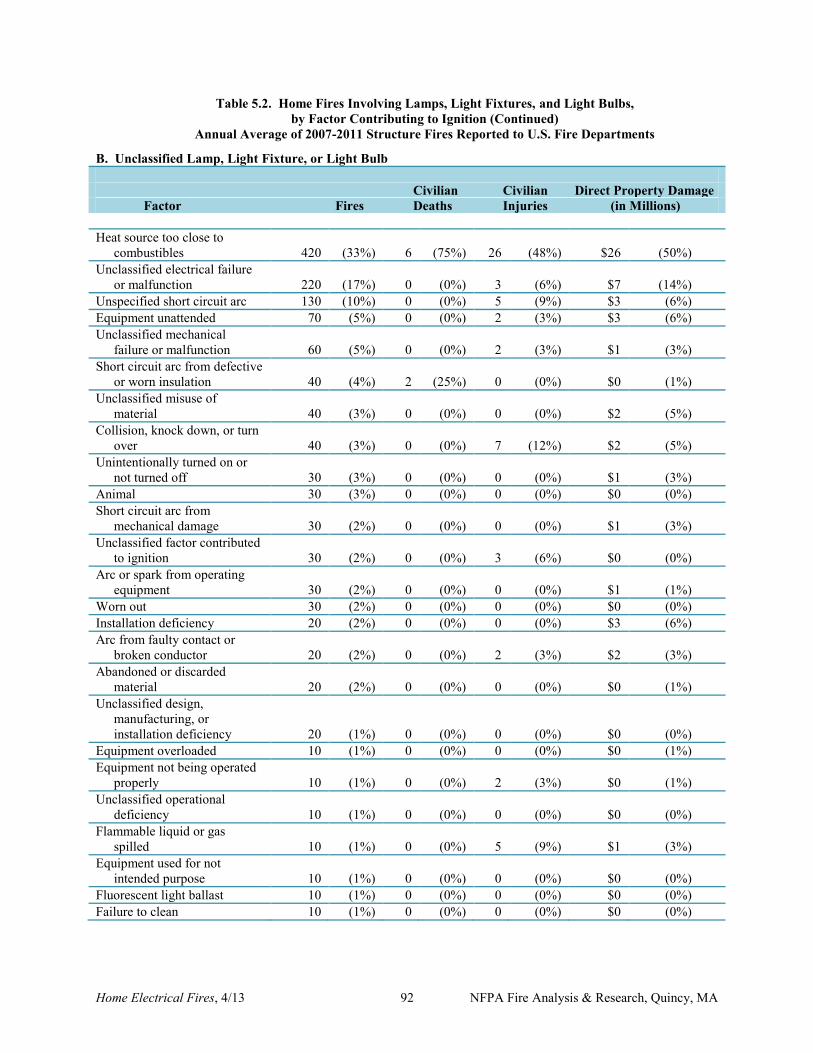
Home Electrical Fires, 4/13 92 NFPA Fire Analysis & Research, Quincy, MA
Table 5.2. Home Fires Involving Lamps, Light Fixtures, and Light Bulbs, by Factor Contributing to Ignition (Continued)
Annual Average of 2007-2011 Structure Fires Reported to U.S. Fire Departments
B. Unclassified Lamp, Light Fixture, or Light Bulb Civilian Civilian Direct Property Damage Factor Fires Deaths Injuries (in Millions) Heat source too close to combustibles 420 (33%) 6 (75%) 26 (48%) $26 (50%) Unclassified electrical failure or malfunction 220 (17%) 0 (0%) 3 (6%) $7 (14%) Unspecified short circuit arc 130 (10%) 0 (0%) 5 (9%) $3 (6%) Equipment unattended 70 (5%) 0 (0%) 2 (3%) $3 (6%) Unclassified mechanical failure or malfunction 60 (5%) 0 (0%) 2 (3%) $1 (3%) Short circuit arc from defective or worn insulation 40 (4%) 2 (25%) 0 (0%) $0 (1%) Unclassified misuse of material 40 (3%) 0 (0%) 0 (0%) $2 (5%) Collision, knock down, or turn over 40 (3%) 0 (0%) 7 (12%) $2 (5%) Unintentionally turned on or not turned off 30 (3%) 0 (0%) 0 (0%) $1 (3%) Animal 30 (3%) 0 (0%) 0 (0%) $0 (0%) Short circuit arc from mechanical damage 30 (2%) 0 (0%) 0 (0%) $1 (3%) Unclassified factor contributed to ignition 30 (2%) 0 (0%) 3 (6%) $0 (0%) Arc or spark from operating equipment 30 (2%) 0 (0%) 0 (0%) $1 (1%) Worn out 30 (2%) 0 (0%) 0 (0%) $0 (0%) Installation deficiency 20 (2%) 0 (0%) 0 (0%) $3 (6%) Arc from faulty contact or broken conductor 20 (2%) 0 (0%) 2 (3%) $2 (3%) Abandoned or discarded material 20 (2%) 0 (0%) 0 (0%) $0 (1%) Unclassified design, manufacturing, or installation deficiency 20 (1%) 0 (0%) 0 (0%) $0 (0%) Equipment overloaded 10 (1%) 0 (0%) 0 (0%) $0 (1%) Equipment not being operated properly 10 (1%) 0 (0%) 2 (3%) $0 (1%) Unclassified operational deficiency 10 (1%) 0 (0%) 0 (0%) $0 (0%) Flammable liquid or gas spilled 10 (1%) 0 (0%) 5 (9%) $1 (3%) Equipment used for not intended purpose 10 (1%) 0 (0%) 0 (0%) $0 (0%) Fluorescent light ballast 10 (1%) 0 (0%) 0 (0%) $0 (0%) Failure to clean 10 (1%) 0 (0%) 0 (0%) $0 (0%)
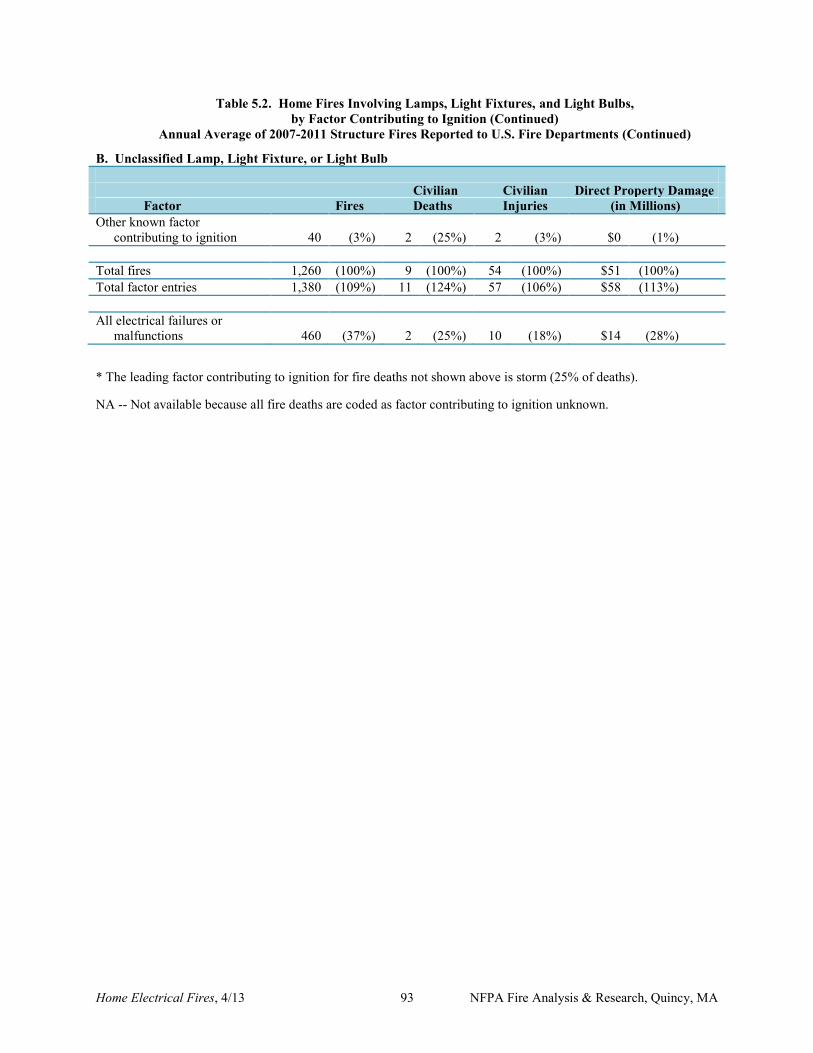
Home Electrical Fires, 4/13 93 NFPA Fire Analysis & Research, Quincy, MA
Table 5.2. Home Fires Involving Lamps, Light Fixtures, and Light Bulbs, by Factor Contributing to Ignition (Continued)
Annual Average of 2007-2011 Structure Fires Reported to U.S. Fire Departments (Continued)
B. Unclassified Lamp, Light Fixture, or Light Bulb Civilian Civilian Direct Property Damage Factor Fires Deaths Injuries (in Millions) Other known factor contributing to ignition 40 (3%) 2 (25%) 2 (3%) $0 (1%) Total fires 1,260 (100%) 9 (100%) 54 (100%) $51 (100%) Total factor entries 1,380 (109%) 11 (124%) 57 (106%) $58 (113%) All electrical failures or malfunctions 460 (37%) 2 (25%) 10 (18%) $14 (28%) * The leading factor contributing to ignition for fire deaths not shown above is storm (25% of deaths). NA -- Not available because all fire deaths are coded as factor contributing to ignition unknown.
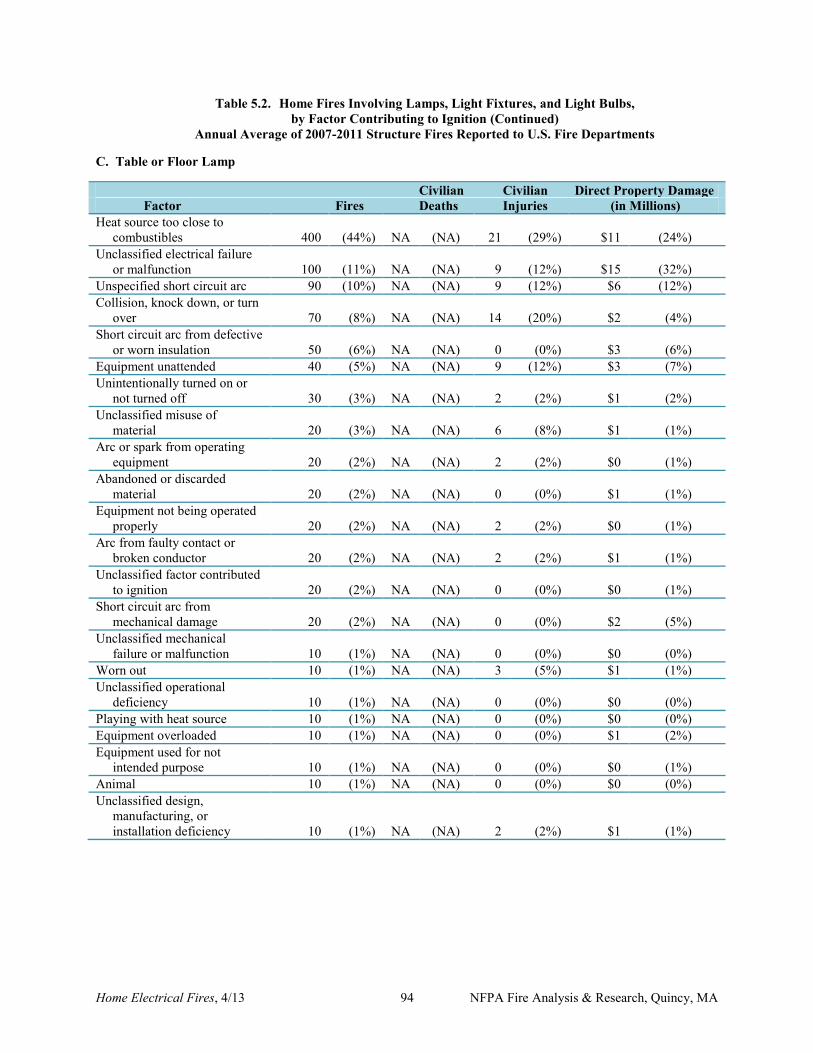
Home Electrical Fires, 4/13 94 NFPA Fire Analysis & Research, Quincy, MA
Table 5.2. Home Fires Involving Lamps, Light Fixtures, and Light Bulbs, by Factor Contributing to Ignition (Continued)
Annual Average of 2007-2011 Structure Fires Reported to U.S. Fire Departments C. Table or Floor Lamp Civilian Civilian Direct Property Damage Factor Fires Deaths Injuries (in Millions) Heat source too close to combustibles 400 (44%) NA (NA) 21 (29%) $11 (24%) Unclassified electrical failure or malfunction 100 (11%) NA (NA) 9 (12%) $15 (32%) Unspecified short circuit arc 90 (10%) NA (NA) 9 (12%) $6 (12%) Collision, knock down, or turn over 70 (8%) NA (NA) 14 (20%) $2 (4%) Short circuit arc from defective or worn insulation 50 (6%) NA (NA) 0 (0%) $3 (6%) Equipment unattended 40 (5%) NA (NA) 9 (12%) $3 (7%) Unintentionally turned on or not turned off 30 (3%) NA (NA) 2 (2%) $1 (2%) Unclassified misuse of material 20 (3%) NA (NA) 6 (8%) $1 (1%) Arc or spark from operating equipment 20 (2%) NA (NA) 2 (2%) $0 (1%) Abandoned or discarded material 20 (2%) NA (NA) 0 (0%) $1 (1%) Equipment not being operated properly 20 (2%) NA (NA) 2 (2%) $0 (1%) Arc from faulty contact or broken conductor 20 (2%) NA (NA) 2 (2%) $1 (1%) Unclassified factor contributed to ignition 20 (2%) NA (NA) 0 (0%) $0 (1%) Short circuit arc from mechanical damage 20 (2%) NA (NA) 0 (0%) $2 (5%) Unclassified mechanical failure or malfunction 10 (1%) NA (NA) 0 (0%) $0 (0%) Worn out 10 (1%) NA (NA) 3 (5%) $1 (1%) Unclassified operational deficiency 10 (1%) NA (NA) 0 (0%) $0 (0%) Playing with heat source 10 (1%) NA (NA) 0 (0%) $0 (0%) Equipment overloaded 10 (1%) NA (NA) 0 (0%) $1 (2%) Equipment used for not intended purpose 10 (1%) NA (NA) 0 (0%) $0 (1%) Animal 10 (1%) NA (NA) 0 (0%) $0 (0%) Unclassified design, manufacturing, or installation deficiency 10 (1%) NA (NA) 2 (2%) $1 (1%)
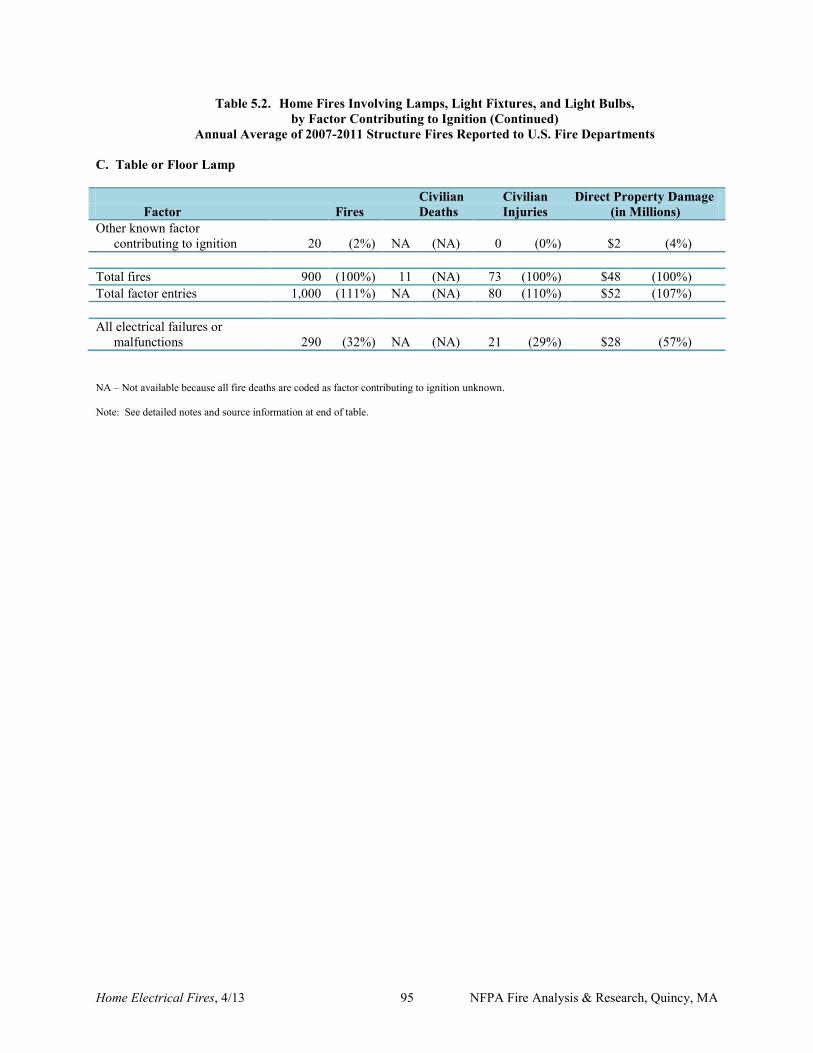
Home Electrical Fires, 4/13 95 NFPA Fire Analysis & Research, Quincy, MA
Table 5.2. Home Fires Involving Lamps, Light Fixtures, and Light Bulbs, by Factor Contributing to Ignition (Continued)
Annual Average of 2007-2011 Structure Fires Reported to U.S. Fire Departments C. Table or Floor Lamp Civilian Civilian Direct Property Damage Factor Fires Deaths Injuries (in Millions) Other known factor contributing to ignition 20 (2%) NA (NA) 0 (0%) $2 (4%) Total fires 900 (100%) 11 (NA) 73 (100%) $48 (100%) Total factor entries 1,000 (111%) NA (NA) 80 (110%) $52 (107%) All electrical failures or malfunctions 290 (32%) NA (NA) 21 (29%) $28 (57%) NA – Not available because all fire deaths are coded as factor contributing to ignition unknown. Note: See detailed notes and source information at end of table.
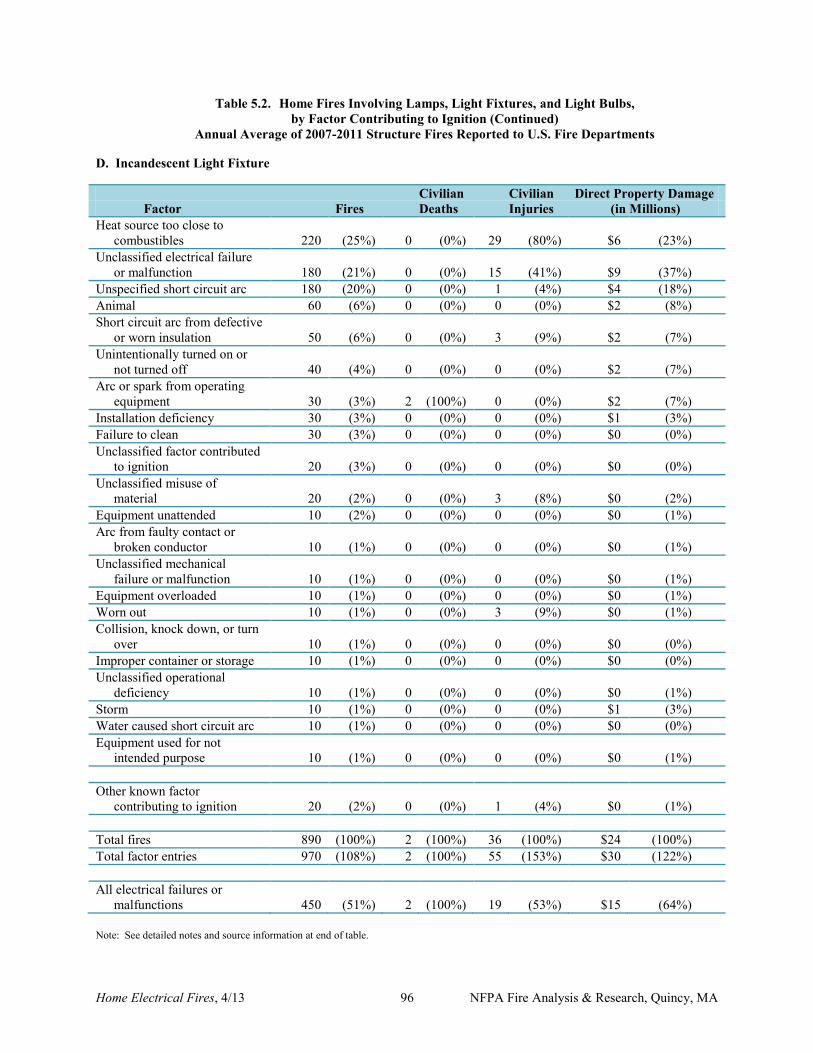
Home Electrical Fires, 4/13 96 NFPA Fire Analysis & Research, Quincy, MA
Table 5.2. Home Fires Involving Lamps, Light Fixtures, and Light Bulbs, by Factor Contributing to Ignition (Continued)
Annual Average of 2007-2011 Structure Fires Reported to U.S. Fire Departments D. Incandescent Light Fixture Civilian Civilian Direct Property Damage Factor Fires Deaths Injuries (in Millions) Heat source too close to combustibles 220 (25%) 0 (0%) 29 (80%) $6 (23%) Unclassified electrical failure or malfunction 180 (21%) 0 (0%) 15 (41%) $9 (37%) Unspecified short circuit arc 180 (20%) 0 (0%) 1 (4%) $4 (18%) Animal 60 (6%) 0 (0%) 0 (0%) $2 (8%) Short circuit arc from defective or worn insulation 50 (6%) 0 (0%) 3 (9%) $2 (7%) Unintentionally turned on or not turned off 40 (4%) 0 (0%) 0 (0%) $2 (7%) Arc or spark from operating equipment 30 (3%) 2 (100%) 0 (0%) $2 (7%) Installation deficiency 30 (3%) 0 (0%) 0 (0%) $1 (3%) Failure to clean 30 (3%) 0 (0%) 0 (0%) $0 (0%) Unclassified factor contributed to ignition 20 (3%) 0 (0%) 0 (0%) $0 (0%) Unclassified misuse of material 20 (2%) 0 (0%) 3 (8%) $0 (2%) Equipment unattended 10 (2%) 0 (0%) 0 (0%) $0 (1%) Arc from faulty contact or broken conductor 10 (1%) 0 (0%) 0 (0%) $0 (1%) Unclassified mechanical failure or malfunction 10 (1%) 0 (0%) 0 (0%) $0 (1%) Equipment overloaded 10 (1%) 0 (0%) 0 (0%) $0 (1%) Worn out 10 (1%) 0 (0%) 3 (9%) $0 (1%) Collision, knock down, or turn over 10 (1%) 0 (0%) 0 (0%) $0 (0%) Improper container or storage 10 (1%) 0 (0%) 0 (0%) $0 (0%) Unclassified operational deficiency 10 (1%) 0 (0%) 0 (0%) $0 (1%) Storm 10 (1%) 0 (0%) 0 (0%) $1 (3%) Water caused short circuit arc 10 (1%) 0 (0%) 0 (0%) $0 (0%) Equipment used for not intended purpose 10 (1%) 0 (0%) 0 (0%) $0 (1%) Other known factor contributing to ignition 20 (2%) 0 (0%) 1 (4%) $0 (1%) Total fires 890 (100%) 2 (100%) 36 (100%) $24 (100%) Total factor entries 970 (108%) 2 (100%) 55 (153%) $30 (122%) All electrical failures or malfunctions 450 (51%) 2 (100%) 19 (53%) $15 (64%) Note: See detailed notes and source information at end of table.
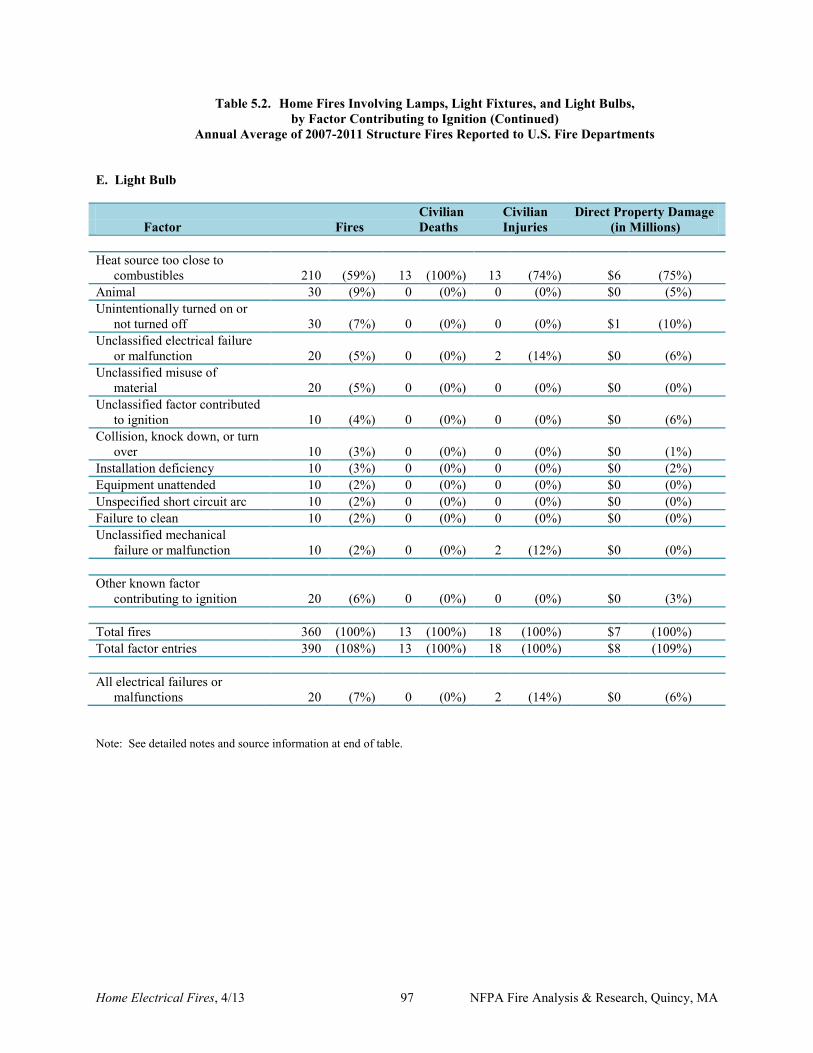
Home Electrical Fires, 4/13 97 NFPA Fire Analysis & Research, Quincy, MA
Table 5.2. Home Fires Involving Lamps, Light Fixtures, and Light Bulbs, by Factor Contributing to Ignition (Continued)
Annual Average of 2007-2011 Structure Fires Reported to U.S. Fire Departments E. Light Bulb Civilian Civilian Direct Property Damage Factor Fires Deaths Injuries (in Millions) Heat source too close to combustibles 210 (59%) 13 (100%) 13 (74%) $6 (75%) Animal 30 (9%) 0 (0%) 0 (0%) $0 (5%) Unintentionally turned on or not turned off 30 (7%) 0 (0%) 0 (0%) $1 (10%) Unclassified electrical failure or malfunction 20 (5%) 0 (0%) 2 (14%) $0 (6%) Unclassified misuse of material 20 (5%) 0 (0%) 0 (0%) $0 (0%) Unclassified factor contributed to ignition 10 (4%) 0 (0%) 0 (0%) $0 (6%) Collision, knock down, or turn over 10 (3%) 0 (0%) 0 (0%) $0 (1%) Installation deficiency 10 (3%) 0 (0%) 0 (0%) $0 (2%) Equipment unattended 10 (2%) 0 (0%) 0 (0%) $0 (0%) Unspecified short circuit arc 10 (2%) 0 (0%) 0 (0%) $0 (0%) Failure to clean 10 (2%) 0 (0%) 0 (0%) $0 (0%) Unclassified mechanical failure or malfunction 10 (2%) 0 (0%) 2 (12%) $0 (0%) Other known factor contributing to ignition 20 (6%) 0 (0%) 0 (0%) $0 (3%) Total fires 360 (100%) 13 (100%) 18 (100%) $7 (100%) Total factor entries 390 (108%) 13 (100%) 18 (100%) $8 (109%) All electrical failures or malfunctions 20 (7%) 0 (0%) 2 (14%) $0 (6%) Note: See detailed notes and source information at end of table.
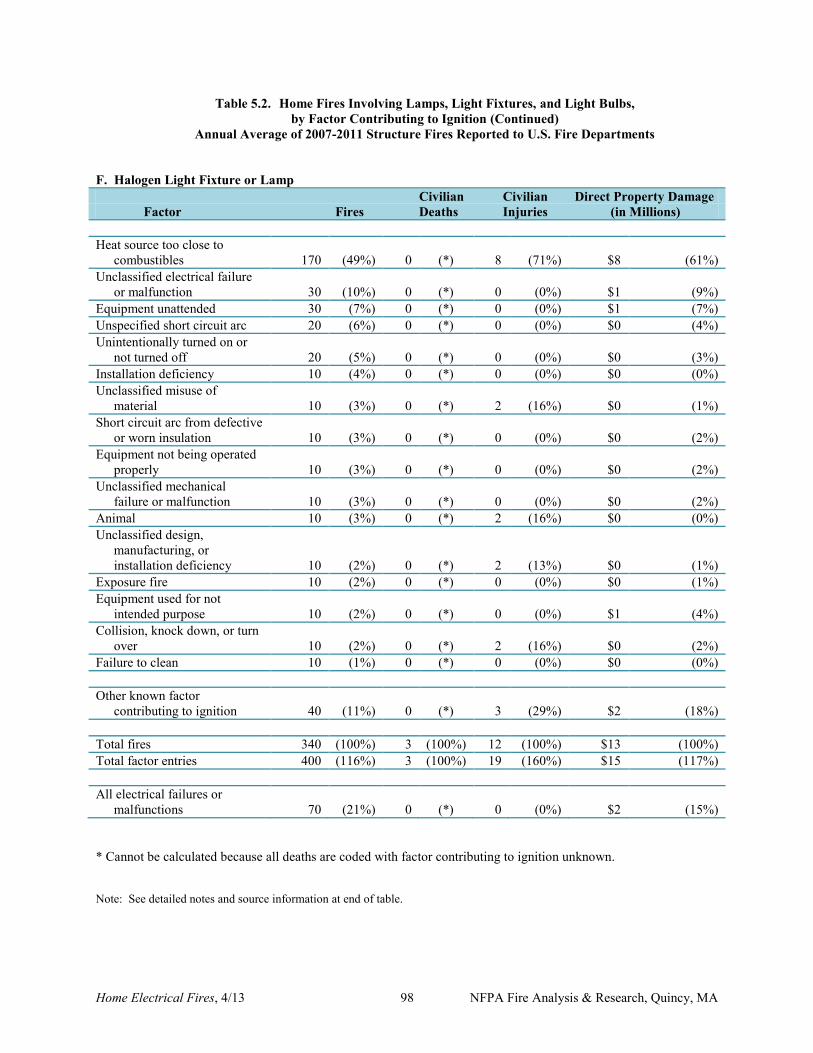
Home Electrical Fires, 4/13 98 NFPA Fire Analysis & Research, Quincy, MA
Table 5.2. Home Fires Involving Lamps, Light Fixtures, and Light Bulbs, by Factor Contributing to Ignition (Continued)
Annual Average of 2007-2011 Structure Fires Reported to U.S. Fire Departments F. Halogen Light Fixture or Lamp Civilian Civilian Direct Property Damage Factor Fires Deaths Injuries (in Millions) Heat source too close to combustibles 170 (49%) 0 (*) 8 (71%) $8 (61%) Unclassified electrical failure or malfunction 30 (10%) 0 (*) 0 (0%) $1 (9%) Equipment unattended 30 (7%) 0 (*) 0 (0%) $1 (7%) Unspecified short circuit arc 20 (6%) 0 (*) 0 (0%) $0 (4%) Unintentionally turned on or not turned off 20 (5%) 0 (*) 0 (0%) $0 (3%) Installation deficiency 10 (4%) 0 (*) 0 (0%) $0 (0%) Unclassified misuse of material 10 (3%) 0 (*) 2 (16%) $0 (1%) Short circuit arc from defective or worn insulation 10 (3%) 0 (*) 0 (0%) $0 (2%) Equipment not being operated properly 10 (3%) 0 (*) 0 (0%) $0 (2%) Unclassified mechanical failure or malfunction 10 (3%) 0 (*) 0 (0%) $0 (2%) Animal 10 (3%) 0 (*) 2 (16%) $0 (0%) Unclassified design, manufacturing, or installation deficiency 10 (2%) 0 (*) 2 (13%) $0 (1%) Exposure fire 10 (2%) 0 (*) 0 (0%) $0 (1%) Equipment used for not intended purpose 10 (2%) 0 (*) 0 (0%) $1 (4%) Collision, knock down, or turn over 10 (2%) 0 (*) 2 (16%) $0 (2%) Failure to clean 10 (1%) 0 (*) 0 (0%) $0 (0%) Other known factor contributing to ignition 40 (11%) 0 (*) 3 (29%) $2 (18%) Total fires 340 (100%) 3 (100%) 12 (100%) $13 (100%) Total factor entries 400 (116%) 3 (100%) 19 (160%) $15 (117%) All electrical failures or malfunctions 70 (21%) 0 (*) 0 (0%) $2 (15%) * Cannot be calculated because all deaths are coded with factor contributing to ignition unknown. Note: See detailed notes and source information at end of table.
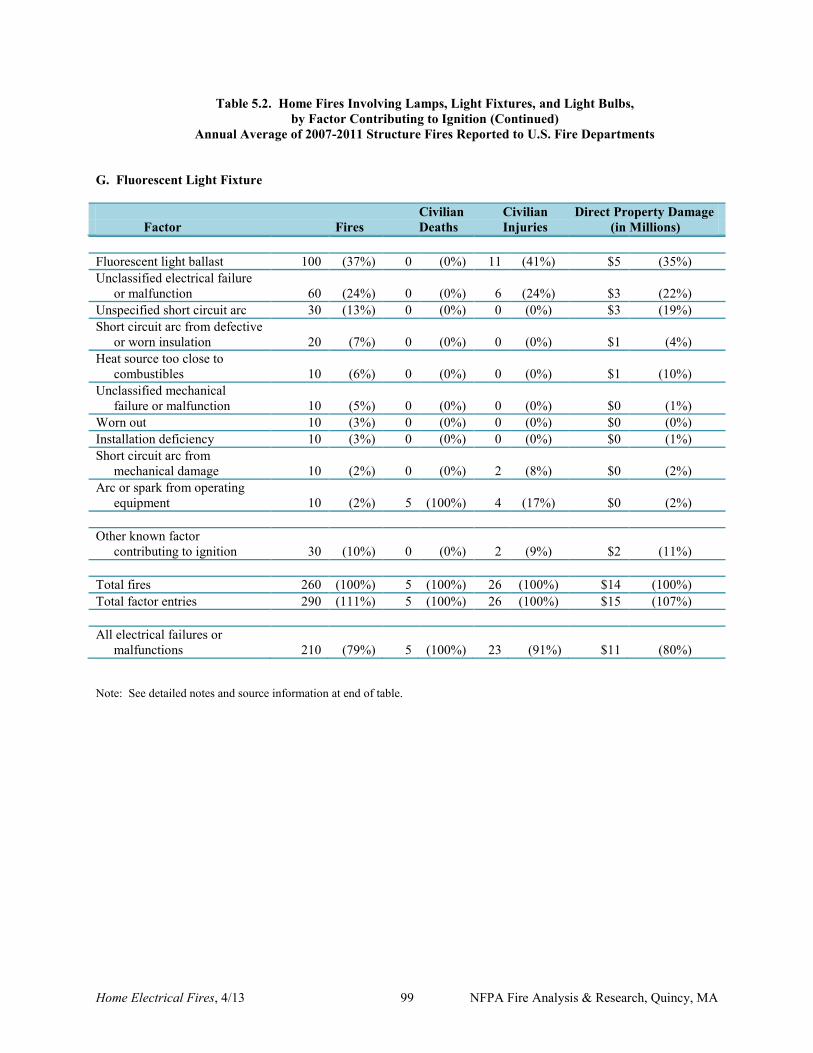
Home Electrical Fires, 4/13 99 NFPA Fire Analysis & Research, Quincy, MA
Table 5.2. Home Fires Involving Lamps, Light Fixtures, and Light Bulbs, by Factor Contributing to Ignition (Continued)
Annual Average of 2007-2011 Structure Fires Reported to U.S. Fire Departments
G. Fluorescent Light Fixture Civilian Civilian Direct Property Damage Factor Fires Deaths Injuries (in Millions) Fluorescent light ballast 100 (37%) 0 (0%) 11 (41%) $5 (35%) Unclassified electrical failure or malfunction 60 (24%) 0 (0%) 6 (24%) $3 (22%) Unspecified short circuit arc 30 (13%) 0 (0%) 0 (0%) $3 (19%) Short circuit arc from defective or worn insulation 20 (7%) 0 (0%) 0 (0%) $1 (4%) Heat source too close to combustibles 10 (6%) 0 (0%) 0 (0%) $1 (10%) Unclassified mechanical failure or malfunction 10 (5%) 0 (0%) 0 (0%) $0 (1%) Worn out 10 (3%) 0 (0%) 0 (0%) $0 (0%) Installation deficiency 10 (3%) 0 (0%) 0 (0%) $0 (1%) Short circuit arc from mechanical damage 10 (2%) 0 (0%) 2 (8%) $0 (2%) Arc or spark from operating equipment 10 (2%) 5 (100%) 4 (17%) $0 (2%) Other known factor contributing to ignition 30 (10%) 0 (0%) 2 (9%) $2 (11%) Total fires 260 (100%) 5 (100%) 26 (100%) $14 (100%) Total factor entries 290 (111%) 5 (100%) 26 (100%) $15 (107%) All electrical failures or malfunctions 210 (79%) 5 (100%) 23 (91%) $11 (80%) Note: See detailed notes and source information at end of table.
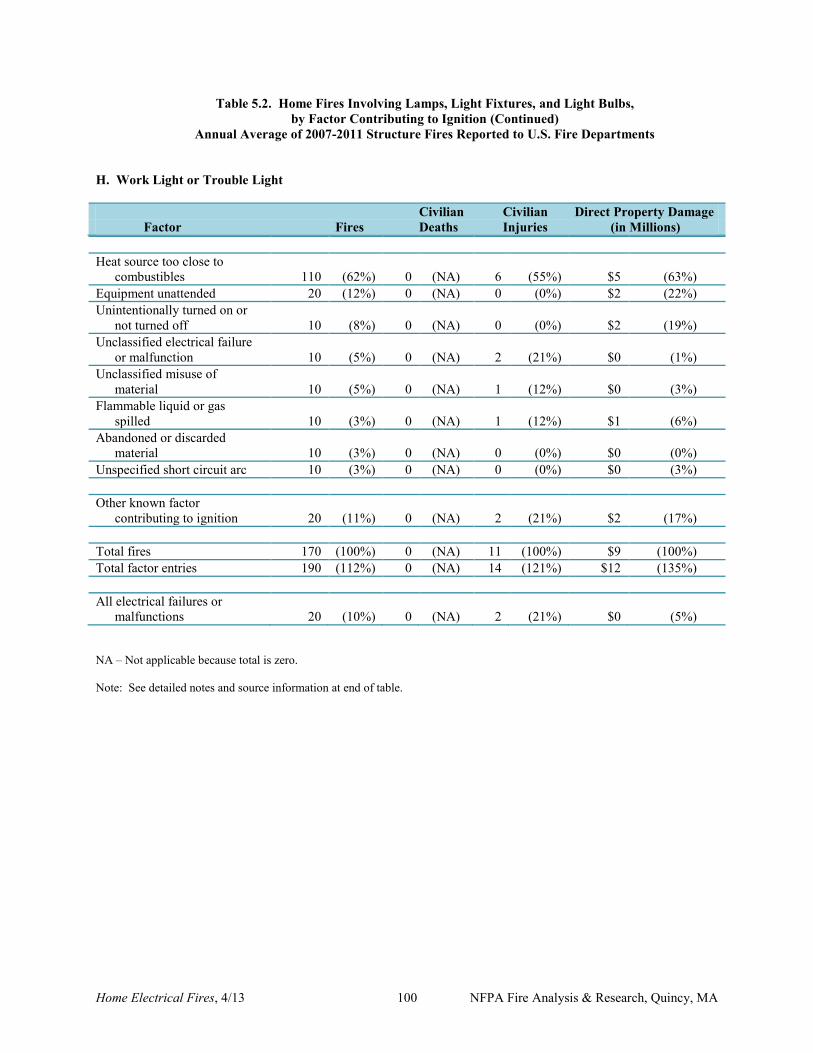
Home Electrical Fires, 4/13 100 NFPA Fire Analysis & Research, Quincy, MA
Table 5.2. Home Fires Involving Lamps, Light Fixtures, and Light Bulbs, by Factor Contributing to Ignition (Continued)
Annual Average of 2007-2011 Structure Fires Reported to U.S. Fire Departments
H. Work Light or Trouble Light Civilian Civilian Direct Property Damage Factor Fires Deaths Injuries (in Millions) Heat source too close to combustibles 110 (62%) 0 (NA) 6 (55%) $5 (63%) Equipment unattended 20 (12%) 0 (NA) 0 (0%) $2 (22%) Unintentionally turned on or not turned off 10 (8%) 0 (NA) 0 (0%) $2 (19%) Unclassified electrical failure or malfunction 10 (5%) 0 (NA) 2 (21%) $0 (1%) Unclassified misuse of material 10 (5%) 0 (NA) 1 (12%) $0 (3%) Flammable liquid or gas spilled 10 (3%) 0 (NA) 1 (12%) $1 (6%) Abandoned or discarded material 10 (3%) 0 (NA) 0 (0%) $0 (0%) Unspecified short circuit arc 10 (3%) 0 (NA) 0 (0%) $0 (3%) Other known factor contributing to ignition 20 (11%) 0 (NA) 2 (21%) $2 (17%) Total fires 170 (100%) 0 (NA) 11 (100%) $9 (100%) Total factor entries 190 (112%) 0 (NA) 14 (121%) $12 (135%) All electrical failures or malfunctions 20 (10%) 0 (NA) 2 (21%) $0 (5%) NA – Not applicable because total is zero. Note: See detailed notes and source information at end of table.
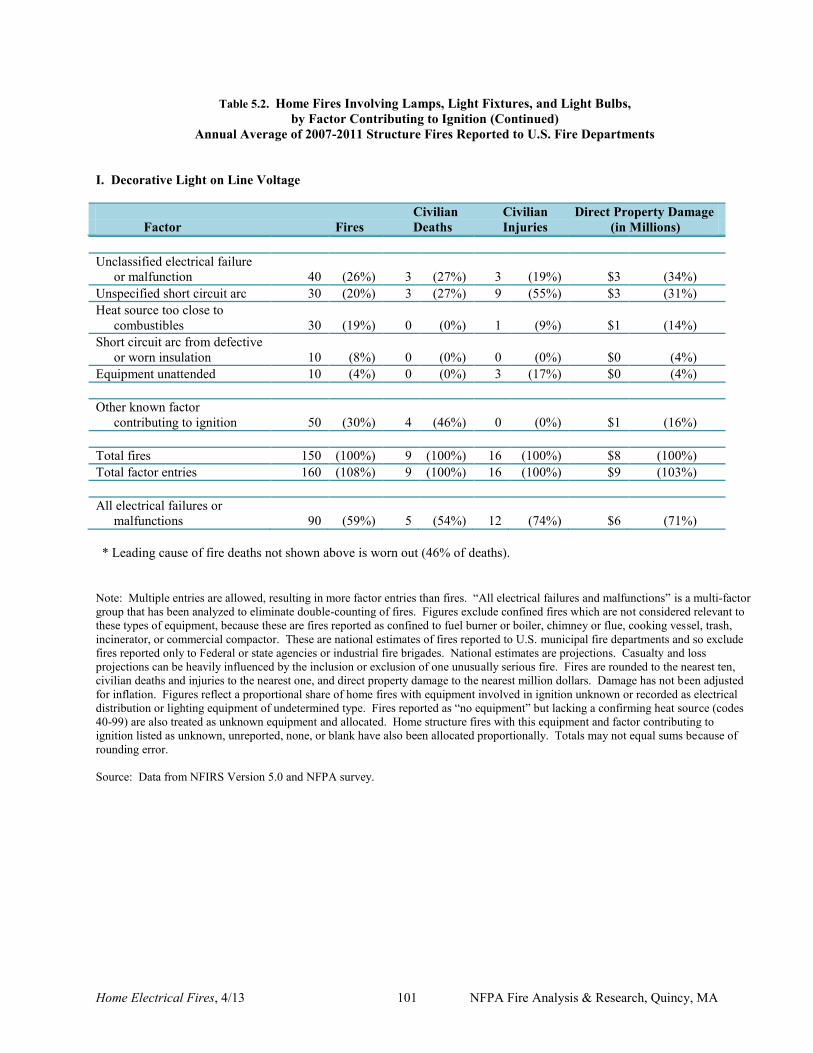
Home Electrical Fires, 4/13 101 NFPA Fire Analysis & Research, Quincy, MA
Table 5.2. Home Fires Involving Lamps, Light Fixtures, and Light Bulbs, by Factor Contributing to Ignition (Continued)
Annual Average of 2007-2011 Structure Fires Reported to U.S. Fire Departments I. Decorative Light on Line Voltage Civilian Civilian Direct Property Damage Factor Fires Deaths Injuries (in Millions) Unclassified electrical failure or malfunction 40 (26%) 3 (27%) 3 (19%) $3 (34%) Unspecified short circuit arc 30 (20%) 3 (27%) 9 (55%) $3 (31%) Heat source too close to combustibles 30 (19%) 0 (0%) 1 (9%) $1 (14%) Short circuit arc from defective or worn insulation 10 (8%) 0 (0%) 0 (0%) $0 (4%) Equipment unattended 10 (4%) 0 (0%) 3 (17%) $0 (4%) Other known factor contributing to ignition 50 (30%) 4 (46%) 0 (0%) $1 (16%) Total fires 150 (100%) 9 (100%) 16 (100%) $8 (100%) Total factor entries 160 (108%) 9 (100%) 16 (100%) $9 (103%) All electrical failures or malfunctions 90 (59%) 5 (54%) 12 (74%) $6 (71%) * Leading cause of fire deaths not shown above is worn out (46% of deaths).
Note: Multiple entries are allowed, resulting in more factor entries than fires. “All electrical failures and malfunctions” is a multi-factor group that has been analyzed to eliminate double-counting of fires. Figures exclude confined fires which are not considered relevant to these types of equipment, because these are fires reported as confined to fuel burner or boiler, chimney or flue, cooking vessel, trash, incinerator, or commercial compactor. These are national estimates of fires reported to U.S. municipal fire departments and so exclude fires reported only to Federal or state agencies or industrial fire brigades. National estimates are projections. Casualty and loss projections can be heavily influenced by the inclusion or exclusion of one unusually serious fire. Fires are rounded to the nearest ten, civilian deaths and injuries to the nearest one, and direct property damage to the nearest million dollars. Damage has not been adjusted for inflation. Figures reflect a proportional share of home fires with equipment involved in ignition unknown or recorded as electrical distribution or lighting equipment of undetermined type. Fires reported as “no equipment” but lacking a confirming heat source (codes 40-99) are also treated as unknown equipment and allocated. Home structure fires with this equipment and factor contributing to ignition listed as unknown, unreported, none, or blank have also been allocated proportionally. Totals may not equal sums because of rounding error. Source: Data from NFIRS Version 5.0 and NFPA survey.
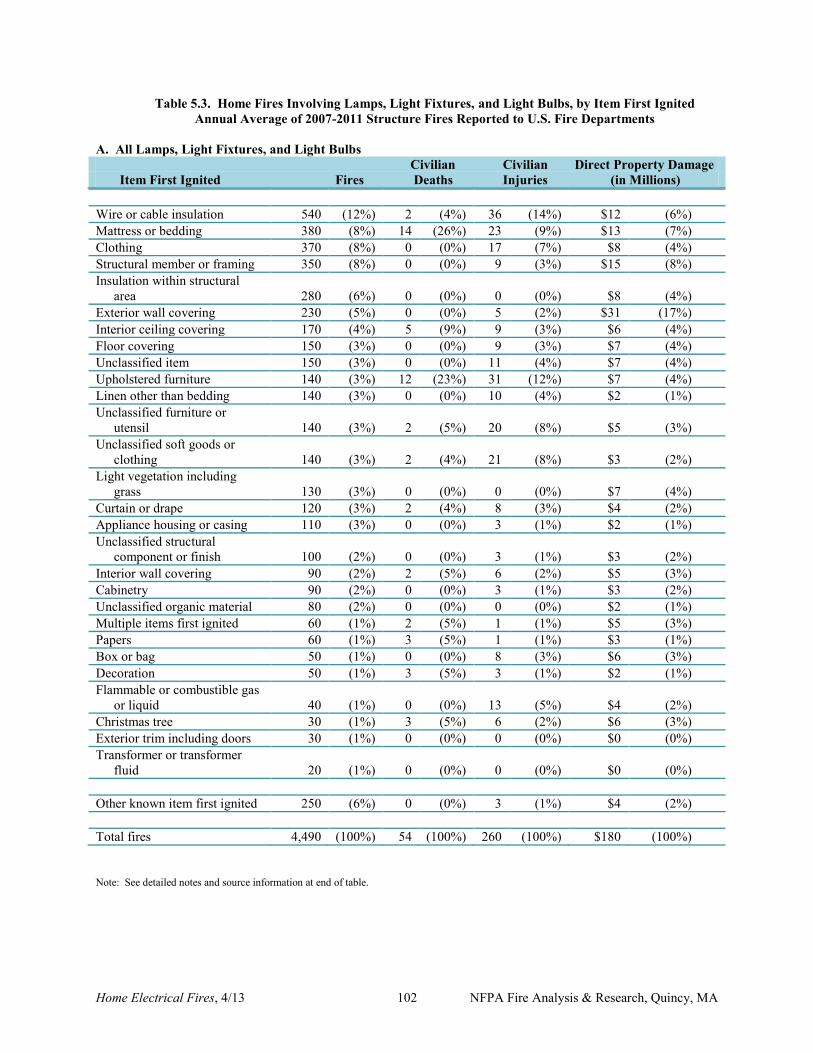
Home Electrical Fires, 4/13 102 NFPA Fire Analysis & Research, Quincy, MA
Table 5.3. Home Fires Involving Lamps, Light Fixtures, and Light Bulbs, by Item First Ignited Annual Average of 2007-2011 Structure Fires Reported to U.S. Fire Departments
A. All Lamps, Light Fixtures, and Light Bulbs Civilian Civilian Direct Property Damage Item First Ignited Fires Deaths Injuries (in Millions) Wire or cable insulation 540 (12%) 2 (4%) 36 (14%) $12 (6%) Mattress or bedding 380 (8%) 14 (26%) 23 (9%) $13 (7%) Clothing 370 (8%) 0 (0%) 17 (7%) $8 (4%) Structural member or framing 350 (8%) 0 (0%) 9 (3%) $15 (8%) Insulation within structural area 280 (6%) 0 (0%) 0 (0%) $8 (4%) Exterior wall covering 230 (5%) 0 (0%) 5 (2%) $31 (17%) Interior ceiling covering 170 (4%) 5 (9%) 9 (3%) $6 (4%) Floor covering 150 (3%) 0 (0%) 9 (3%) $7 (4%) Unclassified item 150 (3%) 0 (0%) 11 (4%) $7 (4%) Upholstered furniture 140 (3%) 12 (23%) 31 (12%) $7 (4%) Linen other than bedding 140 (3%) 0 (0%) 10 (4%) $2 (1%) Unclassified furniture or utensil 140 (3%) 2 (5%) 20 (8%) $5 (3%) Unclassified soft goods or clothing 140 (3%) 2 (4%) 21 (8%) $3 (2%) Light vegetation including grass 130 (3%) 0 (0%) 0 (0%) $7 (4%) Curtain or drape 120 (3%) 2 (4%) 8 (3%) $4 (2%) Appliance housing or casing 110 (3%) 0 (0%) 3 (1%) $2 (1%) Unclassified structural component or finish 100 (2%) 0 (0%) 3 (1%) $3 (2%) Interior wall covering 90 (2%) 2 (5%) 6 (2%) $5 (3%) Cabinetry 90 (2%) 0 (0%) 3 (1%) $3 (2%) Unclassified organic material 80 (2%) 0 (0%) 0 (0%) $2 (1%) Multiple items first ignited 60 (1%) 2 (5%) 1 (1%) $5 (3%) Papers 60 (1%) 3 (5%) 1 (1%) $3 (1%) Box or bag 50 (1%) 0 (0%) 8 (3%) $6 (3%) Decoration 50 (1%) 3 (5%) 3 (1%) $2 (1%) Flammable or combustible gas or liquid 40 (1%) 0 (0%) 13 (5%) $4 (2%) Christmas tree 30 (1%) 3 (5%) 6 (2%) $6 (3%) Exterior trim including doors 30 (1%) 0 (0%) 0 (0%) $0 (0%) Transformer or transformer fluid 20 (1%) 0 (0%) 0 (0%) $0 (0%) Other known item first ignited 250 (6%) 0 (0%) 3 (1%) $4 (2%) Total fires 4,490 (100%) 54 (100%) 260 (100%) $180 (100%) Note: See detailed notes and source information at end of table.
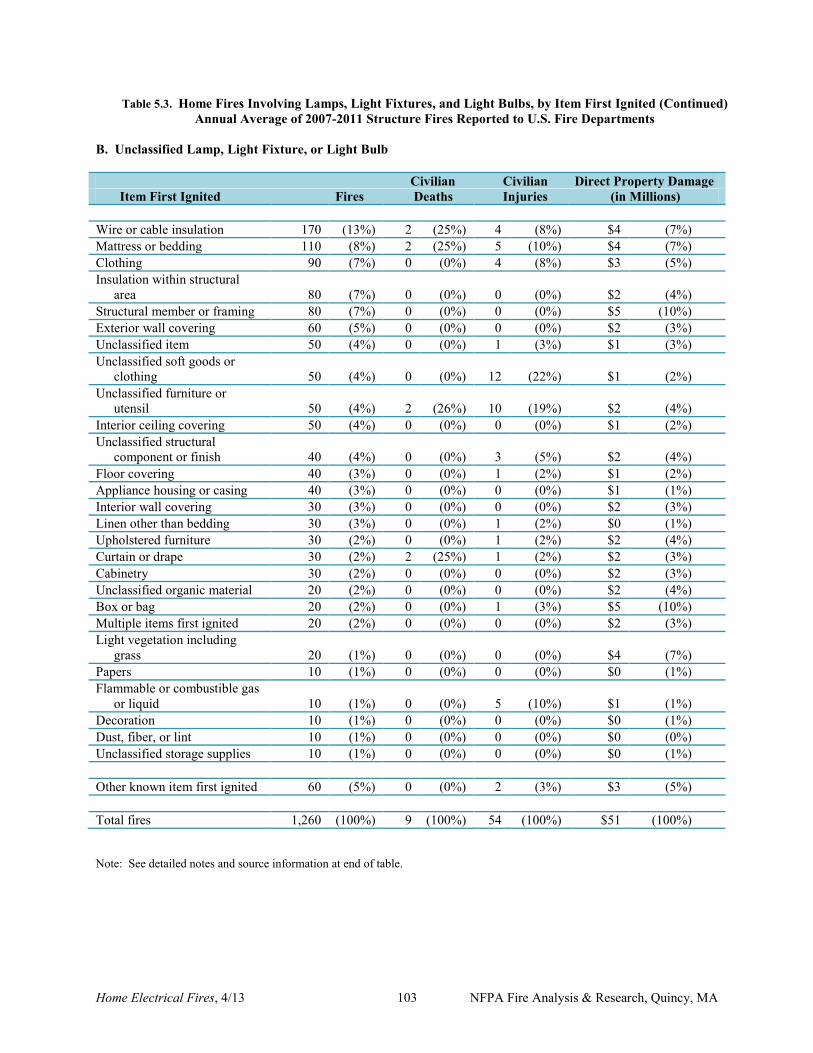
Home Electrical Fires, 4/13 103 NFPA Fire Analysis & Research, Quincy, MA
Table 5.3. Home Fires Involving Lamps, Light Fixtures, and Light Bulbs, by Item First Ignited (Continued) Annual Average of 2007-2011 Structure Fires Reported to U.S. Fire Departments
B. Unclassified Lamp, Light Fixture, or Light Bulb
Civilian Civilian Direct Property Damage Item First Ignited Fires Deaths Injuries (in Millions) Wire or cable insulation 170 (13%) 2 (25%) 4 (8%) $4 (7%) Mattress or bedding 110 (8%) 2 (25%) 5 (10%) $4 (7%) Clothing 90 (7%) 0 (0%) 4 (8%) $3 (5%) Insulation within structural area 80 (7%) 0 (0%) 0 (0%) $2 (4%) Structural member or framing 80 (7%) 0 (0%) 0 (0%) $5 (10%) Exterior wall covering 60 (5%) 0 (0%) 0 (0%) $2 (3%) Unclassified item 50 (4%) 0 (0%) 1 (3%) $1 (3%) Unclassified soft goods or clothing 50 (4%) 0 (0%) 12 (22%) $1 (2%) Unclassified furniture or utensil 50 (4%) 2 (26%) 10 (19%) $2 (4%) Interior ceiling covering 50 (4%) 0 (0%) 0 (0%) $1 (2%) Unclassified structural component or finish 40 (4%) 0 (0%) 3 (5%) $2 (4%) Floor covering 40 (3%) 0 (0%) 1 (2%) $1 (2%) Appliance housing or casing 40 (3%) 0 (0%) 0 (0%) $1 (1%) Interior wall covering 30 (3%) 0 (0%) 0 (0%) $2 (3%) Linen other than bedding 30 (3%) 0 (0%) 1 (2%) $0 (1%) Upholstered furniture 30 (2%) 0 (0%) 1 (2%) $2 (4%) Curtain or drape 30 (2%) 2 (25%) 1 (2%) $2 (3%) Cabinetry 30 (2%) 0 (0%) 0 (0%) $2 (3%) Unclassified organic material 20 (2%) 0 (0%) 0 (0%) $2 (4%) Box or bag 20 (2%) 0 (0%) 1 (3%) $5 (10%) Multiple items first ignited 20 (2%) 0 (0%) 0 (0%) $2 (3%) Light vegetation including grass 20 (1%) 0 (0%) 0 (0%) $4 (7%) Papers 10 (1%) 0 (0%) 0 (0%) $0 (1%) Flammable or combustible gas or liquid 10 (1%) 0 (0%) 5 (10%) $1 (1%) Decoration 10 (1%) 0 (0%) 0 (0%) $0 (1%) Dust, fiber, or lint 10 (1%) 0 (0%) 0 (0%) $0 (0%) Unclassified storage supplies 10 (1%) 0 (0%) 0 (0%) $0 (1%) Other known item first ignited 60 (5%) 0 (0%) 2 (3%) $3 (5%) Total fires 1,260 (100%) 9 (100%) 54 (100%) $51 (100%) Note: See detailed notes and source information at end of table.
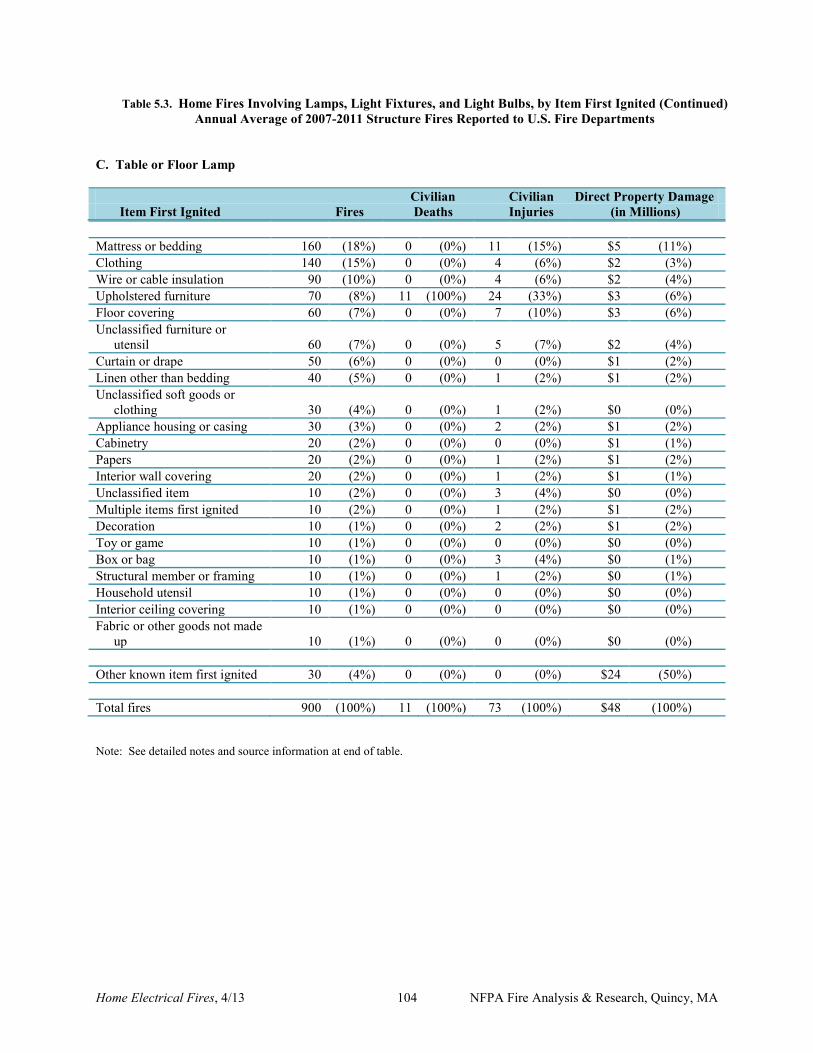
Home Electrical Fires, 4/13 104 NFPA Fire Analysis & Research, Quincy, MA
Table 5.3. Home Fires Involving Lamps, Light Fixtures, and Light Bulbs, by Item First Ignited (Continued) Annual Average of 2007-2011 Structure Fires Reported to U.S. Fire Departments
C. Table or Floor Lamp
Civilian Civilian Direct Property Damage Item First Ignited Fires Deaths Injuries (in Millions) Mattress or bedding 160 (18%) 0 (0%) 11 (15%) $5 (11%) Clothing 140 (15%) 0 (0%) 4 (6%) $2 (3%) Wire or cable insulation 90 (10%) 0 (0%) 4 (6%) $2 (4%) Upholstered furniture 70 (8%) 11 (100%) 24 (33%) $3 (6%) Floor covering 60 (7%) 0 (0%) 7 (10%) $3 (6%) Unclassified furniture or utensil 60 (7%) 0 (0%) 5 (7%) $2 (4%) Curtain or drape 50 (6%) 0 (0%) 0 (0%) $1 (2%) Linen other than bedding 40 (5%) 0 (0%) 1 (2%) $1 (2%) Unclassified soft goods or clothing 30 (4%) 0 (0%) 1 (2%) $0 (0%) Appliance housing or casing 30 (3%) 0 (0%) 2 (2%) $1 (2%) Cabinetry 20 (2%) 0 (0%) 0 (0%) $1 (1%) Papers 20 (2%) 0 (0%) 1 (2%) $1 (2%) Interior wall covering 20 (2%) 0 (0%) 1 (2%) $1 (1%) Unclassified item 10 (2%) 0 (0%) 3 (4%) $0 (0%) Multiple items first ignited 10 (2%) 0 (0%) 1 (2%) $1 (2%) Decoration 10 (1%) 0 (0%) 2 (2%) $1 (2%) Toy or game 10 (1%) 0 (0%) 0 (0%) $0 (0%) Box or bag 10 (1%) 0 (0%) 3 (4%) $0 (1%) Structural member or framing 10 (1%) 0 (0%) 1 (2%) $0 (1%) Household utensil 10 (1%) 0 (0%) 0 (0%) $0 (0%) Interior ceiling covering 10 (1%) 0 (0%) 0 (0%) $0 (0%) Fabric or other goods not made up 10 (1%) 0 (0%) 0 (0%) $0 (0%) Other known item first ignited 30 (4%) 0 (0%) 0 (0%) $24 (50%) Total fires 900 (100%) 11 (100%) 73 (100%) $48 (100%) Note: See detailed notes and source information at end of table.
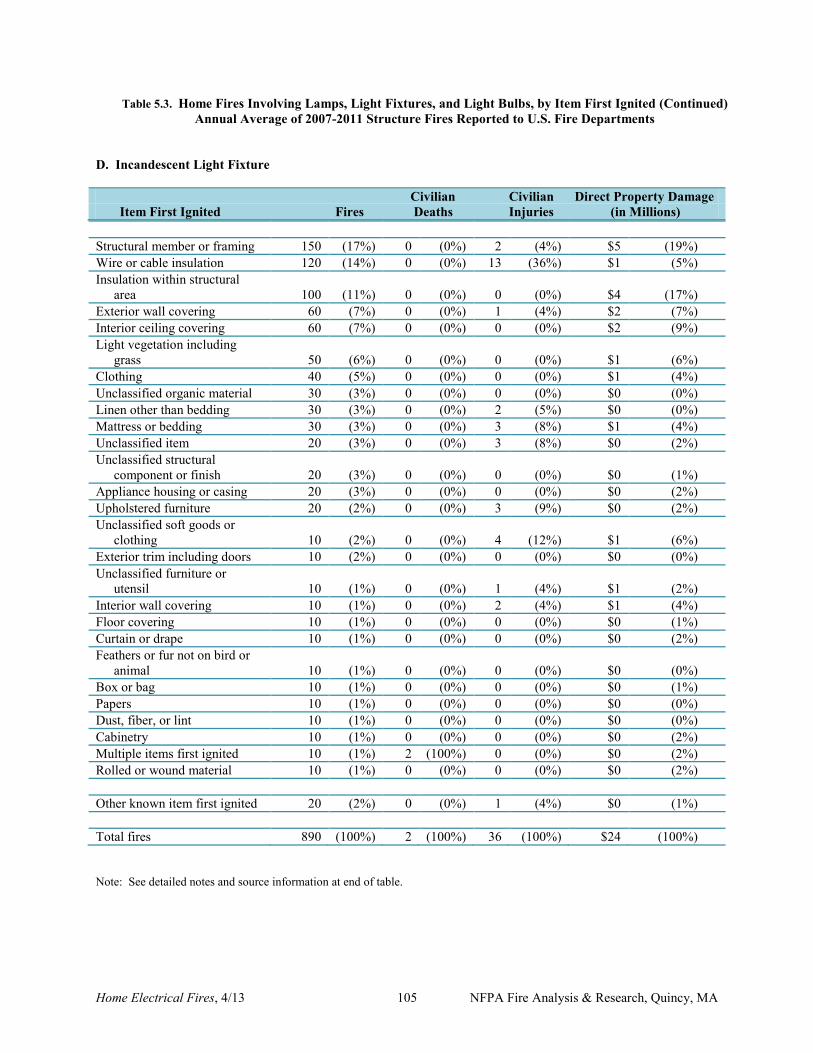
Home Electrical Fires, 4/13 105 NFPA Fire Analysis & Research, Quincy, MA
Table 5.3. Home Fires Involving Lamps, Light Fixtures, and Light Bulbs, by Item First Ignited (Continued) Annual Average of 2007-2011 Structure Fires Reported to U.S. Fire Departments
D. Incandescent Light Fixture
Civilian Civilian Direct Property Damage Item First Ignited Fires Deaths Injuries (in Millions) Structural member or framing 150 (17%) 0 (0%) 2 (4%) $5 (19%) Wire or cable insulation 120 (14%) 0 (0%) 13 (36%) $1 (5%) Insulation within structural area 100 (11%) 0 (0%) 0 (0%) $4 (17%) Exterior wall covering 60 (7%) 0 (0%) 1 (4%) $2 (7%) Interior ceiling covering 60 (7%) 0 (0%) 0 (0%) $2 (9%) Light vegetation including grass 50 (6%) 0 (0%) 0 (0%) $1 (6%) Clothing 40 (5%) 0 (0%) 0 (0%) $1 (4%) Unclassified organic material 30 (3%) 0 (0%) 0 (0%) $0 (0%) Linen other than bedding 30 (3%) 0 (0%) 2 (5%) $0 (0%) Mattress or bedding 30 (3%) 0 (0%) 3 (8%) $1 (4%) Unclassified item 20 (3%) 0 (0%) 3 (8%) $0 (2%) Unclassified structural component or finish 20 (3%) 0 (0%) 0 (0%) $0 (1%) Appliance housing or casing 20 (3%) 0 (0%) 0 (0%) $0 (2%) Upholstered furniture 20 (2%) 0 (0%) 3 (9%) $0 (2%) Unclassified soft goods or clothing 10 (2%) 0 (0%) 4 (12%) $1 (6%) Exterior trim including doors 10 (2%) 0 (0%) 0 (0%) $0 (0%) Unclassified furniture or utensil 10 (1%) 0 (0%) 1 (4%) $1 (2%) Interior wall covering 10 (1%) 0 (0%) 2 (4%) $1 (4%) Floor covering 10 (1%) 0 (0%) 0 (0%) $0 (1%) Curtain or drape 10 (1%) 0 (0%) 0 (0%) $0 (2%) Feathers or fur not on bird or animal 10 (1%) 0 (0%) 0 (0%) $0 (0%) Box or bag 10 (1%) 0 (0%) 0 (0%) $0 (1%) Papers 10 (1%) 0 (0%) 0 (0%) $0 (0%) Dust, fiber, or lint 10 (1%) 0 (0%) 0 (0%) $0 (0%) Cabinetry 10 (1%) 0 (0%) 0 (0%) $0 (2%) Multiple items first ignited 10 (1%) 2 (100%) 0 (0%) $0 (2%) Rolled or wound material 10 (1%) 0 (0%) 0 (0%) $0 (2%) Other known item first ignited 20 (2%) 0 (0%) 1 (4%) $0 (1%) Total fires 890 (100%) 2 (100%) 36 (100%) $24 (100%) Note: See detailed notes and source information at end of table.
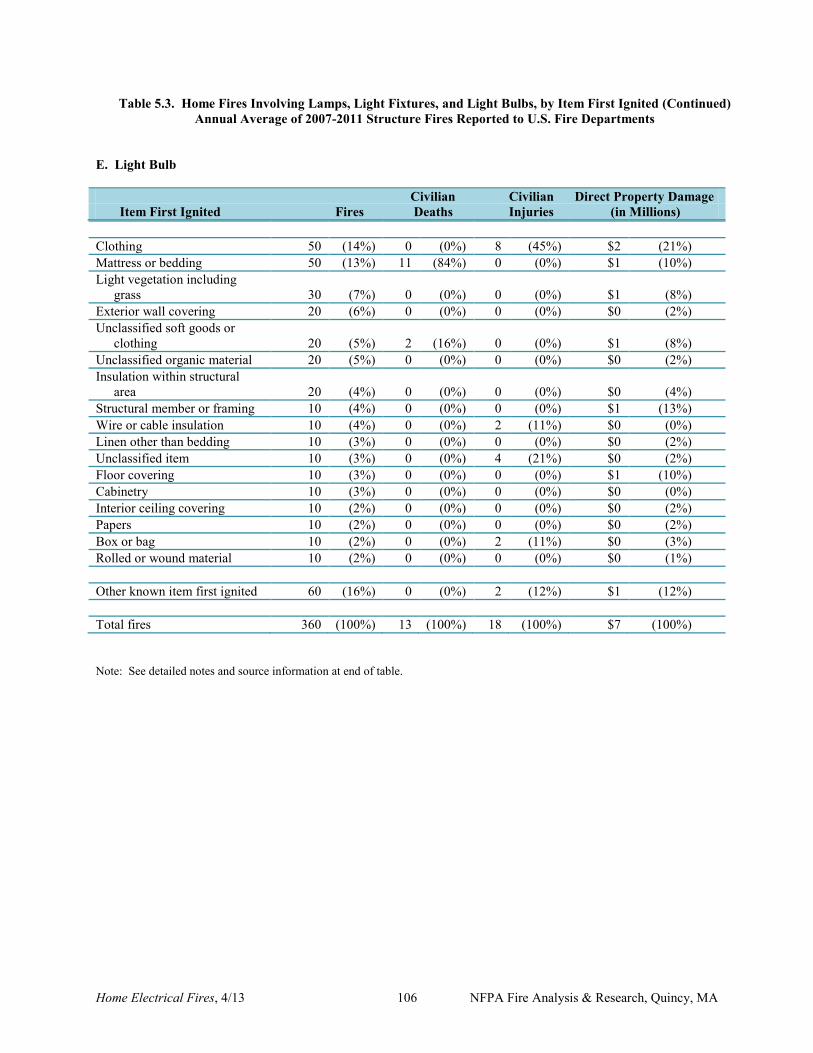
Home Electrical Fires, 4/13 106 NFPA Fire Analysis & Research, Quincy, MA
Table 5.3. Home Fires Involving Lamps, Light Fixtures, and Light Bulbs, by Item First Ignited (Continued) Annual Average of 2007-2011 Structure Fires Reported to U.S. Fire Departments
E. Light Bulb
Civilian Civilian Direct Property Damage Item First Ignited Fires Deaths Injuries (in Millions) Clothing 50 (14%) 0 (0%) 8 (45%) $2 (21%) Mattress or bedding 50 (13%) 11 (84%) 0 (0%) $1 (10%) Light vegetation including grass 30 (7%) 0 (0%) 0 (0%) $1 (8%) Exterior wall covering 20 (6%) 0 (0%) 0 (0%) $0 (2%) Unclassified soft goods or clothing 20 (5%) 2 (16%) 0 (0%) $1 (8%) Unclassified organic material 20 (5%) 0 (0%) 0 (0%) $0 (2%) Insulation within structural area 20 (4%) 0 (0%) 0 (0%) $0 (4%) Structural member or framing 10 (4%) 0 (0%) 0 (0%) $1 (13%) Wire or cable insulation 10 (4%) 0 (0%) 2 (11%) $0 (0%) Linen other than bedding 10 (3%) 0 (0%) 0 (0%) $0 (2%) Unclassified item 10 (3%) 0 (0%) 4 (21%) $0 (2%) Floor covering 10 (3%) 0 (0%) 0 (0%) $1 (10%) Cabinetry 10 (3%) 0 (0%) 0 (0%) $0 (0%) Interior ceiling covering 10 (2%) 0 (0%) 0 (0%) $0 (2%) Papers 10 (2%) 0 (0%) 0 (0%) $0 (2%) Box or bag 10 (2%) 0 (0%) 2 (11%) $0 (3%) Rolled or wound material 10 (2%) 0 (0%) 0 (0%) $0 (1%) Other known item first ignited 60 (16%) 0 (0%) 2 (12%) $1 (12%) Total fires 360 (100%) 13 (100%) 18 (100%) $7 (100%) Note: See detailed notes and source information at end of table.
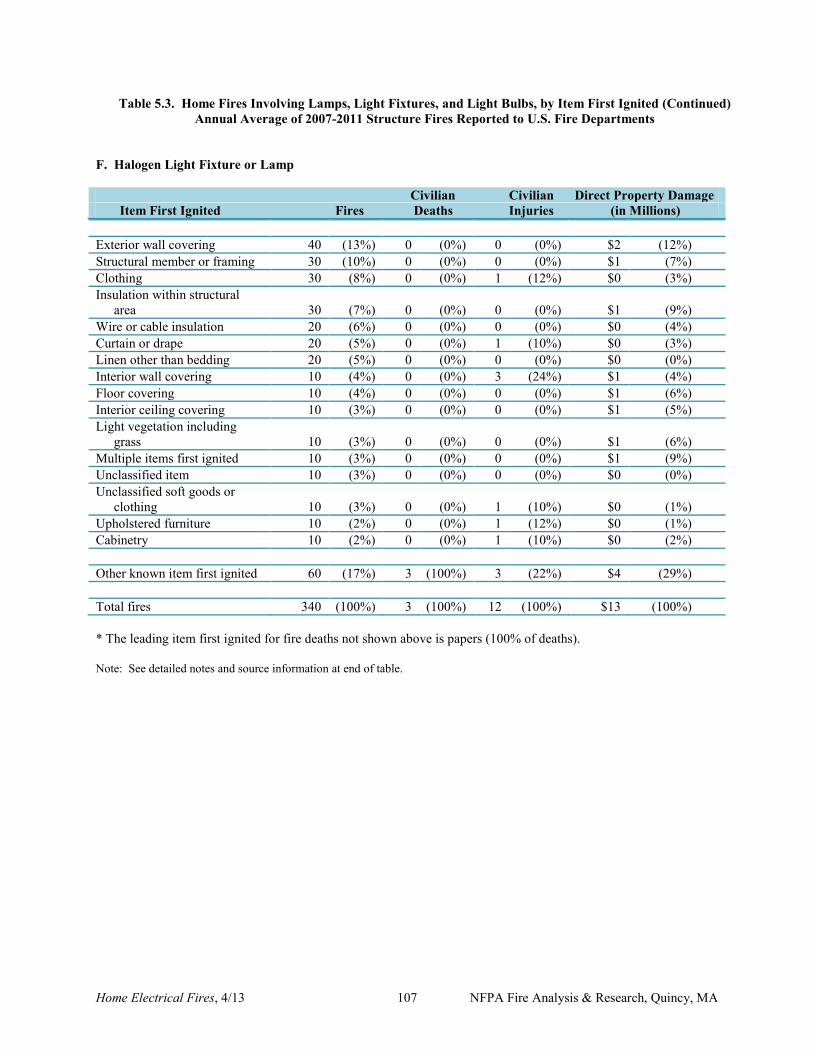
Home Electrical Fires, 4/13 107 NFPA Fire Analysis & Research, Quincy, MA
Table 5.3. Home Fires Involving Lamps, Light Fixtures, and Light Bulbs, by Item First Ignited (Continued) Annual Average of 2007-2011 Structure Fires Reported to U.S. Fire Departments
F. Halogen Light Fixture or Lamp Civilian Civilian Direct Property Damage Item First Ignited Fires Deaths Injuries (in Millions) Exterior wall covering 40 (13%) 0 (0%) 0 (0%) $2 (12%) Structural member or framing 30 (10%) 0 (0%) 0 (0%) $1 (7%) Clothing 30 (8%) 0 (0%) 1 (12%) $0 (3%) Insulation within structural area 30 (7%) 0 (0%) 0 (0%) $1 (9%) Wire or cable insulation 20 (6%) 0 (0%) 0 (0%) $0 (4%) Curtain or drape 20 (5%) 0 (0%) 1 (10%) $0 (3%) Linen other than bedding 20 (5%) 0 (0%) 0 (0%) $0 (0%) Interior wall covering 10 (4%) 0 (0%) 3 (24%) $1 (4%) Floor covering 10 (4%) 0 (0%) 0 (0%) $1 (6%) Interior ceiling covering 10 (3%) 0 (0%) 0 (0%) $1 (5%) Light vegetation including grass 10 (3%) 0 (0%) 0 (0%) $1 (6%) Multiple items first ignited 10 (3%) 0 (0%) 0 (0%) $1 (9%) Unclassified item 10 (3%) 0 (0%) 0 (0%) $0 (0%) Unclassified soft goods or clothing 10 (3%) 0 (0%) 1 (10%) $0 (1%) Upholstered furniture 10 (2%) 0 (0%) 1 (12%) $0 (1%) Cabinetry 10 (2%) 0 (0%) 1 (10%) $0 (2%) Other known item first ignited 60 (17%) 3 (100%) 3 (22%) $4 (29%) Total fires 340 (100%) 3 (100%) 12 (100%) $13 (100%) * The leading item first ignited for fire deaths not shown above is papers (100% of deaths). Note: See detailed notes and source information at end of table.
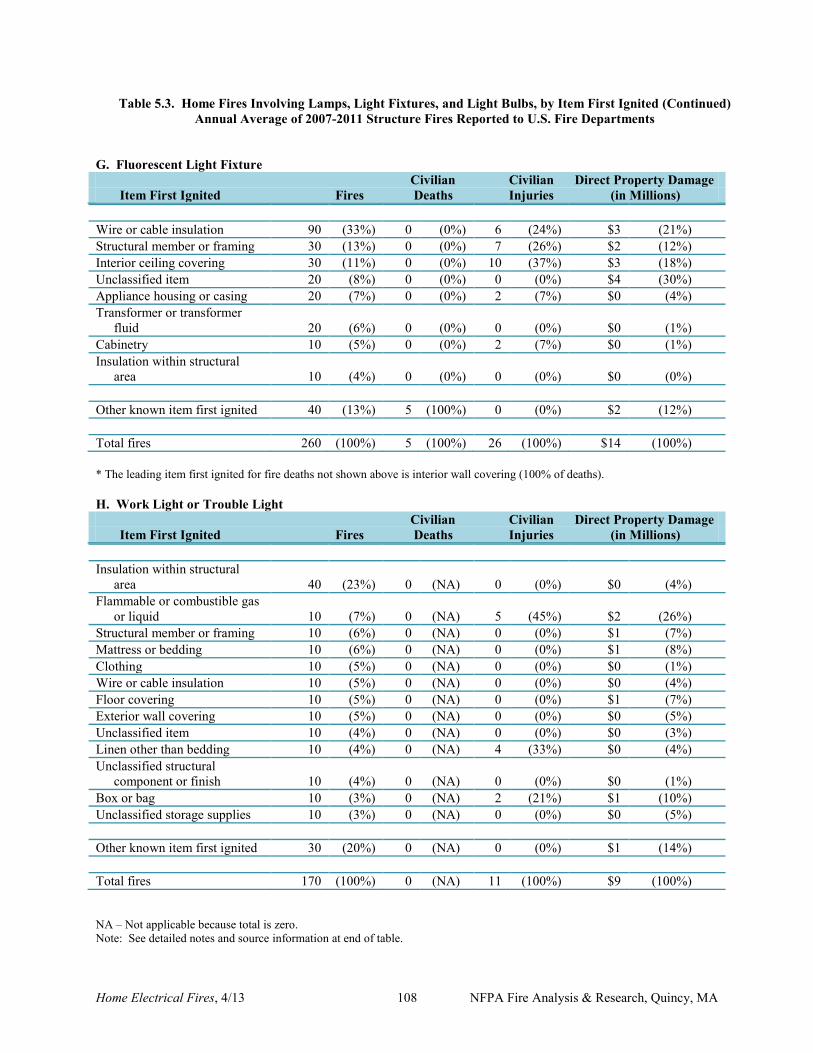
Home Electrical Fires, 4/13 108 NFPA Fire Analysis & Research, Quincy, MA
Table 5.3. Home Fires Involving Lamps, Light Fixtures, and Light Bulbs, by Item First Ignited (Continued) Annual Average of 2007-2011 Structure Fires Reported to U.S. Fire Departments
G. Fluorescent Light Fixture Civilian Civilian Direct Property Damage Item First Ignited Fires Deaths Injuries (in Millions) Wire or cable insulation 90 (33%) 0 (0%) 6 (24%) $3 (21%) Structural member or framing 30 (13%) 0 (0%) 7 (26%) $2 (12%) Interior ceiling covering 30 (11%) 0 (0%) 10 (37%) $3 (18%) Unclassified item 20 (8%) 0 (0%) 0 (0%) $4 (30%) Appliance housing or casing 20 (7%) 0 (0%) 2 (7%) $0 (4%) Transformer or transformer fluid 20 (6%) 0 (0%) 0 (0%) $0 (1%) Cabinetry 10 (5%) 0 (0%) 2 (7%) $0 (1%) Insulation within structural area 10 (4%) 0 (0%) 0 (0%) $0 (0%) Other known item first ignited 40 (13%) 5 (100%) 0 (0%) $2 (12%) Total fires 260 (100%) 5 (100%) 26 (100%) $14 (100%) * The leading item first ignited for fire deaths not shown above is interior wall covering (100% of deaths). H. Work Light or Trouble Light Civilian Civilian Direct Property Damage Item First Ignited Fires Deaths Injuries (in Millions) Insulation within structural area 40 (23%) 0 (NA) 0 (0%) $0 (4%) Flammable or combustible gas or liquid 10 (7%) 0 (NA) 5 (45%) $2 (26%) Structural member or framing 10 (6%) 0 (NA) 0 (0%) $1 (7%) Mattress or bedding 10 (6%) 0 (NA) 0 (0%) $1 (8%) Clothing 10 (5%) 0 (NA) 0 (0%) $0 (1%) Wire or cable insulation 10 (5%) 0 (NA) 0 (0%) $0 (4%) Floor covering 10 (5%) 0 (NA) 0 (0%) $1 (7%) Exterior wall covering 10 (5%) 0 (NA) 0 (0%) $0 (5%) Unclassified item 10 (4%) 0 (NA) 0 (0%) $0 (3%) Linen other than bedding 10 (4%) 0 (NA) 4 (33%) $0 (4%) Unclassified structural component or finish 10 (4%) 0 (NA) 0 (0%) $0 (1%) Box or bag 10 (3%) 0 (NA) 2 (21%) $1 (10%) Unclassified storage supplies 10 (3%) 0 (NA) 0 (0%) $0 (5%) Other known item first ignited 30 (20%) 0 (NA) 0 (0%) $1 (14%) Total fires 170 (100%) 0 (NA) 11 (100%) $9 (100%) NA – Not applicable because total is zero. Note: See detailed notes and source information at end of table.
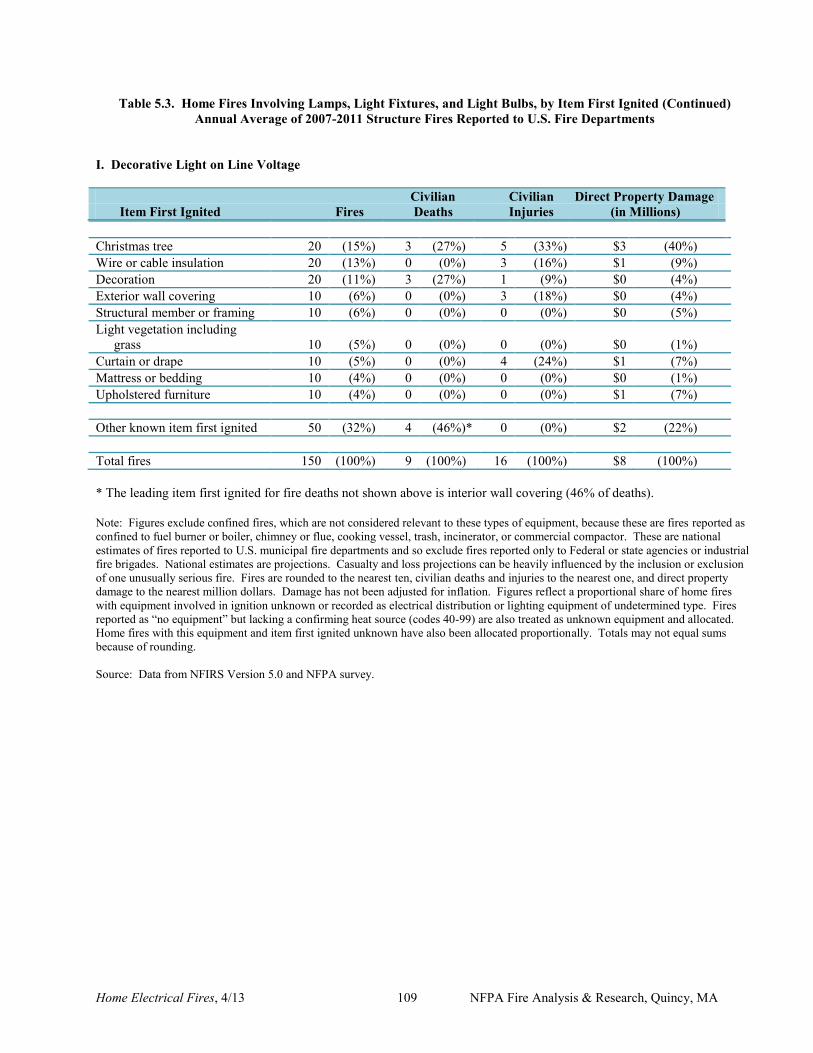
Home Electrical Fires, 4/13 109 NFPA Fire Analysis & Research, Quincy, MA
Table 5.3. Home Fires Involving Lamps, Light Fixtures, and Light Bulbs, by Item First Ignited (Continued) Annual Average of 2007-2011 Structure Fires Reported to U.S. Fire Departments
I. Decorative Light on Line Voltage
Civilian Civilian Direct Property Damage Item First Ignited Fires Deaths Injuries (in Millions) Christmas tree 20 (15%) 3 (27%) 5 (33%) $3 (40%) Wire or cable insulation 20 (13%) 0 (0%) 3 (16%) $1 (9%) Decoration 20 (11%) 3 (27%) 1 (9%) $0 (4%) Exterior wall covering 10 (6%) 0 (0%) 3 (18%) $0 (4%) Structural member or framing 10 (6%) 0 (0%) 0 (0%) $0 (5%) Light vegetation including grass 10 (5%) 0 (0%) 0 (0%) $0 (1%) Curtain or drape 10 (5%) 0 (0%) 4 (24%) $1 (7%) Mattress or bedding 10 (4%) 0 (0%) 0 (0%) $0 (1%) Upholstered furniture 10 (4%) 0 (0%) 0 (0%) $1 (7%) Other known item first ignited 50 (32%) 4 (46%)* 0 (0%) $2 (22%) Total fires 150 (100%) 9 (100%) 16 (100%) $8 (100%) * The leading item first ignited for fire deaths not shown above is interior wall covering (46% of deaths). Note: Figures exclude confined fires, which are not considered relevant to these types of equipment, because these are fires reported as confined to fuel burner or boiler, chimney or flue, cooking vessel, trash, incinerator, or commercial compactor. These are national estimates of fires reported to U.S. municipal fire departments and so exclude fires reported only to Federal or state agencies or industrial fire brigades. National estimates are projections. Casualty and loss projections can be heavily influenced by the inclusion or exclusion of one unusually serious fire. Fires are rounded to the nearest ten, civilian deaths and injuries to the nearest one, and direct property damage to the nearest million dollars. Damage has not been adjusted for inflation. Figures reflect a proportional share of home fires with equipment involved in ignition unknown or recorded as electrical distribution or lighting equipment of undetermined type. Fires reported as “no equipment” but lacking a confirming heat source (codes 40-99) are also treated as unknown equipment and allocated. Home fires with this equipment and item first ignited unknown have also been allocated proportionally. Totals may not equal sums because of rounding. Source: Data from NFIRS Version 5.0 and NFPA survey.
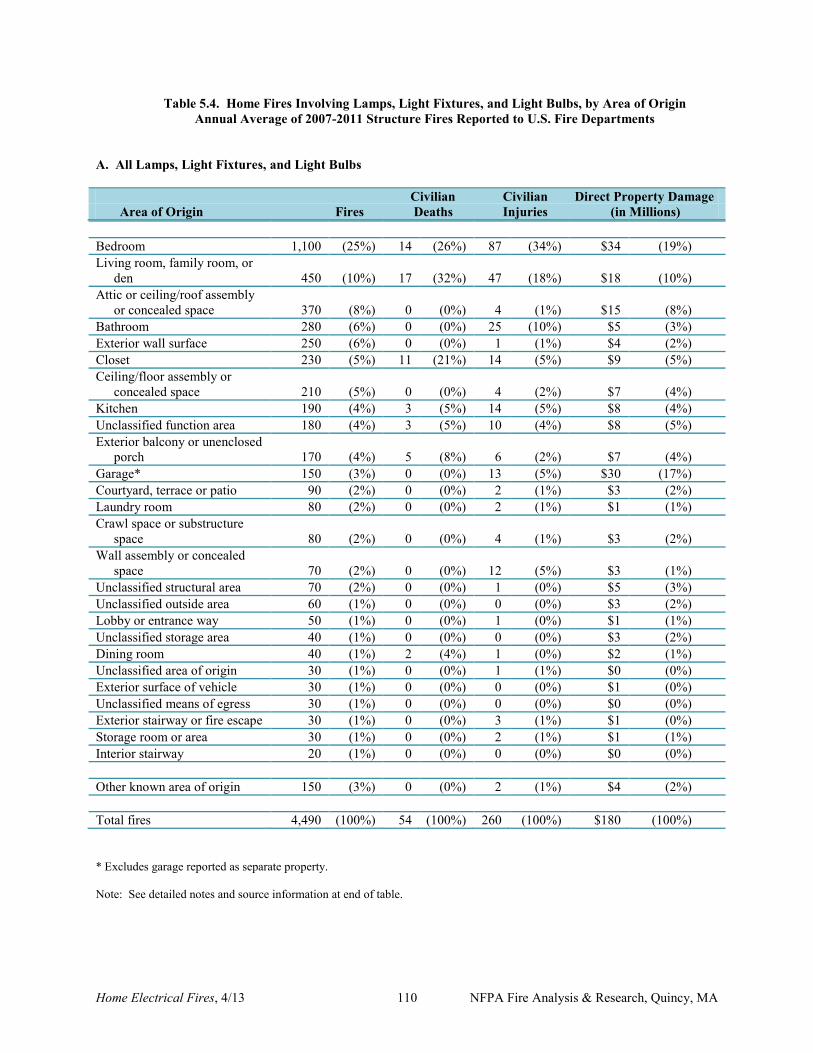
Home Electrical Fires, 4/13 110 NFPA Fire Analysis & Research, Quincy, MA
Table 5.4. Home Fires Involving Lamps, Light Fixtures, and Light Bulbs, by Area of Origin Annual Average of 2007-2011 Structure Fires Reported to U.S. Fire Departments
A. All Lamps, Light Fixtures, and Light Bulbs
Civilian Civilian Direct Property Damage Area of Origin Fires Deaths Injuries (in Millions) Bedroom 1,100 (25%) 14 (26%) 87 (34%) $34 (19%) Living room, family room, or den 450 (10%) 17 (32%) 47 (18%) $18 (10%) Attic or ceiling/roof assembly or concealed space 370 (8%) 0 (0%) 4 (1%) $15 (8%) Bathroom 280 (6%) 0 (0%) 25 (10%) $5 (3%) Exterior wall surface 250 (6%) 0 (0%) 1 (1%) $4 (2%) Closet 230 (5%) 11 (21%) 14 (5%) $9 (5%) Ceiling/floor assembly or concealed space 210 (5%) 0 (0%) 4 (2%) $7 (4%) Kitchen 190 (4%) 3 (5%) 14 (5%) $8 (4%) Unclassified function area 180 (4%) 3 (5%) 10 (4%) $8 (5%) Exterior balcony or unenclosed porch 170 (4%) 5 (8%) 6 (2%) $7 (4%) Garage* 150 (3%) 0 (0%) 13 (5%) $30 (17%) Courtyard, terrace or patio 90 (2%) 0 (0%) 2 (1%) $3 (2%) Laundry room 80 (2%) 0 (0%) 2 (1%) $1 (1%) Crawl space or substructure space 80 (2%) 0 (0%) 4 (1%) $3 (2%) Wall assembly or concealed space 70 (2%) 0 (0%) 12 (5%) $3 (1%) Unclassified structural area 70 (2%) 0 (0%) 1 (0%) $5 (3%) Unclassified outside area 60 (1%) 0 (0%) 0 (0%) $3 (2%) Lobby or entrance way 50 (1%) 0 (0%) 1 (0%) $1 (1%) Unclassified storage area 40 (1%) 0 (0%) 0 (0%) $3 (2%) Dining room 40 (1%) 2 (4%) 1 (0%) $2 (1%) Unclassified area of origin 30 (1%) 0 (0%) 1 (1%) $0 (0%) Exterior surface of vehicle 30 (1%) 0 (0%) 0 (0%) $1 (0%) Unclassified means of egress 30 (1%) 0 (0%) 0 (0%) $0 (0%) Exterior stairway or fire escape 30 (1%) 0 (0%) 3 (1%) $1 (0%) Storage room or area 30 (1%) 0 (0%) 2 (1%) $1 (1%) Interior stairway 20 (1%) 0 (0%) 0 (0%) $0 (0%) Other known area of origin 150 (3%) 0 (0%) 2 (1%) $4 (2%) Total fires 4,490 (100%) 54 (100%) 260 (100%) $180 (100%) * Excludes garage reported as separate property. Note: See detailed notes and source information at end of table.
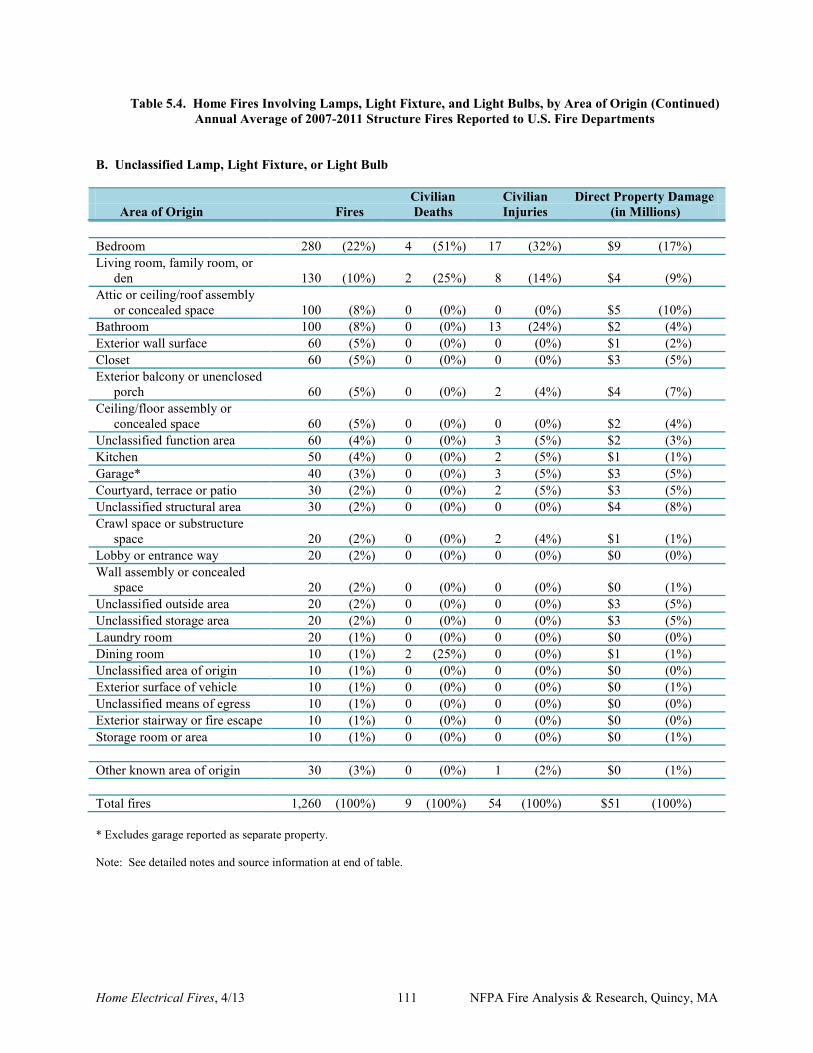
Home Electrical Fires, 4/13 111 NFPA Fire Analysis & Research, Quincy, MA
Table 5.4. Home Fires Involving Lamps, Light Fixture, and Light Bulbs, by Area of Origin (Continued) Annual Average of 2007-2011 Structure Fires Reported to U.S. Fire Departments
B. Unclassified Lamp, Light Fixture, or Light Bulb
Civilian Civilian Direct Property Damage Area of Origin Fires Deaths Injuries (in Millions) Bedroom 280 (22%) 4 (51%) 17 (32%) $9 (17%) Living room, family room, or den 130 (10%) 2 (25%) 8 (14%) $4 (9%) Attic or ceiling/roof assembly or concealed space 100 (8%) 0 (0%) 0 (0%) $5 (10%) Bathroom 100 (8%) 0 (0%) 13 (24%) $2 (4%) Exterior wall surface 60 (5%) 0 (0%) 0 (0%) $1 (2%) Closet 60 (5%) 0 (0%) 0 (0%) $3 (5%) Exterior balcony or unenclosed porch 60 (5%) 0 (0%) 2 (4%) $4 (7%) Ceiling/floor assembly or concealed space 60 (5%) 0 (0%) 0 (0%) $2 (4%) Unclassified function area 60 (4%) 0 (0%) 3 (5%) $2 (3%) Kitchen 50 (4%) 0 (0%) 2 (5%) $1 (1%) Garage* 40 (3%) 0 (0%) 3 (5%) $3 (5%) Courtyard, terrace or patio 30 (2%) 0 (0%) 2 (5%) $3 (5%) Unclassified structural area 30 (2%) 0 (0%) 0 (0%) $4 (8%) Crawl space or substructure space 20 (2%) 0 (0%) 2 (4%) $1 (1%) Lobby or entrance way 20 (2%) 0 (0%) 0 (0%) $0 (0%) Wall assembly or concealed space 20 (2%) 0 (0%) 0 (0%) $0 (1%) Unclassified outside area 20 (2%) 0 (0%) 0 (0%) $3 (5%) Unclassified storage area 20 (2%) 0 (0%) 0 (0%) $3 (5%) Laundry room 20 (1%) 0 (0%) 0 (0%) $0 (0%) Dining room 10 (1%) 2 (25%) 0 (0%) $1 (1%) Unclassified area of origin 10 (1%) 0 (0%) 0 (0%) $0 (0%) Exterior surface of vehicle 10 (1%) 0 (0%) 0 (0%) $0 (1%) Unclassified means of egress 10 (1%) 0 (0%) 0 (0%) $0 (0%) Exterior stairway or fire escape 10 (1%) 0 (0%) 0 (0%) $0 (0%) Storage room or area 10 (1%) 0 (0%) 0 (0%) $0 (1%) Other known area of origin 30 (3%) 0 (0%) 1 (2%) $0 (1%) Total fires 1,260 (100%) 9 (100%) 54 (100%) $51 (100%) * Excludes garage reported as separate property. Note: See detailed notes and source information at end of table.
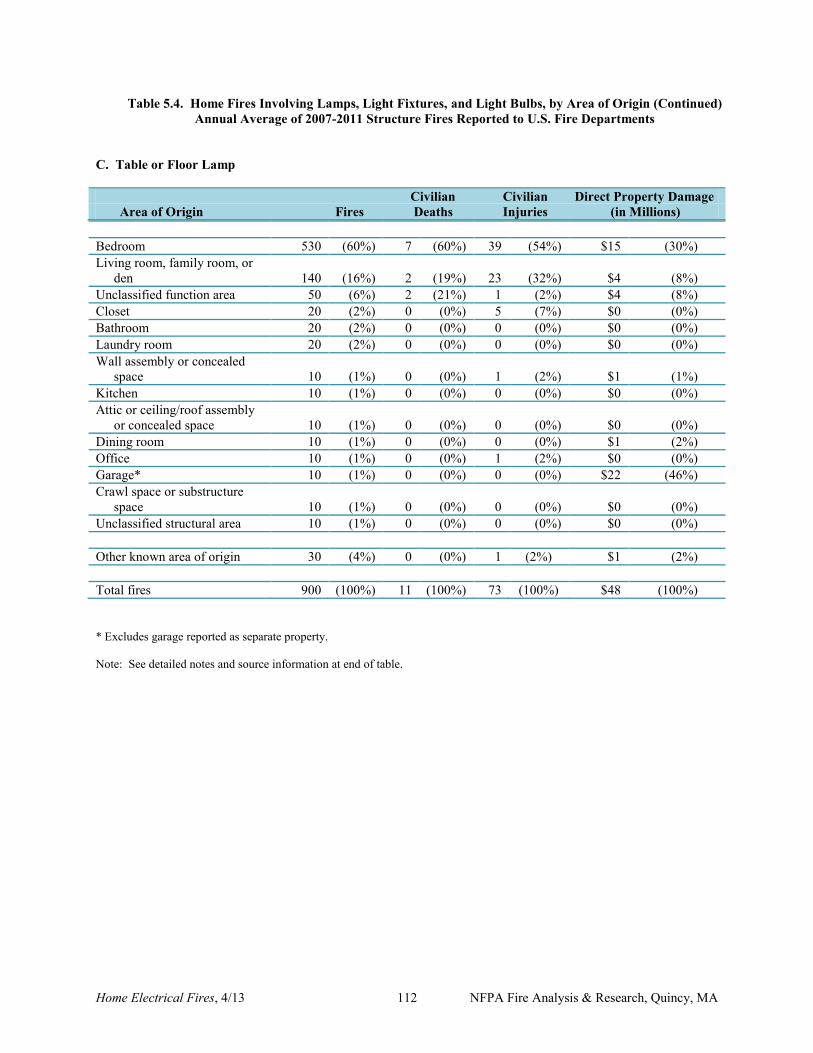
Home Electrical Fires, 4/13 112 NFPA Fire Analysis & Research, Quincy, MA
Table 5.4. Home Fires Involving Lamps, Light Fixtures, and Light Bulbs, by Area of Origin (Continued) Annual Average of 2007-2011 Structure Fires Reported to U.S. Fire Departments
C. Table or Floor Lamp
Civilian Civilian Direct Property Damage Area of Origin Fires Deaths Injuries (in Millions) Bedroom 530 (60%) 7 (60%) 39 (54%) $15 (30%) Living room, family room, or den 140 (16%) 2 (19%) 23 (32%) $4 (8%) Unclassified function area 50 (6%) 2 (21%) 1 (2%) $4 (8%) Closet 20 (2%) 0 (0%) 5 (7%) $0 (0%) Bathroom 20 (2%) 0 (0%) 0 (0%) $0 (0%) Laundry room 20 (2%) 0 (0%) 0 (0%) $0 (0%) Wall assembly or concealed space 10 (1%) 0 (0%) 1 (2%) $1 (1%) Kitchen 10 (1%) 0 (0%) 0 (0%) $0 (0%) Attic or ceiling/roof assembly or concealed space 10 (1%) 0 (0%) 0 (0%) $0 (0%) Dining room 10 (1%) 0 (0%) 0 (0%) $1 (2%) Office 10 (1%) 0 (0%) 1 (2%) $0 (0%) Garage* 10 (1%) 0 (0%) 0 (0%) $22 (46%) Crawl space or substructure space 10 (1%) 0 (0%) 0 (0%) $0 (0%) Unclassified structural area 10 (1%) 0 (0%) 0 (0%) $0 (0%) Other known area of origin 30 (4%) 0 (0%) 1 (2%) $1 (2%) Total fires 900 (100%) 11 (100%) 73 (100%) $48 (100%) * Excludes garage reported as separate property. Note: See detailed notes and source information at end of table.
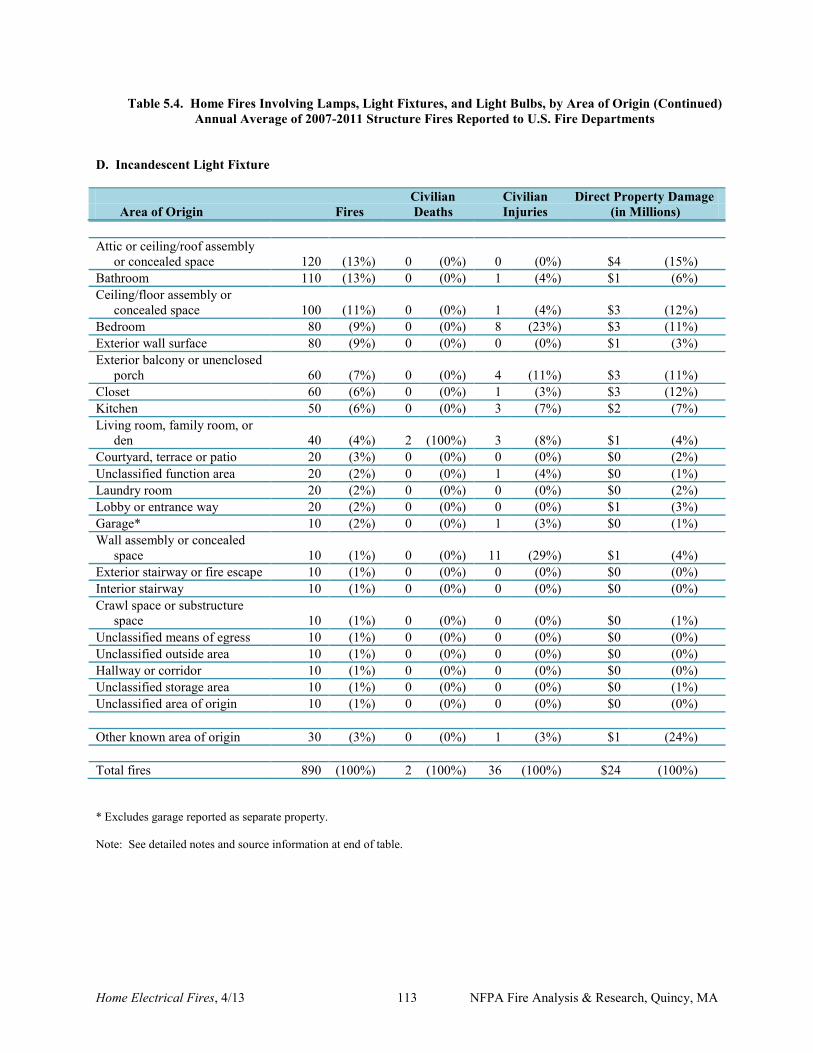
Home Electrical Fires, 4/13 113 NFPA Fire Analysis & Research, Quincy, MA
Table 5.4. Home Fires Involving Lamps, Light Fixtures, and Light Bulbs, by Area of Origin (Continued) Annual Average of 2007-2011 Structure Fires Reported to U.S. Fire Departments
D. Incandescent Light Fixture
Civilian Civilian Direct Property Damage Area of Origin Fires Deaths Injuries (in Millions) Attic or ceiling/roof assembly or concealed space 120 (13%) 0 (0%) 0 (0%) $4 (15%) Bathroom 110 (13%) 0 (0%) 1 (4%) $1 (6%) Ceiling/floor assembly or concealed space 100 (11%) 0 (0%) 1 (4%) $3 (12%) Bedroom 80 (9%) 0 (0%) 8 (23%) $3 (11%) Exterior wall surface 80 (9%) 0 (0%) 0 (0%) $1 (3%) Exterior balcony or unenclosed porch 60 (7%) 0 (0%) 4 (11%) $3 (11%) Closet 60 (6%) 0 (0%) 1 (3%) $3 (12%) Kitchen 50 (6%) 0 (0%) 3 (7%) $2 (7%) Living room, family room, or den 40 (4%) 2 (100%) 3 (8%) $1 (4%) Courtyard, terrace or patio 20 (3%) 0 (0%) 0 (0%) $0 (2%) Unclassified function area 20 (2%) 0 (0%) 1 (4%) $0 (1%) Laundry room 20 (2%) 0 (0%) 0 (0%) $0 (2%) Lobby or entrance way 20 (2%) 0 (0%) 0 (0%) $1 (3%) Garage* 10 (2%) 0 (0%) 1 (3%) $0 (1%) Wall assembly or concealed space 10 (1%) 0 (0%) 11 (29%) $1 (4%) Exterior stairway or fire escape 10 (1%) 0 (0%) 0 (0%) $0 (0%) Interior stairway 10 (1%) 0 (0%) 0 (0%) $0 (0%) Crawl space or substructure space 10 (1%) 0 (0%) 0 (0%) $0 (1%) Unclassified means of egress 10 (1%) 0 (0%) 0 (0%) $0 (0%) Unclassified outside area 10 (1%) 0 (0%) 0 (0%) $0 (0%) Hallway or corridor 10 (1%) 0 (0%) 0 (0%) $0 (0%) Unclassified storage area 10 (1%) 0 (0%) 0 (0%) $0 (1%) Unclassified area of origin 10 (1%) 0 (0%) 0 (0%) $0 (0%) Other known area of origin 30 (3%) 0 (0%) 1 (3%) $1 (24%) Total fires 890 (100%) 2 (100%) 36 (100%) $24 (100%) * Excludes garage reported as separate property. Note: See detailed notes and source information at end of table.
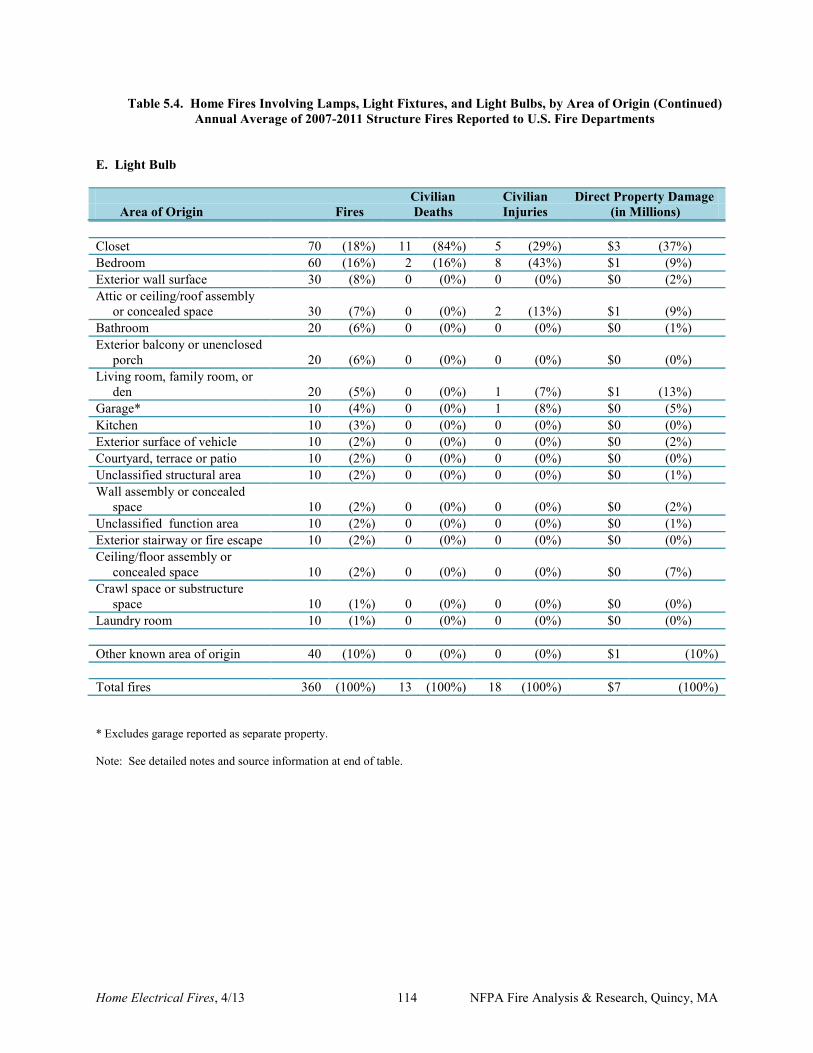
Home Electrical Fires, 4/13 114 NFPA Fire Analysis & Research, Quincy, MA
Table 5.4. Home Fires Involving Lamps, Light Fixtures, and Light Bulbs, by Area of Origin (Continued) Annual Average of 2007-2011 Structure Fires Reported to U.S. Fire Departments
E. Light Bulb
Civilian Civilian Direct Property Damage Area of Origin Fires Deaths Injuries (in Millions) Closet 70 (18%) 11 (84%) 5 (29%) $3 (37%) Bedroom 60 (16%) 2 (16%) 8 (43%) $1 (9%) Exterior wall surface 30 (8%) 0 (0%) 0 (0%) $0 (2%) Attic or ceiling/roof assembly or concealed space 30 (7%) 0 (0%) 2 (13%) $1 (9%) Bathroom 20 (6%) 0 (0%) 0 (0%) $0 (1%) Exterior balcony or unenclosed porch 20 (6%) 0 (0%) 0 (0%) $0 (0%) Living room, family room, or den 20 (5%) 0 (0%) 1 (7%) $1 (13%) Garage* 10 (4%) 0 (0%) 1 (8%) $0 (5%) Kitchen 10 (3%) 0 (0%) 0 (0%) $0 (0%) Exterior surface of vehicle 10 (2%) 0 (0%) 0 (0%) $0 (2%) Courtyard, terrace or patio 10 (2%) 0 (0%) 0 (0%) $0 (0%) Unclassified structural area 10 (2%) 0 (0%) 0 (0%) $0 (1%) Wall assembly or concealed space 10 (2%) 0 (0%) 0 (0%) $0 (2%) Unclassified function area 10 (2%) 0 (0%) 0 (0%) $0 (1%) Exterior stairway or fire escape 10 (2%) 0 (0%) 0 (0%) $0 (0%) Ceiling/floor assembly or concealed space 10 (2%) 0 (0%) 0 (0%) $0 (7%) Crawl space or substructure space 10 (1%) 0 (0%) 0 (0%) $0 (0%) Laundry room 10 (1%) 0 (0%) 0 (0%) $0 (0%) Other known area of origin 40 (10%) 0 (0%) 0 (0%) $1 (10%) Total fires 360 (100%) 13 (100%) 18 (100%) $7 (100%) * Excludes garage reported as separate property. Note: See detailed notes and source information at end of table.
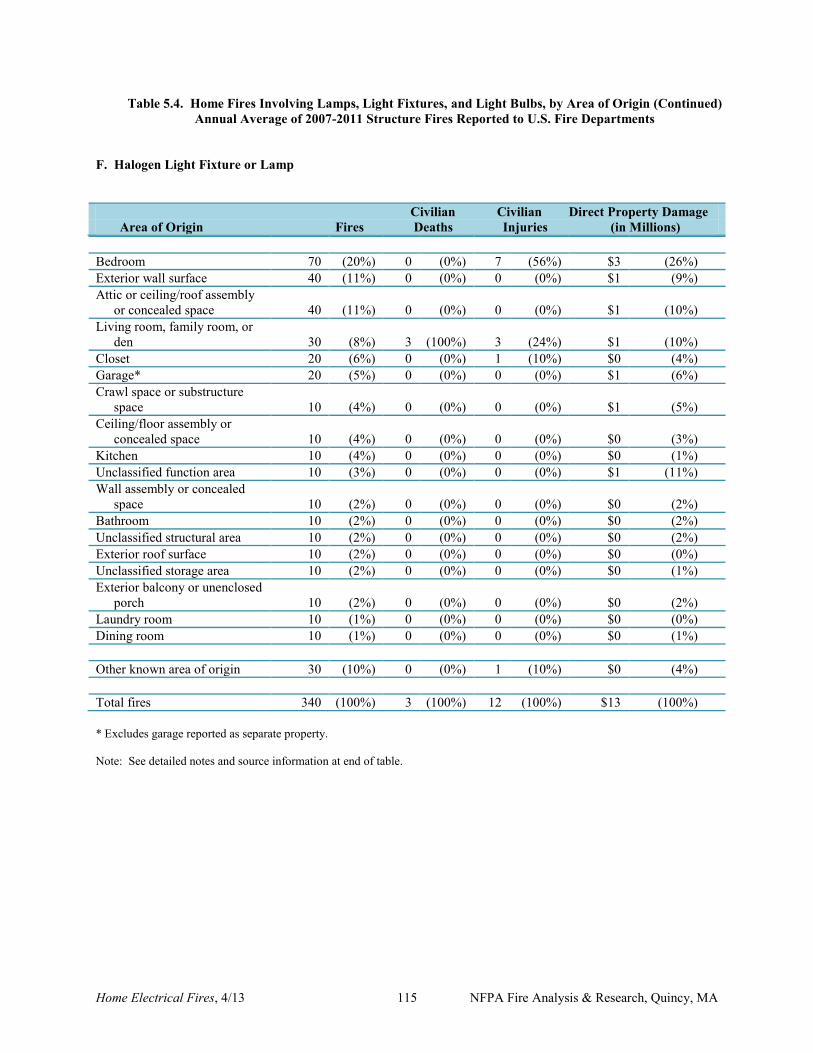
Home Electrical Fires, 4/13 115 NFPA Fire Analysis & Research, Quincy, MA
Table 5.4. Home Fires Involving Lamps, Light Fixtures, and Light Bulbs, by Area of Origin (Continued) Annual Average of 2007-2011 Structure Fires Reported to U.S. Fire Departments
F. Halogen Light Fixture or Lamp
Civilian Civilian Direct Property Damage Area of Origin Fires Deaths Injuries (in Millions) Bedroom 70 (20%) 0 (0%) 7 (56%) $3 (26%) Exterior wall surface 40 (11%) 0 (0%) 0 (0%) $1 (9%) Attic or ceiling/roof assembly or concealed space 40 (11%) 0 (0%) 0 (0%) $1 (10%) Living room, family room, or den 30 (8%) 3 (100%) 3 (24%) $1 (10%) Closet 20 (6%) 0 (0%) 1 (10%) $0 (4%) Garage* 20 (5%) 0 (0%) 0 (0%) $1 (6%) Crawl space or substructure space 10 (4%) 0 (0%) 0 (0%) $1 (5%) Ceiling/floor assembly or concealed space 10 (4%) 0 (0%) 0 (0%) $0 (3%) Kitchen 10 (4%) 0 (0%) 0 (0%) $0 (1%) Unclassified function area 10 (3%) 0 (0%) 0 (0%) $1 (11%) Wall assembly or concealed space 10 (2%) 0 (0%) 0 (0%) $0 (2%) Bathroom 10 (2%) 0 (0%) 0 (0%) $0 (2%) Unclassified structural area 10 (2%) 0 (0%) 0 (0%) $0 (2%) Exterior roof surface 10 (2%) 0 (0%) 0 (0%) $0 (0%) Unclassified storage area 10 (2%) 0 (0%) 0 (0%) $0 (1%) Exterior balcony or unenclosed porch 10 (2%) 0 (0%) 0 (0%) $0 (2%) Laundry room 10 (1%) 0 (0%) 0 (0%) $0 (0%) Dining room 10 (1%) 0 (0%) 0 (0%) $0 (1%) Other known area of origin 30 (10%) 0 (0%) 1 (10%) $0 (4%) Total fires 340 (100%) 3 (100%) 12 (100%) $13 (100%) * Excludes garage reported as separate property. Note: See detailed notes and source information at end of table.
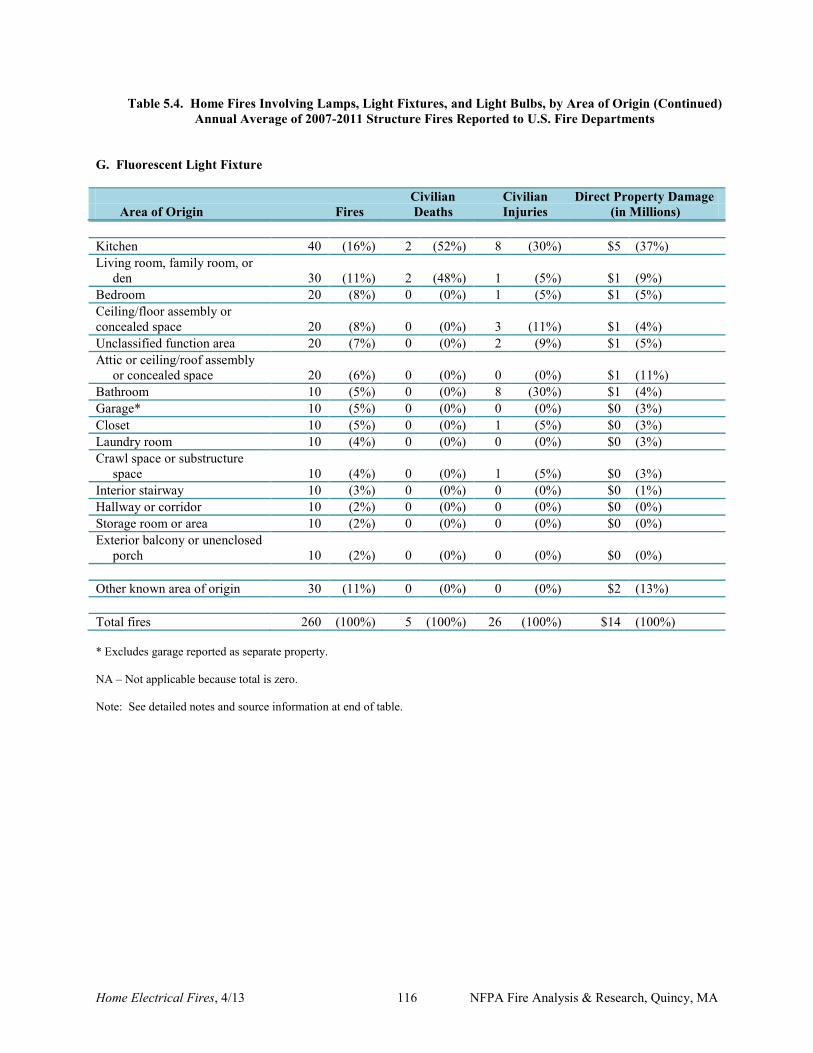
Home Electrical Fires, 4/13 116 NFPA Fire Analysis & Research, Quincy, MA
Table 5.4. Home Fires Involving Lamps, Light Fixtures, and Light Bulbs, by Area of Origin (Continued) Annual Average of 2007-2011 Structure Fires Reported to U.S. Fire Departments
G. Fluorescent Light Fixture Civilian Civilian Direct Property Damage Area of Origin Fires Deaths Injuries (in Millions) Kitchen 40 (16%) 2 (52%) 8 (30%) $5 (37%) Living room, family room, or den 30 (11%) 2 (48%) 1 (5%) $1 (9%) Bedroom 20 (8%) 0 (0%) 1 (5%) $1 (5%) Ceiling/floor assembly or concealed space 20 (8%) 0 (0%) 3 (11%) $1 (4%) Unclassified function area 20 (7%) 0 (0%) 2 (9%) $1 (5%) Attic or ceiling/roof assembly or concealed space 20 (6%) 0 (0%) 0 (0%) $1 (11%) Bathroom 10 (5%) 0 (0%) 8 (30%) $1 (4%) Garage* 10 (5%) 0 (0%) 0 (0%) $0 (3%) Closet 10 (5%) 0 (0%) 1 (5%) $0 (3%) Laundry room 10 (4%) 0 (0%) 0 (0%) $0 (3%) Crawl space or substructure space 10 (4%) 0 (0%) 1 (5%) $0 (3%) Interior stairway 10 (3%) 0 (0%) 0 (0%) $0 (1%) Hallway or corridor 10 (2%) 0 (0%) 0 (0%) $0 (0%) Storage room or area 10 (2%) 0 (0%) 0 (0%) $0 (0%) Exterior balcony or unenclosed porch 10 (2%) 0 (0%) 0 (0%) $0 (0%) Other known area of origin 30 (11%) 0 (0%) 0 (0%) $2 (13%) Total fires 260 (100%) 5 (100%) 26 (100%) $14 (100%) * Excludes garage reported as separate property. NA – Not applicable because total is zero. Note: See detailed notes and source information at end of table.
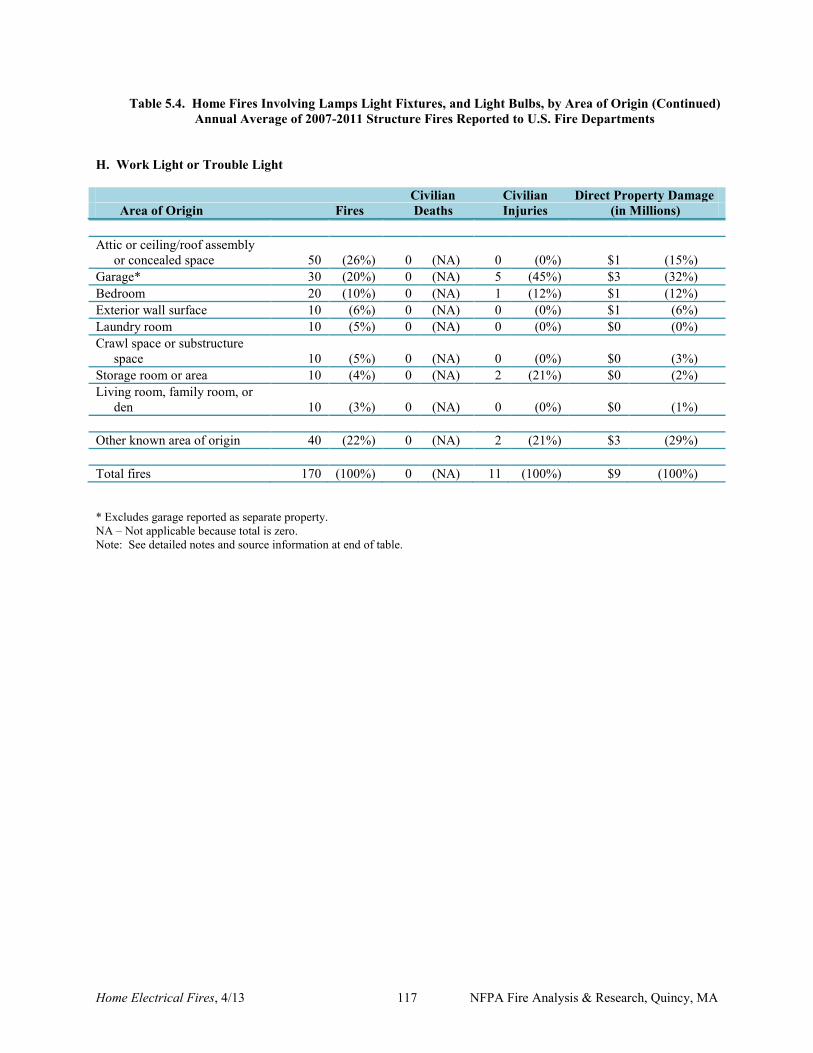
Home Electrical Fires, 4/13 117 NFPA Fire Analysis & Research, Quincy, MA
Table 5.4. Home Fires Involving Lamps Light Fixtures, and Light Bulbs, by Area of Origin (Continued) Annual Average of 2007-2011 Structure Fires Reported to U.S. Fire Departments
H. Work Light or Trouble Light Civilian Civilian Direct Property Damage Area of Origin Fires Deaths Injuries (in Millions) Attic or ceiling/roof assembly or concealed space 50 (26%) 0 (NA) 0 (0%) $1 (15%) Garage* 30 (20%) 0 (NA) 5 (45%) $3 (32%) Bedroom 20 (10%) 0 (NA) 1 (12%) $1 (12%) Exterior wall surface 10 (6%) 0 (NA) 0 (0%) $1 (6%) Laundry room 10 (5%) 0 (NA) 0 (0%) $0 (0%) Crawl space or substructure space 10 (5%) 0 (NA) 0 (0%) $0 (3%) Storage room or area 10 (4%) 0 (NA) 2 (21%) $0 (2%) Living room, family room, or den 10 (3%) 0 (NA) 0 (0%) $0 (1%) Other known area of origin 40 (22%) 0 (NA) 2 (21%) $3 (29%) Total fires 170 (100%) 0 (NA) 11 (100%) $9 (100%) * Excludes garage reported as separate property. NA – Not applicable because total is zero. Note: See detailed notes and source information at end of table.
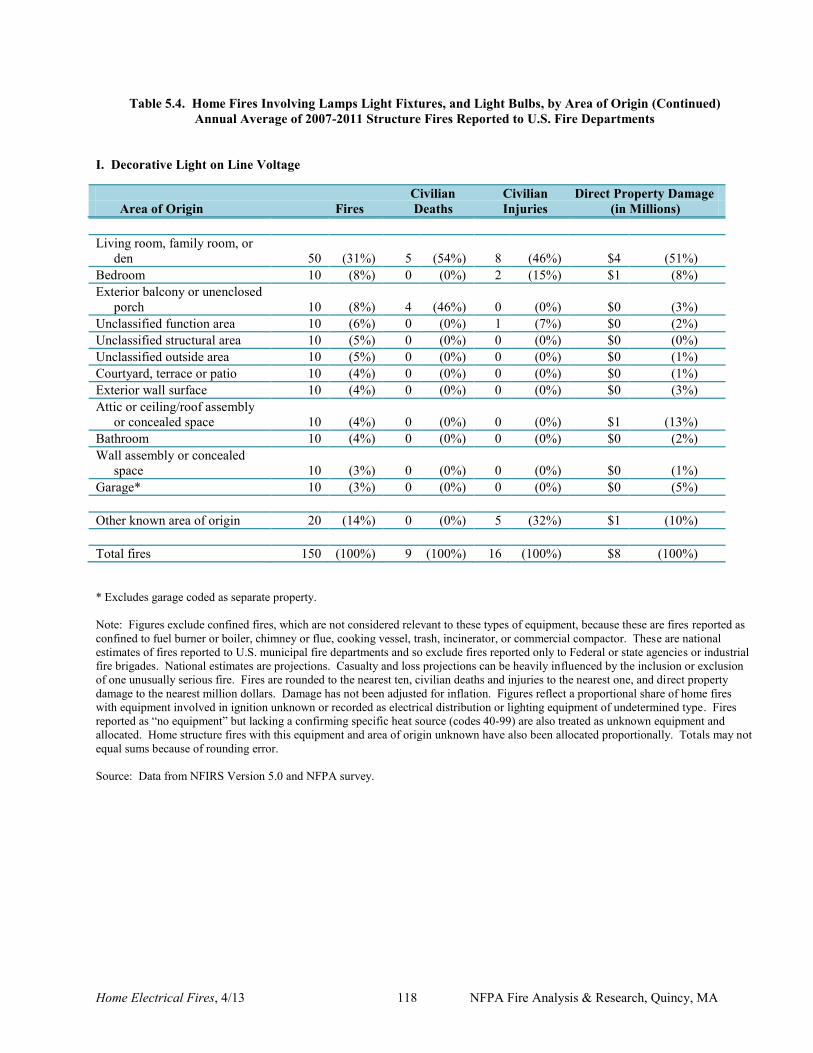
Home Electrical Fires, 4/13 118 NFPA Fire Analysis & Research, Quincy, MA
Table 5.4. Home Fires Involving Lamps Light Fixtures, and Light Bulbs, by Area of Origin (Continued) Annual Average of 2007-2011 Structure Fires Reported to U.S. Fire Departments
I. Decorative Light on Line Voltage
Civilian Civilian Direct Property Damage Area of Origin Fires Deaths Injuries (in Millions) Living room, family room, or den 50 (31%) 5 (54%) 8 (46%) $4 (51%) Bedroom 10 (8%) 0 (0%) 2 (15%) $1 (8%) Exterior balcony or unenclosed porch 10 (8%) 4 (46%) 0 (0%) $0 (3%) Unclassified function area 10 (6%) 0 (0%) 1 (7%) $0 (2%) Unclassified structural area 10 (5%) 0 (0%) 0 (0%) $0 (0%) Unclassified outside area 10 (5%) 0 (0%) 0 (0%) $0 (1%) Courtyard, terrace or patio 10 (4%) 0 (0%) 0 (0%) $0 (1%) Exterior wall surface 10 (4%) 0 (0%) 0 (0%) $0 (3%) Attic or ceiling/roof assembly or concealed space 10 (4%) 0 (0%) 0 (0%) $1 (13%) Bathroom 10 (4%) 0 (0%) 0 (0%) $0 (2%) Wall assembly or concealed space 10 (3%) 0 (0%) 0 (0%) $0 (1%) Garage* 10 (3%) 0 (0%) 0 (0%) $0 (5%) Other known area of origin 20 (14%) 0 (0%) 5 (32%) $1 (10%) Total fires 150 (100%) 9 (100%) 16 (100%) $8 (100%) * Excludes garage coded as separate property. Note: Figures exclude confined fires, which are not considered relevant to these types of equipment, because these are fires reported as confined to fuel burner or boiler, chimney or flue, cooking vessel, trash, incinerator, or commercial compactor. These are national estimates of fires reported to U.S. municipal fire departments and so exclude fires reported only to Federal or state agencies or industrial fire brigades. National estimates are projections. Casualty and loss projections can be heavily influenced by the inclusion or exclusion of one unusually serious fire. Fires are rounded to the nearest ten, civilian deaths and injuries to the nearest one, and direct property damage to the nearest million dollars. Damage has not been adjusted for inflation. Figures reflect a proportional share of home fires with equipment involved in ignition unknown or recorded as electrical distribution or lighting equipment of undetermined type. Fires reported as “no equipment” but lacking a confirming specific heat source (codes 40-99) are also treated as unknown equipment and allocated. Home structure fires with this equipment and area of origin unknown have also been allocated proportionally. Totals may not equal sums because of rounding error. Source: Data from NFIRS Version 5.0 and NFPA survey.
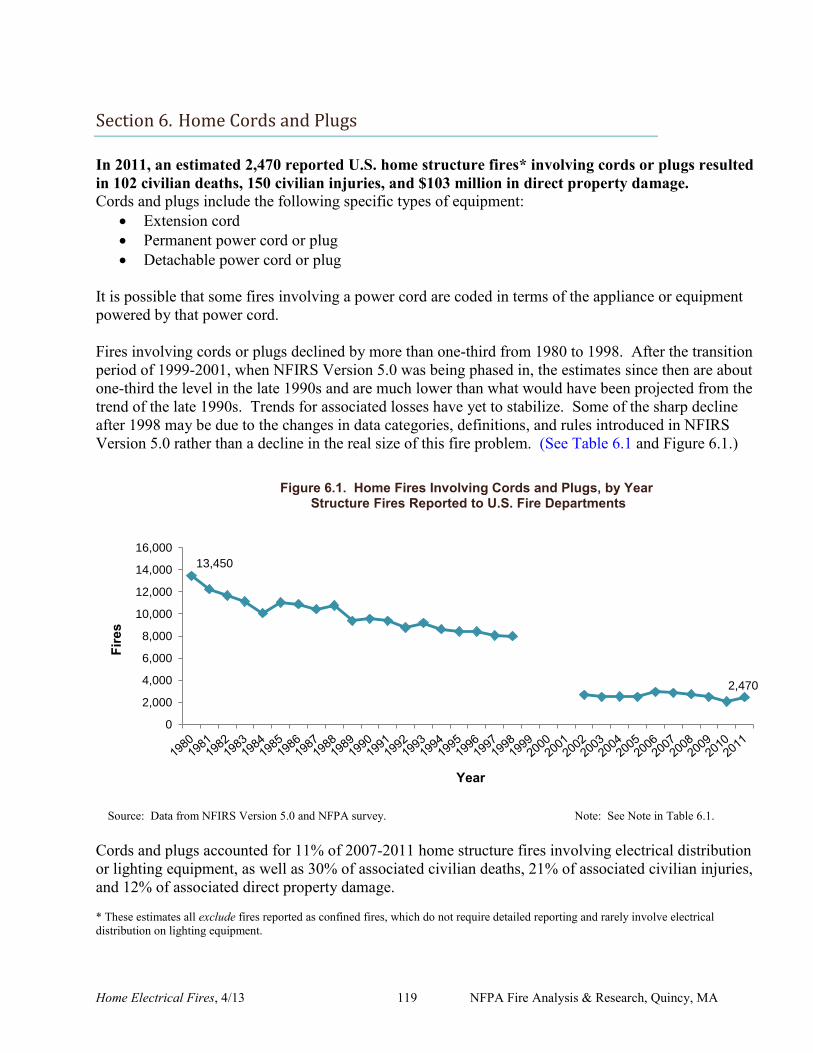
Home Electrical Fires, 4/13 119 NFPA Fire Analysis & Research, Quincy, MA
Section 6. Home Cords and Plugs
In 2011, an estimated 2,470 reported U.S. home structure fires* involving cords or plugs resulted in 102 civilian deaths, 150 civilian injuries, and $103 million in direct property damage. Cords and plugs include the following specific types of equipment:
Extension cord Permanent power cord or plug Detachable power cord or plug
It is possible that some fires involving a power cord are coded in terms of the appliance or equipment powered by that power cord. Fires involving cords or plugs declined by more than one-third from 1980 to 1998. After the transition period of 1999-2001, when NFIRS Version 5.0 was being phased in, the estimates since then are about one-third the level in the late 1990s and are much lower than what would have been projected from the trend of the late 1990s. Trends for associated losses have yet to stabilize. Some of the sharp decline after 1998 may be due to the changes in data categories, definitions, and rules introduced in NFIRS Version 5.0 rather than a decline in the real size of this fire problem. (See Table 6.1 and Figure 6.1.)
Source: Data from NFIRS Version 5.0 and NFPA survey. Note: See Note in Table 6.1. Cords and plugs accounted for 11% of 2007-2011 home structure fires involving electrical distribution or lighting equipment, as well as 30% of associated civilian deaths, 21% of associated civilian injuries, and 12% of associated direct property damage. * These estimates all exclude fires reported as confined fires, which do not require detailed reporting and rarely involve electrical distribution on lighting equipment.
13,450
2,470
0
2,000
4,000
6,000
8,000
10,000
12,000
14,000
16,000
Fire
s
Year
Figure 6.1. Home Fires Involving Cords and Plugs, by Year Structure Fires Reported to U.S. Fire Departments
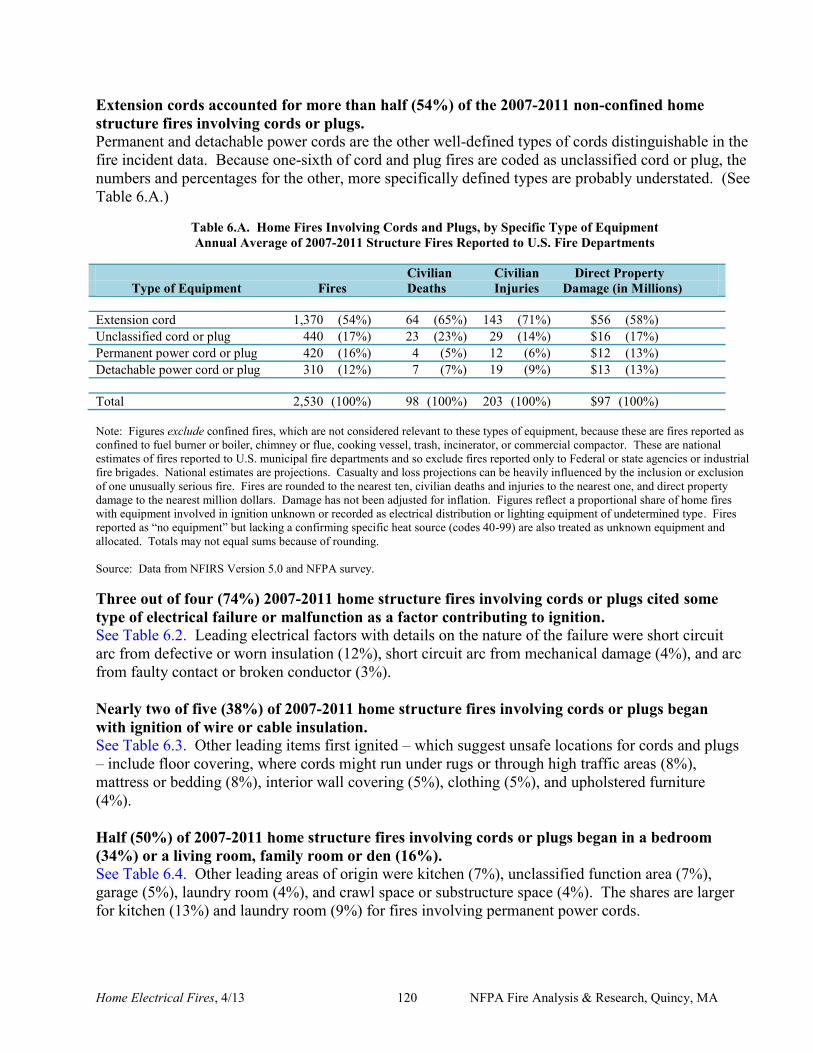
Home Electrical Fires, 4/13 120 NFPA Fire Analysis & Research, Quincy, MA
Extension cords accounted for more than half (54%) of the 2007-2011 non-confined home structure fires involving cords or plugs. Permanent and detachable power cords are the other well-defined types of cords distinguishable in the fire incident data. Because one-sixth of cord and plug fires are coded as unclassified cord or plug, the numbers and percentages for the other, more specifically defined types are probably understated. (See Table 6.A.)
Table 6.A. Home Fires Involving Cords and Plugs, by Specific Type of Equipment Annual Average of 2007-2011 Structure Fires Reported to U.S. Fire Departments
Civilian Civilian Direct Property Type of Equipment Fires Deaths Injuries Damage (in Millions) Extension cord 1,370 (54%) 64 (65%) 143 (71%) $56 (58%) Unclassified cord or plug 440 (17%) 23 (23%) 29 (14%) $16 (17%) Permanent power cord or plug 420 (16%) 4 (5%) 12 (6%) $12 (13%) Detachable power cord or plug 310 (12%) 7 (7%) 19 (9%) $13 (13%) Total 2,530 (100%) 98 (100%) 203 (100%) $97 (100%) Note: Figures exclude confined fires, which are not considered relevant to these types of equipment, because these are fires reported as confined to fuel burner or boiler, chimney or flue, cooking vessel, trash, incinerator, or commercial compactor. These are national estimates of fires reported to U.S. municipal fire departments and so exclude fires reported only to Federal or state agencies or industrial fire brigades. National estimates are projections. Casualty and loss projections can be heavily influenced by the inclusion or exclusion of one unusually serious fire. Fires are rounded to the nearest ten, civilian deaths and injuries to the nearest one, and direct property damage to the nearest million dollars. Damage has not been adjusted for inflation. Figures reflect a proportional share of home fires with equipment involved in ignition unknown or recorded as electrical distribution or lighting equipment of undetermined type. Fires reported as “no equipment” but lacking a confirming specific heat source (codes 40-99) are also treated as unknown equipment and allocated. Totals may not equal sums because of rounding. Source: Data from NFIRS Version 5.0 and NFPA survey. Three out of four (74%) 2007-2011 home structure fires involving cords or plugs cited some type of electrical failure or malfunction as a factor contributing to ignition. See Table 6.2. Leading electrical factors with details on the nature of the failure were short circuit arc from defective or worn insulation (12%), short circuit arc from mechanical damage (4%), and arc from faulty contact or broken conductor (3%). Nearly two of five (38%) of 2007-2011 home structure fires involving cords or plugs began with ignition of wire or cable insulation. See Table 6.3. Other leading items first ignited – which suggest unsafe locations for cords and plugs – include floor covering, where cords might run under rugs or through high traffic areas (8%), mattress or bedding (8%), interior wall covering (5%), clothing (5%), and upholstered furniture (4%). Half (50%) of 2007-2011 home structure fires involving cords or plugs began in a bedroom (34%) or a living room, family room or den (16%). See Table 6.4. Other leading areas of origin were kitchen (7%), unclassified function area (7%), garage (5%), laundry room (4%), and crawl space or substructure space (4%). The shares are larger for kitchen (13%) and laundry room (9%) for fires involving permanent power cords.
Home Electrical Fires, 4/13 121 NFPA Fire Analysis & Research, Quincy, MA
In 2011, an estimated 14,260 injuries involving electrical cords were reported to hospital emergency rooms.22 These consisted of 3,330 extension cord injuries and 10,930 injuries involving other or unknown-type electrical cords. The largest shares of the 14,260 injuries were 3,550 contusion or abrasion injuries and 3,300 fracture injuries. In 2002-2009, two types of cords and plugs accounted for an average of 3.4 electrocution deaths per year.23
Safety Tips:
Home electrical safety begins with NFPA 70, National Electrical Code®, and related documents with special relevance to homes, notably NFPA 73, Electrical Inspection Code for Existing Dwellings. However, work on home electrical distribution or lighting equipment should only be conducted by someone qualified as an electrician. When you are buying, selling, or remodeling a home, have it inspected by a professional electrician.
Never plug a major appliance into an extension cord.
Buy only appliances that have the label of a recognized testing laboratory.
Replace cracked electrical cords. If you have older cords with cloth covering, check for
and replace frayed cords.
Pinching cords against walls or furniture or running them under carpets or across doorways can cause a fire.
Use extension cords for temporary wiring only. Consider having additional circuits or
outlets added by a qualified electrician. More of NFPA’s electrical safety information is available on our website at www.nfpa.org/electricalfires.
22 Statistics from National Electronic Injury Surveillance System (NEISS) data obtained from the U.S. Consumer Product Safety Commission (CPSC) website, www.cpsc.gov. 23 Matthew V. Hnatov, 2009 Electrocutions Associated with Consumer Products, U.S. Consumer Product Safety Commission, November 2012, accessed at www.cpsc.gov.
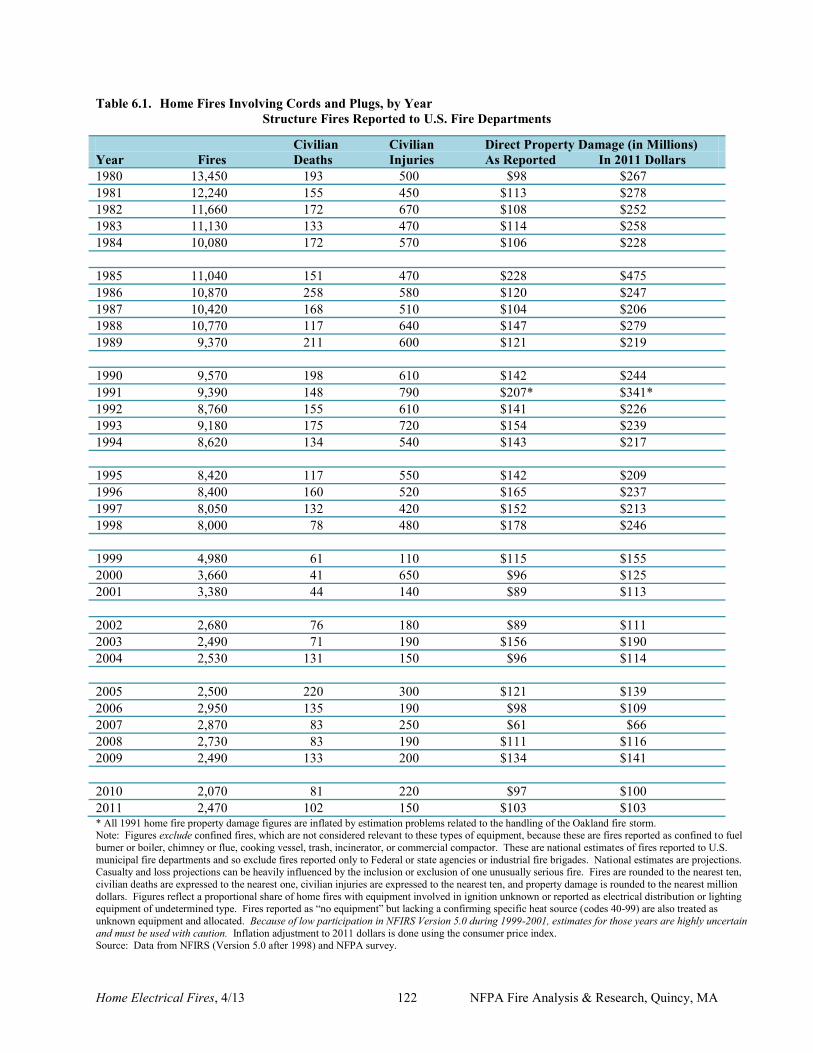
Home Electrical Fires, 4/13 122 NFPA Fire Analysis & Research, Quincy, MA
Table 6.1. Home Fires Involving Cords and Plugs, by Year Structure Fires Reported to U.S. Fire Departments
Civilian Civilian Direct Property Damage (in Millions) Year Fires Deaths Injuries As Reported In 2011 Dollars 1980 13,450 193 500 $98 $267 1981 12,240 155 450 $113 $278 1982 11,660 172 670 $108 $252 1983 11,130 133 470 $114 $258 1984 10,080 172 570 $106 $228 1985 11,040 151 470 $228 $475 1986 10,870 258 580 $120 $247 1987 10,420 168 510 $104 $206 1988 10,770 117 640 $147 $279 1989 9,370 211 600 $121 $219 1990 9,570 198 610 $142 $244 1991 9,390 148 790 $207* $341* 1992 8,760 155 610 $141 $226 1993 9,180 175 720 $154 $239 1994 8,620 134 540 $143 $217 1995 8,420 117 550 $142 $209 1996 8,400 160 520 $165 $237 1997 8,050 132 420 $152 $213 1998 8,000 78 480 $178 $246 1999 4,980 61 110 $115 $155 2000 3,660 41 650 $96 $125 2001 3,380 44 140 $89 $113 2002 2,680 76 180 $89 $111 2003 2,490 71 190 $156 $190 2004 2,530 131 150 $96 $114 2005 2,500 220 300 $121 $139 2006 2,950 135 190 $98 $109 2007 2,870 83 250 $61 $66 2008 2,730 83 190 $111 $116 2009 2,490 133 200 $134 $141 2010 2,070 81 220 $97 $100 2011 2,470 102 150 $103 $103 * All 1991 home fire property damage figures are inflated by estimation problems related to the handling of the Oakland fire storm. Note: Figures exclude confined fires, which are not considered relevant to these types of equipment, because these are fires reported as confined to fuel burner or boiler, chimney or flue, cooking vessel, trash, incinerator, or commercial compactor. These are national estimates of fires reported to U.S. municipal fire departments and so exclude fires reported only to Federal or state agencies or industrial fire brigades. National estimates are projections. Casualty and loss projections can be heavily influenced by the inclusion or exclusion of one unusually serious fire. Fires are rounded to the nearest ten, civilian deaths are expressed to the nearest one, civilian injuries are expressed to the nearest ten, and property damage is rounded to the nearest million dollars. Figures reflect a proportional share of home fires with equipment involved in ignition unknown or reported as electrical distribution or lighting equipment of undetermined type. Fires reported as “no equipment” but lacking a confirming specific heat source (codes 40-99) are also treated as unknown equipment and allocated. Because of low participation in NFIRS Version 5.0 during 1999-2001, estimates for those years are highly uncertain and must be used with caution. Inflation adjustment to 2011 dollars is done using the consumer price index. Source: Data from NFIRS (Version 5.0 after 1998) and NFPA survey.
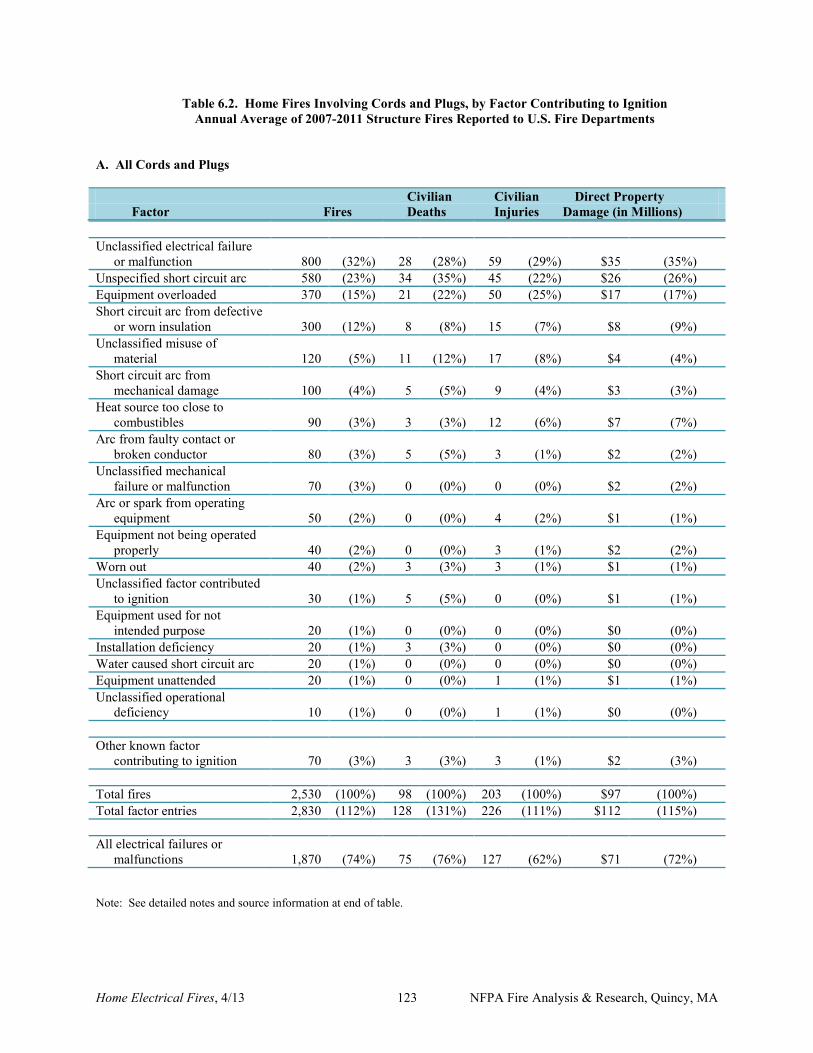
Home Electrical Fires, 4/13 123 NFPA Fire Analysis & Research, Quincy, MA
Table 6.2. Home Fires Involving Cords and Plugs, by Factor Contributing to Ignition Annual Average of 2007-2011 Structure Fires Reported to U.S. Fire Departments
A. All Cords and Plugs
Civilian Civilian Direct Property Factor Fires Deaths Injuries Damage (in Millions) Unclassified electrical failure or malfunction 800 (32%) 28 (28%) 59 (29%) $35 (35%) Unspecified short circuit arc 580 (23%) 34 (35%) 45 (22%) $26 (26%) Equipment overloaded 370 (15%) 21 (22%) 50 (25%) $17 (17%) Short circuit arc from defective or worn insulation 300 (12%) 8 (8%) 15 (7%) $8 (9%) Unclassified misuse of material 120 (5%) 11 (12%) 17 (8%) $4 (4%) Short circuit arc from mechanical damage 100 (4%) 5 (5%) 9 (4%) $3 (3%) Heat source too close to combustibles 90 (3%) 3 (3%) 12 (6%) $7 (7%) Arc from faulty contact or broken conductor 80 (3%) 5 (5%) 3 (1%) $2 (2%) Unclassified mechanical failure or malfunction 70 (3%) 0 (0%) 0 (0%) $2 (2%) Arc or spark from operating equipment 50 (2%) 0 (0%) 4 (2%) $1 (1%) Equipment not being operated properly 40 (2%) 0 (0%) 3 (1%) $2 (2%) Worn out 40 (2%) 3 (3%) 3 (1%) $1 (1%) Unclassified factor contributed to ignition 30 (1%) 5 (5%) 0 (0%) $1 (1%) Equipment used for not intended purpose 20 (1%) 0 (0%) 0 (0%) $0 (0%) Installation deficiency 20 (1%) 3 (3%) 0 (0%) $0 (0%) Water caused short circuit arc 20 (1%) 0 (0%) 0 (0%) $0 (0%) Equipment unattended 20 (1%) 0 (0%) 1 (1%) $1 (1%) Unclassified operational deficiency 10 (1%) 0 (0%) 1 (1%) $0 (0%) Other known factor contributing to ignition 70 (3%) 3 (3%) 3 (1%) $2 (3%) Total fires 2,530 (100%) 98 (100%) 203 (100%) $97 (100%) Total factor entries 2,830 (112%) 128 (131%) 226 (111%) $112 (115%) All electrical failures or malfunctions 1,870 (74%) 75 (76%) 127 (62%) $71 (72%) Note: See detailed notes and source information at end of table.
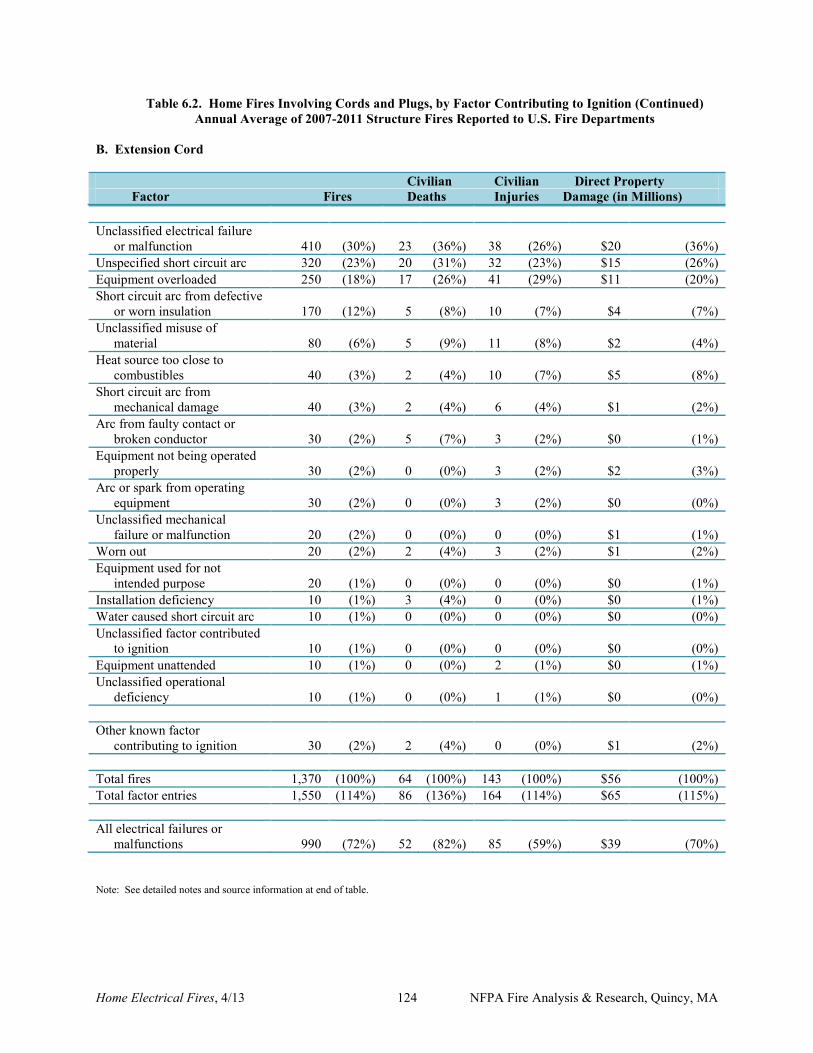
Home Electrical Fires, 4/13 124 NFPA Fire Analysis & Research, Quincy, MA
Table 6.2. Home Fires Involving Cords and Plugs, by Factor Contributing to Ignition (Continued) Annual Average of 2007-2011 Structure Fires Reported to U.S. Fire Departments
B. Extension Cord Civilian Civilian Direct Property Factor Fires Deaths Injuries Damage (in Millions) Unclassified electrical failure or malfunction 410 (30%) 23 (36%) 38 (26%) $20 (36%) Unspecified short circuit arc 320 (23%) 20 (31%) 32 (23%) $15 (26%) Equipment overloaded 250 (18%) 17 (26%) 41 (29%) $11 (20%) Short circuit arc from defective or worn insulation 170 (12%) 5 (8%) 10 (7%) $4 (7%) Unclassified misuse of material 80 (6%) 5 (9%) 11 (8%) $2 (4%) Heat source too close to combustibles 40 (3%) 2 (4%) 10 (7%) $5 (8%) Short circuit arc from mechanical damage 40 (3%) 2 (4%) 6 (4%) $1 (2%) Arc from faulty contact or broken conductor 30 (2%) 5 (7%) 3 (2%) $0 (1%) Equipment not being operated properly 30 (2%) 0 (0%) 3 (2%) $2 (3%) Arc or spark from operating equipment 30 (2%) 0 (0%) 3 (2%) $0 (0%) Unclassified mechanical failure or malfunction 20 (2%) 0 (0%) 0 (0%) $1 (1%) Worn out 20 (2%) 2 (4%) 3 (2%) $1 (2%) Equipment used for not intended purpose 20 (1%) 0 (0%) 0 (0%) $0 (1%) Installation deficiency 10 (1%) 3 (4%) 0 (0%) $0 (1%) Water caused short circuit arc 10 (1%) 0 (0%) 0 (0%) $0 (0%) Unclassified factor contributed to ignition 10 (1%) 0 (0%) 0 (0%) $0 (0%) Equipment unattended 10 (1%) 0 (0%) 2 (1%) $0 (1%) Unclassified operational deficiency 10 (1%) 0 (0%) 1 (1%) $0 (0%) Other known factor contributing to ignition 30 (2%) 2 (4%) 0 (0%) $1 (2%) Total fires 1,370 (100%) 64 (100%) 143 (100%) $56 (100%) Total factor entries 1,550 (114%) 86 (136%) 164 (114%) $65 (115%) All electrical failures or malfunctions 990 (72%) 52 (82%) 85 (59%) $39 (70%) Note: See detailed notes and source information at end of table.
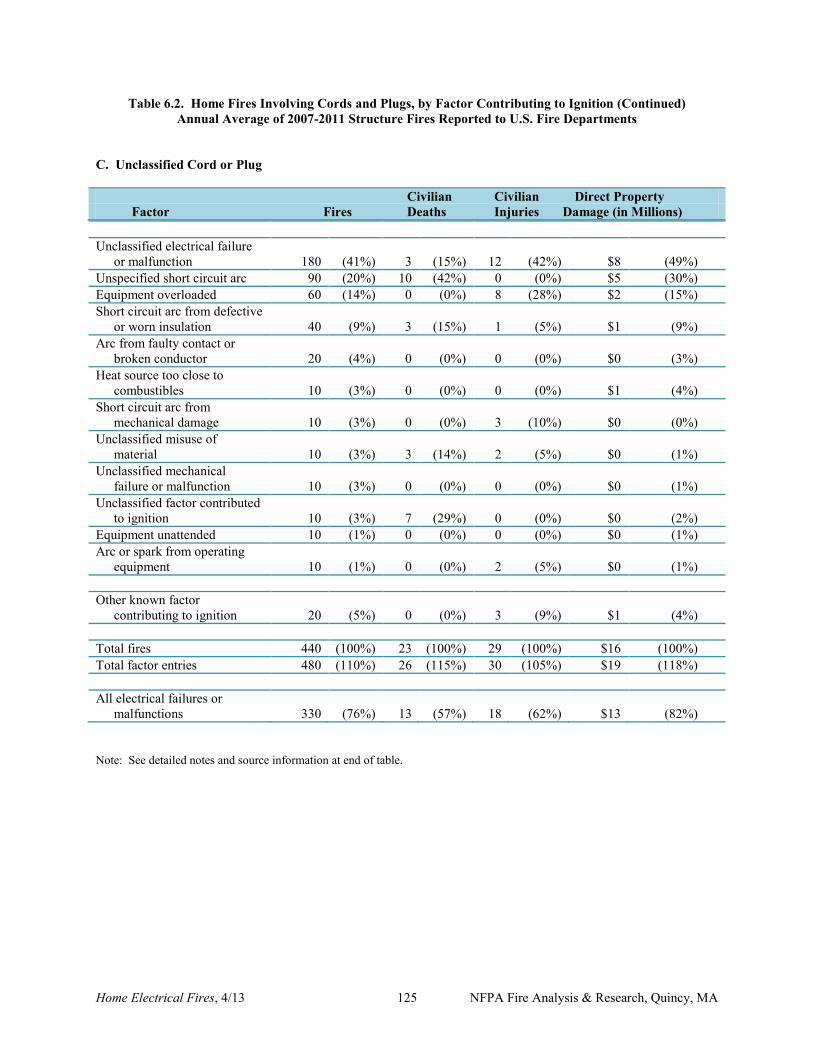
Home Electrical Fires, 4/13 125 NFPA Fire Analysis & Research, Quincy, MA
Table 6.2. Home Fires Involving Cords and Plugs, by Factor Contributing to Ignition (Continued) Annual Average of 2007-2011 Structure Fires Reported to U.S. Fire Departments
C. Unclassified Cord or Plug
Civilian Civilian Direct Property Factor Fires Deaths Injuries Damage (in Millions) Unclassified electrical failure or malfunction 180 (41%) 3 (15%) 12 (42%) $8 (49%) Unspecified short circuit arc 90 (20%) 10 (42%) 0 (0%) $5 (30%) Equipment overloaded 60 (14%) 0 (0%) 8 (28%) $2 (15%) Short circuit arc from defective or worn insulation 40 (9%) 3 (15%) 1 (5%) $1 (9%) Arc from faulty contact or broken conductor 20 (4%) 0 (0%) 0 (0%) $0 (3%) Heat source too close to combustibles 10 (3%) 0 (0%) 0 (0%) $1 (4%) Short circuit arc from mechanical damage 10 (3%) 0 (0%) 3 (10%) $0 (0%) Unclassified misuse of material 10 (3%) 3 (14%) 2 (5%) $0 (1%) Unclassified mechanical failure or malfunction 10 (3%) 0 (0%) 0 (0%) $0 (1%) Unclassified factor contributed to ignition 10 (3%) 7 (29%) 0 (0%) $0 (2%) Equipment unattended 10 (1%) 0 (0%) 0 (0%) $0 (1%) Arc or spark from operating equipment 10 (1%) 0 (0%) 2 (5%) $0 (1%) Other known factor contributing to ignition 20 (5%) 0 (0%) 3 (9%) $1 (4%) Total fires 440 (100%) 23 (100%) 29 (100%) $16 (100%) Total factor entries 480 (110%) 26 (115%) 30 (105%) $19 (118%) All electrical failures or malfunctions 330 (76%) 13 (57%) 18 (62%) $13 (82%) Note: See detailed notes and source information at end of table.
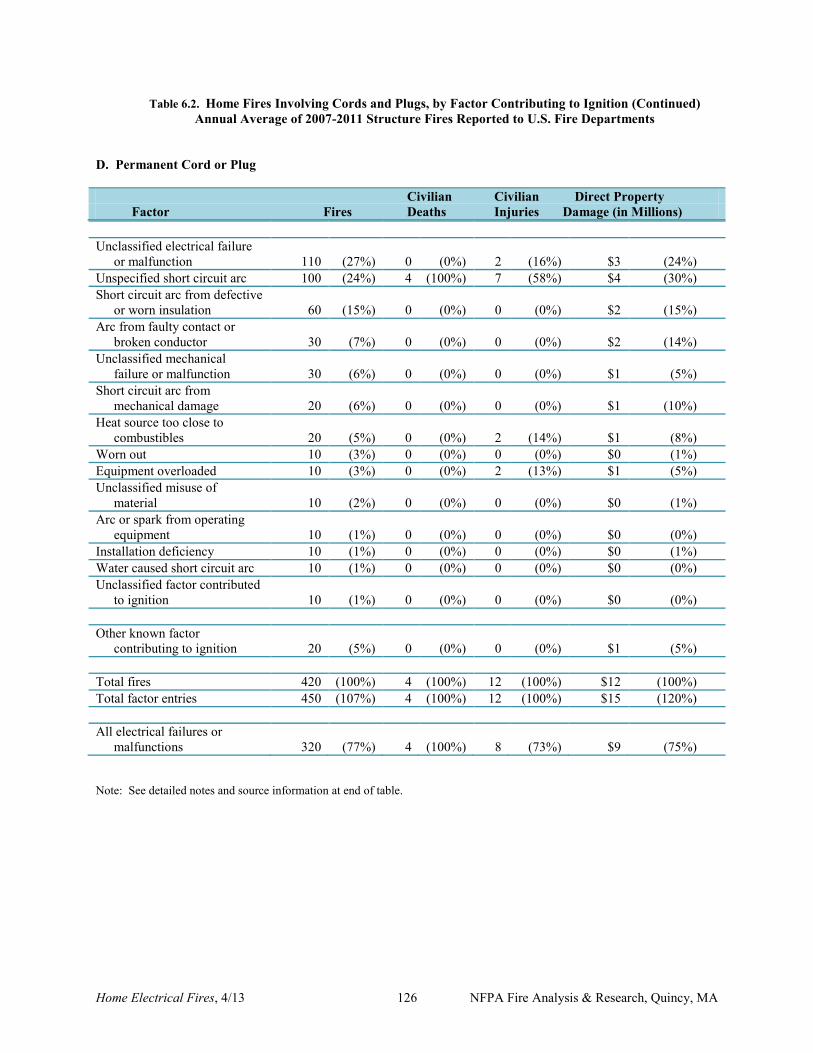
Home Electrical Fires, 4/13 126 NFPA Fire Analysis & Research, Quincy, MA
Table 6.2. Home Fires Involving Cords and Plugs, by Factor Contributing to Ignition (Continued) Annual Average of 2007-2011 Structure Fires Reported to U.S. Fire Departments
D. Permanent Cord or Plug
Civilian Civilian Direct Property Factor Fires Deaths Injuries Damage (in Millions) Unclassified electrical failure or malfunction 110 (27%) 0 (0%) 2 (16%) $3 (24%) Unspecified short circuit arc 100 (24%) 4 (100%) 7 (58%) $4 (30%) Short circuit arc from defective or worn insulation 60 (15%) 0 (0%) 0 (0%) $2 (15%) Arc from faulty contact or broken conductor 30 (7%) 0 (0%) 0 (0%) $2 (14%) Unclassified mechanical failure or malfunction 30 (6%) 0 (0%) 0 (0%) $1 (5%) Short circuit arc from mechanical damage 20 (6%) 0 (0%) 0 (0%) $1 (10%) Heat source too close to combustibles 20 (5%) 0 (0%) 2 (14%) $1 (8%) Worn out 10 (3%) 0 (0%) 0 (0%) $0 (1%) Equipment overloaded 10 (3%) 0 (0%) 2 (13%) $1 (5%) Unclassified misuse of material 10 (2%) 0 (0%) 0 (0%) $0 (1%) Arc or spark from operating equipment 10 (1%) 0 (0%) 0 (0%) $0 (0%) Installation deficiency 10 (1%) 0 (0%) 0 (0%) $0 (1%) Water caused short circuit arc 10 (1%) 0 (0%) 0 (0%) $0 (0%) Unclassified factor contributed to ignition 10 (1%) 0 (0%) 0 (0%) $0 (0%) Other known factor contributing to ignition 20 (5%) 0 (0%) 0 (0%) $1 (5%) Total fires 420 (100%) 4 (100%) 12 (100%) $12 (100%) Total factor entries 450 (107%) 4 (100%) 12 (100%) $15 (120%) All electrical failures or malfunctions 320 (77%) 4 (100%) 8 (73%) $9 (75%) Note: See detailed notes and source information at end of table.
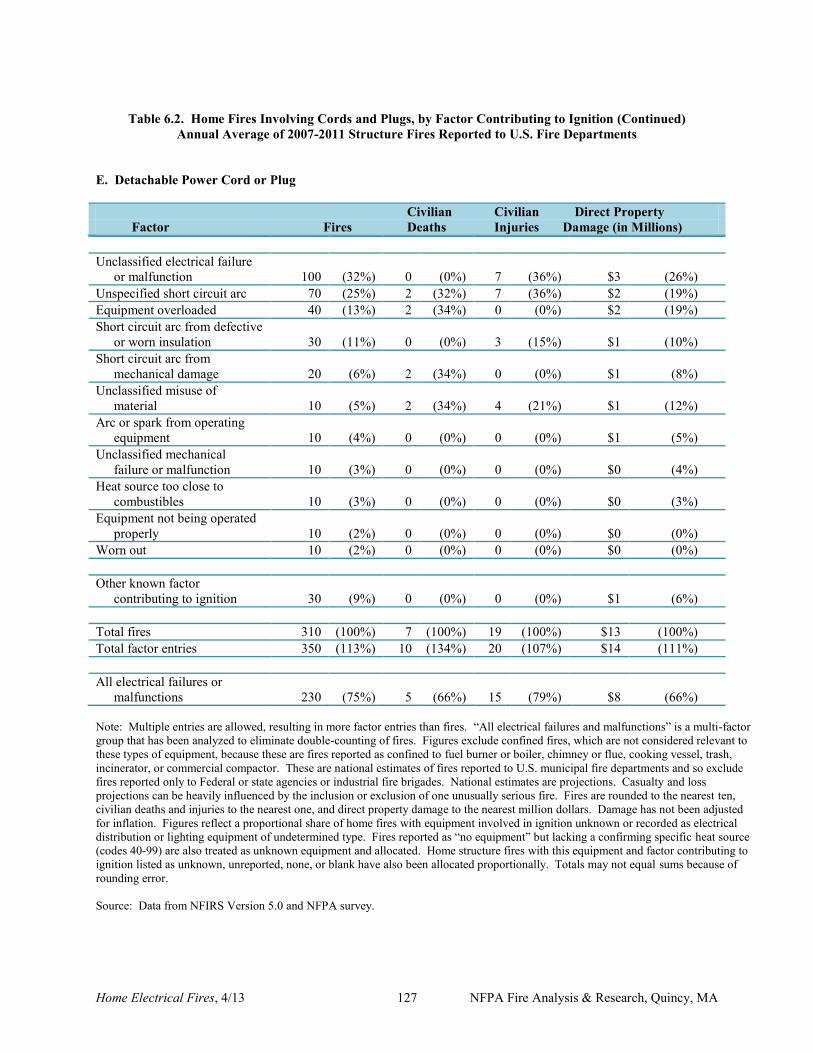
Home Electrical Fires, 4/13 127 NFPA Fire Analysis & Research, Quincy, MA
Table 6.2. Home Fires Involving Cords and Plugs, by Factor Contributing to Ignition (Continued)
Annual Average of 2007-2011 Structure Fires Reported to U.S. Fire Departments
E. Detachable Power Cord or Plug Civilian Civilian Direct Property Factor Fires Deaths Injuries Damage (in Millions) Unclassified electrical failure or malfunction 100 (32%) 0 (0%) 7 (36%) $3 (26%) Unspecified short circuit arc 70 (25%) 2 (32%) 7 (36%) $2 (19%) Equipment overloaded 40 (13%) 2 (34%) 0 (0%) $2 (19%) Short circuit arc from defective or worn insulation 30 (11%) 0 (0%) 3 (15%) $1 (10%) Short circuit arc from mechanical damage 20 (6%) 2 (34%) 0 (0%) $1 (8%) Unclassified misuse of material 10 (5%) 2 (34%) 4 (21%) $1 (12%) Arc or spark from operating equipment 10 (4%) 0 (0%) 0 (0%) $1 (5%) Unclassified mechanical failure or malfunction 10 (3%) 0 (0%) 0 (0%) $0 (4%) Heat source too close to combustibles 10 (3%) 0 (0%) 0 (0%) $0 (3%) Equipment not being operated properly 10 (2%) 0 (0%) 0 (0%) $0 (0%) Worn out 10 (2%) 0 (0%) 0 (0%) $0 (0%) Other known factor contributing to ignition 30 (9%) 0 (0%) 0 (0%) $1 (6%) Total fires 310 (100%) 7 (100%) 19 (100%) $13 (100%) Total factor entries 350 (113%) 10 (134%) 20 (107%) $14 (111%) All electrical failures or malfunctions 230 (75%) 5 (66%) 15 (79%) $8 (66%) Note: Multiple entries are allowed, resulting in more factor entries than fires. “All electrical failures and malfunctions” is a multi-factor group that has been analyzed to eliminate double-counting of fires. Figures exclude confined fires, which are not considered relevant to these types of equipment, because these are fires reported as confined to fuel burner or boiler, chimney or flue, cooking vessel, trash, incinerator, or commercial compactor. These are national estimates of fires reported to U.S. municipal fire departments and so exclude fires reported only to Federal or state agencies or industrial fire brigades. National estimates are projections. Casualty and loss projections can be heavily influenced by the inclusion or exclusion of one unusually serious fire. Fires are rounded to the nearest ten, civilian deaths and injuries to the nearest one, and direct property damage to the nearest million dollars. Damage has not been adjusted for inflation. Figures reflect a proportional share of home fires with equipment involved in ignition unknown or recorded as electrical distribution or lighting equipment of undetermined type. Fires reported as “no equipment” but lacking a confirming specific heat source (codes 40-99) are also treated as unknown equipment and allocated. Home structure fires with this equipment and factor contributing to ignition listed as unknown, unreported, none, or blank have also been allocated proportionally. Totals may not equal sums because of rounding error. Source: Data from NFIRS Version 5.0 and NFPA survey.
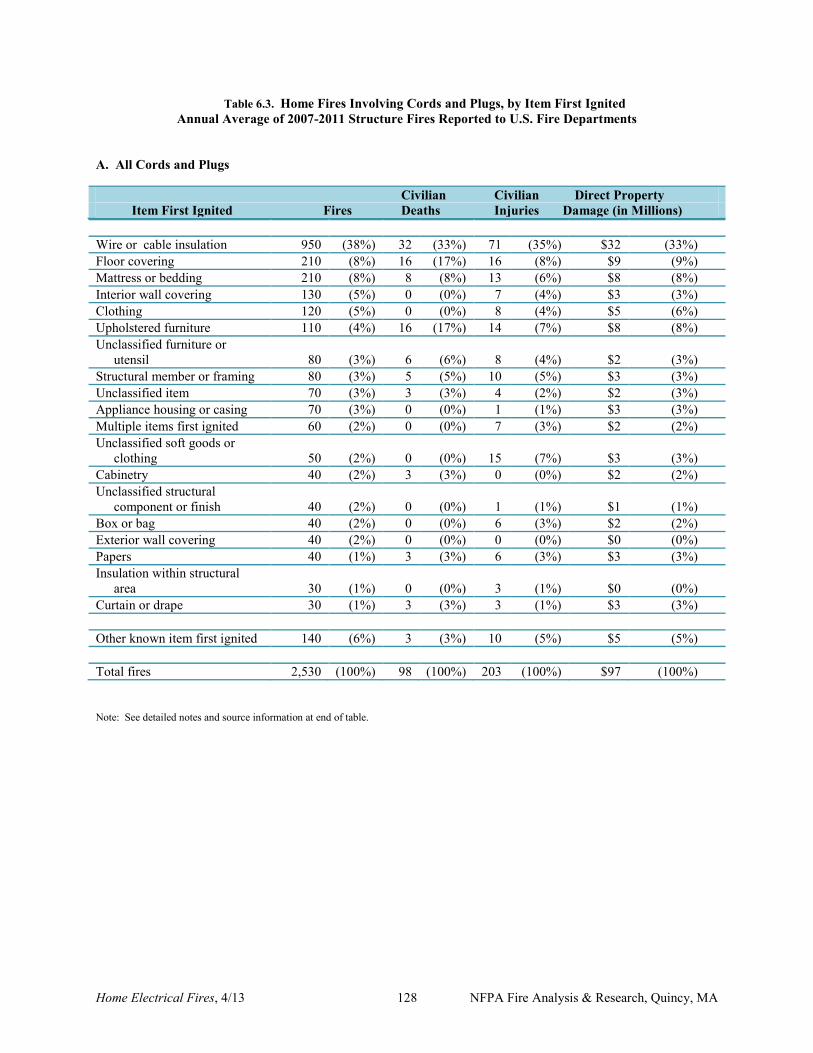
Home Electrical Fires, 4/13 128 NFPA Fire Analysis & Research, Quincy, MA
Table 6.3. Home Fires Involving Cords and Plugs, by Item First Ignited Annual Average of 2007-2011 Structure Fires Reported to U.S. Fire Departments
A. All Cords and Plugs
Civilian Civilian Direct Property Item First Ignited Fires Deaths Injuries Damage (in Millions) Wire or cable insulation 950 (38%) 32 (33%) 71 (35%) $32 (33%) Floor covering 210 (8%) 16 (17%) 16 (8%) $9 (9%) Mattress or bedding 210 (8%) 8 (8%) 13 (6%) $8 (8%) Interior wall covering 130 (5%) 0 (0%) 7 (4%) $3 (3%) Clothing 120 (5%) 0 (0%) 8 (4%) $5 (6%) Upholstered furniture 110 (4%) 16 (17%) 14 (7%) $8 (8%) Unclassified furniture or utensil 80 (3%) 6 (6%) 8 (4%) $2 (3%) Structural member or framing 80 (3%) 5 (5%) 10 (5%) $3 (3%) Unclassified item 70 (3%) 3 (3%) 4 (2%) $2 (3%) Appliance housing or casing 70 (3%) 0 (0%) 1 (1%) $3 (3%) Multiple items first ignited 60 (2%) 0 (0%) 7 (3%) $2 (2%) Unclassified soft goods or clothing 50 (2%) 0 (0%) 15 (7%) $3 (3%) Cabinetry 40 (2%) 3 (3%) 0 (0%) $2 (2%) Unclassified structural component or finish 40 (2%) 0 (0%) 1 (1%) $1 (1%) Box or bag 40 (2%) 0 (0%) 6 (3%) $2 (2%) Exterior wall covering 40 (2%) 0 (0%) 0 (0%) $0 (0%) Papers 40 (1%) 3 (3%) 6 (3%) $3 (3%) Insulation within structural area 30 (1%) 0 (0%) 3 (1%) $0 (0%) Curtain or drape 30 (1%) 3 (3%) 3 (1%) $3 (3%) Other known item first ignited 140 (6%) 3 (3%) 10 (5%) $5 (5%) Total fires 2,530 (100%) 98 (100%) 203 (100%) $97 (100%) Note: See detailed notes and source information at end of table.
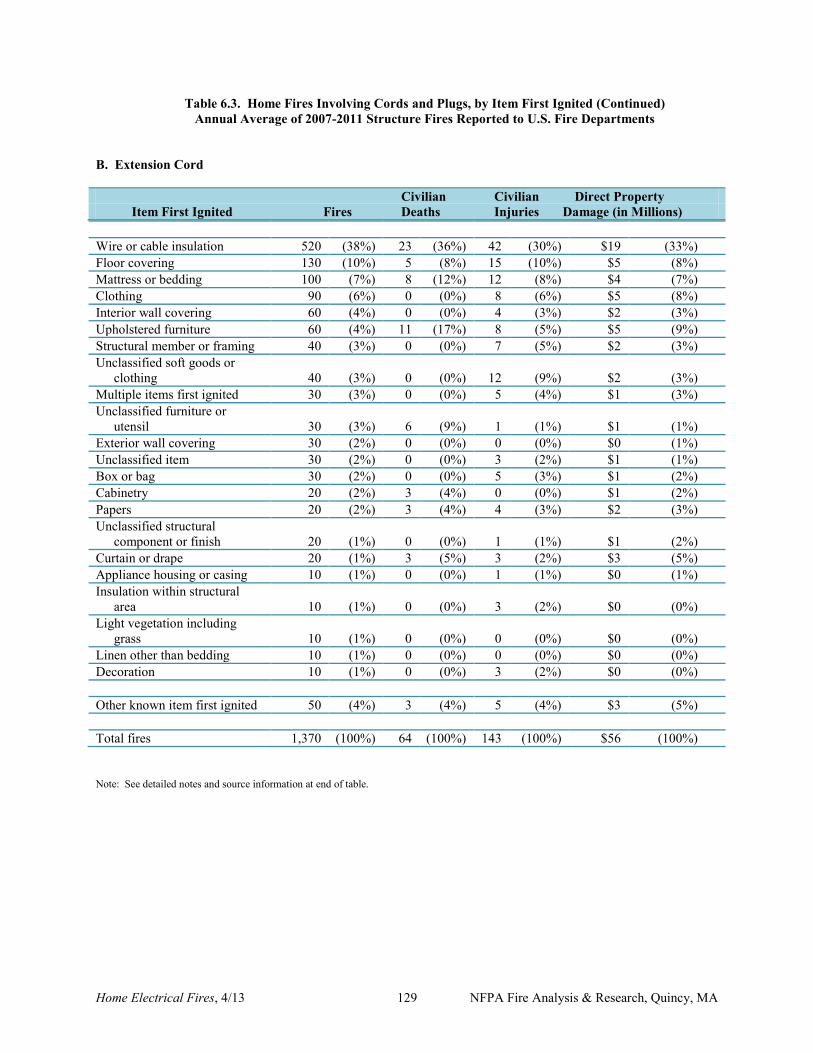
Home Electrical Fires, 4/13 129 NFPA Fire Analysis & Research, Quincy, MA
Table 6.3. Home Fires Involving Cords and Plugs, by Item First Ignited (Continued) Annual Average of 2007-2011 Structure Fires Reported to U.S. Fire Departments
B. Extension Cord
Civilian Civilian Direct Property Item First Ignited Fires Deaths Injuries Damage (in Millions) Wire or cable insulation 520 (38%) 23 (36%) 42 (30%) $19 (33%) Floor covering 130 (10%) 5 (8%) 15 (10%) $5 (8%) Mattress or bedding 100 (7%) 8 (12%) 12 (8%) $4 (7%) Clothing 90 (6%) 0 (0%) 8 (6%) $5 (8%) Interior wall covering 60 (4%) 0 (0%) 4 (3%) $2 (3%) Upholstered furniture 60 (4%) 11 (17%) 8 (5%) $5 (9%) Structural member or framing 40 (3%) 0 (0%) 7 (5%) $2 (3%) Unclassified soft goods or clothing 40 (3%) 0 (0%) 12 (9%) $2 (3%) Multiple items first ignited 30 (3%) 0 (0%) 5 (4%) $1 (3%) Unclassified furniture or utensil 30 (3%) 6 (9%) 1 (1%) $1 (1%) Exterior wall covering 30 (2%) 0 (0%) 0 (0%) $0 (1%) Unclassified item 30 (2%) 0 (0%) 3 (2%) $1 (1%) Box or bag 30 (2%) 0 (0%) 5 (3%) $1 (2%) Cabinetry 20 (2%) 3 (4%) 0 (0%) $1 (2%) Papers 20 (2%) 3 (4%) 4 (3%) $2 (3%) Unclassified structural component or finish 20 (1%) 0 (0%) 1 (1%) $1 (2%) Curtain or drape 20 (1%) 3 (5%) 3 (2%) $3 (5%) Appliance housing or casing 10 (1%) 0 (0%) 1 (1%) $0 (1%) Insulation within structural area 10 (1%) 0 (0%) 3 (2%) $0 (0%) Light vegetation including grass 10 (1%) 0 (0%) 0 (0%) $0 (0%) Linen other than bedding 10 (1%) 0 (0%) 0 (0%) $0 (0%) Decoration 10 (1%) 0 (0%) 3 (2%) $0 (0%) Other known item first ignited 50 (4%) 3 (4%) 5 (4%) $3 (5%) Total fires 1,370 (100%) 64 (100%) 143 (100%) $56 (100%) Note: See detailed notes and source information at end of table.
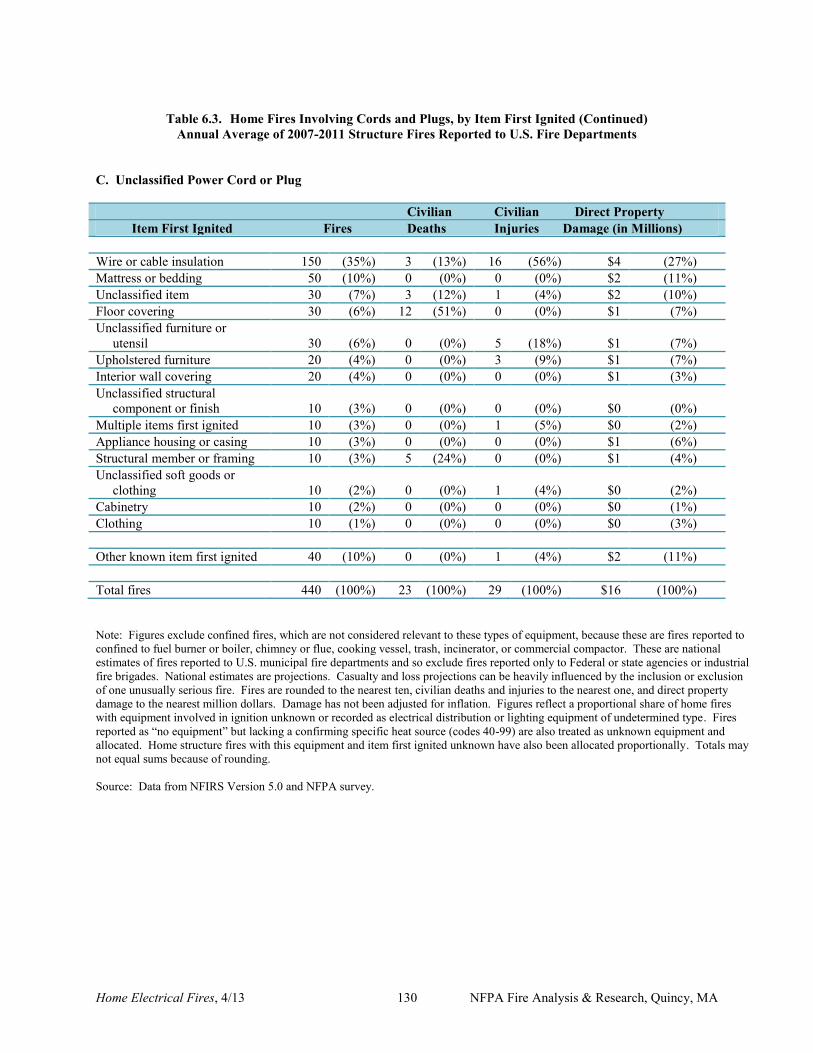
Home Electrical Fires, 4/13 130 NFPA Fire Analysis & Research, Quincy, MA
Table 6.3. Home Fires Involving Cords and Plugs, by Item First Ignited (Continued)
Annual Average of 2007-2011 Structure Fires Reported to U.S. Fire Departments
C. Unclassified Power Cord or Plug
Civilian Civilian Direct Property Item First Ignited Fires Deaths Injuries Damage (in Millions) Wire or cable insulation 150 (35%) 3 (13%) 16 (56%) $4 (27%) Mattress or bedding 50 (10%) 0 (0%) 0 (0%) $2 (11%) Unclassified item 30 (7%) 3 (12%) 1 (4%) $2 (10%) Floor covering 30 (6%) 12 (51%) 0 (0%) $1 (7%) Unclassified furniture or utensil 30 (6%) 0 (0%) 5 (18%) $1 (7%) Upholstered furniture 20 (4%) 0 (0%) 3 (9%) $1 (7%) Interior wall covering 20 (4%) 0 (0%) 0 (0%) $1 (3%) Unclassified structural component or finish 10 (3%) 0 (0%) 0 (0%) $0 (0%) Multiple items first ignited 10 (3%) 0 (0%) 1 (5%) $0 (2%) Appliance housing or casing 10 (3%) 0 (0%) 0 (0%) $1 (6%) Structural member or framing 10 (3%) 5 (24%) 0 (0%) $1 (4%) Unclassified soft goods or clothing 10 (2%) 0 (0%) 1 (4%) $0 (2%) Cabinetry 10 (2%) 0 (0%) 0 (0%) $0 (1%) Clothing 10 (1%) 0 (0%) 0 (0%) $0 (3%) Other known item first ignited 40 (10%) 0 (0%) 1 (4%) $2 (11%) Total fires 440 (100%) 23 (100%) 29 (100%) $16 (100%) Note: Figures exclude confined fires, which are not considered relevant to these types of equipment, because these are fires reported to confined to fuel burner or boiler, chimney or flue, cooking vessel, trash, incinerator, or commercial compactor. These are national estimates of fires reported to U.S. municipal fire departments and so exclude fires reported only to Federal or state agencies or industrial fire brigades. National estimates are projections. Casualty and loss projections can be heavily influenced by the inclusion or exclusion of one unusually serious fire. Fires are rounded to the nearest ten, civilian deaths and injuries to the nearest one, and direct property damage to the nearest million dollars. Damage has not been adjusted for inflation. Figures reflect a proportional share of home fires with equipment involved in ignition unknown or recorded as electrical distribution or lighting equipment of undetermined type. Fires reported as “no equipment” but lacking a confirming specific heat source (codes 40-99) are also treated as unknown equipment and allocated. Home structure fires with this equipment and item first ignited unknown have also been allocated proportionally. Totals may not equal sums because of rounding. Source: Data from NFIRS Version 5.0 and NFPA survey.
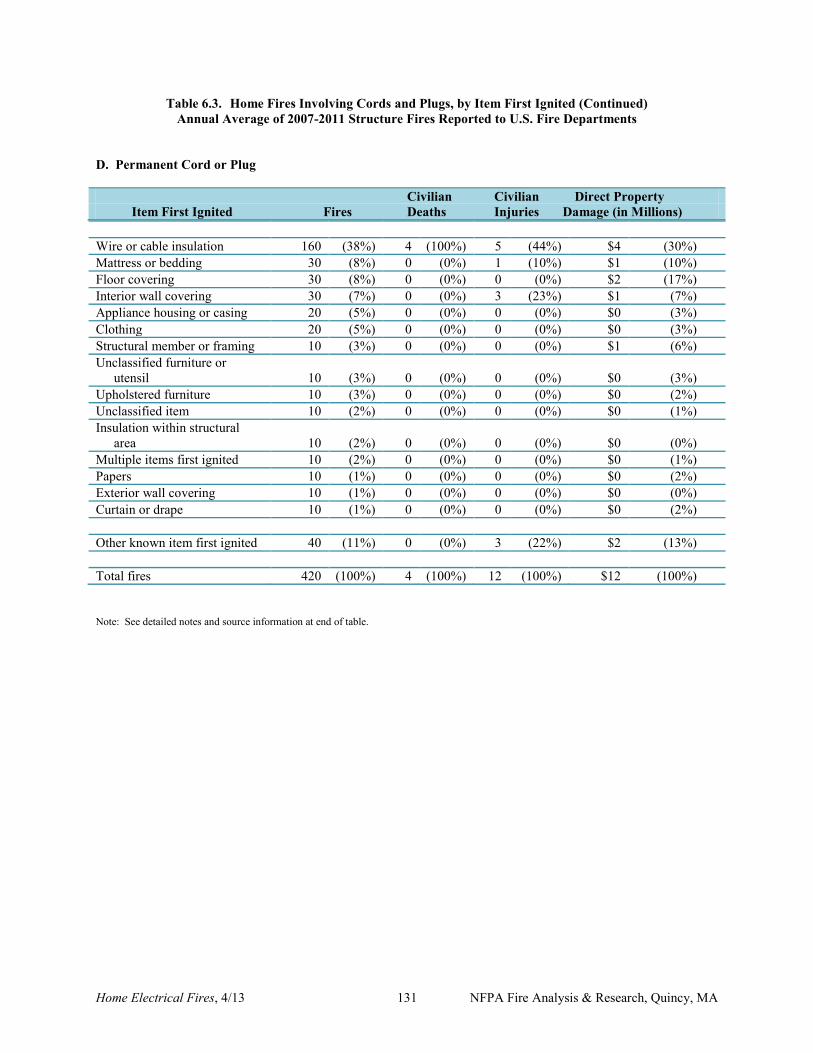
Home Electrical Fires, 4/13 131 NFPA Fire Analysis & Research, Quincy, MA
Table 6.3. Home Fires Involving Cords and Plugs, by Item First Ignited (Continued) Annual Average of 2007-2011 Structure Fires Reported to U.S. Fire Departments
D. Permanent Cord or Plug Civilian Civilian Direct Property Item First Ignited Fires Deaths Injuries Damage (in Millions) Wire or cable insulation 160 (38%) 4 (100%) 5 (44%) $4 (30%) Mattress or bedding 30 (8%) 0 (0%) 1 (10%) $1 (10%) Floor covering 30 (8%) 0 (0%) 0 (0%) $2 (17%) Interior wall covering 30 (7%) 0 (0%) 3 (23%) $1 (7%) Appliance housing or casing 20 (5%) 0 (0%) 0 (0%) $0 (3%) Clothing 20 (5%) 0 (0%) 0 (0%) $0 (3%) Structural member or framing 10 (3%) 0 (0%) 0 (0%) $1 (6%) Unclassified furniture or utensil 10 (3%) 0 (0%) 0 (0%) $0 (3%) Upholstered furniture 10 (3%) 0 (0%) 0 (0%) $0 (2%) Unclassified item 10 (2%) 0 (0%) 0 (0%) $0 (1%) Insulation within structural area 10 (2%) 0 (0%) 0 (0%) $0 (0%) Multiple items first ignited 10 (2%) 0 (0%) 0 (0%) $0 (1%) Papers 10 (1%) 0 (0%) 0 (0%) $0 (2%) Exterior wall covering 10 (1%) 0 (0%) 0 (0%) $0 (0%) Curtain or drape 10 (1%) 0 (0%) 0 (0%) $0 (2%) Other known item first ignited 40 (11%) 0 (0%) 3 (22%) $2 (13%) Total fires 420 (100%) 4 (100%) 12 (100%) $12 (100%) Note: See detailed notes and source information at end of table.
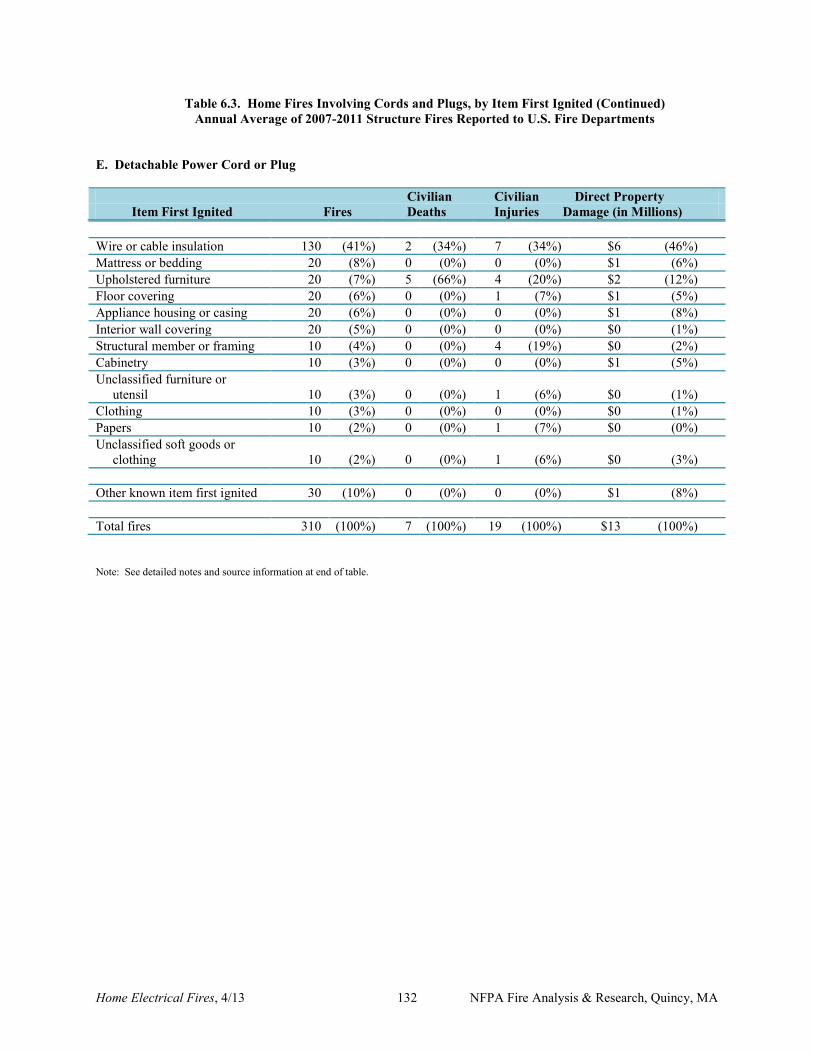
Home Electrical Fires, 4/13 132 NFPA Fire Analysis & Research, Quincy, MA
Table 6.3. Home Fires Involving Cords and Plugs, by Item First Ignited (Continued) Annual Average of 2007-2011 Structure Fires Reported to U.S. Fire Departments
E. Detachable Power Cord or Plug Civilian Civilian Direct Property Item First Ignited Fires Deaths Injuries Damage (in Millions) Wire or cable insulation 130 (41%) 2 (34%) 7 (34%) $6 (46%) Mattress or bedding 20 (8%) 0 (0%) 0 (0%) $1 (6%) Upholstered furniture 20 (7%) 5 (66%) 4 (20%) $2 (12%) Floor covering 20 (6%) 0 (0%) 1 (7%) $1 (5%) Appliance housing or casing 20 (6%) 0 (0%) 0 (0%) $1 (8%) Interior wall covering 20 (5%) 0 (0%) 0 (0%) $0 (1%) Structural member or framing 10 (4%) 0 (0%) 4 (19%) $0 (2%) Cabinetry 10 (3%) 0 (0%) 0 (0%) $1 (5%) Unclassified furniture or utensil 10 (3%) 0 (0%) 1 (6%) $0 (1%) Clothing 10 (3%) 0 (0%) 0 (0%) $0 (1%) Papers 10 (2%) 0 (0%) 1 (7%) $0 (0%) Unclassified soft goods or clothing 10 (2%) 0 (0%) 1 (6%) $0 (3%) Other known item first ignited 30 (10%) 0 (0%) 0 (0%) $1 (8%) Total fires 310 (100%) 7 (100%) 19 (100%) $13 (100%) Note: See detailed notes and source information at end of table.
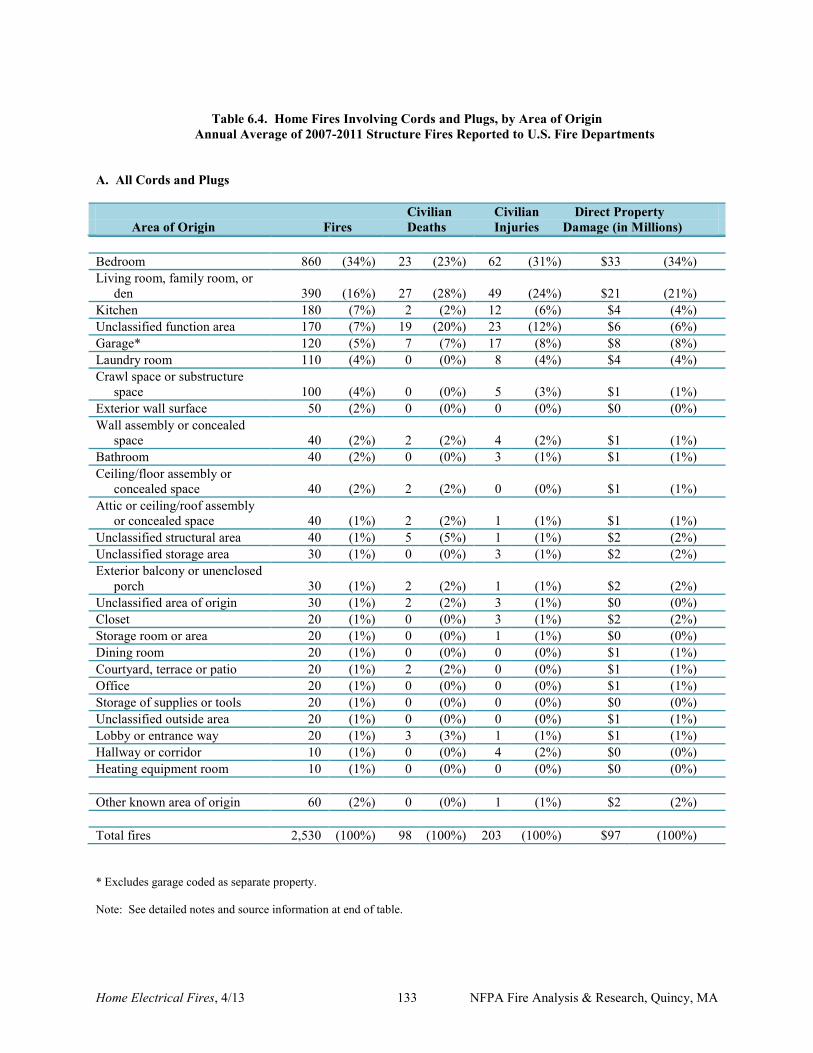
Home Electrical Fires, 4/13 133 NFPA Fire Analysis & Research, Quincy, MA
Table 6.4. Home Fires Involving Cords and Plugs, by Area of Origin
Annual Average of 2007-2011 Structure Fires Reported to U.S. Fire Departments
A. All Cords and Plugs
Civilian Civilian Direct Property Area of Origin Fires Deaths Injuries Damage (in Millions) Bedroom 860 (34%) 23 (23%) 62 (31%) $33 (34%) Living room, family room, or den 390 (16%) 27 (28%) 49 (24%) $21 (21%) Kitchen 180 (7%) 2 (2%) 12 (6%) $4 (4%) Unclassified function area 170 (7%) 19 (20%) 23 (12%) $6 (6%) Garage* 120 (5%) 7 (7%) 17 (8%) $8 (8%) Laundry room 110 (4%) 0 (0%) 8 (4%) $4 (4%) Crawl space or substructure space 100 (4%) 0 (0%) 5 (3%) $1 (1%) Exterior wall surface 50 (2%) 0 (0%) 0 (0%) $0 (0%) Wall assembly or concealed space 40 (2%) 2 (2%) 4 (2%) $1 (1%) Bathroom 40 (2%) 0 (0%) 3 (1%) $1 (1%) Ceiling/floor assembly or concealed space 40 (2%) 2 (2%) 0 (0%) $1 (1%) Attic or ceiling/roof assembly or concealed space 40 (1%) 2 (2%) 1 (1%) $1 (1%) Unclassified structural area 40 (1%) 5 (5%) 1 (1%) $2 (2%) Unclassified storage area 30 (1%) 0 (0%) 3 (1%) $2 (2%) Exterior balcony or unenclosed porch 30 (1%) 2 (2%) 1 (1%) $2 (2%) Unclassified area of origin 30 (1%) 2 (2%) 3 (1%) $0 (0%) Closet 20 (1%) 0 (0%) 3 (1%) $2 (2%) Storage room or area 20 (1%) 0 (0%) 1 (1%) $0 (0%) Dining room 20 (1%) 0 (0%) 0 (0%) $1 (1%) Courtyard, terrace or patio 20 (1%) 2 (2%) 0 (0%) $1 (1%) Office 20 (1%) 0 (0%) 0 (0%) $1 (1%) Storage of supplies or tools 20 (1%) 0 (0%) 0 (0%) $0 (0%) Unclassified outside area 20 (1%) 0 (0%) 0 (0%) $1 (1%) Lobby or entrance way 20 (1%) 3 (3%) 1 (1%) $1 (1%) Hallway or corridor 10 (1%) 0 (0%) 4 (2%) $0 (0%) Heating equipment room 10 (1%) 0 (0%) 0 (0%) $0 (0%) Other known area of origin 60 (2%) 0 (0%) 1 (1%) $2 (2%) Total fires 2,530 (100%) 98 (100%) 203 (100%) $97 (100%) * Excludes garage coded as separate property. Note: See detailed notes and source information at end of table.
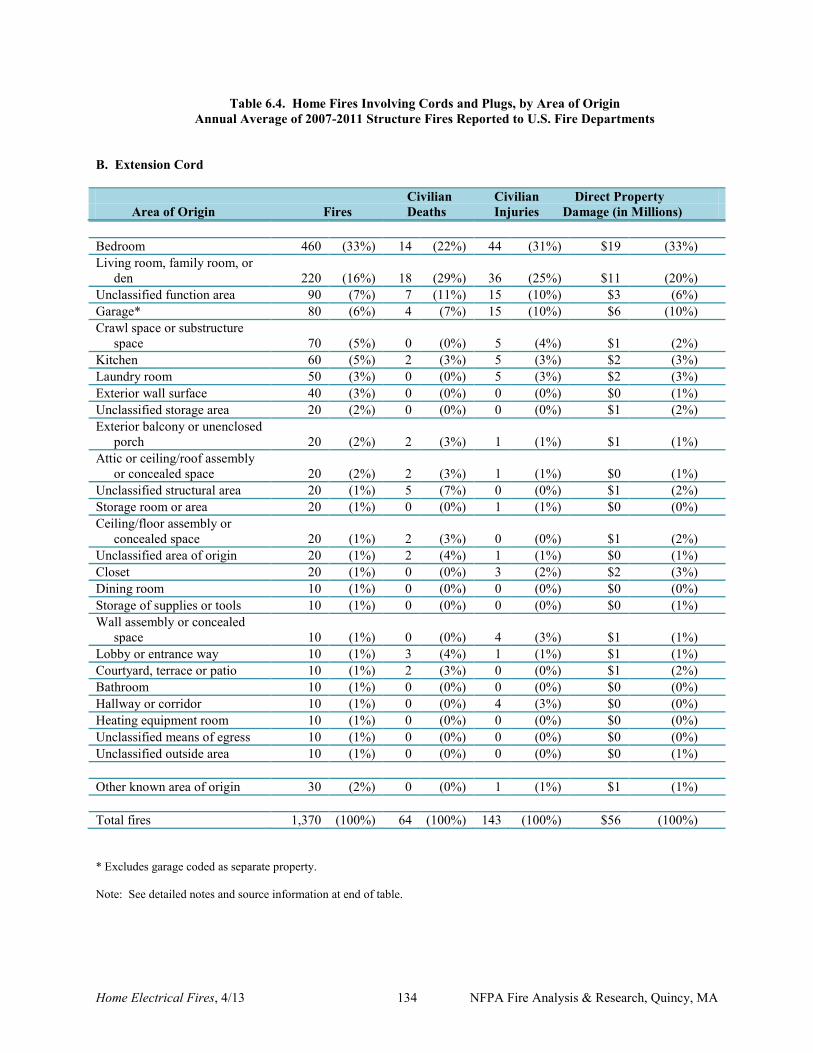
Home Electrical Fires, 4/13 134 NFPA Fire Analysis & Research, Quincy, MA
Table 6.4. Home Fires Involving Cords and Plugs, by Area of Origin Annual Average of 2007-2011 Structure Fires Reported to U.S. Fire Departments
B. Extension Cord
Civilian Civilian Direct Property Area of Origin Fires Deaths Injuries Damage (in Millions) Bedroom 460 (33%) 14 (22%) 44 (31%) $19 (33%) Living room, family room, or den 220 (16%) 18 (29%) 36 (25%) $11 (20%) Unclassified function area 90 (7%) 7 (11%) 15 (10%) $3 (6%) Garage* 80 (6%) 4 (7%) 15 (10%) $6 (10%) Crawl space or substructure space 70 (5%) 0 (0%) 5 (4%) $1 (2%) Kitchen 60 (5%) 2 (3%) 5 (3%) $2 (3%) Laundry room 50 (3%) 0 (0%) 5 (3%) $2 (3%) Exterior wall surface 40 (3%) 0 (0%) 0 (0%) $0 (1%) Unclassified storage area 20 (2%) 0 (0%) 0 (0%) $1 (2%) Exterior balcony or unenclosed porch 20 (2%) 2 (3%) 1 (1%) $1 (1%) Attic or ceiling/roof assembly or concealed space 20 (2%) 2 (3%) 1 (1%) $0 (1%) Unclassified structural area 20 (1%) 5 (7%) 0 (0%) $1 (2%) Storage room or area 20 (1%) 0 (0%) 1 (1%) $0 (0%) Ceiling/floor assembly or concealed space 20 (1%) 2 (3%) 0 (0%) $1 (2%) Unclassified area of origin 20 (1%) 2 (4%) 1 (1%) $0 (1%) Closet 20 (1%) 0 (0%) 3 (2%) $2 (3%) Dining room 10 (1%) 0 (0%) 0 (0%) $0 (0%) Storage of supplies or tools 10 (1%) 0 (0%) 0 (0%) $0 (1%) Wall assembly or concealed space 10 (1%) 0 (0%) 4 (3%) $1 (1%) Lobby or entrance way 10 (1%) 3 (4%) 1 (1%) $1 (1%) Courtyard, terrace or patio 10 (1%) 2 (3%) 0 (0%) $1 (2%) Bathroom 10 (1%) 0 (0%) 0 (0%) $0 (0%) Hallway or corridor 10 (1%) 0 (0%) 4 (3%) $0 (0%) Heating equipment room 10 (1%) 0 (0%) 0 (0%) $0 (0%) Unclassified means of egress 10 (1%) 0 (0%) 0 (0%) $0 (0%) Unclassified outside area 10 (1%) 0 (0%) 0 (0%) $0 (1%) Other known area of origin 30 (2%) 0 (0%) 1 (1%) $1 (1%) Total fires 1,370 (100%) 64 (100%) 143 (100%) $56 (100%) * Excludes garage coded as separate property. Note: See detailed notes and source information at end of table.
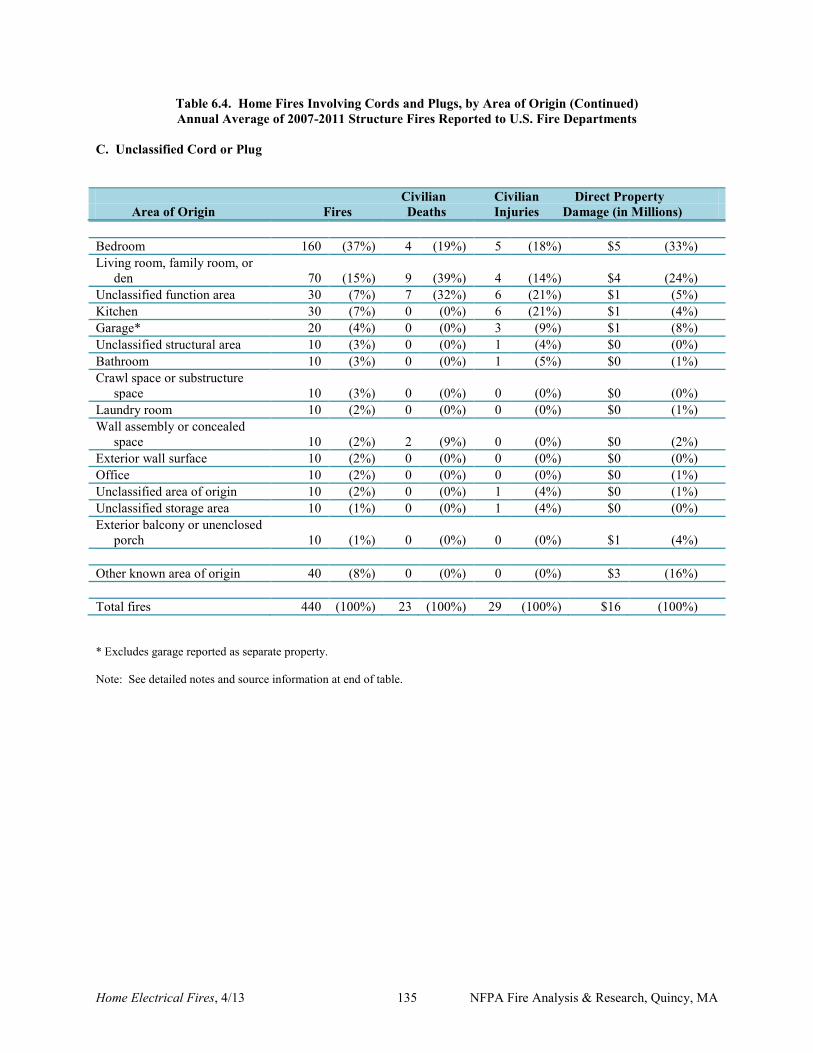
Home Electrical Fires, 4/13 135 NFPA Fire Analysis & Research, Quincy, MA
Table 6.4. Home Fires Involving Cords and Plugs, by Area of Origin (Continued) Annual Average of 2007-2011 Structure Fires Reported to U.S. Fire Departments
C. Unclassified Cord or Plug
Civilian Civilian Direct Property Area of Origin Fires Deaths Injuries Damage (in Millions) Bedroom 160 (37%) 4 (19%) 5 (18%) $5 (33%) Living room, family room, or den 70 (15%) 9 (39%) 4 (14%) $4 (24%) Unclassified function area 30 (7%) 7 (32%) 6 (21%) $1 (5%) Kitchen 30 (7%) 0 (0%) 6 (21%) $1 (4%) Garage* 20 (4%) 0 (0%) 3 (9%) $1 (8%) Unclassified structural area 10 (3%) 0 (0%) 1 (4%) $0 (0%) Bathroom 10 (3%) 0 (0%) 1 (5%) $0 (1%) Crawl space or substructure space 10 (3%) 0 (0%) 0 (0%) $0 (0%) Laundry room 10 (2%) 0 (0%) 0 (0%) $0 (1%) Wall assembly or concealed space 10 (2%) 2 (9%) 0 (0%) $0 (2%) Exterior wall surface 10 (2%) 0 (0%) 0 (0%) $0 (0%) Office 10 (2%) 0 (0%) 0 (0%) $0 (1%) Unclassified area of origin 10 (2%) 0 (0%) 1 (4%) $0 (1%) Unclassified storage area 10 (1%) 0 (0%) 1 (4%) $0 (0%) Exterior balcony or unenclosed porch 10 (1%) 0 (0%) 0 (0%) $1 (4%) Other known area of origin 40 (8%) 0 (0%) 0 (0%) $3 (16%) Total fires 440 (100%) 23 (100%) 29 (100%) $16 (100%) * Excludes garage reported as separate property. Note: See detailed notes and source information at end of table.
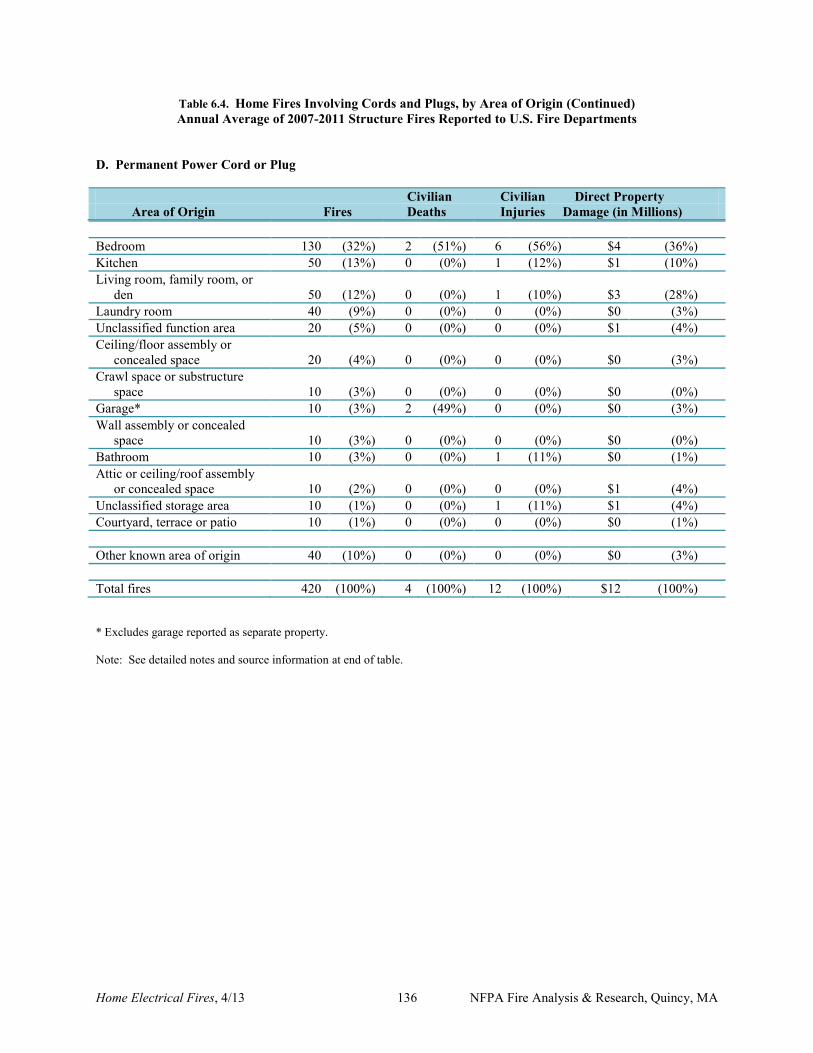
Home Electrical Fires, 4/13 136 NFPA Fire Analysis & Research, Quincy, MA
Table 6.4. Home Fires Involving Cords and Plugs, by Area of Origin (Continued) Annual Average of 2007-2011 Structure Fires Reported to U.S. Fire Departments
D. Permanent Power Cord or Plug Civilian Civilian Direct Property Area of Origin Fires Deaths Injuries Damage (in Millions) Bedroom 130 (32%) 2 (51%) 6 (56%) $4 (36%) Kitchen 50 (13%) 0 (0%) 1 (12%) $1 (10%) Living room, family room, or den 50 (12%) 0 (0%) 1 (10%) $3 (28%) Laundry room 40 (9%) 0 (0%) 0 (0%) $0 (3%) Unclassified function area 20 (5%) 0 (0%) 0 (0%) $1 (4%) Ceiling/floor assembly or concealed space 20 (4%) 0 (0%) 0 (0%) $0 (3%) Crawl space or substructure space 10 (3%) 0 (0%) 0 (0%) $0 (0%) Garage* 10 (3%) 2 (49%) 0 (0%) $0 (3%) Wall assembly or concealed space 10 (3%) 0 (0%) 0 (0%) $0 (0%) Bathroom 10 (3%) 0 (0%) 1 (11%) $0 (1%) Attic or ceiling/roof assembly or concealed space 10 (2%) 0 (0%) 0 (0%) $1 (4%) Unclassified storage area 10 (1%) 0 (0%) 1 (11%) $1 (4%) Courtyard, terrace or patio 10 (1%) 0 (0%) 0 (0%) $0 (1%) Other known area of origin 40 (10%) 0 (0%) 0 (0%) $0 (3%) Total fires 420 (100%) 4 (100%) 12 (100%) $12 (100%) * Excludes garage reported as separate property. Note: See detailed notes and source information at end of table.
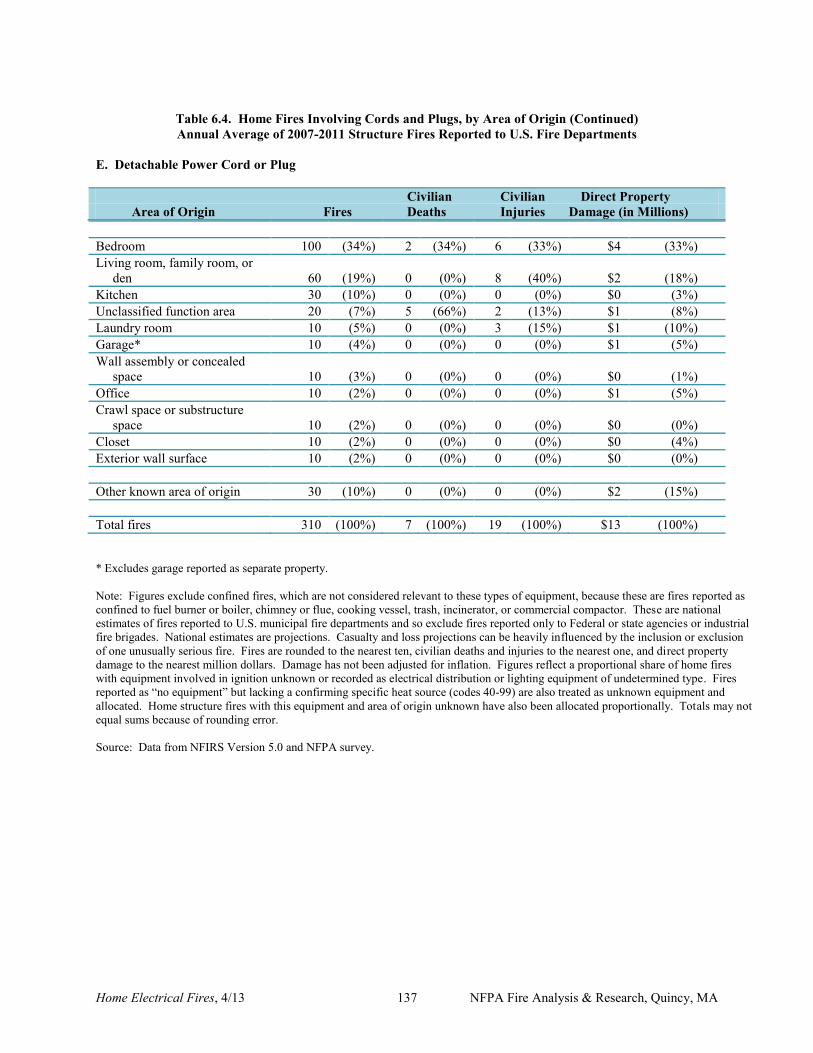
Home Electrical Fires, 4/13 137 NFPA Fire Analysis & Research, Quincy, MA
Table 6.4. Home Fires Involving Cords and Plugs, by Area of Origin (Continued) Annual Average of 2007-2011 Structure Fires Reported to U.S. Fire Departments
E. Detachable Power Cord or Plug Civilian Civilian Direct Property Area of Origin Fires Deaths Injuries Damage (in Millions) Bedroom 100 (34%) 2 (34%) 6 (33%) $4 (33%) Living room, family room, or den 60 (19%) 0 (0%) 8 (40%) $2 (18%) Kitchen 30 (10%) 0 (0%) 0 (0%) $0 (3%) Unclassified function area 20 (7%) 5 (66%) 2 (13%) $1 (8%) Laundry room 10 (5%) 0 (0%) 3 (15%) $1 (10%) Garage* 10 (4%) 0 (0%) 0 (0%) $1 (5%) Wall assembly or concealed space 10 (3%) 0 (0%) 0 (0%) $0 (1%) Office 10 (2%) 0 (0%) 0 (0%) $1 (5%) Crawl space or substructure space 10 (2%) 0 (0%) 0 (0%) $0 (0%) Closet 10 (2%) 0 (0%) 0 (0%) $0 (4%) Exterior wall surface 10 (2%) 0 (0%) 0 (0%) $0 (0%) Other known area of origin 30 (10%) 0 (0%) 0 (0%) $2 (15%) Total fires 310 (100%) 7 (100%) 19 (100%) $13 (100%) * Excludes garage reported as separate property. Note: Figures exclude confined fires, which are not considered relevant to these types of equipment, because these are fires reported as confined to fuel burner or boiler, chimney or flue, cooking vessel, trash, incinerator, or commercial compactor. These are national estimates of fires reported to U.S. municipal fire departments and so exclude fires reported only to Federal or state agencies or industrial fire brigades. National estimates are projections. Casualty and loss projections can be heavily influenced by the inclusion or exclusion of one unusually serious fire. Fires are rounded to the nearest ten, civilian deaths and injuries to the nearest one, and direct property damage to the nearest million dollars. Damage has not been adjusted for inflation. Figures reflect a proportional share of home fires with equipment involved in ignition unknown or recorded as electrical distribution or lighting equipment of undetermined type. Fires reported as “no equipment” but lacking a confirming specific heat source (codes 40-99) are also treated as unknown equipment and allocated. Home structure fires with this equipment and area of origin unknown have also been allocated proportionally. Totals may not equal sums because of rounding error. Source: Data from NFIRS Version 5.0 and NFPA survey.

Home Electrical Fires, 4/13 138 NFPA Fire Analysis & Research, Quincy, MA
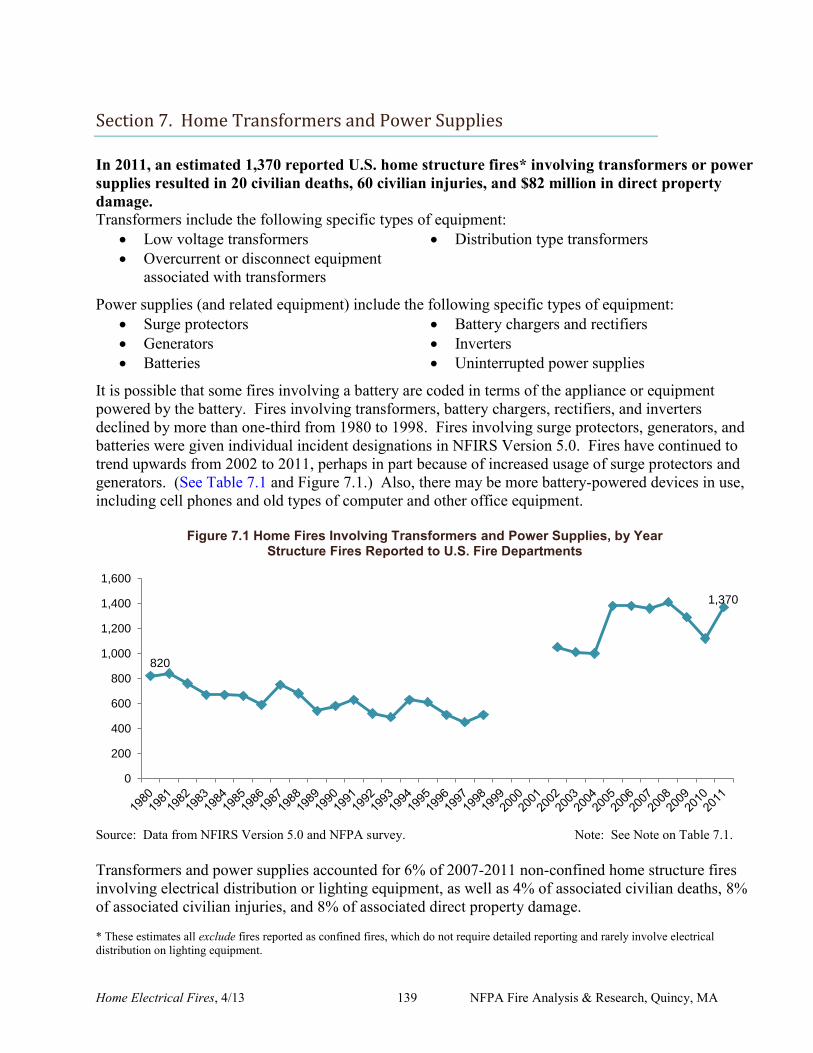
Home Electrical Fires, 4/13 139 NFPA Fire Analysis & Research, Quincy, MA
Section 7. Home Transformers and Power Supplies
In 2011, an estimated 1,370 reported U.S. home structure fires* involving transformers or power supplies resulted in 20 civilian deaths, 60 civilian injuries, and $82 million in direct property damage. Transformers include the following specific types of equipment:
Low voltage transformers Distribution type transformers Overcurrent or disconnect equipment
associated with transformers
Power supplies (and related equipment) include the following specific types of equipment: Surge protectors Battery chargers and rectifiers Generators Inverters Batteries Uninterrupted power supplies
It is possible that some fires involving a battery are coded in terms of the appliance or equipment powered by the battery. Fires involving transformers, battery chargers, rectifiers, and inverters declined by more than one-third from 1980 to 1998. Fires involving surge protectors, generators, and batteries were given individual incident designations in NFIRS Version 5.0. Fires have continued to trend upwards from 2002 to 2011, perhaps in part because of increased usage of surge protectors and generators. (See Table 7.1 and Figure 7.1.) Also, there may be more battery-powered devices in use, including cell phones and old types of computer and other office equipment.
Figure 7.1 Home Fires Involving Transformers and Power Supplies, by Year Structure Fires Reported to U.S. Fire Departments
Source: Data from NFIRS Version 5.0 and NFPA survey. Note: See Note on Table 7.1. Transformers and power supplies accounted for 6% of 2007-2011 non-confined home structure fires involving electrical distribution or lighting equipment, as well as 4% of associated civilian deaths, 8% of associated civilian injuries, and 8% of associated direct property damage. * These estimates all exclude fires reported as confined fires, which do not require detailed reporting and rarely involve electrical distribution on lighting equipment.
820
1,370
0
200
400
600
800
1,000
1,200
1,400
1,600
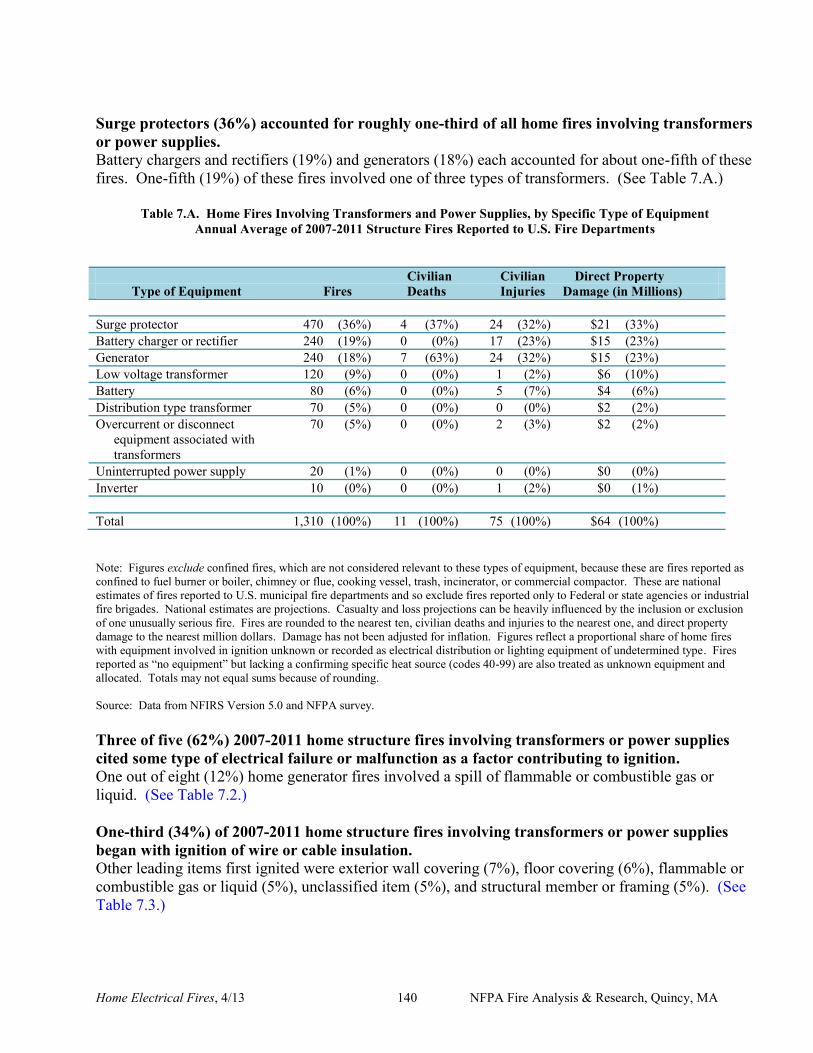
Home Electrical Fires, 4/13 140 NFPA Fire Analysis & Research, Quincy, MA
Surge protectors (36%) accounted for roughly one-third of all home fires involving transformers or power supplies. Battery chargers and rectifiers (19%) and generators (18%) each accounted for about one-fifth of these fires. One-fifth (19%) of these fires involved one of three types of transformers. (See Table 7.A.)
Table 7.A. Home Fires Involving Transformers and Power Supplies, by Specific Type of Equipment Annual Average of 2007-2011 Structure Fires Reported to U.S. Fire Departments
Civilian Civilian Direct Property Type of Equipment Fires Deaths Injuries Damage (in Millions) Surge protector 470 (36%) 4 (37%) 24 (32%) $21 (33%) Battery charger or rectifier 240 (19%) 0 (0%) 17 (23%) $15 (23%) Generator 240 (18%) 7 (63%) 24 (32%) $15 (23%) Low voltage transformer 120 (9%) 0 (0%) 1 (2%) $6 (10%) Battery 80 (6%) 0 (0%) 5 (7%) $4 (6%) Distribution type transformer 70 (5%) 0 (0%) 0 (0%) $2 (2%) Overcurrent or disconnect 70 (5%) 0 (0%) 2 (3%) $2 (2%) equipment associated with transformers Uninterrupted power supply 20 (1%) 0 (0%) 0 (0%) $0 (0%) Inverter 10 (0%) 0 (0%) 1 (2%) $0 (1%) Total 1,310 (100%) 11 (100%) 75 (100%) $64 (100%) Note: Figures exclude confined fires, which are not considered relevant to these types of equipment, because these are fires reported as confined to fuel burner or boiler, chimney or flue, cooking vessel, trash, incinerator, or commercial compactor. These are national estimates of fires reported to U.S. municipal fire departments and so exclude fires reported only to Federal or state agencies or industrial fire brigades. National estimates are projections. Casualty and loss projections can be heavily influenced by the inclusion or exclusion of one unusually serious fire. Fires are rounded to the nearest ten, civilian deaths and injuries to the nearest one, and direct property damage to the nearest million dollars. Damage has not been adjusted for inflation. Figures reflect a proportional share of home fires with equipment involved in ignition unknown or recorded as electrical distribution or lighting equipment of undetermined type. Fires reported as “no equipment” but lacking a confirming specific heat source (codes 40-99) are also treated as unknown equipment and allocated. Totals may not equal sums because of rounding. Source: Data from NFIRS Version 5.0 and NFPA survey. Three of five (62%) 2007-2011 home structure fires involving transformers or power supplies cited some type of electrical failure or malfunction as a factor contributing to ignition. One out of eight (12%) home generator fires involved a spill of flammable or combustible gas or liquid. (See Table 7.2.) One-third (34%) of 2007-2011 home structure fires involving transformers or power supplies began with ignition of wire or cable insulation. Other leading items first ignited were exterior wall covering (7%), floor covering (6%), flammable or combustible gas or liquid (5%), unclassified item (5%), and structural member or framing (5%). (See Table 7.3.)
Home Electrical Fires, 4/13 141 NFPA Fire Analysis & Research, Quincy, MA
More than one-third (37%) of 2007-2011 home structure fires involving transformers or power supplies began in one of the principal types of occupiable rooms – bedroom (20%), living room, family room, or den (14%), and kitchen (3%). One in six (16%) began in a garage, most of which were battery chargers or rectifiers (43% of these fires began in a garage). (See Table 7.4.) In 2011, an estimated 14,260 injuries involving transformers or power supplies were reported to hospital emergency rooms.24 These consisted of 12,370 battery injuries, 2,560 generator injuries, and 1,120 battery charger injuries. The largest share of the 14,260 injuries was 5,360 injuries due to ingested object, followed by 1,570 contusions and abrasions and 1,180 lacerations. In 1999 to 2011, 695 people died of non-fire injuries from unvented carbon monoxide from generators, or 58 deaths per year.25 Generators are the only electrical distribution or lighting equipment that burn fuel, which makes them the only electrical distribution or lighting equipment that generates carbon monoxide. (Fueled lighting devices are not included in the scope of this report.) The death toll from carbon monoxide produced by generators has increased sharply in recent years until 2007, from less than 10 per year on average in 1999 and prior years to 19 per year in 2000-2001, 47 per year in 2002-2004, peaking at 92 per year in 2005-2006, then falling to 72 per year in 2007-2009, down to 39 in 2010, and back up to 73 in 2011. The large jump in deaths involving generators in 2000 may reflect the fact that roughly half the total generators in use in 2000 had been purchased in 1999 because of concerns over Y2K (year 2000) problems with the nation’s power grid.26 This meant a large number of generator users had no experience in safe generator use. Disasters like Hurricane Katrina and a series of Florida hurricanes have added to the demand for generators and probably added to the number of inexperienced users. The U.S. Consumer Product Safety Commission examined the circumstances of the 695 non-fire carbon monoxide generator deaths in 1999-2011. One-eighth (84 deaths) of the 687 deaths in known locations occurred in temporary shelters. Of the 755 deaths where the reason for generator use was known:
30% involved generator usage because of a weather-related power outage (29%) or because of preparation for a coming storm (1%),
30% involved generator usage because power had been shut off because of non-payment (19%) or because power had not been turned on in a building still under construction (11%),
24 Statistics from National Electronic Injury Surveillance System (NEISS) data obtained from the U.S. Consumer Product Safety Commission (CPSC) website, www.cpsc.gov. 25 Matthew V. Hnatov, Incidents, deaths and in-depth investigations associated with non-fire carbon monoxide from engine-driven generators and other engine-driven tools, 1999-2011, U.S. Consumer Product Safety Commission, July 2011, accessed at www.cpsc.gov. 26 Portable Generators, U.S. Consumer Product Safety Commission, May 20, 2004, accessed at www.cpsc.gov.
Home Electrical Fires, 4/13 142 NFPA Fire Analysis & Research, Quincy, MA
22% involved generator use in either a building that does normally have power (7%) or a property separate from the main housing unit (15%), such as a storage shed, trailer, boat, camper, cabin, or campsite, and
19% involved generator use in a power outage due to unknown reasons (16%) or for miscellaneous other reasons (3%).
Safety Tips Generators
Use generators only in well-ventilated areas outdoors, away from all doors, windows, and vent openings. This is to avoid serious danger of carbon monoxide poisoning from exhaust fumes.
Generators should be operated and refueled in accordance with manufacturer’s instructions.
Do not use a generator that is in poor condition. Make sure the equipment is not overloaded. Carefully follow manufacturer’s instructions when using any of these devices. Install carbon monoxide alarms, powered by batteries or with battery back-up to a line
voltage connection by hard-wiring or plug-in, in accordance with manufacturer’s instructions.
Backfeeding electrical systems can be dangerous. Use a suitable transfer switch that prevents the inadvertent interconnection of the normal and standby sources of supply.
More of NFPA’s electrical safety information is available on our website at www.nfpa.org/electricalfires.
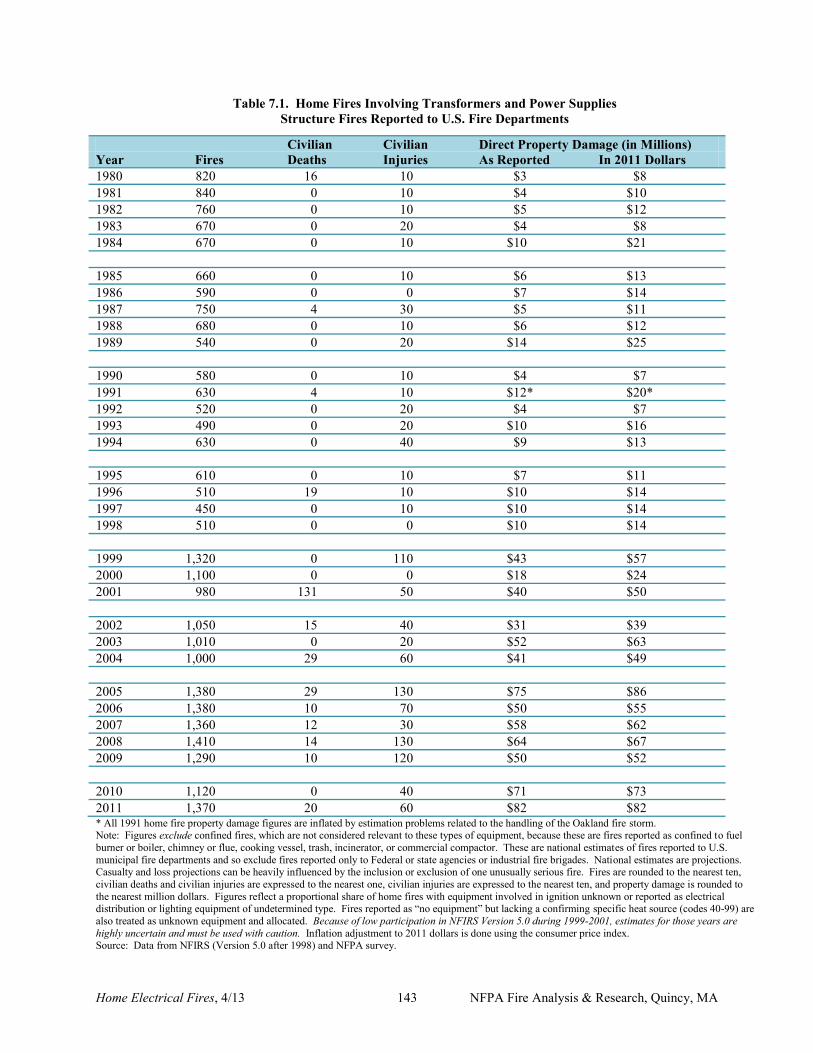
Home Electrical Fires, 4/13 143 NFPA Fire Analysis & Research, Quincy, MA
Table 7.1. Home Fires Involving Transformers and Power Supplies Structure Fires Reported to U.S. Fire Departments
Civilian Civilian Direct Property Damage (in Millions) Year Fires Deaths Injuries As Reported In 2011 Dollars 1980 820 16 10 $3 $8 1981 840 0 10 $4 $10 1982 760 0 10 $5 $12 1983 670 0 20 $4 $8 1984 670 0 10 $10 $21 1985 660 0 10 $6 $13 1986 590 0 0 $7 $14 1987 750 4 30 $5 $11 1988 680 0 10 $6 $12 1989 540 0 20 $14 $25 1990 580 0 10 $4 $7 1991 630 4 10 $12* $20* 1992 520 0 20 $4 $7 1993 490 0 20 $10 $16 1994 630 0 40 $9 $13 1995 610 0 10 $7 $11 1996 510 19 10 $10 $14 1997 450 0 10 $10 $14 1998 510 0 0 $10 $14 1999 1,320 0 110 $43 $57 2000 1,100 0 0 $18 $24 2001 980 131 50 $40 $50 2002 1,050 15 40 $31 $39 2003 1,010 0 20 $52 $63 2004 1,000 29 60 $41 $49 2005 1,380 29 130 $75 $86 2006 1,380 10 70 $50 $55 2007 1,360 12 30 $58 $62 2008 1,410 14 130 $64 $67 2009 1,290 10 120 $50 $52 2010 1,120 0 40 $71 $73 2011 1,370 20 60 $82 $82 * All 1991 home fire property damage figures are inflated by estimation problems related to the handling of the Oakland fire storm. Note: Figures exclude confined fires, which are not considered relevant to these types of equipment, because these are fires reported as confined to fuel burner or boiler, chimney or flue, cooking vessel, trash, incinerator, or commercial compactor. These are national estimates of fires reported to U.S. municipal fire departments and so exclude fires reported only to Federal or state agencies or industrial fire brigades. National estimates are projections. Casualty and loss projections can be heavily influenced by the inclusion or exclusion of one unusually serious fire. Fires are rounded to the nearest ten, civilian deaths and civilian injuries are expressed to the nearest one, civilian injuries are expressed to the nearest ten, and property damage is rounded to the nearest million dollars. Figures reflect a proportional share of home fires with equipment involved in ignition unknown or reported as electrical distribution or lighting equipment of undetermined type. Fires reported as “no equipment” but lacking a confirming specific heat source (codes 40-99) are also treated as unknown equipment and allocated. Because of low participation in NFIRS Version 5.0 during 1999-2001, estimates for those years are highly uncertain and must be used with caution. Inflation adjustment to 2011 dollars is done using the consumer price index. Source: Data from NFIRS (Version 5.0 after 1998) and NFPA survey.
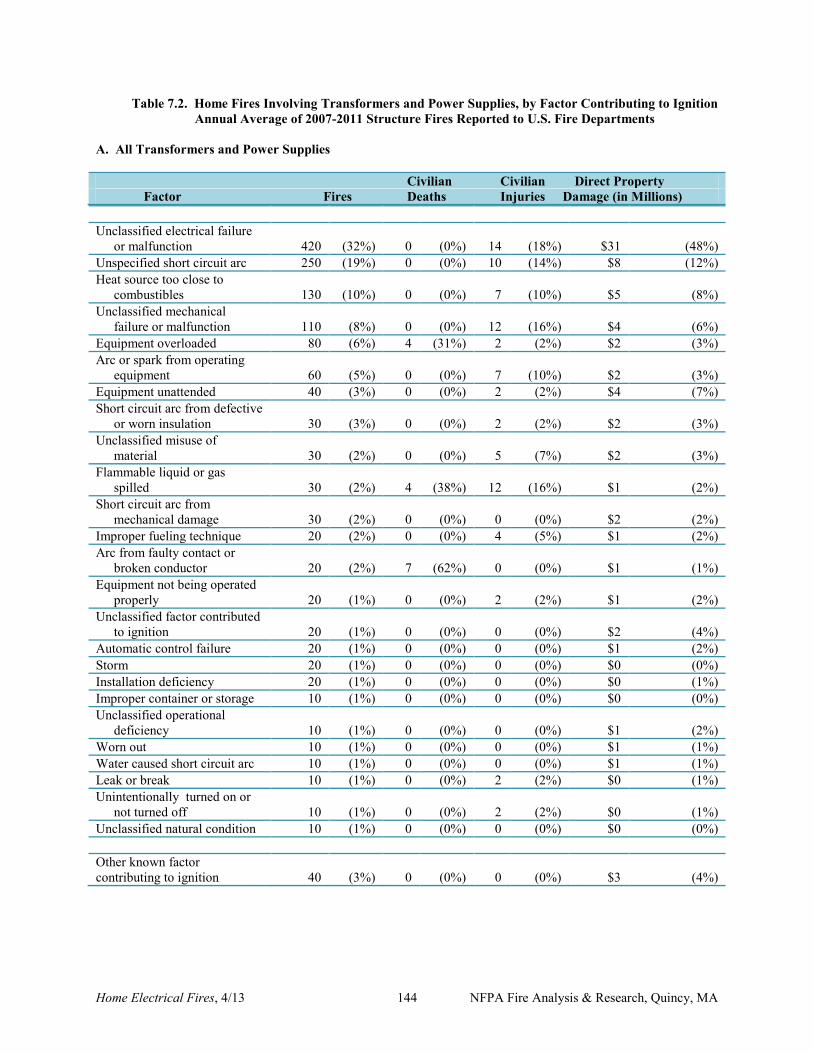
Home Electrical Fires, 4/13 144 NFPA Fire Analysis & Research, Quincy, MA
Table 7.2. Home Fires Involving Transformers and Power Supplies, by Factor Contributing to Ignition Annual Average of 2007-2011 Structure Fires Reported to U.S. Fire Departments
A. All Transformers and Power Supplies Civilian Civilian Direct Property Factor Fires Deaths Injuries Damage (in Millions) Unclassified electrical failure or malfunction 420 (32%) 0 (0%) 14 (18%) $31 (48%) Unspecified short circuit arc 250 (19%) 0 (0%) 10 (14%) $8 (12%) Heat source too close to combustibles 130 (10%) 0 (0%) 7 (10%) $5 (8%) Unclassified mechanical failure or malfunction 110 (8%) 0 (0%) 12 (16%) $4 (6%) Equipment overloaded 80 (6%) 4 (31%) 2 (2%) $2 (3%) Arc or spark from operating equipment 60 (5%) 0 (0%) 7 (10%) $2 (3%) Equipment unattended 40 (3%) 0 (0%) 2 (2%) $4 (7%) Short circuit arc from defective or worn insulation 30 (3%) 0 (0%) 2 (2%) $2 (3%) Unclassified misuse of material 30 (2%) 0 (0%) 5 (7%) $2 (3%) Flammable liquid or gas spilled 30 (2%) 4 (38%) 12 (16%) $1 (2%) Short circuit arc from mechanical damage 30 (2%) 0 (0%) 0 (0%) $2 (2%) Improper fueling technique 20 (2%) 0 (0%) 4 (5%) $1 (2%) Arc from faulty contact or broken conductor 20 (2%) 7 (62%) 0 (0%) $1 (1%) Equipment not being operated properly 20 (1%) 0 (0%) 2 (2%) $1 (2%) Unclassified factor contributed to ignition 20 (1%) 0 (0%) 0 (0%) $2 (4%) Automatic control failure 20 (1%) 0 (0%) 0 (0%) $1 (2%) Storm 20 (1%) 0 (0%) 0 (0%) $0 (0%) Installation deficiency 20 (1%) 0 (0%) 0 (0%) $0 (1%) Improper container or storage 10 (1%) 0 (0%) 0 (0%) $0 (0%) Unclassified operational deficiency 10 (1%) 0 (0%) 0 (0%) $1 (2%) Worn out 10 (1%) 0 (0%) 0 (0%) $1 (1%) Water caused short circuit arc 10 (1%) 0 (0%) 0 (0%) $1 (1%) Leak or break 10 (1%) 0 (0%) 2 (2%) $0 (1%) Unintentionally turned on or not turned off 10 (1%) 0 (0%) 2 (2%) $0 (1%) Unclassified natural condition 10 (1%) 0 (0%) 0 (0%) $0 (0%) Other known factor contributing to ignition 40 (3%) 0 (0%) 0 (0%) $3 (4%)
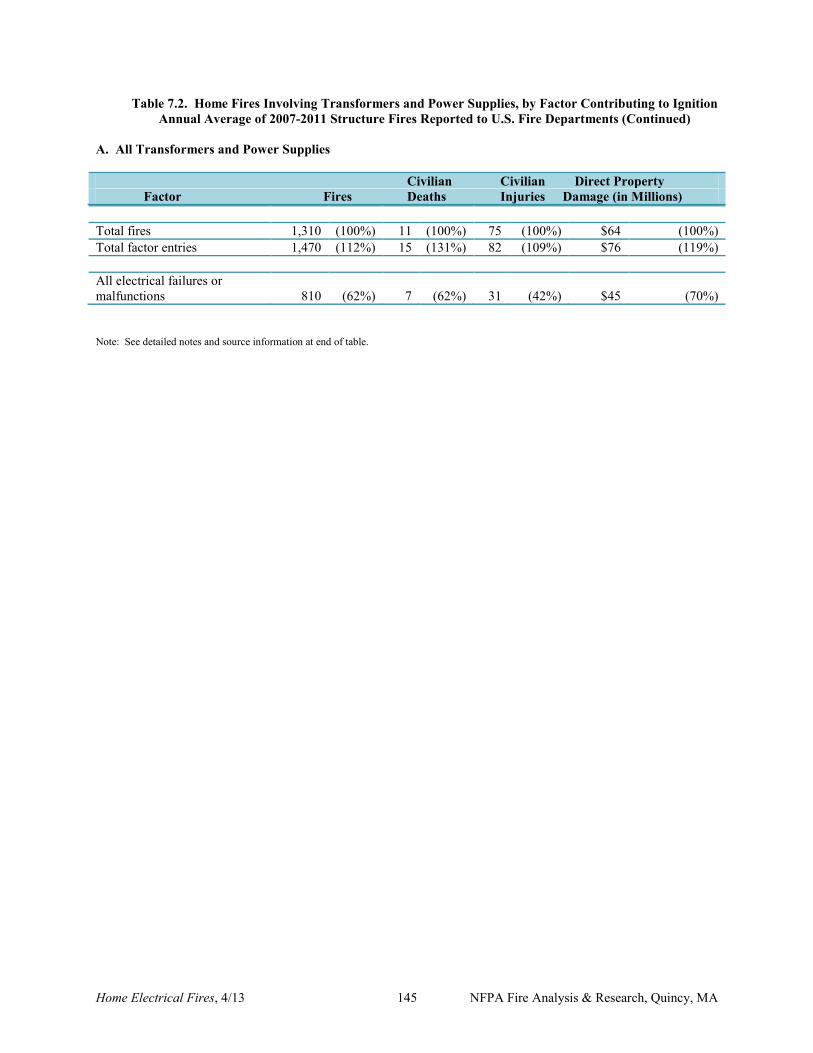
Home Electrical Fires, 4/13 145 NFPA Fire Analysis & Research, Quincy, MA
Table 7.2. Home Fires Involving Transformers and Power Supplies, by Factor Contributing to Ignition Annual Average of 2007-2011 Structure Fires Reported to U.S. Fire Departments (Continued)
A. All Transformers and Power Supplies Civilian Civilian Direct Property Factor Fires Deaths Injuries Damage (in Millions) Total fires 1,310 (100%) 11 (100%) 75 (100%) $64 (100%) Total factor entries 1,470 (112%) 15 (131%) 82 (109%) $76 (119%) All electrical failures or malfunctions 810 (62%) 7 (62%) 31 (42%) $45 (70%) Note: See detailed notes and source information at end of table.
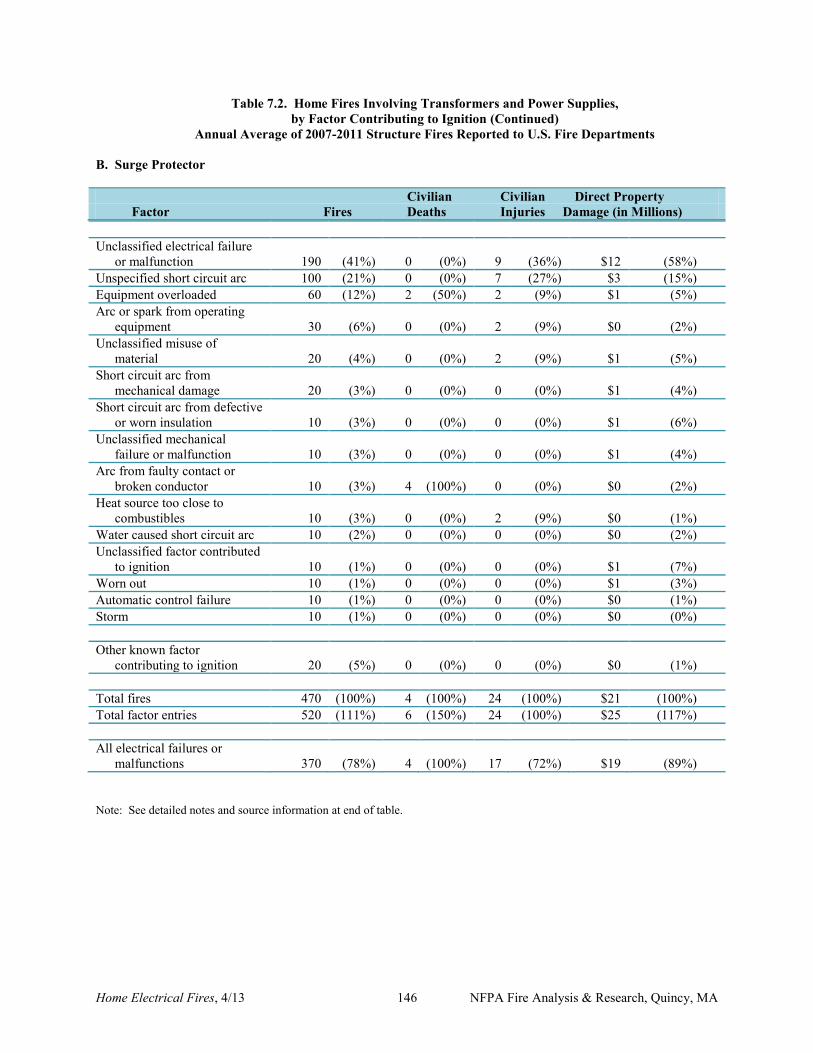
Home Electrical Fires, 4/13 146 NFPA Fire Analysis & Research, Quincy, MA
Table 7.2. Home Fires Involving Transformers and Power Supplies, by Factor Contributing to Ignition (Continued)
Annual Average of 2007-2011 Structure Fires Reported to U.S. Fire Departments B. Surge Protector Civilian Civilian Direct Property Factor Fires Deaths Injuries Damage (in Millions) Unclassified electrical failure or malfunction 190 (41%) 0 (0%) 9 (36%) $12 (58%) Unspecified short circuit arc 100 (21%) 0 (0%) 7 (27%) $3 (15%) Equipment overloaded 60 (12%) 2 (50%) 2 (9%) $1 (5%) Arc or spark from operating equipment 30 (6%) 0 (0%) 2 (9%) $0 (2%) Unclassified misuse of material 20 (4%) 0 (0%) 2 (9%) $1 (5%) Short circuit arc from mechanical damage 20 (3%) 0 (0%) 0 (0%) $1 (4%) Short circuit arc from defective or worn insulation 10 (3%) 0 (0%) 0 (0%) $1 (6%) Unclassified mechanical failure or malfunction 10 (3%) 0 (0%) 0 (0%) $1 (4%) Arc from faulty contact or broken conductor 10 (3%) 4 (100%) 0 (0%) $0 (2%) Heat source too close to combustibles 10 (3%) 0 (0%) 2 (9%) $0 (1%) Water caused short circuit arc 10 (2%) 0 (0%) 0 (0%) $0 (2%) Unclassified factor contributed to ignition 10 (1%) 0 (0%) 0 (0%) $1 (7%) Worn out 10 (1%) 0 (0%) 0 (0%) $1 (3%) Automatic control failure 10 (1%) 0 (0%) 0 (0%) $0 (1%) Storm 10 (1%) 0 (0%) 0 (0%) $0 (0%) Other known factor contributing to ignition 20 (5%) 0 (0%) 0 (0%) $0 (1%) Total fires 470 (100%) 4 (100%) 24 (100%) $21 (100%) Total factor entries 520 (111%) 6 (150%) 24 (100%) $25 (117%) All electrical failures or malfunctions 370 (78%) 4 (100%) 17 (72%) $19 (89%) Note: See detailed notes and source information at end of table.
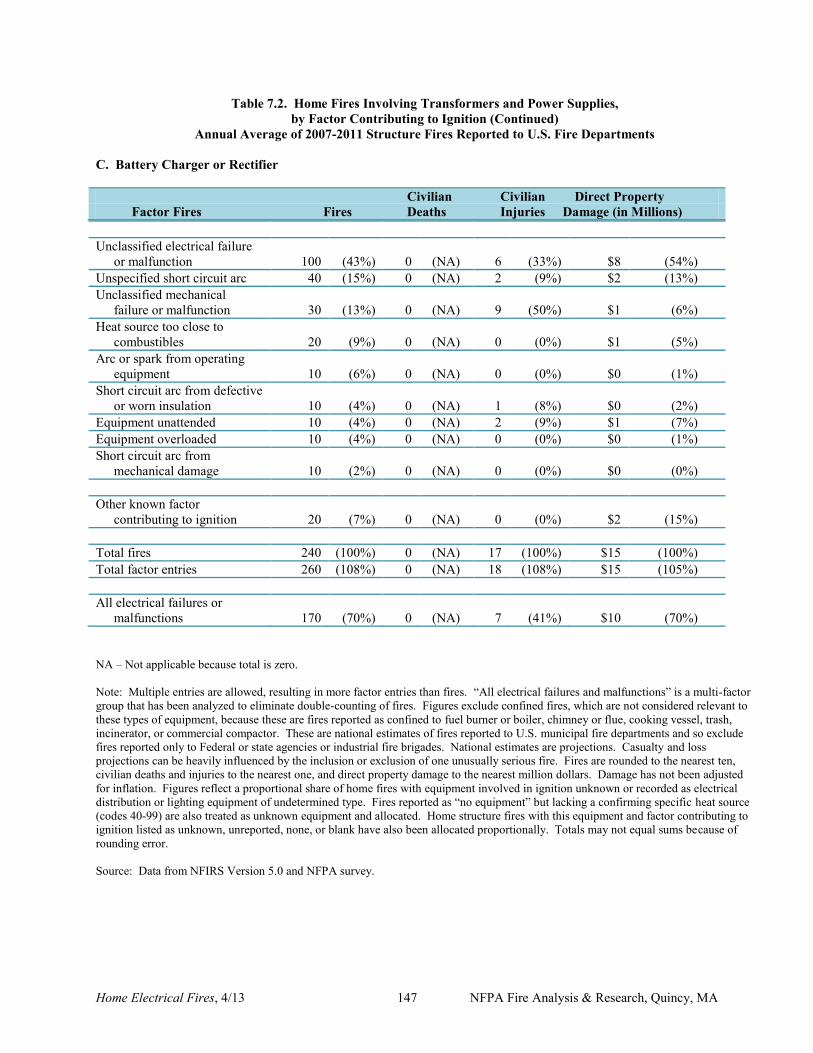
Home Electrical Fires, 4/13 147 NFPA Fire Analysis & Research, Quincy, MA
Table 7.2. Home Fires Involving Transformers and Power Supplies, by Factor Contributing to Ignition (Continued)
Annual Average of 2007-2011 Structure Fires Reported to U.S. Fire Departments C. Battery Charger or Rectifier Civilian Civilian Direct Property Factor Fires Fires Deaths Injuries Damage (in Millions) Unclassified electrical failure or malfunction 100 (43%) 0 (NA) 6 (33%) $8 (54%) Unspecified short circuit arc 40 (15%) 0 (NA) 2 (9%) $2 (13%) Unclassified mechanical failure or malfunction 30 (13%) 0 (NA) 9 (50%) $1 (6%) Heat source too close to combustibles 20 (9%) 0 (NA) 0 (0%) $1 (5%) Arc or spark from operating equipment 10 (6%) 0 (NA) 0 (0%) $0 (1%) Short circuit arc from defective or worn insulation 10 (4%) 0 (NA) 1 (8%) $0 (2%) Equipment unattended 10 (4%) 0 (NA) 2 (9%) $1 (7%) Equipment overloaded 10 (4%) 0 (NA) 0 (0%) $0 (1%) Short circuit arc from mechanical damage 10 (2%) 0 (NA) 0 (0%) $0 (0%) Other known factor contributing to ignition 20 (7%) 0 (NA) 0 (0%) $2 (15%) Total fires 240 (100%) 0 (NA) 17 (100%) $15 (100%) Total factor entries 260 (108%) 0 (NA) 18 (108%) $15 (105%) All electrical failures or malfunctions 170 (70%) 0 (NA) 7 (41%) $10 (70%) NA – Not applicable because total is zero. Note: Multiple entries are allowed, resulting in more factor entries than fires. “All electrical failures and malfunctions” is a multi-factor group that has been analyzed to eliminate double-counting of fires. Figures exclude confined fires, which are not considered relevant to these types of equipment, because these are fires reported as confined to fuel burner or boiler, chimney or flue, cooking vessel, trash, incinerator, or commercial compactor. These are national estimates of fires reported to U.S. municipal fire departments and so exclude fires reported only to Federal or state agencies or industrial fire brigades. National estimates are projections. Casualty and loss projections can be heavily influenced by the inclusion or exclusion of one unusually serious fire. Fires are rounded to the nearest ten, civilian deaths and injuries to the nearest one, and direct property damage to the nearest million dollars. Damage has not been adjusted for inflation. Figures reflect a proportional share of home fires with equipment involved in ignition unknown or recorded as electrical distribution or lighting equipment of undetermined type. Fires reported as “no equipment” but lacking a confirming specific heat source (codes 40-99) are also treated as unknown equipment and allocated. Home structure fires with this equipment and factor contributing to ignition listed as unknown, unreported, none, or blank have also been allocated proportionally. Totals may not equal sums because of rounding error. Source: Data from NFIRS Version 5.0 and NFPA survey.
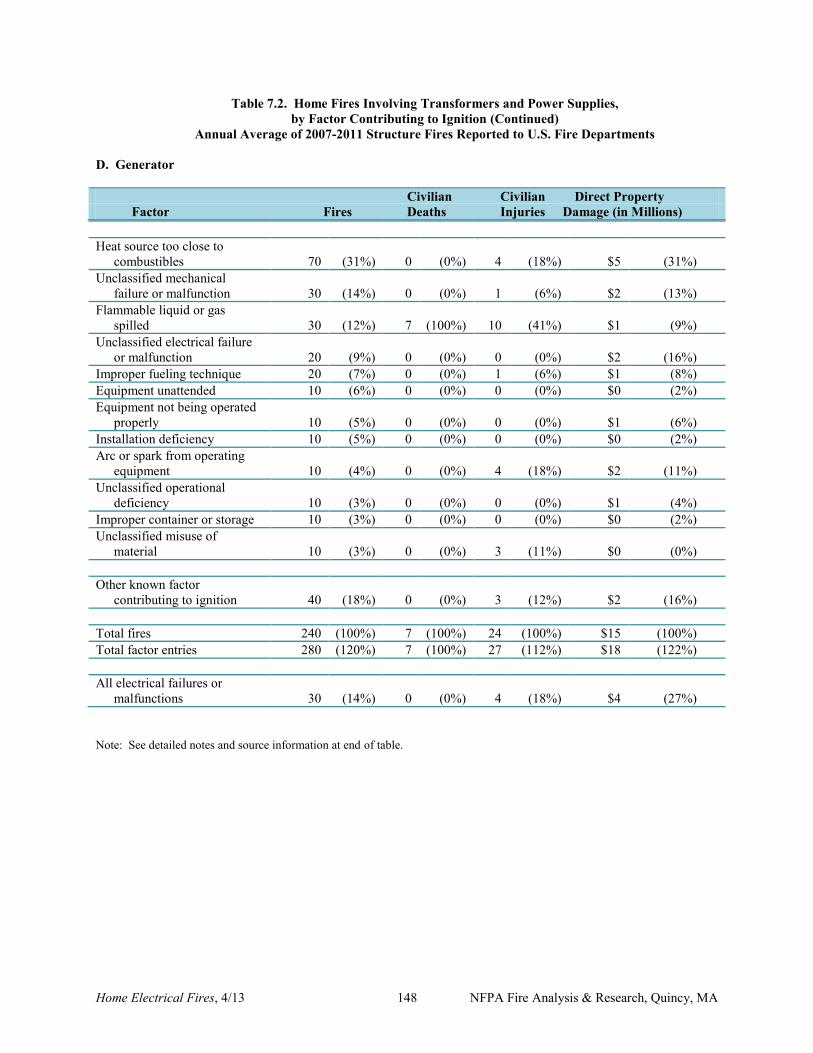
Home Electrical Fires, 4/13 148 NFPA Fire Analysis & Research, Quincy, MA
Table 7.2. Home Fires Involving Transformers and Power Supplies, by Factor Contributing to Ignition (Continued)
Annual Average of 2007-2011 Structure Fires Reported to U.S. Fire Departments D. Generator Civilian Civilian Direct Property Factor Fires Deaths Injuries Damage (in Millions) Heat source too close to combustibles 70 (31%) 0 (0%) 4 (18%) $5 (31%) Unclassified mechanical failure or malfunction 30 (14%) 0 (0%) 1 (6%) $2 (13%) Flammable liquid or gas spilled 30 (12%) 7 (100%) 10 (41%) $1 (9%) Unclassified electrical failure or malfunction 20 (9%) 0 (0%) 0 (0%) $2 (16%) Improper fueling technique 20 (7%) 0 (0%) 1 (6%) $1 (8%) Equipment unattended 10 (6%) 0 (0%) 0 (0%) $0 (2%) Equipment not being operated properly 10 (5%) 0 (0%) 0 (0%) $1 (6%) Installation deficiency 10 (5%) 0 (0%) 0 (0%) $0 (2%) Arc or spark from operating equipment 10 (4%) 0 (0%) 4 (18%) $2 (11%) Unclassified operational deficiency 10 (3%) 0 (0%) 0 (0%) $1 (4%) Improper container or storage 10 (3%) 0 (0%) 0 (0%) $0 (2%) Unclassified misuse of material 10 (3%) 0 (0%) 3 (11%) $0 (0%) Other known factor contributing to ignition 40 (18%) 0 (0%) 3 (12%) $2 (16%) Total fires 240 (100%) 7 (100%) 24 (100%) $15 (100%) Total factor entries 280 (120%) 7 (100%) 27 (112%) $18 (122%) All electrical failures or malfunctions 30 (14%) 0 (0%) 4 (18%) $4 (27%) Note: See detailed notes and source information at end of table.
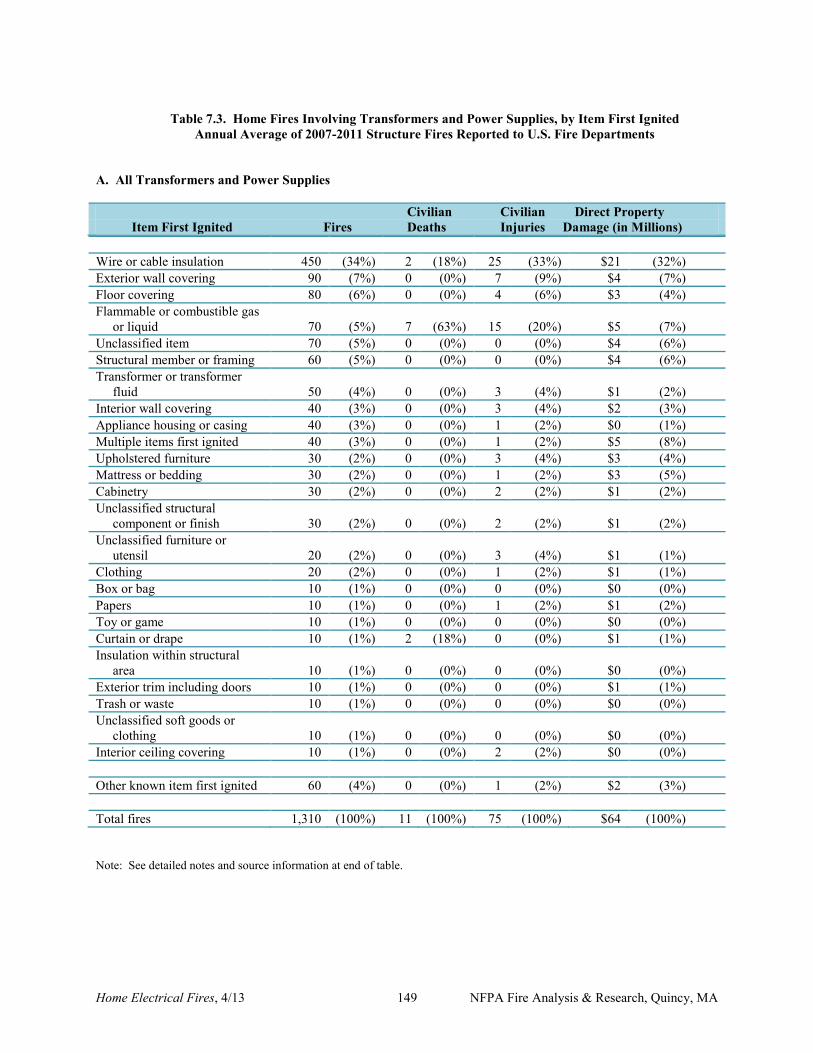
Home Electrical Fires, 4/13 149 NFPA Fire Analysis & Research, Quincy, MA
Table 7.3. Home Fires Involving Transformers and Power Supplies, by Item First Ignited
Annual Average of 2007-2011 Structure Fires Reported to U.S. Fire Departments
A. All Transformers and Power Supplies Civilian Civilian Direct Property Item First Ignited Fires Deaths Injuries Damage (in Millions) Wire or cable insulation 450 (34%) 2 (18%) 25 (33%) $21 (32%) Exterior wall covering 90 (7%) 0 (0%) 7 (9%) $4 (7%) Floor covering 80 (6%) 0 (0%) 4 (6%) $3 (4%) Flammable or combustible gas or liquid 70 (5%) 7 (63%) 15 (20%) $5 (7%) Unclassified item 70 (5%) 0 (0%) 0 (0%) $4 (6%) Structural member or framing 60 (5%) 0 (0%) 0 (0%) $4 (6%) Transformer or transformer fluid 50 (4%) 0 (0%) 3 (4%) $1 (2%) Interior wall covering 40 (3%) 0 (0%) 3 (4%) $2 (3%) Appliance housing or casing 40 (3%) 0 (0%) 1 (2%) $0 (1%) Multiple items first ignited 40 (3%) 0 (0%) 1 (2%) $5 (8%) Upholstered furniture 30 (2%) 0 (0%) 3 (4%) $3 (4%) Mattress or bedding 30 (2%) 0 (0%) 1 (2%) $3 (5%) Cabinetry 30 (2%) 0 (0%) 2 (2%) $1 (2%) Unclassified structural component or finish 30 (2%) 0 (0%) 2 (2%) $1 (2%) Unclassified furniture or utensil 20 (2%) 0 (0%) 3 (4%) $1 (1%) Clothing 20 (2%) 0 (0%) 1 (2%) $1 (1%) Box or bag 10 (1%) 0 (0%) 0 (0%) $0 (0%) Papers 10 (1%) 0 (0%) 1 (2%) $1 (2%) Toy or game 10 (1%) 0 (0%) 0 (0%) $0 (0%) Curtain or drape 10 (1%) 2 (18%) 0 (0%) $1 (1%) Insulation within structural area 10 (1%) 0 (0%) 0 (0%) $0 (0%) Exterior trim including doors 10 (1%) 0 (0%) 0 (0%) $1 (1%) Trash or waste 10 (1%) 0 (0%) 0 (0%) $0 (0%) Unclassified soft goods or clothing 10 (1%) 0 (0%) 0 (0%) $0 (0%) Interior ceiling covering 10 (1%) 0 (0%) 2 (2%) $0 (0%) Other known item first ignited 60 (4%) 0 (0%) 1 (2%) $2 (3%) Total fires 1,310 (100%) 11 (100%) 75 (100%) $64 (100%) Note: See detailed notes and source information at end of table.
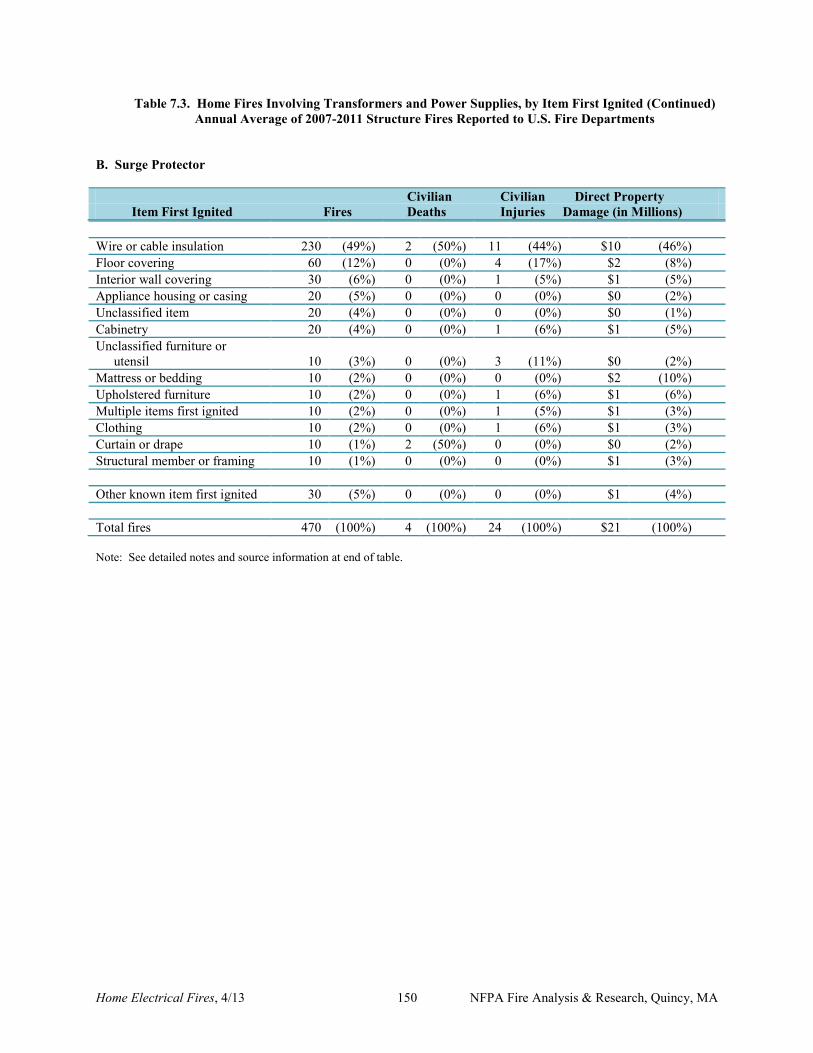
Home Electrical Fires, 4/13 150 NFPA Fire Analysis & Research, Quincy, MA
Table 7.3. Home Fires Involving Transformers and Power Supplies, by Item First Ignited (Continued) Annual Average of 2007-2011 Structure Fires Reported to U.S. Fire Departments
B. Surge Protector Civilian Civilian Direct Property Item First Ignited Fires Deaths Injuries Damage (in Millions) Wire or cable insulation 230 (49%) 2 (50%) 11 (44%) $10 (46%) Floor covering 60 (12%) 0 (0%) 4 (17%) $2 (8%) Interior wall covering 30 (6%) 0 (0%) 1 (5%) $1 (5%) Appliance housing or casing 20 (5%) 0 (0%) 0 (0%) $0 (2%) Unclassified item 20 (4%) 0 (0%) 0 (0%) $0 (1%) Cabinetry 20 (4%) 0 (0%) 1 (6%) $1 (5%) Unclassified furniture or utensil 10 (3%) 0 (0%) 3 (11%) $0 (2%) Mattress or bedding 10 (2%) 0 (0%) 0 (0%) $2 (10%) Upholstered furniture 10 (2%) 0 (0%) 1 (6%) $1 (6%) Multiple items first ignited 10 (2%) 0 (0%) 1 (5%) $1 (3%) Clothing 10 (2%) 0 (0%) 1 (6%) $1 (3%) Curtain or drape 10 (1%) 2 (50%) 0 (0%) $0 (2%) Structural member or framing 10 (1%) 0 (0%) 0 (0%) $1 (3%) Other known item first ignited 30 (5%) 0 (0%) 0 (0%) $1 (4%) Total fires 470 (100%) 4 (100%) 24 (100%) $21 (100%) Note: See detailed notes and source information at end of table.
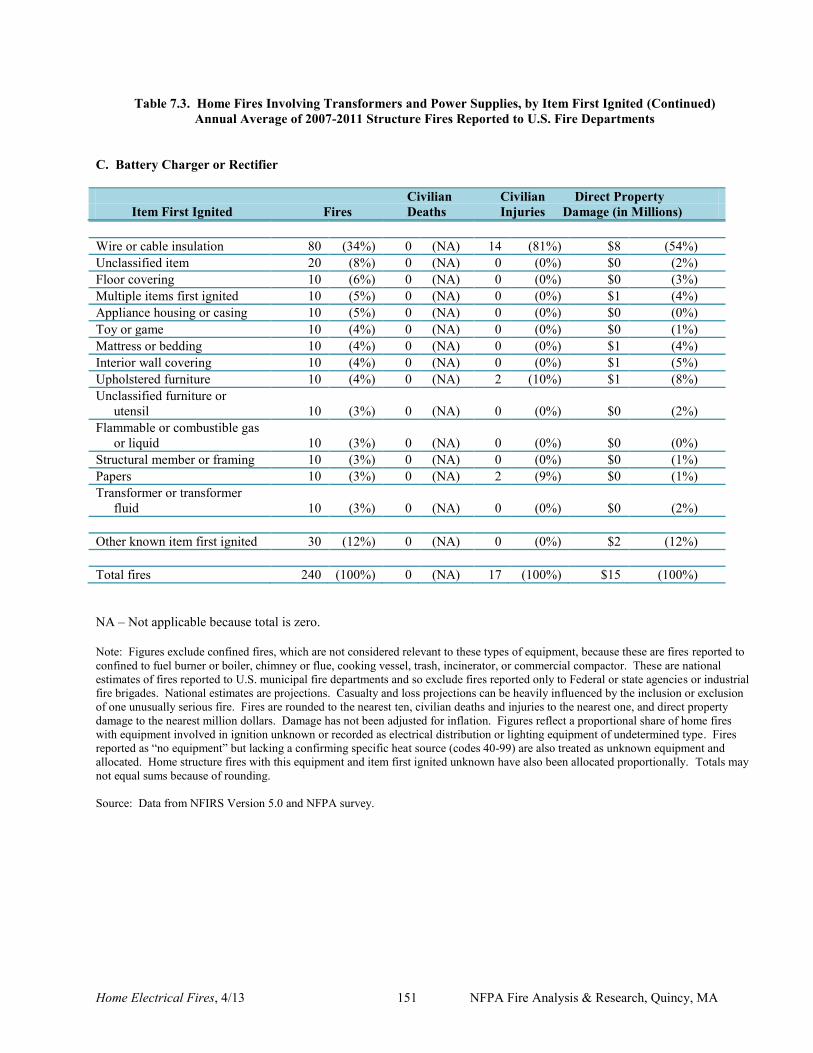
Home Electrical Fires, 4/13 151 NFPA Fire Analysis & Research, Quincy, MA
Table 7.3. Home Fires Involving Transformers and Power Supplies, by Item First Ignited (Continued) Annual Average of 2007-2011 Structure Fires Reported to U.S. Fire Departments
C. Battery Charger or Rectifier Civilian Civilian Direct Property Item First Ignited Fires Deaths Injuries Damage (in Millions) Wire or cable insulation 80 (34%) 0 (NA) 14 (81%) $8 (54%) Unclassified item 20 (8%) 0 (NA) 0 (0%) $0 (2%) Floor covering 10 (6%) 0 (NA) 0 (0%) $0 (3%) Multiple items first ignited 10 (5%) 0 (NA) 0 (0%) $1 (4%) Appliance housing or casing 10 (5%) 0 (NA) 0 (0%) $0 (0%) Toy or game 10 (4%) 0 (NA) 0 (0%) $0 (1%) Mattress or bedding 10 (4%) 0 (NA) 0 (0%) $1 (4%) Interior wall covering 10 (4%) 0 (NA) 0 (0%) $1 (5%) Upholstered furniture 10 (4%) 0 (NA) 2 (10%) $1 (8%) Unclassified furniture or utensil 10 (3%) 0 (NA) 0 (0%) $0 (2%) Flammable or combustible gas or liquid 10 (3%) 0 (NA) 0 (0%) $0 (0%) Structural member or framing 10 (3%) 0 (NA) 0 (0%) $0 (1%) Papers 10 (3%) 0 (NA) 2 (9%) $0 (1%) Transformer or transformer fluid 10 (3%) 0 (NA) 0 (0%) $0 (2%) Other known item first ignited 30 (12%) 0 (NA) 0 (0%) $2 (12%) Total fires 240 (100%) 0 (NA) 17 (100%) $15 (100%) NA – Not applicable because total is zero. Note: Figures exclude confined fires, which are not considered relevant to these types of equipment, because these are fires reported to confined to fuel burner or boiler, chimney or flue, cooking vessel, trash, incinerator, or commercial compactor. These are national estimates of fires reported to U.S. municipal fire departments and so exclude fires reported only to Federal or state agencies or industrial fire brigades. National estimates are projections. Casualty and loss projections can be heavily influenced by the inclusion or exclusion of one unusually serious fire. Fires are rounded to the nearest ten, civilian deaths and injuries to the nearest one, and direct property damage to the nearest million dollars. Damage has not been adjusted for inflation. Figures reflect a proportional share of home fires with equipment involved in ignition unknown or recorded as electrical distribution or lighting equipment of undetermined type. Fires reported as “no equipment” but lacking a confirming specific heat source (codes 40-99) are also treated as unknown equipment and allocated. Home structure fires with this equipment and item first ignited unknown have also been allocated proportionally. Totals may not equal sums because of rounding. Source: Data from NFIRS Version 5.0 and NFPA survey.
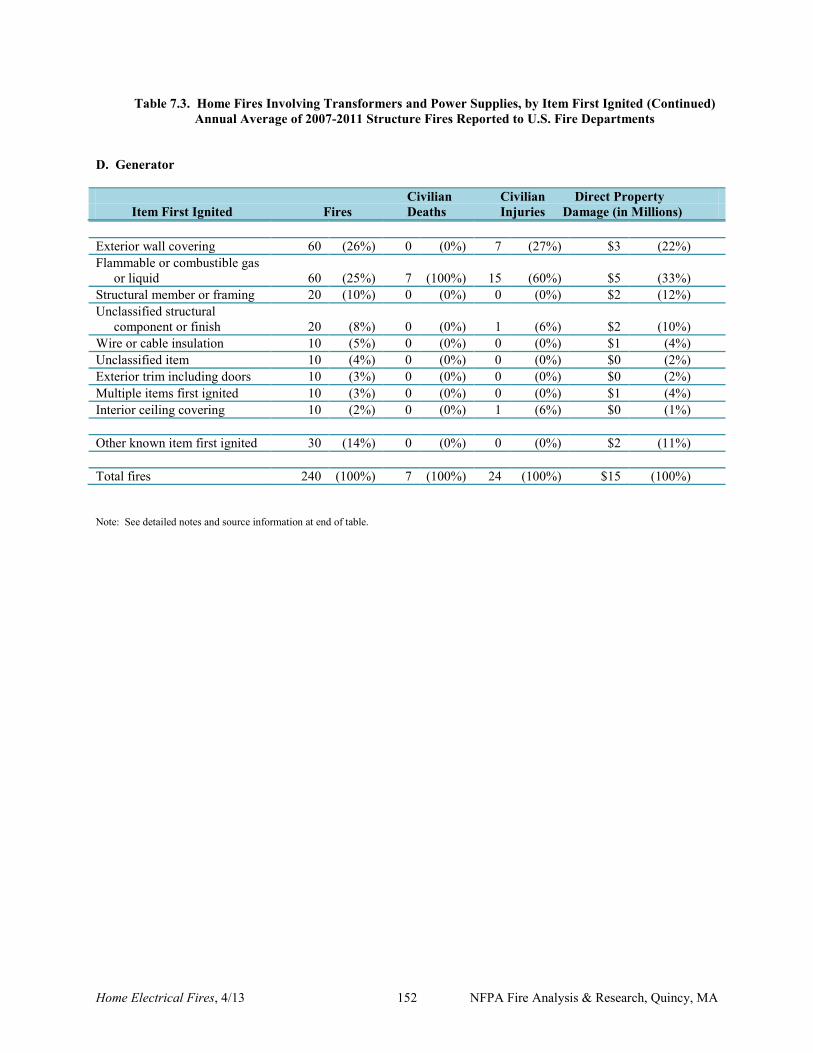
Home Electrical Fires, 4/13 152 NFPA Fire Analysis & Research, Quincy, MA
Table 7.3. Home Fires Involving Transformers and Power Supplies, by Item First Ignited (Continued) Annual Average of 2007-2011 Structure Fires Reported to U.S. Fire Departments
D. Generator Civilian Civilian Direct Property Item First Ignited Fires Deaths Injuries Damage (in Millions) Exterior wall covering 60 (26%) 0 (0%) 7 (27%) $3 (22%) Flammable or combustible gas or liquid 60 (25%) 7 (100%) 15 (60%) $5 (33%) Structural member or framing 20 (10%) 0 (0%) 0 (0%) $2 (12%) Unclassified structural component or finish 20 (8%) 0 (0%) 1 (6%) $2 (10%) Wire or cable insulation 10 (5%) 0 (0%) 0 (0%) $1 (4%) Unclassified item 10 (4%) 0 (0%) 0 (0%) $0 (2%) Exterior trim including doors 10 (3%) 0 (0%) 0 (0%) $0 (2%) Multiple items first ignited 10 (3%) 0 (0%) 0 (0%) $1 (4%) Interior ceiling covering 10 (2%) 0 (0%) 1 (6%) $0 (1%) Other known item first ignited 30 (14%) 0 (0%) 0 (0%) $2 (11%) Total fires 240 (100%) 7 (100%) 24 (100%) $15 (100%) Note: See detailed notes and source information at end of table.
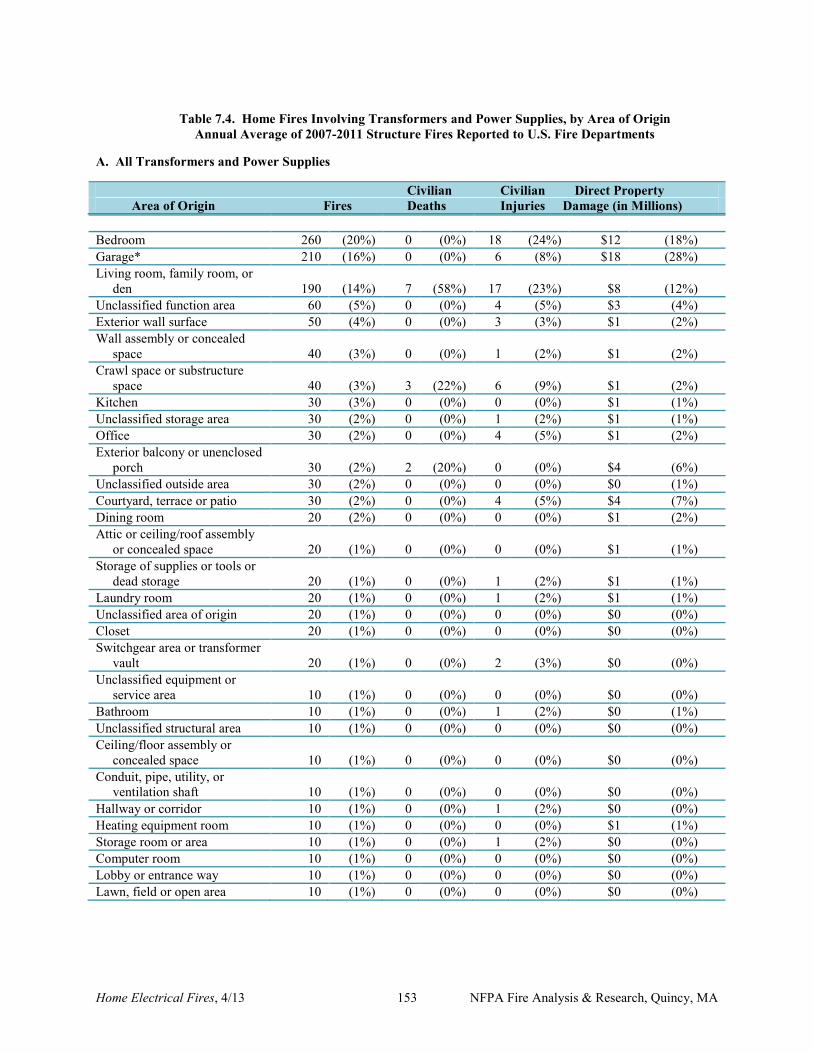
Home Electrical Fires, 4/13 153 NFPA Fire Analysis & Research, Quincy, MA
Table 7.4. Home Fires Involving Transformers and Power Supplies, by Area of Origin
Annual Average of 2007-2011 Structure Fires Reported to U.S. Fire Departments
A. All Transformers and Power Supplies Civilian Civilian Direct Property Area of Origin Fires Deaths Injuries Damage (in Millions) Bedroom 260 (20%) 0 (0%) 18 (24%) $12 (18%) Garage* 210 (16%) 0 (0%) 6 (8%) $18 (28%) Living room, family room, or den 190 (14%) 7 (58%) 17 (23%) $8 (12%) Unclassified function area 60 (5%) 0 (0%) 4 (5%) $3 (4%) Exterior wall surface 50 (4%) 0 (0%) 3 (3%) $1 (2%) Wall assembly or concealed space 40 (3%) 0 (0%) 1 (2%) $1 (2%) Crawl space or substructure space 40 (3%) 3 (22%) 6 (9%) $1 (2%) Kitchen 30 (3%) 0 (0%) 0 (0%) $1 (1%) Unclassified storage area 30 (2%) 0 (0%) 1 (2%) $1 (1%) Office 30 (2%) 0 (0%) 4 (5%) $1 (2%) Exterior balcony or unenclosed porch 30 (2%) 2 (20%) 0 (0%) $4 (6%) Unclassified outside area 30 (2%) 0 (0%) 0 (0%) $0 (1%) Courtyard, terrace or patio 30 (2%) 0 (0%) 4 (5%) $4 (7%) Dining room 20 (2%) 0 (0%) 0 (0%) $1 (2%) Attic or ceiling/roof assembly or concealed space 20 (1%) 0 (0%) 0 (0%) $1 (1%) Storage of supplies or tools or dead storage 20 (1%) 0 (0%) 1 (2%) $1 (1%) Laundry room 20 (1%) 0 (0%) 1 (2%) $1 (1%) Unclassified area of origin 20 (1%) 0 (0%) 0 (0%) $0 (0%) Closet 20 (1%) 0 (0%) 0 (0%) $0 (0%) Switchgear area or transformer vault 20 (1%) 0 (0%) 2 (3%) $0 (0%) Unclassified equipment or service area 10 (1%) 0 (0%) 0 (0%) $0 (0%) Bathroom 10 (1%) 0 (0%) 1 (2%) $0 (1%) Unclassified structural area 10 (1%) 0 (0%) 0 (0%) $0 (0%) Ceiling/floor assembly or concealed space 10 (1%) 0 (0%) 0 (0%) $0 (0%) Conduit, pipe, utility, or ventilation shaft 10 (1%) 0 (0%) 0 (0%) $0 (0%) Hallway or corridor 10 (1%) 0 (0%) 1 (2%) $0 (0%) Heating equipment room 10 (1%) 0 (0%) 0 (0%) $1 (1%) Storage room or area 10 (1%) 0 (0%) 1 (2%) $0 (0%) Computer room 10 (1%) 0 (0%) 0 (0%) $0 (0%) Lobby or entrance way 10 (1%) 0 (0%) 0 (0%) $0 (0%) Lawn, field or open area 10 (1%) 0 (0%) 0 (0%) $0 (0%)
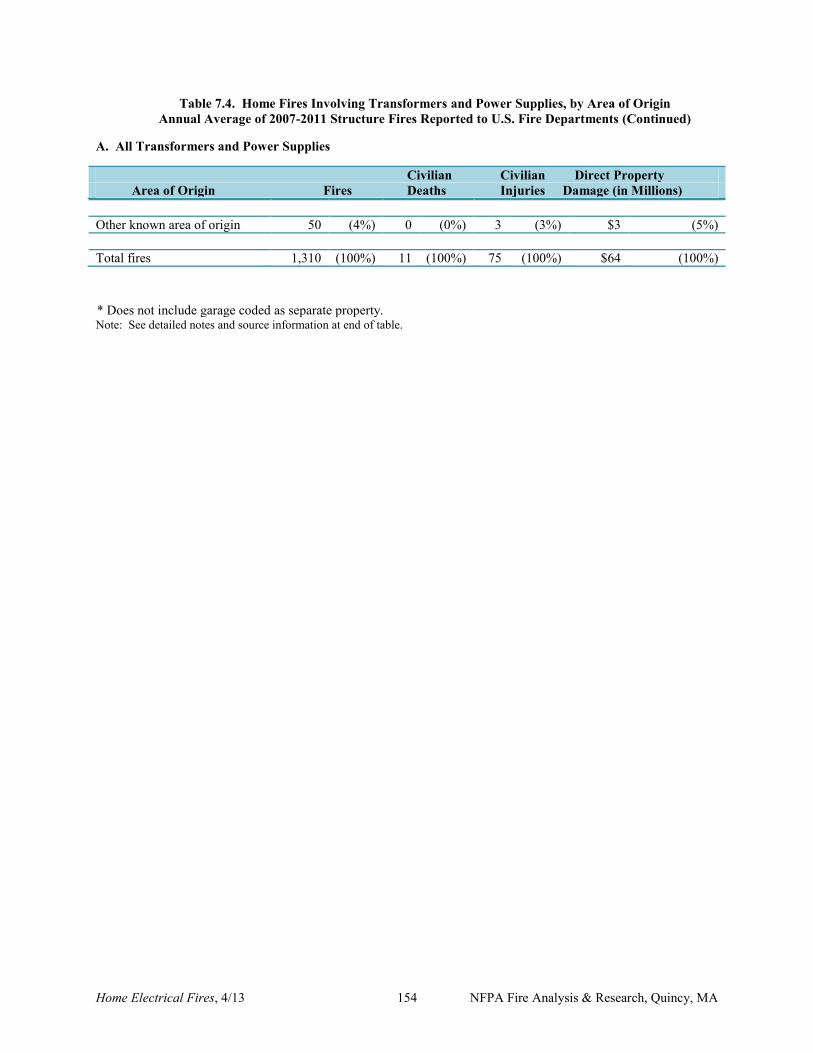
Home Electrical Fires, 4/13 154 NFPA Fire Analysis & Research, Quincy, MA
Table 7.4. Home Fires Involving Transformers and Power Supplies, by Area of Origin Annual Average of 2007-2011 Structure Fires Reported to U.S. Fire Departments (Continued)
A. All Transformers and Power Supplies Civilian Civilian Direct Property Area of Origin Fires Deaths Injuries Damage (in Millions) Other known area of origin 50 (4%) 0 (0%) 3 (3%) $3 (5%) Total fires 1,310 (100%) 11 (100%) 75 (100%) $64 (100%)
* Does not include garage coded as separate property.
Note: See detailed notes and source information at end of table.
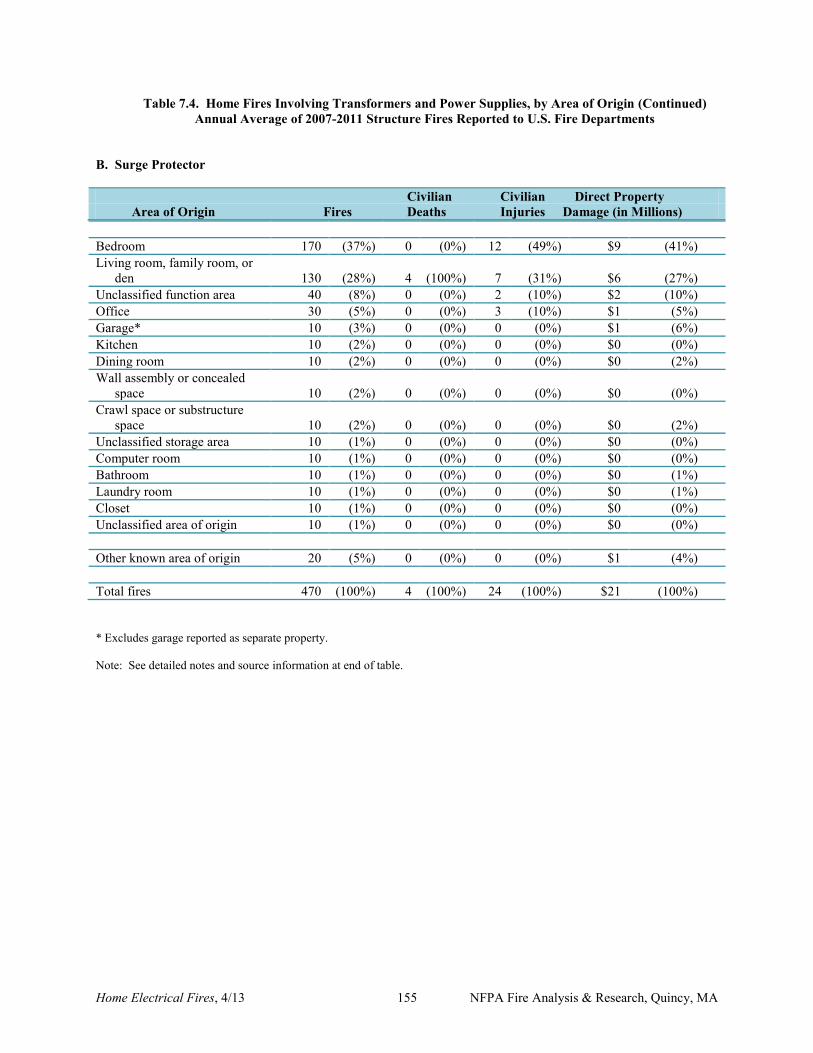
Home Electrical Fires, 4/13 155 NFPA Fire Analysis & Research, Quincy, MA
Table 7.4. Home Fires Involving Transformers and Power Supplies, by Area of Origin (Continued) Annual Average of 2007-2011 Structure Fires Reported to U.S. Fire Departments
B. Surge Protector Civilian Civilian Direct Property Area of Origin Fires Deaths Injuries Damage (in Millions) Bedroom 170 (37%) 0 (0%) 12 (49%) $9 (41%) Living room, family room, or den 130 (28%) 4 (100%) 7 (31%) $6 (27%) Unclassified function area 40 (8%) 0 (0%) 2 (10%) $2 (10%) Office 30 (5%) 0 (0%) 3 (10%) $1 (5%) Garage* 10 (3%) 0 (0%) 0 (0%) $1 (6%) Kitchen 10 (2%) 0 (0%) 0 (0%) $0 (0%) Dining room 10 (2%) 0 (0%) 0 (0%) $0 (2%) Wall assembly or concealed space 10 (2%) 0 (0%) 0 (0%) $0 (0%) Crawl space or substructure space 10 (2%) 0 (0%) 0 (0%) $0 (2%) Unclassified storage area 10 (1%) 0 (0%) 0 (0%) $0 (0%) Computer room 10 (1%) 0 (0%) 0 (0%) $0 (0%) Bathroom 10 (1%) 0 (0%) 0 (0%) $0 (1%) Laundry room 10 (1%) 0 (0%) 0 (0%) $0 (1%) Closet 10 (1%) 0 (0%) 0 (0%) $0 (0%) Unclassified area of origin 10 (1%) 0 (0%) 0 (0%) $0 (0%) Other known area of origin 20 (5%) 0 (0%) 0 (0%) $1 (4%) Total fires 470 (100%) 4 (100%) 24 (100%) $21 (100%) * Excludes garage reported as separate property. Note: See detailed notes and source information at end of table.
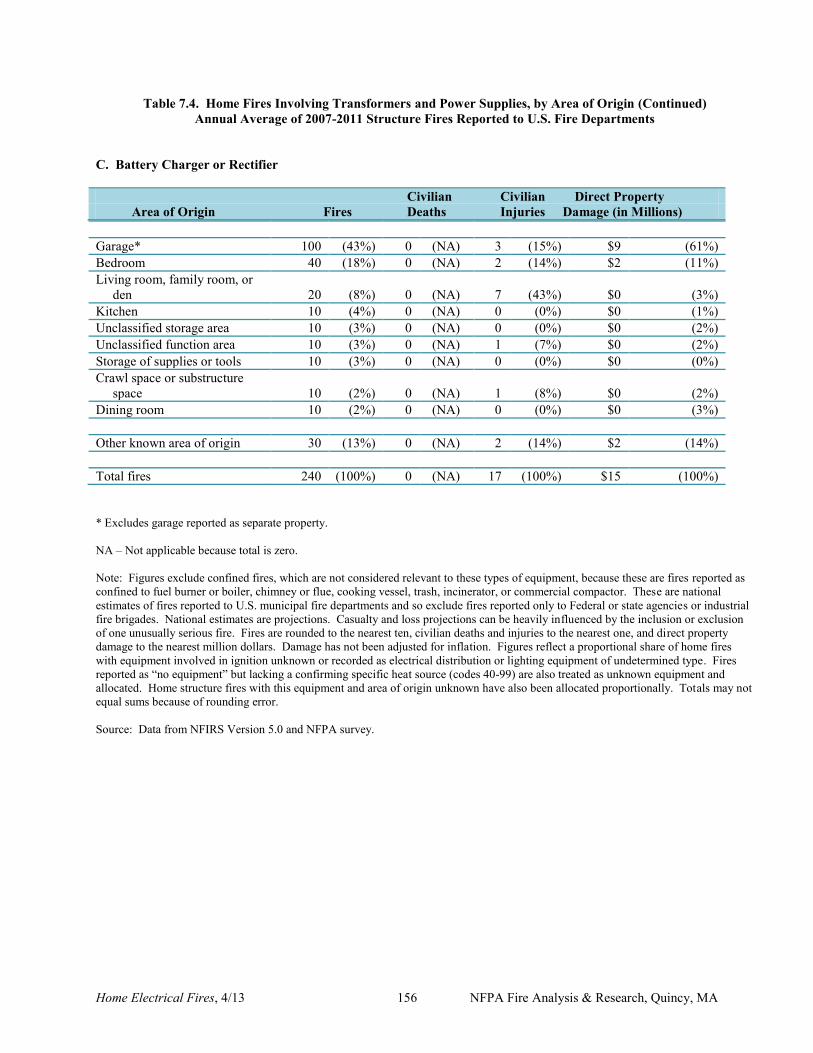
Home Electrical Fires, 4/13 156 NFPA Fire Analysis & Research, Quincy, MA
Table 7.4. Home Fires Involving Transformers and Power Supplies, by Area of Origin (Continued) Annual Average of 2007-2011 Structure Fires Reported to U.S. Fire Departments
C. Battery Charger or Rectifier Civilian Civilian Direct Property Area of Origin Fires Deaths Injuries Damage (in Millions) Garage* 100 (43%) 0 (NA) 3 (15%) $9 (61%) Bedroom 40 (18%) 0 (NA) 2 (14%) $2 (11%) Living room, family room, or den 20 (8%) 0 (NA) 7 (43%) $0 (3%) Kitchen 10 (4%) 0 (NA) 0 (0%) $0 (1%) Unclassified storage area 10 (3%) 0 (NA) 0 (0%) $0 (2%) Unclassified function area 10 (3%) 0 (NA) 1 (7%) $0 (2%) Storage of supplies or tools 10 (3%) 0 (NA) 0 (0%) $0 (0%) Crawl space or substructure space 10 (2%) 0 (NA) 1 (8%) $0 (2%) Dining room 10 (2%) 0 (NA) 0 (0%) $0 (3%) Other known area of origin 30 (13%) 0 (NA) 2 (14%) $2 (14%) Total fires 240 (100%) 0 (NA) 17 (100%) $15 (100%) * Excludes garage reported as separate property. NA – Not applicable because total is zero. Note: Figures exclude confined fires, which are not considered relevant to these types of equipment, because these are fires reported as confined to fuel burner or boiler, chimney or flue, cooking vessel, trash, incinerator, or commercial compactor. These are national estimates of fires reported to U.S. municipal fire departments and so exclude fires reported only to Federal or state agencies or industrial fire brigades. National estimates are projections. Casualty and loss projections can be heavily influenced by the inclusion or exclusion of one unusually serious fire. Fires are rounded to the nearest ten, civilian deaths and injuries to the nearest one, and direct property damage to the nearest million dollars. Damage has not been adjusted for inflation. Figures reflect a proportional share of home fires with equipment involved in ignition unknown or recorded as electrical distribution or lighting equipment of undetermined type. Fires reported as “no equipment” but lacking a confirming specific heat source (codes 40-99) are also treated as unknown equipment and allocated. Home structure fires with this equipment and area of origin unknown have also been allocated proportionally. Totals may not equal sums because of rounding error. Source: Data from NFIRS Version 5.0 and NFPA survey.
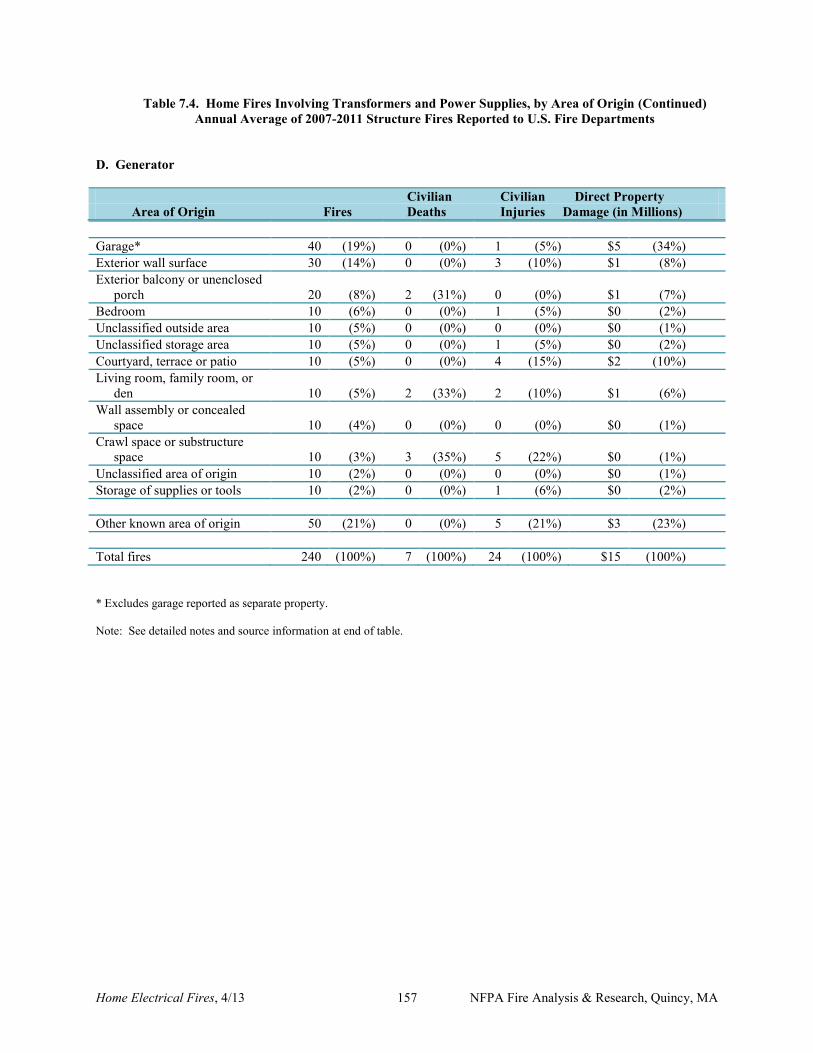
Home Electrical Fires, 4/13 157 NFPA Fire Analysis & Research, Quincy, MA
Table 7.4. Home Fires Involving Transformers and Power Supplies, by Area of Origin (Continued) Annual Average of 2007-2011 Structure Fires Reported to U.S. Fire Departments
D. Generator Civilian Civilian Direct Property Area of Origin Fires Deaths Injuries Damage (in Millions) Garage* 40 (19%) 0 (0%) 1 (5%) $5 (34%) Exterior wall surface 30 (14%) 0 (0%) 3 (10%) $1 (8%) Exterior balcony or unenclosed porch 20 (8%) 2 (31%) 0 (0%) $1 (7%) Bedroom 10 (6%) 0 (0%) 1 (5%) $0 (2%) Unclassified outside area 10 (5%) 0 (0%) 0 (0%) $0 (1%) Unclassified storage area 10 (5%) 0 (0%) 1 (5%) $0 (2%) Courtyard, terrace or patio 10 (5%) 0 (0%) 4 (15%) $2 (10%) Living room, family room, or den 10 (5%) 2 (33%) 2 (10%) $1 (6%) Wall assembly or concealed space 10 (4%) 0 (0%) 0 (0%) $0 (1%) Crawl space or substructure space 10 (3%) 3 (35%) 5 (22%) $0 (1%) Unclassified area of origin 10 (2%) 0 (0%) 0 (0%) $0 (1%) Storage of supplies or tools 10 (2%) 0 (0%) 1 (6%) $0 (2%) Other known area of origin 50 (21%) 0 (0%) 5 (21%) $3 (23%) Total fires 240 (100%) 7 (100%) 24 (100%) $15 (100%) * Excludes garage reported as separate property. Note: See detailed notes and source information at end of table.

Home Electrical Fires, 4/13 158 NFPA Fire Analysis & Research, Quincy, MA
Home Electrical Fires, 4/13 159 NFPA Fire Analysis & Research, Quincy, MA
Section 8. Non-Home Electrical Distribution or Lighting Equipment
In 2007-2011, an estimated 10,150 reported U.S. non-confined, non-home structure fires per year involving electrical distribution or lighting equipment resulted in 19 civilian deaths, 150 civilian injuries, and $498 million in direct property damage per year. Another 475 confined fires per year (mostly fires confined to trash) are not included in these statistics.27 Electrical distribution or lighting equipment accounted for 8% of 2007-2011 on-home structure fires, 9% of associated civilian deaths, 7% of associated civilian injuries, and 14% of associated direct property damage. If confined fires are included, the share of all non-home fires is still 8%. Table 8.1 provides estimated fires and associated losses for each type of electrical distribution or lighting equipment and for the major equipment groups. Some types of equipment have much larger shares of non-home electrical distribution or lighting equipment fires than of home electrical distribution or lighting equipment fires, including fluorescent light fixtures and signs. The types of equipment with higher non-home fire shares also tend to have much higher average usage in non-home properties than in homes.
27 The other estimates in this chapter exclude fires reported as confined fires, which do not require detailed reporting and rarely involve electrical distribution or lighting equipment.
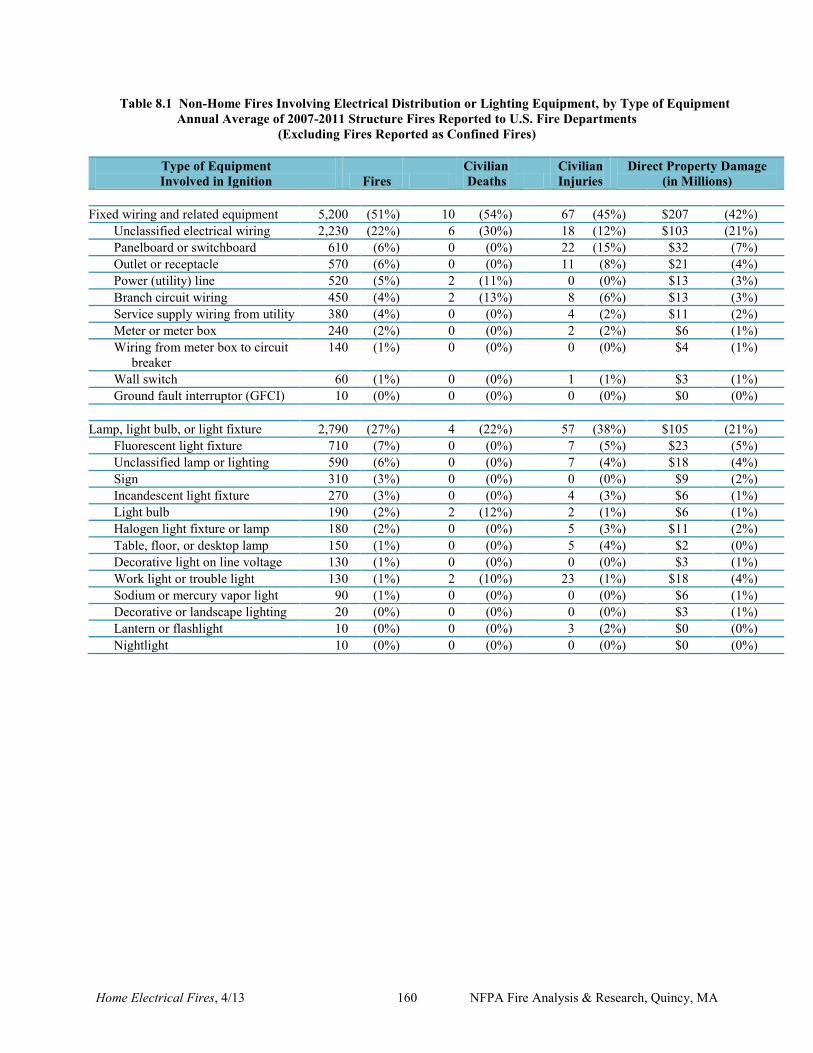
Home Electrical Fires, 4/13 160 NFPA Fire Analysis & Research, Quincy, MA
Table 8.1 Non-Home Fires Involving Electrical Distribution or Lighting Equipment, by Type of Equipment Annual Average of 2007-2011 Structure Fires Reported to U.S. Fire Departments
(Excluding Fires Reported as Confined Fires)
Type of Equipment Involved in Ignition Fires
Civilian Deaths
Civilian Injuries
Direct Property Damage (in Millions)
Fixed wiring and related equipment 5,200 (51%) 10 (54%) 67 (45%) $207 (42%) Unclassified electrical wiring 2,230 (22%) 6 (30%) 18 (12%) $103 (21%) Panelboard or switchboard 610 (6%) 0 (0%) 22 (15%) $32 (7%) Outlet or receptacle 570 (6%) 0 (0%) 11 (8%) $21 (4%) Power (utility) line 520 (5%) 2 (11%) 0 (0%) $13 (3%) Branch circuit wiring 450 (4%) 2 (13%) 8 (6%) $13 (3%) Service supply wiring from utility 380 (4%) 0 (0%) 4 (2%) $11 (2%) Meter or meter box 240 (2%) 0 (0%) 2 (2%) $6 (1%) Wiring from meter box to circuit breaker
140 (1%) 0 (0%) 0 (0%) $4 (1%)
Wall switch 60 (1%) 0 (0%) 1 (1%) $3 (1%) Ground fault interruptor (GFCI) 10 (0%) 0 (0%) 0 (0%) $0 (0%) Lamp, light bulb, or light fixture 2,790 (27%) 4 (22%) 57 (38%) $105 (21%) Fluorescent light fixture 710 (7%) 0 (0%) 7 (5%) $23 (5%) Unclassified lamp or lighting 590 (6%) 0 (0%) 7 (4%) $18 (4%) Sign 310 (3%) 0 (0%) 0 (0%) $9 (2%) Incandescent light fixture 270 (3%) 0 (0%) 4 (3%) $6 (1%) Light bulb 190 (2%) 2 (12%) 2 (1%) $6 (1%) Halogen light fixture or lamp 180 (2%) 0 (0%) 5 (3%) $11 (2%) Table, floor, or desktop lamp 150 (1%) 0 (0%) 5 (4%) $2 (0%) Decorative light on line voltage 130 (1%) 0 (0%) 0 (0%) $3 (1%) Work light or trouble light 130 (1%) 2 (10%) 23 (1%) $18 (4%) Sodium or mercury vapor light 90 (1%) 0 (0%) 0 (0%) $6 (1%) Decorative or landscape lighting 20 (0%) 0 (0%) 0 (0%) $3 (1%) Lantern or flashlight 10 (0%) 0 (0%) 3 (2%) $0 (0%) Nightlight 10 (0%) 0 (0%) 0 (0%) $0 (0%)
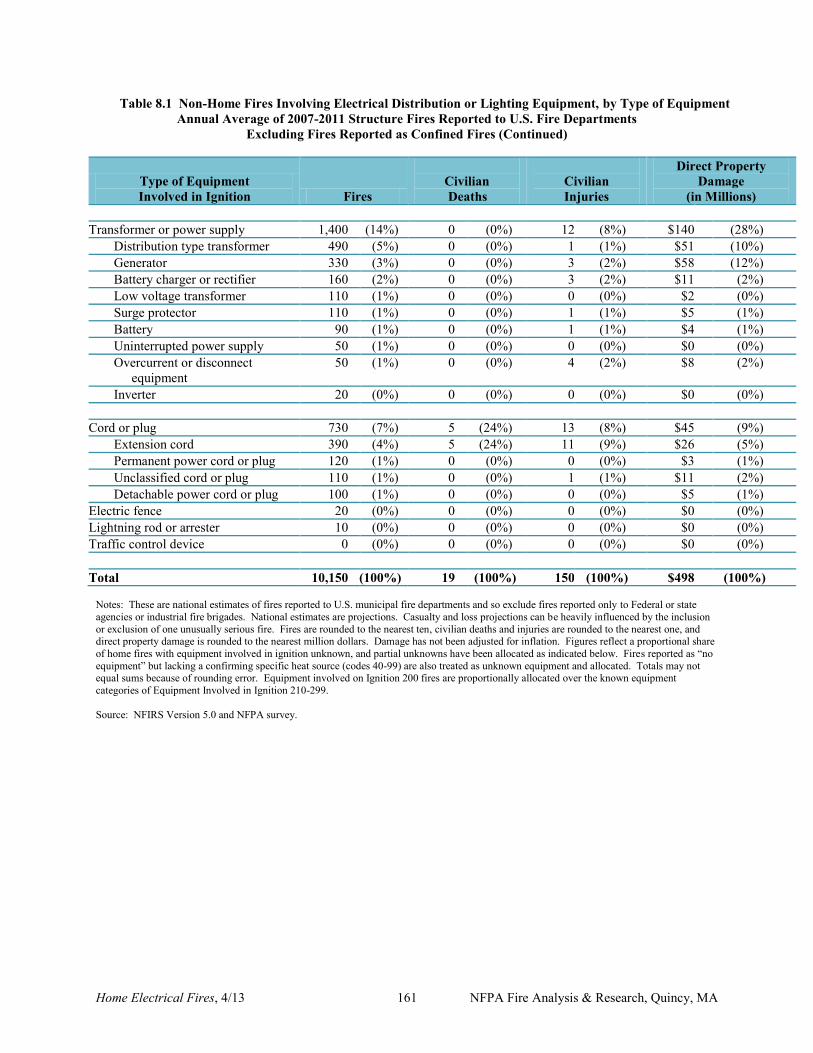
Home Electrical Fires, 4/13 161 NFPA Fire Analysis & Research, Quincy, MA
Table 8.1 Non-Home Fires Involving Electrical Distribution or Lighting Equipment, by Type of Equipment Annual Average of 2007-2011 Structure Fires Reported to U.S. Fire Departments
Excluding Fires Reported as Confined Fires (Continued)
Type of Equipment Involved in Ignition Fires
Civilian Deaths
Civilian Injuries
Direct Property Damage
(in Millions) Transformer or power supply 1,400 (14%) 0 (0%) 12 (8%) $140 (28%) Distribution type transformer 490 (5%) 0 (0%) 1 (1%) $51 (10%) Generator 330 (3%) 0 (0%) 3 (2%) $58 (12%) Battery charger or rectifier 160 (2%) 0 (0%) 3 (2%) $11 (2%) Low voltage transformer 110 (1%) 0 (0%) 0 (0%) $2 (0%) Surge protector 110 (1%) 0 (0%) 1 (1%) $5 (1%) Battery 90 (1%) 0 (0%) 1 (1%) $4 (1%) Uninterrupted power supply 50 (1%) 0 (0%) 0 (0%) $0 (0%) Overcurrent or disconnect equipment
50 (1%) 0 (0%) 4 (2%) $8 (2%)
Inverter 20 (0%) 0 (0%) 0 (0%) $0 (0%) Cord or plug 730 (7%) 5 (24%) 13 (8%) $45 (9%) Extension cord 390 (4%) 5 (24%) 11 (9%) $26 (5%) Permanent power cord or plug 120 (1%) 0 (0%) 0 (0%) $3 (1%) Unclassified cord or plug 110 (1%) 0 (0%) 1 (1%) $11 (2%) Detachable power cord or plug 100 (1%) 0 (0%) 0 (0%) $5 (1%) Electric fence 20 (0%) 0 (0%) 0 (0%) $0 (0%) Lightning rod or arrester 10 (0%) 0 (0%) 0 (0%) $0 (0%) Traffic control device 0 (0%) 0 (0%) 0 (0%) $0 (0%) Total 10,150 (100%) 19 (100%) 150 (100%) $498 (100%)
Notes: These are national estimates of fires reported to U.S. municipal fire departments and so exclude fires reported only to Federal or state agencies or industrial fire brigades. National estimates are projections. Casualty and loss projections can be heavily influenced by the inclusion or exclusion of one unusually serious fire. Fires are rounded to the nearest ten, civilian deaths and injuries are rounded to the nearest one, and direct property damage is rounded to the nearest million dollars. Damage has not been adjusted for inflation. Figures reflect a proportional share of home fires with equipment involved in ignition unknown, and partial unknowns have been allocated as indicated below. Fires reported as “no equipment” but lacking a confirming specific heat source (codes 40-99) are also treated as unknown equipment and allocated. Totals may not equal sums because of rounding error. Equipment involved on Ignition 200 fires are proportionally allocated over the known equipment categories of Equipment Involved in Ignition 210-299. Source: NFIRS Version 5.0 and NFPA survey.

Home Electrical Fires, 4/13 162 NFPA Fire Analysis & Research, Quincy, MA
Home Electrical Fires, 4/13 163 NFPA Fire Analysis & Research, Quincy, MA
Appendix A. How National Estimates Statistics Are Calculated
The statistics in this analysis are estimates derived from the U.S. Fire Administration’s (USFA’s) National Fire Incident Reporting System (NFIRS) and the National Fire Protection Association’s (NFPA’s) annual survey of U.S. fire departments. NFIRS is a voluntary system by which participating fire departments report detailed factors about the fires to which they respond. Roughly two-thirds of U.S. fire departments participate, although not all of these departments provide data every year. Fires reported to federal or state fire departments or industrial fire brigades are not included in these estimates. NFIRS provides the most detailed incident information of any national database not limited to large fires. NFIRS is the only database capable of addressing national patterns for fires of all sizes by specific property use and specific fire cause. NFIRS also captures information on the extent of flame spread, and automatic detection and suppression equipment. For more information about NFIRS visit http://www.nfirs.fema.gov/. Copies of the paper forms may be downloaded from http://www.nfirs.fema.gov/documentation/design/NFIRS_Paper_Forms_2008.pdf. NFIRS has a wide variety of data elements and code choices. The NFIRS database contains coded information. Many code choices describe several conditions. These cannot be broken down further. For example, area of origin code 83 captures fires starting in vehicle engine areas, running gear areas or wheel areas. It is impossible to tell the portion of each from the coded data. Methodology may change slightly from year to year. NFPA is continually examining its methodology to provide the best possible answers to specific questions, methodological and definitional changes can occur. Earlier editions of the same report may have used different methodologies to produce the same analysis, meaning that the estimates are not directly comparable from year to year. NFPA’s fire department experience survey provides estimates of the big picture. Each year, NFPA conducts an annual survey of fire departments which enables us to capture a summary of fire department experience on a larger scale. Surveys are sent to all municipal departments protecting populations of 50,000 or more and a random sample, stratified by community size, of the smaller departments. Typically, a total of roughly 3,000 surveys are returned, representing about one of every ten U.S. municipal fire departments and about one third of the U.S. population. The survey is stratified by size of population protected to reduce the uncertainty of the final estimate. Small rural communities have fewer people protected per department and are less likely to respond to the survey. A larger number must be surveyed to obtain an adequate sample of those departments. (NFPA also makes follow-up calls to a sample of the smaller fire departments that do not respond, to confirm that those that did respond are truly representative of fire departments their size.) On the other hand, large city departments are so few in number and protect such a large proportion of the total U.S.
Home Electrical Fires, 4/13 164 NFPA Fire Analysis & Research, Quincy, MA
population that it makes sense to survey all of them. Most respond, resulting in excellent precision for their part of the final estimate. The survey includes the following information: (1) the total number of fire incidents, civilian deaths, and civilian injuries, and the total estimated property damage (in dollars), for each of the major property use classes defined in NFIRS; (2) the number of on-duty firefighter injuries, by type of duty and nature of illness; 3) the number and nature of non-fire incidents; and (4) information on the type of community protected (e.g., county versus township versus city) and the size of the population protected, which is used in the statistical formula for projecting national totals from sample results. The results of the survey are published in the annual report Fire Loss in the United States. To download a free copy of the report, visit http://www.nfpa.org/assets/files/PDF/OS.fireloss.pdf. Projecting NFIRS to National Estimates As noted, NFIRS is a voluntary system. Different states and jurisdictions have different reporting requirements and practices. Participation rates in NFIRS are not necessarily uniform across regions and community sizes, both factors correlated with frequency and severity of fires. This means NFIRS may be susceptible to systematic biases. No one at present can quantify the size of these deviations from the ideal, representative sample, so no one can say with confidence that they are or are not serious problems. But there is enough reason for concern so that a second database -- the NFPA survey -- is needed to project NFIRS to national estimates and to project different parts of NFIRS separately. This multiple calibration approach makes use of the annual NFPA survey where its statistical design advantages are strongest. Scaling ratios are obtained by comparing NFPA’s projected totals of residential structure fires, non-residential structure fires, vehicle fires, and outside and other fires, and associated civilian deaths, civilian injuries, and direct property damage with comparable totals in NFIRS. Estimates of specific fire problems and circumstances are obtained by multiplying the NFIRS data by the scaling ratios. Reports for incidents in which mutual aid was given are excluded from NFPA’s analyses. Analysts at the NFPA, the USFA and the Consumer Product Safety Commission developed the specific basic analytical rules used for this procedure. "The National Estimates Approach to U.S. Fire Statistics," by John R. Hall, Jr. and Beatrice Harwood, provides a more detailed explanation of national estimates. Version 5.0 of NFIRS, first introduced in 1999, used a different coding structure for many data elements, added some property use codes, and dropped others. The essentials of the approach described by Hall and Harwood are still used, but some modifications have been necessary to accommodate the changes in NFIRS 5.0. Figure A.1 shows the percentage of fires originally collected in the NFIRS 5.0 system. Each year’s release version of NFIRS data also includes data collected in older versions of NFIRS that were converted to NFIRS 5.0 codes.
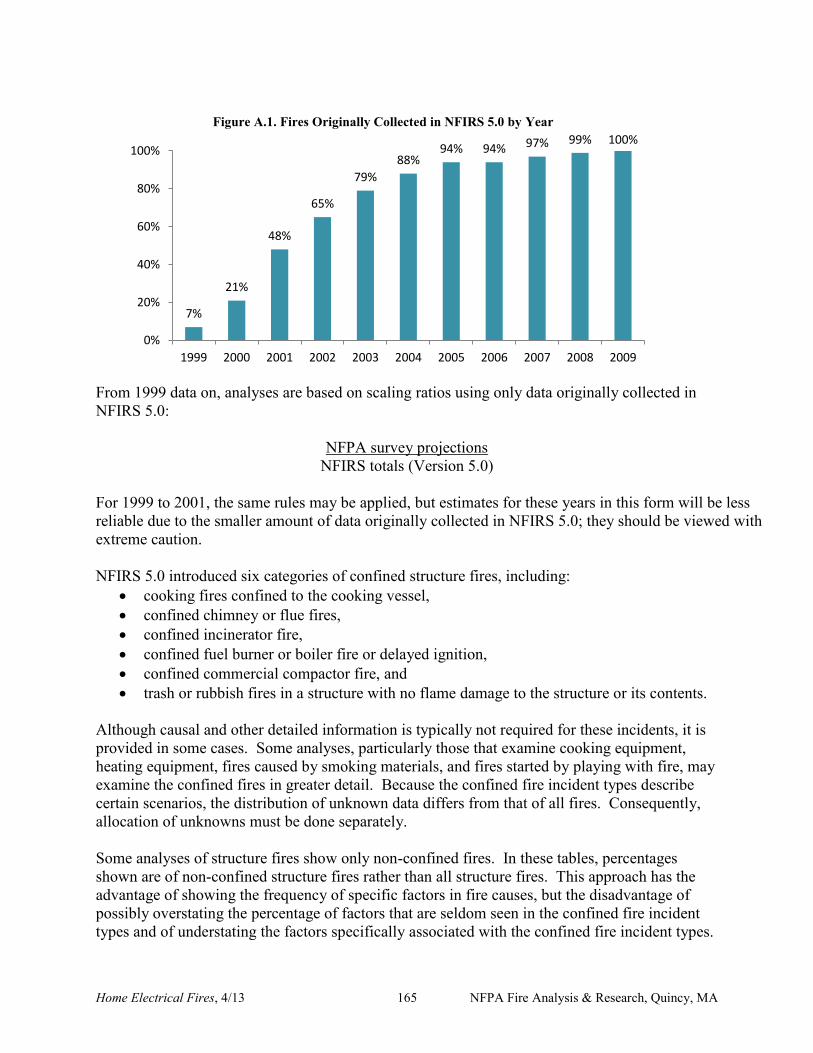
Home Electrical Fires, 4/13 165 NFPA Fire Analysis & Research, Quincy, MA
Figure A.1. Fires Originally Collected in NFIRS 5.0 by Year
From 1999 data on, analyses are based on scaling ratios using only data originally collected in NFIRS 5.0:
NFPA survey projections NFIRS totals (Version 5.0)
For 1999 to 2001, the same rules may be applied, but estimates for these years in this form will be less reliable due to the smaller amount of data originally collected in NFIRS 5.0; they should be viewed with extreme caution. NFIRS 5.0 introduced six categories of confined structure fires, including:
cooking fires confined to the cooking vessel, confined chimney or flue fires, confined incinerator fire, confined fuel burner or boiler fire or delayed ignition, confined commercial compactor fire, and trash or rubbish fires in a structure with no flame damage to the structure or its contents.
Although causal and other detailed information is typically not required for these incidents, it is provided in some cases. Some analyses, particularly those that examine cooking equipment, heating equipment, fires caused by smoking materials, and fires started by playing with fire, may examine the confined fires in greater detail. Because the confined fire incident types describe certain scenarios, the distribution of unknown data differs from that of all fires. Consequently, allocation of unknowns must be done separately. Some analyses of structure fires show only non-confined fires. In these tables, percentages shown are of non-confined structure fires rather than all structure fires. This approach has the advantage of showing the frequency of specific factors in fire causes, but the disadvantage of possibly overstating the percentage of factors that are seldom seen in the confined fire incident types and of understating the factors specifically associated with the confined fire incident types.
7%
21%
48%
65%
79%
88% 94% 94% 97% 99% 100%
0%
20%
40%
60%
80%
100%
1999 2000 2001 2002 2003 2004 2005 2006 2007 2008 2009
Home Electrical Fires, 4/13 166 NFPA Fire Analysis & Research, Quincy, MA
Other analyses include entries for confined fire incident types in the causal tables and show percentages based on total structure fires. In these cases, the confined fire incident type is treated as a general causal factor. For most fields other than Property Use and Incident Type, NFPA allocates unknown data proportionally among known data. This approach assumes that if the missing data were known, it would be distributed in the same manner as the known data. NFPA makes additional adjustments to several fields. Casualty and loss projections can be heavily influenced by the inclusion or exclusion of unusually serious fire. In the formulas that follow, the term “all fires” refers to all fires in NFIRS on the dimension studied. The percentages of fires with known or unknown data are provided for non-confined fires and associated losses, and for confined fires only. Cause of Ignition: This field is used chiefly to identify intentional fires. “Unintentional” in this field is a specific entry and does not include other fires that were not intentionally set: failure of equipment or heat source, act of nature, or “other” (unclassified).” The last should be used for exposures but has been used for other situations as well. Fires that were coded as under investigation and those that were coded as undetermined after investigation were treated as unknown. Factor Contributing to Ignition: In this field, the code “none” is treated as an unknown and allocated proportionally. For Human Factor Contributing to Ignition, NFPA enters a code for “not reported” when no factors are recorded. “Not reported” is treated as an unknown, but the code “none” is treated as a known code and not allocated. Multiple entries are allowed in both of these fields. Percentages are calculated on the total number of fires, not entries, resulting in sums greater than 100%. Although Factor Contributing to Ignition is only required when the cause of ignition was coded as: 2) unintentional, 3) failure of equipment or heat source; or 4) act of nature, data is often present when not required. Consequently, any fire in which no factor contributing to ignition was entered was treated as unknown. In some analyses, all entries in the category of mechanical failure, malfunction (factor contributing to ignition 20-29) are combined and shown as one entry, “mechanical failure or malfunction.” This category includes:
21. Automatic control failure; 22. Manual control failure; 23. Leak or break. Includes leaks or breaks from containers or pipes. Excludes operational
deficiencies and spill mishaps; 25. Worn out; 26. Backfire. Excludes fires originating as a result of hot catalytic converters; 27. Improper fuel used; Includes the use of gasoline in a kerosene heater and the like; and 20. Mechanical failure or malfunction, other.
Entries in “electrical failure, malfunction” (factor contributing to ignition 30-39) may also be combined into one entry, “electrical failure or malfunction.” This category includes:
Home Electrical Fires, 4/13 167 NFPA Fire Analysis & Research, Quincy, MA
31. Water-caused short circuit arc; 32. Short-circuit arc from mechanical damage; 33. Short-circuit arc from defective or worn insulation; 34. Unspecified short circuit arc; 35. Arc from faulty contact or broken connector, including broken power lines and loose
connections; 36. Arc or spark from operating equipment, switch, or electric fence; 37. Fluorescent light ballast; and 30. Electrical failure or malfunction, other.
Heat Source. In NFIRS 5.0, one grouping of codes encompasses various types of open flames and smoking materials. In the past, these had been two separate groupings. A new code was added to NFIRS 5.0, which is code 60: “Heat from open flame or smoking material, other.” NFPA treats this code as a partial unknown and allocates it proportionally across the codes in the 61-69 range, shown below.
61. Cigarette; 62. Pipe or cigar; 63. Heat from undetermined smoking material; 64. Match; 65. Lighter: cigarette lighter, cigar lighter; 66. Candle; 67 Warning or road flare, fuse; 68. Backfire from internal combustion engine. Excludes flames and sparks from an exhaust system,
(11); and 69. Flame/torch used for lighting. Includes gas light and gas-/liquid-fueled lantern.
In addition to the conventional allocation of missing and undetermined fires, NFPA multiplies fires with codes in the 61-69 range by
All fires in range 60-69 All fires in range 61-69
The downside of this approach is that heat sources that are truly a different type of open flame or smoking material are erroneously assigned to other categories. The grouping “smoking materials” includes codes 61-63 (cigarettes, pipes or cigars, and heat from undetermined smoking material, with a proportional share of the code 60s and true unknown data. Equipment Involved in Ignition (EII). NFIRS 5.0 originally defined EII as the piece of equipment that provided the principal heat source to cause ignition if the equipment malfunctioned or was used improperly. In 2006, the definition was modified to “the piece of equipment that provided the principal heat source to cause ignition.” However, much of the data predates the change. Individuals who have already been trained with the older definition may not change their practices. To compensate, NFPA treats fires in which EII = NNN and heat source is not in the range of 40-99 as an additional unknown. To allocate unknown data for EII, the known data is multiplied by
Home Electrical Fires, 4/13 168 NFPA Fire Analysis & Research, Quincy, MA
All fires (All fires – blank – undetermined – [fires in which EII =NNN and heat source <>40-99])
In addition, the partially unclassified codes for broad equipment groupings (i.e., code 100 - heating, ventilation, and air conditioning, other; code 200 - electrical distribution, lighting and power transfer, other; etc.) were allocated proportionally across the individual code choices in their respective broad groupings (heating, ventilation, and air conditioning; electrical distribution, lighting and power transfer, other; etc.). Equipment that is totally unclassified is not allocated further. This approach has the same downside as the allocation of heat source 60 described above. Equipment that is truly different is erroneously assigned to other categories. In some analyses, various types of equipment are grouped together.
Code Grouping EII Code NFIRS definitions Central heat 132 Furnace or central heating unit 133 Boiler (power, process or heating) Fixed or portable space heater 131 Furnace, local heating unit, built-in 123 Fireplace with insert or stove 124 Heating stove 141 Heater, excluding catalytic and oil-filled 142 Catalytic heater 143 Oil-filled heater Fireplace or chimney 120 Fireplace or chimney 121 Fireplace, masonry 122 Fireplace, factory-built 125 Chimney connector or vent connector 126 Chimney – brick, stone or masonry 127 Chimney-metal, including stovepipe or flue Fixed wiring and related equipment 210 Unclassified electrical wiring 211 Electrical power or utility line 212 Electrical service supply wires from utility 213 Electric meter or meter box 214 Wiring from meter box to circuit breaker 215 Panel board, switch board or circuit breaker board 216 Electrical branch circuit 217 Outlet or receptacle 218 Wall switch 219 Ground fault interrupter Transformers and power supplies 221 Distribution-type transformer 222 Overcurrent, disconnect equipment 223 Low-voltage transformer 224 Generator 225 Inverter 226 Uninterrupted power supply (UPS) 227 Surge protector 228 Battery charger or rectifier 229 Battery (all types)
Home Electrical Fires, 4/13 169 NFPA Fire Analysis & Research, Quincy, MA
Lamp, bulb or lighting 230 Unclassified lamp or lighting 231 Lamp-tabletop, floor or desk 232 Lantern or flashlight 233 Incandescent lighting fixture 234 Fluorescent light fixture or ballast 235 Halogen light fixture or lamp 236 Sodium or mercury vapor light fixture or lamp 237 Work or trouble light 238 Light bulb 241 Nightlight 242 Decorative lights – line voltage 243 Decorative or landscape lighting – low voltage 244 Sign Cord or plug 260 Unclassified cord or plug 261 Power cord or plug, detachable from appliance 262 Power cord or plug- permanently attached 263 Extension cord Torch, burner or soldering iron 331 Welding torch 332 Cutting torch 333 Burner, including Bunsen burners 334 Soldering equipment Portable cooking or warming equipment 631 Coffee maker or teapot 632 Food warmer or hot plate 633 Kettle 634 Popcorn popper 635 Pressure cooker or canner 636 Slow cooker 637 Toaster, toaster oven, counter-top broiler 638 Waffle iron, griddle 639 Wok, frying pan, skillet 641 Breadmaking machine Equipment was not analyzed separately for confined fires. Instead, each confined fire incident type was listed with the equipment or as other known equipment. Item First Ignited. In most analyses, mattress and pillows (item first ignited 31) and bedding, blankets, sheets, and comforters (item first ignited 32) are combined and shown as “mattresses and bedding.” In many analyses, wearing apparel not on a person (code 34) and wearing apparel on a person (code 35) are combined and shown as “clothing.” In some analyses, flammable and combustible liquids and gases, piping and filters (item first ignited 60-69) are combined and shown together. Area of Origin. Two areas of origin: bedroom for more than five people (code 21) and bedroom for less than five people (code 22) are combined and shown as simply “bedroom.” Chimney is no longer a valid area of origin code for non-confined fires. Rounding and percentages. The data shown are estimates and generally rounded. An entry of zero may be a true zero or it may mean that the value rounds to zero. Percentages are calculated from unrounded values. It is quite possible to have a percentage entry of up to 100% even if the rounded number entry is zero. The same rounded value may account for a slightly different percentage share.
Home Electrical Fires, 4/13 170 NFPA Fire Analysis & Research, Quincy, MA
Because percentages are expressed in integers and not carried out to several decimal places, percentages that appear identical may be associated with slightly different values.
Home Electrical Fires, 4/13 171 NFPA Fire Analysis & Research, Quincy, MA
Appendix B – What Is an Electrical Fire?
There are several possible approaches to estimating the electrical part of the home fire problem. The most direct and inclusive approach is to identify fires that began because of some type of electrical failure or malfunction. Version 5.0 of the National Fire Incident Reporting System (NFIRS), first introduced in 1999, introduced many changes in data classifications, definitions, and rules. Among those changes was the creation of an Electrical Failure or Malfunction section in the Factor Contributing to Ignition data element. Prior to the introduction of NFIRS Version 5.0, there were two fields that could be used to identify electrical failures. One was the Form of Heat of Ignition field, which had 10 categories defined by different failure modes for electrical equipment plus two additional categories for properly or improperly operating electrical equipment and a thirteenth category for electric lamp or light bulb. The other was the Ignition Factor field, which had two relevant categories – short circuit or ground fault, and other electrical failure. Because the pre-1999 Form of Heat of Ignition also had two categories each for gas-fueled, liquid-fueled, and solid-fueled equipment, the field was primarily used to distinguish equipment fires by type of fuel or power. NFIRS Version 5.0 provides a separate field on Equipment Power, which means it is no longer necessary to use Heat Source codes as a proxy for this purpose. The new Heat Source field has removed the 13 Form of Heat of Ignition categories that had referred to electrical equipment and added one category for electrical arcing. Seven of the 13 categories that used to be in the Electrical Equipment section of Heat Source are now in an Electrical Failure or Malfunction section of the Factor Contributing to Ignition field. Six of the seven (excluding fluorescent light ballast) are defined by some type of arcing. The former Form of Heat of Ignition category of overloaded equipment within the Electrical Equipment section is now an equipment overloaded category applicable to any type of equipment and located within the Operational Deficiency section of Factor Contributing to Ignition. The other five electrical-related categories – electric lamp or light bulb, properly or improperly operating electrical equipment, and unclassified or unknown-type electrical equipment – either no longer exist or are now represented by the “other” (unclassified or unknown-type) electrical failure or malfunction category. The unclassified and unknown-type electrical equipment categories that were in Form of Heat of Ignition prior to 1999 both referenced “heat from electrical equipment arcing or overloaded.” This phrasing provided a subtle reminder that not all electrical ignitions involve arcing. Overloaded circuits can overheat and ignite nearby combustibles without arcing. The new unclassified and unknown-type electrical failure or malfunction includes no such reminder but is not limited to arcing. Here are some of the estimates of 1980 home electrical failure or malfunction reported structure fires that could be developed from these two data fields:
(1) 202,500, based on all 13 potentially relevant categories in the Form of Heat of Ignition field;
Home Electrical Fires, 4/13 172 NFPA Fire Analysis & Research, Quincy, MA
(2) 100,700, based on the Form of Heat of Ignition field but excluding four specific categories that do not mention a type of electrical failure or malfunction in their labels – electric lamp or light bulb, heat from properly operating electrical equipment, heat from improperly operating electrical equipment, and heat from overloaded equipment – while including fluorescent light ballast; this was the formula used in the 2009 report;
(3) 83,700, based on formula (2) with the additional exclusion of heat from unclassified or unknown-type electrical equipment arcing or overloading; and
(4) 71,700, based on the two Ignition Factor codes, which is the formula used in this report.
From 1999 on, the Factor Contributing to Ignition field provides the most comprehensive but focused identification of fires involving electrical failure or malfunction, and pre-1999, the Ignition Factor field is most similar to the current Factor Contributing to Ignition field. The old Form of Heat of Ignition field had too many categories that might have been mostly or partly filled with fires started by heat from electrical equipment but with no electrical failure or malfunction involved. The new Heat Source field cannot be used to estimate fires involving all forms of electrical failure or malfunction but only electrical arcing. That approach results in an estimate 35% lower than the 2003-2007 non-confined home fires estimate for electrical failure or malfunction. If fires with Heat Source coded as unclassified or unknown-type within the Operating Equipment section of Heat Source, which includes electrical arcing, are proportionally allocated over the section, the adjusted electrical arcing estimate is still 11% lower than the 2003-2007 estimate based on electrical failure or malfunction as a factor contributing to ignition. Because the latter also includes more detail on the failure mode resulting in arcing, this report does not use the electrical arcing category in Heat Source as the basis of estimates of the size of the electrical failure problem. In previous years, NFPA analysis of home electrical fires focused on fires where some type of electrical distribution or lighting equipment was the equipment involved in ignition. This approach was not so inclusive as direct analysis of all electrical failures but could be executed more cleanly than the more inclusive approach prior to the introduction of Version 5.0 of NFIRS. Prior to 1999, NFIRS had 10 electrical distribution equipment categories, including separate categories for unclassified and unknown-type equipment. There was also an eleventh category (rectifier, charger, inverter, battery) that was outside the electrical distribution equipment group prior to NFIRS Version 5.0 but moved into that group as part of the Version 5.0 changes. In NFIRS Version 5.0, there are 40 distinct electrical distribution or lighting equipment categories. One is for unclassified or unknown-type equipment and is normally proportionally distributed over the other categories for analysis purposes, as was done with the unknown-type category (but not the unclassified category) prior to 1999. There are also three categories for unclassified wiring or related equipment, lighting equipment, or cords or plugs, respectively. These three categories had also been proportionally allocated in the 2008 report in this series but are now kept separate.