Embed Size (px)
Citation preview

Electrical Insulation Research Center
Institute of Materials Science, U-136
University of Connecticut
Storrs, CT 06269-3136
Performed for
Tennessee Valley Authority
contract TV-79850T
ANALYSIS OF DAMAGE TO INSTRUMENTATION CABLES
REMOVED FROM
WATTS BAR NUCLEAR PLANT
prepared by:
Joseph H. Groeger
JoAnne Ronzello,
Peter Wronski
Matthew S. Mashikian
P December 11, 1989
8912280164 891220R ADOCK 05000390
PNU

INTRODUCTION
As a result of an Employee Concern program, a group of
instrumentation cables was removed from conduits at the Watts Bar
nuclear pl ant (WBN) of the Tennessee Valley Authority (TVA). This
program had specifically cited the possibility of thermal damage
to instrumentation cables inside a conduit that had received an
electric welder arc strike. When the cable was removed from this
conduit, there was no readily apparent thermal damage to the
jackets of any of the 26 cables in the conduit cited. However, a
number of areas on the cable jackets contained damage ranging from
slight abrasions/cuts into the jacket, to exposed conductors. The
damage appeared, upon inspection by TVA, to have been mechanically
introduced. The Electrical Insulation Research Center (EIRC) was
contacted for an independent evaluation of the nature of the
damage to the cable jackets and to determine how and when it may
have occurred.
Approximately four weeks later, another group of cables was
removed by TVA from Unit 1. of the Watts Bar facility for the
express purpose of assessing whether any damage similar to that
found in the aforementioned cable conduit was to-be found. Some
locations on the surfaces of t he latter cables contained damage
similar to that found on the surfaces of the previous cables, as
examined by TVA.
EIRC- was specifically asked to use its expertise and
experience to determine the cause of the damage to these cables.
All testing/ analysis was witnessed by TVA employees, including
Frank McGovern, Brian Reagan, Kent Brown, Tom Hughes, and Jim
Hutson.
Tables 2. and 2 indicate the inventory of cables evaluated
which were removed as a result of the Employee Concern program and
those removed at TVA's discretion to asse ss the extent of damage
to other instrumentation cables at the WBN facility.

Table 1Selected Cables Removed As A Result of Employee Concern Program
from WBN Unit 2
2PM-506-D
2PM-516-D
2PM-4781-D
2PM-508-D
2PM-1694-D
2PM-1041-D
2PS5281D
2PS-283-D
2PM-696-D
2PS-284-D
2PM-881-D
2PM-871-D
Table 2Cables Removed At Discretion of TVA
from WBN Unit 1
X9
1-2PM-203-4470-B
1-PM-506-D
1-PM-778-D
1M-591-B
1RM440A
1-2RM-90-450-B
1-2PL-83-1085-B
2V-2846-B
1-2PS-68-283-D
O-SP-285-529
1M-2450-B
1-PM-1656-D
SP565 (2-3PL-26-5080-B)
V976B
1-RM-452-B
1-2RM-90-448-B
1-2PM-3-3990-A
1-3M-74-2451-B
1PM4470B
Table 3Remaining Samples Submitted By TVA for Reference/Background
parachute cord
flexible conduit
"Polywater G" lubricant
virgin cable (CPE)
virgin cable (XLPE)
Wasp killer spray
pull rope
"Yellow-77" lubricant
"Polywater J" lubricant
virgin cable (Hypalon®)
concrete anchor
fire stop "breaching tool"

In meetings with. TVA, a number of items were discussed asbackground to the investigation. These are as follows:
* It is known that "Yellow-77" was the predominant pulling
compound used during the original installation of theinstrumentation cables at the Watts Bar facility.
* The complement of cables were installed as sub-bundles
(pull-bys) in a given conduit, rather than as onecomplete bundle (bulk pull).
* To aid in removing the cables with as little subsequent
damage as possible, the conduits were lubricated with"Polywater G" pulling compound. This was later washedfrom the surfaces of the cables prior to their shipment
to EIRC.
* TVA prepared isometric drawings of the instrumentationcable conduit system at the Watts Bar facility andcompared the locations of damage on the instrumentation
cables to the corresponding locations in the conduit
system. A significant amount of damage was found tocorrespond to the location of a flexible conduit. Thelatter was also provided to EIRC for analysis.
* The instrumentation cables contain three different types of
jackets, including chlorinated polyethylene (CPE),Hypalon® rubber, and crosslinked polyethylene (XLPE).
* The Unit 2 instrumentation cables had all been installed
between 1982 and 1985 and were removed between June andJuly, 1989. The unit 1 cables from conduit MC 400B wereinstalled between 1979 and 1985 and were removed in
September, 1989.* TVA stated that cables 1-PM-778-D and 1-PM-1656-D were
known or suspected to have suffered accidental contactwith an abrasive cut-off wheel used to dismantle a fire
seal during removal of this cable.

INSTRUMENTATION USED, FOR ANALYSES
'. Infrared Microspectrophotometry (LLIR)a This instrument consists of a dispersive type infrared
spectrometer that is integrated into a special optical microscope.This system allows'conventional infrared absorption spectra to beobtained from very small, user selected areas of specimens thatare too small for conventional, bulk IR spectroscopy. The systemis used by focusing a reference (visible) light beam over an areaof interest then the infrared spectrometer scan is started. Thespectrometer consists of a variable wavelength infrared lightsource that is scanned from a wavelength of 2.5 to 14.5gm. Whilethe spectrometer is scanned at a user-selected rate, thetransmitted infrared signal through the specimen is simultaneouslymonitored with a mercury cadmium telluride detector. The infraredwavelength is plotted against the corresponding absorbance toproduce a spectrum. Virtually all organic compounds containchemical bonds that actively absorb infrared radiation at selectedwavelengths. Each compound contains its own fairly unique"fingerprint" of absorbances. These are catalogued in a number ofreferences on the subject [1,2].
Optical Microscopy (Stereo. Polarized)
Three types of optical microscopy were used throughout thisinvestigation. These included stereo microscopy, photomacroscopy, polarized microscopy. Stereo microscopy provided amagnification range from 1 through 80 magnifications, with theNikon SMZ-l, serial #193348, used for this project. This type ofmicroscope provides two concentric optical paths in order tomaintain a high depth-of-field. This instrument was used to aidin viewing the surface details at all of the damaged sites on thecable jackets. It was also used to inspect the surface of theconcrete anchor for any debris that might have indicated its timeof placement in the conduit from which it had been removed.
Photography of larger areas, in the magnification range of 1x
h through 50x, was accomplished with a macro-photography system.

This operates in much the same.-.way as the stereo microscopepreviously described, except that only one optical path is used.This system, a Leitz model 301-182101, serial #60;4', was used tophotograph many of the damaged sites on the cable surfaces.
Polarized microscopy consists of a microscope with a singleoptical path and various polarizing accessories incorporated forthe purpose of measuring the optical properties of a specimen. ANikon Biophot, serial #520114, was used throughout this project.This instrument has a magnification range from 40 through 1000x.The "Yellow 77"1 and "Polywater" pulling compounds were examinedwith this microscope in order to identify their components. Theends -of the conductors of one cable section that was found brokenwithin a conduit were examined with this instrument.
The polarizing microscope previously described can be usedwith either transmitted or reflected illumination. The former istypically used for the examination of optically transparentmaterials, while the latter is used to examine opaque specimens.Thicknesses of the insulation from the' coaxial cables weremeasured with this instrument, using a scale calibrated with areference grating from Reticules, Inc., traceable to NBSstandards.
Hardnessq Tes4tinJ
Shore hardness measurements were made on the surfaces of allof the cable jackets selected for analysis. A Shore hardnesstester was used for all tests cited herein. The Shore hardness Aprobe, serial #88766 and D probe, serial #87458, were usedexclusively for all hardness testing. This instrument consists ofa series of calibrated styli that are impressed into the surfaceof a material with a constant force. The displacement, orpenetration of the stylus into the material's surface is measuredwith a built-in dial micrometer. The displacement is proportionalto the hardness of the material. The Shore hardness value isdependent on the type of stylus used (Shore A or D) and the stylus

displacement. The relationship is described in tables providedwith the tester. Calibration of the hardness tester was conductedwith standard blocks supplied with the instrument. Hardnesstesting was used to determine if any cable jackets were improperlymanufactured or had suffered some deleterious damage while in the
conduits or during handling prior to their installation. Hardnessof polymers can be adversely affected by solvent interaction,thermal damage, or improper manufacture, among otherconsiderations. Hardness values obtained from the damaged cableswere then compared with values provided from the manufacturers ofthese cables, as obtained by Frank McGovern, in the presence of
EIRC.
Tensile Testing
An Instron model TTCM6, serial #856, tensile tester was usedto determine the tensile strength of the "parachute cord" whichhad been found in one of the implicated conduits and was known tohave been used for cable pull-in operations. The tensileproperties of a 2 conductor #12 AIW cable were also obtained withthis instrument. This instrument consists of a grip system thatis used to hold a specimen from either end. One grip is fixed toa load cell while the other is attached to a moving frame that hasa user-selectable rate of displacement. From this instrument, theuser obtains a chart showing displacement plotted against load.The tensile strength of a material is obtained by measuring themaximum load obtained when a specimen breaks under load. TheInstron system was calibrated with an Instron weight set,traceable to NBS standards for Class C Laboratory Weights.
Pull-by "simulations" were also conducted with the Instronsystem. This afforded a means for obtaining a known contact loadbetween a cable and a pull rope, for example, while simultaneouslyallowing for a controlled- rate of contact velocity.

Gag Chromatography/Masn Spectroscopy (GC/MS)
This instrument is used to identify volatile organiccompounds, based on their molecular weight and retention time in aspecial column. This system consists of two subsystems, as thename suggests. The gas chromatograph is an instrument that makes
use of a special, small bore (i.e., 20gm) column into which a gassample is injected. At the end of the column is one of a varietyof detectors that sense a gas evolving from the column based onits thermal conductivity, infrared absorbance, dielectricconstant, or other property, depending on the type of detectorused. Larger gas molecules pass through the column more slowlythan the smaller ones. In this manner, the column separates a gasmixture into its constituents. The measurement consists ofdetermining a retention time, in a given column, as a function oftemperature. Standard, high purity gases are used to calibratethe column before and after an analysis.
The mass spectrometer system uses the gases separated by theGC system and measures their mass as they are accelerated through.a strong magnetic field. By combining the GC and MS systems, eachgas component can be identified by its retention time anld mass.This instrument was used in an effort to identify the agentresponsible for the apparent swelling of the jackets of cables 2V-2846-B and X9. This will be explained in detail in this report.
A hand-held micrometer was used to measure the thickness ofsome of the cable components. The micrometer used was a Mitutoyo1 inch range, serial #Y12549. The calibration was checked with aset of Do-All gage blocks, serial #826. Thickness measurementswere made in at least three locations for each measurement, with
the average results recorded.
X-Radiography
X-radiographic inspection of selected specimens wasaccomplished with a Faxitron model 805 system, serial #1472. All

inspections were accomplished with a potential of 90 kV, usingcopper ka X-radiation. The distance of the specimen to the X-ray
source was maintained at 8 inches. Photographic records were made
of all radiographic inspections and appear within this report.
Metalloaraphic Inspection
This inspection technique involves mounting a metal sampleinto a hard, polymeric resin, with subsequent polishing through
successively finer abrasive steps to obtain a highly polishedcross-section of the metal sample. This procedure was used todetermine the thickness of the oxide layer on the surface ofcopper .,conductors that had been exposed due to damage to thejacket and insulation of the cable in which they were included.Inspection of the metallographic specimen is accomplished with a
reflected light microscope, as previously described.
Thermal Aging
To experimentally determine the rate of oxidation of thecopper conductors in cable 2PM-516-D, a section some location away-from the damaged site on this cable was removed. on this section,
the jacket and insulation were removed to exposed approximatelythe same area as that exposed in the damaged site. This was theninserted into a hot air oven at 60 0C for a period of 60 days.
EXPERIMENTAL PROCZDURZS
CAble Shipment and Initial Inspection
The cables listed in Tables 1 and 2 were separately shipped
in wooden crates to EIRC. Figure 1. shows the first set of
shipping crates containing the cables listed in Table 1. These
crates were opened in the presence of TVA personnel. Figure 2
shows the flexible conduit section, as removed from its shipping
container. Note that care was taken to keep the conduit in its
original conformation, as found at the Watts Bar facility. The
cables were removed from their shipping containers and laid out on
a floor for inspection by EIRC personnel and to review the

labelling system used by TVA to identify the cables and thedamaged sites on each cable. Figure 3 shows one bundle of cablesas tfiey were removed from their shipping container. Figure 4shows two damaged sites on the cables removed from conduit MC400B, covered prior to shipment by TVA with protective wrap, asrequested by EIRC. This precaution was taken to reduce thechances for subsequent damage or contamination to the damaged
sites.
The items listed in Table 3 were received in five separateshipments over the course of six weeks. The virgin cable sampleswere shipped at the request of EIRC for the purpose of comparativehardness measurements and for use in pull-by simulations.
Representative damaged sites were removed from theinstrumentation cables according to a priority ranking system assuggested by TVA and agreed to by EIRC. These sites correspond to
those listed in Tables 6 through 8.
Infrared Microspectrophotometry
Infrared microspectrophotometric analyses were conducted onfibers of the pull rope and the parachute cord. In addition, thepulling compounds and surface residues from the concrete anchorwere also analyzed. Individual fibers from the ropes were removedwith a fine tweezer and supported over an open hole in an aluminumholder. This was then imaged on the gIR microscope. The IRspectrometer was then scanned at a rate of 4cm-i/minute, from4000cm-i to 690 cm-1. The spectrometer was calibrated with aPerkin-Elmer standard polypropylene film, serial #1667-1. Samplesof the pulling compounds, "Yellow-77", "Polywater G", and"Polywater J", were placed on thin salt crystals for JIR analyses.The salt crystals were first analyzed without pulling compoundpresent, to established a background spectrum. The salt crystalscontaining the pulling compound were then analyzed, with thebackground spectrum from the crystals alone subtracted.

Visual and Stereomicroscopic Examination
Visual inspection was first conducted to assess the extent ofdamage to the cable components. The cables were divided intothree categories according to the extent of damage observed, aswill be discussed. Figure 5 shows a representative visualexamination of three damaged sites removed from theinstrumentation cables listed in Table 1. Following visualexamination, a stereomicroscope was used to examine the damagedsites in more detail. Figure 6 shows one such cable beingexamined with this instrument. These examinations concentrated onthe details at the damaged sites, such as surface characteristics,presence of embedded materials, presence of material flow, sharp
cuts,-crushing, etc.
The fracture surface of cable 2PS5281D was examined for itsmorphology to determine its mode of fracture. These details were
subsequently photographed.
Physical Dissection
Physical dissection of a number of sites on selected cablesamples was conducted. This was accomplished with a number ofsectioning tools, including scalpels, razor blades, pliers, andother tools, selected as needed. All such dissections wereconducted in the presence of TVA personnel. In all cases, suchdissections were preceded by X-radiographic inspection so as to becertain that destructive sectioning would not inadvertentlydestroy areas or information that would hinder the investigation.
Polarized Microscopy
The pulling compounds were analyzed with the polarizingmicroscope to determine if they were homogeneous and might containany constituents that may have aided in identifying the time ofdamage to any of the cables. A few drops of each pulling compoundwere mounted on glass slides and observed under polarized,
transmitted illumination at magnifications ranging from 40xthrough 400x. The components were characterized by their optical

properties (polarizing characteristics, color, s6lventinteraction, texture, etc.) and identified with the aid ofreference [3).
Hardness Testing
Hardness testing of the cable jackets was conducted with thejacket in place over the cable core. The Shore A or Shore Dscales were used for all of the hardness tests conducted.Hardness testing was conducted on virgin cables of each jackettype (CPE, Hypalon®, and XLPE). It should be noted that thevirgin cables are of the same vintage and manufacturing source asthe damaged cables. Hardness values were obtained from var-iouslocations on the surfaces of the damaged cables. These includedsites in the immediate vicinity of the damage and sites somedistance removed from those sites.
Tensile Testing
Tensile testing of the pull ropes and one wire specimen wasconducted with the Instron machine previously described. All.tensile tests were conducted with an extension rate of 0.25in/minute. Loads were determined from a calibrated recorderscale. The tensile strength data obtained corresponded to theultimate tensile strength (i.e., the load measured at the break
point).
Pull-By Simulations
Pull-by "simulations" were conducted on the Instron tensiletesting machine previously described. Various combinations ofcable-over-cable and parachute cord-over-cable were used todetermine the nature of the surface damage inflicted at theinterface between these materials. Cables of the various jackettypes were sequentially pulled over cables of the same and otherjacket types. The parachute cord was pulled over each of thecable jacket types. To accomplish this, a loop of each cable wasformed and fixed to the traveling (lower) end of the Instron testframe. To the upper, or stationary part of the frame, the cable

or parachute cord being-pulled over the cable loop was attached at
one end. The free end of the latter was then held by hand at a
900 angle to the load axis. This arrangement is shown in Figure7. In Figure 8, a pull-by simulation is shown as it is being
conducted, The operator is controlling the tension on theparachute cord, in this case, to assure that a desired contact
load is maintained, as indicated on the load-indicating chart
recorder shown at the left edge of this Figure. Contact loads of
approximately 75, 100, and 150 lbs were used for all combinations
of pull-bys. The selected load was maintained by physicallyrestricting the movement of the free end on the lower cable or
rope, while observing the load detected by the Instron load cell.
These loads were chosen to be representative of moderate and upper
limits of the pulling forces achievable by a single person
installing cables. The contact velocity was maintained at 20
inches/minute and a standard pull-by of 12 in. of material was
maintained for all tests. This velocity, though perhaps slower
than a true cable pull-in operation, was the highest speed
available on the equipment at the disposal of EIRC. Subsequent to
these pull-by simulations, the surface damage on each cable was
evaluated visually and with the aid of a stereomicroscope.
The pull rope was not used in the pull-by simulations as it
was determined by EIRC to be too large in cross-section to have
inflicted the type of localized damage found on the surfaces of
the cables in question.
Gas Chromatography/Mass Spectroscopy
Analysis of the compound(s) responsible for swelling of thejacket on cable 2V-2846-B (Hypalon@) was attempted using a
thermodesorption process to remove the responsible material(s)
from the jacket for subsequent identification using GC/MS methods.
Sections of the jacket material in the swollen area were heated ina closed chamber to 1500C. The evolved gases were then injected
into the GC/MS system which was run through a temperature program
from 350C to 3500C. An OVl fused silica capillary column, 0.32mm

x 50 meter length, was used to separate the gaseous components foridentification.., To determine what differences might exist in thechemistry of the swollen areas compared with the unaffected areas,analyses of both were conducted. The spectral peaks obtained withthis system are identified through use of the EnvironmentalProtection Agency (EPA) search library, among others. As only asingle peak could be identified as unique to the swollen area ofthe Hypalon® cable jacket, a number of steps were taken to attemptto increase the system resolution. These included increasing thesample size, cryo-focusing of the injection step, and otherstandard concentration procedures. These are not described indetail as no significant results were obtained.
Wasp Spray Interaction with Cable Jacket Material
Using the wasp spray provided by TVA (Superior Industries "NoSting"®), several areas of the jacket of cables 2V-2846-B and X9were exposed to this material and observed for any swelling. Thiswas done under ambient conditions at a temperature ofapproximately 720F. After four days, no swelling had yet become-apparent. A final observations was made following ten days and noswelling had become apparent.
X-Radiographic Inspection
X-radiographic inspection was conducted on the samples shownin Table 4 for the purpose of non-destructively inspecting theinternal construction. It was suspected that some of theirregularities in these cables might be attributable to splices inthe conductor strands. This method was also used to inspect whatappeared to be a repair splice identified as 1-2PS-68-283-D, priorto sectioning.
Table 4Cables and Samples Subjected To X-radiographic Inspection
1-2PS-68-283-D l-2PM-203-4407-B
1-2PM-3-3990A 2PM-4781-D
2PM-1694-D

RESULTS
Analysis of Pulling Lubricants. Pull Cord and Pull Rope
Infrared microspectrophotometry (JIR) was used to
characterize the pulling compounds "Yellow 77", "Polywater J", and
"Polywater 'G". The "Yellow 77" compound was found to contain
three components, including a liquid, cellulose fibers, and a
yellow inorganic pigment. Figure 9 is the infrared spectrum from
the "Yellow 77" compound, with most of the liquid removed and some
yellow pigment present. From reference [1], and excluding the
absorbances due to water, the spectrum corresponds to that for
cellulose. The liquid phase could not be fully identified using
this technique, but was determined to contain water and a
hydrocarbon of some type. The yellow pigment was not analyzed
beyond the simple determination of its inorganic nature.
The "Polywater G" and "J" compounds were found to consist of
a liquid component and, in the case of "Polywater J", a brown
inorganic pigment with a particle size of less than 1 pm. The
pigment was not analyzed beyond a simple determination of its.
inorganic nature. Infrared spectra for "Polywater J" and
"Polywater G" are presented in Figures 10 and 11, respectively.
Small fibers of the parachute cord and pulling rope were
removed for identification using the gIR method. Figure 12 shows
identical infrared spectra from two separate parachute cord
fibers. Figure 13 is a spectrum for nylon 6,6, obtained from
reference [1]. Figure 14 is the infrared spectrum from a fiber of
the pull rope.
Inspection of Flexible Conduit
The interior of the flexible conduit section was first
examined with the aid of a borescope provided by TVA. This
disclosed no evidence of any cable jacket material retained within
the convoluted interior surface. The conduit was subsequently
sectioned by unwrapping its convolutions, as shown in Figures 15
and 16. These were then visually inspected and, again, no

evidence of cable jacket material-was found at any point. At the
end of the conduit where there is a transition between a female
pipe thread and a straight section of galvanized pipe, a sharp
edge was found, as shown in Figure 17. No evidence of retained
cable jacket material was found at this point.
Assessment of Copper Oxidation
Metallographic inspection of the oxidized surface of the
conductors of cable 2PM-516-D disclosed that the oxide was 7;m
thick. For comparison purposes, the sample of the same cable,
deliberately exposed to a slightly elevated temperature for 60
days, contained an oxide film thickness of 0.5 lim.
Inspection of Cable Repair Sleeve
Inspection of the suspected repair sleeve, 1-2PS-68-283-D,
shown in Figure 18, was first conducted with X-radiography. The
corresponding X-radiograph of the cable within the repair sleeve,
Figure 19, reveals a cut through the cable jacket. The underlying
cable components appeared to be unaffected, but the cable was-
subsequently dissected for more detailed examination. Figure 20
reveals the cable jacket with the repair sleeve stripped away.
The cut in the jacket is shown at the center of this figure, with
the open end on the right. The cut was found to have been filled
with an elastomeric resin. Figures 21 shows the cable components
underneath the jacket cut, with no damage to these components
evident.
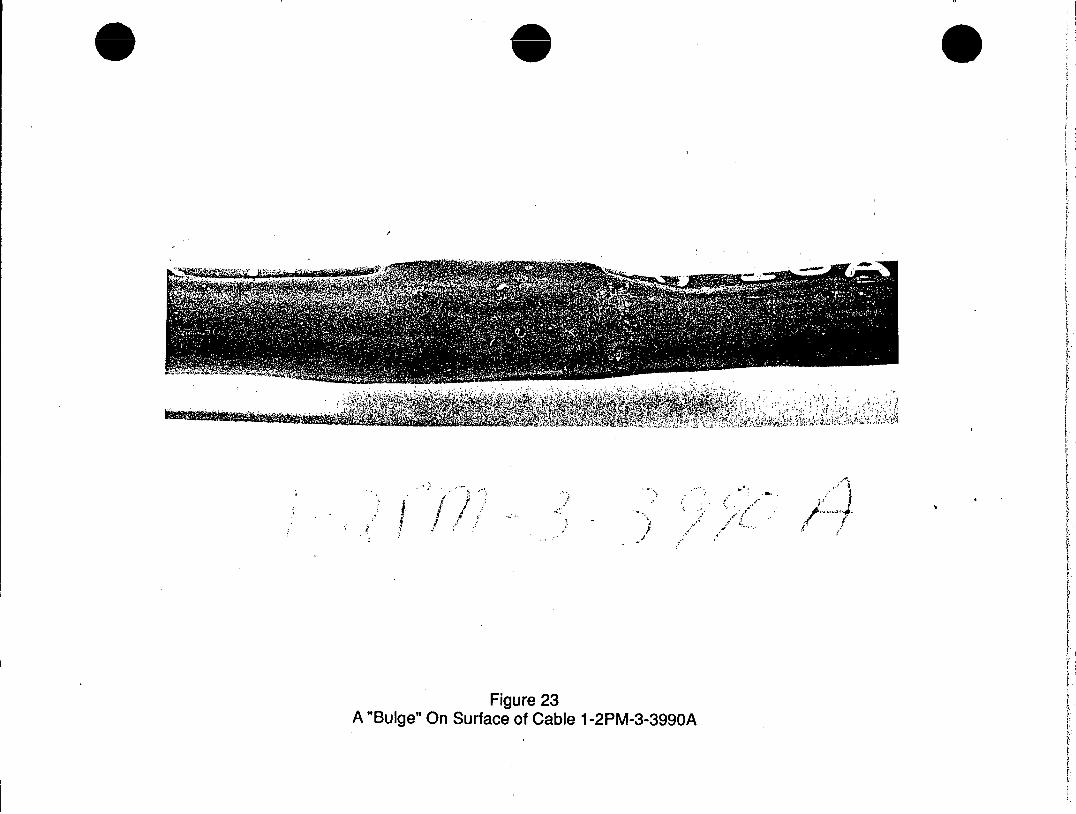
Analysis of Jacket "Bumps" and "Bulges"
A number of cables were found to contain protrusions in their
cross-sections, variously referred to as "bumps" or "bulges". The
term "bump" was used to describe the short, relatively sharp
protrusions from the- jacket surfaces. "Bulge" was used to
describe the longer, less sharp protrusions. The cables
containing these features are identified as follows: 2PM-4781-D,
2PM-1694-D, 2PM-1041-D (2 locations), 2PS-284-D, and 1-2PM-3-
3990A. Figures 22 and 23 show one "bump" and one "bulge",

respectively, on the Surface of cable 1-2PM-3-3990A. The "bump"on the surface of this cable was subjected to X-radiographicexamination, as shown in Figure 24. This shows that there is nointerruption in the conductor bundle. Similarly, Figure 25 is anX-radiograph of the "bulge" on the- surface of the same cable.Again, there was no interruption in the conductors noted. The"bump" site was subsequently dissected and found to contain alarge chunk of material embedded within the jacket, as shown inFigure 26. The "bulge" site was found to contain similarinclusions of material within the jacket. Small bits of thesematerials were removed from the jacket for characterization. Theywere found to be black, opaque, brittle, and insoluble in a rangeof poiar and non-polar organic solvents. No further analyses wereconducted on these materials. Cable 2PS-284-D was found tocontain a similar particle embedded in its jacket immediatelyunder a "bump". X-radiographic inspection revealed that thiscable did not contain any interruptions or splices within the
conductors.
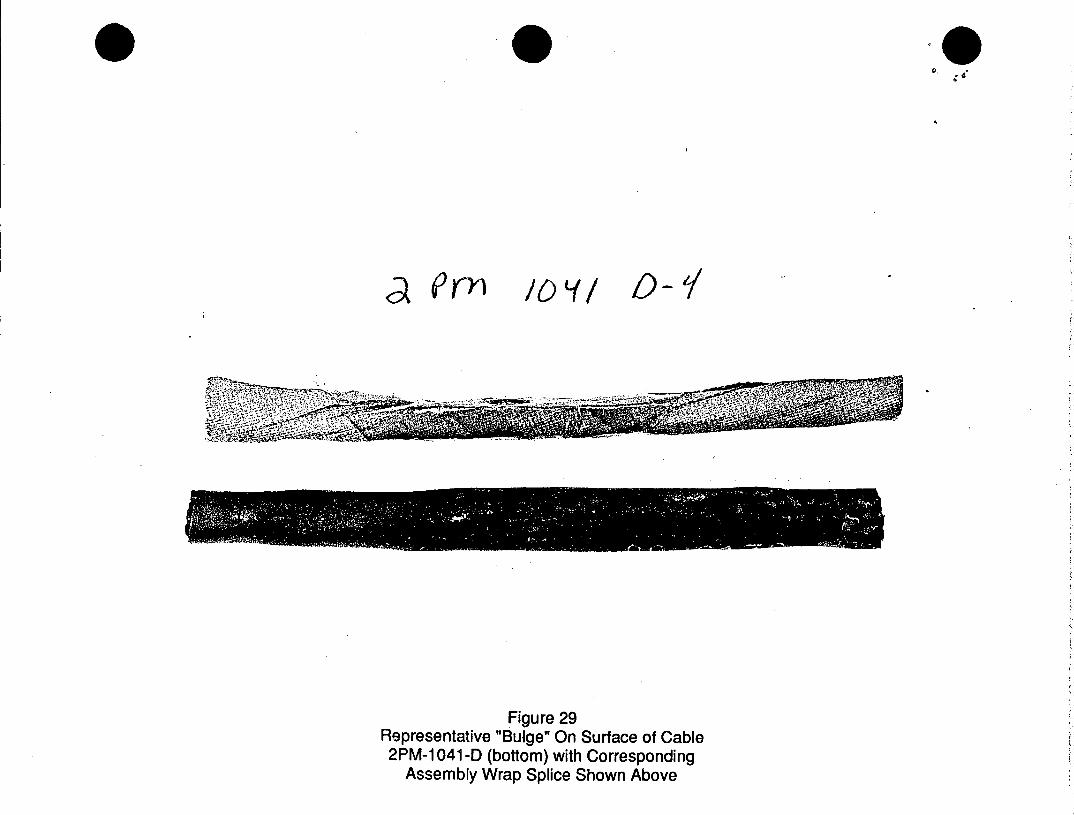
Figure 27 shows cable 2PM-4781-D and the corresponding"bulge" in its jacket. At the top of this figure, the splice inthe assembly wrap is shown, including the black thread used tomake the joint. This was found immediately under the "bulge".Figure 28 shows cable 2PM-1694-D with its jacket "bulge" at thebottom and the corresponding splice in its assembly wrap shown atthe top of this figure. White thread was used to complete thesplice. Cable 2PM-1041-D (location 1) was found to contain asimilar "bulge" on the surface of its jacket, with a correspondingsplice in the assembly wrap, also sewn with white thread. Figure29 shows the "bulge" in the surface of cable 2PM-1041-D (location2), with the corresponding joint in its assembly wrap shown at thetop of this Figure. In this case, the joint was completed with ayellow Mylar tape. A cross-section through the jacket of thelatter cable is shown in Figure 30. No anomalies were found inthe wall of this jacket. X-radiographic inspection of the cablescontaining splices in their assembly wrap tapes disclosed that

none containedýeny interruptions br splices in their conductors.This includes cables,2PM-4781-D, 2PM-1694-D, and 2PM-1041-D.
Examination of Abandoned Cable
Cable "2PS5281D had been found as a short section that hadbeen abandoned in the WBN Unit 2 conduit in which it had beeninstalled. The ends of this cable were examined in order to
determine how it had failed, specifically whether it had broken or
had been cut. Figure 31 is an overall view of the end of this
cable. In Figure 32, more details of the ends of the conductorsare shown. These were found to be elongated and tapered which isconsistent with a tensile overload fracture [5].
Jacket Hardness Results
Hardness testing of most of the cables listed in Table 1 wasconducted. In those cases when a jacket "bulge" or "bump" waspresent, the reasons for these became apparent as a result of thedissection of these sites. As a consequence, hardness testing ofthese sites was not necessary. In addition, the cables containing-swollen jackets, 2V-2846-B and X9, were tested for their jacket
hardness. The hardness of the jacket of cable 2PS5281D was not
measured as this had been abandoned within its conduit. Expected
hardness values for the cable jackets listed below were obtained
from the manufacturers on September 12, 1989, by Mr. Frank
McGovern, of TVA, while on-site at EIRC. Table 5 lists thehardness values for each of the cable jackets tested and their
corresponding expected values.
The hardness values measured near each of the damaged areasof the cables listed in Table 5 were compared with hardness
measurements approximately 4 in. away from the damaged sites. Inall cases, these compared within less than ± 0.2, Shore A units.
This range is within experimental error.

Table 5Expected and Measured Hardness Values for Cable Jackets
All Values Provided In Shore A Units
measurednal nhardness
2PM-506-D 89.8
2PM-516-D (location 2) 93.6
2PM-508-D (location 1) 91.9
2PM-871-D (location 1) 92.7
2PM-871-D (location 2) 94.5
2PM-516-D (location 2) 92.7
2PS-283-D 71.0
2PM-696-D 71.5
2PM-508-D (location 2) 93.0
2PM-881-D 73.4
2PS-284-D 69.6
2V-2846-B (swollen area) 55.8
2V-2846-B (non-swollen) 76.7
X9 (swollen area) 60.3
X9 (non-swollen) 79.3
expectedhardnts3
93
93
93
93
9393
65-68
65-70**
93
65-70**
65-68
65-70
65-70
65-70
65-70
** note: These jackets are made from Hypalon® insulating material.As a result, the values for hardness are those expected for otherHypalon® jacketed cables and these are used for comparison
purposes.
Analysis of Damaged Sites
Microscopic examination of all of the damaged sites on the
cables failed to disclose any residue of the pulling compounds,including "Yellow-77", "Polywater G", and "Polywater J". Inaddition, no fibers from any of the pulling ropes or parachute
cord could be identified. Microscopic examination of the concreteanchor surface and analysis of selected samples of the surfaceresidues failed to disclose any residues of the three pulling
compounds previously described.

Examination of the details of the damaged locations on thecables shown in Tables 1, 2, and 3 was conducted with thestereomicroscope. As a result of this and visual examination, thecables were divided into the categories shown in Tables 6, 7, and
8. Each category contains cables grouped according the theseverity of jacket and insulation damage. Details of the damagesites on each cable were examined and the results are itemized in
the following paragraphs.
Table 6Cables with Exposed Conductor Strands
(Manufacturers are Indicated In Parentheses)
2PS-284-D (AIW) 2PM-881-D (Eaton)
2PM-516-D (Anaconda) 1-3M-74-2451-B (Rockbestos)
2PM-871-D (Anaconda) 2PS5281D (abandoned)
0-SP-285-529 (Cyprus)
Table 7Cables with Damaged Insulations, Non-Exposed Conductors
(Manufacturers Indicated In Parentheses)
2PM-506-D (Anaconda)
2PM-871-D (Anaconda)
1M-2450-B (Rockbestos)
1-3M-74-2451-B (Rockbestos)
lPM4470B (Eaton)
The cables listed in Table 8 were examined visually and withthe stereomicroscope to study their surface damage. Cable l-2PS-
68-283-D was previously discussed and found to contain a damagedjacket under a repair sleeve. Cables 2PS-284-D, l-2PM-3-3990A,
2PM-4781-D, 2PM-1694-D (2 locations), and 2PM-1041-D (2 locations)were found to contain jacket "bumps" or "bulges", as previouslydescribed. Cables 2V-2846-B and X9 were found to have jackets thathad been swollen, as previously described. Cables 1-PM-778-D and

1-PM-1656-D were each found to have a groove approximately 0.150
in. wide penetrating through and limited to the jacket, as shown in -Figure 33, for cable 1-PM-778-D. In a short experiment, contactingan unaffected area of this cable with an abrasive cut-off wheel
(Makita 12-304), at 3500 rpm, resulted in a site with damage
similar to that found on this cable.
Table 8Cables with Damage Limited to Jacket
(Manufacturers Indicated In Parentheses)
1-2PS-68-283-D (AIW) (repair)
!M-591-B (AIW)
1-2PS-68-283-D (AIW) (damage site)
2PS-284-D (AIW)
V976B (AIW)
1-2PL-83-1085-B (Anaconda)
1-PM-778-D (Anaconda)
1-PM-1656-D (Anaconda)
2PM-508-D (Anaconda) (2 locations)
2V-2846-B (Rockbestos)
2PM-516-D (Anaconda)
2PM-1694-D (Eaton)
2PM-1041-D (Eaton) (2 locations)
2-3PL-26-5080-B (Cyprus)
1-2PM-3-3990A (Eaton)
1-2PM-203-4470-B (Eaton)
2PM-696-D (Eaton)
2PM-1694-D (Eaton)
1-2RM-90-450-B (Rockbestos)
1-2RM-90-448-B (Rockbestos)
1-RM-452-B (Rockbestos)
1RM440A (Rockbestos)
1-PM-506-D (Belden)
X9 (Rockbestos)
2PM-4781-D (Eaton)
Cables 2PS-283-D, V976B, 2PM-508-D (2 locations), 2PM-516-D,2-3PL-26-5080-B, and 2PM-696-D were found to contain longitudinal
cuts through their jackets. These cuts varied in length from
approximately 0.25 in. through 1 in. They had a round cross-
section and were approximately 0.130 in wide. When compared with
the grooves formed during the pull-by simulations, their appearance
and features corresponded virtually completely. Figure 34 shows
such a feature on the surface of cable 2PS-283-D.

Cables 1-2PL-83-1085-B, 1-2RM-90-450-B, 1-2RM-90-448-B, 1-RM-452-B, and 1RM440A were found to contain a variety of shapes ofshort, sharp cuts in their jacket surfaces. These varied in lengthfrom approximately 0.080 in. to approximately 0.50 in. The cutswere found to have surface features indicative of the surfaces withwhich they had come into contact (i.e. rough edges) . Thoughexamined carefully, the edges of the cuts contained no embeddedmaterials that might have been analyzed to determine their origin.Figure 35 is an example of a surface cut limited to the jacket ofcable I-2PL-83-1085-B. Cross-sections through the damaged areas ofthe coaxial cables listed in Table 9 were prepared so that theremaining wall thicknesses could be measured with the microscope.
Table 9Jacket Wall Thicknesses for Coaxial Cables
All Values In Mils
damaged wall non-damaged wallcable Tn tikm tcel-2RM-90-450-B 18 351-2RM-90-448-B 22 351-RM-452-B 28 351RM440A 30 35
The final group of cables from Table 8, cables 1M-591-B, 1-PM-506-D, and 1-2PM-203-4470-B were found to contain splits intheir jackets. Examination of the split surfaces indicated thatthese were caused by excessive, local tensile stresses. This mayhave resulted from sidewall tension caused by high frictionalcontact forces (pull-by) or bunching of the cables during secondarypull-by operations. Figures 36 and 37 show examples of splits inthe jackets of cables 1M-591-B and 1-PM-506-D, respectively.
The cables listed in Table 7 were found to contain surfacedamage that extended through the jacket into the underlying

insulation, without e'xposure of the conductors. Two of these,
cables 2PM-506-D, 1-3M-74-2451-B, and 2PM-871-D contained narrow
grooves cut into their surfaces. These were approximately 0.140
in. wide and varied in length from 0.50 in. to more than 1 in.
When compared to the grooves introduced during the pull-by
simulations with the parachute cord over the jacketing materials,
these grooves shared all observable features. Cable 1M-2450-B was
found to contain a shallow, smooth-edged cut into the insulation.
To determine the extent of this damage, a cross-section was
prepared through the damaged site, as shown in Figure 38. The
remaining insulation thickness at this site was 7.4 mils, out of a
nominal 30 mil thickness.
Of the cables listed in Table 6, cables 2PS-284-D, 2PM-516-D,
2PM-871-D, and 1-3M-74-2451-B were found to have deep, narrow
grooves in their surfaces, sharing virtually all features with
those produced in the pull-by simulations with the parachute cord
over the jacketing materials. Cable O-SP-285-529 was found to
contain a deep, sharp cut into its jacket surface, through the
insulation, with exposed the conductor strands. Figure 38 shows
one example of a sharp, long cut in the jacket of cable O-SP-285-
529. Cable 2PM-881-D was found to be highly twisted and distorted
with the jacket severely pulled back along the cable. This
apparently resulted from entanglement with other cables or pull
cord in the conduit.
Pull-By Simulation Results
The pull-by simulations produced a number of results that
provided background regarding possible surface damage mechanisms,
given the complement of cables and parachute cord provided. Pull-
by simulations of the combinations of cable jackets shown in Table
9 produced only a slight scuffing of the cable jackets. As
indicated under the stereomicroscope, no traces of material loss
were noted on either cable of the pairs shown in Table 10, as a
result of these simulations. The scuffing on the surfaces was so
slight that it defied photographic recording. The simulations of

parachute cord in combination with Hypalon® at a load of 75 lb.produced some damage and material loss on the jacket surface. At aload of 100 lb. the parachute cord cut a groove into the surface ofthe Hypalon® jacket. At a contact load of 150 lb., the Hypalon®jacket was cut completely through, exposing the underlying cablecomponents. The groove was measured to have a width ofapproximately 0.14 in. The edges of the groove were found to besmooth, with no elongated "stringers" of material evident at theedges.
The surface of the CPE jacket was severely damaged by theparachute cord during the pull-by simulations with a contact loadof 75 lb. This produced a narrow groove that nearly penetrated thejacket thickness. With a load of 100 lb., the jacket was fullypenetrated by the parachute cord, as shown in Figure 39. Thegroove was measured and found to have a width of approximately 0.13in. The edges of the groove were found to be smooth, with a greatdeal of feathering at the edges with "stringers" present. Thelatter term is used to describe the strings of elongated jacketmaterial extending past the end of the groove cut by the parachutecord. These result from plastic flow of the polymer, caused byhigh contact forces and high temperature produced by interfacial
friction.
Table 10Combinations of Cable Jackets and Parachute Cord Used In Pull-By
Simulations
* chlorinated polyethylene vs. chlorinated polyethylene (CPE)* Hypalon® vs.Hypalon®
* chlorinated polyethylene vs. Hypalon®
* chlorinated polyethylene vs. parachute cord
* Hypalon® vs. parachute cord

Tensile Testing Results
Tensile testing of ýi 2 conductor, #12 AWG cable (AIW contract2PS5281D) was conducted and it was determined that a force of 135pounds was required to break a single conductor with its insulationintact. Efforts to test the entire cable construction failed dueto excessive slippage of the jacket over the conductors. -Theparachute cord was found to require an average of 335 lb. to break.
Analysis of Swollen Areas of Jackets
.Gas chromatography/mass spectroscopy analysis of the jacketof cable 2V-2846-B, which contained visibly swollen areas, wasconducted to identify the swelling agent (s). Figure 41 is the gaschromatogram of the swollen area of cable 2V-2846-B. The arrowindicates the only peak that did not appear when the non-swollen
area of this jacket was similarly analyzed. Figure 42 shows themass spectrum for the compound with a retention time of 15.9minutes (indicated by the arrow in Figure 41). This mass spectrumwas insufficient for a complete identification of the compoundpresent, though some of its characteristics are similar to aglycol-containing compound. Figure 43 is the gas chromatogram forthe non-swollen area of the jacket of cable X9. Figure 44 is the
corresponding chromatogram for the swollen area. Again, a smalldifference is noted at approximately the same place as for cable2V-2846-B. A complete analysis of this compound was not possible,
due to its low concentration.
D IS CUSS IONLimitations- of Surface Chemical Analyses
One complication in making a more definite determination of
the cause of damage to the cable jackets is that they were cleanedsubsequent to their remnoval from the conduits. The cleaningprocess could have removed traces of pulling rope in the damaged
areas of the jackets, for example. Similarly, residues of the

"Yellow 77"1 or other pulling compounds could also have been
removed from the cable jackets and from the concrete anchor.
FlexibIP Conduit_
Though a significant amount of damage occurred to
instrumentation cables located at the flexible- conduit, as
determined by TVA, little evidence for this was present in the
form of transferred jacket material or jacket debris. The inner
surface of the conduit is heavily corrugated, though it does not
have a very sharp surface. Any debris produced by friction with
the cable jackets may have been washed away when the conduit was
flood..ed with pulling compound for purposes of removing the cables
for inspection. The outer and inner surfaces of the bend in the
conduit did exhibit some degree of surface polishing, indicating
that the cables did preferentially contact these su rfaces. A
simple hand rubbing of a CPE and a Hypalong jacket over the
surface of the conduit only produced a slight scuffing of either
jacket, with no material transferred to the conduit. The only
sharp area noted in the conduit was at the transition point shown-
in Figure 17.
Pull-By Simulations
The pull-by simulation used in this study did not seek to
fully duplicate those conditions found in the conduit system at
Watts Bar, where the cables had been installed. This task can
only be duplicated if the geometry, materials, pulling forces, and
pulling speeds, and cable combinations could be precisely
duplicated. The pull-by simulations used in the present work only
sought to determine the nature of localized damaged to a given
cable jacket when various other objects were dragged over its
surface under conditions of known contact speed and force. As the
conditions at WBN could not be duplicated precisely, specific load
values cited in this report may not be directly comparable to
actual pulling tensions. The forces used for the pull-by
simulations were those assumed to be possible from a worker acting
alone.

Copper Oxidation
.;The conditions under which thle conductors of cable 2PM-516-Doxidized at the WBN site cannot be duplicated in the laboratorywithout precise knowledge of the thermal and chemical history towhich it was exposed. The conditions used in the experiment to
determine the rate of copper oxidation only sought to bracket thereasonable time frame during which the observed oxidation couldhave taken place. The key question regarded whether this hadoccurred either when the cable was installed or during pull-byoperations, or if it had occurred when the cable was removed. By
thermally aging the cable in its original jacket, the localchemistry was preserved to the best degree possible. Atemperature of 40*C was chosen following discussion with TVApersonnel about the conditions at the WBN facility, with a smallmargin allowed for acceleration of the oxidation process.
Jacket Swelling
GC/MS analyses of the. swollen areas of the jacket of cable2V-2846-B failed to disclose the causative agent. Insufficientmaterial was removable from the cable jacket to allow a preciseidentification. This may be due to several possibilities. Theagent that caused the jackets to swell could have been lostthrough evaporation during handling and storage. The compound
could have reacted with the cable jacket material in such afashion that volatiles were not obtained at the samplingtemperature used. It is also possible that a different columncould be more effective in separating the compounds, with improvedsensitivity, but this option was not explored. In the final run,no such swelling was noted at any location on any of the damagedcables removed from the Watts Bar plant. It is clear that theagent that caused the swelling also significantly degraded thehardness of the corresponding jackets, as shown in Table 5.Precautions should be taken to avoid contact with any agents that
cause swelling of these jackets as this, and the associatedsoftening, would significantly degrade their physical properties.

27
Jacket Inclusions
Dissection of the jackets of cables 2PS-284-D and 1-2PM-3-
3990A revealed that they contained inclusions of harder material.
This is not an uncommon occurrence in cable jackets and often
results from either of two sources. The first is that the carbon
black used in these materials may contains large "grits" of carbon
or mineral-rich carbon inclusions. These can occasionally escape
the filtering or screening processes. While a compound is being
extruded, such as a jacket on a cable, there is a chance that a
small amount of compound may be caught at the edge of the die and
retained so long that it oxidizes. The material then becomes hard
and may break free to become incorporated into the cable jacket.
These are often referred to as "retains". Inclusions of this type
cannot result from external heating of the"cable jacket. In the
latter case, the jacket material would be hottest at its outer
surface, where the most charring would occur. In the case of the
inclusions noted in the two cables in question, the jacket
material surrounding the particles was in good condition, without
any apparent thermal damage.
Jacket Surface Damage
The instrumentation cables were found to contain a number of
types of surface damage, as discussed in the preceding section.
While it is fairly certain, based on geometrical considerations,
pull-by simulation results, and materials considerations, that
much of this damage occurred as a result of the parachute cord
being pulled past cables during secondary pull-in operations, a
number of cables exhibited discrete sites of sharp physical
damage. In the absence of any retained material, such as sand
grains, metal debris, or other materials-that might reflect the
source of these mechanically-produced marks, an absolute
determination of how they occurred is not possible. The concrete
anchor found in one of the conduits associated with the cables
listed in Table 1 could have caused damage similar to that
AIM observed on a number of cables.

CONCLUSIONS
Pulling Compound
The pulling compounds were chemically analyzed and found to
contain distinctive residues that would have enabledidentification had any of their residues been found on the cablesor concrete anchor removed from the conduits in question.
Concrete Anchor
The concrete anchor was found to contain no identifiable
surface residues that would attest to the time in which it wasplaced into the conduit in which it was found. The anchor wasfound to contain sharp corners that could possible have inflictedsurface damage to some of the cables, in the manner observed.
Repair Sleeve
The suspected repair splice, 1-2PS-68-283-D was verified assuch. This was applied to cover a cut that was limited to thejacket of this cable. Inspection of the cable following removalof the repair sleeve showed that no damage had been done to theprimary insulation or conductors of this cable.
Surface "Bumps" and "Bulges"
The "bumps" on the surfaces of cables 2PM-4781-D, 2PM-1694-D,
2PM-1041-D (2 locations), 2PS-284-D, and 1-2PM-3-3990A, were not
the result of splices in the conductors. In cables 2PM-4781-D,2PM-1694-D, and 2PM-1041-D this resulted from splices in theassembly tapes. In cables 2PS-284-D and l-2PM-3-3990A this
resulted from inclusions of large particles of what appears to becarbon or charred rubber. In no cases did any of the surfaceirregularities result from externally applied heat.
Surface Damaae
The cables listed in Tables 6, 7, and 8 were found to havebeen damaged in a manner consistent with pull-by damage, resultingfrom contact with a parachute cord, as supplied by TVA. Inaddition, others of the cables were damaged following contact with

sharp edges, as evidenced by the details of their damagedsurfaces. The causative .urfaces could not be deductively
identified.
Flexible Conduit
The interior of the flexible conduit was inspected and found
to contain no evidence of any cable jacket materials. The inner
surface was found to be free of any sharp edges except at a
transition coupling at one end.
Tensile Properties of One Cable and A Parachute Cord
It was determined that a load of 335 lb. was required tobreak the parachute cord provided by TVA. The 2-conductor #12 AWGcable manufactured by AIW (contract 79K5-825342-2) was found tohave a breaking point of 135 lb., for a single insulated
conductor. Roughly doubled, and allowing some additional load for
the tensile strength of the overlying jacket, it appears possiblethat the parachute cord could sustain a load adequate to break a
2-conductor #12 wire, as provided.
Abandoned Cable
The 2-conductor #12 AWG cable (2PS281D) manufactured by AIWand found abandoned in a conduit, had broken due to a tensile
overload.
Conductor Oxidation
Thermal Aging of the conductors from cable 2PM-516-Dindicated that the oxidation found on the damaged section of thiscable most likely occurred while the cable was installed in theconduit and did not occur after the cable was removed for
inspection.
Jacket Swelling
The jackets of two cables, X9 and 2V-2846-B, were swollen byby a chemical compound that could be detected but not identified.The compound caused considerable swelling and softening of the

jacket materials. Swelling was'pot caused by the insecticideprovided, as originally suspected by TVA.
REFERENCES[1] The Aldrich Library of Infrared Spectra, Edition 3, The
Aldrich Chemical Company, 1981.
[2] The Infrared Spectra Atlas of Polymers and Additives, Volumes
1, 2, and 3, Sadtler Research Laboratories, 1987.
[3] The Particle Atlas, Vol 2, W.C. McCrone, editor, Ann Arbor
Science Publishers, 1976.[4] An Atlas of Polymer Damage, Lothar, Klingele, et al, editors,
Prentice-Hall, 1981.
[5] The Metals Handbook. Ninth Edition.Volume 12 (Fractography),
American Society for Materials, 1987.

Figure 1Shipping Containers with Cables Listed In Table 1

/ i7 ,
Figure 2Flexible Conduit Strapped To Plywood Support In
Order To Maintain Original Conformation

Figure 3Cables from Conduit MC 400B, As Removed* from Shipping Container

mc 4/00,3Figure 4
Damaged Sites On Cables from Conduit MC400B, Showing Protective Wrapping Applied
by TVA Prior To Shipment

Figure 5Visual Examination of Damaged Sites Removedfrom Instrumentation Cables Listed In Table 1
': -v- - - - - _75

Figure 6Detailed Examination of Damaged Site Using
Stereomicroscope

c- 3C., 2 CD
co 0~ 0
= _0 0 00c CD a.

Figure 8Pull-By Simulation In Progress- Parachute Cord
Contacting 2-Conductor Cable

PERATOwfkIA
iMN
*LTEA TIME
SMOOTHING
A REMARKS
3.0
iS3.
DATE V1111 //fshl
SCAN REMODE
3.5MICROMETEF
4.0JIJffiLIIWL~L I I - l I I I I I I £ £ II I I S S SS irISES ,iiiiiiiii'iti
I
/I
/
NGLE S
PETITIVE El S
CUMULATIVE El]kTH F-] C
i s (M) • e 9
JANOMETRICS (U)PECTRUM NO. U c1-4o-r'AMPLE -A/,,. _
)RIGIN
10 11 12 13 14 16 18 20I 1 1 . I I . .
Figure 9Infrared Spectrum of Fibrous Portion of "Yellow 77"
Pulling Compound
1800 100FREQUENCY (CM-
A AAA A. . . I I-
1400 1200 1000 800 600 400
FORM 9999-0013
360u 3200 2800 2400 2000
AC
MI
P P I , . % I I i j I I I I I a I
1 1. -A A A A a A I I I A I A- 1... 1.
I I m M M J a M I J I A &
. . . . . . . v . . . . . . . . . . . . . . . . . . . V . . . .

OPERA /
GAINW
FILTER TIME
SMOOTHING
REMARKS '
2.5
DATE _
MICRO3.0 3.5 4.0 5
I I a a a a a a a a a a a I a a a a i a I I i a1111 gull -"I 1 - - - -,- -", ,,,, ,. . .". . . . ..; , ' 1, " , 0 , ,, -, - -. ' . ; , '
SINGLE
REPETITIVE
ACCUMULATIVE
MATH
METERS (uM)6 7
ElE]0!
NANOMETRICS
SPECTRUM NO.
SAMPLE
ORIGIN
8 9 10 11 12 13 14 16 18 20I i | 1 i 1 i 1 1 1 1 1 1 A I I I I I I I I
Figure 10Infrared Spectrum of "Polywater J"
1800 1600FREQUENCY (CM ')
1400 1200 1000 800 600 400
FORM 9920.aa
4000 3600 3200 2800 2400 2000
SCANMODE
. . . . . . . . . . . . . . . . . . . . . . . . . . . . . . .I. .
: . . . . . .. . . . . . . .. . . . . . . . . . . .. . . . . . • .. . . . . . . = . . . .
' • ' • ' • ' w I l I I I I I 1 I
B
•1 i i i. . I

OPERA
GAIN
FILTER TIME
SMOOTHING
REMARKS
DATE __ __/
* NGLE 1
SCAN REPETITIVE F-]MODE ACCUMULATIVE ---
MATH F-]
NANOMETRICS()SPECTRUM NO.
SAMPLE £o/• r , _ _
ORIGIN
3.0 3.5 4.0I t I I i i I I I i I i i I
MICROMETERS &M)5 6 7 8 9 10 11 12 13 14 16 18 20
I I ~ I I I l I I I I I I I I I I I I I I I I
_1 !Iz
z-i a l
1800 1600FREOUENCY(CM-1)
1400 1200 1000 800 600 400
FORM 9999-O01Iw,W
I I
Figure 11Infrared Spectrum of "Polywater G"
4000 3600 3200 2800 2400 2000
. . . . .1i I i i 1 i i I- 1 1 --I - 1 -- 1 1 1- 1 1i 1- : . _ _ _ 1 1 1 1, 1 r ," , -1' 1-1 . .I ", 1', '1 1' '. ; . ," , , , . I " , R It , , . , .. ý .,.I ' ;* ' I .,. I . ,I I I

OPERATOR1"• /0,1, -3kI ,'
GAIN - ..
FILTER TIME
SMOOTHING
REMARKS
!.5 3.0 3.5 4.0
DATE -911
SCAN
MODE
5
REPETITIVE
ACCUMULATIVE
MATH
MICROMETERS (M)6 7
E-]
EI
NANOMETRICS®ý
SPECTRUM NO.
SAMPLE c____ J-/-. c~o-
ORIGIN-_
8 9 10 11 12 13 14 16 18 20 25
1800 1600FREQUENCY CM •
1400 1200 600 400
FORM 9999 0013
4000 3600 3200 2800 2400 2000 1000

18,111-0Nylon 6 (poly(caprolactam)]
PelletsWAVENUMBER CM'
700 650 625
Imilam= 100
5 6 7 8 9 10 II 12 13 14 15 16WAVELENGTH IN MICRONS
Figure 13Infrared Spectrum from Reference [1] for
I Nylon 6

I IbERATOJ
IAIN
4iFILTER TIME
£SMOOTHINGlREMARKS
AI.sI'r . ! . . . .' .
DATE - '1
SCANMODE
MICROMETERS (pM)3.0 3.5 4.0 5 6 7
I I I I I a I I I I I I a a a I a a a a a a I
NANOMETRICS
SPECTRUM NO. _e
SAMPLE Re
ORIGIN
8 9 10 11 12 13 14 16 18 20a I a a nI i a I a a a i i I I i i i i
. I I . . I I I I I I I I I ' u In I * I I I I I I I I I I I I I I I I . , I I I I IJ1 I
3600 3200
iure 14rresponding To Pull Rope:iber
FigInfrared Spectrum Co.
F
7A A A
Kria II•,,--A--a fl5aa aa•a•aA alaaa aAIf Ia IIA l . I Il I A II A Iý . I- L LL
2800 2400 2000 1800 1600FREOUENCY (CM -')
1400 1200 1000 800
FORM 9999-0013
600
INGLE
REPETITIVE 1-I
ACCUMULATIVE ElMATH E-1
- ---- - - - - - - - --.. . . . . . -" - - - -w l I . .IIIIIWlllllllllllllllllfl-Jl
. l*

-nCDXc°
C0oO00
0o20 = Cr
co
00 3110
C/) =c CL
CDD1)

Figure 16Flexible Conduit Construction with Sleeve
Shown Above

- ~ -I. V
Figure 17Residue (Not Cable Jacket Material) At Transition
Point At Felxible Conduit End

S
Figure 18Cable Repair Sleeve 1-2PS-68-283-D Shown In
Its As-Received Condition
2 ZZýr
/ P,ýr - 7402 L2
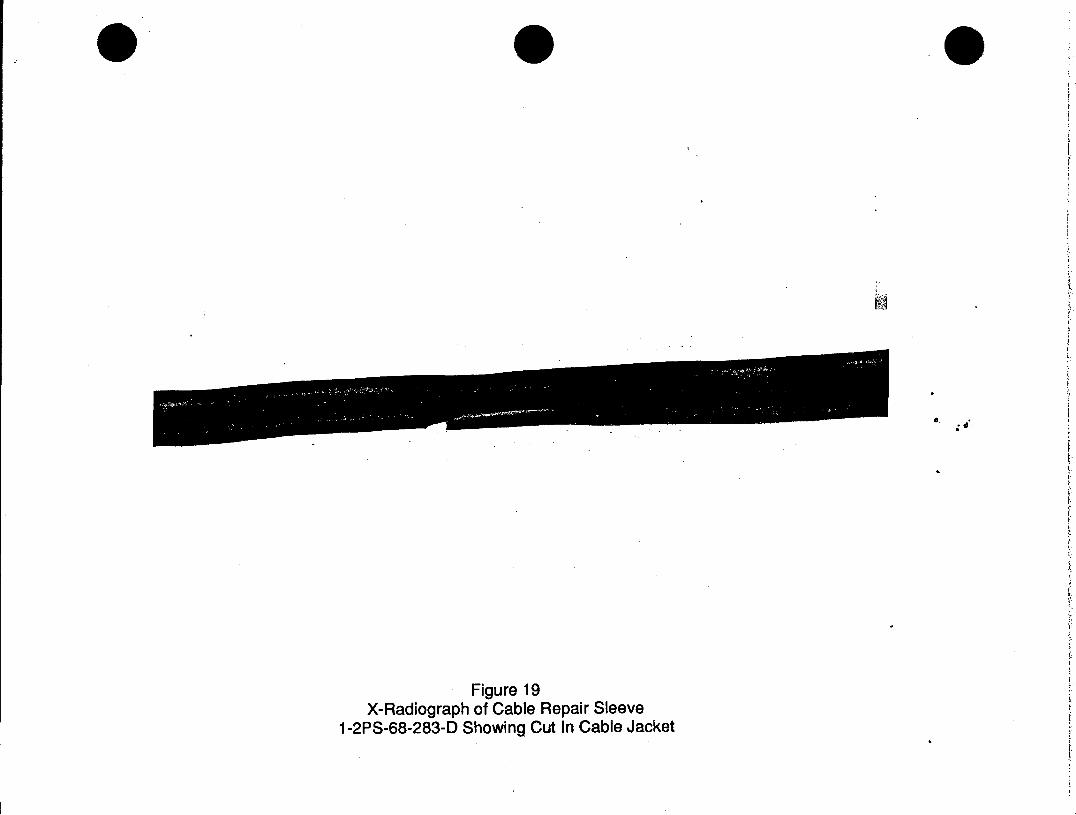
Figure 19X-Radiograph of Cable Repair Sleeve
1-2PS-68-283-D Showing Cut In Cable Jacket

/ -2 P56 M26CL9Vv/ r-
P5
Figure 20Cut In Cable Jacket Under Repair Sleeve
1-2PS-68-283-D. Elastomeric Resin Shown In Cut
/
"0-bo
e74 an -2)0-0, 4ZIP to

Figure 21Cable Components Under Jacket Cut Repaired
with Sleeve 1-2PS-68-283-D

/.. ., I/ (/77- 2)6 4
Figure 22"Bump" On Outer Surface of Cable
1-2PM-3-3990A
- S.
-. 9
A ,"4
.. /1
Figure 23A "Bulge" On Surface of Cable 1-2PM-3-3990A
'I'9",
r/1

Figure 24X-radiograph of "Bump" On Surface of Cable
1-2PM-3-3990A. Location Corresponds to thatShown In Figure 22

Figure 25X-radiograph of "Bulge" On Surface of Cable
1-2PM-3-3990A. Location Corresponds to thatShown In Figure 23

)
7) ,.. ~ 7
'~ -I-
'7
Figure 26Cross-Section Through "Bump" On Surface of
Jacket, Cable 1-2PM-3-3990A. Note SmallParticle Embedded In Jacket
'I, I??

Figure 27"Bulge" On Jacket of Cable 2-PM-4781 -D
(below) and Corresponding Splice In AssemblyWrap, Sewn with Black Thread

Figure 28"Bulge" On Surface of Cable 2PM-1694-D
(bottom) with Corresponding Splice In AssemlyWrap Shown Above
Q P/h, -/6 :::,' 0-3
Peryi /01L(/ D-I
Figure 29Representative "Bulge" On Surface of Cable2PM-1041-D (bottom) with Corresponding
Assembly Wrap Splice Shown Above
0. 4

7. ..
I
Figure 30Jacket Cross-Section Through "Bulge" On
Surface of Cable 2PM-1041-D
it/

Figure 31End of Cable 2PS281 D Abandoned In Conduit,
WBN Unit 2


97') ,-. 717'> [..'I
Figure 33Jacket of Cable 1 -PM-778-D Causedby Cut-Off Wheel ContactGroove In

Figure 34Damage To Surface of Cable 2PM-871 -D-1

) 4~. *1
V 7 1 '~14,
7!
Figure 35Sharp Cut Limited To Jacket of Cable
1-2PL-83-1085-B
• ,••i• •,. •! ,•. .••' , ,••;••• • • •• • '.• -'i•, , i• •: •••••. • • i~ ~ • • ,•,', •"Aw •• • •

6
.~ ~~~~ . , ~ ., r , . , .
I. . .. -.. .
Figure 36Split In Jacket of Cable 1 M-591 -B

Figure 37Split In Jacket of Cable 1 -PM-506-D

Figure 35Cross-Section Through Damaged Site of Cable
1 M-2450-B

Figure 39Sharp, Deep Cut. In Surface of CableO-SP-255-529 (Conductors Exposed)

V .~
JACorEr PVU.Z1 PhV4 z A 1-16 A(
Vt, 143
ti/ C(A/fl~IN Co2~
Figure 40Pull-By Simulation Damage To Surface of CPE
Jacket from Contact with Parachute Cord
12.
CPE
pozo-1.0

E L::TEFE2 •E35 TC Z : FEB
++ :FECT;RUIf DFL EDIT *+2H.4 MGM, 2V-2846-i15- C DEZPT
PC.:1411.~s'**=
Figure 41Gas Chromatogram of Swollen Area of CableJacket 2V-2846-B. Peak Indicated Was Not
Found In Non-Swollen Area

•- -4-... =-.• l e l 5 1 7 . 5 1 7 64 , , 3 ._ a- 4 : :-. . 2 . 84 @ 2 .' 387.4,, 2.6 391.8. 2. 6
EE
2 4Z
40
0 ' 46 83 772
Figure 42Mass Spectrum Corresponding To GC Peak At
15.9 Minutes, Shown In Figure 41, for CableJacket 2V-2846-B
.

.-. D FQ''E~iT rpm SOND@2
.... .. .. . IST SC PT G:134S_F FC m- I IN HOLD = .2 = 4 .00
Lmo
TII I 1' I I
Figure 43Gas Chromatogram of Non-Swollen Area of
Cable Jacket X-947
V
?1

"• Z E Z L ." -L Q Y -E D IT r p m S @ 5 2 8-- - D EG C F "IN Ic1T SC/PG:1345
F , ,IN HOLD .25 Y= 4.00
TI T! ' I '
Figure 43Gas Chromatogram of Non-Swollen Area of
Cable Jacket X-9I,;

*+ ;ECTFUlf DISPLPYI-EDIT rpm• 5029RED QFEQ 97 MG!•S Ise DE(G C S MINS IST SC/PG:I'331is X= .25 Y= 2.00
I A I 1 1 .2 '
Figure 44Gas Chromatogram of Swollen Area of Cable
Jacket X-9, Showing Unique Peak At 15.6 MinuteRetention Time

INSTITUTE OF MATERIALS SCIENCE
The Institute of Materials Science (IMS) wasestablished at The University of Connecticut in 1966 inorder to promote academic research programs inmaterials science. To provide requisite researchlaboratories and equipment, the State of Connecticuthas provided $6,000,000, which has been augmented byover $7,500,000 in federal grants. To operate the In-stitute, the State Legislature appropriates over$1,200,000 annually for faculty and staff salaries, sup-plies and commodities, and supporting facilities such asan electronics shop, instrument shop, a reading room,etc. This core funding has enabled IMS to attract over$5,500,000 annually in direct grants from federal agen-cies and industrial sponsors.
IMS fosters interdisciplinary research programs invarious areas of materials science with special emphasison adhesion, composites, corrosion, electrical insula-tion, interfaces, liquid crystals, metals, and polymers.These programs are directed toward training graduatestudents while advancing the frontiers of knowledge andmeeting current and long-range needs of our state andour nation.

ATTACHMENT 2
An Evaluation of
Cable Damage Susceptibility
from Pullby Events at the
Watts Bar Nuclear Plant
(PLG-0744, Revision 1)
1028g