Embed Size (px)
Citation preview
Giocoli et al., accepted manuscript, Annals of Geophysics, December 2007 1
ELECTRICAL RESISTIVITY TOMOGRAPHY INVESTIGATIONS IN THE UFITA VALLEY (SOUTHERN ITALY)
Giocoli A. 1, Magrì C. 2, Vannoli P.3, Piscitelli S. 1, Rizzo E. 1, Siniscalchi A. 2, Burrato P.4, Basso C. 5, Di Nocera S.5 1IMAA-CNR, Institute of Methodologies for Environmental Analysis (IMAA-CNR), Tito Scalo (PZ), Italy 2Dipartimento di Geologia e Geofisica, Università di Bari, Bari, Italy 3Istituto Nazionale di Geofisica e Vulcanologia, Centro per la Sismologia e l'Ingegneria Sismica, Grottaminarda, Italy 4Istituto Nazionale di Geofisica e Vulcanologia, Roma, Italy 5Dipartimento di Scienze della Terra, Università degli Studi Federico II, Napoli, Italy
Giocoli et al., accepted manuscript, Annals of Geophysics, December 2007 2
Abstract Several Electrical Resistivity Tomography (ERT) surveys have been carried out to study
the subsurface structural and sedimentary settings of the upper Ufita River valley, and to evaluate their efficiency to distinguish the geological boundary between shallow Quaternary sedimentary deposits and clayey bedrock characterized by moderate resistivity contrast.
Five shallow ERTs were carried out across a morphological scarp running at the foot of the northeastern slope of the valley. This valley shoulder is characterized by a set of triangular facets, that some authors associated to the presence of a SW-dipping normal fault. The geological studies allow us to interpret the shallow ERTs results obtaining a resistivity range for each Quaternary sedimentary deposit. The tomographies showed the geometrical relationships of alluvial and slope deposits, having a maximum thickness of 30-40 m, and the morphology of the bedrock.
The resistivity range obtained for each sedimentary body has been used for calibrating the tomographic results of one 3560m-long deep ERT carried out across the deeper part of the intramountain depression with an investigation depth of about 170 m. The deep resistivity result highlighted the complex alluvial setting, characterized by alternating fine grained lacustrine deposits and coarser gravelly fluvial sediments.
Key words: Shallow ERT, Deep ERT, Ufita River valley, Southern Italy.
Giocoli et al., accepted manuscript, Annals of Geophysics, December 2007 3
1. Introduction The Electrical Resistivity Tomography (ERT) is a geoelectrical method widely applied to
obtain 2D and 3D high-resolution images of the resistivity subsurface patterns and it was applied to solve a wide class of geological problems: to determine the position of active faults and quantify displacements in Quaternary formations before performing trenching paleoseismological studies (e.g. Storz et al., 2000; Suzuki et al., 2000; Demanet et al., 2001; Caputo et al., 2003; Nguyen et al., 2003; Wise et al., 2003; Nguyen et al., 2005; Galli et al., 2006); to infer some characteristics of the fault zones, such as the presence of fluids, and to estimate the width of the damage zone (Diaferia et al., 2006); for the delineation of the structural settings of geological sedimentary basin (Rizzo et al., 2004) and volcanic areas (Di Maio et al., 1998, Finizola et al., 2006).
Several Electrical Resistivity Tomography (ERT) surveys were acquired to study the shallow subsurface structural and sedimentary settings of the upper Ufita River valley.
The Ufita river valley is located in Irpinia, in the axial zone of the southern Apennines of Italy (Fig. 1). The Irpinia region is one of the most active seismic area with the highest seismic moment release in Italy, having experienced in historical and instrumental times several destructive earthquakes with Imax=IX MCS. The Ufita River valley is located NW of the epicentral region of the M 6.9, 1980 Irpinia earthquake, and it was the epicentral area of the M 6.6, 1732 earthquake (Working Group CPTI, 2004).
In the upper Ufita Valley, five shallow ERT with Wenner-Schlumberger arrays were carried out to study the geometries of the Quaternary alluvial and colluvial bodies across a small morphological scarp, located at the foot of low dipping triangular facets, on the northeastern valley slope (Figs. 1 and 2).
The shape, geometry, and thickness changes of the deposits, across and near the scarp, were reconstructed with the aim of interpreting it either as a tectonic (i.e. fault scarp) or as a morphological feature (i.e. back-edge of a fluvial terrace).
Besides, one 3560m-long, deep ERT profile, joining 11 roll-along profiles using Wenner arrays, was carried out across the valley (Fig. 2c), and around 5000 resistivity data were collected. This tomographic section crossed the deeper part of the intramountain depression, with an investigation depth of about 170 m, and was aimed to study the geometry and maximum thickness of the sedimentary deposits in front of the scarp.
2. Geological and geomorphological setting The study area falls in the Irpinia-Daunia sector located in the eastern margin of the
southern Apennines (Fig. 1). The intramountain morphological depression of the upper Ufita River valley separates two areas characterized by different tectonic and geological units deformed and thrusted towards east starting from Middle Miocene (Basso et al., 2002; Di Nocera et al., 2006) (Fig. 1). The southwestern valley shoulder is composed of tectonostratigraphic units originally belonging to the Lagonegro-Molise basinal domain. Two units can be distinguished: 1- the Fortore Unit (Pescatore et al., 2000), composed of basinal facies ranging in age from Late Cretaceous to Langhian; and 2- the Frigento Unit (Di Nocera et al., 2002) composed of basinal and shelf margin facies, ranging from Middle Triassic to Middle Miocene, and overthrusting the Fortore Unit (for a detailed description of the two units see Di Nocera et al., 2006). To the first unit belong the Lower Cretaceous “Flysch galestrino” and the Upper Cretaceous-Burdigalian “Flysch rosso” formations outcropping along the southwestern Ufita valley side, that are composed of cherty claystone, fine grained calcarenites and marls, and by massive clastic limestones, and pelagic calcarenites and marls (Di Nocera et al., 2006).
Giocoli et al., accepted manuscript, Annals of Geophysics, December 2007 4
Conversely, the Baronia ridge forming the northeastern valley shoulder (Fig. 1), is made up of synorogenic Mio-Pliocene units deposited in wedge-top basins, separated by angular unconformities from the older rocks (Basso et al., 2002; Di Nocera et al., 2006). The northern sector of the ridge is characterized by the outcrop of the Upper Messinian “Altavilla supersynthem”, composed of fluvio-lacustrine conglomerates and clays, and of claystones to sandstones turbiditic deposits. In central-southern sector there are outcrops of the Lower Pliocene “Baronia synthem”, which shows a complete regressive sequence from near-shore to continental deposits, with at the base a thick sandy-conglomeratic continental deposit (Di Nocera et al., 2006).
Finally, the valley is filled with a Quaternary fluvial and lacustrine deposits of variable thickness interfingered along the margins with slope deposits and, especially along the eastern side, with coarse sediments deposited by the right tributaries of the Ufita river in alluvial fans of various size (Figs. 1 and 2d). These are composed of a variable thickness of coarse grained loose deposits, originated from the Pliocene sands and gravels of the “Baronia synthem”.
The thickness of the recent alluvial deposits varies from a few meters along the upstream section of the Ufita River (A-B in Fig. 1), where, the river flows directly on the pre-Quaternary bedrock, to a maximum thickness of about 150 m (Basso et al., 1996) downstream point B (in Fig.1). This reach is a small basin, about 4 km wide and 5 km long, filled by a sequence of alluvial and lacustrine-palustrine deposits.
Different orders of fluvial terraces are present on both sides of the valley, but only the younger orders are well preserved. Few remnants of older and higher paleosurfaces are perched along the southwestern slope of the valley, while wider paleosurfaces are located on the Baronia, norteastern side of the valley. Along this side, a set of triangular facets have been recognised along a distance of more than 10 km (Fig. 2). These 100-m-high facets are developed on the Lower Pliocene soft rocks, are very gently inclined (less than 10°), and were considered as the surface expression of a NW-SE striking, SW-dipping active normal fault (Brancaccio et al., 1981; 1984; Basso et al., 1996).
This fault was assumed to be 22 km long with a vertical slip rate of 0.2 mm/yr since the last glacial maximum (Cinque et al., 2000). It was also hypothesised to be the seismogenic source of the 1732 earthquake (Meletti et al., 2000). But other studies are in disagreement with this identification of the fault (Valensise and Pantosti, 2001; DISS Working Group, 2006). The scarplet that was explored during this work is found at the foot of the triangular facets, reaches a maximum height of about 2 m, and dissects both bedrock and recent alluvial and colluvial sediments (Fig. 2a).
3. Electrical Resistivity Tomography (ERT) The Electrical Resistivity Tomography (ERT) is a 2D and 3D geophysical technique showing the resistivity ground variations along a cross section or volume. In the geoelectrical method a controlled current (I) is injected into the ground by two steel electrodes and the potential drop V is acquired between two other one. The apparent resistivity (?a) is determined as follows: ?a=K*V/I where K is a geometric factor defined by the electrode configurations on surface. During the geoelectrical survey a high resolution system (Syscal R2, Iris Instruments) has been used to acquire the data (?a). The apparent resistivity data are processed by the RES2DINV software (Loke, 2001) to obtain in real time tomographic subsurface images of the electrical resistivity pattern. The 2D inversion routine applies a Gauss-Newton least squares method (Loke and Barker, 1996), based on the finite-difference model of the subsurface, automatically adjusted in an iterative process. The latest is obtained comparing between the measured apparent resistivities
Giocoli et al., accepted manuscript, Annals of Geophysics, December 2007 5
and the calculated apparent resistivities obtained from inverted resistivity model. The Root Mean Squared (RMS) error provides a measurement of this difference as an indicator of the goodness of fit. 3.1. Shallow ERT profiles
In this work the electrical resistivity tomography to study the geometry of the Quaternary alluvial and colluvial bodies across a morphological scarp running at the foot of the northeastern slope of the Ufita valley have been applied (Figs. 2a, 2b and 3).
A multielectrode system was used to obtain shallow ERTs, using a Wenner Schlumberger array with minimum electrode spacing of 5 m, along five electrical profiles (Piani, Renazzo I, Renazzo II, Isca Ciampone, Serritiella) arranged along NE-SW directions (Fig. 3). Piani and Isca Ciampone profiles crossed bedrock (mainly composed of clay) and alluvial fan deposits (gravel and sand in silt matrix), while Renazzo I/II and Serritiella profiles crossed bedrock and alluvial deposits (fine grained alluvium).
Due to the low-to-moderate resistivity contrasts characterizing the field data, the l2 norm was used for the inversion of the five collected data sets, being best suited to represent smooth discontinuities (Loke, 2001). The obtained resistivity sections are shown in Figs. 4 and 5.
In all cases the RMS error is less than 5%, and the resistivity range is between 3 and 90 ohm*m. Due to the good quality of the data (low RMS errors and high homogeneity of the area under investigation), one iteration was enough to reach the final inverse model which was also in agreement with the available geological information.
Correlating the surface lithologies with the five shallow ERTs results, a resistivity ranges to the bedrock (from 3 to 20 ohm*m), to the alluvial deposit (from 10 to 20 ohm*m) and to the alluvial fan (from 15 to 70 ohm*m) have been assigned.
Hereinafter a detailed description of the characteristics and of the features highlighted by the shallow ERT profiles was gave. Isca Ciampone and Piani ERT profiles
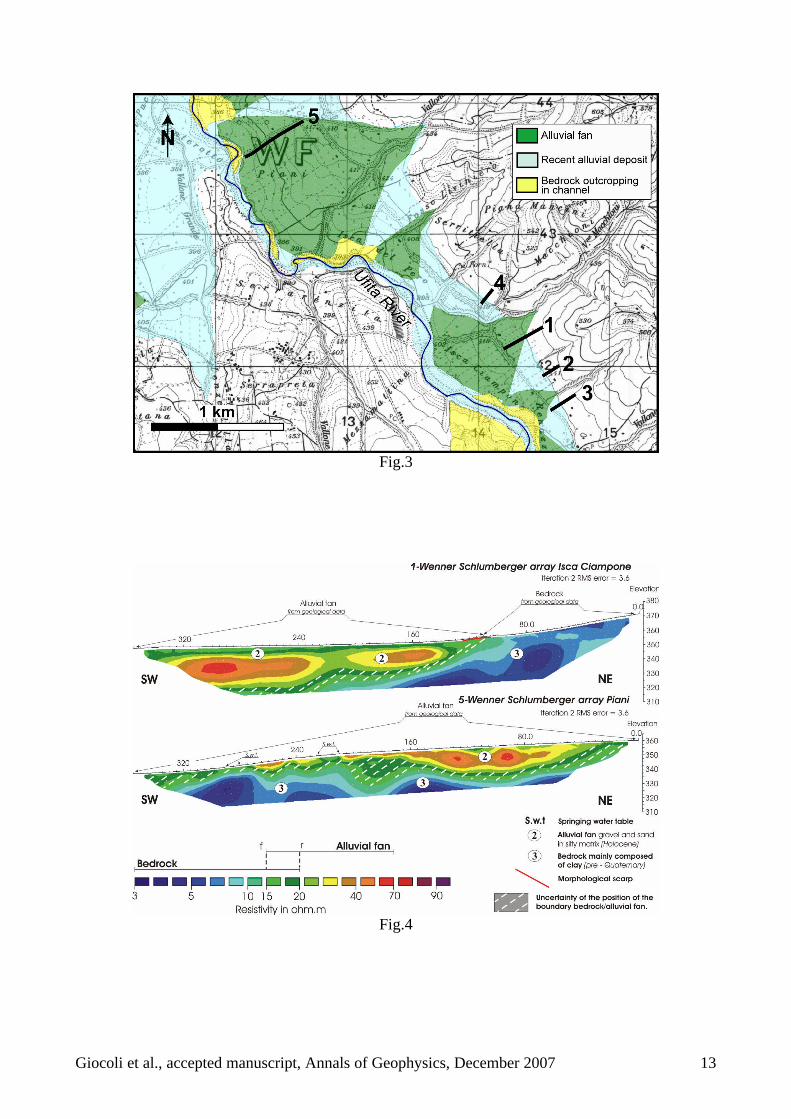
The Isca Ciampone and Piani profiles (nr. 1 and nr. 5 in Figs. 1 and 3) were used to characterize the geoelectrical signature of the alluvial fan deposits, and to constrain their geometry. The Isca Ciampone profile (1) is a 350 m long transect that crosses both outcropping bedrock and alluvial fan deposits (Figs. 2a, 2b and 3). Locally, the bedrock is composed of Lower Pliocene silty-marly clays and silty sands of the Baronia synthem. The Piani profile (5) crosses only alluvial fan sediments for a length of 350 m (Figs. 1 and 3). However, constrains to the depth of the bedrock are given by artificial outcrops, showing a very shallow bedrock overlained by thin sequence of alluvial fan sediments (Fig. 2d), and by the observation that the Ufita River flows directly on the Upper Cretaceous-Burdigalian “Flysch Rosso” formations of the Frigento unit about 100 m away from the southwestern end of the profile (see Fig. 3).
In the Isca Ciampone and Piani ERT profiles the resistivity values lower than 15 ohm*m (“f” limit in Fig. 4) were positively associated to the bedrock, while the resistivity values higher than 20 ohm*m (“r” limit) are related to the alluvial fan (Fig. 4). The resistivity values included between the “f” and “r” limits are common to the two rock types, and could be interpreted either as altered bedrock or as alluvial fan deposit. In the Isca Ciampone profile this could be due to the rather similar lithologies of the bedrock and of portion of the alluvial fan body (sourced from the Baronia synthem outcrops). Conversely, along the Piani profile, the low resistivity values of the coarse alluvial deposits could be explained by the presence of the shallow water table (s.w.t.) in figure 4. During the survey of the Piani
Giocoli et al., accepted manuscript, Annals of Geophysics, December 2007 6
profile, performed on July, we noticed springing groundwaters between 210-215 m, and 280-290 m (Fig. 4) along the profile.
Since we could not precisely locate the contact between the bedrock and the alluvial fan deposits, we were forced to represent with a diagonal pattern in Fig. 4 the uncertainity of its location.
The estimate thickness of the alluvial fans is extremely variable. In the Isca Ciampone profile (1) the alluvial fan deposits are more than 40 m thick bellow the ground surface towards the valley (Fig. 4). However, we know from detailed geological survey mapping that about 500 m more to the SW, the Ufita River flows on the bedrock (Fig. 3). Hence, we estimate that the thickness of the alluvial fan (laterally interfingered with the fluvial deposits of the Ufita River) can not be much higher. The morphological scarplet that is one of the target of this study (Fig. 2a) is located about 100 m from the eastern end of the Isca Ciampone profile (Fig. 4), and corresponds in the subsurface with the estimated contact between bedrock and recent sediments. However, these show a lenticular geometry and no thickening towards the scarp. In the Piani profile (5) the alluvial fan show a lenticular shape with the maximum thickness in the subsoil of about 30 m (Fig. 4). The bedrock rises towards the southwestern end of the profile, in agreement with field geological observations (e.g. Fig. 2d).
Renazzo I/II and Serritiella ERT profiles
The Renazzo I and II, and Serritiella profiles (3, 2 and 4, respectively in Figs. 1, 2 and 3) cross bedrock and alluvial deposits. The bedrock is composed of Lower Pliocene silty-marly clays and silty sands of the Baronia synthem (Fig. 1).
Along these profiles resistivity values lower than 10 ohm*m (“g” limit in Fig. 5) were positively associated to the bedrock, while alluvial deposits are characterized by resisitivity values ranging between 10 and 20 ohm*m (“r” limit in Fig. 5). However, from geological data we can associate outcrops of the bedrock also to resisitivity values ranging between 10 and 20 ohm*m (green colours in the left-hand sides of these three profiles of Fig. 5). Thus, also in this case there is an overlap of the two resistivity ranges, and we indicate the lower limit of the alluvial deposits with the uncertainty represented with the diagonal pattern. Moreover, we have noted one differentiation of the resistivities associated to the bedrock with higher resistivity values concentrated in shallow sectors of each ERT.
Also along these three profiles we did not observe thickening of the recent alluvial deposits towards the morphological scarp. 3.2. Deep ERT
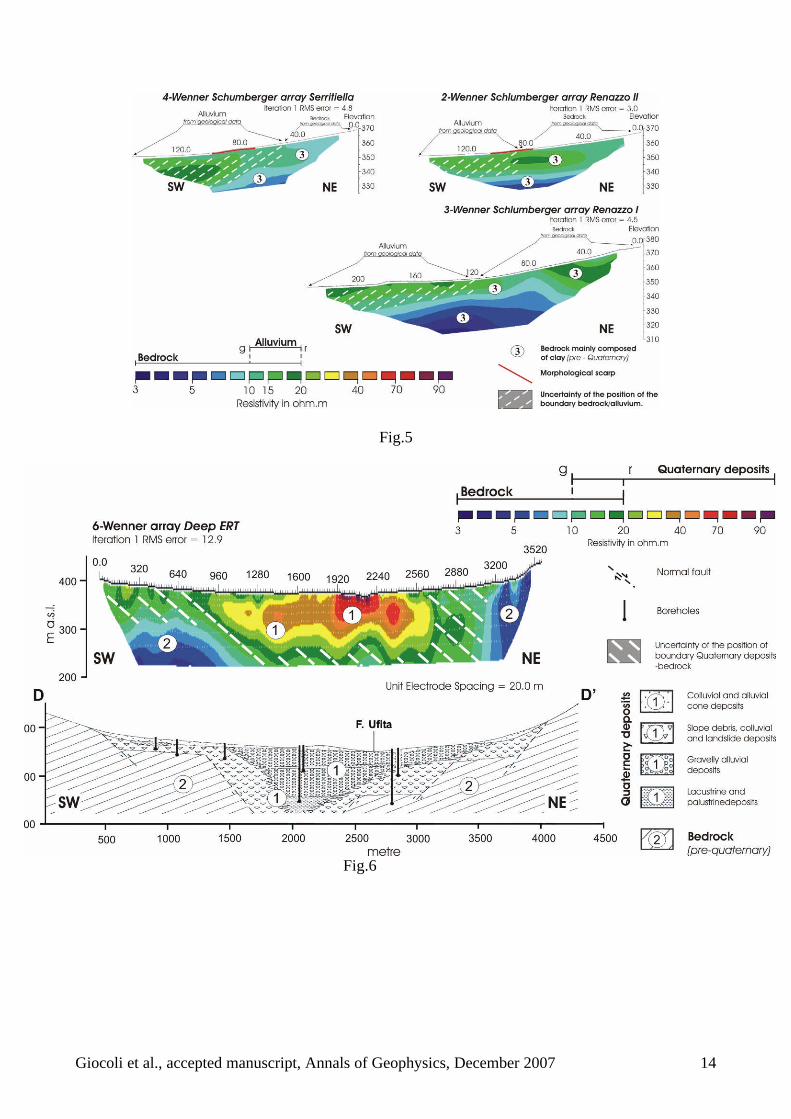
A 3560 m long deep ERT profile (179 electrodes) across the Ufita valley to explore the geometry of the deeper sector of the basin has been carried out (Figs.1 and 2c).The deep profile has been obtained joining 11 roll-along multielectrode acquisition (48 channels) system using Wenner arrays. The roll-allong technique allowed us to cover an extended area with a multichannel instrument characterized by limited number of channels with minimum electrode spacing of 20m and a maximum of 100m. After completing the sequence of measurements, the first part of the cable (12 unit electrode spacing) was moved at the end of the acquired profile. Therefore, an investigation depth of about 170 m has been reached. The tomographic section crossed the deeper part of the intramountain depression and about 5000 resistivity data were acquired. The analysis of the electrical model showed a variability of the resistivity values, from 3 to more than 90 ohm*m (Fig. 6).
The RMS error is about 12% after one iteration. The choice of the first iteration electrical resistivity result is due to the unchanged value of RMS error in the following iterations.
Giocoli et al., accepted manuscript, Annals of Geophysics, December 2007 7
Moreover, the electrical resistivity tomography coming from the first iteration is in agree with the geological section.
In this area, a geological section was constructed based on stratigraphies data obtained from hydro wells (Basso et al., 1996) showed the existence of a 150-m-thick sedimentary sequence (D-D’ profile in Figs. 1 and 6). To interpreting the deep ERT we associated to the bedrock the same range of resistivity values obtained in the shallow ERT profiles.
Conversely, the resistivity range of the quaternary deposits reaches higher values (>70 ohm*m) than in the shallow profiles. We interpret this difference as connected to the presence of gravelly fluvial sediments filling in the Ufita River channel. In our interpretation, the resistivity values lower than 10 ohm*m (“g” limit in Fig. 6) are related only to the bedrock, while the resistivity values higher than 20 ohm*m (“r” limit in Fig. 6) are associated only to the fluvial Quaternary deposits. Again, the resistivity values ranging between 10 and 20 ohm*m are pertaining to both rock types. NE of the Ufita River course the g-r resistivity zone is very wide, while SW of the river the g-r resistivity zone is thinner, constraining better the shape of the Quaternary deposits. Moreover, even considering the occurrence of the g-r resistivity zone, an asymmetric shape of the top of the conductive horizon, with the northeastern side steeper than the southwestern, was observed. The bottom of the sedimentary infilling of this small basin is localized at a depth from 150 to more than 170 m, close to the maximum investigation depth. Finally, a good agreement between the result of the deep ERT profile and the geological cross-section carried out by Basso et al. (1996), in terms both of thickness and geometry of the sedimentary body, especially where the geological cross-section was constrained by the boreholes data is obtained.
4. Discussion and conclusions The geological and geoelectrical results allow us to verify the efficiency of the ERT to locate the boundary between different geological bodies characterized by moderate resistivity contrasts. Several ERTs have been carried out in Ufita Valley to associate resistivity ranges to bedrock (3-20 ohm*m), to fine grained alluvium (10-20 ohm*m) and alluvial fan composed of gravel and sand in silty matrix (15-70 ohm*m). A resistivity range of uncertainty (10-20 ohm*m) was determined, compatible with all the considered rock types. It could correspond for the bedrock to a minor clay content, and/or to a lower water content, and for the alluvial fan to a finer grain dimension and/or higher water content (see e.g. Schon, 2004).
Satisfying results are obtained for Piani and Isca Ciamponi sites presenting sedimentary bodies well discriminated in the resistivity section (alluvial fan superposed onto the bedrock). The latest results highlighted a maximum thickness of the alluvial fan in the order of 30-40 m quickly diminishing in the two opposite directions. This observation is also constrained by surface geological data, indicating that the Ufita River flows on the pre-Quaternary bedrock close to the southwestern end of the ERT profiles. Thus, our data confirm that the sector A-B of the Ufita River valley (Fig. 1) is characterized by a shallow bedrock covered by a thin Quaternary alluvial/colluvial sequence.
Conversely, Serritiella, Renazzo I and Renazzo II sites present bedrock outcrops (known from geological survey) having resistivity values compatible with the alluvial resistivity. The silty-marly clays and silty sands of the Baronia bedrock could have, locally, a minor clay content. The geological contact between alluvial deposits superposed onto the bedrock has lower resolution.
Giocoli et al., accepted manuscript, Annals of Geophysics, December 2007 8
The association between each main resistivity range and the geological units was applied as a key lecture for the interpretation of the deep geoelectrical investigation. The subsurface geometry shown in the deep ERT profile highlights a complex evolution of this small basin. The recovered resistivity model across the Ufita Valley put in evidence a thickening of the Quaternary deposits, more than 150 m below the ground surface, toward the valley axial area. The southwestern bedrock horizon appears smoother than in the northeastern part. Moreover, the deep ERT profile shows a thick fluvio-lacustrine deposit slightly asymmetric towards NE (Fig. 6). Along this section the interpretation of the resistivity model has significant similarity with a geological section performed by Basso et al. (1996) along D-D’ profile of Fig. 1 based on some water-wells and surface geology.
The interpretation of the shallow ERT profiles allowed to make speculations about the origin of the triangular facets and of the scarplet. These features were interpreted as the surface expression of an active, SW-dipping, 22 km-long normal fault. From a geological point of view, a 22 km long normal fault would produce a pair of subsiding and uplifting areas of length comparable to the length of the fault itself. Moreover, using the average height of the triangular facets (about 100 m) as a proxy for the footwall vertical uplift, the related total subsidence should be in the order of about 3/400 m and the area that records at least 100 m of subsidence should be about 8 km wide. Following these observations, a deep depositional basin filled with lacustrine and fluvial sediments in the hanging-wall of the normal fault, and a wedge of recent deposits opening towards the fault itself were expected to be find.
None of these subsurface geometries were observed in the shallow ERT profiles (Figs. 4, 5). Moreover, the geological results of the deep ERT profile shows that the dimension of the associated basin (4 km wide and 5 km long) is not scaled to the size of the hypotesized fault (Fig. 1).
Following this observations, we speculate that the triangular facets and the scarplet at their foot may be geomorphic features generated by the linear erosion process of the longitudinal Ufita River and of its right tributaries. However, we can not exclude that at the beginning this 11 km long reach of the valley may have been controlled by a structural discontinuity.
Finally, the results of this work could also be safely used as a good background for any future geohazard and environmental investigations in the study area. Knowing the electrical properties of the subsurface from surficial geoelectrical measurements, the hydraulics parameters could be estimated in area where there are few hydrogeological direct data (Niwas et al., 2003; Soupios et al., 2007a). Moreover, the knowledge of the depth to the bedrock through the application of the geoelectrical methods, it proved that it is crucial in order to obtain a detailed estimation of the seismic site response analysis and earthquake mitigation (Mucciarelli and Gallipoli, 2001; Parolai et al., 2002; Soupios et al., 2007b). Finally, the identification of the tectonic regime of the area could be used to prevent the site from other correlated environmental problems such as, the movement of contaminants along the active fractures and pollution of the water table.
Giocoli et al., accepted manuscript, Annals of Geophysics, December 2007 9
References
BASSO, C., S. DI NOCERA, F. MATANO AND M. TORRE (1996): Alcune osservazioni di geologia del Quaternario nell’alta valle del Fiume Ufita (Appennino Irpino, Italia meridionale), Il Quaternario, 9 (1), 309-314.
BASSO, C., G. CIAMPO, S. CIARCIA, S. DI NOCERA, F. MATANO AND M. TORRE (2002): Geologia del settore Irpino-Dauno dell’Appennino meridionale: unità meso-cenozoiche e vincoli stratigrafici nell’evoluzione tettonica Mio-Pliocenica, Studi Geologici Camerti, Nuova Serie, 2, 7- 27.
BRANCACCIO, L., A. CINQUE, R. SCARPA AND I. SGROSSO (1981): Evoluzione neotettonica e sismicità in Penisola Sorrentina e in Baronia (Campania), Rend. Soc. Geol. It., 4, 145-149.
BRANCACCIO, L., T. PESCATORE, R. SCARPA AND I. SGROSSO (1984): Geologia regionale, in: Lineamenti di geologia regionale, Ricerche e Studi Formez, Napoli, 37, 4-45.
CAPUTO, R., S. PISCITELLI, A. OLIVETO, E. RIZZO AND V. LAPENNA (2003): The use of electrical resistivity tomographies in active tectonics: examples from the Tyrnavos Basin, Greece, Journal of Geodynamics, 36, 19-35.
CINQUE, A., A. ASCIONE AND C. CAIAZZO (2000): Distribuzione spazio-temporale e caratterizzazione della fagliazione quaternaria in Appennino meridionale, in: GALADINI, F., C. MELETTI AND A. REBEZ (EDS), Le ricerche del GNDT nel campo della pericolosità sismica (1996-1999), CNR-Gruppo Nazionale per la Difesa dai Terremoti – Roma, 2000, 203-218.
DEMANET, D., E. PIRARD, F. RENARDY AND D. JONGMANS (2001): Application and processing of geophysical images for mapping faults, Computers & Geosciences, 27, 1031-1037.
DIAFERIA I, M. BARCHI, M. LODDO, D. SCHIAVONE AND A. SINISCALCHI (2006): Detailed imaging of tectonic structures by multiscale earth resistivity tomographies: the Colfiorito normal faults (Central Italy), Geoph. Res. Letters, 33, L09305, doi:10.1029/2006GL025828.
DI MAIO, R., P. MAURIELLO, D. PATELLA, Z. PETRILLO, S. PISCITELLI AND A. SINISCALCHI (1998): Electric and electromagnetic outline of the Mount Somma-Vesuvius structural setting, J.Volcanol. Geotherm. Res., 82 (1-4), 219-238.
DI NOCERA, S., F. MATANO, T.S. PESCATORE, F. PINTO, R. QUARANTIELLO, M.R. SENATORE AND M. TORRE (2006): Schema geologico del transetto Monti Picentini orientali-Monti della Daunia meridionali: unità stratigrafiche ed evoluzione tettonica del settore esterno dell’Appennino meridionale, Boll. Soc. Geol. It., 125, 39-58.
DI NOCERA , S., F. MATANO AND M. TORRE (2002): Le unità “Sannitiche” Auct. (Appennino centro-meridionale): rassegna delle correnti interpretazioni stratigrafiche e paleogeografiche e nuove ipotesi con l’introduzione dell’Unità di Frigento, Studi Geologici Camerti, 1 (1), 87-102.
DISS WORKING GROUP (2006): Database of Individual Seismogenic Sources, Version 3.0.2: A compilation of potential sources for earthquakes larger than M 5.5 in Italy and surrounding areas, http://www.ingv.it/DISS/, Istituto Nazionale di Geofisica e Vulcanologia.
FINIZOLA, A., A. REVIL, E. RIZZO, S. PISCITELLI, T. RICCI, J. MORIN, B. ANGELETTI, L. MOCOCHAIN, AND F. SORTINO (2006): Hydrogeological insights at Stromboli volcano (Italy) from geoelectrical, temperature, and CO2 soil degassing investigations, Geophys. Res. Lett., 33, L17304, doi:10.1029/2006GL026842.
GALLI, P., V. BOSI, S. PISCITELLI, A. GIOCOLI AND V. SCIONTI (2006): Late Holocene earthquakes in southern Apennines: paleoseismology of the Caggiano fault, Int. J. Earth Sci. (Geol Rundsch), 95 (5), 855-870, DOI 10.1007/s00531-005-0066-2.
LOKE, M.H. (2001): Tutorial: 2-D and 3-D electrical imaging surveys. I: Course notes for USGS workshop “2-D and 3-D inversion and modeling of surface and borehole resistivity data”, Storrs, CT, 13-16 March 2001.
Giocoli et al., accepted manuscript, Annals of Geophysics, December 2007 10
LOKE, M.H. AND R.D. BARKER (1996): Rapid least-squares inversion of apparent resistivity pseudosections by a quasi-newton method, Geophys. Prospect., 44, 131-152.
MELETTI, C., M. STUCCHI, F. GALADINI, I. LESCHIUTTA AND P. SCANDONE (2000): Criteri e procedure per la compilazione di un inventario speditivo delle sorgenti potenziali di terremoti distruttivi finalizzato alla compilazione di una nuova mappa delle zone sismogenetiche per l’area italiana, in: GALADINI, F., C. MELETTI AND A. REBEZ (EDS), Le ricerche del GNDT nel campo della pericolosità sismica (1996-1999), CNR-Gruppo Nazionale per la Difesa dai Terremoti – Roma, 2000, 379-397.
MUCCIARELLI M. AND M.R. GALLIPOLI (2001): A critical review of 10 years of microtremor HVSR technique, Boll. Di Geof. Teor. ed Appl., 42, 255-266.
NIWAS, S. AND O.A.L. DE LIMA (2003): Aquifer parameter estimation from surface resistivity data, Groundwater, 41 (1), 94-99.
NGUYEN, F., S. GARAMBOIS, D. CHARDON, D. JONGMANS, O. BELLIERA AND D. HERMITTE (2003): Slow active fault detection and imaging using multiple geophysical methods: the Trévaresse thrust (Provence, France), Geophysical Research Abstracts, 5, 10878.
NGUYEN, F., S. GARAMBOIS, D. JONGMANS, E. PIRARD AND M.H. LOKE (2005): Image processing of 2D resistivity data for imaging faults, Journal of Applied Geophysics, 57, 260-277.
PAROLAI S., P. BORMANN AND C. MILKEREIT (2002): New Relationships between Vs, Thickness of Sediments and Resonance Frequency Calculated by H/V Ratio Seismic Noise for Cologne Area (Germany), Bull. Seism. Soc. Am., 92(6), 2521-2527.
PESCATORE, T., S. DI NOCERA, F. MATANO AND F. PINTO (2000): L’unità del Fortore nel quadro della geologia del settore orientale dei Monti del Sannio (Appennino meridionale), Boll. Soc. Geol. It., 119, 587-601.
RIZZO, E., A. COLELLA, V. LAPENNA AND S. PISCITELLI (2004): High-resolution images of the fault-controlled High Agri Valley basin (Southern Italy) with deep and shallow electrical resistivity tomographies, Physics and Chemistry of the Earth, 29, 321-327.
SCHON, J.H. (2004): Physical Properties of Rocks : fundamentals and principles of petrophysics, Chapter 9, Elsevier, Amsterdam.
SOUPIOS, P.M., M. KOULI, F. VALLIANATOS, A. VAFIDIS AND G. STAVROULAKIS (2007a): ESTIMATION OF AQUIFER HYDRAULIC PARAMETERS FROM SURFICIAL GEOPHYSICAL METHODS : A Case Study of Keritis Basin in Chania (Crete-Greece), Journal of Hydrology, DOI: 10.1016/jhydrol.2007.02.028.
SOUPIOS, P.M., N. PAPADOPOULOS, I. PAPADOPOULOS, M. KOULI, F. VALLIANATOS, A. SARRIS AND T. MANIOS (2007b): Application of integrated method in mapping waste disposal areas, Envirol Geol, DOI 10.1007/s00254-007-0681-2.
STORZ, H., W. STORZ AND F. JACOBS (2000): Electrical resistivity tomography to investigate geological structures of the earth's upper crust, Geophysical Prospecting, 48, 455-471.
SUZUKI, K., S. TODA, K. KUSUNOKI, Y. FUJIMITSU, T. MOGI AND A. JOMORI (2000): Case studies of electrical and electromagnetic methods applied to mapping active faults beneath the thick quaternary, Engineering Geology, 56, 29-45.
VALENSISE, G. AND D. PANTOSTI (EDS) (2001): Database of Potential Sources for Earthquakes Larger than M 5.5 in Italy, Annali di Geofisica, Suppl. to vol. 44 (4), 180 pp., with CD-ROM.
WISE, D.J, J. CASSIDY AND C.A. LOCKE (2003): Geophysical imaging of the Quaternary Wairoa North Fault, New Zealand: a case study, Journal of Applied Geophysics, 53, 1-16.
WORKING GROUP CPTI (2004): Catalogo parametrico dei terremoti italiani, versione 2004 (CPTI04), INGV, Bologna. Available on line from: http://emidius.mi.ingv.it/CPTI04/.
Giocoli et al., accepted manuscript, Annals of Geophysics, December 2007 11
Figure captions
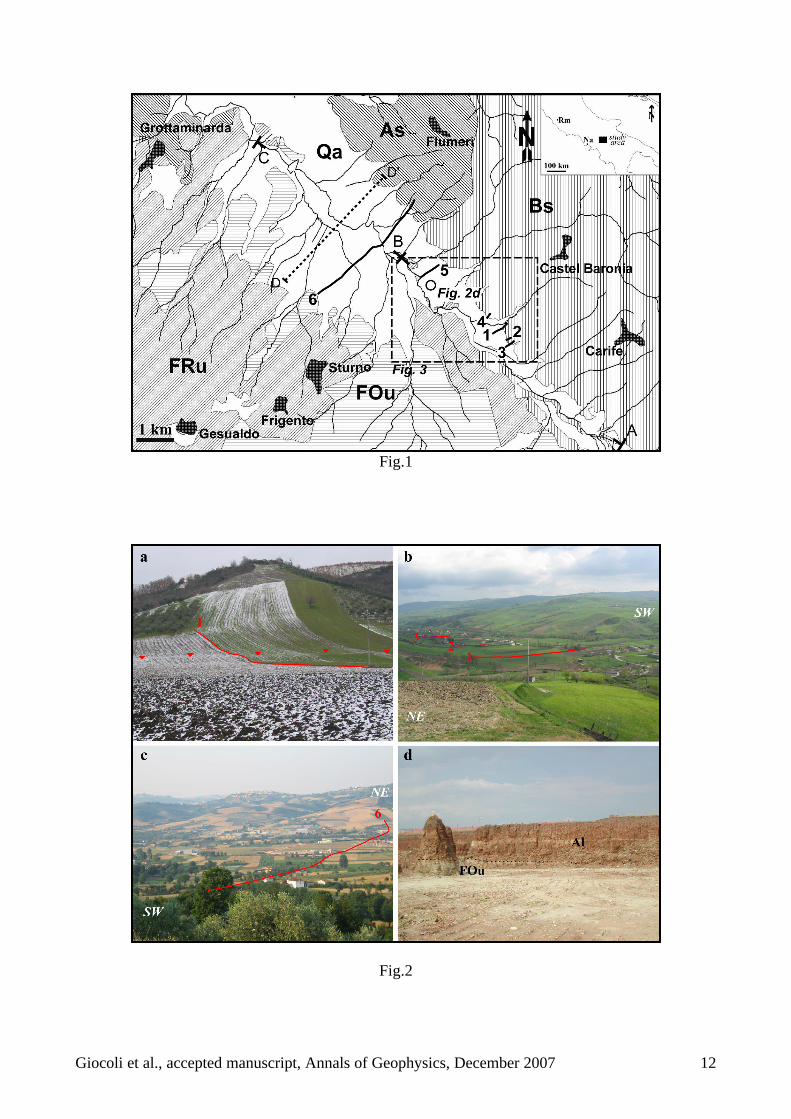
Fig. 1. Geological scheme of the study area (modified, from Di Nocera et al., 2006) with traces of the ERT profiles, and location of Fig. 2d (white circle). FOu: Fortore Unit; FRu: Frigento Unit; As: Altavilla supersynthem; Bs: Baronia synthem; Qa: Quaternary deposits. A-B: erosive reach of the Ufita River; B-C: depositional reach. Profiles are numbered as follows: 1- Isca Ciampone; 2- Renazzo II; 3- Renazzo I; 4- Serritiella; 5- Piani; 6- Deep profile. D-D’: trace of the geological profile of Fig. 6. Fig. 2. Photos showing the study area: a) trace of Isca Ciampone profile (1). The scarplet at the base of the triangular facet is highlighted by red triangles; b) traces of Isca Ciampone (1), Renazzo II (2) and Renazzo I (3) profiles, on the north-eastern valley shoulder. View is towards the upstream section of the Ufita River (reach A-B in Fig. 1); c) trace of the deep ERT profile (6) running across the valley. View is towards the north-eastern shoulder of the valley, and shows also two of the low-dipping triangular facets that characterize this margin; d) photo taken near profile Piani (location in Fig. 1) showing the erosive contact between coarse alluvial fan deposits (Al) and the marly limestone of the Fortore Unit (FOu). In this site the alluvial fan is few meters thick. Fig. 3. Location map of the shallow ERT profiles, numbered same as Fig. 1. This figure shows the alluvial fans (green), the recent alluvial deposits (light blue), and the bedrock outcrops along the Ufita River (yellow). Area covered by this figure is shown in Fig. 1 with dotted rectangle. Fig. 4. Electrical tomographies of profiles: 1- Isca Ciampone; 5- Piani of Fig.1. Fig. 5. Electrical tomographies of profiles: 2- Renazzo II; 3- Renazzo I; 4- Serritiella of Fig.1. Fig.6. Deep ERT carried out along the profile 6 of Fig.1 and Fig.2c. D-D’ Geological cross-section carried along the profile D-D’ of Fig.1. The resistivity and geology models are to the same metrics scale.
Giocoli et al., accepted manuscript, Annals of Geophysics, December 2007 12
Fig.1
Fig.2
Giocoli et al., accepted manuscript, Annals of Geophysics, December 2007 13
Fig.3
Fig.4
Giocoli et al., accepted manuscript, Annals of Geophysics, December 2007 14
Fig.5
Fig.6