Embed Size (px)
Citation preview
Electricity and Heat
HP Chung
UNESCAP Statistics Division
Workshop on Energy Statistics for ASEAN Countries
21-23 November 2017
Kuala Lumpur, Malaysia
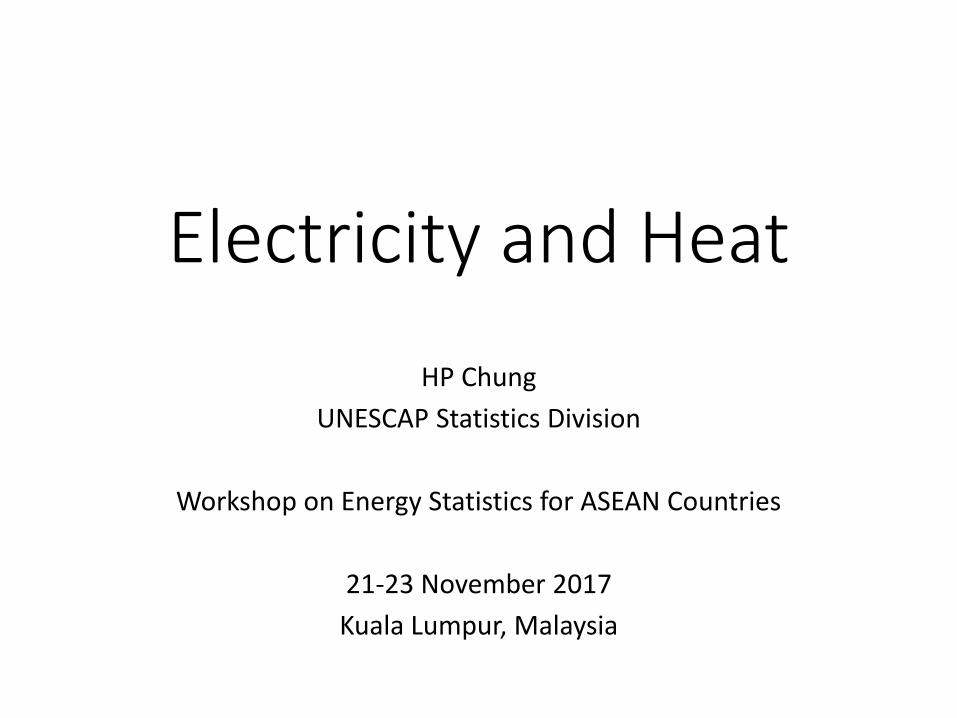
Overview
• Main trends
• Introduction to core concepts• Primary and secondary sources• Types of plants and producers• Supply and consumption
• Data collection and compilation• Issues• Data sources• Checks
• Quizzes!
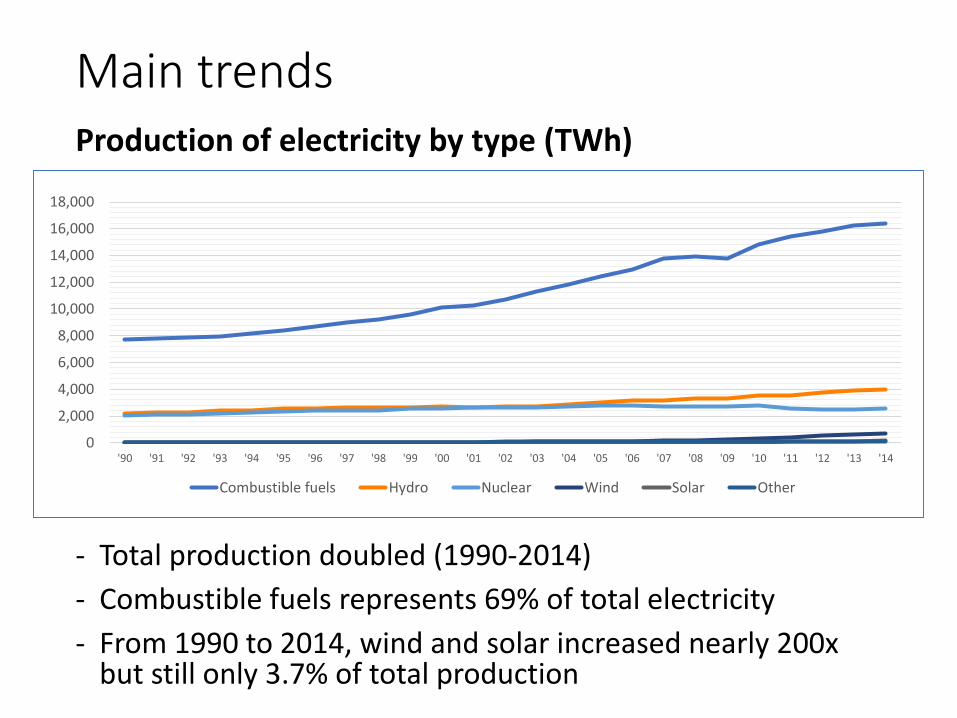
Main trendsProduction of electricity by type (TWh)
- Total production doubled (1990-2014)
- Combustible fuels represents 69% of total electricity
- From 1990 to 2014, wind and solar increased nearly 200x but still only 3.7% of total production
0
2,000
4,000
6,000
8,000
10,000
12,000
14,000
16,000
18,000
'90 '91 '92 '93 '94 '95 '96 '97 '98 '99 '00 '01 '02 '03 '04 '05 '06 '07 '08 '09 '10 '11 '12 '13 '14
Combustible fuels Hydro Nuclear Wind Solar Other
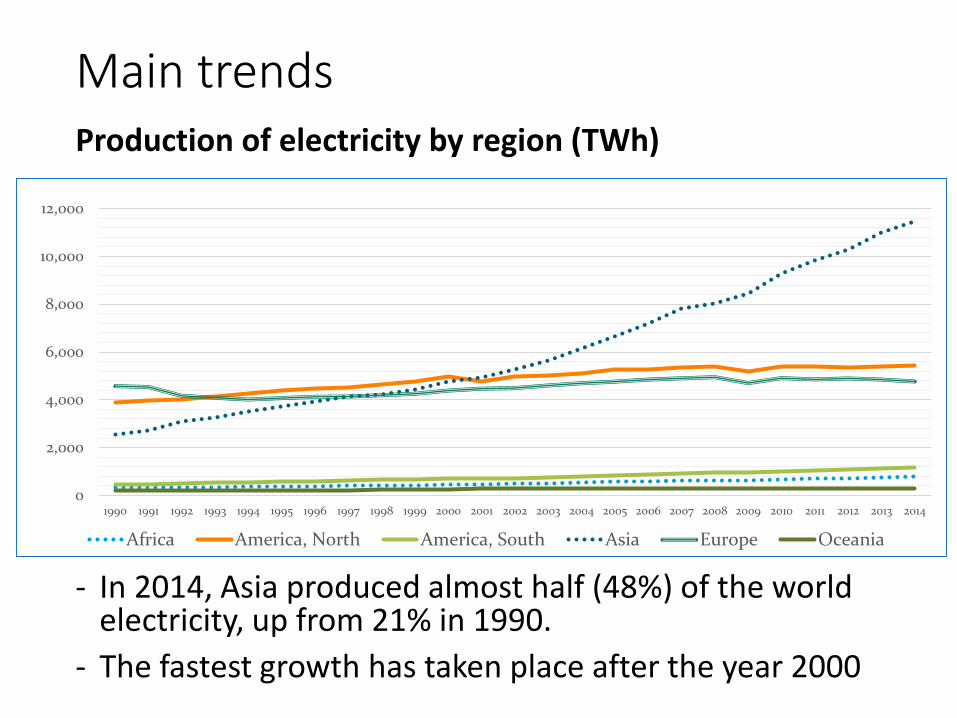
Main trendsProduction of electricity by region (TWh)
- In 2014, Asia produced almost half (48%) of the world electricity, up from 21% in 1990.
- The fastest growth has taken place after the year 2000
0
2,000
4,000
6,000
8,000
10,000
12,000
1990 1991 1992 1993 1994 1995 1996 1997 1998 1999 2000 2001 2002 2003 2004 2005 2006 2007 2008 2009 2010 2011 2012 2013 2014
Africa America, North America, South Asia Europe Oceania
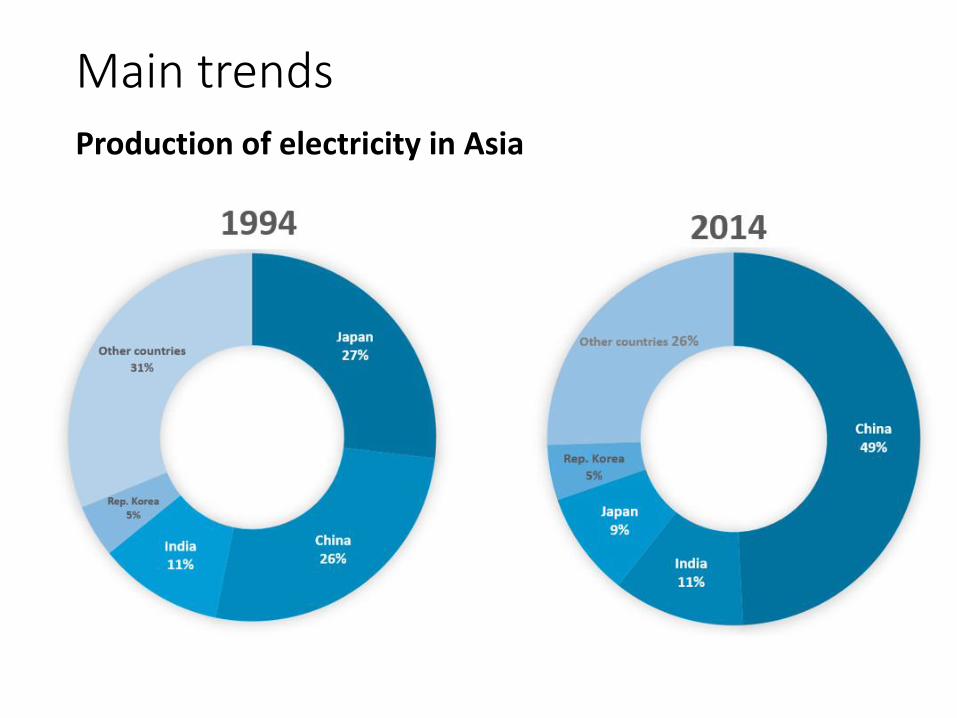
Main trends
Production of electricity in Asia
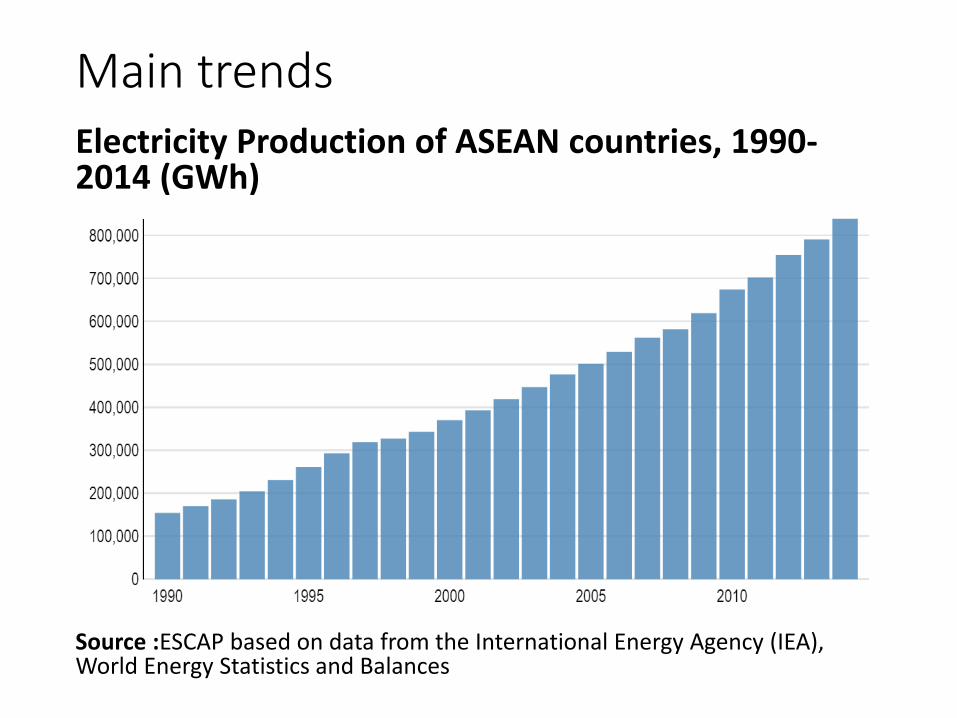
Main trendsElectricity Production of ASEAN countries, 1990-2014 (GWh)
Source :ESCAP based on data from the International Energy Agency (IEA), World Energy Statistics and Balances
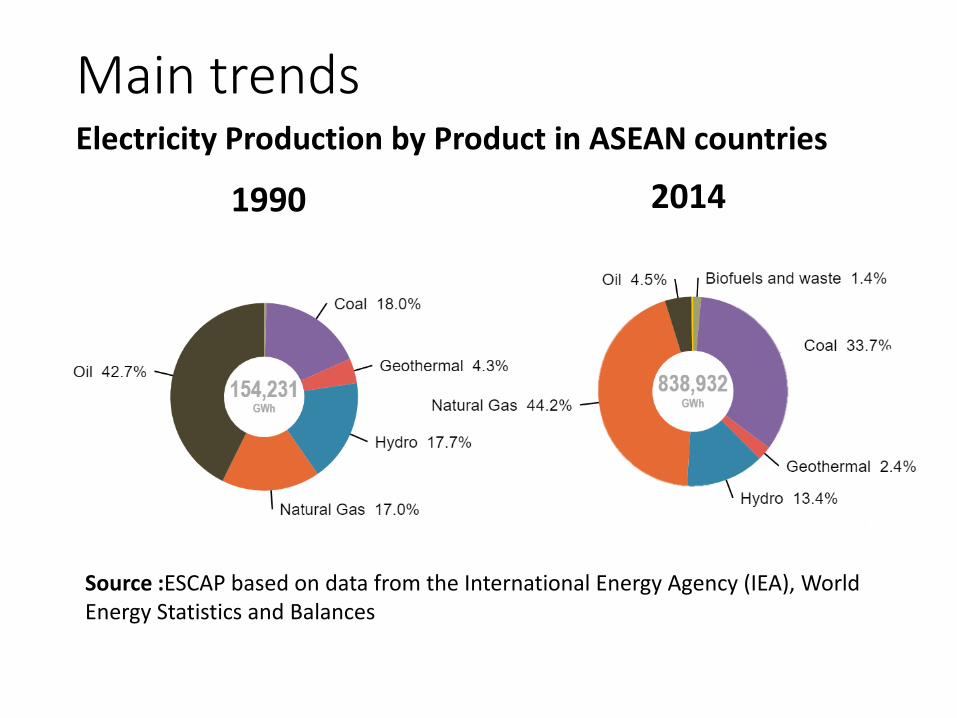
Main trends
1990 2014
Electricity Production by Product in ASEAN countries
Source :ESCAP based on data from the International Energy Agency (IEA), World Energy Statistics and Balances
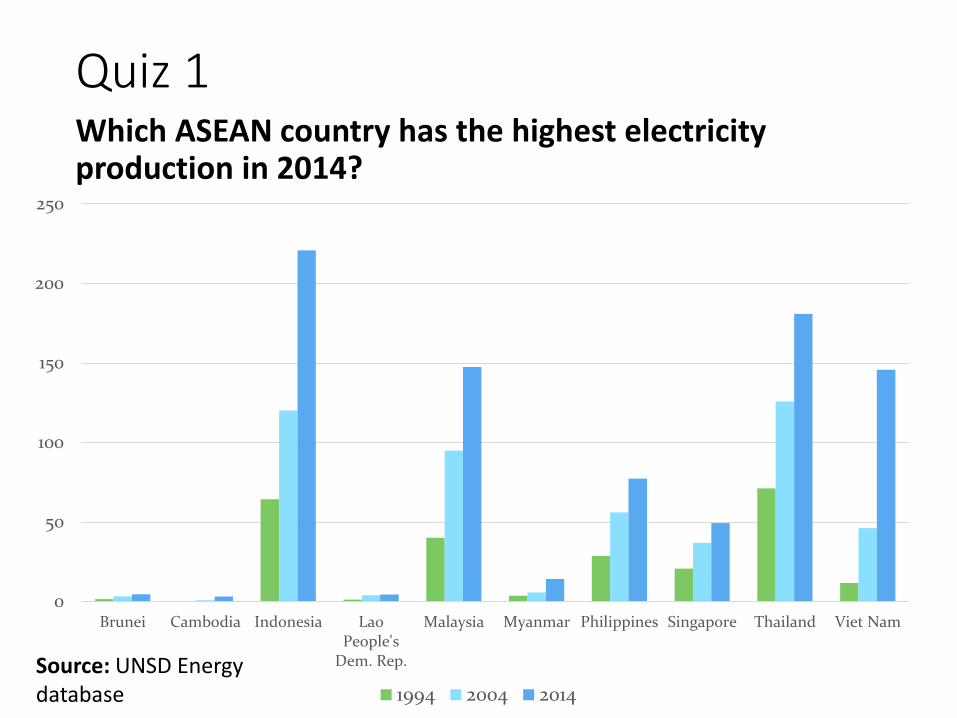
Quiz 1Which ASEAN country has the highest electricity production in 2014?
0
50
100
150
200
250
Brunei Cambodia Indonesia LaoPeople's
Dem. Rep.
Malaysia Myanmar Philippines Singapore Thailand Viet Nam
1994 2004 2014
Source: UNSD Energy database
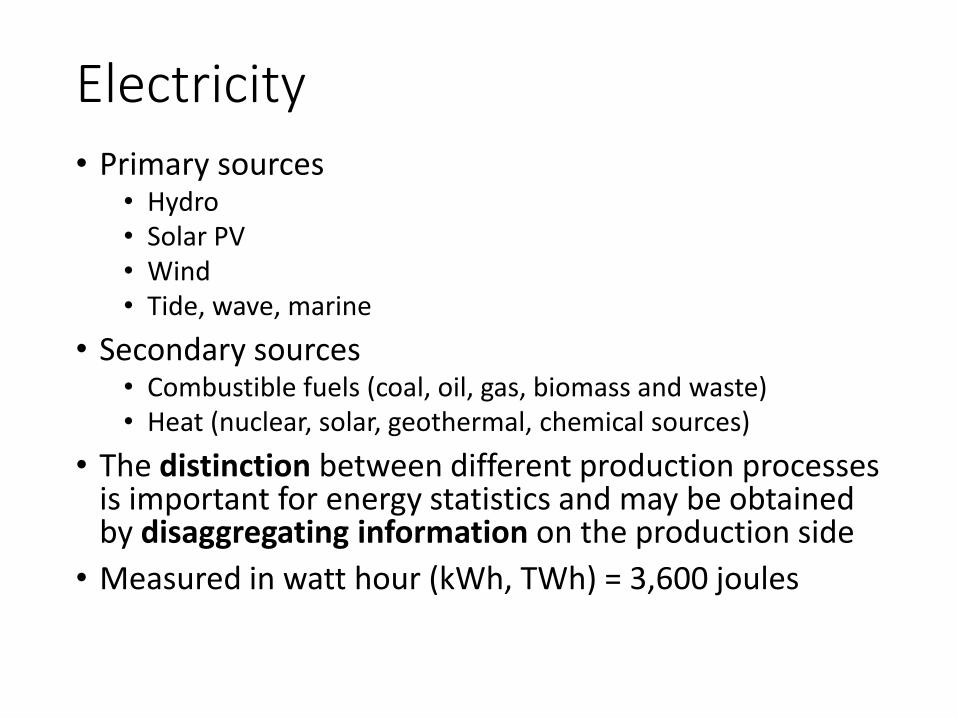
Electricity• Primary sources
• Hydro• Solar PV• Wind• Tide, wave, marine
• Secondary sources• Combustible fuels (coal, oil, gas, biomass and waste)• Heat (nuclear, solar, geothermal, chemical sources)
• The distinction between different production processes is important for energy statistics and may be obtained by disaggregating information on the production side
• Measured in watt hour (kWh, TWh) = 3,600 joules
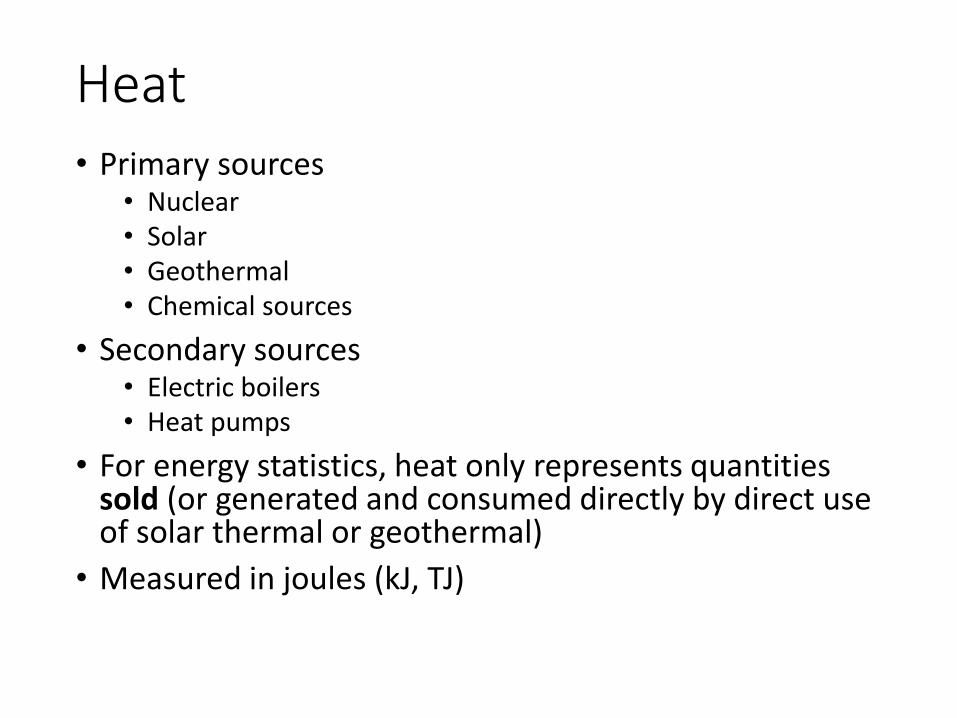
Heat• Primary sources
• Nuclear• Solar• Geothermal• Chemical sources
• Secondary sources• Electric boilers• Heat pumps
• For energy statistics, heat only represents quantities sold (or generated and consumed directly by direct use of solar thermal or geothermal)
• Measured in joules (kJ, TJ)
Quiz 2
What is difference between primary and secondary sources of energy?
• Primary: extracted or captured directly from natural resources
• Secondary: from the transformation of primary or other secondary energy
Energy equivalent for primary electricity and heat
• When electricity and heat are produced the output is always measurable, but the input can be difficult to measure.
• For secondary electricity and heat (e.g. coal plants), there is a measurable input to the transformation.
• For primary electricity and heat, according to IRES the “physical energy content” method should be used to assess the energy content used to produce them.
• In the case of electricity generation from primary heat (nuclear, geothermal and solar thermal), the heat is the primary energy form.
Energy equivalent for primary electricity and heat
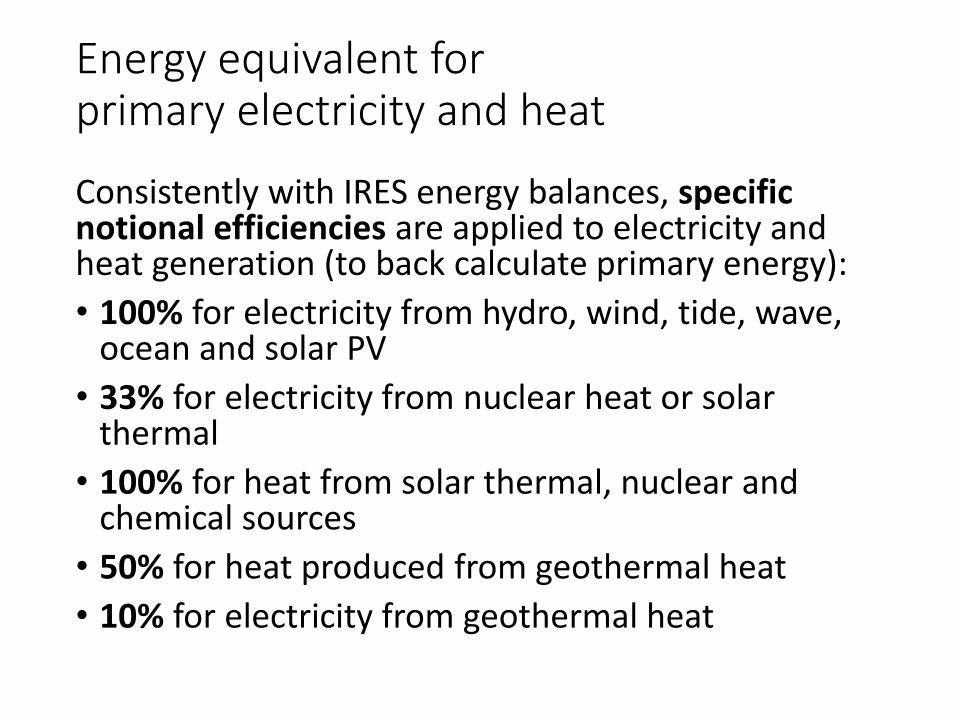
Consistently with IRES energy balances, specific notional efficiencies are applied to electricity and heat generation (to back calculate primary energy):
• 100% for electricity from hydro, wind, tide, wave, ocean and solar PV
• 33% for electricity from nuclear heat or solar thermal
• 100% for heat from solar thermal, nuclear and chemical sources
• 50% for heat produced from geothermal heat
• 10% for electricity from geothermal heat
Energy equivalent for primary electricity and heat
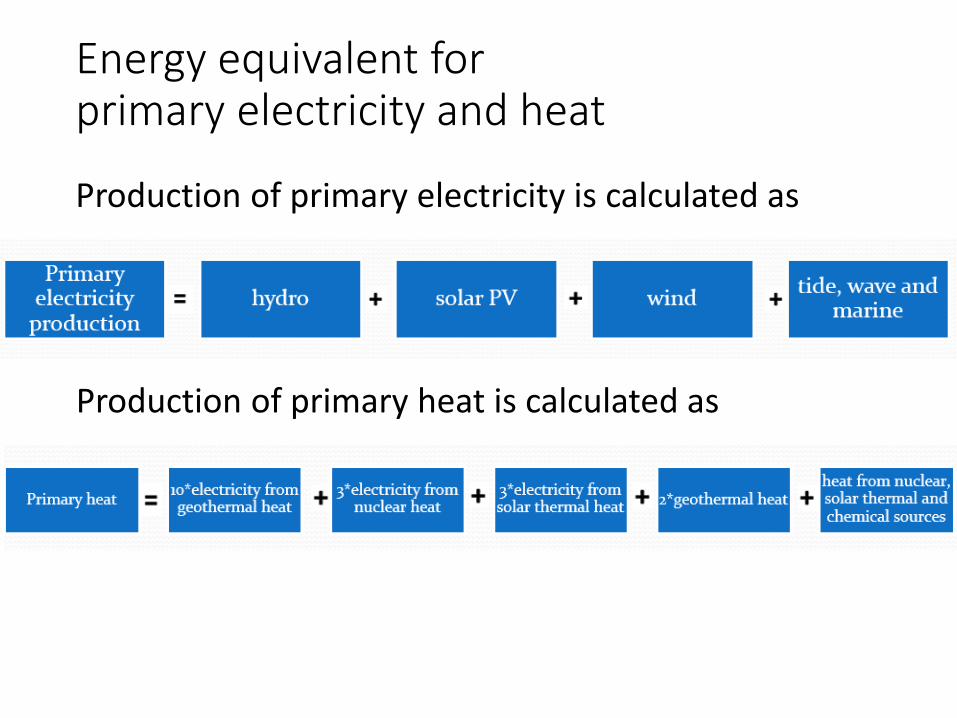
Production of primary electricity is calculated as
Production of primary heat is calculated as
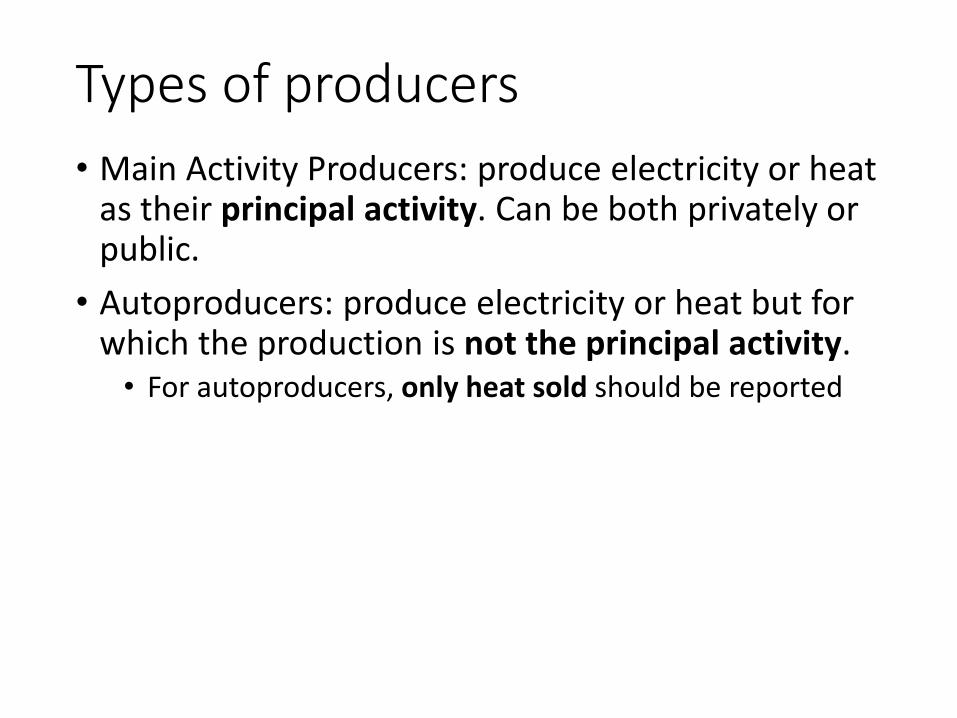
Types of producers
• Main Activity Producers: produce electricity or heat as their principal activity. Can be both privately or public.
• Autoproducers: produce electricity or heat but for which the production is not the principal activity. • For autoproducers, only heat sold should be reported
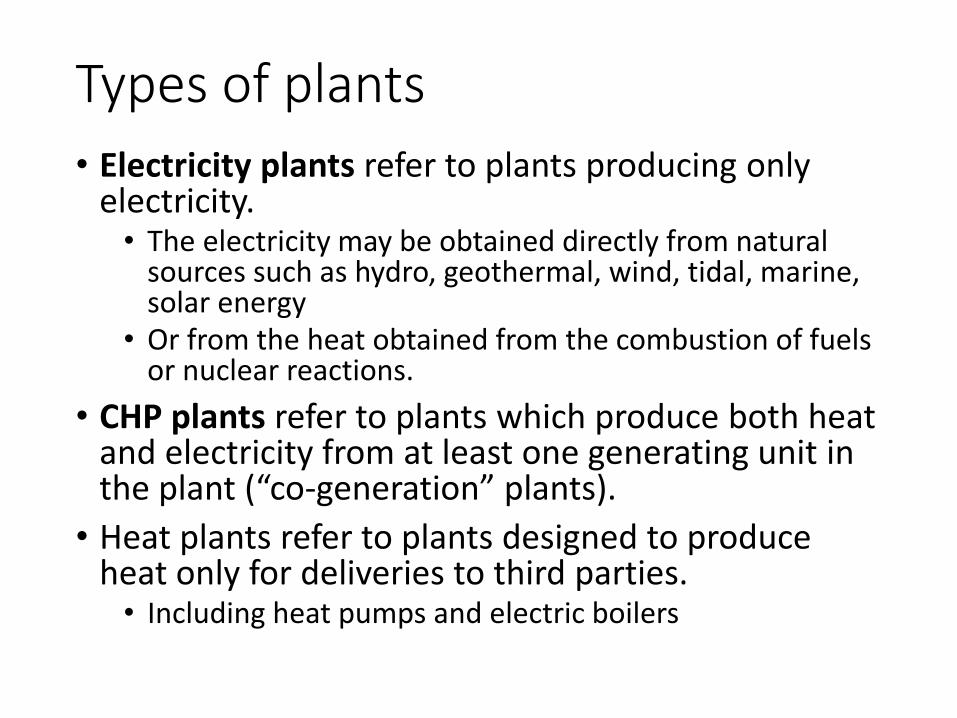
Types of plants
• Electricity plants refer to plants producing only electricity. • The electricity may be obtained directly from natural
sources such as hydro, geothermal, wind, tidal, marine, solar energy
• Or from the heat obtained from the combustion of fuels or nuclear reactions.
• CHP plants refer to plants which produce both heat and electricity from at least one generating unit in the plant (“co-generation” plants).
• Heat plants refer to plants designed to produce heat only for deliveries to third parties. • Including heat pumps and electric boilers
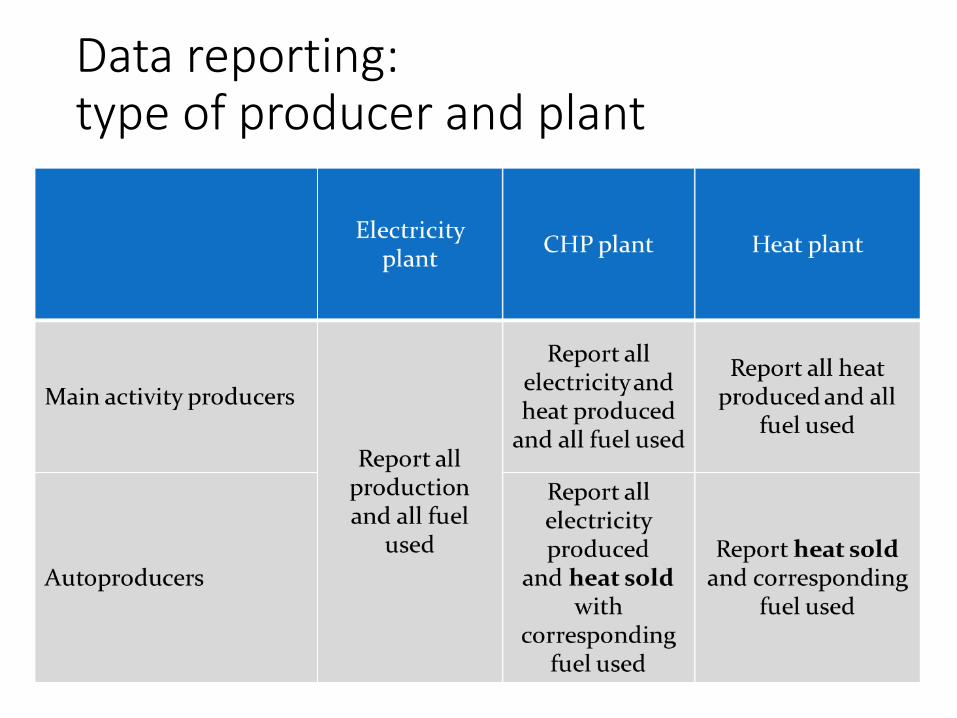
Data reporting: type of producer and plant
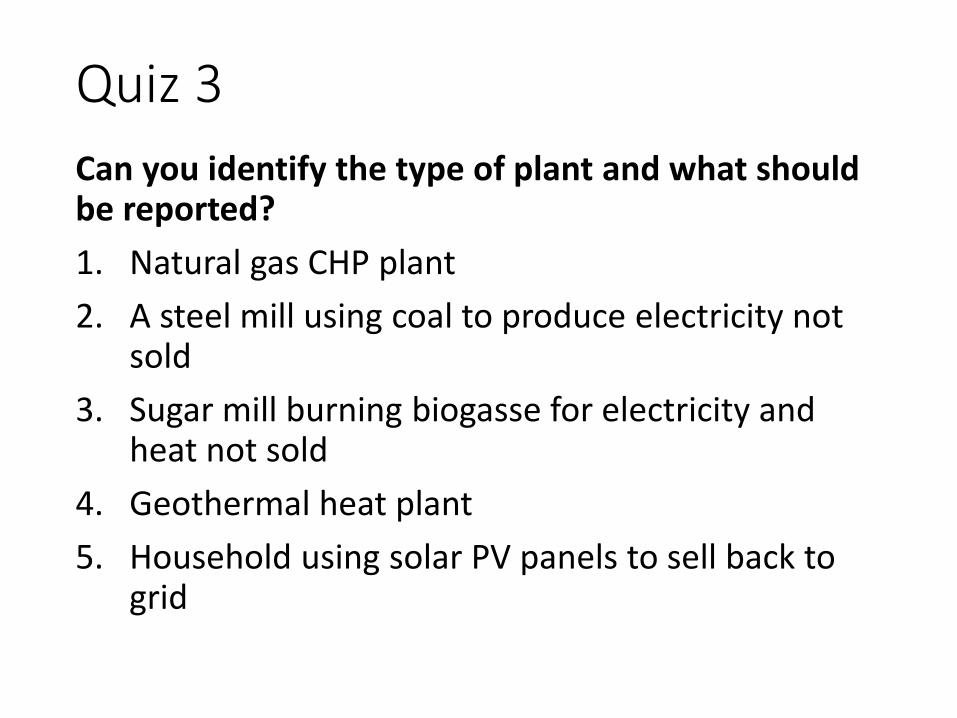
Quiz 3
Can you identify the type of plant and what should be reported?
1. Natural gas CHP plant
2. A steel mill using coal to produce electricity not sold
3. Sugar mill burning biogasse for electricity and heat not sold
4. Geothermal heat plant
5. Household using solar PV panels to sell back to grid
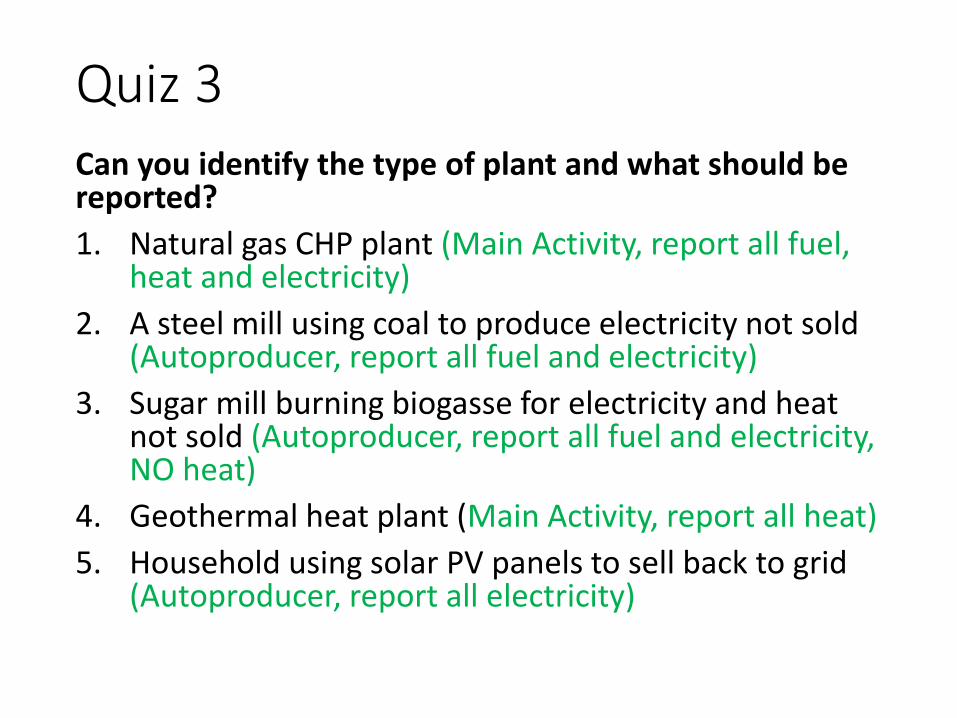
Quiz 3Can you identify the type of plant and what should be reported?
1. Natural gas CHP plant (Main Activity, report all fuel, heat and electricity)
2. A steel mill using coal to produce electricity not sold (Autoproducer, report all fuel and electricity)
3. Sugar mill burning biogasse for electricity and heat not sold (Autoproducer, report all fuel and electricity, NO heat)
4. Geothermal heat plant (Main Activity, report all heat)
5. Household using solar PV panels to sell back to grid (Autoproducer, report all electricity)
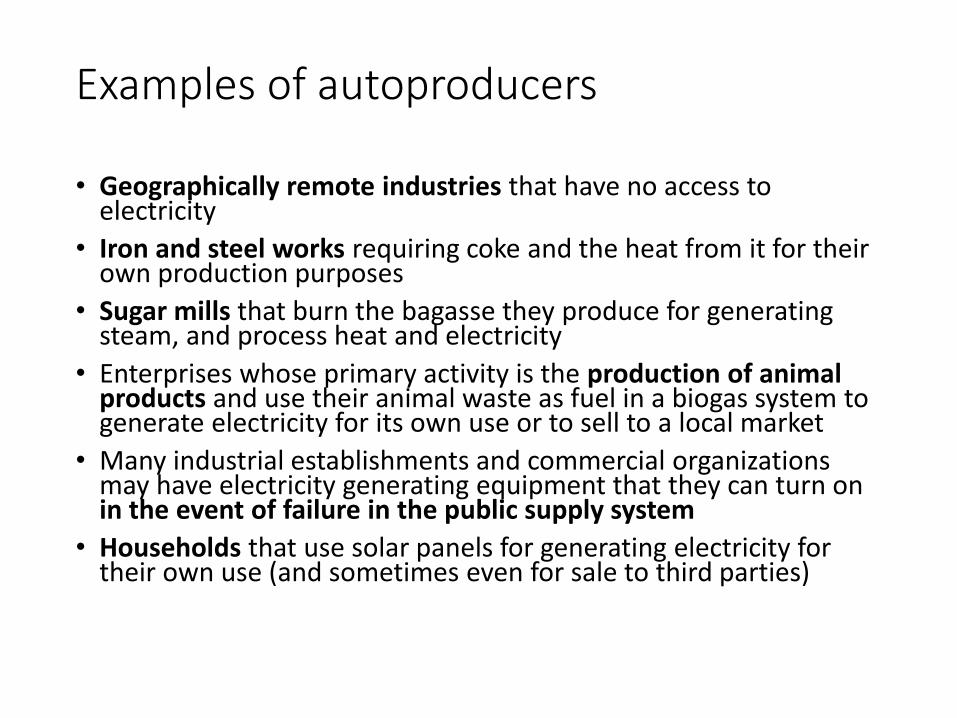
Examples of autoproducers
• Geographically remote industries that have no access to electricity
• Iron and steel works requiring coke and the heat from it for their own production purposes
• Sugar mills that burn the bagasse they produce for generating steam, and process heat and electricity
• Enterprises whose primary activity is the production of animal products and use their animal waste as fuel in a biogas system to generate electricity for its own use or to sell to a local market
• Many industrial establishments and commercial organizations may have electricity generating equipment that they can turn on in the event of failure in the public supply system
• Households that use solar panels for generating electricity for their own use (and sometimes even for sale to third parties)
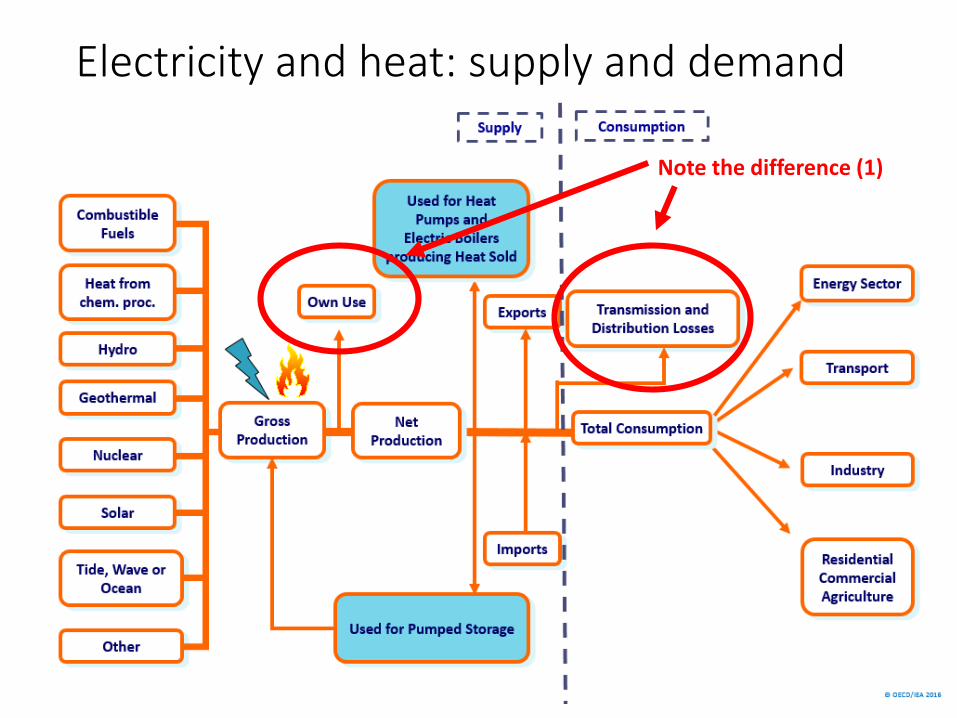
Electricity and heat: supply and demand
Note the difference (1)
Electricity and heat: supply and demand
• Own use by electricity, CHP and heat plants refers to the consumption of electricity and heat for the direct support of the production and preparation for use of fuels and energy, except heat not sold.
• Losses refer to losses during the transmission, distribution and transport of heat and electricity. Losses of geothermal heat after production and pilferage of electricity are also included.
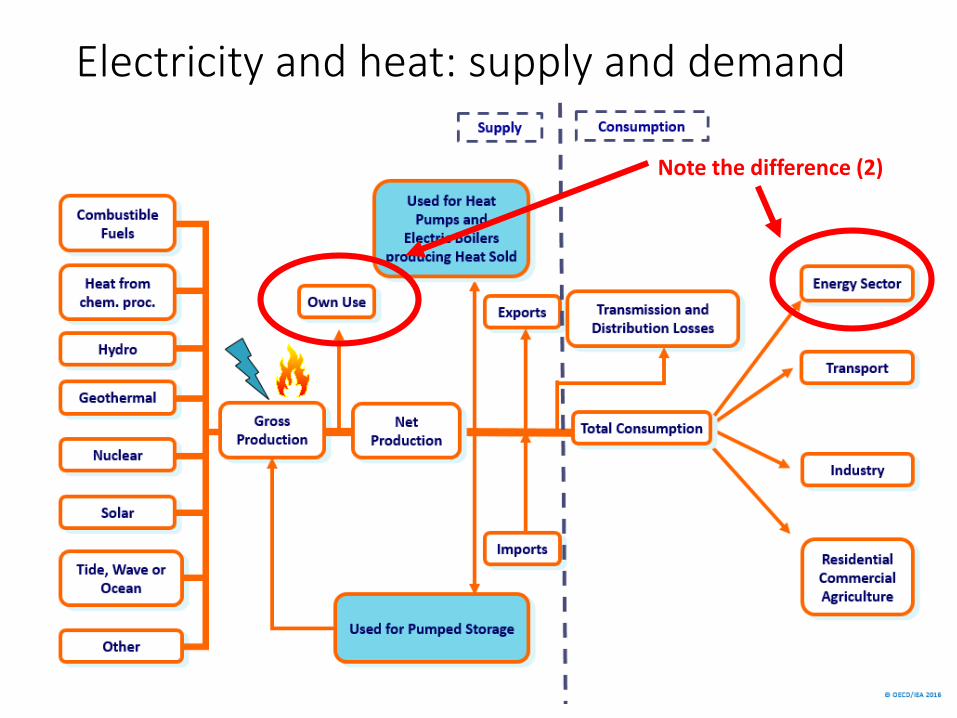
Electricity and heat: supply and demand
Note the difference (2)
Quiz 4
What is difference between “own use” and consumption in “energy sector”
• Energy Industries use refers to the consumption of electricity and heat for the direct support of the production and preparation for use of fuels and energy, by industries in the energy sector such as coal mines, oil refineries, oil and gas extraction etc.
• As we have seen, consumption by electricity, CHP and heat plants is accounted for separately in Own Use.
Electricity and heat: supply and demand
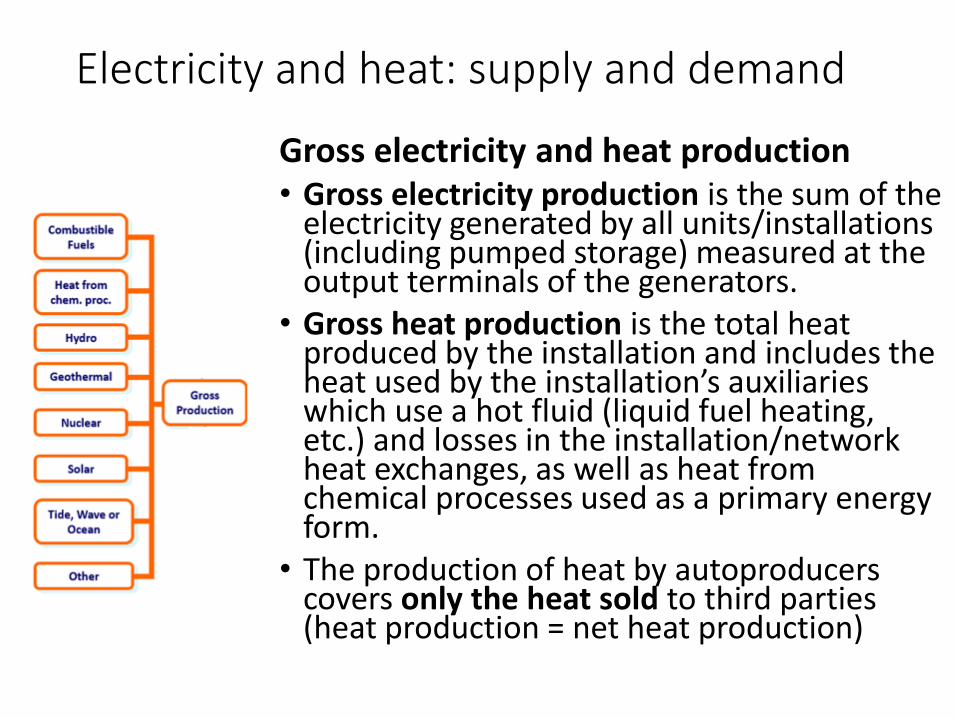
Gross electricity and heat production• Gross electricity production is the sum of the
electricity generated by all units/installations (including pumped storage) measured at the output terminals of the generators.
• Gross heat production is the total heat produced by the installation and includes the heat used by the installation’s auxiliaries which use a hot fluid (liquid fuel heating, etc.) and losses in the installation/network heat exchanges, as well as heat from chemical processes used as a primary energy form.
• The production of heat by autoproducers covers only the heat sold to third parties (heat production = net heat production)
Electricity and heat: supply and demand
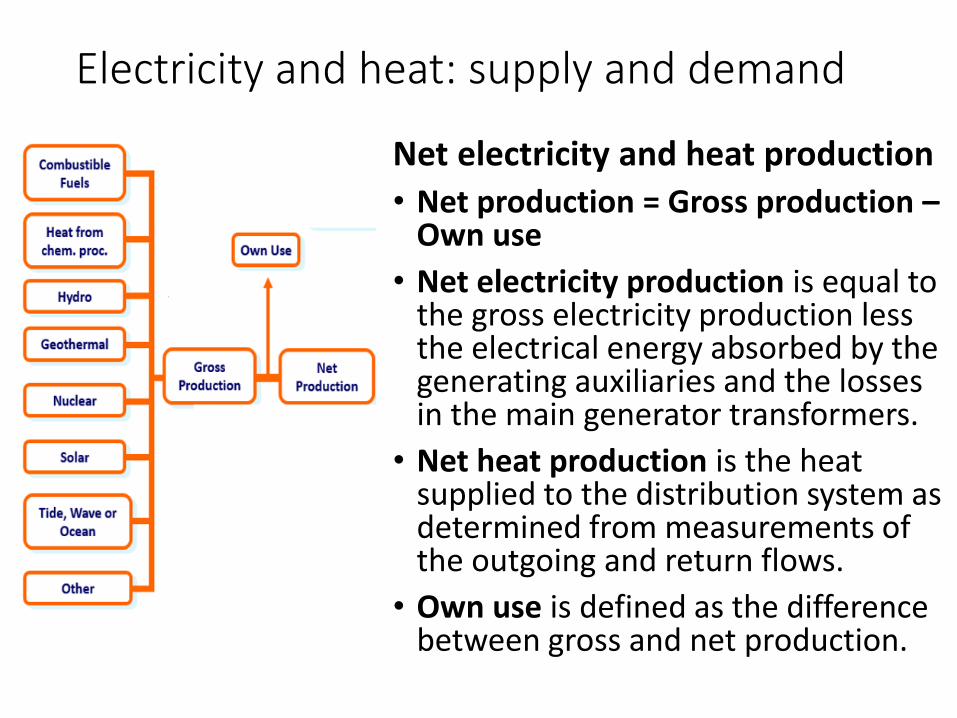
Net electricity and heat production
• Net production = Gross production –Own use
• Net electricity production is equal to the gross electricity production less the electrical energy absorbed by the generating auxiliaries and the losses in the main generator transformers.
• Net heat production is the heat supplied to the distribution system as determined from measurements of the outgoing and return flows.
• Own use is defined as the difference between gross and net production.
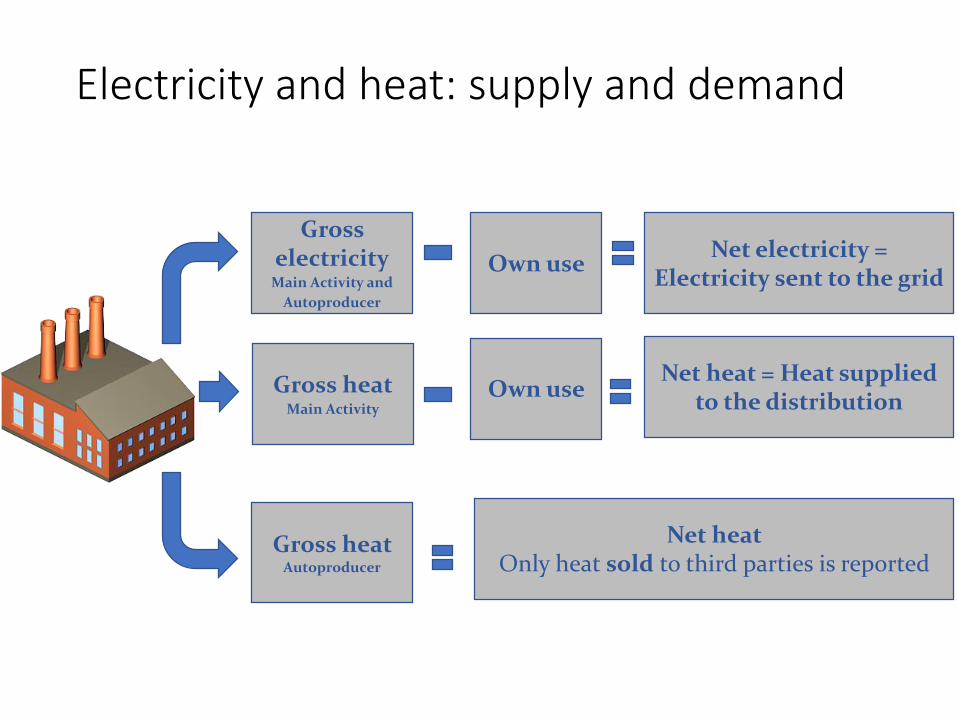
Electricity and heat: supply and demand
Gross electricity
Main Activity and
Autoproducer
Own useNet electricity =
Electricity sent to the grid
Gross heat Autoproducer
Gross heatMain Activity
Own useNet heat = Heat supplied
to the distribution
Net heatOnly heat sold to third parties is reported
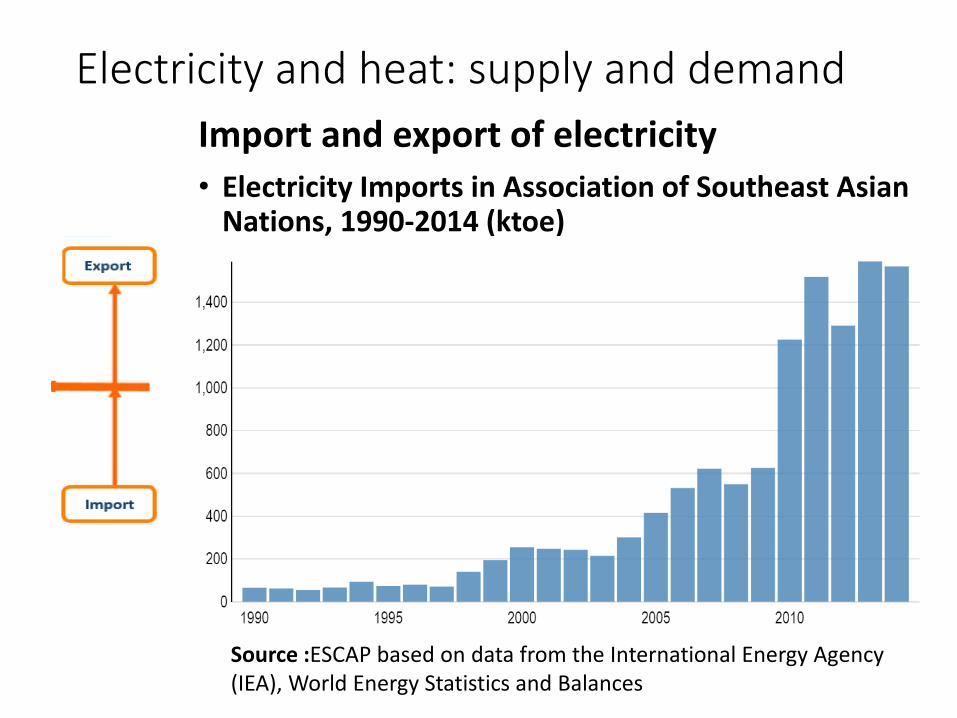
Electricity and heat: supply and demand
Import and export of electricity
• Electricity Imports in Association of Southeast Asian Nations, 1990-2014 (ktoe)
Source :ESCAP based on data from the International Energy Agency (IEA), World Energy Statistics and Balances
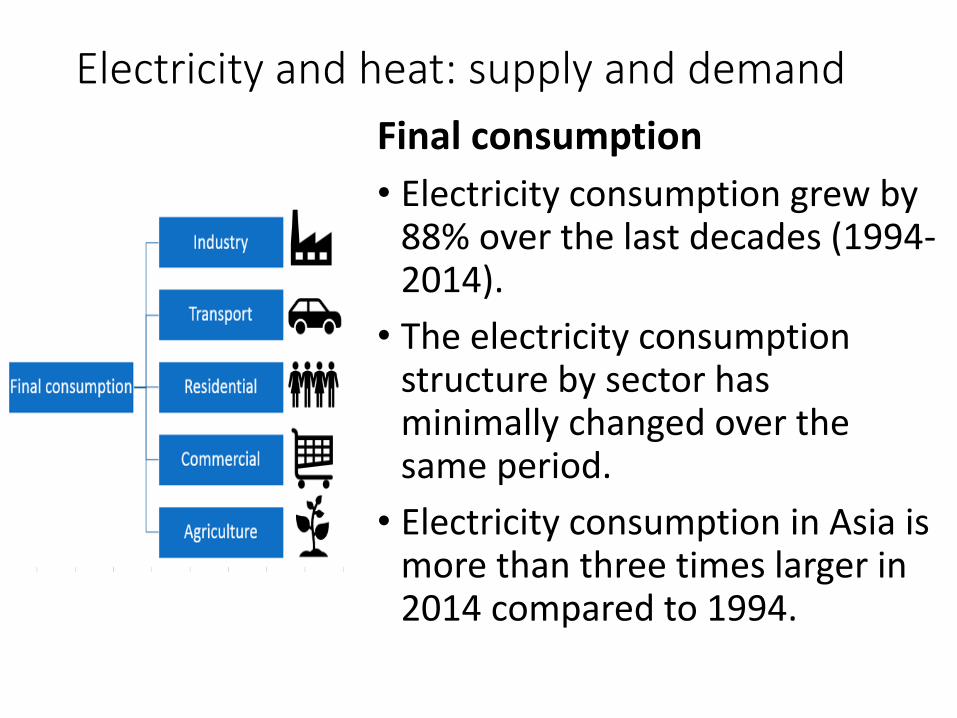
Electricity and heat: supply and demand
Final consumption
• Electricity consumption grew by 88% over the last decades (1994-2014).
• The electricity consumption structure by sector has minimally changed over the same period.
• Electricity consumption in Asia is more than three times larger in 2014 compared to 1994.
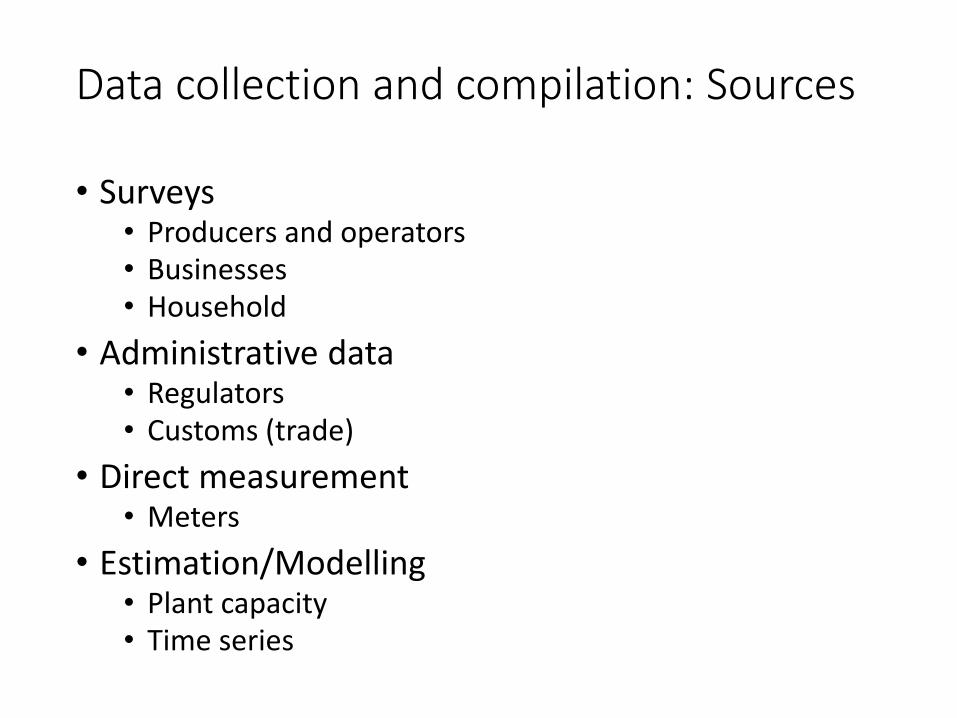
Data collection and compilation: Sources
• Surveys• Producers and operators• Businesses• Household
• Administrative data• Regulators• Customs (trade)
• Direct measurement• Meters
• Estimation/Modelling• Plant capacity• Time series
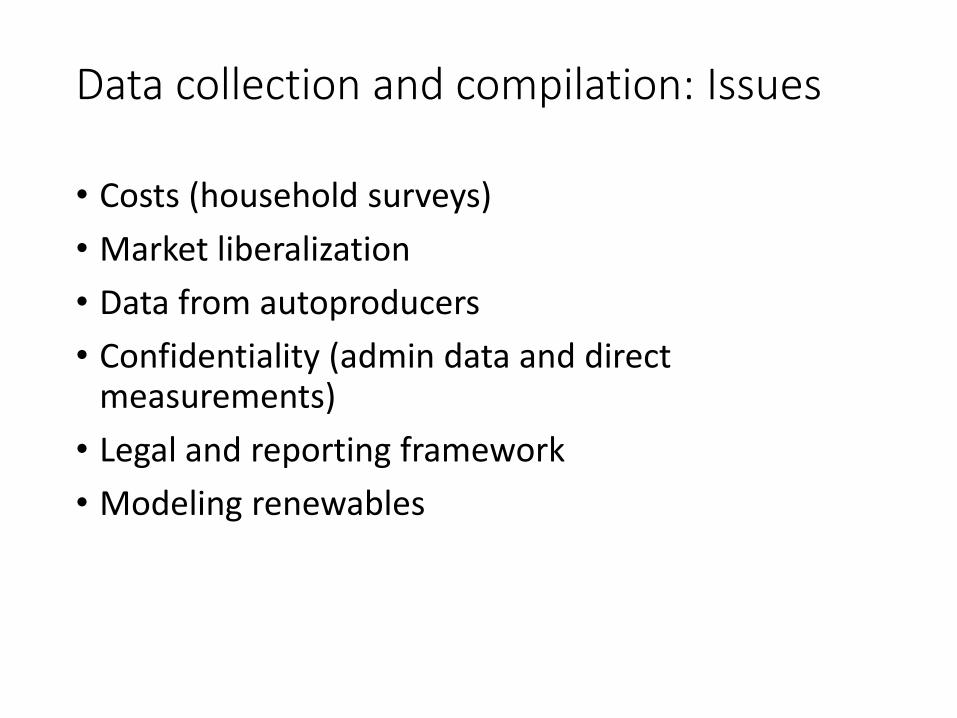
Data collection and compilation: Issues
• Costs (household surveys)
• Market liberalization
• Data from autoproducers
• Confidentiality (admin data and direct measurements)
• Legal and reporting framework
• Modeling renewables
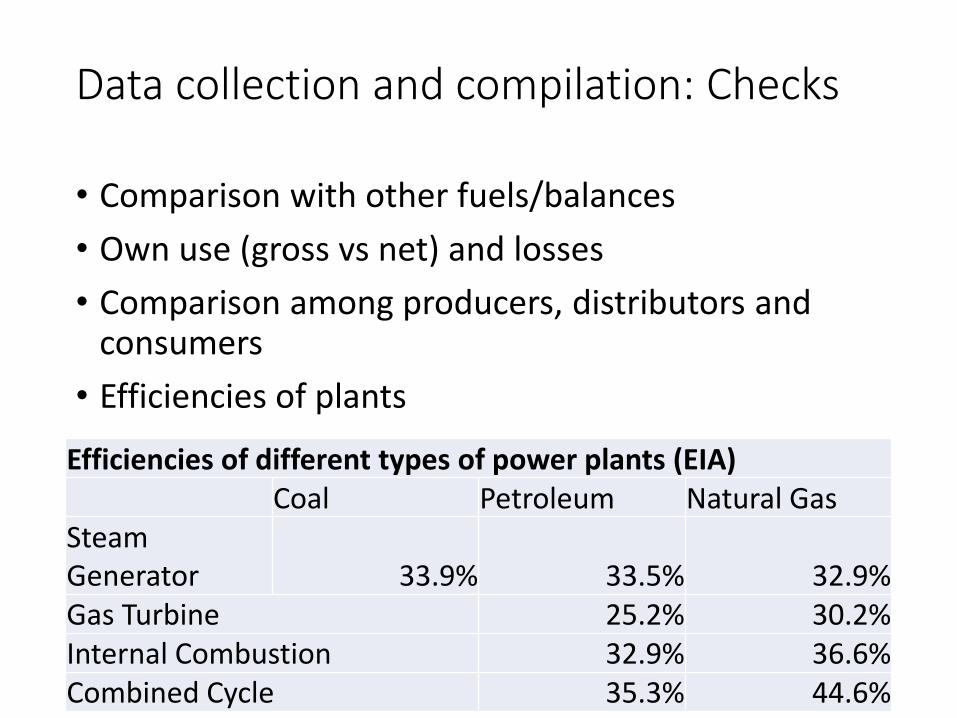
Data collection and compilation: Checks
• Comparison with other fuels/balances
• Own use (gross vs net) and losses
• Comparison among producers, distributors and consumers
• Efficiencies of plants
Efficiencies of different types of power plants (EIA)Coal Petroleum Natural Gas
Steam Generator 33.9% 33.5% 32.9%Gas Turbine 25.2% 30.2%Internal Combustion 32.9% 36.6%Combined Cycle 35.3% 44.6%
Thank you
http://unstats.un.org/unsd/energy/
http://asiapacificenergy.org/