Embed Size (px)
Citation preview
Technical Brief
Electricity and privatisation What happened to those promises?
Technical Brief No. 22 April 2013 ISSN 1836-9014
David Richardson

About TAI
The Australia Institute is an independent public policy think tank based in Canberra. It is funded by donations from philanthropic trusts and individuals, memberships and commissioned research. Since its launch in 1994, the Institute has carried out highly influential research on a broad range of economic, social and environmental issues.
Our philosophy
As we begin the 21st century, new dilemmas confront our society and our planet. Unprecedented levels of consumption co-exist with extreme poverty. Through new technology we are more connected than we have ever been, yet civic engagement is declining. Environmental neglect continues despite heightened ecological awareness. A better balance is urgently needed.
The Australia Institute’s directors, staff and supporters represent a broad range of views and priorities. What unites us is a belief that through a combination of research and creativity we can promote new solutions and ways of thinking.
Our purpose—‘Research that matters’
The Institute aims to foster informed debate about our culture, our economy and our environment and bring greater accountability to the democratic process. Our goal is to gather, interpret and communicate evidence in order to both diagnose the problems we face and propose new solutions to tackle them.
The Institute is wholly independent and not affiliated with any other organisation. As an Approved Research Institute, donations to its Research Fund are tax deductible for the donor. Anyone wishing to donate can do so via the website at https://www.tai.org.au or by calling the Institute on 02 6206 8700. Our secure and user-friendly website allows donors to make either one-off or regular monthly donations and we encourage everyone who can to donate in this way as it assists our research in the most significant manner.
LPO Box 5096 University of Canberra, Bruce ACT 2617 Tel: (02) 6206 8700 Fax: (02) 6206 8708 Email: [email protected] Website: www.tai.org.au
1
Electricity and privatisation
Summary
Electricity prices are a major contributor to cost of living pressures and a major cause of concern for Australian consumers. While the carbon tax has recently been depicted as the main culprit in electricity price increases, electricity prices have been increasing rapidly for the past two decades. The cost of electricity increased by 170 per cent from 1995 to 2012, an increase four times higher than the rise in the consumer price index (CPI).
This increase has occurred despite the industry being subjected to privatisation and corporatisation for the past two decades, a process that promised to increase efficiency and lower prices. The agenda of the electricity, gas and water industries continues to push towards privatisation, a direction supported by people on both sides of state politics.
In the context of continued support for privatisation it is important to ask why, despite the promise of lower prices, electricity costs have risen since the reforms began. This paper examines this question and explains some of the factors behind the apparent contradiction between price increases and the promises of privatisation. It reveals that far from privatisation reducing costs it is likely it has contributed to price increases.
A major factor that appears to be involved in the increase in electricity prices is the productivity slump that has occurred in the sector since privatisation. Output per worker has fallen markedly in electricity while it has increased in the rest of the economy. Over the period June 1995 to the present, productivity across all workers increased by 33.6 per cent, while in the electricity sector it declined by 24.9 per cent.
One explanation for this dramatic fall in output per worker is the rapid increase in staff numbers in occupations that do not have a direct role in actually generating electricity. For example, the number of managers in the sector has grown from 6,000 to 19,000 from 1997 to 2012, a rise of 217 per cent. This has seen the ratio of managers to workers change from one manager to every 13 workers in 1997 to one manager for every nine workers in 2012.
In contrast to this, there was a much smaller increase in the group of people who are directly involved in producing electricity. It is likely that this change in the sector’s employment structure is a consequence of privatisation and the split of electricity entities into much smaller units, each requiring its own management and administration team. The cost of this investment in individual teams has likely been recovered from consumers through higher electricity prices.
This paper also examines the increased capital costs associated with privatisation. Private buyers tend to pay more than the value of an electricity plant is worth because of the potential for profits. In order to achieve profitability these businesses are required to increase prices to achieve a competitive return. In this way further costs are passed onto consumers.

2
Introduction
Electricity price increases have become highly politically significant in Australia recently and despite the fact that the carbon price accounted for a tiny proportion of the electricity price increases it was often depicted as the main culprit. Electricity has been subject to a ‘reform’ and privatisation agenda for the past two decades. While the electricity price was expected to increase modestly with the price of carbon, the real main culprit seems to have been the set of policies that were supposed to actually lower prices; the national competition policy in general and privatisation/corporatisation in particular.
The purpose of this paper is to try to draw out some of the specific factors that might further explain the apparent contradiction between the price increases and the reform agenda that carried the promise of cheaper and more efficient electricity generation.
The promises
For a long time now the agenda in the electricity, gas and water industries has been to make them operate more like the private sector by splitting them into smaller units and corporatising or privatising the organisations concerned. Jeff Kennett was one of the first movers among the state Premiers. He had been influenced in opposition by Project Victoria, an initiative developed by employer groups, business groups and Melbourne-based right wing think tanks. Project Victoria promoted a comprehensive privatisation program that included electricity as one of the main targets. Corporatisation and privatisation of the electricity supply, generation and distribution was expected to deliver lower prices and a more efficient industry. Private ownership would deliver “the incentives of ‘profit motive, and the disciplines associated with the markets’ to ‘eliminate waste and inefficiency’”.1
Interestingly Jeff Kennett still appears to hold those views. In a recent essay he said:
There are four main reasons why privatisation of certain state-owned assets should be seriously considered.
First, … state governments are severely stretched in terms of the revenue they collect.
Second, governments have never been very good at maintaining the assets they own.
Third, often assets owned by government form a monopoly. Monopolies …can lead to inefficiencies, waste and increased costs. Competition with selected government assets can lead to lower costs, more regular maintenance, the adoption of new technology and the more accurate pricing for services.
Finally, privatisation … can often generate money that can be used to reduce debt, as we did in Victoria.2
The arguments (points one and four) about state financing are misleading, as shown by John Quiggin3 among others. However, Kennett’s points two and three go to issues of interest
1 Moore and Porter cited in Cahill D and Beder S (2005) ‘Neo-liberal think tanks and neo-liberal
restructuring: Learning the lessons from Project Victoria and the privatisation of Victoria’s electricity industry’ Social Alternatives, 24(1), 2005, 43-48, p.44 2 Kennett J (2013) ‘Former Victorian premier Jeff Kennett says asset sales make sense but that
Campbell Newman won’t break trust’, The Courier-Mail, 4 March. 3 Most recently see Quiggin J (2013) Privatisation of Queensland electricity assets: A preliminary
evaluation’ unpublished paper at http://dl.dropbox.com/u/29646818/Electricity1303.pdf accessed 19 March 2013.
3
Electricity and privatisation
here. Point three in particular suggests a monopoly is likely to be inefficient, lazy and more expensive, but that will remain the case whether it is in the public or private sector. Nevertheless, the promise here is that privatisation will deliver benefits.
On the other side of politics former Queensland treasurer in the Labor government, Keith De Lacy, is reported to have recently said:
In this day and age there is no compelling case to keep commercial assets in public ownership. They are better off in private hands … It is just a distraction for government and it is inevitably less efficient in government hands’4
Private sector interests tend to agree and the Tatts Group chief Dick McIlwain said:
I think the private sector is more rational. It’s not as compromised in its objectives. Its objectives are clearer. It doesn’t have that political overlay.5
Former NSW Premier Nick Greiner has long been lobbying the NSW government to sell the entire electricity industry although he took a much more cautious approach in government.6 In the meantime former Commonwealth treasurer, Peter Costello, has been urging the Newman government in Queensland to privatise the electricity industry. Costello headed a commission of audit which reported to the Newman government urging the privatisation of state-owned energy and port assets. However, Campbell Newman is quoted as saying, “I’m going to have to be convinced. This is a natural monopoly.”7 Clearly Newman is at odds with Jeff Kennett on that score.
The Productivity Commission notes that a 1989 report by its predecessor, the Industries Assistance Commission, set the agenda for ‘reforming’8 government business enterprises (GBEs) and that was followed up by reports specifically on rail, electricity, water and postal services which it claims:
…demonstrated the importance of improving performance via a range of measures:
the removal of barriers to competition (for example, legislative barriers to
entry) and structural separation of activities to promote competition;
institutional and administrative reforms designed to enhance commercial
focus and accountability;
privatisation, when appropriate, to promote on-going cost reductions; and
4 Ludlow M (2012) ‘Queensland urged to sell power assets’ The Australian Financial Review, 5
November. 5 Ludlow M (2012) ‘Queensland urged to sell power assets’ The Australian Financial Review, 5
November. 6 Clennell A (2011) ‘Impatient Nick Greiner wants the power to build’, The Daily Telegraph, 30 August.
7 Ludlow M (2013) ‘Newman cold on full power sale’, The Australian Financial Review, 6 March. It is
also interesting to note that Costello is now a principle with lobby firm ECG Advisory Solutions along with some of his former staffers. It is understood that ECG will lobby for privatisation work with the Newman government on behalf of corporate clients. For that reason Costello has been referred to the Queensland Crime and Misconduct Commission with an alleged conflict of interest between his work for the government and those business clients who may seek to own state assets. See Daley G (2013) ’Canberra insiders lobby for business’, The Australian Financial Review, 9 March. 8 Quotation marks are used here because ‘reform’ is usually intended to refer to changing something
for the better. But in the case of many recent reforms it is questionable whether things actually improved. For example, ‘reform’ was used to describe some of the industrial relations changes under the Howard government

4
other measures, such as pricing reform.9
The GBE reforms were reinforced with the commitments given by state and territory governments in 1995 as part of the National Competition Policy adopted at the Council of Australian Governments (COAG). As a result, state utilities “have been disaggregated into separate generation, transmission, distribution and retail supply entities, corporatised and, in some jurisdictions, sold to the private sector”.10 On top of all that competitive wholesale and retail markets were introduced in 1994 and in 1998 the National Electricity Market was established which now links all states and territories except for WA and the NT.
Given that background it is important to question how that agenda has played out in practice now that much of the sector has been corporatised and/or privatised. Did the reform agenda work as intended and how does that square with the recent debates about electricity and other cost of living pressures? One would have to expect that corporatisation and privatisation as well as participation in the national market could have increased some costs as state entities adopted the trappings of the corporate sector. The expertise needed to survive in a more deregulated and commercial environment has to be purchased. However, the very rationale of the reform agenda was that overall costs would fall to the benefit of consumers and business.
Of course there is always the risk that in a market with only a small number of players, price competition is avoided and the competitors engage in various forms of non-price competition. For example, Coke and Pepsi compete heavily but it is almost completely an advertising war. Later we report on some data that suggests electricity suppliers have invested heavily in sales teams and other resources and, of course, those costs are recovered from consumers.
Prices
The cost of electricity has generated a good deal of concern and ABS figures show electricity prices increased by 170 per cent in the period March 1995 to December 2012. In the meantime the consumer price index (CPI) increased by a more modest 60 per cent over the same period,11 implying that electricity prices have increased by almost four times the CPI. The graph in Figure 1 shows the average cost of electricity and the cost of all groups in the CPI going back to March 1995. To enable comparison the index for all groups and electricity is set at 100 for March 1995.
9 Productivity Commission (2003) From industry assistance to productivity: 30 years of ‘the
Commission’, Productivity Commission, Canberra, p. 76. 10
ABS (2008) Electricity, gas, water and waste services, Australia, 2006-07, Cat no 8226.0, 9 July. 11
ABS (2013a) Consumer Price Index, Australia, Dec 2012, Cat no 6401.0, 23 January. The figures refer to the average of the eight capital cities.

5
Electricity and privatisation
Figure 1: Electricity retail price index and CPI, Mar 1995 = 100
Source: ABS (2013a) Consumer Price Index, Australia, Dec 2012, Cat no 6401.0, 23 January.
Figure 1 clearly shows that the electricity component of the CPI has increased much more than the overall CPI. Over the period covered in the graph electricity prices increased by 170 per cent while the CPI increased by a modest 60 per cent. The increased electricity prices have been blamed on the carbon tax, which had effect from July 2012. However, the increase since then, at 15 per cent, is a fraction of the total increase over the period shown in Figure 1. Also, as Figure 1 makes clear, electricity prices had been rising steeply well before the carbon tax. Indeed, the graph for electricity seems to show costs increasing more rapidly the further we move into the reform period and beyond.
When Jeff Kennett made the comments cited above he also said:
…while prices for energy have risen in Victoria, as has everything else, they have risen less there than other states.12
This last proposition is easily examined, as CPI data from the ABS is broken down by capital cities. Jeff Kennett’s government was elected in October 1992. In the previous quarter (September 1992) the electricity index for Melbourne stood at 42.0 compared with the average of the eight capitals at 41.4. In December 2012 the Melbourne index stood at 118.1 and the Australian at 116.4; by coincidence both increased by 181.2 per cent exactly. Of course this sort of result can be sensitive to the exact start and finish dates so the actual figures going back to 1990 are plotted in Figure 2.
12
Kennett J (2013) ‘Former Victorian premier Jeff Kennett says asset sales make sense but that Campbell Newman won’t break trust’, The Courier-Mail, 4 March
0
50
100
150
200
250
300
Mar
-95
May
-96
Jul-
97
Sep
-98
No
v-9
9
Jan
-01
Mar
-02
May
-03
Jul-
04
Sep
-05
No
v-0
6
Jan
-08
Mar
-09
May
-10
Jul-
11
Sep
-12
electricity
All groups
6
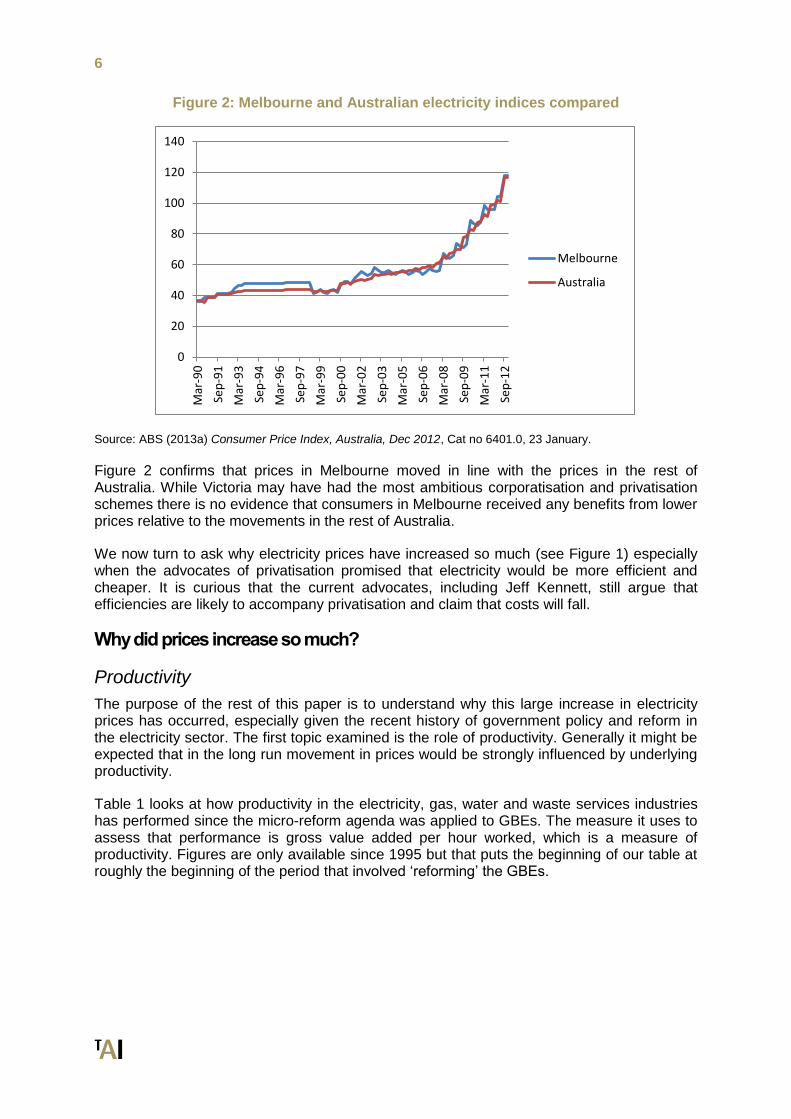
Figure 2: Melbourne and Australian electricity indices compared
Source: ABS (2013a) Consumer Price Index, Australia, Dec 2012, Cat no 6401.0, 23 January.
Figure 2 confirms that prices in Melbourne moved in line with the prices in the rest of Australia. While Victoria may have had the most ambitious corporatisation and privatisation schemes there is no evidence that consumers in Melbourne received any benefits from lower prices relative to the movements in the rest of Australia.
We now turn to ask why electricity prices have increased so much (see Figure 1) especially when the advocates of privatisation promised that electricity would be more efficient and cheaper. It is curious that the current advocates, including Jeff Kennett, still argue that efficiencies are likely to accompany privatisation and claim that costs will fall.
Why did prices increase so much?
Productivity
The purpose of the rest of this paper is to understand why this large increase in electricity prices has occurred, especially given the recent history of government policy and reform in the electricity sector. The first topic examined is the role of productivity. Generally it might be expected that in the long run movement in prices would be strongly influenced by underlying productivity.
Table 1 looks at how productivity in the electricity, gas, water and waste services industries has performed since the micro-reform agenda was applied to GBEs. The measure it uses to assess that performance is gross value added per hour worked, which is a measure of productivity. Figures are only available since 1995 but that puts the beginning of our table at roughly the beginning of the period that involved ‘reforming’ the GBEs.
0
20
40
60
80
100
120
140
Mar
-90
Sep
-91
Mar
-93
Sep
-94
Mar
-96
Sep
-97
Mar
-99
Sep
-00
Mar
-02
Sep
-03
Mar
-05
Sep
-06
Mar
-08
Sep
-09
Mar
-11
Sep
-12
Melbourne
Australia

7
Electricity and privatisation
Table 1: Performance of electricity, gas and water
Index of hours worked; Electricity, gas, water and waste services.
Index of hours worked; All industries
Index of gross value added; Electricity, gas, water and waste services.
Index of gross value added; All industries
Jun-1995, 100 100 100 100
Jun-2012, 168.4 133.2 75.1 133.6
Increase 68.4% 33.2% -24.9% 33.6%
Source: ABS (2012) Australian System of National Accounts, 2011-12, Cat no 5204.0, 2 November.
In the period 1995 to 2012 the gross value added per hour of work of all industries in Australia increased by 33.6 per cent. That is equivalent to 1.7 per cent per annum. By contrast productivity in electricity, gas and water slumped with gross value added per hour worked falling by 24.9 per cent over that period. While the number of hours worked in Australia over that period increased by 33.2 per cent overall, the number of hours worked in electricity gas and water increased by more than double this amount (68.4 per cent).
A recent study by the Productivity Commission pointed to a number of factors that might have been responsible for the slump in productivity in the electricity sector.13 This study attributed the slump in productivity to:
The increased use of air conditioners and other factors, which implies an increase in
the difference between average and peak electricity use and so increases the need
for spare capacity to meet peak needs.
Cyclical investment in large capital assets ahead of growth in output.
A shift to underground cabling, which increases costs.
The move away from coal-fired generators to higher cost sources, including
renewables.
Some of those factors could play a role in explaining the slump in multifactor productivity that the Productivity Commission was interested in. For example, investment factors should increase labour productivity as should the move away from coal-fired generators that require handling of the coal and maintaining the equipment that moves coal around inside the plant. Generally the Productivity Commission’s ‘explanation’ is to suggest the output has changed; a change in the peak-to-average ratio, less visual pollution and ‘greener’ energy. If the nature of the output has changed it suggests that standard productivity measures may no longer be valid; if there is a greater mix of peak load for example then the nature of the output has changed and it may be more expensive to supply that different mix. However, the Productivity Commission seems to have settled on those explanations and does not question whether or not the reform agenda itself may have played a role. In particular they failed to consider a rather simple explanation, namely that the industry now employs a lot more people with no role in actually generating electricity and that this might explain a lot of the dramatic fall in output per worker. It is now important to consider the nature of the labour inputs in the electricity, gas and water industries.
13
Topp V and Kulys A (2012) ‘Productivity in electricity, gas and water: Measurement and interpretation’, Productivity Commission Staff Working Paper, Canberra, March.

8
Labour inputs
There appear to be some data sources missed by the Productivity Commission which are apparent on inspection of the ABS data on employment by occupation in the electricity, gas and water sector. Those figures are summarised in Table 2 which breaks down the electricity, gas and water labour force figures into occupations.
Table 2: Electricity, gas, water and waste services; employed workers by occupation
Aug 1997 Aug 2002 Aug 2007 Aug 2012
Increase, 1997 to 2012, %
Managers 6,000 8,000 13,000
19,000
217
Professionals 11,000 16,000 17,000 32,000 191
Technicians and Trades Workers 25,000 20,000 23,000 32,000 28
Community and Personal Service Workers 9,000 10,000 1,000 0 -100
Clerical and Administrative Workers 16,000 18,000 19,000 31,000 94
Sales Workers 1,000 1,000 3,000 6,000 500
Machinery Operators And Drivers 9,000 6,000 16,000 18,000 100
Labourers 4,000 6,000 9,000 11,000 175
Total 80,000 84,000 101,000 149,000 86
Memo item – Total employment Australia (million)
8.39 9.31 10.62 11.50 37
Source: ABS (2012) Labour Force, Australia, Detailed, Quarterly, Aug 2012, Cat no 6291.0.55.003, 13
September.
A striking aspect of Table 2 is the rapid increase in occupations that do not actually do the work of making electricity or gas and water. For example, the number of sales workers increased from 1,000 to 6,000 over this period. Competition may well be beneficial in theory but it means the firms themselves have to put resources into selling a product. It seems remarkable that a sales force of 6,000 people is necessary to sell undifferentiated homogenous products like electricity, gas and water, yet this is a consequence of corporatisation and privatisation as well as the introduction of new trading schemes.
The number of managers also increased from 6,000 to 19,000, an increase of 217 per cent. In 1997 there was a manager for every 13 workers but by 2012 there was a manger for every nine workers. On the face of it that seems very wasteful. The large increase in clerical and administrative workers may reflect such things as the duplication of billing systems, human resource sections and so on as government enterprises are broken up into smaller ‘businesses’. It is not immediately obvious why the industry would need more clerical and administration workers unless it is the consequence of corporatisation, privatisation and new trading systems.
The increase in the number of machinery operators and drivers as well as labourers may well be the result of factors such as putting cables underground and other factors that make the
9
Electricity and privatisation
delivery of electricity more difficult, but those people account for a small increase in the total numbers.
However, it is interesting that the biggest category of workers in the early years, and the category we would normally associate with electricity, gas and water in particular, is ‘technicians and trade workers’. This group increased by 28 per cent, roughly in line with the 27 per cent increase in value added implied by Table 1. However, their numbers, which increased in absolute terms, actually fell as a share of the workforce from 31 per cent to 21 per cent over the period examined here.
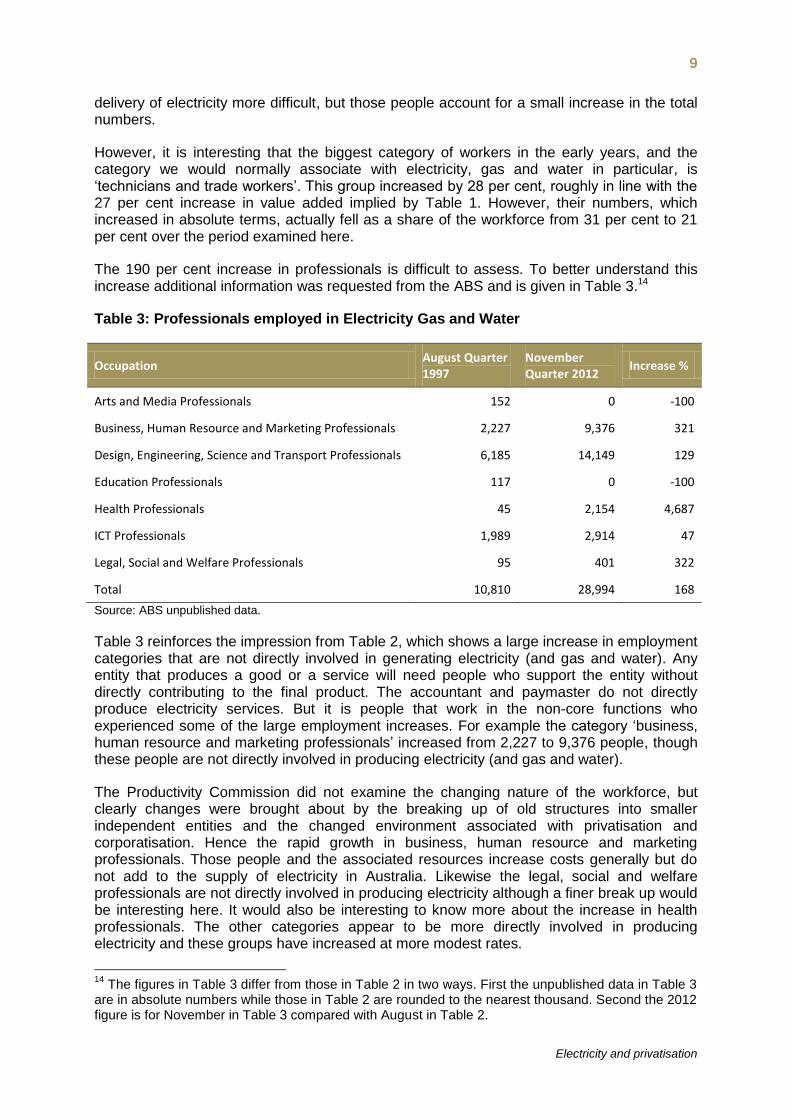
The 190 per cent increase in professionals is difficult to assess. To better understand this increase additional information was requested from the ABS and is given in Table 3.14
Table 3: Professionals employed in Electricity Gas and Water
Occupation August Quarter 1997
November Quarter 2012
Increase %
Arts and Media Professionals 152 0 -100
Business, Human Resource and Marketing Professionals 2,227 9,376 321
Design, Engineering, Science and Transport Professionals 6,185 14,149 129
Education Professionals 117 0 -100
Health Professionals 45 2,154 4,687
ICT Professionals 1,989 2,914 47
Legal, Social and Welfare Professionals 95 401 322
Total 10,810 28,994 168
Source: ABS unpublished data.
Table 3 reinforces the impression from Table 2, which shows a large increase in employment categories that are not directly involved in generating electricity (and gas and water). Any entity that produces a good or a service will need people who support the entity without directly contributing to the final product. The accountant and paymaster do not directly produce electricity services. But it is people that work in the non-core functions who experienced some of the large employment increases. For example the category ‘business, human resource and marketing professionals’ increased from 2,227 to 9,376 people, though these people are not directly involved in producing electricity (and gas and water).
The Productivity Commission did not examine the changing nature of the workforce, but clearly changes were brought about by the breaking up of old structures into smaller independent entities and the changed environment associated with privatisation and corporatisation. Hence the rapid growth in business, human resource and marketing professionals. Those people and the associated resources increase costs generally but do not add to the supply of electricity in Australia. Likewise the legal, social and welfare professionals are not directly involved in producing electricity although a finer break up would be interesting here. It would also be interesting to know more about the increase in health professionals. The other categories appear to be more directly involved in producing electricity and these groups have increased at more modest rates.
14
The figures in Table 3 differ from those in Table 2 in two ways. First the unpublished data in Table 3 are in absolute numbers while those in Table 2 are rounded to the nearest thousand. Second the 2012 figure is for November in Table 3 compared with August in Table 2.
10
Based on recent ABS earnings data15 the increase in the costs of some of the ‘unnecessary’ labour can be estimated. The increase in employment in sales workers, managers and the professionals mentioned above would have increased direct cash costs by around $1.2 billion. The total cost with the various on-costs such as super and workers’ compensation insurance, is likely to increase that cost to at least $1.5 billion without taking into account the accommodation for those groups.
Overall it does seem that the figures here suggest that the ‘reforms’ beginning in the 1990s may well have stifled productivity in the electricity, gas and water industry by loading up the industry with functions that are not its core business. Although we recognise this industry still has a much higher productivity than the rest of the Australian economy, that productivity would have likely been higher without the history of corporatisation and privatisation. In electricity, value added was $332,000 per worker in 2006-0716 which compares with the Australia-wide figure of $104,000 in that year.17
Asset value inflation
In parallel with the increased labour costs associated with the non-core functions that have been taken on by the industry there are likely to be increased capital servicing costs associated with privatisation. Private buyers tend to pay a good deal more than the value of the plant and equipment is worth because the business has the potential to earn monopoly or near-monopoly profits. In addition, when companies are privatised the new owners often borrow huge amounts to finance their acquisitions. Those debts are usually rolled into the new entity so that the new entity is lumbered with a huge new expense, the interest expense. In addition the new owner can legitimately claim depreciation and amortisation expenses on their capital asset values.
If we take Hazelwood for example, it was commissioned between 1964 and 1971 and is described as ‘one of the oldest power stations still operating in Australia and has the highest level of greenhouse gas emissions per [unit] of generation’.18 The Kennett government sold it in 1996 for $2.4 billion. However, by that time the asset value of the Hazelwood plant is likely to have been pretty well written down to next to nothing. Electricity generation and related assets have a maximum depreciation life of 30 years or often much less.19 Hazelwood was not expected to be operating after the turn of the century.20 Hence the $2.4 billion sales price is likely to have been very much higher than the value of the plant on the books of the Victorian government. Likewise any depreciation and residual financing costs associated with the Hazelwood plant are likely to have been very low. However all that changes with privatisation. The asset price increases because the new purchaser knows that the plant is likely highly profitable, especially when the government sets prices designed to attract investors and the regulators are going to allow the private companies to pass on financing costs as well as depreciation and amortisation. The end effect, which we might call ‘asset price inflation’, will have a consequent impact on the costs to consumers. Of course while privatisation is associated with asset price inflation, so too is corporatisation – when assets are revalued and the organisation is required to make a commercial return on the revalued assets. The new owners – in Hazelwood’s case the new owner is International Power plc –
15
ABS (2013b) Employee earnings and hours, Australia, May 2012, Cat no 6306.0, 23 January. 16
ABS (2008) Electricity, gas, water and waste services, Australia, 2006-07, Cat no 8226.0, 9 July. 17
ABS (2012) Australian System of National Accounts, 2011-12, Cat no 5204.0, 2 November and ABS (2012) Labour Force, Australia, Detailed, Quarterly, Aug 2012, Cat no 6291.0.55.003, 13 September. 18
Green Energy Markets (2010) Fast-tracking Victoria’s clean energy future to replace Hazelwood Power Station: A report by Green Energy Markets for Environment Victoria, May. 19
The latest depreciation schedule is given at Australian Taxation Office (2010) Tax Ruling TR 2010/2 accessed 19 March 2013. 20
Green Energy Markets (2010) Fast-tracking Victoria’s clean energy future to replace Hazelwood Power Station: A report by Green Energy Markets for Environment Victoria, May.
11
Electricity and privatisation
are going to want a commercial rate of return on the $2.4 billion sales price and will want to earn a profit on top of this in addition to meeting their depreciation and amortisation expenses.21
The impact of asset price inflation can be seen in the figures for electricity supply in Australia. In the last period for which the ABS collected the information, 2006-07, total electricity sales were $31.2 billion with interest expenses at $4.0 billion, and depreciation and amortisation at $3.8 billion.22 On top of that the operating profit before tax was $5.1 billion. All up $12.9 billion or 41 per cent of the sales price represents costs or profits that are likely to be substantially higher than they need to be because of the history of privatisation and corporatisation.
So we have a vicious circle. Electricity assets, like any monopoly assets that can be used to charge whatever the market will bear, are very valuable. Given the potential profit to be made buyers will borrow large amounts to fund their purchases and make winning bids. However, once they do that there is a new interest expense that has to be honoured by the new companies. Likewise depreciation and amortisation expenses increase dramatically. That means the whole cost structure is much higher than under government ownership. Hence asset price inflation is likely to be a major contributor to higher electricity prices.
Conclusion
The advocates of electricity reforms in the 1990s and since have argued for privatisation, corporatisation and competition with the promise of a more efficient industry and lower costs. The pervasive nature of this advocacy suggests there should be some solid evidence by now, especially with two decades of experience of these ‘reforms’ behind us.
Despite the promise of lower prices and a more efficient industry, electricity prices instead have been a major cause for concern on the part of Australian consumers. Over the period since March 1995 electricity prices have outpaced the CPI with an increase of 170 per cent compared with an increase of 60 per cent for the CPI.
One of the factors that is bound to be implicated in the relative increase in electricity prices is the slump in productivity in the sector. The data we have to use is often contaminated because gas and water are included in the one industry by the ABS so we are forced to consider electricity, gas and water as a whole. Nevertheless the results show that labour productivity has slumped in the industry. Over the period June 1995 to the present, productivity across all industries in Australia increased by 33.6 per cent. However, in electricity, gas and water, productivity actually declined by 24.9 per cent. On the face of it, output per worker fell markedly in electricity while it increased in most of the rest of the economy. This is a major adverse finding for an industry that has supposedly been the subject of an enormous reform effort on the part of Australian governments.
Other explanations have been put for the slump in electricity’s productivity and those explanations may well go part of the way towards a full explanation. However, to date it seems there has been little examination of some of the consequences of privatisation and the reform agenda more generally. Some clues to a more complete explanation are found in the labour market data on the categories of workers found in the electricity industry.
21
This is likely to have been the case in the early years. By now much of the capital may have been returned to the new owner, much debt repaid and the remaining asset value written down considerably. 22
ABS (2008) Electricity, Gas, Water and Waste Services, Australia, 2006-07, Cat no 8226.0, 9 July.
12
One of the consequences of privatisation and the split of traditional electricity entities into smaller units seems to have been an increase in the number of managers by 217 per cent since 1997. At the beginning there was a manager for every 13 workers but that had fallen to a manager for every nine workers by 2012. A doubling in the number of clerical and administrative workers may have been in part a consequence of the need to look after the increase in management numbers. Privatisation and the increasing reliance on the market also seem implicated in the increase in sales workers from 1,000 to 6,000. Among the professional workers there was a dramatic increase from 2,227 to 9,376 workers described as ‘business, human resource and marketing professionals’. It is not difficult to understand why this happened; each time a separate entity was hived off it would have needed its own human resources section, a new billing operation and of course a new corporate affairs section. These are some of the consequences of the privatisation and associated policies that were supposed to increase efficiencies and drive down prices.
By contrast there was a much smaller increase in the sort of people who actually do the work of producing electricity. For example, the number of technicians and trades workers increased by 28 per cent, in line with the increase in the value added in this industry. Generally the privatisation and reform agenda seems to have generated a large increase in the labour required in the electricity industry, but the large increases experienced were in workers engaged in non-core activities.
Another factor that may well explain a good deal of the increase in electricity costs is the ‘asset price inflation’ involved in the privatisation process. Private buyers are willing to pay a good deal more than the value of the plant and equipment because of the potential profitability involved in buying a business with monopoly pricing power. However, for the new owner there is now an objective need to increase prices to earn a competitive return on the inflated asset price as well as to cover depreciation and amortisation expenses. In this way privatisation directly increases the capital servicing costs associated with electricity supply.
13
Electricity and privatisation
References
ABS (2008) Electricity, Gas, Water and Waste Services, Australia, 2006-07, Cat no 8226.0, 9 July.
ABS (2012) Australian System of National Accounts, 2011-12, Cat no 5204.0, 2 November.
ABS (2012) Labour Force, Australia, Detailed, Quarterly, Aug 2012, Cat no 6291.0.55.003, 13 September.
ABS (2013a) Consumer Price Index, Australia, Dec 2012, Cat no 6401.0, 23 January.
ABS (2013b) Employee earnings and hours, Australia, May 2012, Cat no 6306.0, 23 January.
Australian Taxation Office (2010) Tax Ruling TR 2010/2 accessed 19 March 2013.
Cahill D and Beder S (2005) ‘Neo-liberal think tanks and neo-liberal restructuring: Learning the lessons from Project Victoria and the privatisation of Victoria’s electricity industry’ Social Alternatives, 24(1), 2005, 43-48
Clennell A (2011) ‘Impatient Nick Greiner wants the power to build’, The Daily Telegraph, 30 August.
Daley G (2013) ’Canberra insiders lobby for business’, The Australian Financial Review, 9 March.
Green Energy Markets (2010) Fast-tracking Victoria’s clean energy future to replace Hazelwood Power Station: A report by Green Energy Markets for Environment Victoria, May.
Kennett J (2013) ‘Former Victorian premier Jeff Kennett says asset sales make sense but that Campbell Newman won’t break trust’, The Courier-Mail 4 March
Ludlow M (2012) ‘Queensland urged to sell power assets’ The Australian Financial Review, 5 November.
Ludlow M (2013) ‘Newman cold on full power sale’, The Australian Financial Review, 6 March.
Productivity Commission (2003) From industry assistance to productivity: 30 years of ‘the Commission’, Productivity Commission, Canberra
Quiggin J (2013) Privatisation of Queensland electricity assets: A preliminary evaluation’ unpublished paper
Topp V and Kulys A (2012) ‘Productivity in electricity, gas and water: Measurement and interpretation’, Productivity Commission Staff Working Paper, Canberra, March.