Embed Size (px)
Citation preview
Electricity Intensities of the OECD and South Africa:
A Comparison
R. Inglesi-Lotz and J. Blignaut
Working paper 204
February 2011
Electricity intensities of the OECD and SouthAfrica: A comparison
R. Inglesi-Lotz∗and J. Blignaut†
February 21, 2011
Abstract
Improving a country’s electricity efficiency is considered one of the important ways to reduceits greenhouse gas emissions and to meet its commitments concerning climate change mitigation.In this paper, we conduct a comparative analysis between South Africa and OECD members’total and sectoral electricity intensities. This is done to establish a sense of South Africa’srelative performance in this regard, to ascertain the possible scope for improvement and, if suchscope exists, to determine in which of the industrial sectors.
1 IntroductionImproving the electricity efficiency of a country is an important step towards decreasing greenhousegas emissions originating from fossil fuelbased electricity generation and consumption. Studying theintensity of electricity use (the quantitative measure of electricity efficiency) is important from anenergy policy-making perspective since it is a measure that combines electricity consumption witheconomic output (Liddle 2009). It is equally imperative for the energy authorities to understand howelectricity demand will change under conditions of structural change in the economy (Markandya,Pedroso-Galinato & Streimikiene 2006).A large number of studies have been conducted to identify the dynamics, determinants and
characteristics of electricity intensity in developed and developing economies (Zhao, Ma & Hong2010; Mendiluce, Pérez-Arriaga & Ocaña 2010; Andrade Silva & Guerra 2009; Tiwari 2000). Thesestudies indicate that electricity intensity first increases as a consequence of rising economic growthand development, but subsequently falls as a result of a shift to a services-based economic structure(Medlock III & Soligo 2001). This trend can be compared to the famous environmental Kuznetscurve (Gergel et al. 2004; Baker 2003), but applied to electricity intensity. A general policy objectiveis to ‘tunnel through’ the curve and hence the need to compare one’s own position relative to theobjective. This is to be followed by policies to achieve such tunnelling.Here we seek to answer the question whether South Africa follows international trends regarding
electricity intensity. We do this by conducting a comparison between South Africa’s national andsectoral electricity intensities and the equivalents thereof for the member countries of Organisationfor Economic Co-operation and Development (OECD).This exercise will indicate whether there is any scope for improvement in South Africa, on both
a national and a disaggregated, sectoral level. This layered approach has at least two benefits.Firstly, the economic sectors of a country have dissimilar economic and energy characteristics andit is therefore important to understand these differences (Inglesi & Blignaut 2010). Secondly, notall economies produce the same basket of goods in the same proportion. Hence, there is a need to
∗Department of Economics, University of Pretoria, South Africa. Corresponding author.†Department of Economics, University of Pretoria, South Africa.
1
examine the country’s electricityintensity profiles on a sectoral level to be able to make comparisonsas well as to use the example of successful case studies (Weber 2009).The next section of this paper introduces the meaning of electricity efficiency and intensity and
describes current levels of electricity efficiency in South Africa. This is followed by the descriptionof the data used and an international electricityintensity comparison on both a national and adisaggregated level. Finally, we conclude with a discussion of the findings.
2 Background
2.1 Electricity efficiency and intensity
The definition of energy (sic. electricity) efficiency seems to be complex and depends largely on thecontext within which the term is being used. An economist, a politician and a sociologist may havedifferent opinions in defining the energy efficiency. When the Energy Information Administration(EIA) (1999) asked participants in workshops to define ‘energy efficiency’, the answers varied, rangingfrom a service to a mechanistic perspective. The World Energy Council (2008:9), however, providesthe following guiding definition:Energy efficiency improvements refer to a reduction in the energy used for a given service (heat-
ing, lighting, etc.) or level of activity. The reduction in the energy consumption is usually associatedwith technological changes, but not always since it can also result from better organisation and man-agement or improved economic conditions in the sector (‘non-technical factors’).The importance of electricity efficiency cannot be overstated. Policies to this effect have been
accepted globally, as it is seen as one of the most economical ways towards the reduction or slowingdown of the increasing energy demand as well as its cost and environmental effects. Repetto andAustin (1997) further demonstrate the significance of electricity efficiency improvement for positiveresults not only in the energy sector and the environment but also in the economy as a whole. Inorder to measure electricity efficiency, the EIA (1999) proposes two methods: the so-called market-basket approach and the comprehensive approach. The first approach refers to the estimation of theenergy consumption for a set of electricity services based on their share in an index computed as theIndex of Industrial Production. The second approach refers to the estimation of broader indicatorsand is an assessment of the changes that are not connected with electricity efficiency directly.In contrast to the above, Mukherjee (2008) proposes a measurement approach from a production-
theoretic perspective. His measurement models are founded on the objectives of energy managementand cost minimisation as well as the capacity output of the economy. The conceptual difficulty inthe analysis of energy efficiency, according to Bosseboeuf et al. (1997), is that the evaluation andprogress thereof is made after the implementation of energy efficiency policies. There is thereforea temporal, and even spatial, decoupling of the policy and its implementation, and that which ismeasured and observed later. This also complicates comparison among countries. Bosseboeuf et al.(1997) therefore make an effort to focus on the convergence of energyefficiency indicators globallyby classifying the indicators used in the literature as follows:
• Macro-indicators versus micro-indicators: Macro-indicators are linked with the economy in itsentirety or its main sectors. From a micro-perspective, the indicators are concerned with thelevel of the main end-users such as companies or households.
• Ratios versus quantities: Ratios such as energy use per GDP or quantities such as variationsin the demand for energy are both used in the literature.
• Descriptive versus explanatory indicators: The descriptive indicators explain the energy-efficiency situation and progress; conversely, the explanatory indicators describe the factorsresponsible for the evolution.
2
Following from the above, energy efficiency is therefore often measured in terms of the change inenergy intensity in an effort to describe more accurately its quantitative nature. Energy intensity, inturn, is defined as the ratio of energy consumption to a unit of measurement (e.g. floor space, house-holds, number of workers, GDP per capita) (EIA 1999). In response to Freeman et al. (1997), whocritically assess the commonly used energy intensity indicators for analysis particularly of the indus-trial sector, Andrade-Silva and Guerra (2009) argue that there are six possible ways of calculatingenergy intensity. The existence of different measures is based on the definition of energy intensity asenergy consumption (numerator) divided by the production or economic activity (denominator) ofthe economy. Energy consumption can be measured according to its thermal equivalence (in joule),or in economic terms (price). Accordingly, the economic activity of a country can be measured asthe value added or value of delivered goods (production value minus the value of inventories) orproduction value (Andrade-Silva & Guerra 2009). Therefore, the proposed measures in accordancewith Bor (2008) are:
1. Thermal equivalence/added value
2. Thermal equivalence/value of delivered goods
3. Thermal equivalence/production value
4. Economic measure/added value
5. Economic measure/value of delivered goods
6. Economic measure/production value
Andrade-Silva and Guerra (2009:2590) also state:...even when the physical measures can be used at the desired levels (disaggregated and aggregated),
the economic nature measures emerge more strongly within the upper aggregation levels. This featureleans on favouring the establishment of a standard consumption measure per national production unitsuch as the joule (J) per US$ of GDP.Based on this, we have decided to standardise the definition of electricity intensity for our analysis
as follows:
Electricity intensity =Electricity consumption
output(1)
This is a common definition also used by Mukherjee (2008), Choi and Ang (2003), Sun and Ang(2000).
2.2 Electricity intensity: The South African case
Following the political transition in 1994, the new democratically elected South African governmentconsidered energy issues to be of great importance for the economic development of the country. Inthe first White Paper on Energy Policy (DME 1998), energy efficiency was mentioned among thecross-cutting issues. More specifically for the industrial and commercial sectors, the governmentcommitted itself to the following:
• Promotion of energy-efficiency awareness
• Encouragement of the use of energy-efficiency practices
• Establishment of energy-efficiency standards for commercial buildings
• Monitoring the progress
3
While progress on these was slow due to pressing socio-economic and development considerationsthe South African Department of Minerals and Energy released its first Energy Efficiency Strategy in2005 (DME 2005). The purpose of the Strategy was to provide a policy framework toward affordableenergy for all and diminish the negative consequences of the extensive energy use in the country.Its national target for electricity efficiency was to improve efficiency by 12% by 2015. It is concededin the document that this target can be questioned and challenged, but the target was set in lightof the fact that the country was the seventh biggest emitter of greenhouse gases on a per capitabasis (Sebitosi 2008) the national electricity intensity was almost twice the average of the OECDcountries, and that efficiency improvements are a necessity. It however has had limited impact todate and is currently being revised. This is clearly illustrated in Figure 1.Figure 1 shows the economy-wide electricity intensity and its growth for the period 1994—2006.
Total electricity intensity showed a sharp upward trend until 2004. This trend was broken in 2005when intensity declined by 8.4% mainly as a result of a small decline of electricity consumption by5.4% (South Africa 2004—2006). By and large, however, the trend is strongly upward. However, if theresidential, commercial and non-classified electricity consumption is excluded from the calculation,a lower intensity is observed, with the growth not being as steep as before.See Figure 1 below.Large inter-sectoral variations exist, however, as can be seen in Table 1. In the first column,
the sectors are ranked based on their electricity-intensity levels from the more intensive to the moreefficient in 2006. This is contrasted with the sector’s contribution or share to output and its relativeranking. (See table 2 below).The three most electricity-intensive sectors in 2006 were ‘basic metals’ (which includes ‘iron and
steel’ and ‘non-ferrous metals’), ‘mining and quarrying’ and ‘non-metallic minerals’, while ‘agricul-ture and forestry’ was fourth in the ranking. The ‘construction’, ‘transport equipment’, ‘machineryand equipment’ and ‘food and tobacco’ sectors were the most electricity-efficient sectors of theeconomy.Various anomalies, however, exist when comparing the relative size of the sector to its electricity
efficiency. The largest sector, ‘chemical and petrochemical’, has the sixth highest intensity, whereas‘basic metals’, the most electricity-intense sector, is only seventh in size. ‘Mining and quarrying’, onthe other hand, is second both in terms of size and intensity. Therefore, there clearly are inter-sectoraldifferences that can and should be ascribed? to sectoral characteristics and that have to be takeninto account when considering any electricity-efficiency plan. Given this general information, howdoes South Africa compare, both on a national as well as sectoral level, with the OECD countries?We turn to this next.
3 Research method and dataSeveral studies concerned with inter-country comparison of electricity intensities have been con-ducted (Schipper et al. 1997; ECE 1996; IEA 1994; Bosseboeuf et al. 1997). These studies have,however, encountered certain difficulties, namely:
1. the heterogeneous definition of variables,
2. the ratios to calculate electricity intensity differ from country to country, and
3. the diverse interpretations of the ratios calculated.
We tried to avoid these problems by estimating the electricity intensities for each country usingthe same definition (i.e. electricity consumption/gross domestic product (GDP)) and the samedataset.The group of OECD countries is selected for four distinct reasons: a) among the OECD coun-
tries, there is a group (admittedly a small minority) of developing countries (according to IMFclassification); b) South Africa should be compared with international ‘best practice’ in order to
4
have the opportunity to learn and improve; c) the country’s major trading partners as well as tradecompetitors are included in the OECD panel, hence South Africa needs to be compared against theirindustrialisation levels and their sophisticated energy sectors, and d) South Africa has mixed char-acteristics resembling those of both developing and developed countries alike. This is also recognizedby the U.S. Department of State (2010) which argues that the country has a two-tiered economy:‘..one rivalling other developed countries and the other with only the most basic infrastructure’. Themain aim however is not to be good among the developing countries, but to be good overall. Be-ing compared with developed countries in energy matters is therefore appropriate given that SouthAfrica’s energy and industry sectors resemble those of the OECD.Moreover, South Africa is one of the many non-member economies with which the OECD has
working relationships in addition to its member countries. The OECD Council at Ministerial leveladopted a resolution in 2007 to strengthen the co-operation with South Africa through a programmeof enhanced engagement. While enhanced engagement is distinct from accession to the OECD, ithas the potential in the future to lead to membership. This makes South Africa a unique case of adeveloping economy that is not far from being considered a developed one.Also, this group’s data and definitions are consolidated under one umbrella organisation. This
limits the risk of data inconsistencies.The data for electricity consumption (total and sectoral) were obtained from the OECD’s Energy
balances for OECD countries (OECD 2009a) and for South Africa from Energy balances for non-OECD countries (OECD 2009b). The national GDP data (in current prices), the consumer priceindex (base year 2000) and the Power Purchasing Parity (PPP) adjusted real exchange rate valuesfor all the countries were derived from the World Economic Outlook April 2010 of the InternationalMonetary Fund (IMF). The disaggregated data for output for OECD members were derived fromthe STAN Database for Structural Analysis of OECD.
4 Comparative analysis
4.1 Comparing South Africa to OECD averages
In 1980 South Africa’s electricity intensity was substantially lower than that of OECD countries (seeFigure 2). This is to be expected given the high level of welfare enjoyed by a minority of peoplebased on an industrial sector that services only a few, with limited focus on exports at that pointin time.See Figure 2.The country’s electricity use rose sharply since the early 1990s with the abolishment of sanctions,
the internationalisation of the markets to international trade, and the more stable economic andpolitical situation after the first democratic elections in 1994. Since the 1990s, however, the electricityintensity in South Africa kept rising at an alarming rate and currently far exceeds that of the OECDcountries, with no sign of any change. While the OECD countries kept their average electricityintensity relatively constant, in the range of 0.34-0.35 GWh/$ million (PPP adj.) over the period1990 to 2007, South Africa’s electricity intensity almost doubled from 0.329 in 1990 to 0.657 in 2000and increased even further to 0.694 (2006) and 0.713 (2007).In the same figure, we extracted the developing economies of the OECD group (Hungary, Poland,
Mexico and Turkey) and weight their average against South Africa for a better view of the country’sposition in comparison with emerging economies. South Africa’s electricity efficiency was signif-icantly higher than that of the average of the OECD developing economies, through the years.Although they also showed a substantial increase from 1990 to 2000 (536.5%), the starting point of1990 was significantly lower than that of South Africa.
5
4.2 South Africa and OECD member states: An economy-wide compari-son
Following this analysis, we disaggregate the OECD average to examine how South Africa compareswith the OECD countries individually over the study period. The economy-wide percentage changeof electricity intensity for the period 1990 to 2007 as well as the electricity intensity of 2007 for theOECD members and South Africa is presented in Figure 3. It should be noted that Poland, Hun-gary, Mexico and Turkey were outliers (hence, excluded from the figure) with changes in electricityintensity for the examined period of 382%, 401%, 493% and more than 1,000% (from 0.0006 in 1990to 0.723 in 2007) respectively. Also, the Czech and Slovak Republics were excluded due to lack ofdata points for 1990. For a comparison of only the OECD developing economies see Figure 3b.From Figure 3a it is clear that South Africa has shown an increase in electricity intensity of 117%
over the study period. This is in sharp contrast to the average of the OECD members (excludingPoland, Hungary, Mexico Turkey, Slovakia and Czech Republic), which was only 10.09%. Only theMediterranean countries (Spain, Greece, Portugal and Italy) as well as Korea and Iceland experiencedan increase in their electricity intensities. Both their output and electricity consumption increasedsubstantially, but the increase in consumption was higher than the growth in output. All the othercountries’ intensity levels declined over the study period, indicating remarkable improvements inelectricity efficiency.A further remarkable trend can be observed from Figure 3a There is a statistically significant
negative, or inverse, relationship between the level of electricity intensity in 1990 and its growth overthe study period. (See the Appendix for statistical results on the significance of the relationship.)This implies that, generally speaking, the higher the electricity intensity of a country in 1990, themore negative its growth was from 1990 to 2007 Countries such as Norway, Canada and Sweden, whowere the most electricity intensive in 1990, were the ones that managed to decrease their intensityof electricity usage meaningfully, namely by 32%, 24% and 30% respectively.On the contrary, Italy, Portugal and Greece with the lowest intensities in 1990, raised them by
33%, 88% and 138% respectively. South Africa does not fit this trend well. It had average electricityintensity in 1990 and yet it had the secondhighest increase (after Greece) of its intensity (117%).Figure 3b presents a rather dismal picture for South Africa’s electricity intensity in comparison
with the developing countries of the OECD. Its growth for the period 2000 to 2007 was significantlyless than Turkey’s (255%) and less than Hungary’s and Mexico’s (13% and 17%). However, Polandmanaged to reduce its electricity intensity by 16% for the same period. It is interesting to see thatSouth Africa and Turkey had similar intensities in 2007 (0.71 and 0.72), but that Turkey increasedits sharply (255%) to ‘catch up’ with the South African level.The country, therefore, does not follow international trends in this regard. What are the impli-
cations thereof on the country’s overall relative position in terms of improvements in efficiency? Weturn to this next.To determine the change in the country’s relative position we calculated the weighted growth
rate of each of the countries in order to take into account both the changes and the final electricityintensity levels of the respective countries over the study period. We did this using equation (2) andnormalising the result so that South Africa’s growth equals 1. The results are presented in Figure 4.
Weighted growth =electricity intensityi,2007electricity intensitySA,2007
x intensity"realg row thi (2)
From Figure 4 it can be seen that the only countries that fared worse than South Africa wasIceland and the developing OECD countries (Hungary, Poland, Mexico and Turkey with the latestbeing excluded from the graph as an outlier). All the other OECD members’ (excluding the outliersas discussed for Figure 3a) weighted growth was either positive, but lower than the South African(six out of twenty-eight countries), or negative for the majority of the countries (seventeen out oftwenty-eight).
6
The results from Figures 3 and 4 clearly indicate that South Africa’s electricity intensity wasnot only higher than the majority of OECD countries in absolute terms (for 2007), but also showedexcessive increase for the period 1990 to 2007 compared to the rest of the countries in the studiedgroup The next question that arises is whether this trend and big difference compared to OECDcountries holds for all the economic sectors of South Africa.
4.3 South Africa and OECD member states: A sectoral comparison
To investigate the differences among industrial sectors, Table 2 presents the sectoral electricityintensities for South Africa and OECD average in 2006 and their differences. The last columnpresents a weighted difference relative to the output shares of each sector and was calculated asfollows:
Weighted difference =sector’s output shareOECDave
sector’s output shareSAx intensity difference % (3)
The majority of the South African sectors are more electricity intensive than the OECD average.Only four out of thirteen were more efficient than OECD countries and they are ‘construction’, ‘foodand tobacco’, ‘machinery’ and ‘transport equipment’. On average, these four sectors were 150.5%more efficient than the OECD average. In stark contrast, the nine sectors which were less efficientthan the OECD average fared, on average, 980.7% worse than the OECD grouping — a 6.5-folddifference. See Table 2.‘Basic metals’ have the highest electricity intensity in both South Africa and the OECD coun-
tries. Comparatively speaking, however, South Africa’s ‘basic metals’ sector was significantly moreintensive (886%) than the OECD average, and 644% after adjusting for relative size (or contributionto output). The most efficient sector was ‘construction’ mainly due its high labour intensity andlower use of electricity-demanding technologies. On top of that the South African ‘construction’sector was significantly more efficient than the OECD average. One can only speculate why the‘construction’ sector is more efficient compared to the rest. A number of inter-linked factors come tomind; one of them being the labour intensity of the sector. While all South African sectors are morelabour intensive compared to OECD countries, ‘construction’ is 600% more labour intensive thanits OECD equivalents, compared with a differential of 100-300% for the rest of the South Africansectors The weighted difference shows that the South African intensity was 156% lower than theOECD average.While most electricity intensive South African sectors, i.e. ‘basic metals’ and ‘non-metallic
minerals’, present high differences compared with the OECD average (644% and 2517%), ‘miningand quarrying’ does not. Here the South African electricity intensity was 2305% higher than theOECD average; however, considering that the South African mining sector is a dominant one forthe economy (14.6% of total output) and a very small proportion of the OECD production (3%),the weighted difference is considerably lower (482%), albeit still very meaningful.
5 DiscussionIt is evident from our analysis that South Africa’s electricity intensity was at a level much higher thanthat of OECD countries and that the gap between South Africa and OECD countries is increasingat an alarming rate. This differential points to the scope for improvement. At the same time,if South Africa is to remain competitive relative to its OECD counterparts under more stringenttrade regimes, including carbon and climate change considerations, such improvement is essential(Blignaut et al. 2005, Van Heerden et al. 2005).South Africa has experienced an increase in electricity intensity of 117% over the study period
— more than doubling its electricity intensity from 0.32 to 0.71 GWh/millions $ (PPP). This is in
7
sharp contrast to the average of the OECD members (except Poland, Hungary, Mexico, Turkey,Slovakia and Czech Republic), which was only 10.09%. After adjusting this growth in electricityintensity for different starting levels in 1990, it was evident that South Africa’s performance wassignificantly worse than that of the OECD member states.The economy-wide results show that South Africa is perhaps slowly reaching the level of de-
velopment that would place the country on the top of the environmental Kuznets curve, with apositive but declining growth rate of efficiency. Moreover, the main objective of countries is totunnel through the curve. Hence, it is important to know the aim and compare with countries withimproved conditions, i.e. countries on the ‘other (or downhill) side’ of the curve.Furthermore, reaching a certain development level or income growth is a necessary but not
sufficient condition to improve the country’s electricity efficiency levels. As Yandle and Vijaraghavan(2002) argue, economic prosperity does not automatically result in an improvement of efficiency levelsand of the environment. Instead, these depend on appropriate policies and institutions. Hence, high-income economies do not necessarily have the appropriate policies; they are placed on their way downthe Kuznets curve, in contrast to South Africa.In order to identify the possible differences between the economic sectors of OECD member
countries and those of South Africa, we examined the differences between their electricity intensity.Nine out of thirteen South African sectors are more electricity intensive than their OECD equivalents,and by a considerable margin. ‘Basic metals’, ‘mining and quarrying’ and ‘non-metallic minerals’were the most electricity-intensive sectors; these were also the sectors where South Africa fared worstrelative to OECD countries. The analysis showed, also, that the electricity efficiency behavioursof the various economic sectors were radically different. This necessitates a sector-specific policyapproach to improve efficiency levels.The next step is to identify possible reasons why South Africa moved towards greater electricity
intensity compared to OECD members (both developed and developing). In this paper, we onlydiscuss possible ways to explain this phenomenon.One possible reason might be the low and stable prices of electricity in South Africa for the
studied period. South African producers were not concerned about electricity efficiency given therelatively low price levels of electricity over the period. Figure 5 plots average electricity prices incomparison with the total electricity intensity in South Africa for the period from 1993 to 2005. SeeFigure 5.This figure illustrates the existence of low and stable electricity prices in the period 1993 to
2002; price restructures are responsible for the structural break in the years 2002 and 2003, whenprices more than doubled. In contrast, electricity intensity has been increasing since 1993, but at adecreasing rate, especially after the rises of the electricity prices.The period 2005-2006 was characterised by a notable decrease of 8.4% in electricity intensity;
in the same period prices increased by only 3.5%. There are two possible reasons for this change.Firstly, electricity prices increased by 182% in 2003 and it was impossible for electricity consumersto change their behaviour in the short run. Hence, the drop in electricity intensity (caused by adecrease in electricity consumption) might be considered the lagged impact of the high increase inelectricity prices.Also, the South African Department of Minerals and Energy released its first Energy Efficiency
Strategy in 2005 (DME 2005). The purpose of the strategy was to provide a policy framework towardaffordable energy for all and to diminish the negative consequences of extensive energy use in thecountry. Its national target was to improve efficiency by 12% by 2015. From a policy perspective,this document might also be the cause of the decrease in 2005/06. However, it has not had thedesired effects to date and is currently being revised.However, due to lack of data for the subsequent years, it is not yet possible to determine whether
this is a permanent change in overall electricity intensity or if it was only a temporary drop.
8
6 ConclusionThe study of the efficiency of electricity use recently has become an important topic owing to thelinkage of high electricity consumption with the negative consequences of greenhouse gas emissions.The energy policy-makers should take into account the electricity efficiency of the economy, becauseit is a measure that combines electricity consumption with economic output (Liddle 2009).South Africa’s electricity intensity more than doubled in the period from 1990 to 2007 (from 0.329
to 0.713) and the country’s weighted growth was higher than the majority of the OECD membersby a considerable margin. In addition, nine out of thirteen South African sectors are more intensivethan their OECD counterparts.To conclude, it became apparent that for South Africa to reduce its electricity intensity, it has to
either reduce its electricity usage, or increase its production while keeping its electricity consumptionstable. This can be done through concerted industrial policy to enhance the use and development ofelectricity-efficient appliances. Electricity-price reform, such as what has been recently announced,whereby the electricity price level is increased significantly in conjunction with block-rate tariffs thatcharges a higher rate to those that consume more, is also vital. These results also point to the needfor a nation-wide demand-side management programme to improve efficiencies.
References[1] Andrade Silva, F.I. & Guerra, S.M.G. 2009, ‘Analysis of the energy intensity evolution in the
Brazilian industrial sector–1995 to 2005’, Renewable and Sustainable Energy Reviews, vol. 13,no. 9, pp. 2589-2596.
[2] Baker, D. 2003, ‘The Environmental Kuznets Curve’, The Journal of Economic Perspectives,vol. 17, no. 1, pp. 226-227.
[3] Blignaut, J.N., Mabugu, R.M. & Chitiga-Mabugu, M.R. 2005, ‘Constructing a greenhouse gasemissions inventory using energy balances: the case of South Africa: 1998’, Journal of energyin Southern Africa, vol.16, no.3, pp.105-116
[4] Bor, Y.J. 2008, ‘Consistent multi-level energy efficiency indicators and their policy implications’,Energy Economics, vol. 30, no. 5, pp. 2401-2419.
[5] Bosseboeuf, D., Chateau, B. & Lapillonne, B. 1997, ‘Cross-country comparison on energy ef-ficiency indicators: the on-going European effort towards a common methodology’, EnergyPolicy, vol. 25, no. 7-9, pp. 673-682.
[6] Choi, K-H. & Ang, B.W. 2003, ‘Decomposition of aggregate energy intensity changes in twomeasures: ratio and difference’, Energy Economics,vol.25, no.6, pp. 615-624.
[7] Department of Minerals and Energy (DME) 1998, White Paper on the Energy Policy of theRepublic of South Africa, Department of Minerals and Energy, Pretoria.
[8] Department of Minerals and Energy (DME) 2005, Energy Efficiency Strategy of the Republic ofSouth Africa, Department of Minerals and Energy, Pretoria.
[9] Department of Minerals and Energy (DME) 2009, Energy Price Report 2009, Department ofMinerals and Energy, Pretoria.
[10] Economic Commission for Europe (ECE). 1996, Worldwide Energy Conservation Handbook,Energy Conservation Center, Tokyo.
9
[11] Energy Information Administration (EIA) 1999, Energy Efficiencypage: Defining Energy efficiency and its measurement. Available at:http://www.eia.doe.gov/emeu/efficiency/ee_ch2.htm
[12] Freeman, S.L., Niefer, M.J. & Roop, J.M. 1997, ‘Measuring industrial energy intensity: practicalissues and problems’, Energy Policy, vol. 25, no. 7-9, pp. 703-714.
[13] Gergel, S.E., Bennett, E.M., Greenfield, B.K., King, S., Overdevest, C.A. & Stumborg, B. 2004,‘A Test of the Environmental Kuznets Curve Using Long-Term Watershed Inputs’, EcologicalApplications, vol. 14, no. 2, pp. 555-570.
[14] Inglesi, R. & Blignaut, J. 2010, ‘Estimating the demand elasticity for electricity by sector inSouth Africa’, Putting a price on carbon: Economic instruments to mitigate climate changein South Africa and other developing countries. Energy Research Center, University of CapeTown, pp. 65.
[15] International Monetary Fund (IMF). 2010, World Economic Outlook April 2010, InternationalMonetary Fund (IMF), Washington D.C., USA.
[16] Liddle, B. 2009, ‘Electricity intensity convergence in IEA/OECD countries: Aggregate andsectoral analysis’, Energy Policy, vol. 37, no. 4, pp. 1470-1478.
[17] Markandya, A., Pedroso-Galinato, S. & Streimikiene, D. 2006, ‘Energy intensity in transitioneconomies: Is there convergence towards the EU average?’, Energy Economics, vol. 28, no. 1,pp. 121-145.
[18] Medlock III, K. & Soligo, R. 2001, ‘Economic Development and End-Use Energy Demand’, TheEnergy Journal, vol. 22, no. 2, pp. 77-106.
[19] Mendiluce, M., Pérez-Arriaga, I. & Ocaña, C. 2010, ‘Comparison of the evolution of energyintensity in Spain and in the EU15. Why is Spain different?’, Energy Policy, vol. 38, no. 1, pp.639-645.
[20] Mukherjee, K. 2008, ‘Energy use efficiency in U.S. manufacturing: A nonparametric analysis’,Energy Economics, vol. 30, no. 1, pp. 76-96.
[21] Organisation for Economic Co-operation and Development (OECD) 2009a, Energy balances forOECD countries, OECD , Paris, France.
[22] Organisation for Economic Co-operation and Development (OECD) 2009b, Energy balances fornon-OECD countries, OECD , Paris, France.
[23] Repetto, R. & Austin, D. 1997, The costs of climate protection: A guide for the perplexed.World Resources Institute: Climate Protection Initiative, Washington, DC.
[24] Schipper, L., Ting, M., Khrushch, M. & Golove, W. 1997, ‘The evolution of carbon dioxideemissions from energy use in industrialized countries: an end-use analysis’, Energy Policy, vol.25, no. 7-9, pp. 651-672.
[25] Sebitosi, A.B. 2008, ‘Energy efficiency, security of supply and the environment in South Africa:Moving beyond the strategy documents’, Energy, vol. 33, no. 11, pp. 1591-1596.
[26] Sun, J.W. & Ang, B.W. 2000. ‘Some properties of an exact energy decomposition model’.Energy, vol25, no.12, pp. 1177-1188.
[27] Tiwari, P. 2000, ‘An analysis of sectoral energy intensity in India’, Energy Policy, vol. 28, no.11, pp. 771-778.
10
[28] Bureau of African Affairs. 2010, ‘Background note: South Africa’, U.S. State Department.Available at http://www.state.gov/r/pa/ei/bgn/2898.htm
[29] Van Heerden, J., Gerlagh, R., Blignaut, JN., Horridge, M., Hess, S., Mabugu, R. & Mabugu,M. 2006 ‘Searching for triple dividends in South Africa: Fighting CO2 pollution and povertywhile promoting growth’, The Energy Journal, vol.27, no.2, pp.113-142.
[30] Weber, C.L. 2009, ‘Measuring structural change and energy use: Decomposition of the USeconomy from 1997 to 2002’, Energy Policy, vol. 37, no. 4, pp. 1561-1570.
[31] World Energy Council (WEC) 2008, Energy efficiency policies around the world: Re-view and evaluation: Chapter 1.3 Definition and scope of energy efficiency. Available ath t tp :/ /w w w .w o r ld e n e r g y.o r g / p u b l ic a t io n s / en e r g y_ effi c i e n c y_ p o l i c i e s_ a ro u n d_ th e_ w o r ld_ r e v iew _ an d_ e va lu a t io n / 1_ in t r o d u c t io n / 1 1 7 5 .a s p
[32] Zhao, X., Ma, C. & Hong, D. 2010, ‘Why did China’s energy intensity increase during 1998—2006: Decomposition and policy analysis’, Energy Policy, vol. 38, no. 3, pp. 1379-1388.
11
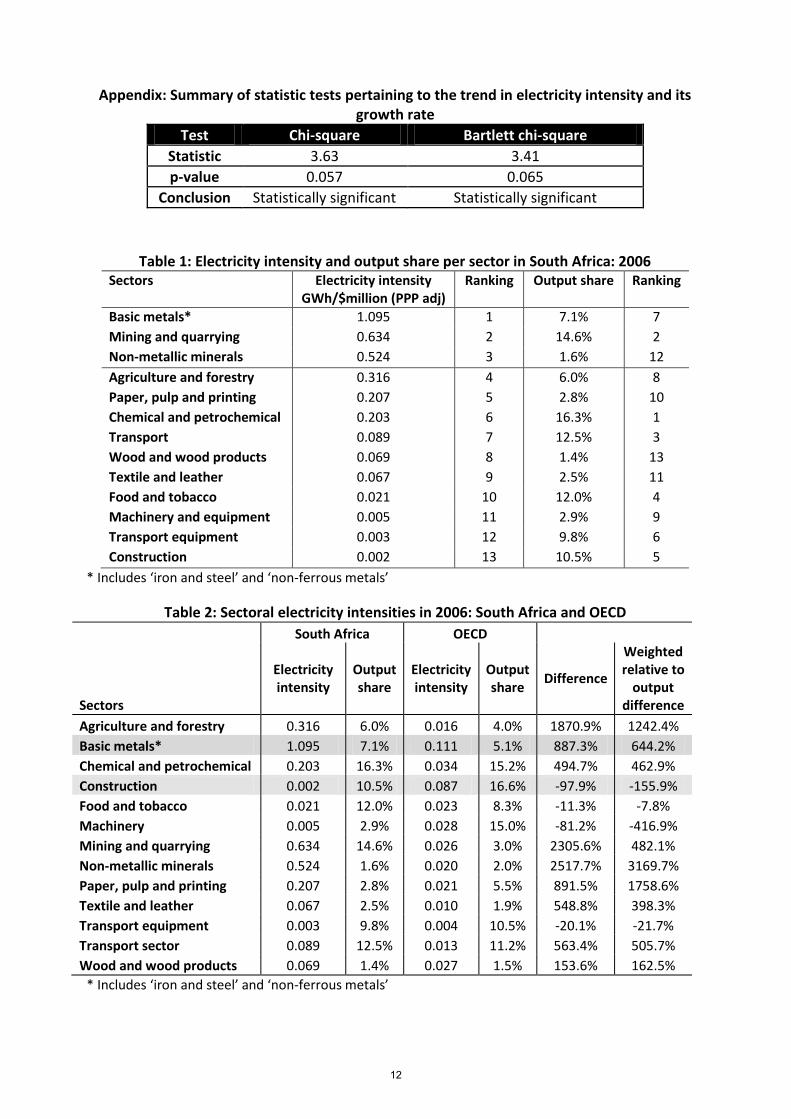
Appendix: Summary of statistic tests pertaining to the trend in electricity intensity and its growth rate
Test Chi-square Bartlett chi-square
Statistic 3.63 3.41
p-value 0.057 0.065
Conclusion Statistically significant Statistically significant
Table 1: Electricity intensity and output share per sector in South Africa: 2006 Sectors Electricity intensity
GWh/$million (PPP adj) Ranking Output share Ranking
Basic metals* 1.095 1 7.1% 7
Mining and quarrying 0.634 2 14.6% 2
Non-metallic minerals 0.524 3 1.6% 12
Agriculture and forestry 0.316 4 6.0% 8
Paper, pulp and printing 0.207 5 2.8% 10
Chemical and petrochemical 0.203 6 16.3% 1
Transport 0.089 7 12.5% 3
Wood and wood products 0.069 8 1.4% 13
Textile and leather 0.067 9 2.5% 11
Food and tobacco 0.021 10 12.0% 4
Machinery and equipment 0.005 11 2.9% 9
Transport equipment 0.003 12 9.8% 6
Construction 0.002 13 10.5% 5
* Includes ‘iron and steel’ and ‘non-ferrous metals’
Table 2: Sectoral electricity intensities in 2006: South Africa and OECD
South Africa OECD
Sectors
Electricity intensity
Output share
Electricity intensity
Output share
Difference
Weighted relative to
output difference
Agriculture and forestry 0.316 6.0% 0.016 4.0% 1870.9% 1242.4%
Basic metals* 1.095 7.1% 0.111 5.1% 887.3% 644.2%
Chemical and petrochemical 0.203 16.3% 0.034 15.2% 494.7% 462.9%
Construction 0.002 10.5% 0.087 16.6% -97.9% -155.9%
Food and tobacco 0.021 12.0% 0.023 8.3% -11.3% -7.8%
Machinery 0.005 2.9% 0.028 15.0% -81.2% -416.9%
Mining and quarrying 0.634 14.6% 0.026 3.0% 2305.6% 482.1%
Non-metallic minerals 0.524 1.6% 0.020 2.0% 2517.7% 3169.7%
Paper, pulp and printing 0.207 2.8% 0.021 5.5% 891.5% 1758.6%
Textile and leather 0.067 2.5% 0.010 1.9% 548.8% 398.3%
Transport equipment 0.003 9.8% 0.004 10.5% -20.1% -21.7%
Transport sector 0.089 12.5% 0.013 11.2% 563.4% 505.7%
Wood and wood products 0.069 1.4% 0.027 1.5% 153.6% 162.5%
* Includes ‘iron and steel’ and ‘non-ferrous metals’
12
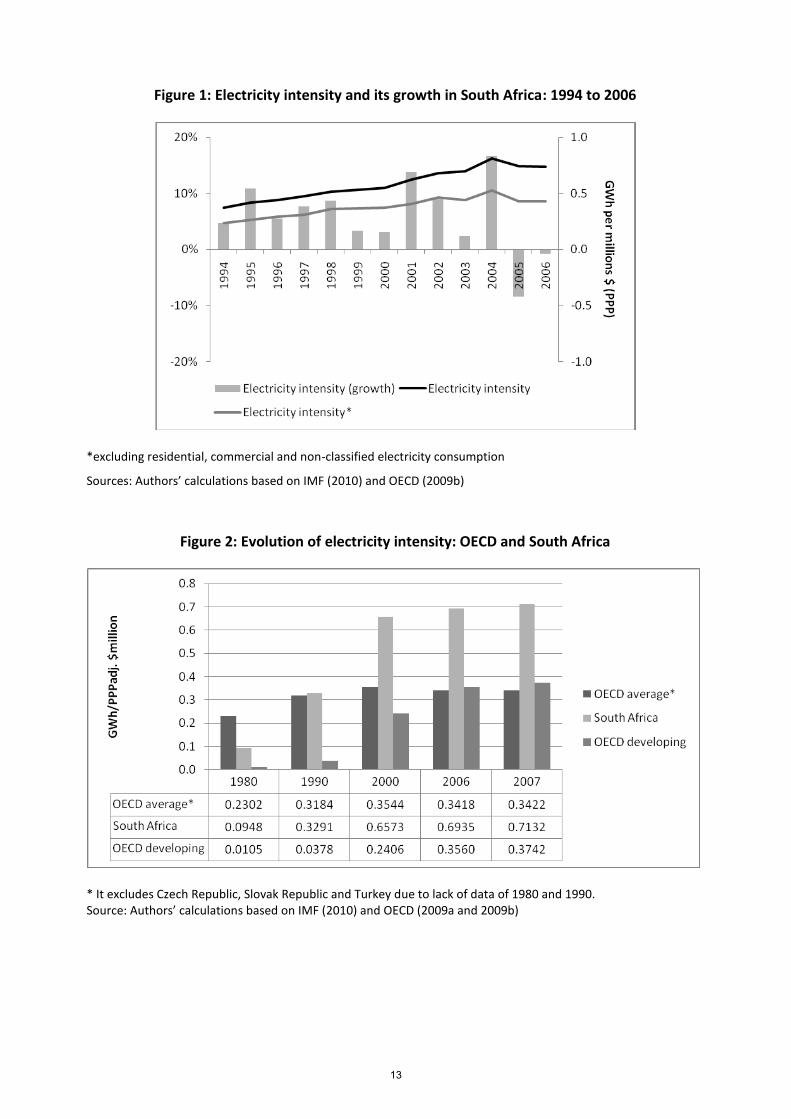
Figure 1: Electricity intensity and its growth in South Africa: 1994 to 2006
*excluding residential, commercial and non-classified electricity consumption
Sources: Authors’ calculations based on IMF (2010) and OECD (2009b)
Figure 2: Evolution of electricity intensity: OECD and South Africa
* It excludes Czech Republic, Slovak Republic and Turkey due to lack of data of 1980 and 1990. Source: Authors’ calculations based on IMF (2010) and OECD (2009a and 2009b)
13
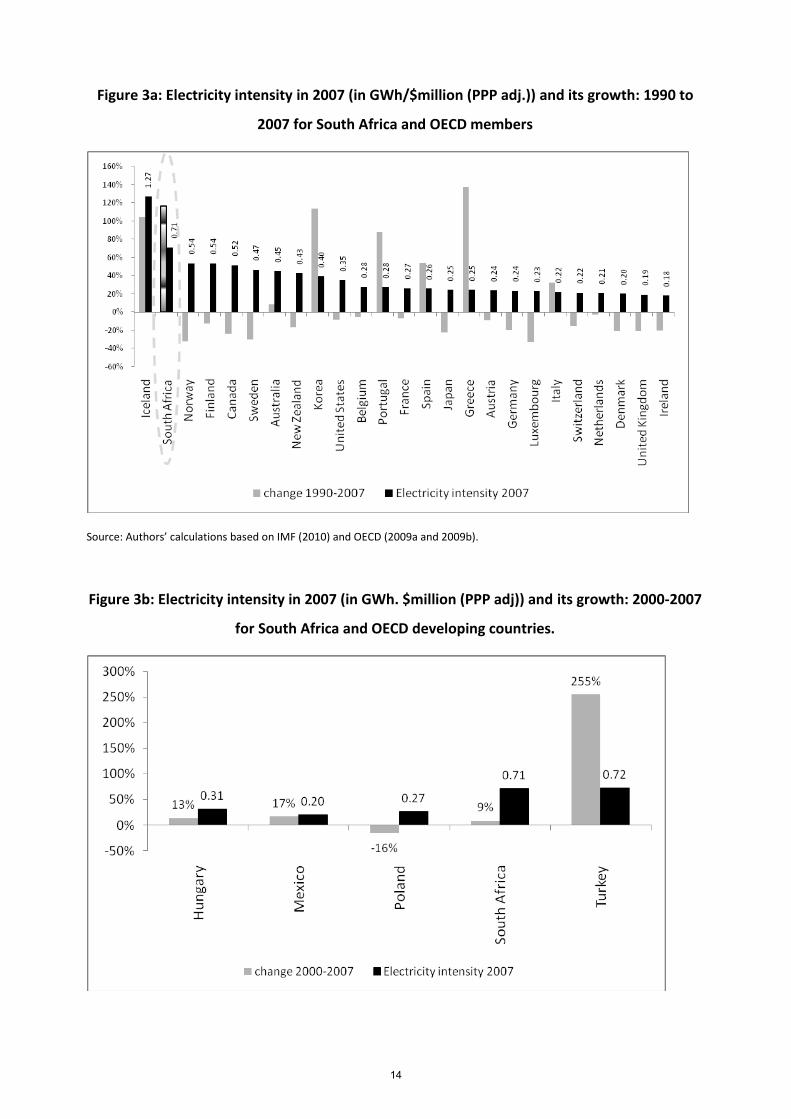
Figure 3a: Electricity intensity in 2007 (in GWh/$million (PPP adj.)) and its growth: 1990 to
2007 for South Africa and OECD members
Source: Authors’ calculations based on IMF (2010) and OECD (2009a and 2009b).
Figure 3b: Electricity intensity in 2007 (in GWh. $million (PPP adj)) and its growth: 2000-2007
for South Africa and OECD developing countries.
14
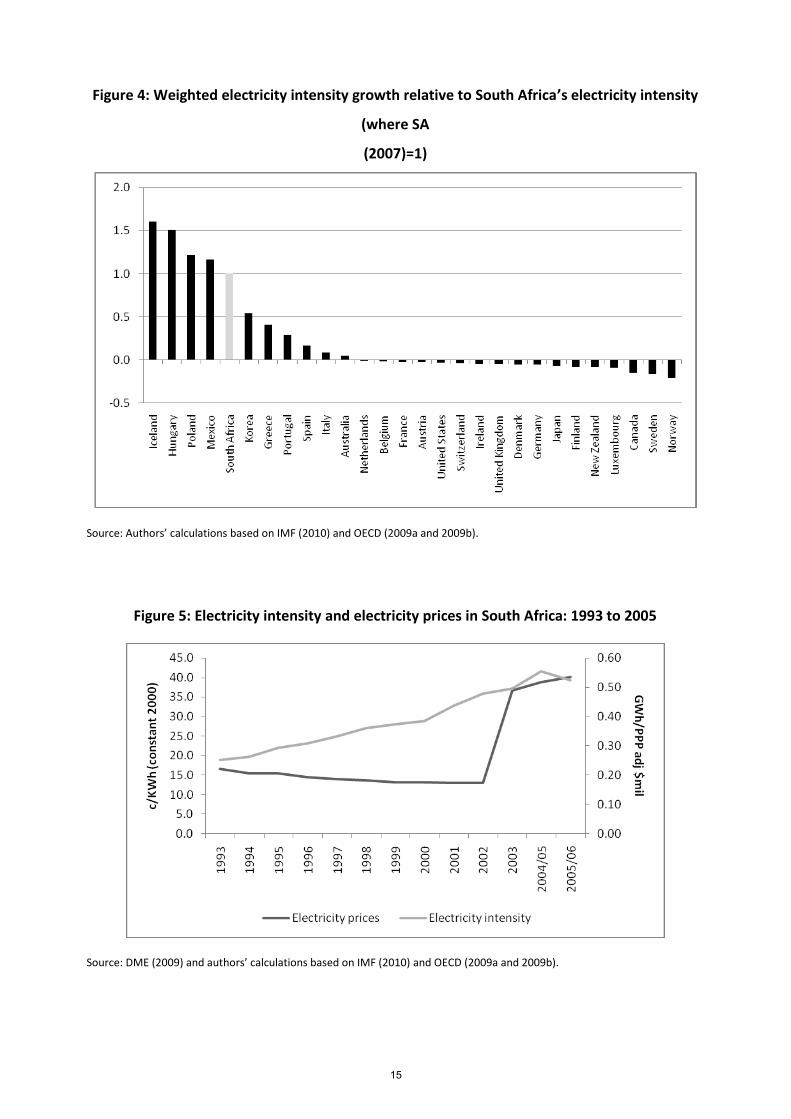
Figure 4: Weighted electricity intensity growth relative to South Africa’s electricity intensity
(where SA
(2007)=1)
Source: Authors’ calculations based on IMF (2010) and OECD (2009a and 2009b).
Figure 5: Electricity intensity and electricity prices in South Africa: 1993 to 2005
Source: DME (2009) and authors’ calculations based on IMF (2010) and OECD (2009a and 2009b).
15