Embed Size (px)
Citation preview
© OECD/IEA 2012 © OECD/IEA 2012
Electricity markets Opening up to competition and investments
Lars Dittmar (TU Berlin), Dennis Volk & Matthew Wittenstein (IEA) IEA Energy Training Week
Paris, 11.04.14
© OECD/IEA 2012
© OECD/IEA 2012
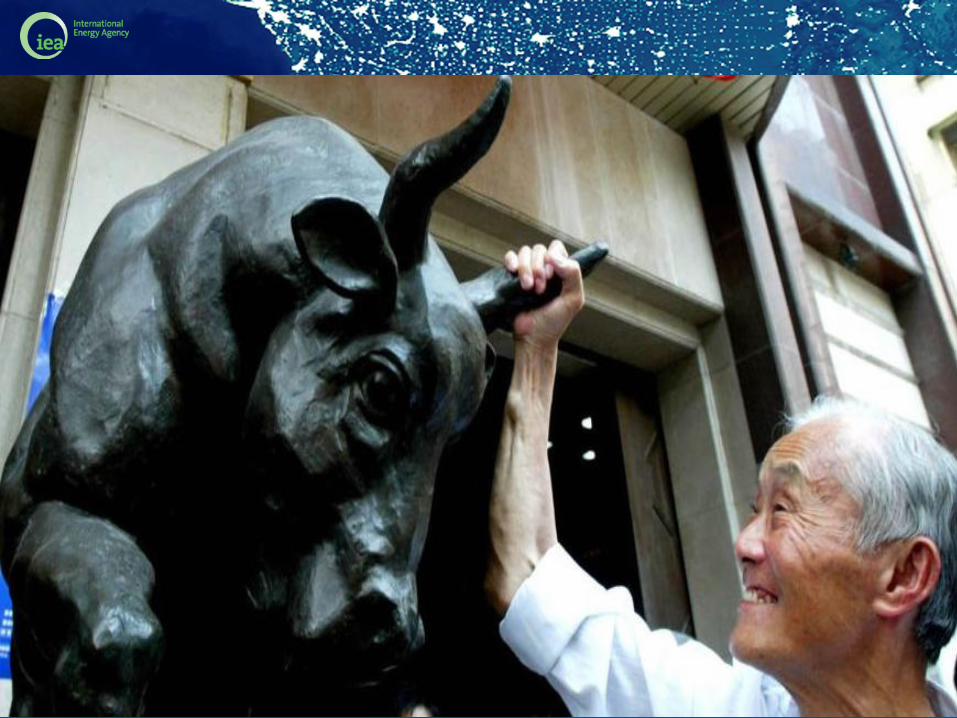
Electricity is primarily a wealth creator
© OECD/IEA 2012
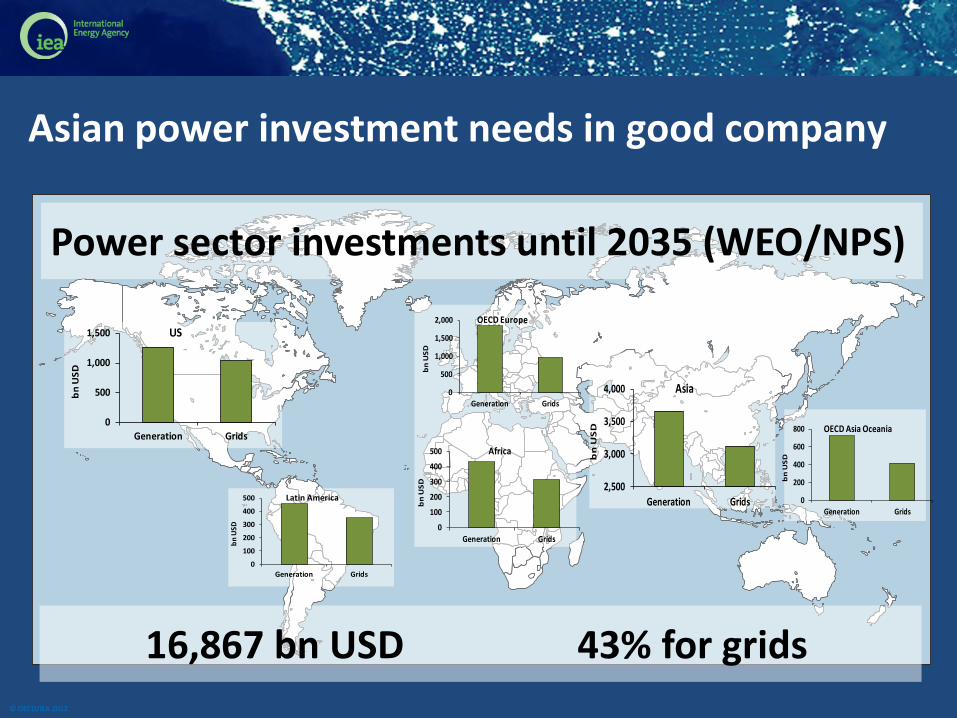
Asian power investment needs in good company
Power sector investments until 2035 (WEO/NPS)
16,867 bn USD 43% for grids
0
500
1,000
1,500
Generation Grids
bn
US
D
US
0
100
200
300
400
500
Generation Grids
bn
USD
Latin America
0
100
200
300
400
500
Generation Grids
bn
US
D
Africa
0
500
1,000
1,500
2,000
Generation Grids
bn
US
D
OECD Europe
2,500
3,000
3,500
4,000
Generation Grids
bn
US
D
Asia
0
200
400
600
800
Generation Grids
bn
US
D
OECD Asia Oceania
© OECD/IEA 2012
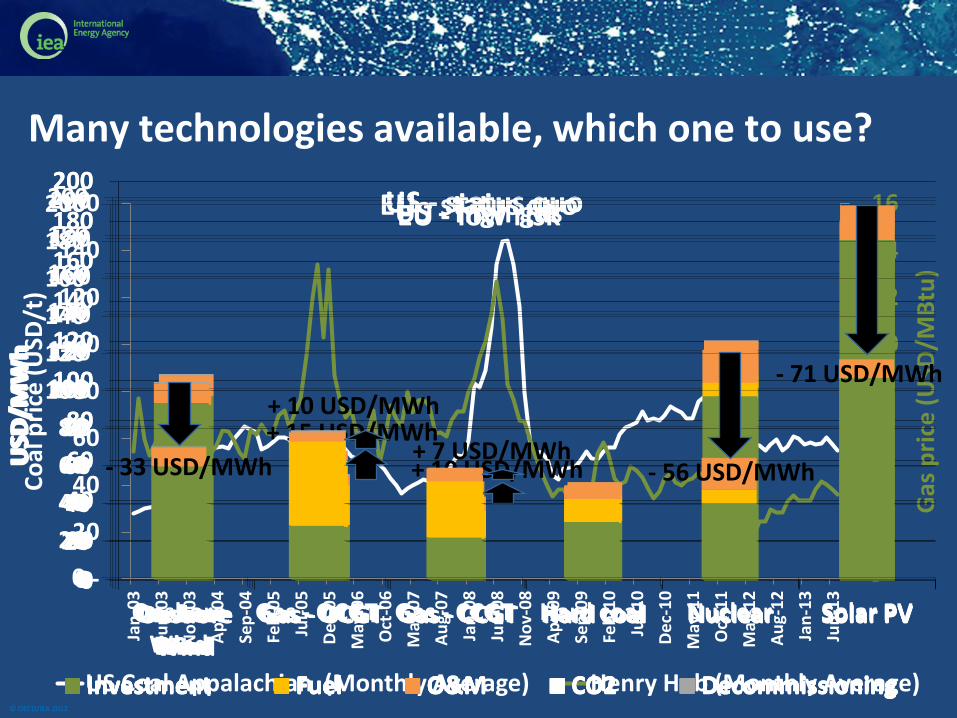
Many technologies available, which one to use?
0
20
40
60
80
100
120
140
160
180
200
Onshore Wind
Gas - OCGT Gas - CCGT Hard coal Nuclear Solar PV
USD
/MW
h
US - status quo
Investment Fuel O&M CO2 Decommissioning
-
2
4
6
8
10
12
14
16
-
20
40
60
80
100
120
140
160
Jan
-03
Jun
-03
No
v-0
3
Ap
r-0
4
Sep
-04
Feb
-05
Jul-
05
De
c-0
5
May
-06
Oct
-06
Mar
-07
Au
g-0
7
Jan
-08
Jun
-08
No
v-0
8
Ap
r-0
9
Sep
-09
Feb
-10
Jul-
10
De
c-1
0
May
-11
Oct
-11
Mar
-12
Au
g-1
2
Jan
-13
Jun
-13
Gas
pri
ce (
USD
/MB
tu)
Co
al p
rice
(U
SD/t
)
US Coal Appalachian (Monthly Average) Henry Hub (Monthly Average)
0
20
40
60
80
100
120
140
160
180
200
Onshore Wind
Gas - OCGT Gas - CCGT Hard coal Nuclear Solar PV
USD
/MW
h
US - status quo
Investment Fuel O&M CO2 Decommissioning
0
20
40
60
80
100
120
140
160
180
200
Onshore Wind
Gas - OCGT Gas - CCGT Hard coal Nuclear Solar PV
USD
/MW
h
US - high gas
Investment Fuel O&M CO2 Decommissioning
+ 15 USD/MWh
+ 10 USD/MWh
0
20
40
60
80
100
120
140
160
180
200
Onshore Wind
Gas - OCGT Gas - CCGT Hard coal Nuclear Solar PV
USD
/MW
h
EU - status quo
Investment Fuel O&M CO2 Decommissioning
+ 10 USD/MWh
+ 7 USD/MWh
0
20
40
60
80
100
120
140
160
180
200
Onshore Wind
Gas - OCGT Gas - CCGT Hard coal Nuclear Solar PV
USD
/MW
h
EU - low risk
Investment Fuel O&M CO2 Decommissioning
- 33 USD/MWh - 56 USD/MWh
- 71 USD/MWh
© OECD/IEA 2012
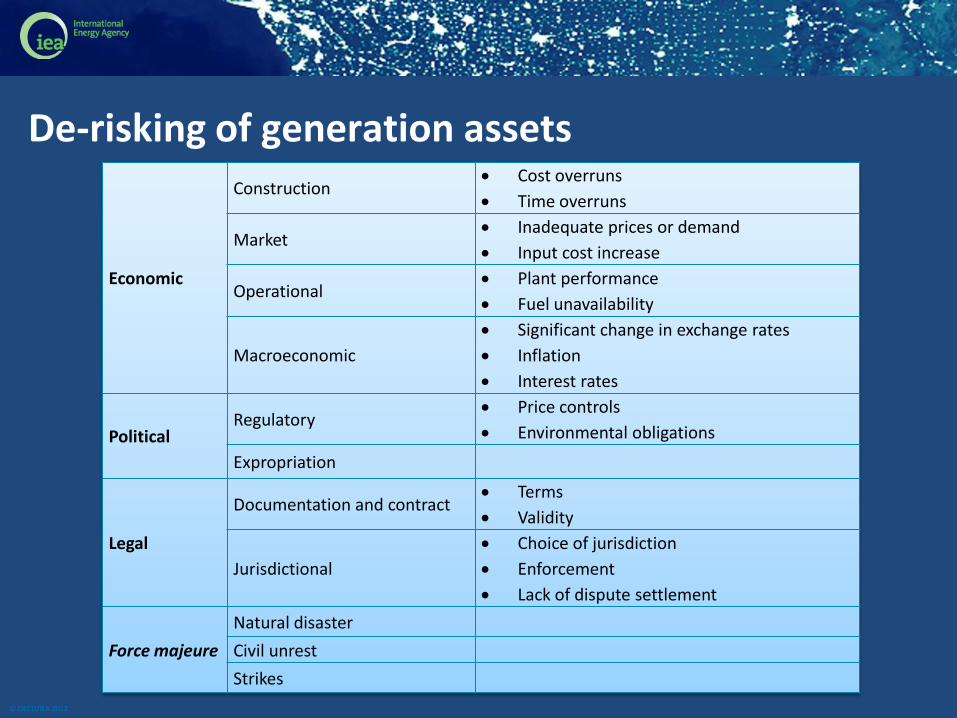
De-risking of generation assets
Economic
Construction Cost overruns
Time overruns
Market Inadequate prices or demand
Input cost increase
Operational Plant performance
Fuel unavailability
Macroeconomic
Significant change in exchange rates
Inflation
Interest rates
Political Regulatory
Price controls
Environmental obligations
Expropriation
Legal
Documentation and contract Terms
Validity
Jurisdictional
Choice of jurisdiction
Enforcement
Lack of dispute settlement
Force majeure
Natural disaster
Civil unrest
Strikes
© OECD/IEA 2012
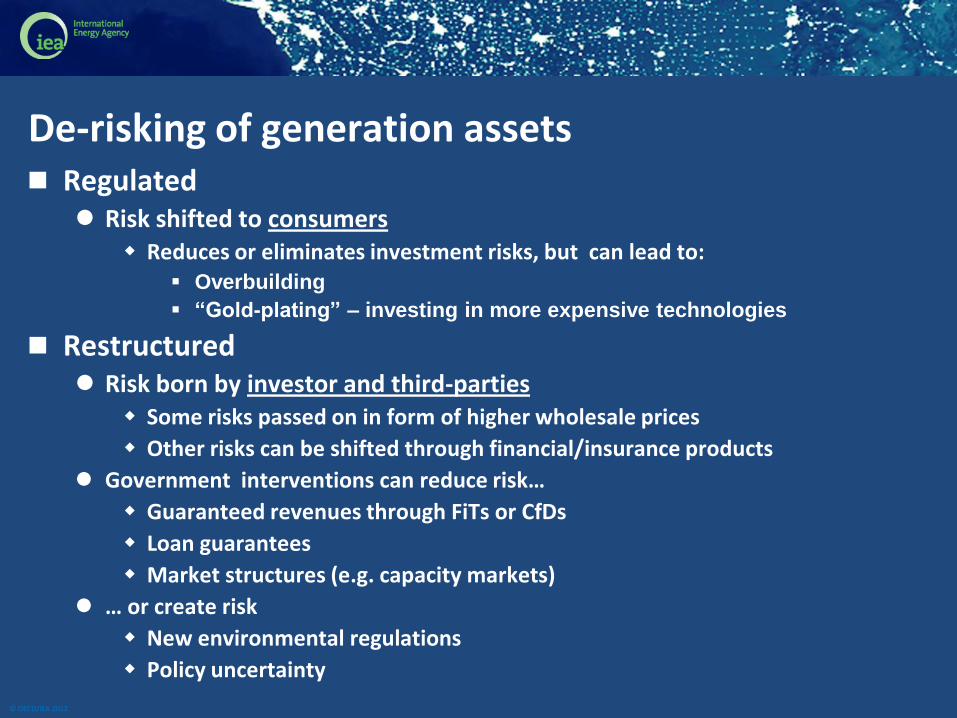
De-risking of generation assets Regulated
Risk shifted to consumers Reduces or eliminates investment risks, but can lead to:
Overbuilding
“Gold-plating” – investing in more expensive technologies
Restructured Risk born by investor and third-parties
Some risks passed on in form of higher wholesale prices
Other risks can be shifted through financial/insurance products
Government interventions can reduce risk…
Guaranteed revenues through FiTs or CfDs
Loan guarantees
Market structures (e.g. capacity markets)
… or create risk
New environmental regulations
Policy uncertainty
© OECD/IEA 2012
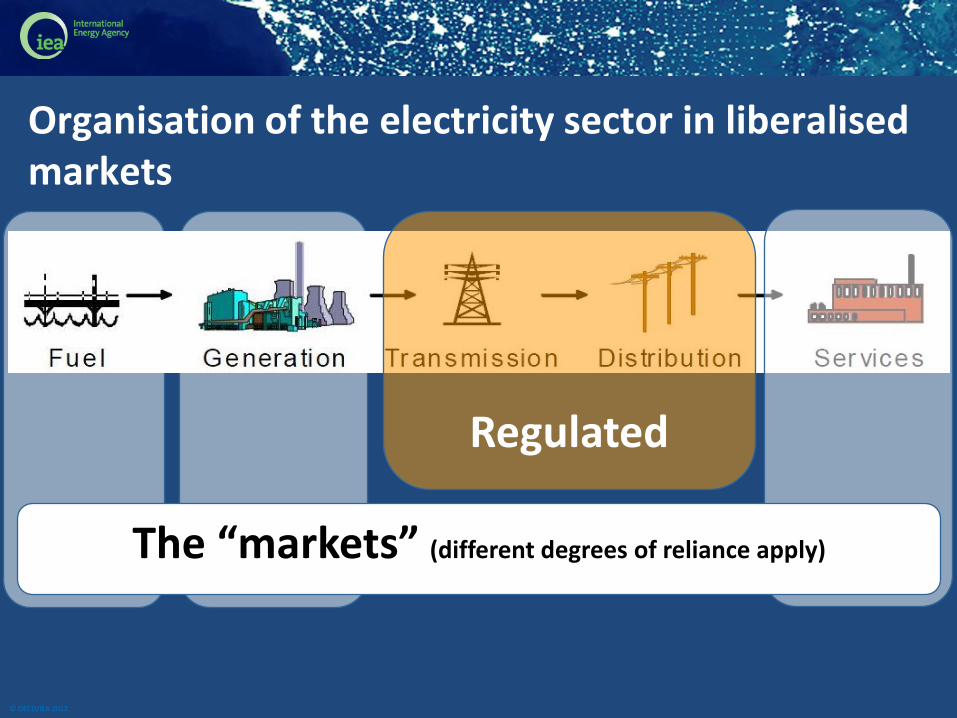
Organisation of the electricity sector in liberalised markets
Regulated
The “markets” (different degrees of reliance apply)
© OECD/IEA 2012
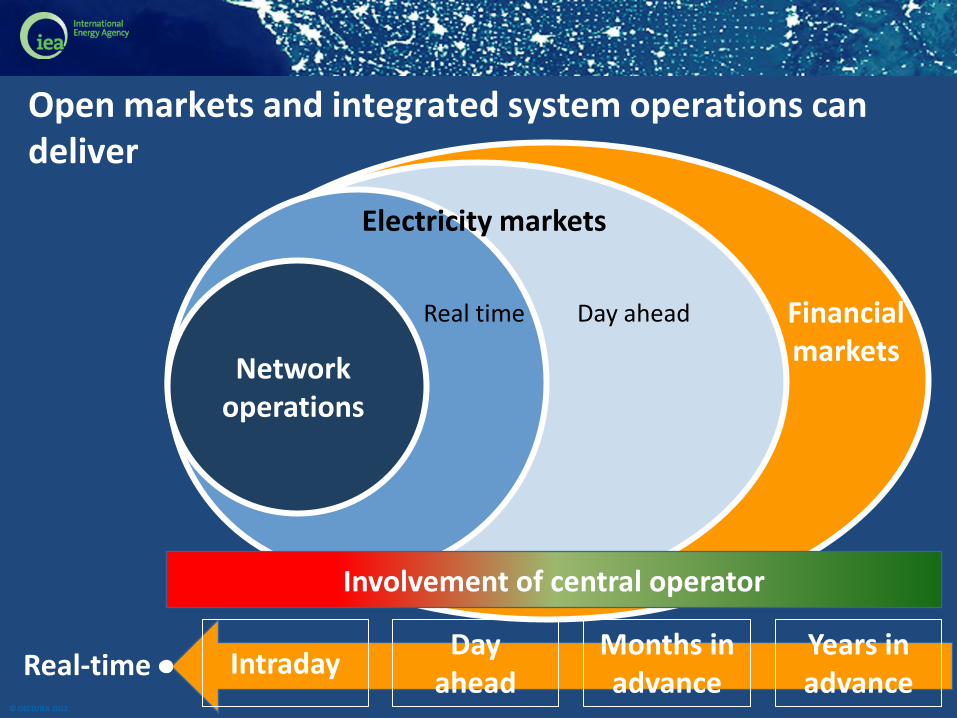
Open markets and integrated system operations can deliver
Years in advance
Months in advance
Day ahead
Intraday
Real-time
Network operations
Electricity markets
Real time
Day ahead
Financial markets
Involvement of central operator
© OECD/IEA 2012
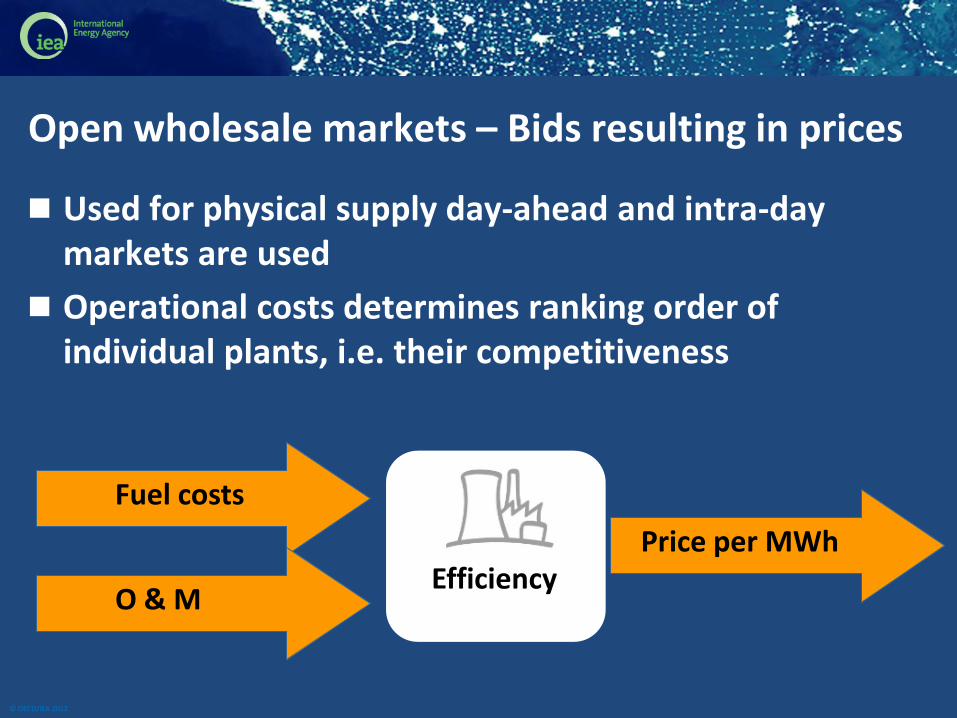
Open wholesale markets – Bids resulting in prices
Used for physical supply day-ahead and intra-day markets are used
Operational costs determines ranking order of individual plants, i.e. their competitiveness
Efficiency
Fuel costs
O & M
Price per MWh
© OECD/IEA 2012
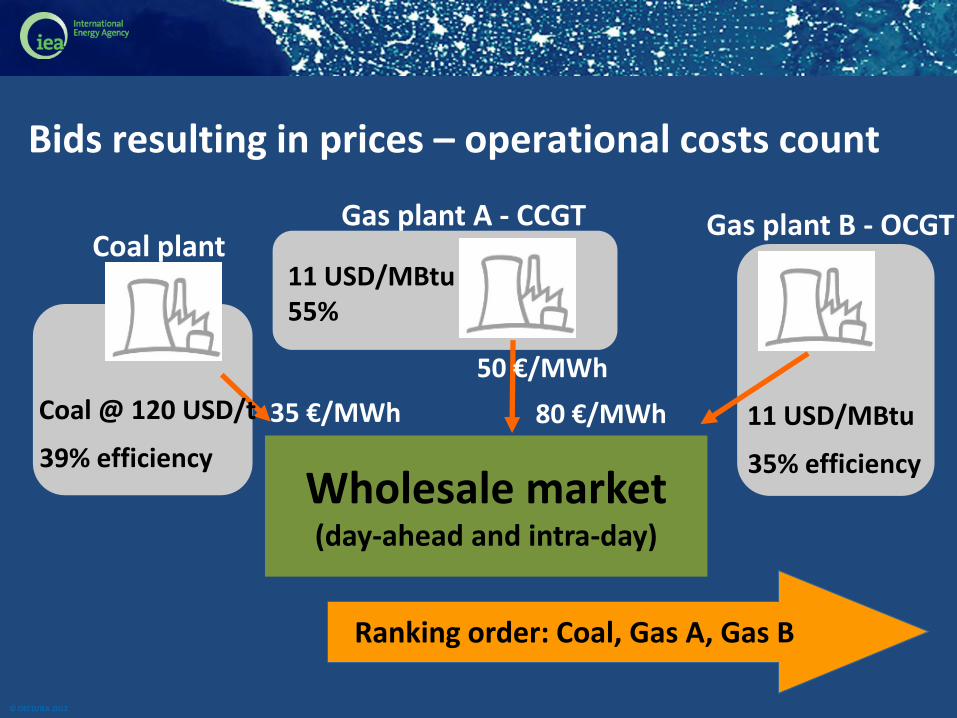
Bids resulting in prices – operational costs count
Wholesale market (day-ahead and intra-day)
Coal @ 120 USD/t
39% efficiency
35 €/MWh
Coal plant Gas plant A - CCGT Gas plant B - OCGT
50 €/MWh
80 €/MWh
11 USD/MBtu 55%
11 USD/MBtu
35% efficiency
Ranking order: Coal, Gas A, Gas B
© OECD/IEA 2012
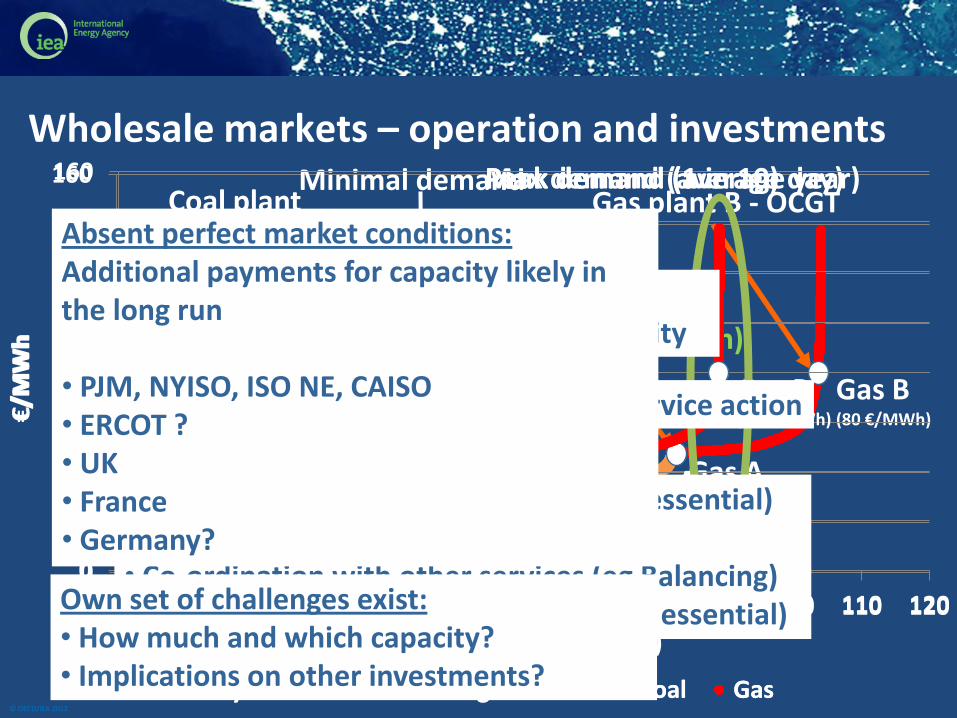
Wholesale markets – operation and investments
0
20
40
60
80
100
120
140
160
0 10 20 30 40 50 60 70 80 90 100 110 120
€/M
Wh
cumulated capacity (GW)
Hydro Nuclear Lignite Hard Coal Gas
Coal @ 120 USD/t
39% efficiency 35 €/MWh
Coal plant
Gas plant A - CCGT
Gas plant B - OCGT
Coal plant (35 €/MWh)
Gas A (50 €/MWh)
Gas B (80 €/MWh)
Minimal demand Max demand (average day)
Last required plant sets the market price: Marginal price @ 20 €/MWh
No
t d
isp
atch
ed
Marginal price @ 42 €/MWh
Coal plant „in the money“ (Infra-marginal rent: 42 – 35 €/MWh)
0
20
40
60
80
100
120
140
160
0 10 20 30 40 50 60 70 80 90 100 110 120
€/M
Wh
cumulated capacity (GW)
Hydro Nuclear Lignite Hard Coal Gas
Coal plant (35 €/MWh)
Gas A (50 €/MWh)
Gas B (80 €/MWh)
Peak demand (average year) Peak demand (1 in 10)
Scarcity conditions
Relevant first-order principle: • Getting the price(s) right during scarcity
• Marginal cost represents marginal service action
• Demand response (Value of Lost Load essential) • Price caps (Reliability target essential) • Co-ordination with other services (eg Balancing) • Locational differences (Underlying grid essential)
Absent perfect market conditions: Additional payments for capacity likely in the long run • PJM, NYISO, ISO NE, CAISO • ERCOT ? • UK • France • Germany?
Own set of challenges exist: • How much and which capacity? • Implications on other investments?

© OECD/IEA 2012
Q&A
Lars Dittmar | 14
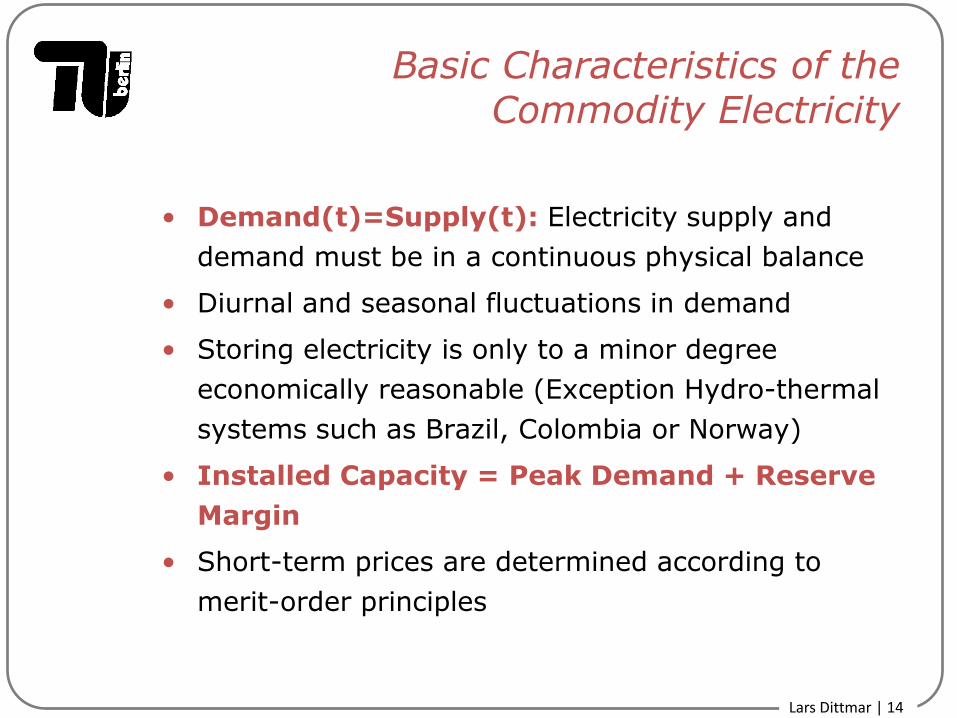
Basic Characteristics of the Commodity Electricity
• Demand(t)=Supply(t): Electricity supply and
demand must be in a continuous physical balance
• Diurnal and seasonal fluctuations in demand
• Storing electricity is only to a minor degree
economically reasonable (Exception Hydro-thermal
systems such as Brazil, Colombia or Norway)
• Installed Capacity = Peak Demand + Reserve
Margin
• Short-term prices are determined according to
merit-order principles
Lars Dittmar | 15
0
10
20
30
40
50
60
70
80
Dem
an
d [
GW
]
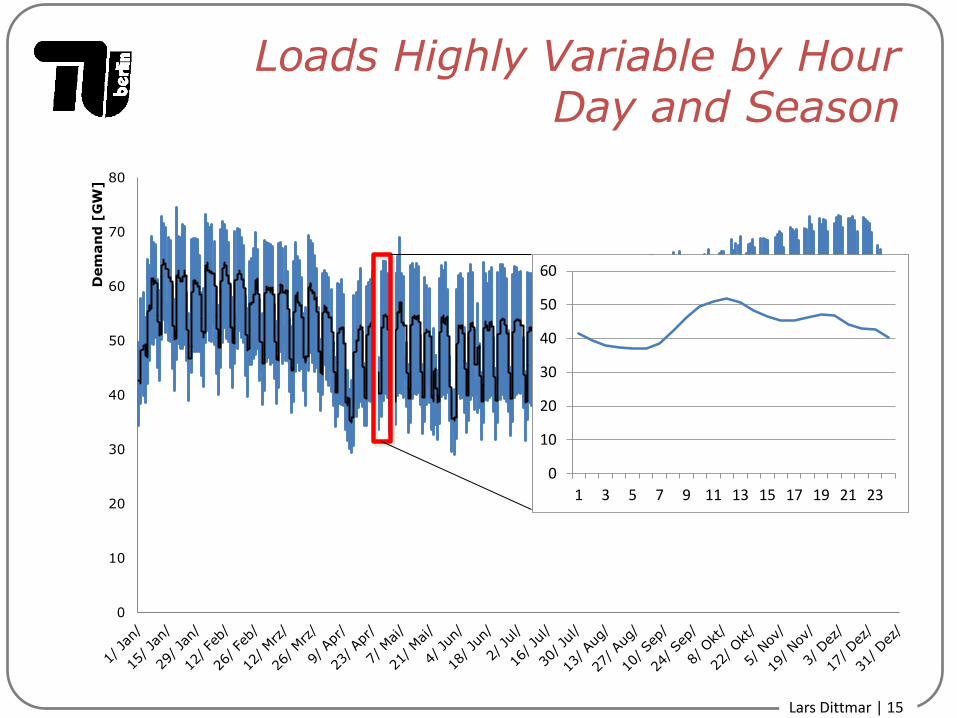
Loads Highly Variable by Hour Day and Season
0
10
20
30
40
50
60
1 3 5 7 9 11 13 15 17 19 21 23
Lars Dittmar | 16
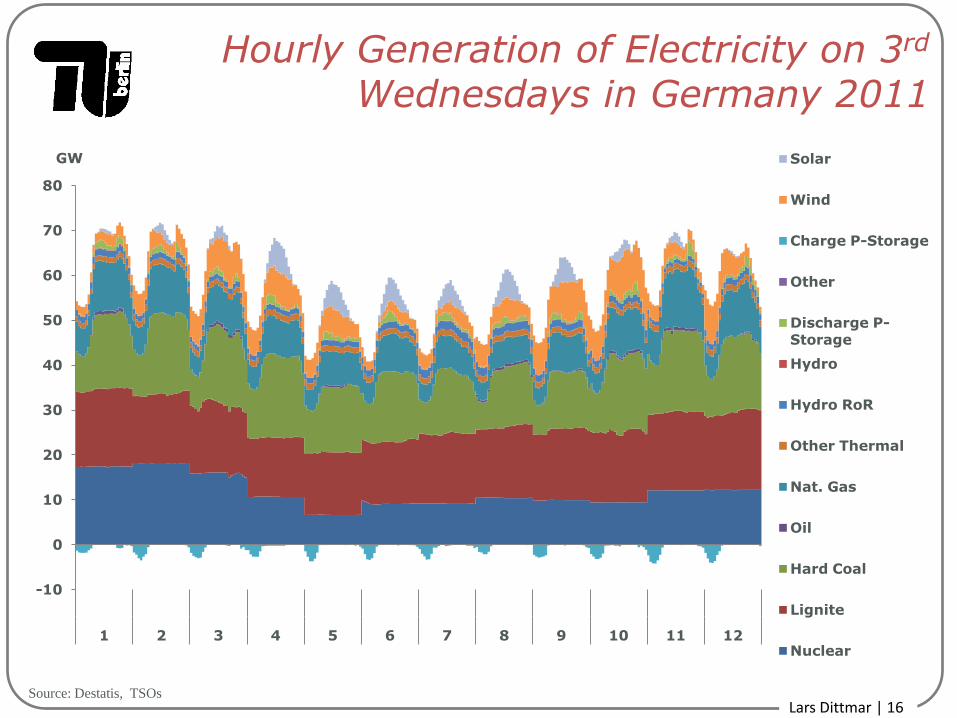
Hourly Generation of Electricity on 3rd Wednesdays in Germany 2011
-10
0
10
20
30
40
50
60
70
80
1 2 3 4 5 6 7 8 9 10 11 12
GW Solar
Wind
Charge P-Storage
Other
Discharge P-Storage
Hydro
Hydro RoR
Other Thermal
Nat. Gas
Oil
Hard Coal
Lignite
Nuclear
Source: Destatis, TSOs
Lars Dittmar | 17
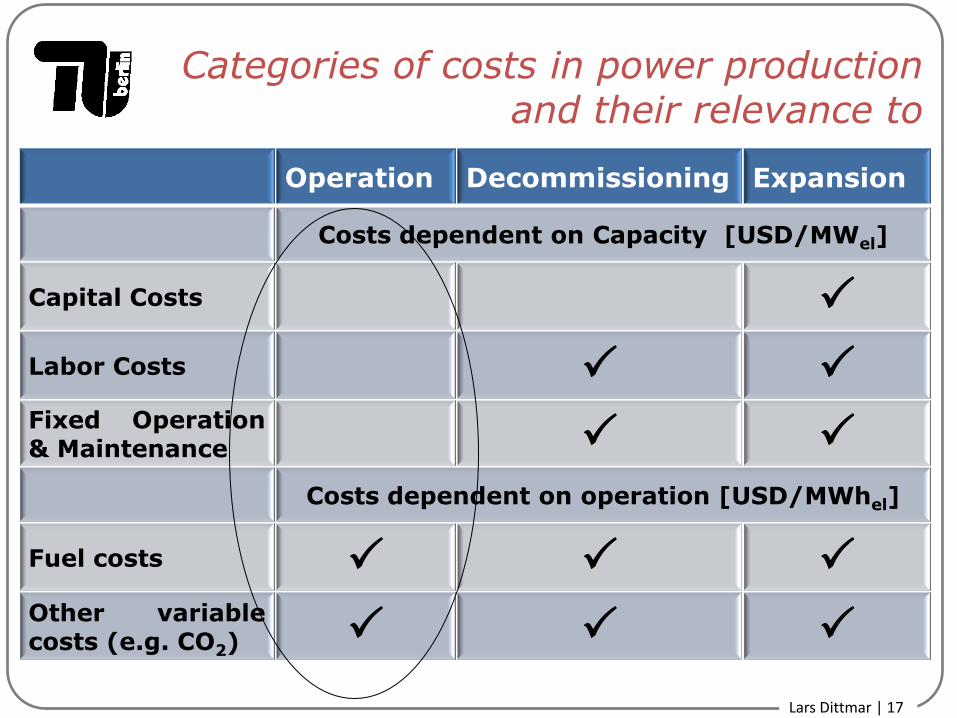
Categories of costs in power production and their relevance to
Operation Decommissioning Expansion
Costs dependent on Capacity [USD/MWel]
Capital Costs P
Labor Costs P P
Fixed Operation & Maintenance P P
Costs dependent on operation [USD/MWhel]
Fuel costs P P P
Other variable costs (e.g. CO2) P P P
Lars Dittmar | 18
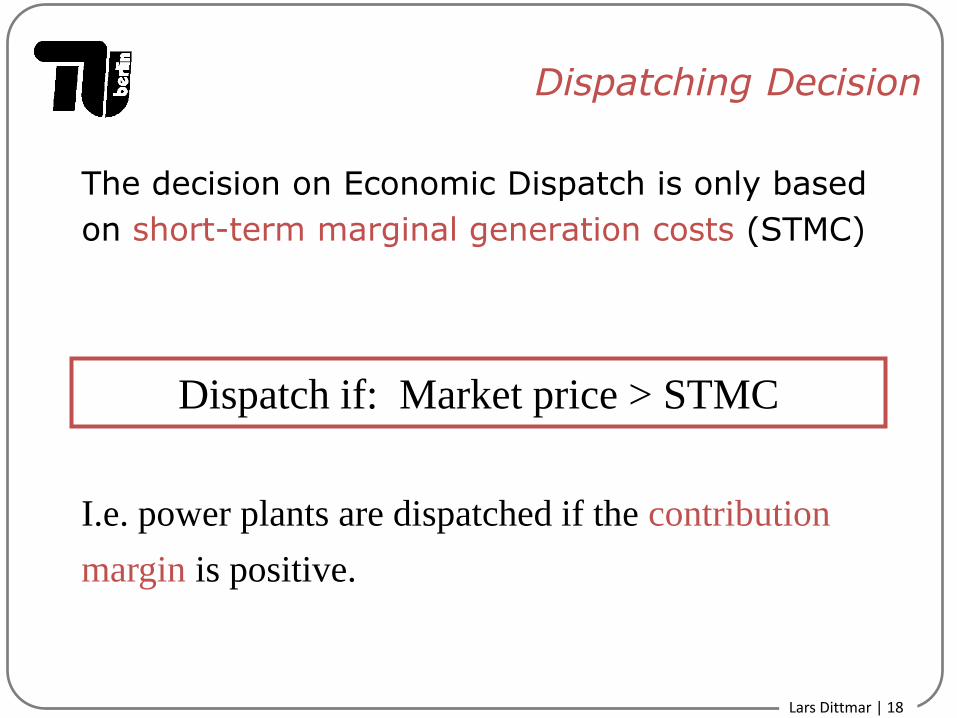
Dispatching Decision
The decision on Economic Dispatch is only based
on short-term marginal generation costs (STMC)
Dispatch if: Market price > STMC
I.e. power plants are dispatched if the contribution
margin is positive.
Lars Dittmar | 19
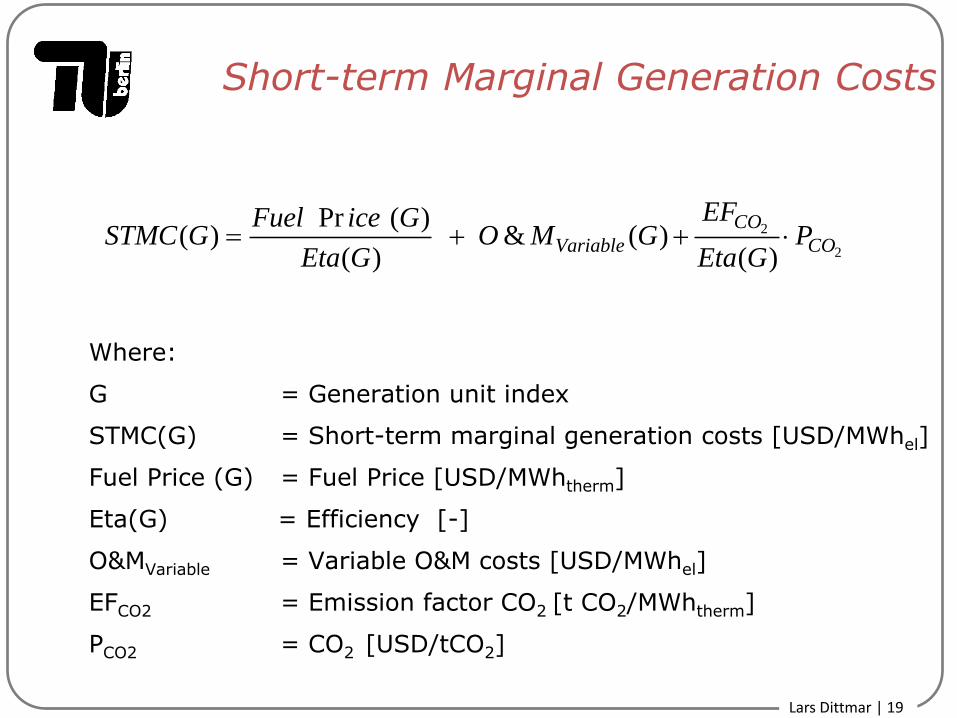
Short-term Marginal Generation Costs
Where:
G = Generation unit index
STMC(G) = Short-term marginal generation costs [USD/MWhel]
Fuel Price (G) = Fuel Price [USD/MWhtherm]
Eta(G) = Efficiency [-]
O&MVariable = Variable O&M costs [USD/MWhel]
EFCO2 = Emission factor CO2 [t CO2/MWhtherm]
PCO2 = CO2 [USD/tCO2]
2
2
Pr ( )( ) & ( )
( ) ( )
CO
Variable CO
EFFuel ice GSTMC G O M G P
Eta G Eta G
Lars Dittmar | 20
Stylized Merit Order
Hydro, Wind, Solar Nuclear
Coal
Gas
Tu
rbin
es
GT
Die
sel
installed capacity (GW)
CCGT
short-term marginal cost (USD/MWh)
Daily demand fluctuations
High Demand
Low Demand
Ppeak
Poff-peak
0
10
20
30
40
50
60
1 3 5 7 9 11 13 15 17 19 21 23
Lars Dittmar | 21
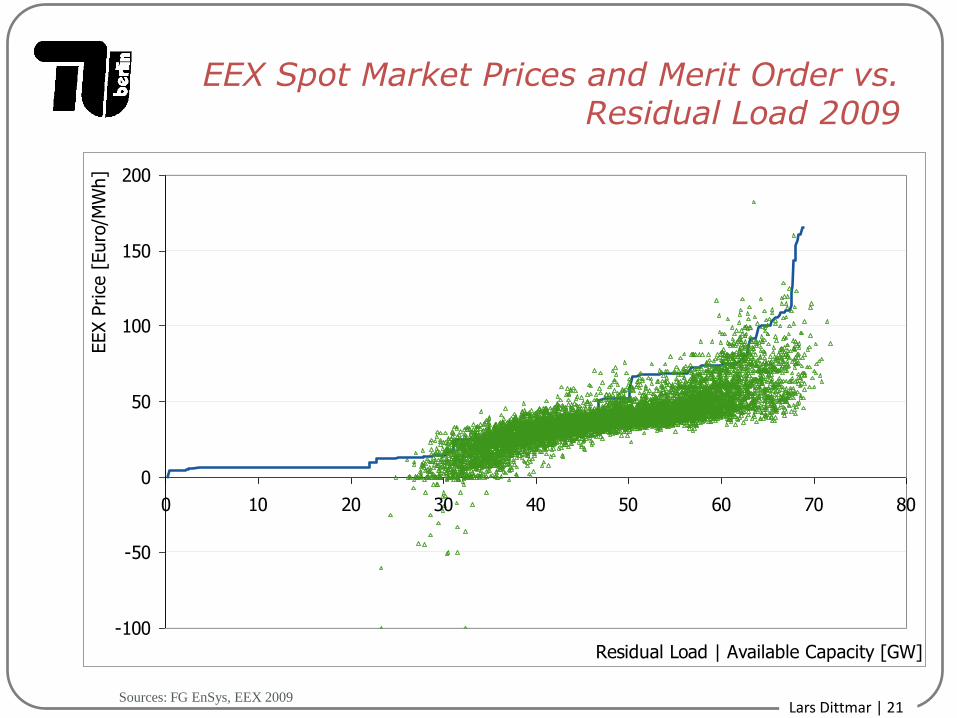
EEX Spot Market Prices and Merit Order vs. Residual Load 2009
-100
-50
0
50
100
150
200
0 10 20 30 40 50 60 70 80
Residual Load | Available Capacity [GW]
EEX P
rice
[Euro
/MW
h]
Sources: FG EnSys, EEX 2009
Lars Dittmar | 22
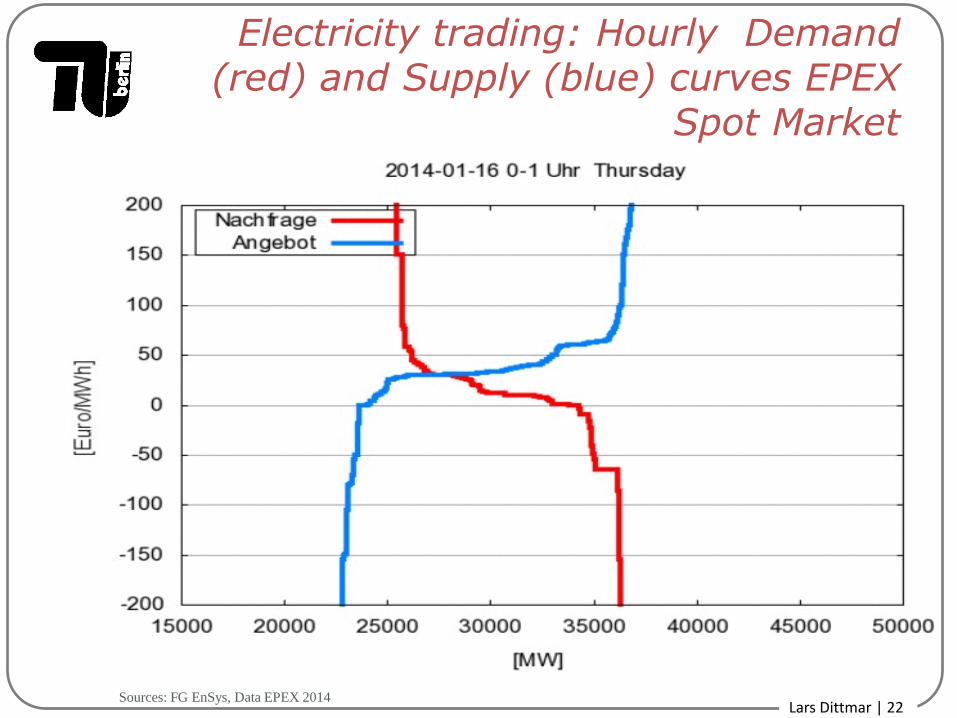
Electricity trading: Hourly Demand (red) and Supply (blue) curves EPEX
Spot Market
Sources: FG EnSys, Data EPEX 2014
Lars Dittmar | 23
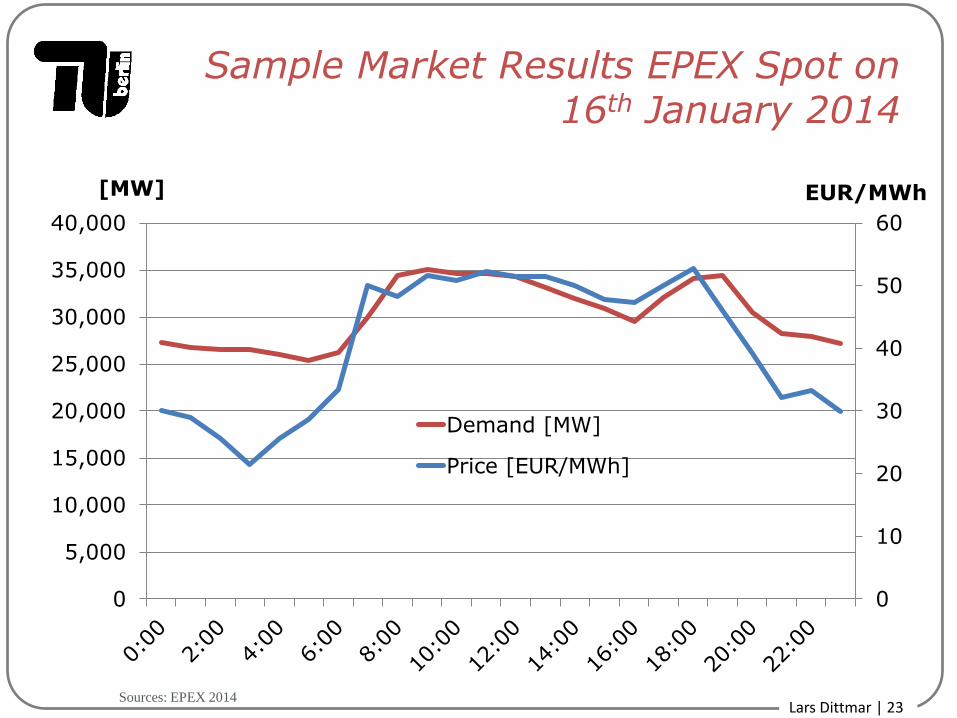
Sample Market Results EPEX Spot on 16th January 2014
0
10
20
30
40
50
60
0
5,000
10,000
15,000
20,000
25,000
30,000
35,000
40,000
EUR/MWh [MW]
Demand [MW]
Price [EUR/MWh]
Sources: EPEX 2014
Lars Dittmar | 24
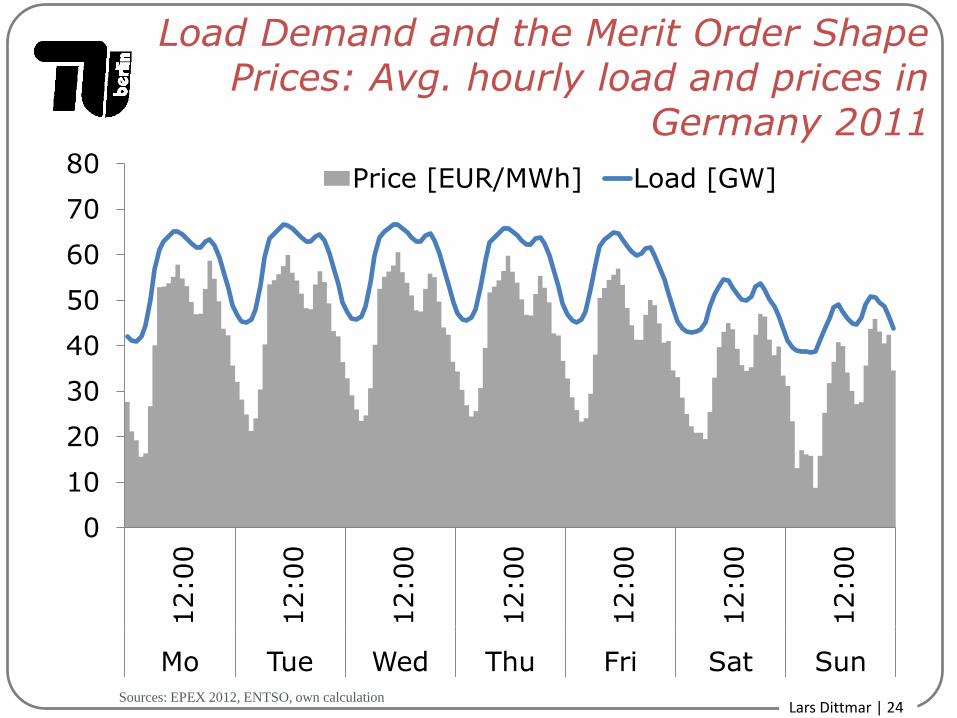
Load Demand and the Merit Order Shape Prices: Avg. hourly load and prices in
Germany 2011
0
10
20
30
40
50
60
70
80 12:0
0
12:0
0
12:0
0
12:0
0
12:0
0
12:0
0
12:0
0
Mo Tue Wed Thu Fri Sat Sun
Price [EUR/MWh] Load [GW]
Sources: EPEX 2012, ENTSO, own calculation
Lars Dittmar | 25
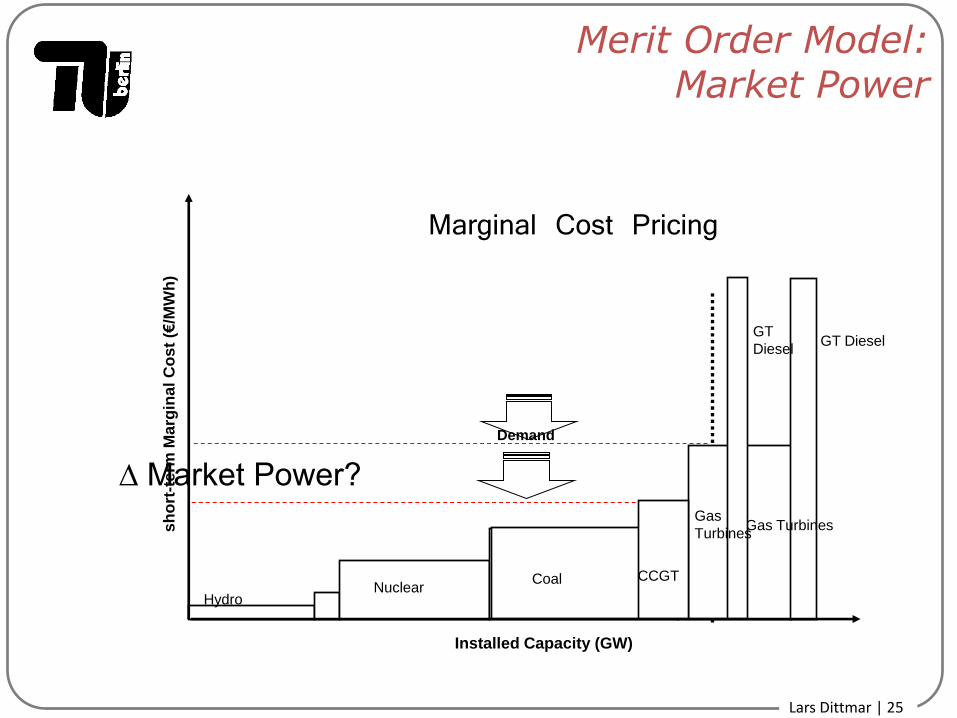
Merit Order Model: Market Power
Hydro Nuclear
Installed Capacity (GW)
Coal
Gas Turbines
GT Diesel
CCGT
sh
ort
-term
Ma
rgin
al
Co
st
(€/M
Wh
)
Demand
Marginal Cost Pricing
Coal
Gas
Turbines
GT
Diesel
CCGT
∆ Market Power?
Lars Dittmar | 26
Merit Order Model: Merit Order Effect of Renewables
REN
Installed Capacity (GW)
short-term Marginal Cost (€/MWh)
P1
PREN
∆ Merit Order Effect
Lars Dittmar | 27
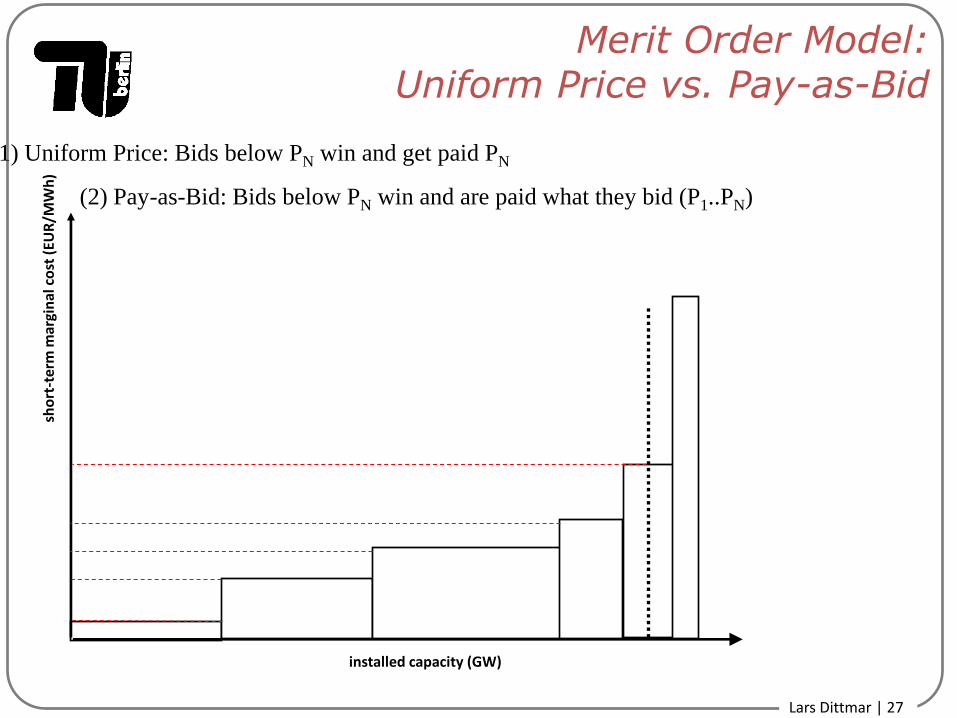
Merit Order Model: Uniform Price vs. Pay-as-Bid
installed capacity (GW)
sho
rt-t
erm
mar
gin
al c
ost
(EU
R/M
Wh
)
(1) Uniform Price: Bids below PN win and get paid PN
(2) Pay-as-Bid: Bids below PN win and are paid what they bid (P1..PN)
Lars Dittmar | 28
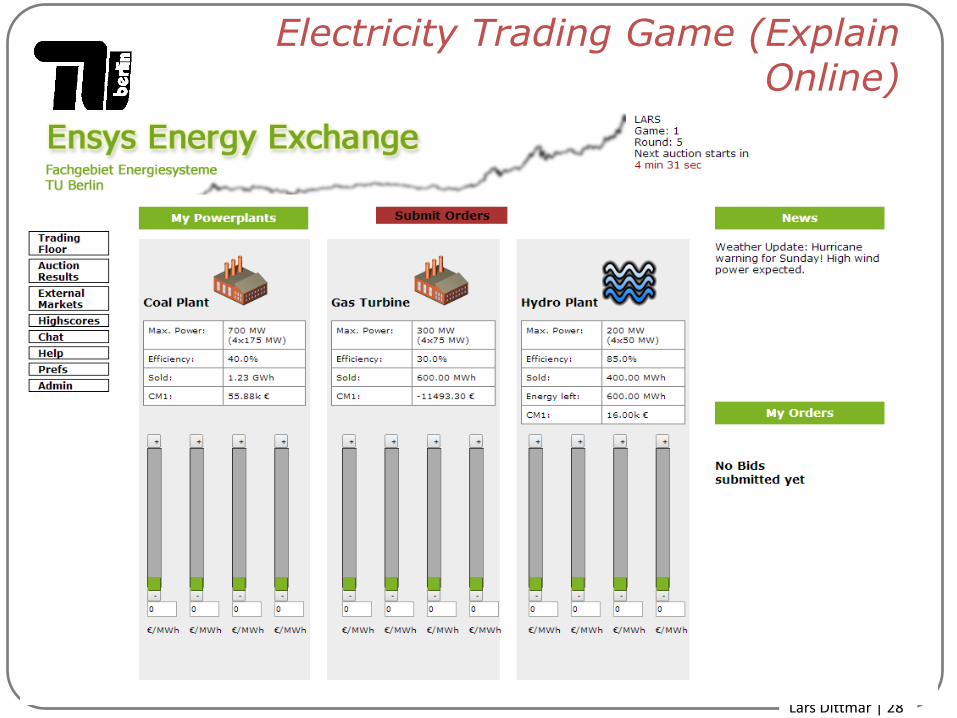
Electricity Trading Game (Explain Online)
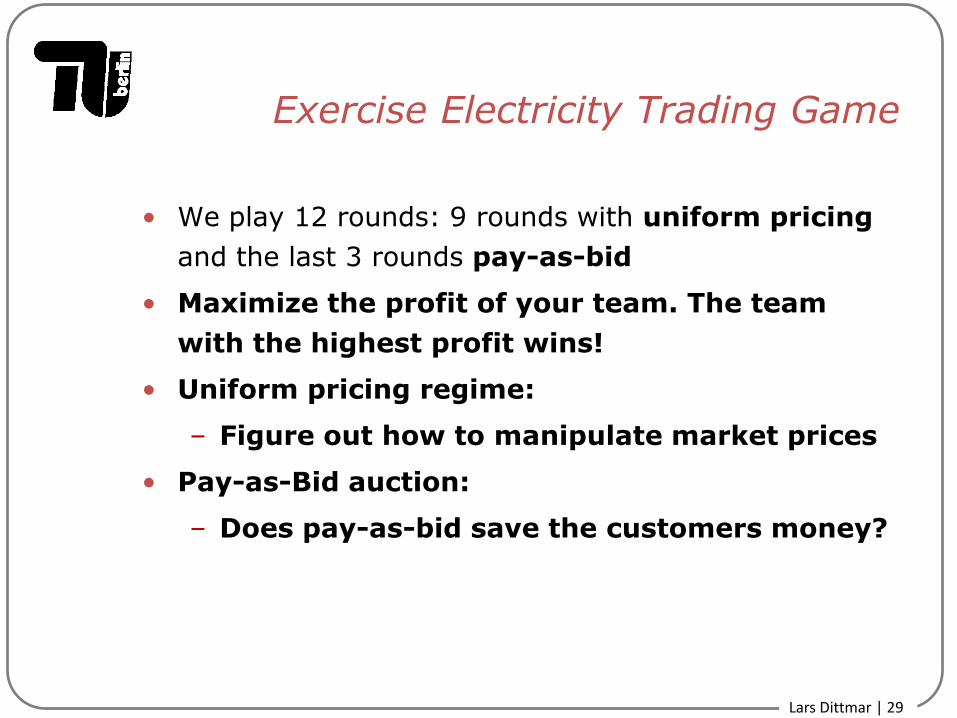
Lars Dittmar | 29
Exercise Electricity Trading Game
• We play 12 rounds: 9 rounds with uniform pricing
and the last 3 rounds pay-as-bid
• Maximize the profit of your team. The team
with the highest profit wins!
• Uniform pricing regime:
– Figure out how to manipulate market prices
• Pay-as-Bid auction:
– Does pay-as-bid save the customers money?

© OECD/IEA 2012
Break
© OECD/IEA 2012
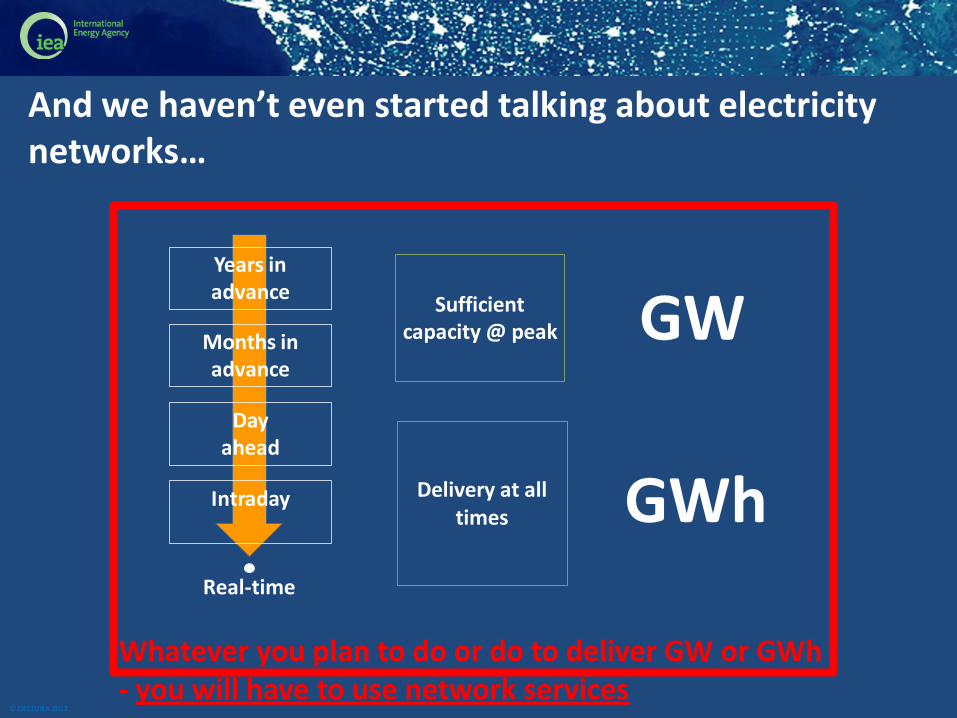
And we haven’t even started talking about electricity networks…
Years in advance
Months in advance
Day ahead
Intraday
Real-time
Sufficient capacity @ peak GW
Delivery at all times GWh
Whatever you plan to do or do to deliver GW or GWh - you will have to use network services
© OECD/IEA 2012
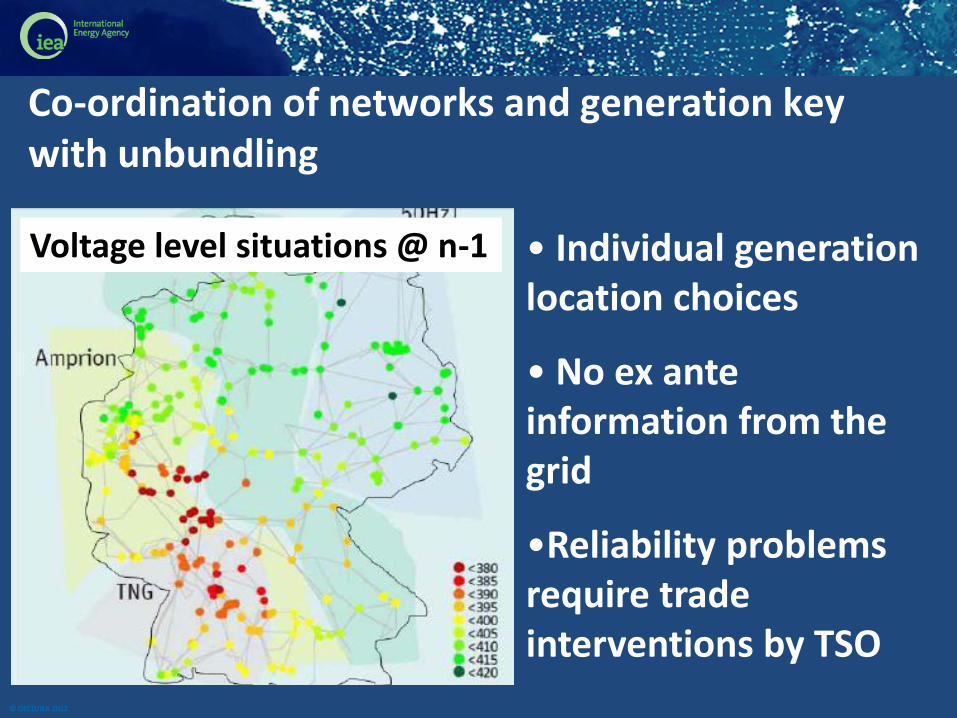
Co-ordination of networks and generation key with unbundling
Voltage level situations @ n-1 • Individual generation location choices
• No ex ante information from the grid
•Reliability problems require trade interventions by TSO
© OECD/IEA 2012
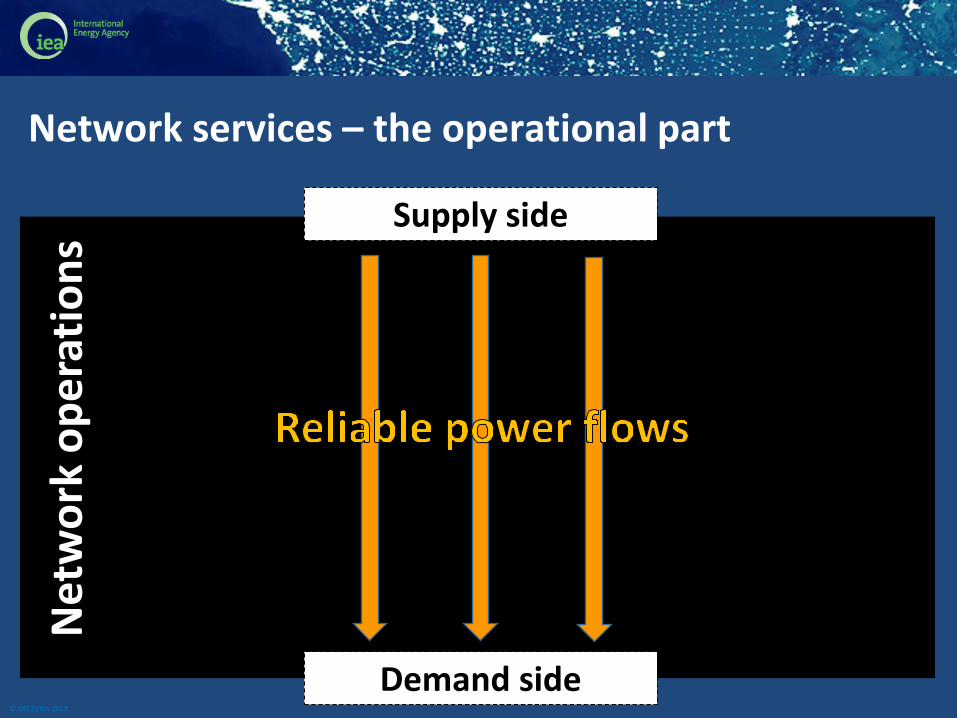
Congestion
Balancing
Further reliability aspects
Network services – the operational part
Net
wo
rk o
pe
rati
on
s
Supply side
Demand side
© OECD/IEA 2012
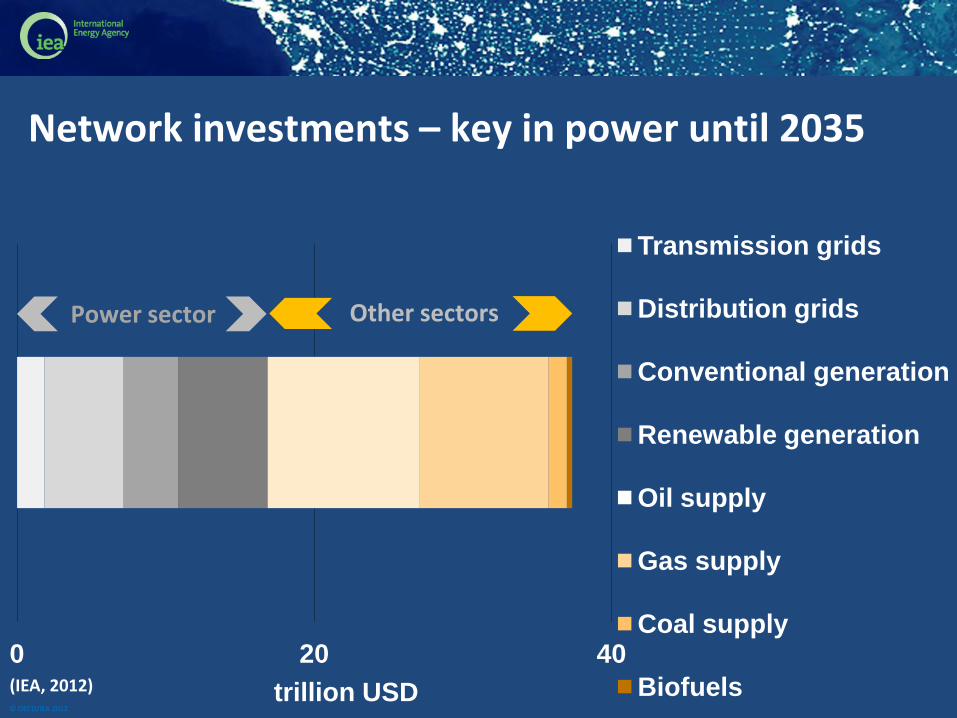
Network investments – key in power until 2035
0 20 40
trillion USD
Transmission grids
Distribution grids
Conventional generation
Renewable generation
Oil supply
Gas supply
Coal supply
Biofuels
Power sector Other sectors
(IEA, 2012)
© OECD/IEA 2012
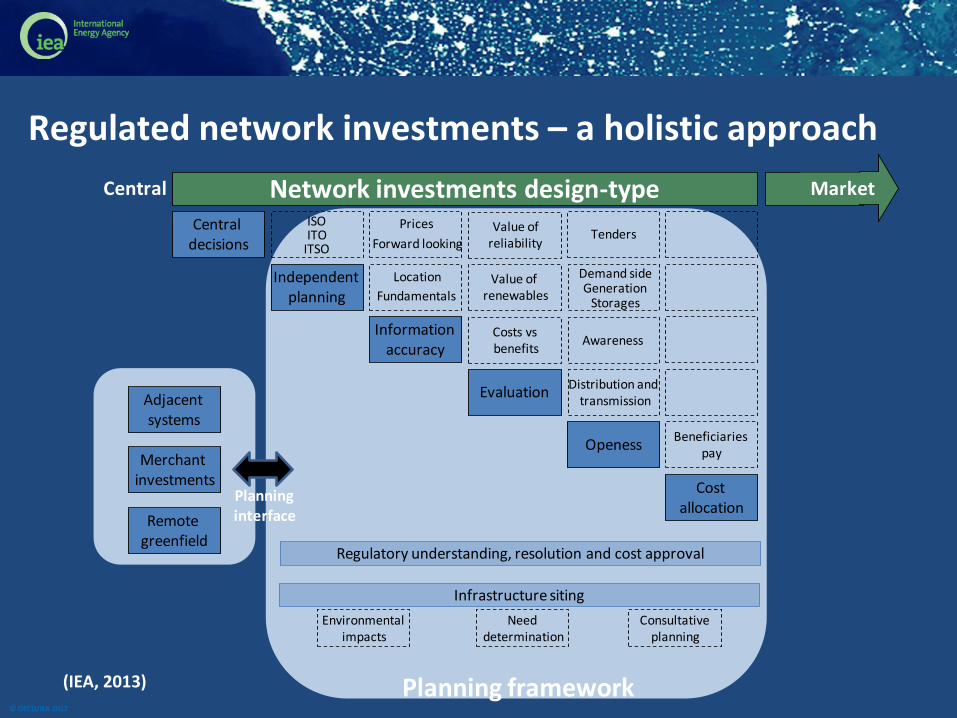
Regulated network investments – a holistic approach
Central
Central decisions
Independent planning
Information accuracy
Evaluation
Openess
Cost allocation
Network investments design-type
Planning framework
ISOITO
ITSO
Location
Prices
Fundamentals
Distribution and transmission
Demand side
StoragesGeneration
AwarenessCosts vs benefits
Beneficiaries pay
Value of renewables
Value ofreliabilityForward looking
Regulatory understanding, resolution and cost approval
Infrastructure siting
Planning interface
Environmental impacts
Need determination
Consultative planning
Adjacent systems
Merchant investments
Remote greenfield
Tenders
Market
(IEA, 2013)

© OECD/IEA 2012
Independent planning facilitation can matter
© OECD/IEA 2012
Evaluation
Network investments design-type Market
Costs vs benefits
Value of renewables
Value ofreliability
Value of trade
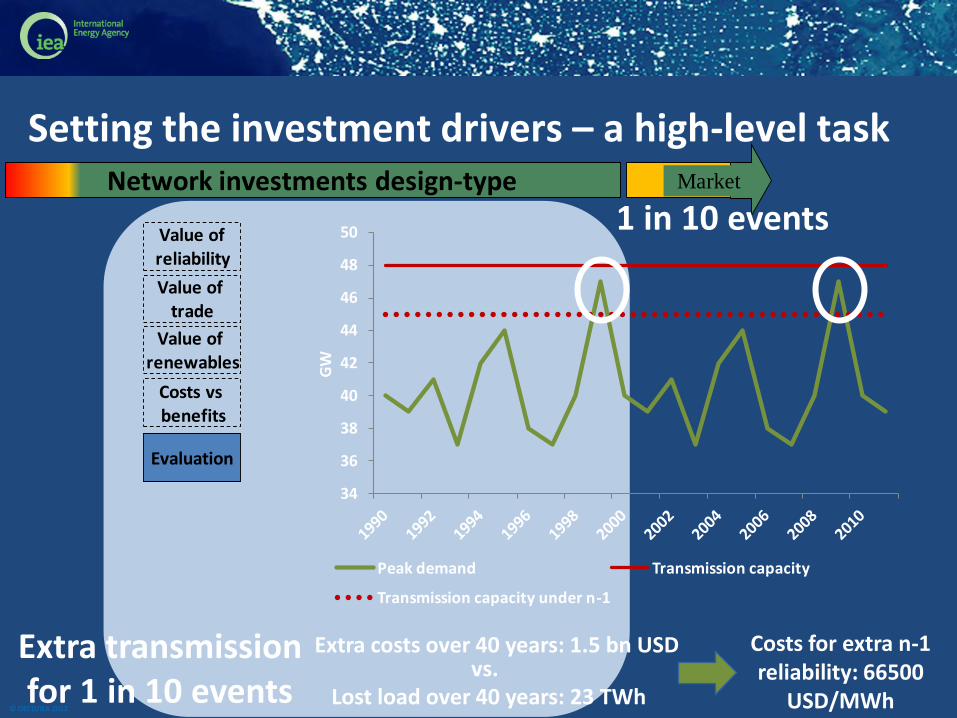
Setting the investment drivers – a high-level task
34
36
38
40
42
44
46
48
50
GW
Peak demand Transmission capacity
Transmission capacity under n-1
1 in 10 events
Extra transmission for 1 in 10 events Lost load over 40 years: 23 TWh
Extra costs over 40 years: 1.5 bn USD vs.
Costs for extra n-1 reliability: 66500
USD/MWh
© OECD/IEA 2012
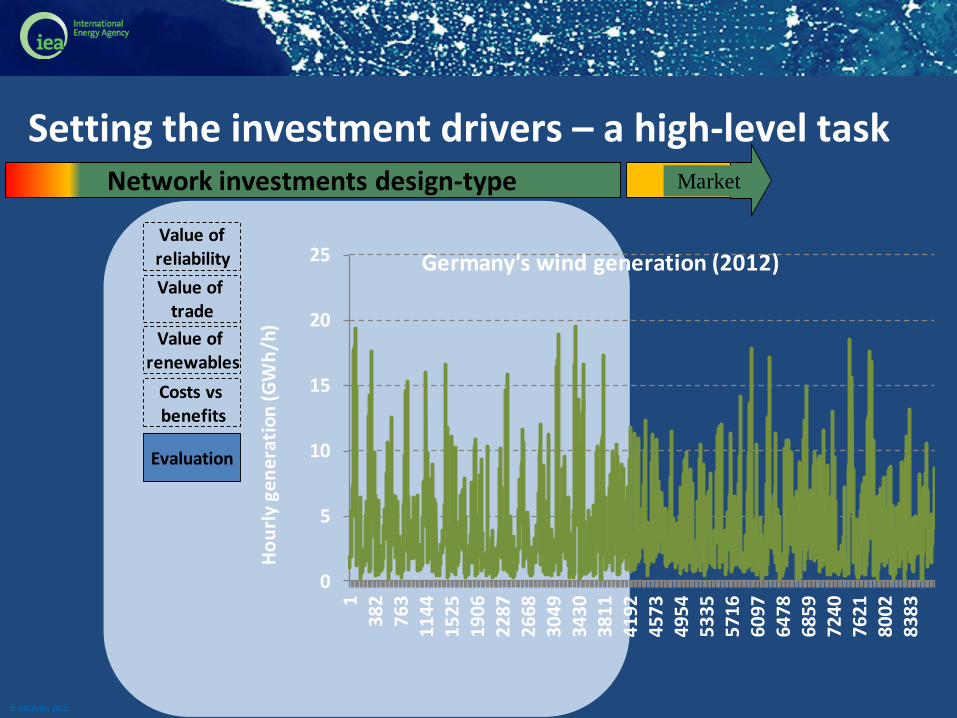
Evaluation
Network investments design-type Market
Costs vs benefits
Value of renewables
Value ofreliability
Value of trade
Setting the investment drivers – a high-level task
0
5
10
15
20
25
13
82
76
31
14
41
52
51
90
62
28
72
66
83
04
93
43
03
81
14
19
24
57
34
95
45
33
55
71
66
09
76
47
86
85
97
24
07
62
18
00
28
38
3
Ho
url
y ge
ne
rati
on
(GW
h/h
)Germany's wind generation (2012)
© OECD/IEA 2012
Evaluation
Network investments design-type Market
Costs vs benefits
Value of renewables
Value ofreliability
Value of trade
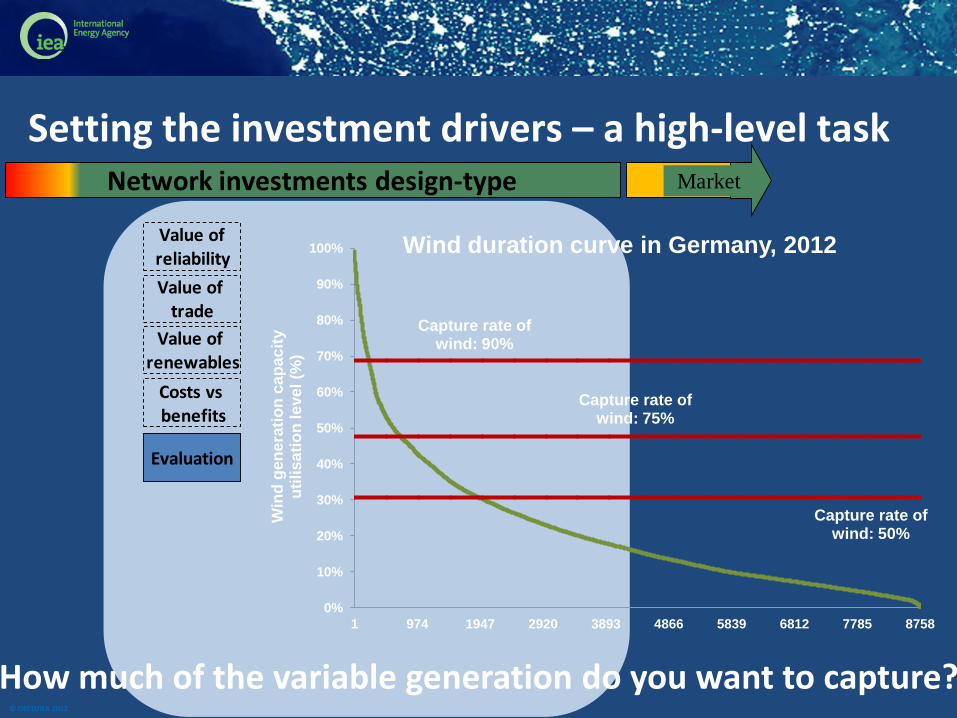
Setting the investment drivers – a high-level task
Capture rate of wind: 50%
Capture rate of wind: 75%
Capture rate of wind: 90%
0%
10%
20%
30%
40%
50%
60%
70%
80%
90%
100%
1 974 1947 2920 3893 4866 5839 6812 7785 8758
Win
d g
en
era
tio
n c
ap
ac
ity
uti
lis
ati
on
le
ve
l (%
)
Wind duration curve in Germany, 2012
How much of the variable generation do you want to capture?
© OECD/IEA 2012
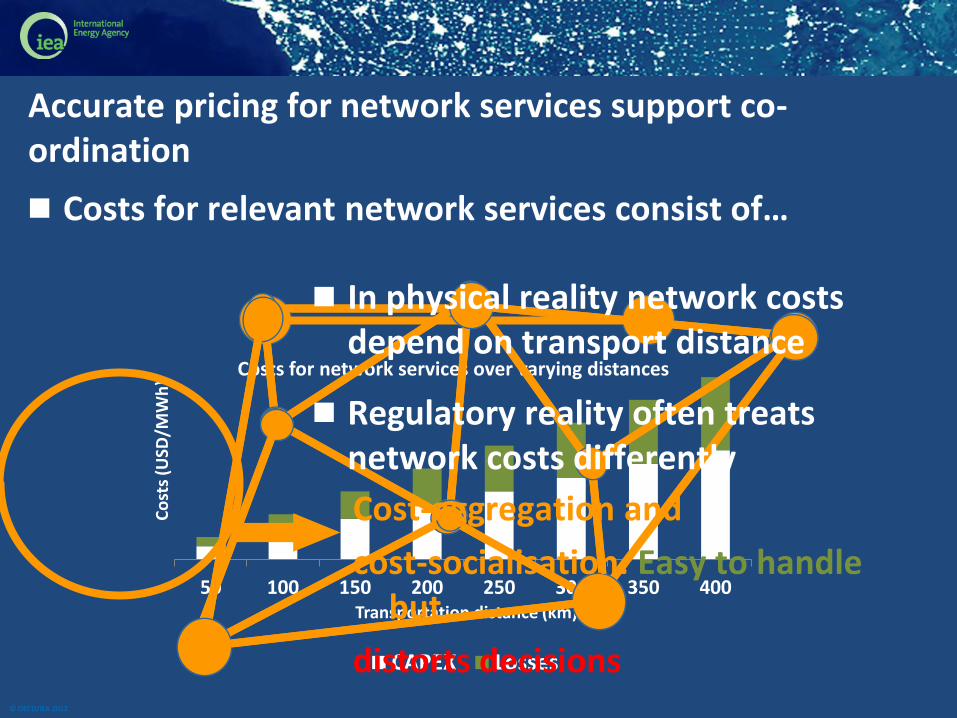
Accurate pricing for network services support co-ordination
Costs for relevant network services consist of…
50 100 150 200 250 300 350 400
Co
sts
(USD
/MW
h)
Transportation distance (km)
Costs for network services over varying distances
CAPEX Losses
In physical reality network costs depend on transport distance
Regulatory reality often treats network costs differently
Cost-aggregation and
cost-socialisation. Easy to handle but
distorts decisions

© OECD/IEA 2012
Accurate pricing for network services support co-ordination
What is the distortion exactly?
G2
G1 L G1
Cost of production: 40 USD/MWh
G2
Cost of production: 42 USD/MWh
Cost of network losses: 5 USD/MWh
Cost of losses: 2 USD/MWh
Situation 1 (socialisation): G1 wins against G2
High network losses Total costs: 45 USD/MWh
Situation 2 (precision): G2 wins against G1
Low network losses Total costs: 44 USD/MWh
© OECD/IEA 2012
Accurate pricing for network services support co-ordination
What is the distortion exactly?
G2
G1 L G1
Cost of production: 40 USD/MWh
G2
Cost of production: 42 USD/MWh
Cost of network augmentation: 10 USD/MWh
Cost of augmentation: 2 USD/MWh
Situation 1 (socialisation): G1 wins against G2
High network CAPEX Total costs: 50 USD/MWh
Situation 2 (precision): G2 wins against G1
Low network CAPEX Total costs: 44 USD/MWh
© OECD/IEA 2012
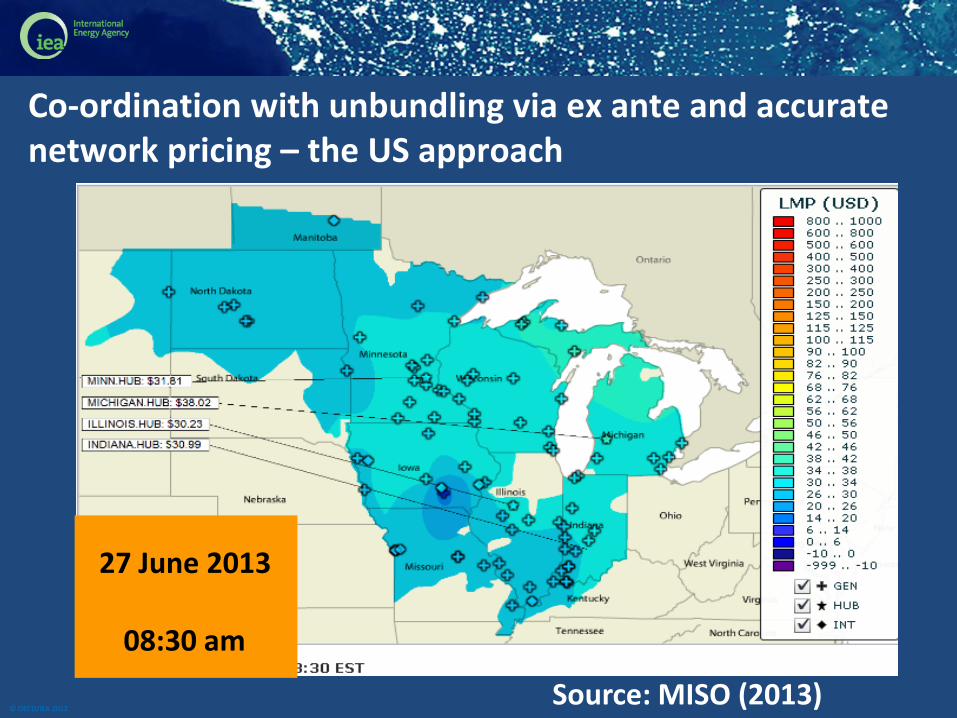
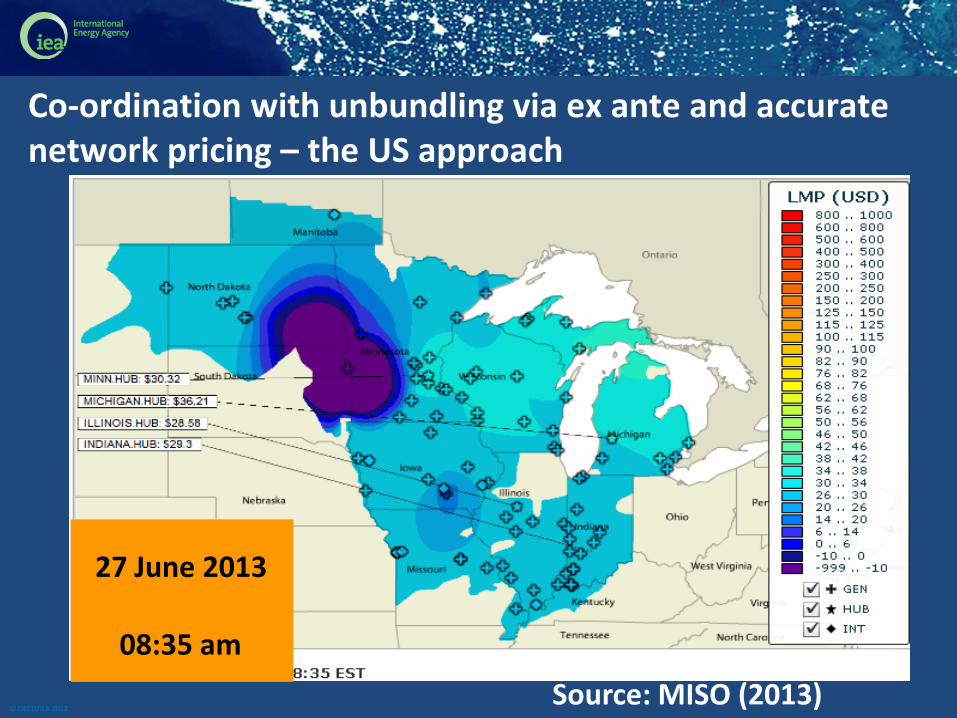
Co-ordination with unbundling via ex ante and accurate network pricing – the US approach
Source: MISO (2013)
27 June 2013
08:30 am
© OECD/IEA 2012
Co-ordination with unbundling via ex ante and accurate network pricing – the US approach
Source: MISO (2013)
27 June 2013
08:35 am
© OECD/IEA 2012
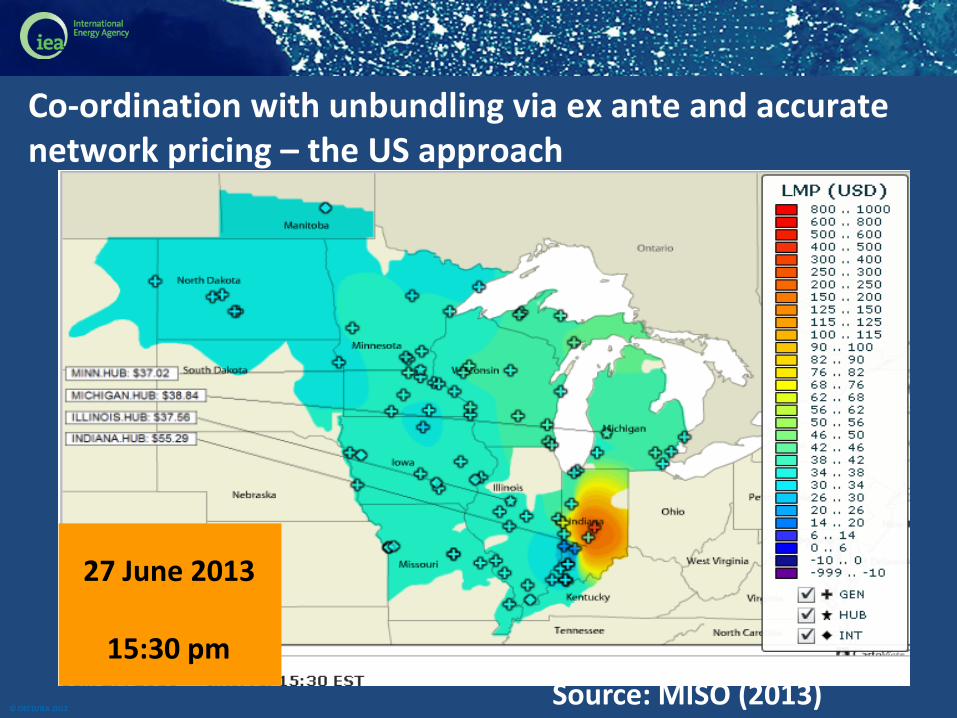
Co-ordination with unbundling via ex ante and accurate network pricing – the US approach
Source: MISO (2013)
27 June 2013
15:30 pm
© OECD/IEA 2012
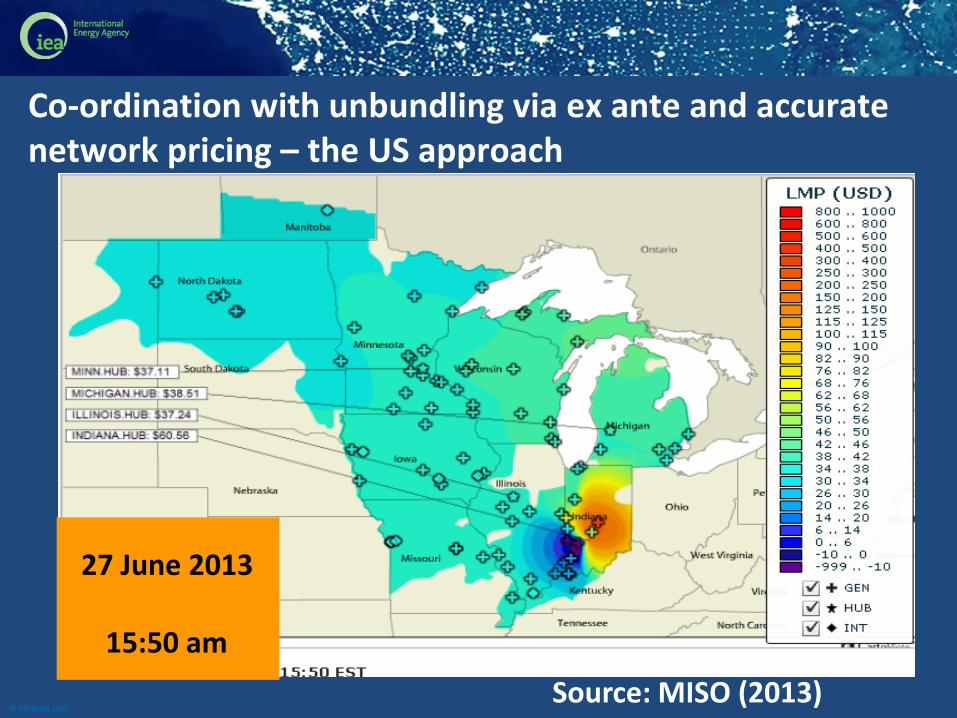
Co-ordination with unbundling via ex ante and accurate network pricing – the US approach
Source: MISO (2013)
27 June 2013
15:50 am
© OECD/IEA 2012
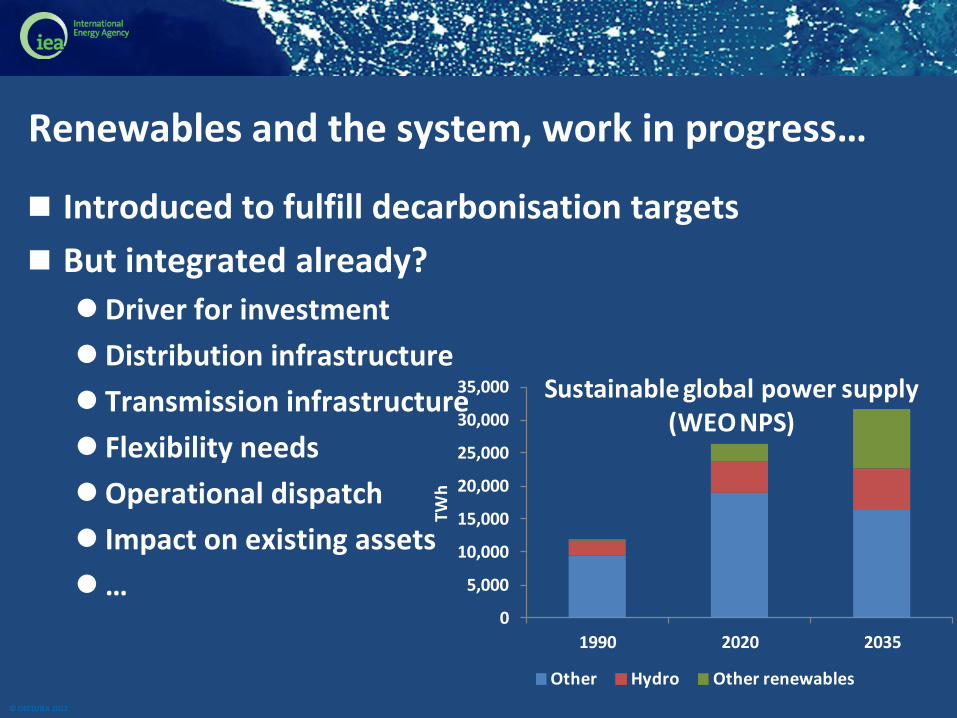
Renewables and the system, work in progress…
Introduced to fulfill decarbonisation targets
But integrated already?
Driver for investment
Distribution infrastructure
Transmission infrastructure
Flexibility needs
Operational dispatch
Impact on existing assets
… 0
5,000
10,000
15,000
20,000
25,000
30,000
35,000
1990 2020 2035
TWh
Sustainable global power supply (WEO NPS)
Other Hydro Other renewables
© OECD/IEA 2012
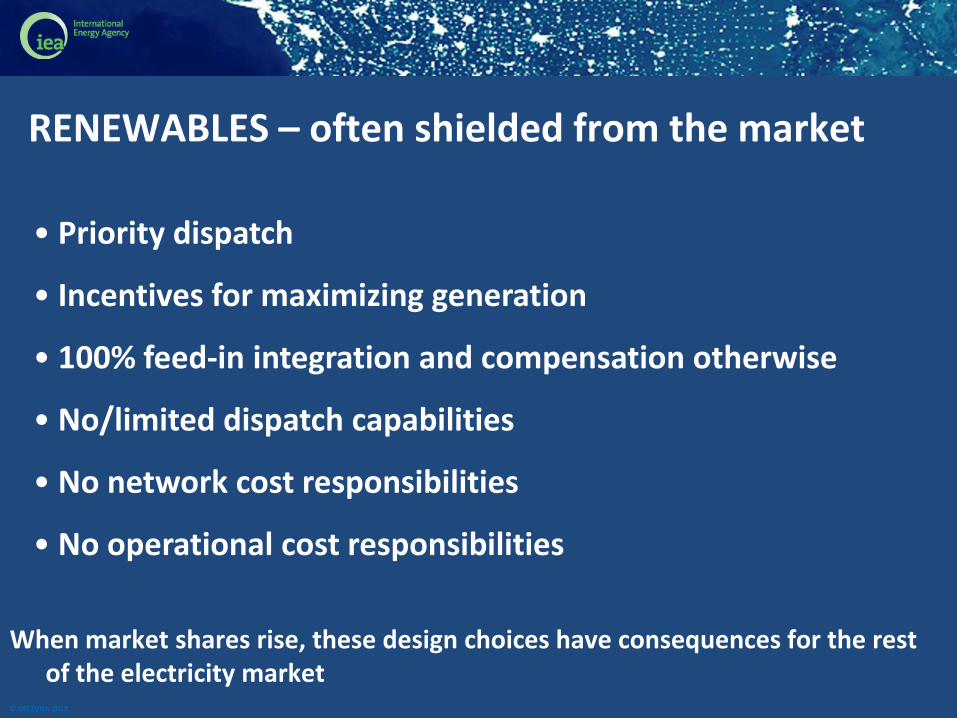
RENEWABLES – often shielded from the market
• Priority dispatch
• Incentives for maximizing generation
• 100% feed-in integration and compensation otherwise
• No/limited dispatch capabilities
• No network cost responsibilities
• No operational cost responsibilities
When market shares rise, these design choices have consequences for the rest
of the electricity market
© OECD/IEA 2012
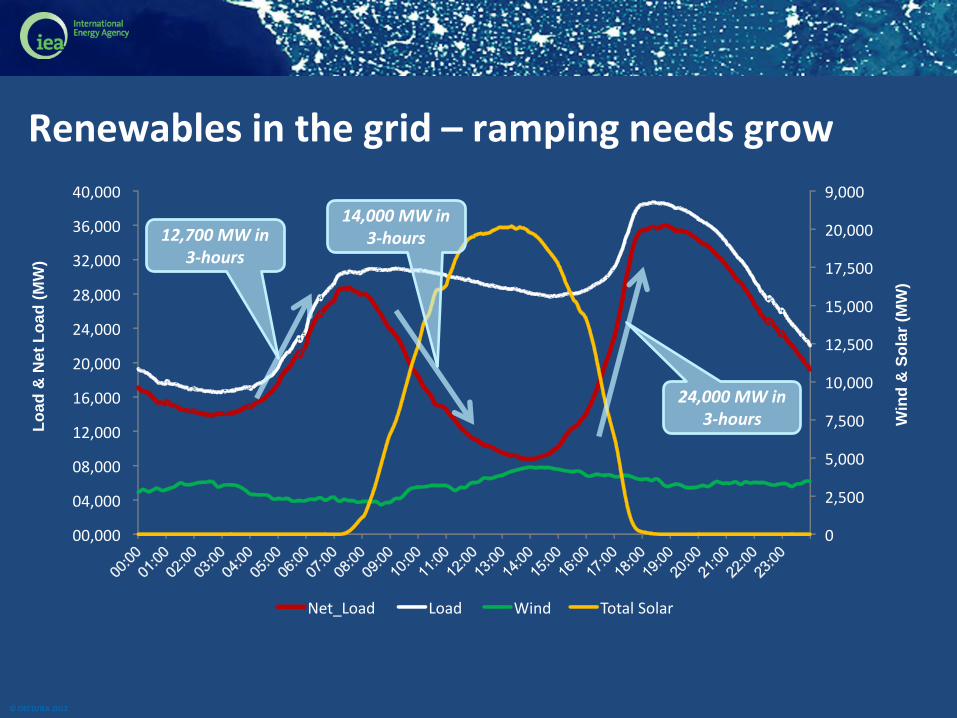
Renewables in the grid – ramping needs grow
Lo
ad
& N
et
Lo
ad
(M
W)
0
2,500
5,000
7,500
10,000
12,500
15,000
17,500
20,000
9,000
00,000
04,000
08,000
12,000
16,000
20,000
24,000
28,000
32,000
36,000
40,000
Net_Load Load Wind Total Solar
Win
d &
So
lar
(MW
)
12,700 MW in 3-hours
14,000 MW in 3-hours
24,000 MW in 3-hours
© OECD/IEA 2012
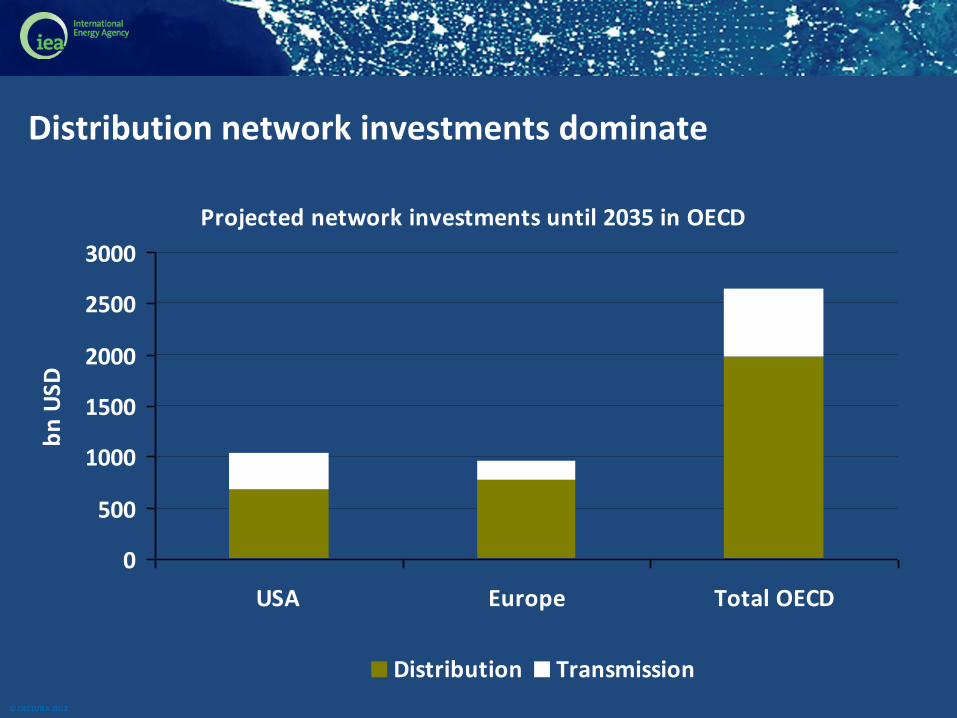
Distribution network investments dominate
Projected network investments until 2035 in OECD
0
500
1000
1500
2000
2500
3000
USA Europe Total OECD
bn
USD
Distribution Transmission
© OECD/IEA 2012
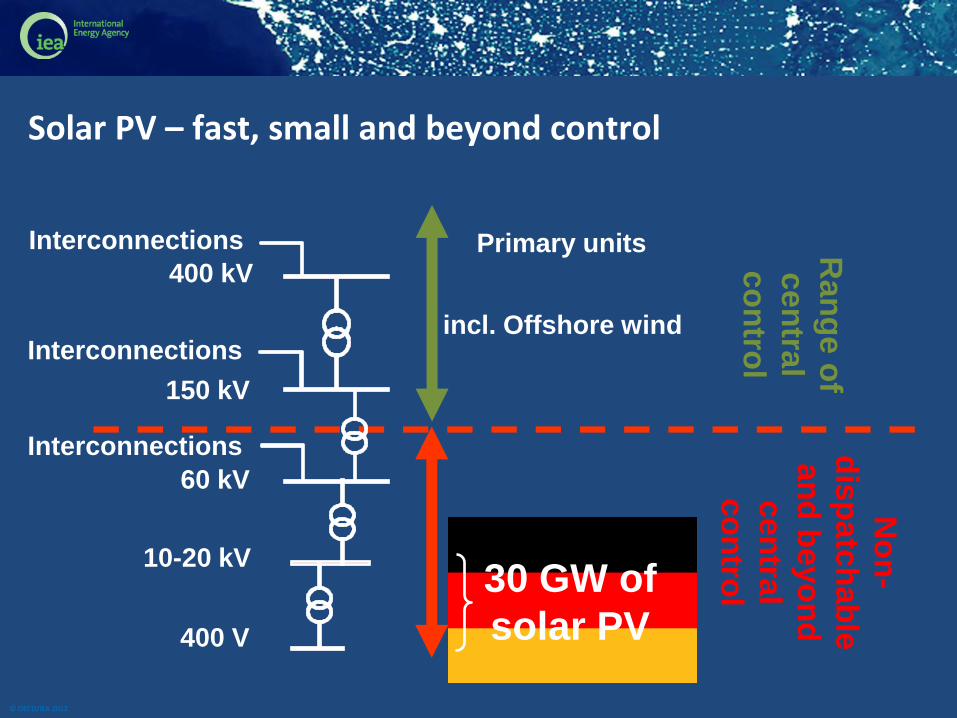
Solar PV – fast, small and beyond control
400 kV
Interconnections
Interconnections
Interconnections
150 kV
60 kV
10-20 kV
400 V
Primary units
incl. Offshore wind
Ran
ge o
f
cen
tral
co
ntro
l
No
n-
dis
patc
hab
le
an
d b
eyo
nd
cen
tral
co
ntro
l 30 GW of
solar PV
© OECD/IEA 2012
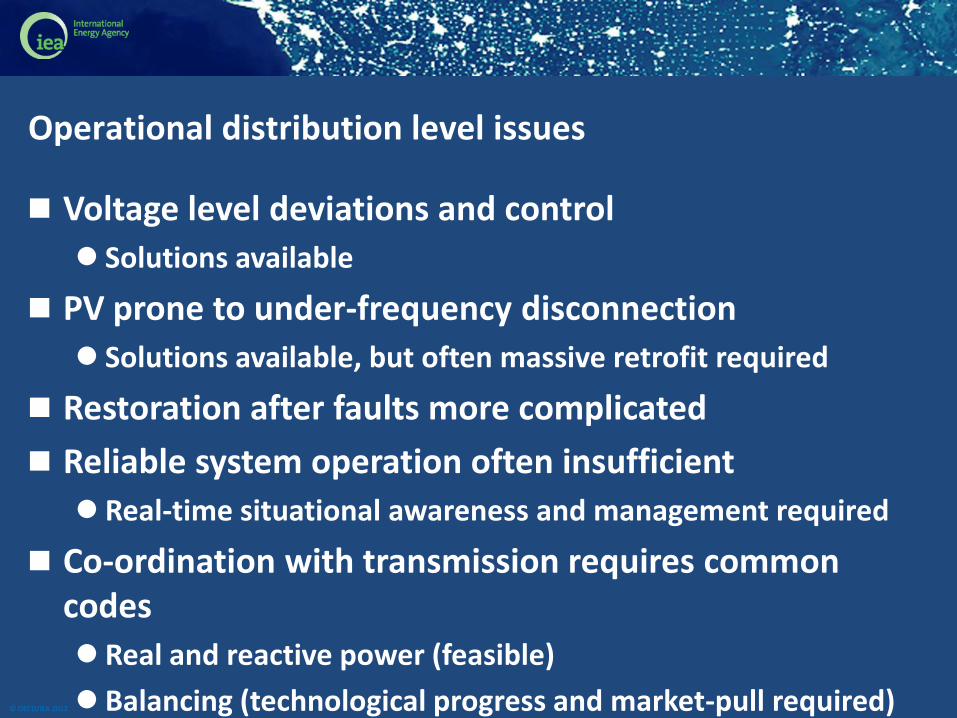
Operational distribution level issues
Voltage level deviations and control
Solutions available
PV prone to under-frequency disconnection
Solutions available, but often massive retrofit required
Restoration after faults more complicated
Reliable system operation often insufficient
Real-time situational awareness and management required
Co-ordination with transmission requires common codes
Real and reactive power (feasible)
Balancing (technological progress and market-pull required)

© OECD/IEA 2012
Q&A
Lars Dittmar | 54
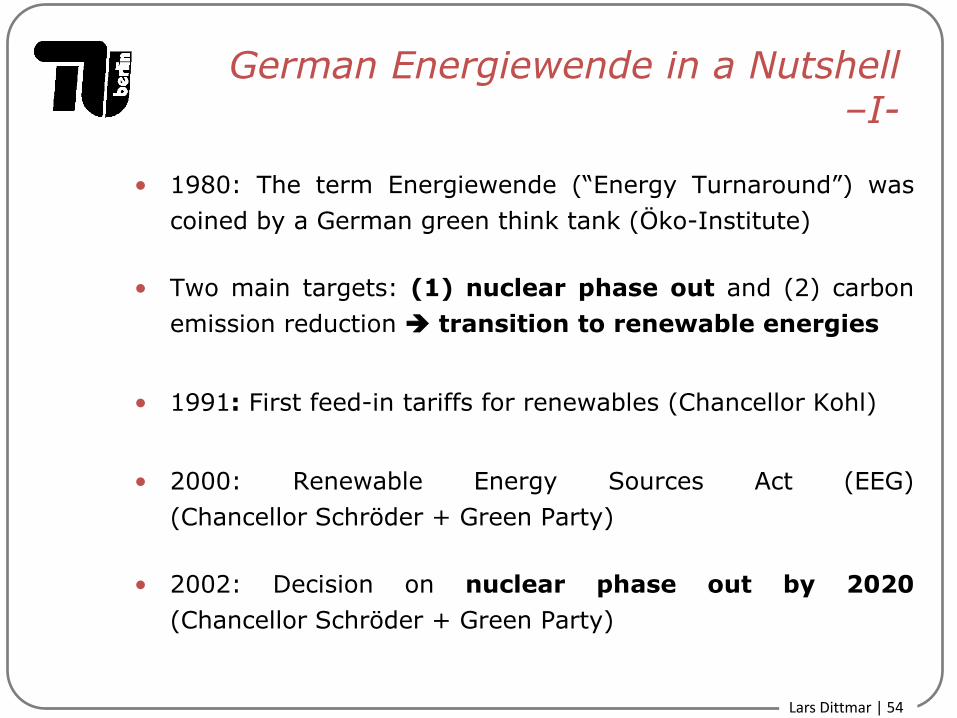
German Energiewende in a Nutshell –I-
• 1980: The term Energiewende (“Energy Turnaround”) was
coined by a German green think tank (Öko-Institute)
• Two main targets: (1) nuclear phase out and (2) carbon
emission reduction transition to renewable energies
• 1991: First feed-in tariffs for renewables (Chancellor Kohl)
• 2000: Renewable Energy Sources Act (EEG)
(Chancellor Schröder + Green Party)
• 2002: Decision on nuclear phase out by 2020
(Chancellor Schröder + Green Party)
Lars Dittmar | 55
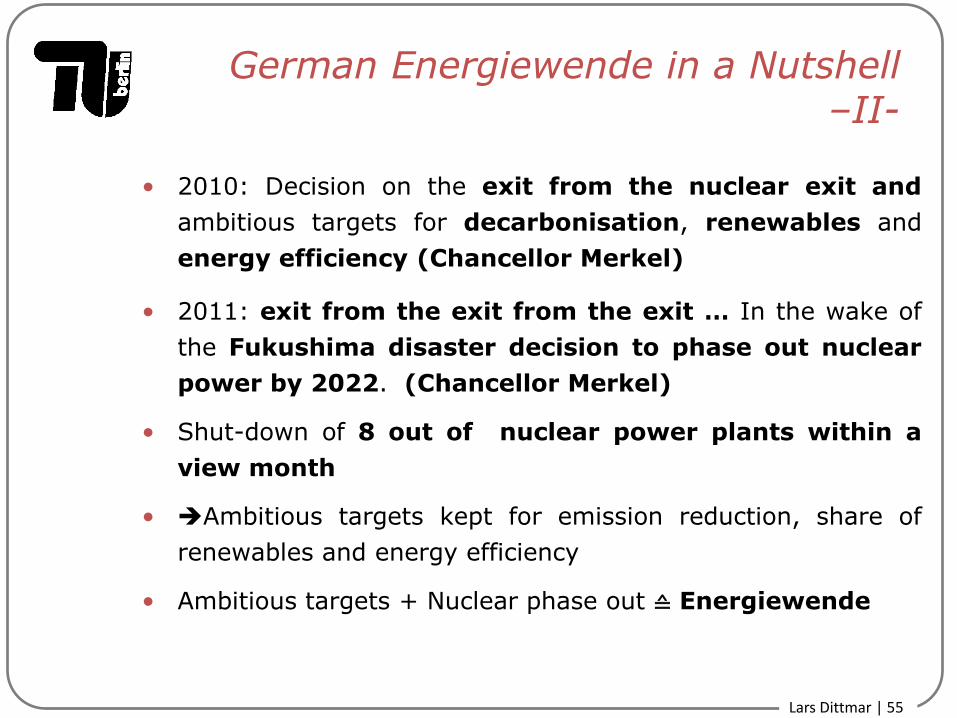
German Energiewende in a Nutshell –II-
• 2010: Decision on the exit from the nuclear exit and
ambitious targets for decarbonisation, renewables and
energy efficiency (Chancellor Merkel)
• 2011: exit from the exit from the exit … In the wake of
the Fukushima disaster decision to phase out nuclear
power by 2022. (Chancellor Merkel)
• Shut-down of 8 out of nuclear power plants within a
view month
• Ambitious targets kept for emission reduction, share of
renewables and energy efficiency
• Ambitious targets + Nuclear phase out ≙ Energiewende
Lars Dittmar | 56
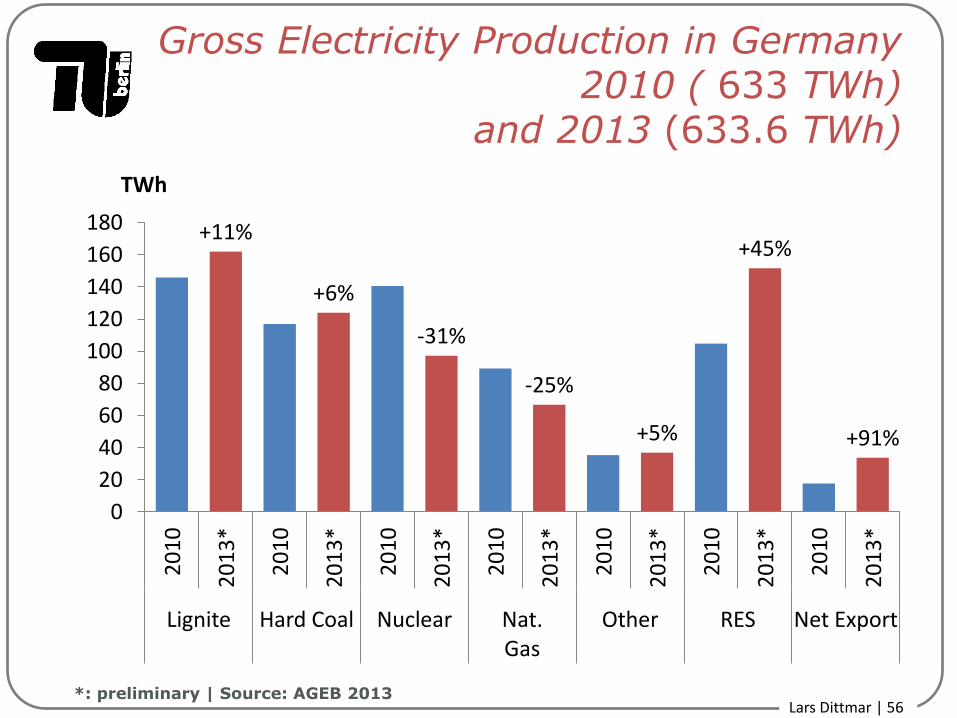
Gross Electricity Production in Germany 2010 ( 633 TWh)
and 2013 (633.6 TWh)
*: preliminary | Source: AGEB 2013
+11%
+6%
-31%
-25%
+5%
+45%
+91%
0
20
40
60
80
100
120
140
160
180
20
10
20
13
*
20
10
20
13
*
20
10
20
13
*
20
10
20
13
*
20
10
20
13
*
20
10
20
13
*
20
10
20
13
*
Lignite Hard Coal Nuclear Nat. Gas
Other RES Net Export
TWh
Lars Dittmar | 57
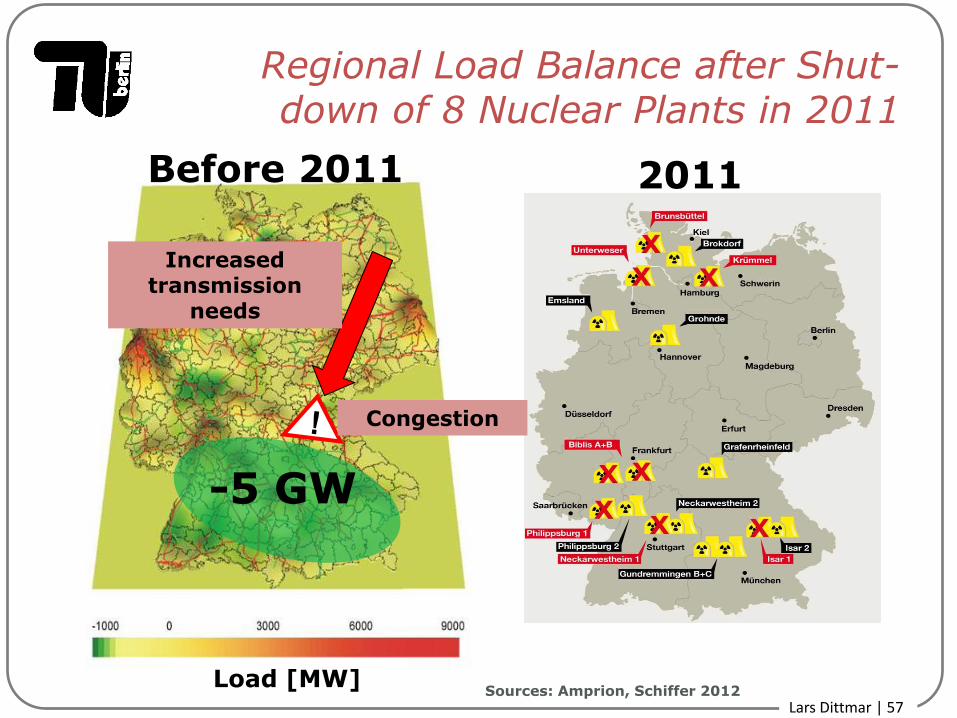
Regional Load Balance after Shut-down of 8 Nuclear Plants in 2011
Load [MW]
Before 2011 2011
Increased transmission
needs
Congestion
-5 GW
Sources: Amprion, Schiffer 2012
Lars Dittmar | 58
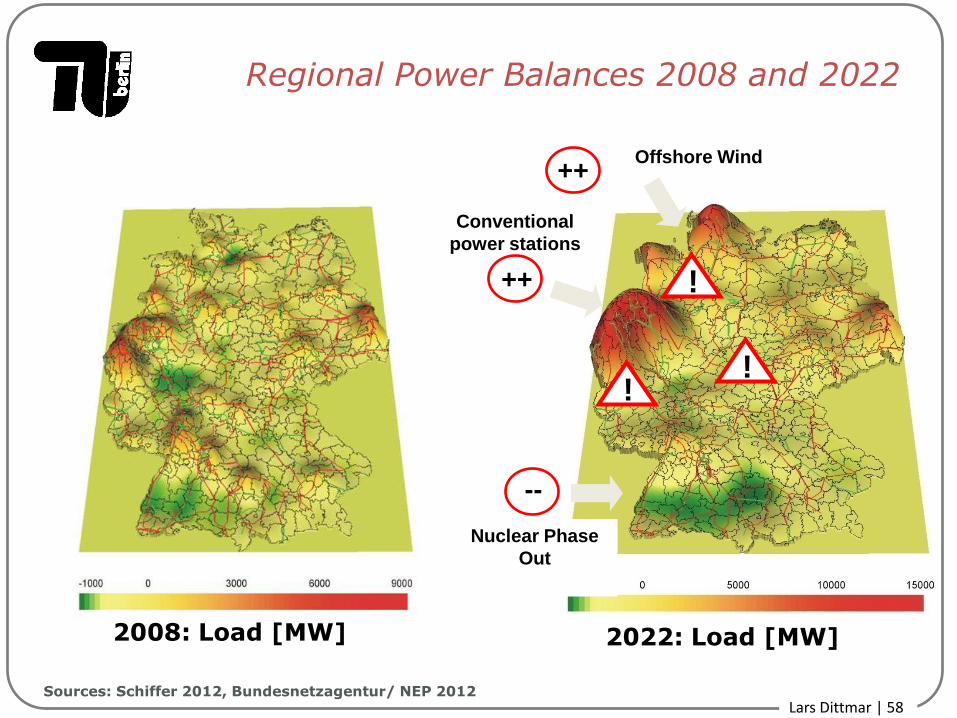
--
++
++
Offshore Wind
Conventional
power stations
Nuclear Phase
Out
!
!
!
Regional Power Balances 2008 and 2022
2008: Load [MW] 2022: Load [MW]
Sources: Schiffer 2012, Bundesnetzagentur/ NEP 2012
Lars Dittmar | 59
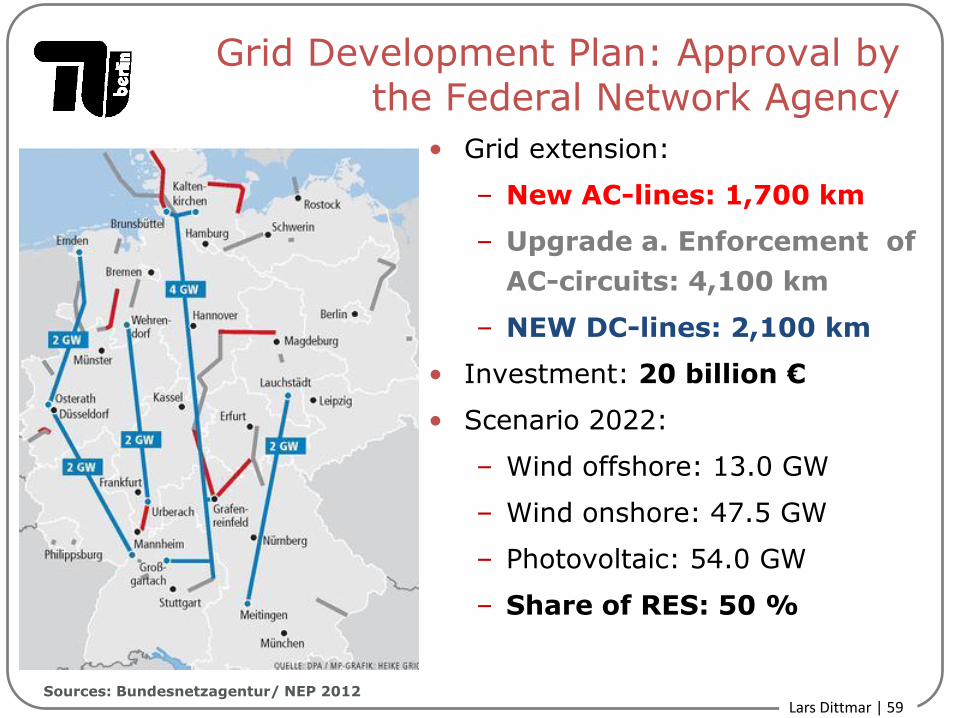
Grid Development Plan: Approval by the Federal Network Agency
• Grid extension:
– New AC-lines: 1,700 km
– Upgrade a. Enforcement of
AC-circuits: 4,100 km
– NEW DC-lines: 2,100 km
• Investment: 20 billion €
• Scenario 2022:
– Wind offshore: 13.0 GW
– Wind onshore: 47.5 GW
– Photovoltaic: 54.0 GW
– Share of RES: 50 %
Sources: Bundesnetzagentur/ NEP 2012
Lars Dittmar | 60
Development of Renewable Electricity in Germany
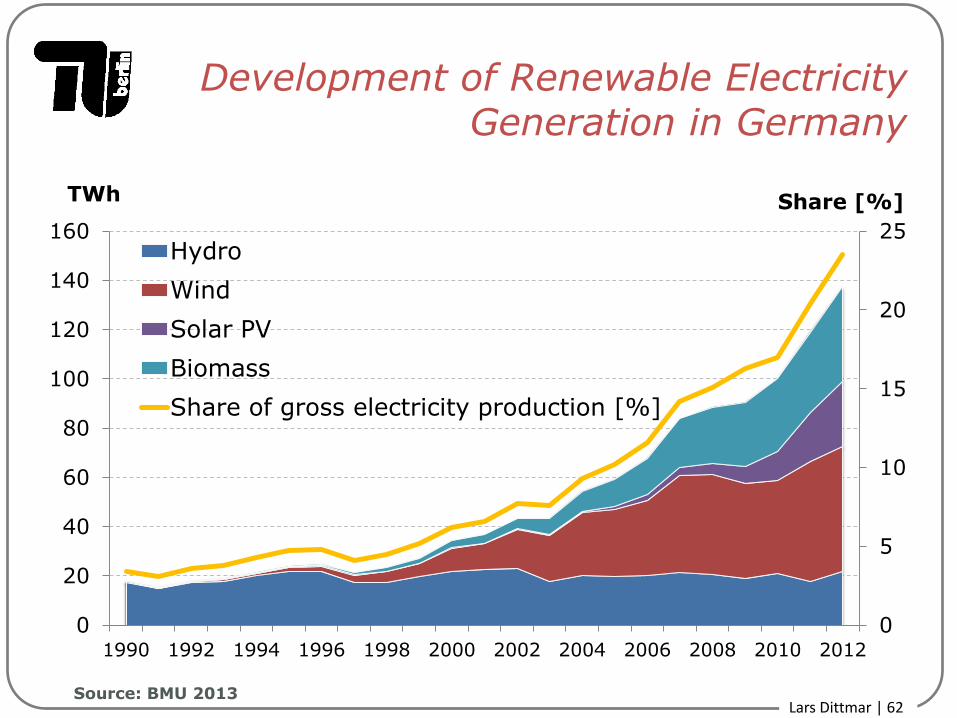
• Induced by the German Renewable Energy Sources Act
(EEG) the share of renewables in the German electricity mix
increased from 7 to 23 percent (≈ 117 TWh) between 2000
and 2012.
• In the same timeframe annual gross transfer payments grew
from EUR 1.2 to EUR 21 billion (≈ 342 USD/Cap/a).
• The difference between transfer payments and the market value
of renewable electricity (net burden) is apportioned to
consumers via their electricity bills as levy (“EEG levy”).
• The total EEG levy (= net burden) in 2012 amounts to EUR 17
billion (≈ 270 USD/Cap/a)
Lars Dittmar | 61
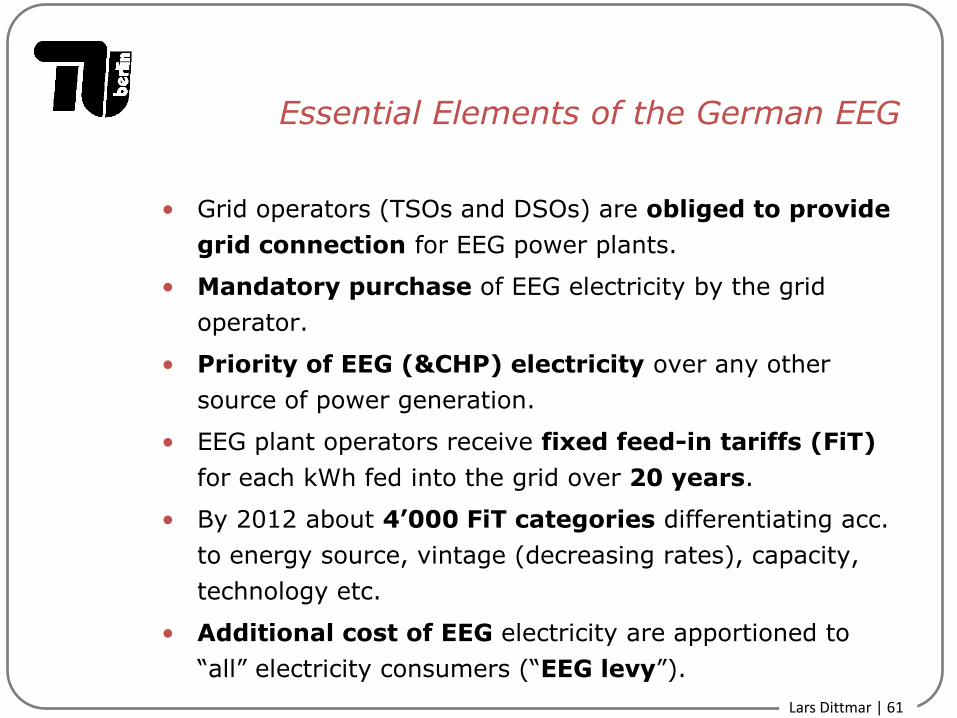
Essential Elements of the German EEG
• Grid operators (TSOs and DSOs) are obliged to provide
grid connection for EEG power plants.
• Mandatory purchase of EEG electricity by the grid
operator.
• Priority of EEG (&CHP) electricity over any other
source of power generation.
• EEG plant operators receive fixed feed-in tariffs (FiT)
for each kWh fed into the grid over 20 years.
• By 2012 about 4’000 FiT categories differentiating acc.
to energy source, vintage (decreasing rates), capacity,
technology etc.
• Additional cost of EEG electricity are apportioned to
“all” electricity consumers (“EEG levy”).
Lars Dittmar | 62
Development of Renewable Electricity Generation in Germany
Source: BMU 2013
0
5
10
15
20
25
0
20
40
60
80
100
120
140
160
1990 1992 1994 1996 1998 2000 2002 2004 2006 2008 2010 2012
Share [%] TWh
Hydro
Wind
Solar PV
Biomass
Share of gross electricity production [%]
Lars Dittmar | 63
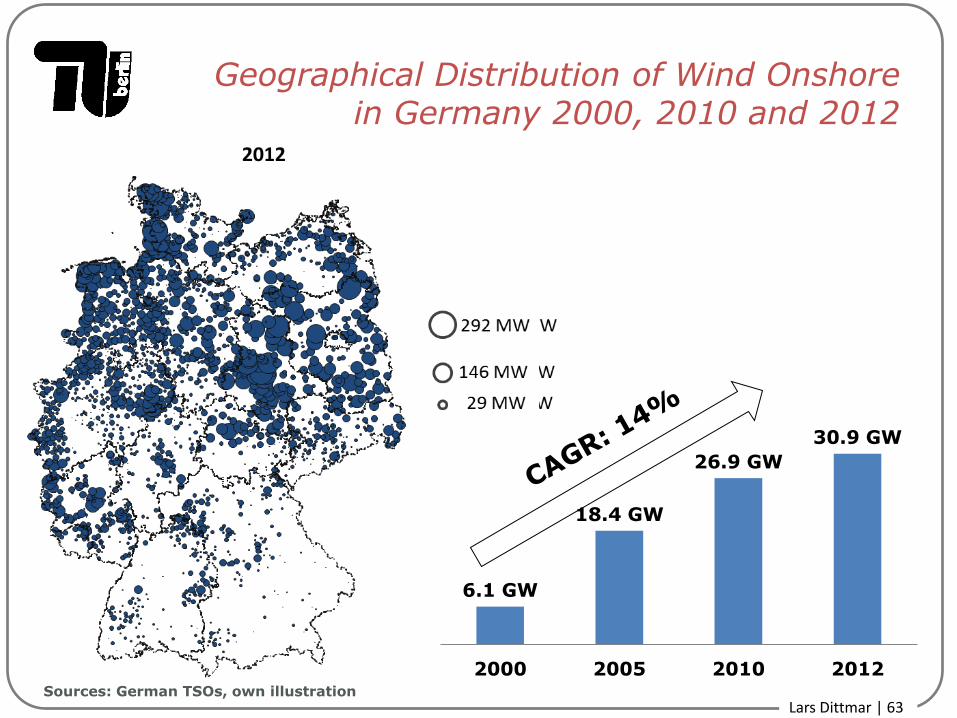
Geographical Distribution of Wind Onshore in Germany 2000, 2010 and 2012
6.1 GW
18.4 GW
26.9 GW
30.9 GW
2000 2005 2010 2012 Sources: German TSOs, own illustration
Lars Dittmar | 64
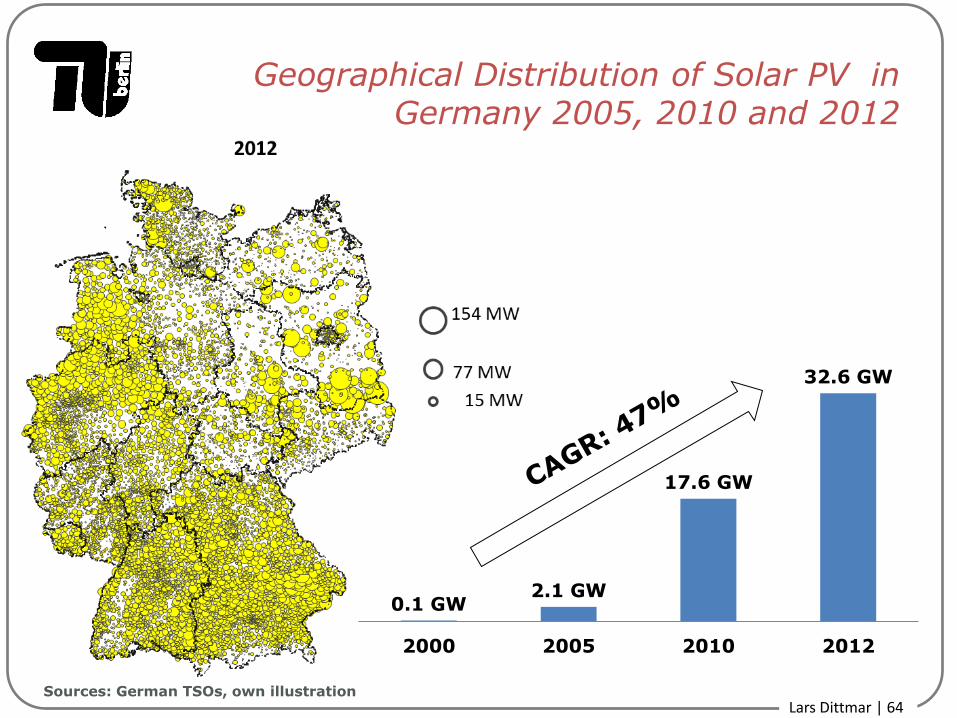
Geographical Distribution of Solar PV in Germany 2005, 2010 and 2012
0.1 GW 2.1 GW
17.6 GW
32.6 GW
2000 2005 2010 2012
Sources: German TSOs, own illustration
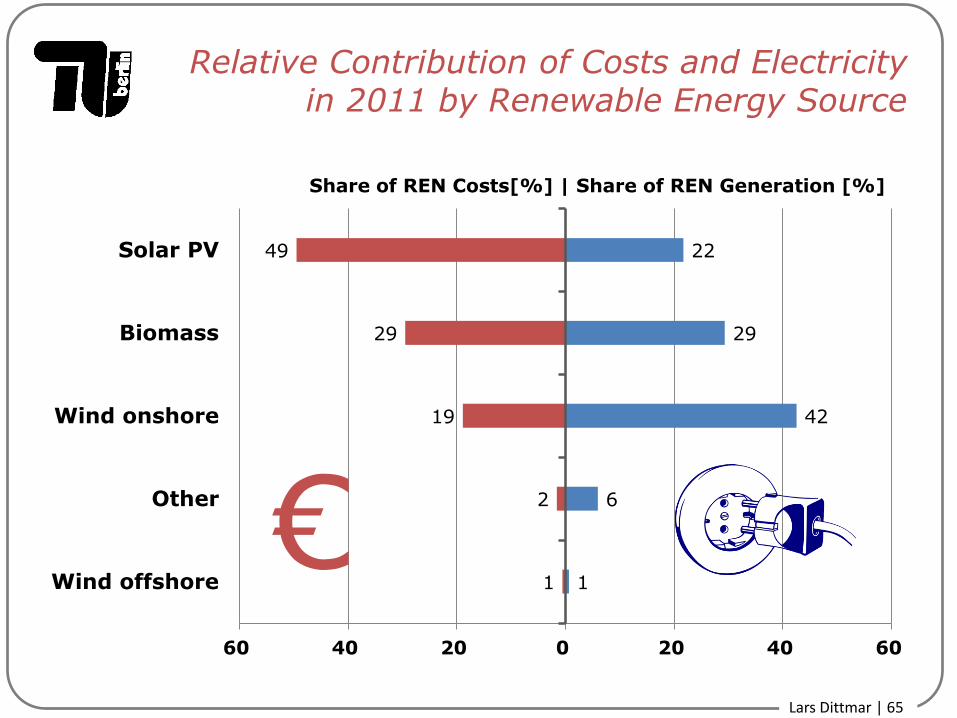
Lars Dittmar | 65
Relative Contribution of Costs and Electricity in 2011 by Renewable Energy Source
1
2
19
29
49
1
6
42
29
22
60 40 20 0 20 40 60
Wind offshore
Other
Wind onshore
Biomass
Solar PV
Share of REN Costs[%] | Share of REN Generation [%]
€
Lars Dittmar | 66
Energiewende and the Electricity Market
Lars Dittmar | 67
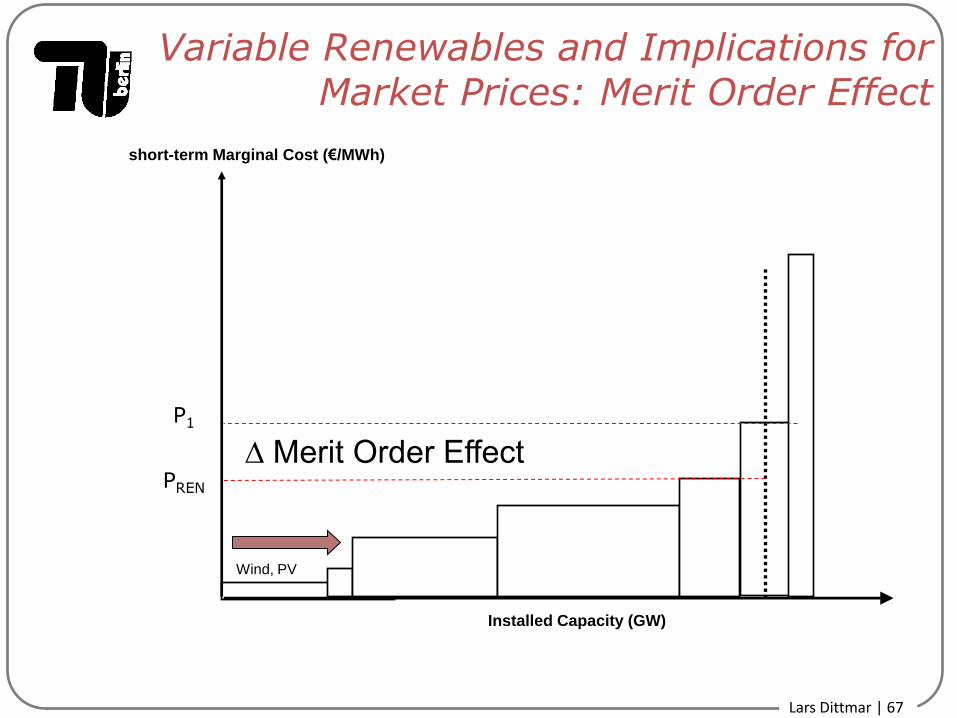
Variable Renewables and Implications for Market Prices: Merit Order Effect
Wind, PV
Installed Capacity (GW)
short-term Marginal Cost (€/MWh)
P1
PREN
∆ Merit Order Effect
Lars Dittmar | 68
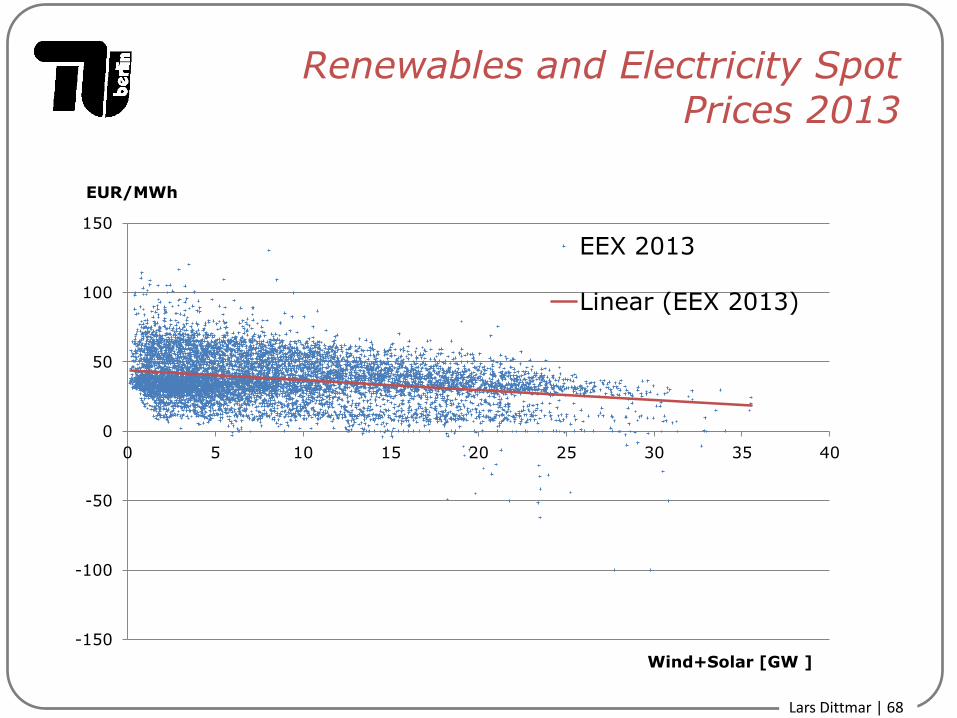
Renewables and Electricity Spot Prices 2013
-150
-100
-50
0
50
100
150
0 5 10 15 20 25 30 35 40
EUR/MWh
Wind+Solar [GW ]
EEX 2013
Linear (EEX 2013)
Lars Dittmar | 69
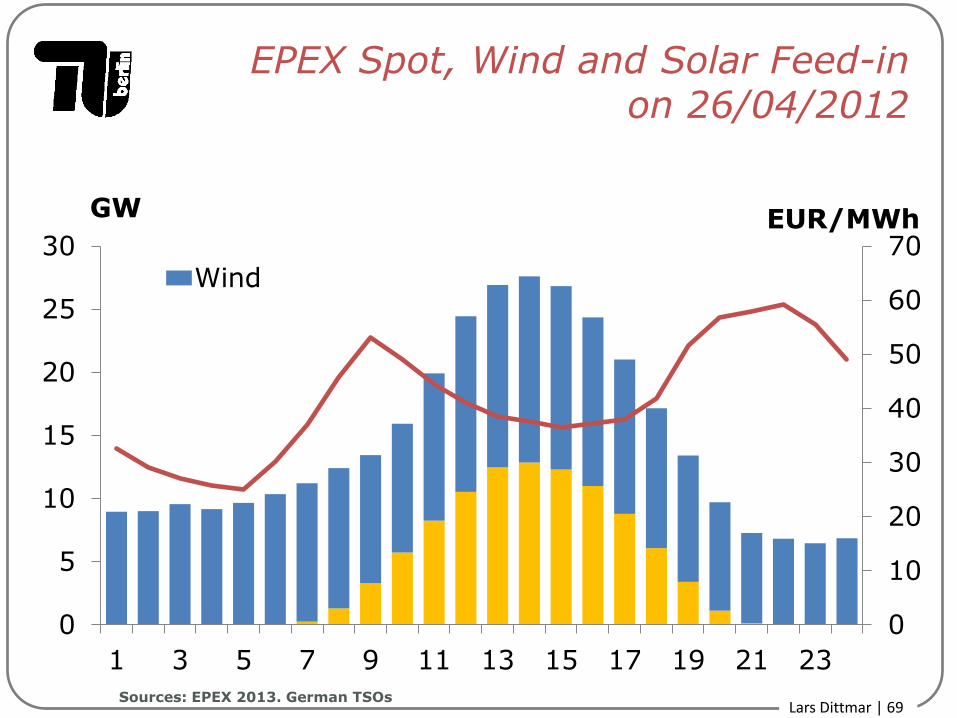
EPEX Spot, Wind and Solar Feed-in on 26/04/2012
0
10
20
30
40
50
60
70
0
5
10
15
20
25
30
1 3 5 7 9 11 13 15 17 19 21 23
EUR/MWh GW
Wind
Sources: EPEX 2013. German TSOs
Lars Dittmar | 70
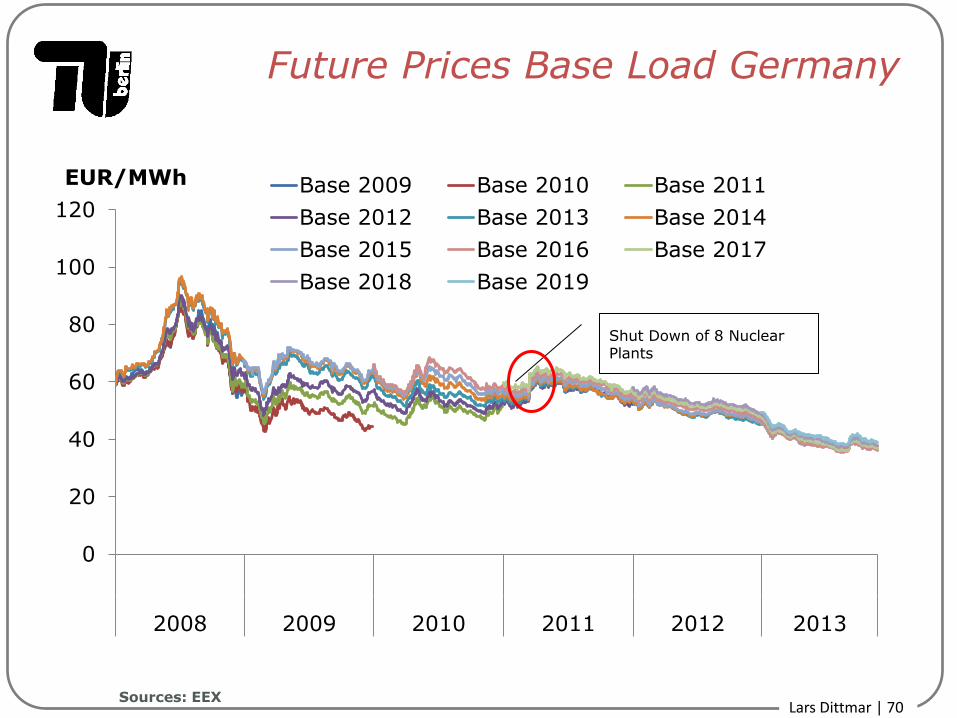
Future Prices Base Load Germany
0
20
40
60
80
100
120
2008 2009 2010 2011 2012 2013
EUR/MWh Base 2009 Base 2010 Base 2011
Base 2012 Base 2013 Base 2014
Base 2015 Base 2016 Base 2017
Base 2018 Base 2019
Shut Down of 8 Nuclear Plants
Sources: EEX
Lars Dittmar | 71
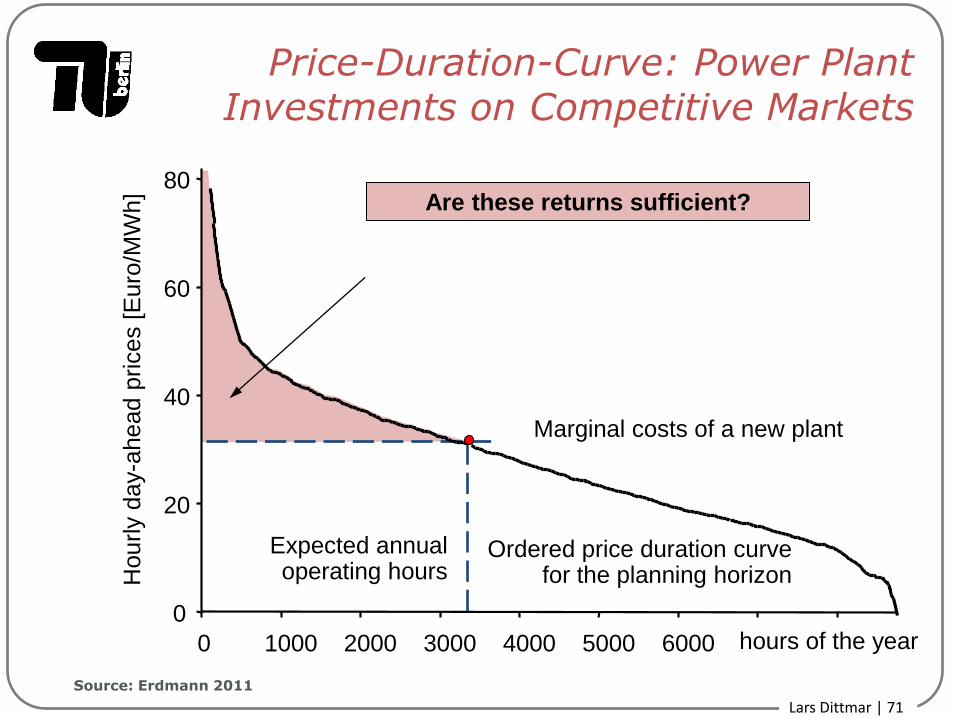
Are these returns sufficient?
Price-Duration-Curve: Power Plant Investments on Competitive Markets
0
20
40
60
80
0 1000 2000 3000 4000 5000 6000
Hourly d
ay-a
head p
rices [
Euro
/MW
h]
Marginal costs of a new plant
Expected annual operating hours
Ordered price duration curve for the planning horizon
hours of the year
Source: Erdmann 2011
Lars Dittmar | 72
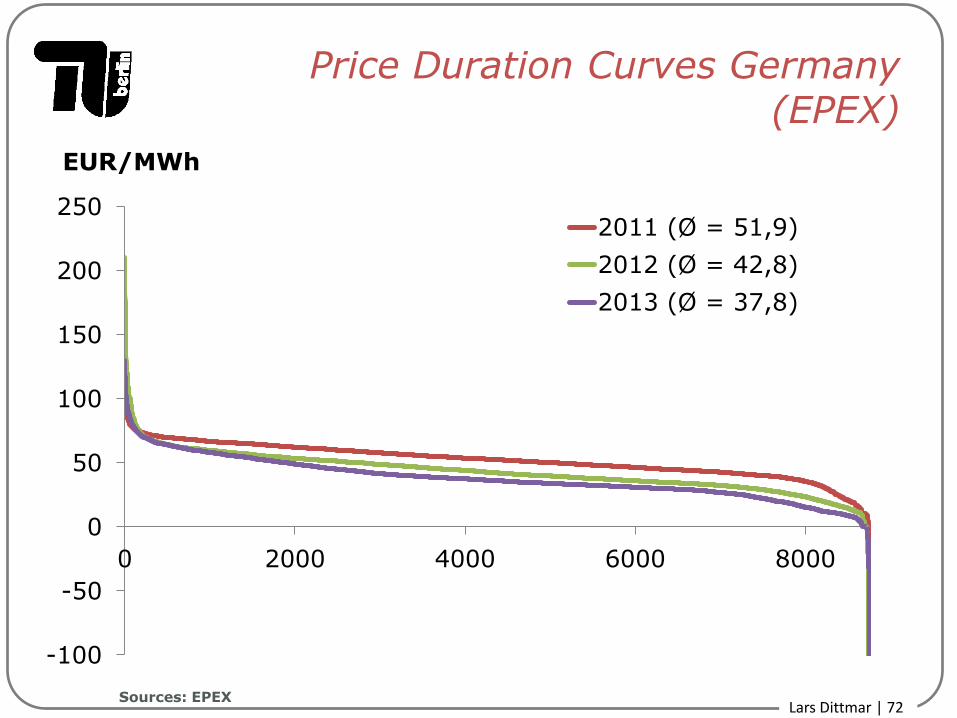
Price Duration Curves Germany (EPEX)
Sources: EPEX
-100
-50
0
50
100
150
200
250
0 2000 4000 6000 8000
EUR/MWh
2011 (Ø = 51,9)
2012 (Ø = 42,8)
2013 (Ø = 37,8)
Lars Dittmar | 73
0
10
20
30
40
50
60
70
80
90
100
0 20 40 60 80 100
P/Pinstalled [%]
time per year [%]
2006
2007
2008
2009
2010
2011
2012
2007
2010
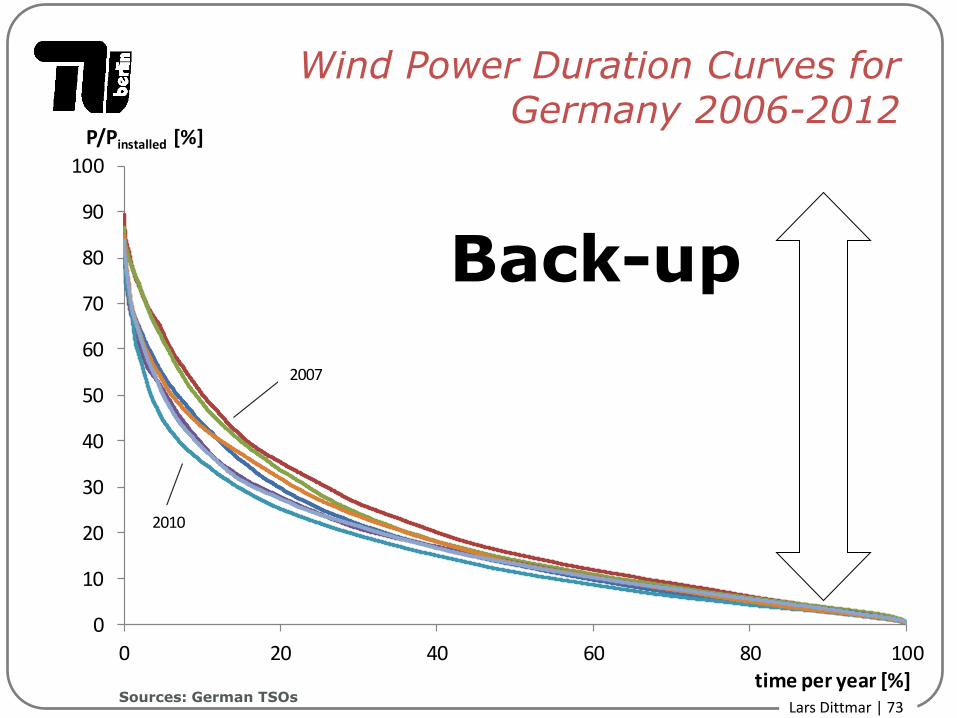
Wind Power Duration Curves for Germany 2006-2012
Sources: German TSOs
Back-up
Lars Dittmar | 74
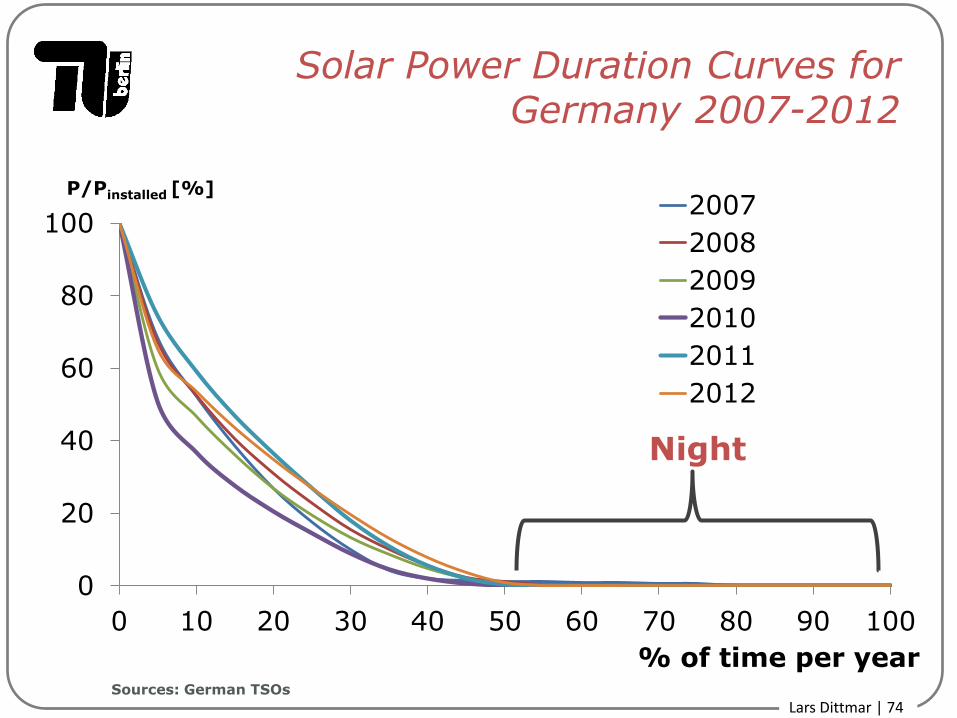
Solar Power Duration Curves for Germany 2007-2012
0
20
40
60
80
100
0 10 20 30 40 50 60 70 80 90 100
P/Pinstalled [%]
% of time per year
2007
2008
2009
2010
2011
2012
Night
Sources: German TSOs
Lars Dittmar | 75
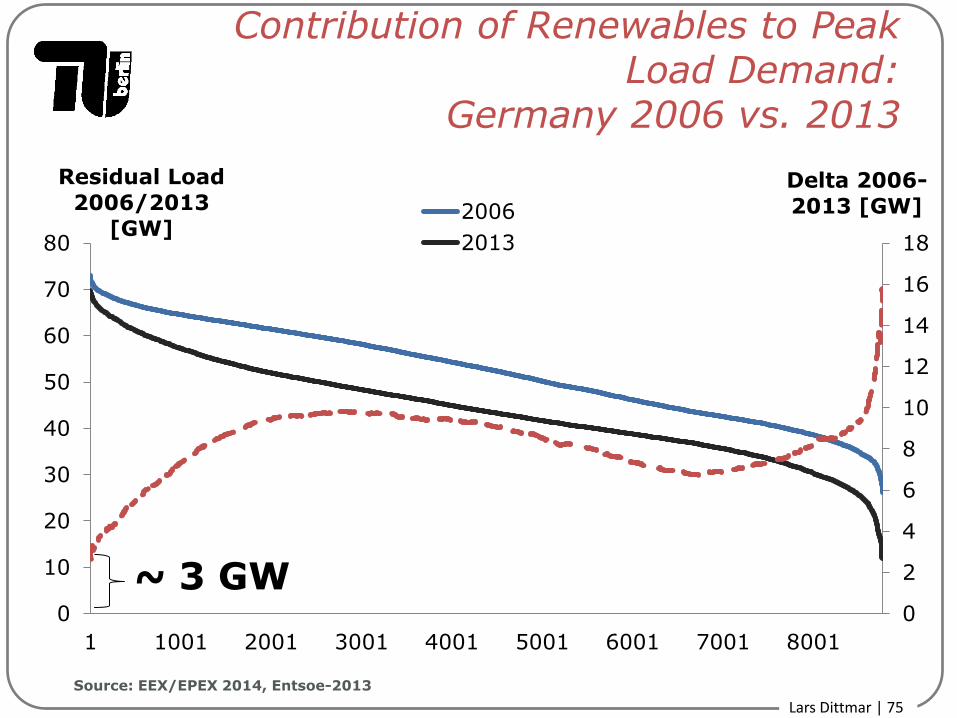
Contribution of Renewables to Peak Load Demand:
Germany 2006 vs. 2013
0
2
4
6
8
10
12
14
16
18
0
10
20
30
40
50
60
70
80
1 1001 2001 3001 4001 5001 6001 7001 8001
Delta 2006-
2013 [GW]
Residual Load
2006/2013
[GW] 2006
2013
Source: EEX/EPEX 2014, Entsoe-2013
~ 3 GW
Lars Dittmar | 76
Conclusion
• The Energiewende is a mammoth policy project
affecting the entire electricity system
• Current market prices do not cover the costs of
conventional capacities. Additionally sales volumes
decline.
• The RES-Policy-Design of „produce and forget“ has
to be changed create demand for secured
capacity
• Conventional power plants are still needed, also in
the long-run (~50GW with 80% RES)
© OECD/IEA 2012
Thank you for your attention
For further questions - please contact…
© OECD/IEA 2012
References
Besant-Jones, J., 2006: “Reforming Power Markets in Developing
Countries: What have we learned?”, available at
http://siteresources.worldbank.org/INTENERGY/Resources/Energy19.pdf.
Domah, P. D. and Pollitt, M.G., 2001: “The Restructuring and Privatisation of the Regional Electricity Companies in England and Wales: A Social Cost Benefit Analysis”, Fiscal Studies, 22 (1): 107-146.
Fabrizio, K., Rose, N. and Wolfram, C. (2007), ‘Do Markets Reduce Costs? Assessing the Impact of Regulatory Restructuring on U.S.
Electric Generation Efficiency’, American Economic Review, 97 (4): 1250-1277.
FERC, 2013: “Industry Activities”, available at
http://www.ferc.gov/industries/electric/indus-act.asp.
© OECD/IEA 2012
References
Fiorio, C. et al., 2007: “The Electricity Industry Reform Paradigm in the European Union: Testing the Impact on Consumers” Available at http://services.bepress.com/unimi/economics/art23/
IEA, 2012: “Electricity”, available at http://www.iea.org/topics/electricity/
Hattori and Tsutsui, 2004: “Economic impact of regulatory reforms in the electricity supply industry: a panel data analysis for OECD countries” Available at
http://www.sciencedirect.com/science/article/pii/S0301421503000041
Jamasb, et al., “Electricity Sector Reform in Developing Countries: A Survey of Empirical Evidence on Determinants and Performance”, available at http://ideas.repec.org/p/wbk/wbrwps/3549.html.
© OECD/IEA 2012
References
Joule Assets (2014) “The Choice Is Yours: Competition in Retail Electricity Markets”, Available at http://jouleassets.com/the-choice-is-yours-competition-in-retail-electricity-markets/
Joskow and Schmalensee, 1983: “Markets for Power: An Analysis of Electric Utility Deregulation”, Cambridge, MA: MIT Press.
Joskow, 2001: “California’s Electricity Crises”, available at
http://www.nber.org/papers/w8442.
Moore, 1992: “Privatisation Everywhere: The World’s Adoption of the British Experience” available at
http://www.cps.org.uk/files/reports/original/111027160313-PrivitisationEverywhere1992.pdf.
Nagayama, H., 2009: “Electric power sector reform liberalization models and electric power prices in developing countries – An empirical analysis using international panel data”, Energy Economics, 31:
463-472.
© OECD/IEA 2012
References
Pollitt, 2009: “Evaluating the evidence on electricity reform:
Lessons for the South East Europe (SEE) market”, available at https://www.repository.cam.ac.uk/bitstream/handle/1810/195425/0756&eprg0725.pdf?sequence=1.
PUC Texas (2014) “Power to Choose”, Available at http://www.powertochoose.org/
Steiner, 2001: “REGULATION, INDUSTRY STRUCTURE AND PERFORMANCE IN THE ELECTRICITY SUPPLY INDUSTRY”, Available at http://www.oecd.org/eco/outlook/2731965.pdf.
Triebs, T., Kwoka, J. and Pollitt, M., 2010: “The Direct Costs and Benefits of US Electric Utility Divestitures”, available at https://www.repository.cam.ac.uk/bitstream/handle/1810/242074/cwpe1049.pdf?sequence=1.
Toba, N., 2007: “Welfare Impacts of Electricity Generation Sector Reform in the Philippines”, Energy Policy, 35(12): 6145-6162.
© OECD/IEA 2012
References
AEMO, 2012: “Planning”, available at http://www.aemo.com.au/Electricity/Planning.
AER, 2013: “AER releases determination on South Australia to Victoria electricity transmission interconnector”, available at http://www.aer.gov.au/node/21633.
IEA, 2013: “Electricity Networks: Infrastructure and Operations”, available at http://www.iea.org/publications/insights/insightpublications/name,43756,en.html.
IEA, 2012: “World Energy Outlook 2012”, IEA, Paris. Joskow, 2006: “INCENTIVE REGULATION IN THEORY AND
PRACTICE: ELECTRICITY DISTRIBUTION AND TRANSMISSION NETWORKS”, available at http://economics.mit.edu/files/1181.
Pollitt, 2013: “Global Trends in Electricity Transmission System Operation: Where does the future lie?“, available at http://www.eprg.group.cam.ac.uk/wp-content/uploads/2013/05/Draft-Project-2.pdf.
Roland Berger, 2011: “Permitting procedures for energy infrastructure projects in the EU: evaluation and legal recommendations”, available at http://ec.europa.eu/energy/infrastructure/studies/doc/2011_ten_e_permitting_report.pdf.