Embed Size (px)
Citation preview
Electricity Markets: Summer Semester 2016,
Lecture 1
Tom Brown, Mirko Schafer
11th April 2016
Frankfurt Institute of Advanced Studies (FIAS), Goethe-Universitat Frankfurt
FIAS Renewable Energy System and Network Analysis (FRESNA)
brown,[email protected]
Table of Contents
1. Administration
2. Introduction: Why Electricity Markets are Important
3. Units: Watts, Kilowatts, Megawatts, WTF?
4. Electricity Markets from the Consumer Perspective
2

Administration
Who we are
• Tom Brown, Postdoctoral Researcher, FIAS (Riedberg),
• Mirko Schafer, Postdoctoral Researcher, FIAS (Riedberg),
We are both physicists who have specialised in the optimisation of energy
systems and the interactions of complex networks.
4

Lectures and Exercise Classes
Lectures:
• Weekly, Mondays 16:00 - 18:00 Seminarhaus SH 0.109
• 11.04.2016 until 11.07.2016 (with exception of Pfingsten
16.05.2016)
Exercise Classes:
• Biweekly, Mondays 18:00 - 20:00 Seminarhaus SH 0.109
• 18.04.2016 until 11.07.2016
• Exercise Sheets: Given out the week before, starting today
5
Exam and Exercise Sheets
Only the final exam is graded.
Every two weeks there will be an Exercise Sheet, which we will go
through in the Exercise Class in the following week.
The exam will be in the style and at the difficulty level of non-starred
question in the Exercise Sheet.
Therefore if you want to do well in the exam, you need to do the Exercise
Sheets.
Exercise classes are biweekly, starting 18.04 (next week).
There are also starred questions which are non-compulsory but should be
interesting - you’ll learn better by doing these exercises.
6

Literature
There are lots of textbooks covering the material of this course and lots
of supporting material on the internet. We will roughly follow:
• Daniel Kirschen and Goran Strbac, “Fundamentals of Power System
Economics,” Wiley, 2004
The following books are also useful:
• D.R. Biggar, M.R. Hesamzadeh, “The Economics of Electricity
Markets,” Wiley, 2014
• Steven Stoft, “Power System Economics: Designing Markets for
Electricity,” Wiley, IEEE Press, 2002
• Joshua Adam Taylor, “Convex Optimization of Power Systems,”
CUP, 2015
• J.M. Morales et al., “Integrating Renewables in Electricity Markets,”
Springer, 2014
7
Kirschen and Strbac
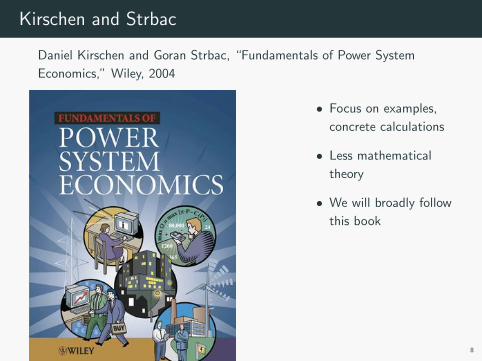
Daniel Kirschen and Goran Strbac, “Fundamentals of Power System
Economics,” Wiley, 2004
• Focus on examples,
concrete calculations
• Less mathematical
theory
• We will broadly follow
this book
8
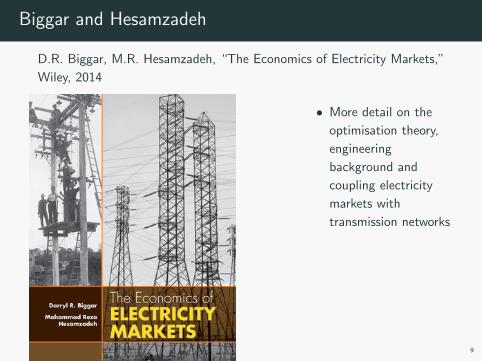
Biggar and Hesamzadeh
D.R. Biggar, M.R. Hesamzadeh, “The Economics of Electricity Markets,”
Wiley, 2014
• More detail on the
optimisation theory,
engineering
background and
coupling electricity
markets with
transmission networks
9
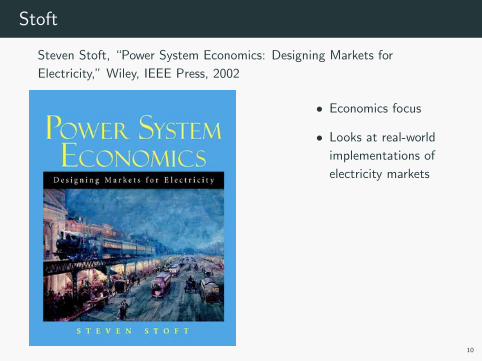
Stoft
Steven Stoft, “Power System Economics: Designing Markets for
Electricity,” Wiley, IEEE Press, 2002
• Economics focus
• Looks at real-world
implementations of
electricity markets
10

Course Website
On the course website:
http://fias.uni-frankfurt.de/~brown/courses/electricity_
markets/
we will publish links to material on the internet and to the course notes
and exercise sheets.
11
Introduction: Why Electricity Mar-
kets are Important
Why is electricity useful?
Electricity is a versatile form of energy carried by electrical charge which
can be consumed in a wide variety of ways (with selected examples):
• Lighting (lightbulbs, halogen lamps, televisions)
• Mechanical work (hoovers, washing machines, electric vehicles)
• Heating (cooking, resistive room heating, heat pumps)
• Cooling (refrigerators, air conditioning)
• Electronics (computation, data storage, control systems)
• Industry (electrochemical processes)
Compare the convenience and versatility of electricity with another
energy carrier: the chemical energy stored in natural gas (methane),
which can only be accessed by burning it.
13
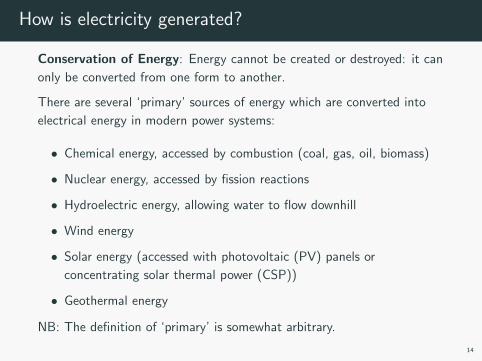
How is electricity generated?
Conservation of Energy: Energy cannot be created or destroyed: it can
only be converted from one form to another.
There are several ‘primary’ sources of energy which are converted into
electrical energy in modern power systems:
• Chemical energy, accessed by combustion (coal, gas, oil, biomass)
• Nuclear energy, accessed by fission reactions
• Hydroelectric energy, allowing water to flow downhill
• Wind energy
• Solar energy (accessed with photovoltaic (PV) panels or
concentrating solar thermal power (CSP))
• Geothermal energy
NB: The definition of ‘primary’ is somewhat arbitrary.
14
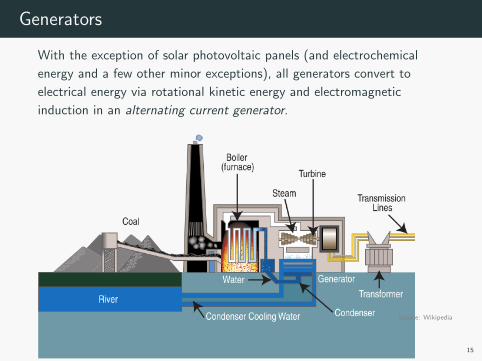
Generators
With the exception of solar photovoltaic panels (and electrochemical
energy and a few other minor exceptions), all generators convert to
electrical energy via rotational kinetic energy and electromagnetic
induction in an alternating current generator.
15
Source: Wikipedia
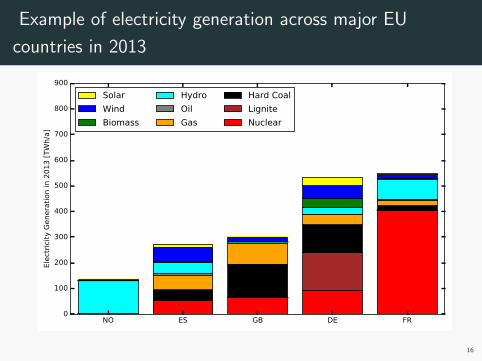
Example of electricity generation across major EU
countries in 2013
NO ES GB DE FR0
100
200
300
400
500
600
700
800
900
Ele
ctri
city
Genera
tion in 2
013 [
TW
h/a
]
Solar
Wind
Biomass
Hydro
Oil
Gas
Hard Coal
Lignite
Nuclear
16
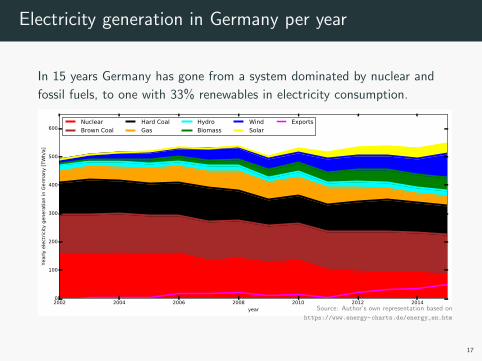
Electricity generation in Germany per year
In 15 years Germany has gone from a system dominated by nuclear and
fossil fuels, to one with 33% renewables in electricity consumption.
2002 2004 2006 2008 2010 2012 2014
year
0
100
200
300
400
500
600
Yearl
y e
lect
rici
ty g
enera
tion in G
erm
any [
TW
h/a
]
Nuclear
Brown Coal
Hard Coal
Gas
Hydro
Biomass
Wind
Solar
Exports
17
Source: Author’s own representation based on
https://www.energy-charts.de/energy_en.htm
The Economic Operation of the Electricity Sector
Given the many different ways of consuming and generating electricity,
the questions naturally arise:
• What is the most efficient way to deploy consuming and generating
assets in the short-run?
• How should we invest in assets in the long-run to maximise
economic welfare?
In the past and still in many countries today, this was done centrally by
‘vertically-integrated’ monopoly utilities that owned generating assets,
the electricity networks and retailing.
Given that these utilities owned all the infrastructure, it was hard for
third-party generators to compete, even if they were allowed to.
From the 1980s onwards, countries began to liberalise their electricity
sectors, separating generation from transmission, and allowing regulated
competition in the generation sector.18
Electricity Markets
Electricity markets have several important differences compared to other
commodity markets.
At every instant in time, consumption must be balanced with generation.
If you throw a switch to turn on a light, somewhere a generator will be
increasing its output to compensate.
If the power is not balanced in the grid, the power supply will collapse
and there will be blackouts.
It is not possible to run an electricity market for every single second, for
practical reasons (the network must be checked for stability, etc.).
So electricity is traded in blocks of time, e.g. hourly, 14:00-15:00, or
quarter-hourly, 14:00-14:15, well in advance of the time when it is
actually consumed (based on forecasts).
Further markets trade in backup balancing power, which step in if the
forecasts are wrong.19
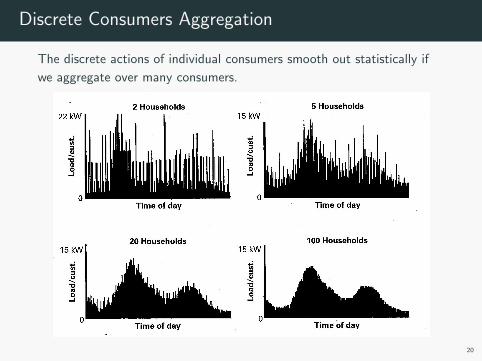
Discrete Consumers Aggregation
The discrete actions of individual consumers smooth out statistically if
we aggregate over many consumers.
20
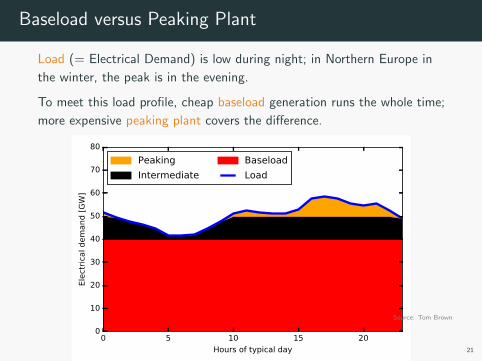
Baseload versus Peaking Plant
Load (= Electrical Demand) is low during night; in Northern Europe in
the winter, the peak is in the evening.
To meet this load profile, cheap baseload generation runs the whole time;
more expensive peaking plant covers the difference.
0 5 10 15 20
Hours of typical day
0
10
20
30
40
50
60
70
80
Ele
ctri
cal dem
and [
GW
]
Peaking
Intermediate
Baseload
Load
21
Source: Tom Brown
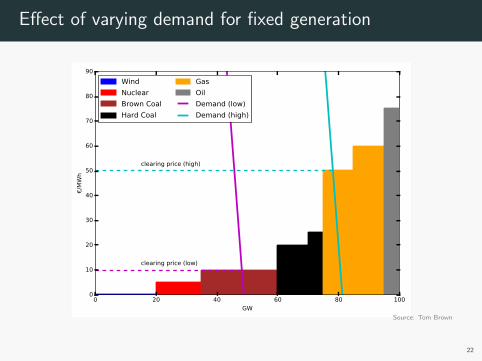
Effect of varying demand for fixed generation
0 20 40 60 80 100
GW
0
10
20
30
40
50
60
70
80
90/M
Wh
clearing price (low)
clearing price (high)
Wind
Nuclear
Brown Coal
Hard Coal
Gas
Oil
Demand (low)
Demand (high)
22
Source: Tom Brown
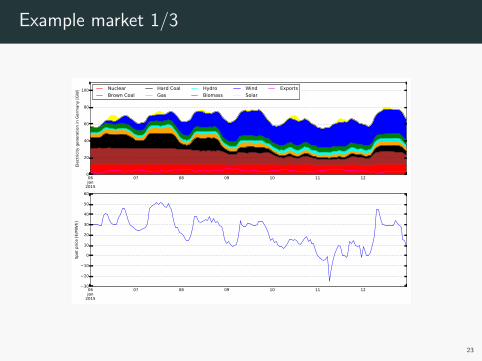
Example market 1/3
06Jan
2015
07 08 09 10 11 120
20
40
60
80
100
Ele
ctri
city
genera
tion in G
erm
any [
GW
] Nuclear
Brown Coal
Hard Coal
Gas
Hydro
Biomass
Wind
Solar
Exports
06Jan
2015
07 08 09 10 11 1230
20
10
0
10
20
30
40
50
60
Spot
pri
ce [
/MW
h]
23
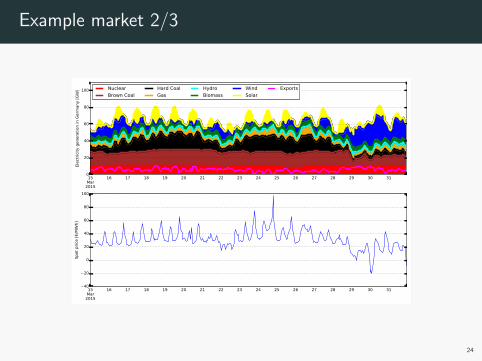
Example market 2/3
15Mar
2015
16 17 18 19 20 21 22 23 24 25 26 27 28 29 30 310
20
40
60
80
100
Ele
ctri
city
genera
tion in G
erm
any [
GW
] Nuclear
Brown Coal
Hard Coal
Gas
Hydro
Biomass
Wind
Solar
Exports
15Mar
2015
16 17 18 19 20 21 22 23 24 25 26 27 28 29 30 3140
20
0
20
40
60
80
100
Spot
pri
ce [
/MW
h]
24
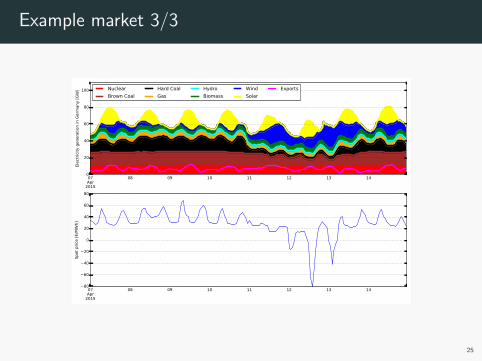
Example market 3/3
07Apr
2015
08 09 10 11 12 13 140
20
40
60
80
100
Ele
ctri
city
genera
tion in G
erm
any [
GW
] Nuclear
Brown Coal
Hard Coal
Gas
Hydro
Biomass
Wind
Solar
Exports
07Apr
2015
08 09 10 11 12 13 1480
60
40
20
0
20
40
60
80
Spot
pri
ce [
/MW
h]
25
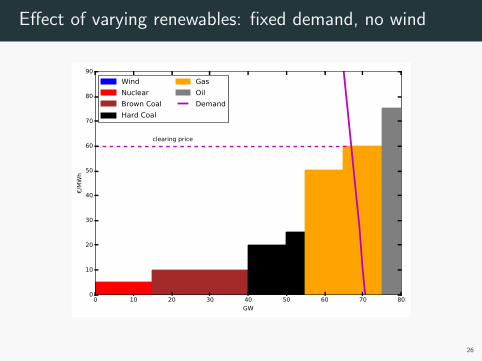
Effect of varying renewables: fixed demand, no wind
0 10 20 30 40 50 60 70 80
GW
0
10
20
30
40
50
60
70
80
90/M
Wh
clearing price
Wind
Nuclear
Brown Coal
Hard Coal
Gas
Oil
Demand
26
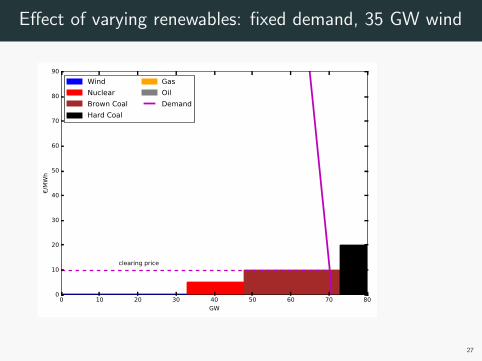
Effect of varying renewables: fixed demand, 35 GW wind
0 10 20 30 40 50 60 70 80
GW
0
10
20
30
40
50
60
70
80
90
/MW
h
clearing price
Wind
Nuclear
Brown Coal
Hard Coal
Gas
Oil
Demand
27
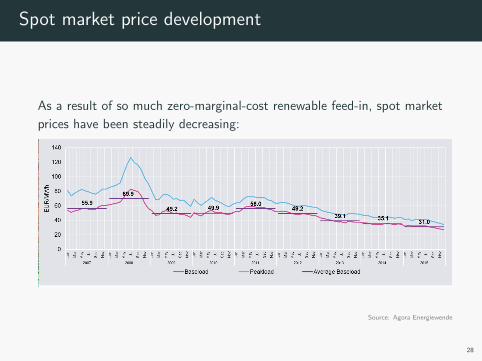
Spot market price development
As a result of so much zero-marginal-cost renewable feed-in, spot market
prices have been steadily decreasing:
28
Source: Agora Energiewende
Merit Order Effect
To summarise:
• Renewables have zero marginal cost
• As a result they enter at the bottom of the merit order, reducing the
price at which the market clears
• This pushes non-CHP gas and hard coal out of the market
• This is unfortunate, because among the fossil fuels, gas and hard
coal are the most flexible and produce the lowest CO2 per MWh
• It also massively reduces the profits that nuclear and brown coal
make
• Will there be enough backup power plants for times with no
wind/solar?
This has led to lots of political tension...
29
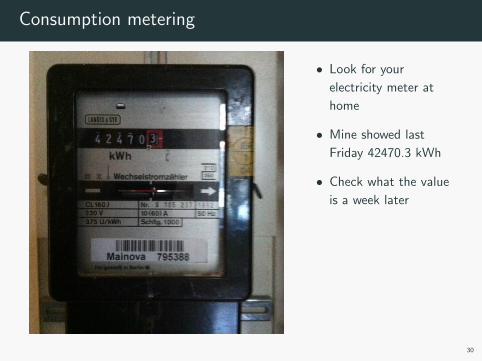
Consumption metering
• Look for your
electricity meter at
home
• Mine showed last
Friday 42470.3 kWh
• Check what the value
is a week later
30
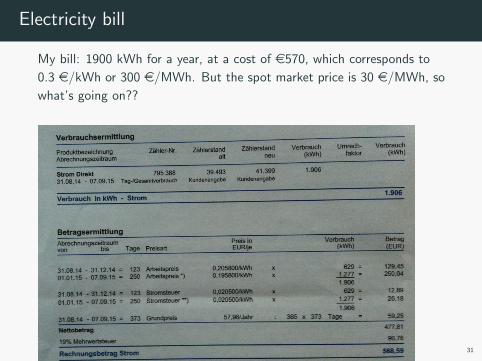
Electricity bill
My bill: 1900 kWh for a year, at a cost of e570, which corresponds to
0.3 e/kWh or 300 e/MWh. But the spot market price is 30 e/MWh, so
what’s going on??
31
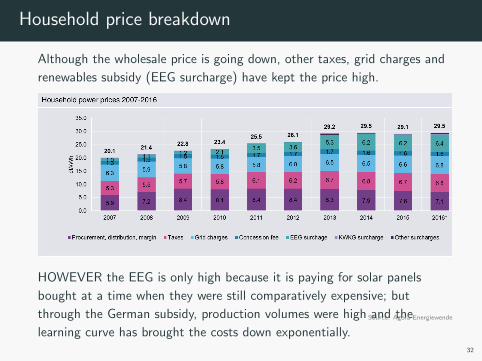
Household price breakdown
Although the wholesale price is going down, other taxes, grid charges and
renewables subsidy (EEG surcharge) have kept the price high.
HOWEVER the EEG is only high because it is paying for solar panels
bought at a time when they were still comparatively expensive; but
through the German subsidy, production volumes were high and the
learning curve has brought the costs down exponentially.32
Source: Agora Energiewende
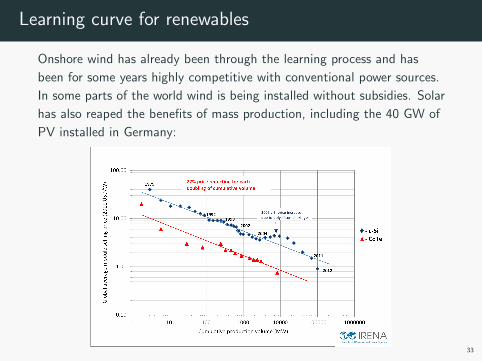
Learning curve for renewables
Onshore wind has already been through the learning process and has
been for some years highly competitive with conventional power sources.
In some parts of the world wind is being installed without subsidies. Solar
has also reaped the benefits of mass production, including the 40 GW of
PV installed in Germany:
33
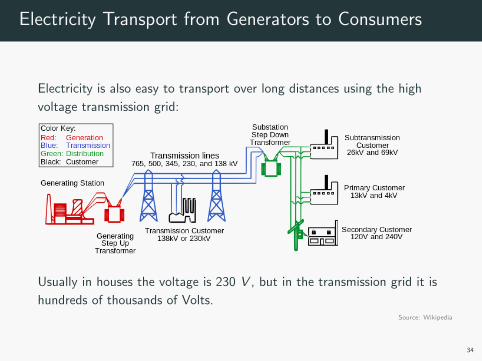
Electricity Transport from Generators to Consumers
Electricity is also easy to transport over long distances using the high
voltage transmission grid:
Usually in houses the voltage is 230 V , but in the transmission grid it is
hundreds of thousands of Volts.
34
Source: Wikipedia
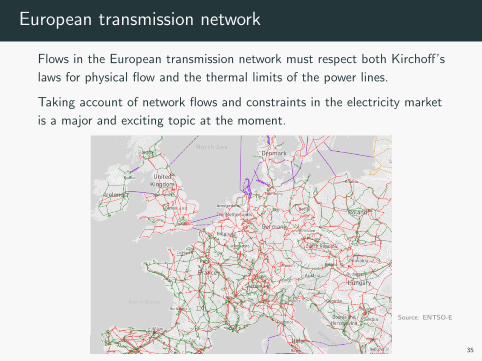
European transmission network
Flows in the European transmission network must respect both Kirchoff’s
laws for physical flow and the thermal limits of the power lines.
Taking account of network flows and constraints in the electricity market
is a major and exciting topic at the moment.
35
Source: ENTSO-E
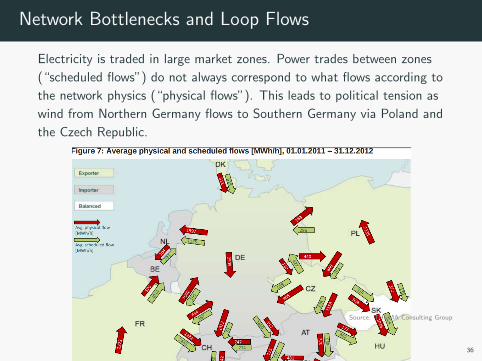
Network Bottlenecks and Loop Flows
Electricity is traded in large market zones. Power trades between zones
(“scheduled flows”) do not always correspond to what flows according to
the network physics (“physical flows”). This leads to political tension as
wind from Northern Germany flows to Southern Germany via Poland and
the Czech Republic.
36
Source: THEMA Consulting Group
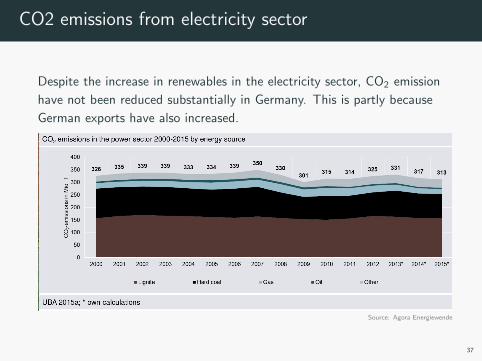
CO2 emissions from electricity sector
Despite the increase in renewables in the electricity sector, CO2 emission
have not been reduced substantially in Germany. This is partly because
German exports have also increased.
37
Source: Agora Energiewende
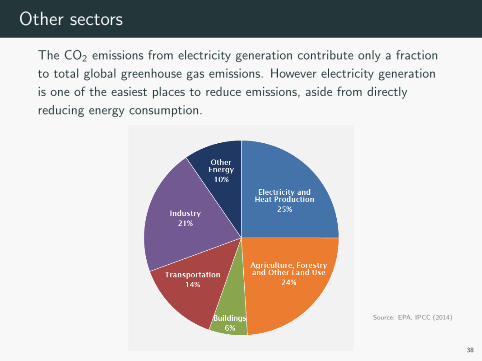
Other sectors
The CO2 emissions from electricity generation contribute only a fraction
to total global greenhouse gas emissions. However electricity generation
is one of the easiest places to reduce emissions, aside from directly
reducing energy consumption.
38
Source: EPA, IPCC (2014)
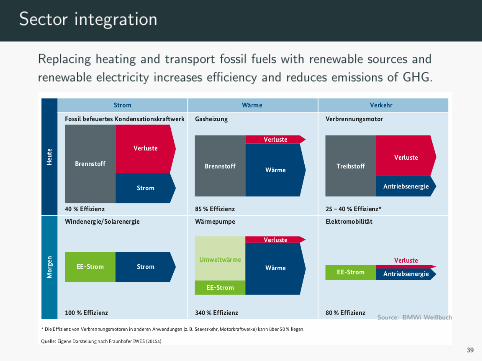
Sector integration
Replacing heating and transport fossil fuels with renewable sources and
renewable electricity increases efficiency and reduces emissions of GHG.
39
Source: BMWi Weißbuch
Several changes happening simultaneously
Energiewende: The Energy Transition
• Renewables replace conventional generation
• Increasing integration of international electricity markets
• Better integration of transmission constraints in electricity markets
• Sector coupling: heating and transport electrify
• Reform of electricity market to allow these transactions and
investments to take place efficiently
In summer 2016 both the German Electricity Market Law and the
Renewable Energy Law will be reformed. Fun times!
40
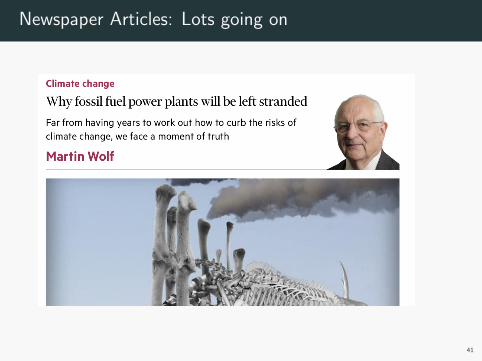
Newspaper Articles: Lots going on
41
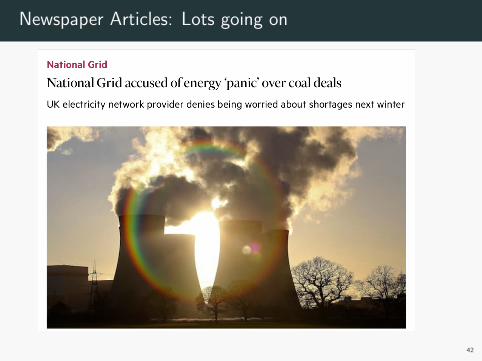
Newspaper Articles: Lots going on
42
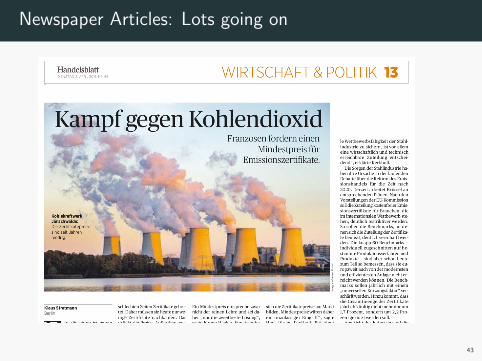
Newspaper Articles: Lots going on
43
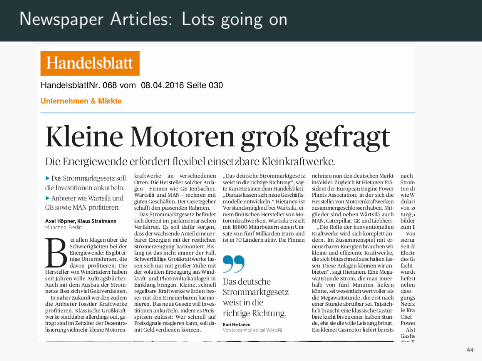
Newspaper Articles: Lots going on
44
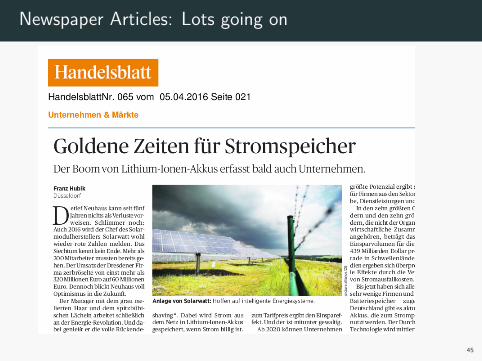
Newspaper Articles: Lots going on
45
Units: Watts, Kilowatts, Megawatts,
WTF?
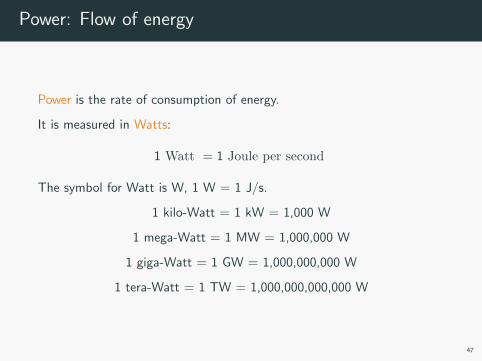
Power: Flow of energy
Power is the rate of consumption of energy.
It is measured in Watts:
1 Watt = 1 Joule per second
The symbol for Watt is W, 1 W = 1 J/s.
1 kilo-Watt = 1 kW = 1,000 W
1 mega-Watt = 1 MW = 1,000,000 W
1 giga-Watt = 1 GW = 1,000,000,000 W
1 tera-Watt = 1 TW = 1,000,000,000,000 W
47
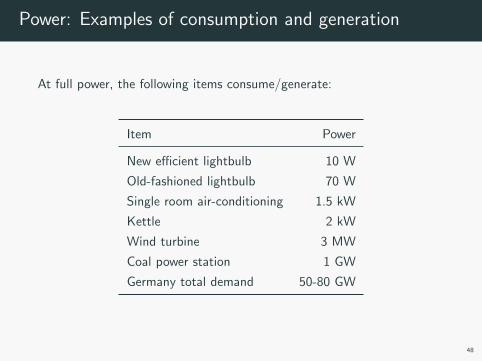
Power: Examples of consumption and generation
At full power, the following items consume/generate:
Item Power
New efficient lightbulb 10 W
Old-fashioned lightbulb 70 W
Single room air-conditioning 1.5 kW
Kettle 2 kW
Wind turbine 3 MW
Coal power station 1 GW
Germany total demand 50-80 GW
48
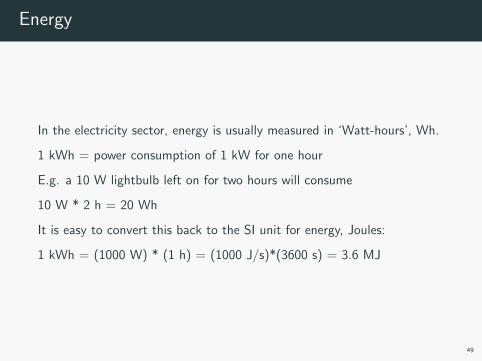
Energy
In the electricity sector, energy is usually measured in ‘Watt-hours’, Wh.
1 kWh = power consumption of 1 kW for one hour
E.g. a 10 W lightbulb left on for two hours will consume
10 W * 2 h = 20 Wh
It is easy to convert this back to the SI unit for energy, Joules:
1 kWh = (1000 W) * (1 h) = (1000 J/s)*(3600 s) = 3.6 MJ
49
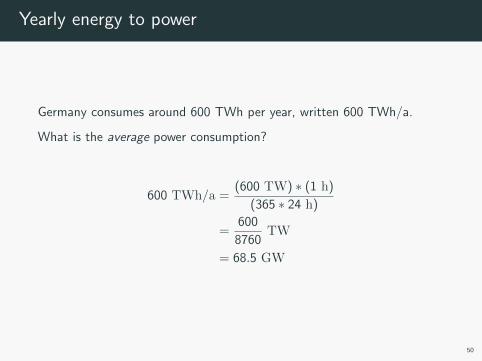
Yearly energy to power
Germany consumes around 600 TWh per year, written 600 TWh/a.
What is the average power consumption?
600 TWh/a =(600 TW) ∗ (1 h)
(365 ∗ 24 h)
=600
8760TW
= 68.5 GW
50
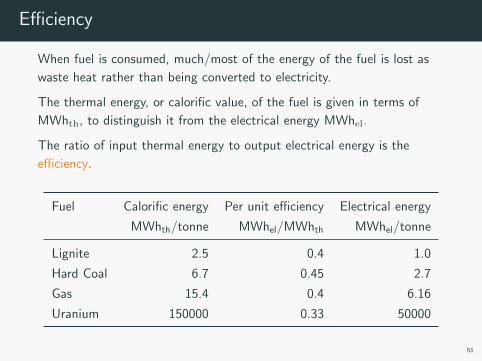
Efficiency
When fuel is consumed, much/most of the energy of the fuel is lost as
waste heat rather than being converted to electricity.
The thermal energy, or calorific value, of the fuel is given in terms of
MWhth, to distinguish it from the electrical energy MWhel.
The ratio of input thermal energy to output electrical energy is the
efficiency.
Fuel Calorific energy Per unit efficiency Electrical energy
MWhth/tonne MWhel/MWhth MWhel/tonne
Lignite 2.5 0.4 1.0
Hard Coal 6.7 0.45 2.7
Gas 15.4 0.4 6.16
Uranium 150000 0.33 50000
51
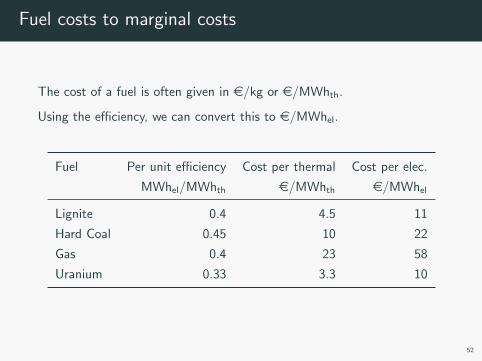
Fuel costs to marginal costs
The cost of a fuel is often given in e/kg or e/MWhth.
Using the efficiency, we can convert this to e/MWhel.
Fuel Per unit efficiency Cost per thermal Cost per elec.
MWhel/MWhth e/MWhth e/MWhel
Lignite 0.4 4.5 11
Hard Coal 0.45 10 22
Gas 0.4 23 58
Uranium 0.33 3.3 10
52
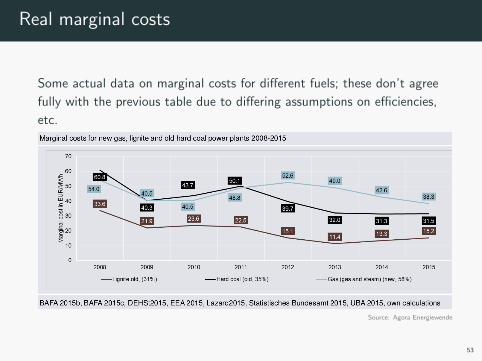
Real marginal costs
Some actual data on marginal costs for different fuels; these don’t agree
fully with the previous table due to differing assumptions on efficiencies,
etc.
53
Source: Agora Energiewende
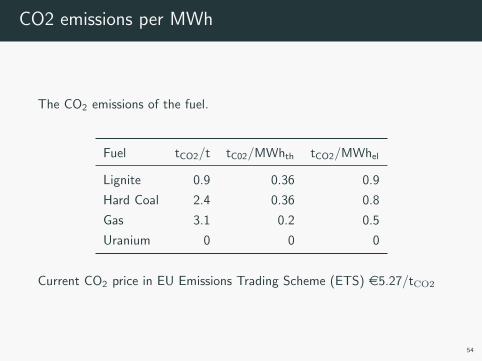
CO2 emissions per MWh
The CO2 emissions of the fuel.
Fuel tCO2/t tC02/MWhth tCO2/MWhel
Lignite 0.9 0.36 0.9
Hard Coal 2.4 0.36 0.8
Gas 3.1 0.2 0.5
Uranium 0 0 0
Current CO2 price in EU Emissions Trading Scheme (ETS) e5.27/tCO2
54
Electricity Markets from the Con-
sumer Perspective
Consumer behaviour: Theory
Suppose for some given period a consumer consumes electricity at a rate
of Q MW.
Their utility or value function U(Q) in e/h is a measure of their benefit
for a given consumption rate Q.
For a firm this could be the profit related to this electricity consumption
from manufacturing goods.
Typical the consumer has a higher utility for higher Q, i.e. the first
derivative is positive U ′(Q) > 0. By assumption, the rate of value
increase with consumption decreases the higher the rate of consumption,
i.e. U ′′(Q) < 0.
56
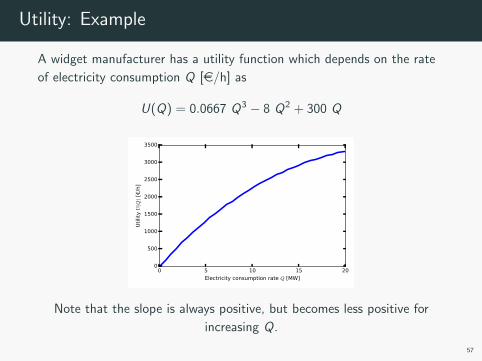
Utility: Example
A widget manufacturer has a utility function which depends on the rate
of electricity consumption Q [e/h] as
U(Q) = 0.0667 Q3 − 8 Q2 + 300 Q
0 5 10 15 20
Electricity consumption rate Q [MW]
0
500
1000
1500
2000
2500
3000
3500
Uti
lity U
(Q)
[/h
]
Note that the slope is always positive, but becomes less positive for
increasing Q.
57
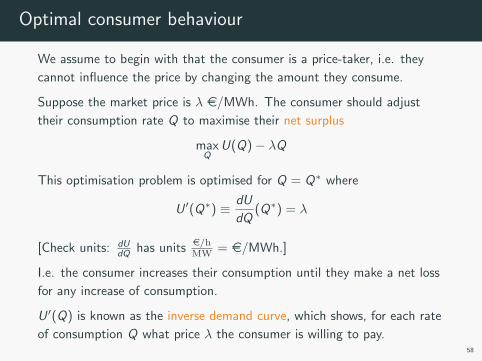
Optimal consumer behaviour
We assume to begin with that the consumer is a price-taker, i.e. they
cannot influence the price by changing the amount they consume.
Suppose the market price is λ e/MWh. The consumer should adjust
their consumption rate Q to maximise their net surplus
maxQ
U(Q)− λQ
This optimisation problem is optimised for Q = Q∗ where
U ′(Q∗) ≡ dU
dQ(Q∗) = λ
[Check units: dUdQ has units e/hMW = e/MWh.]
I.e. the consumer increases their consumption until they make a net loss
for any increase of consumption.
U ′(Q) is known as the inverse demand curve, which shows, for each rate
of consumption Q what price λ the consumer is willing to pay.58
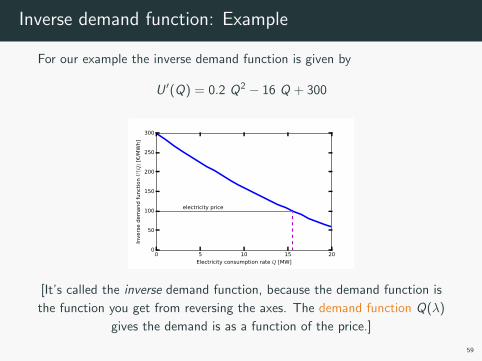
Inverse demand function: Example
For our example the inverse demand function is given by
U ′(Q) = 0.2 Q2 − 16 Q + 300
0 5 10 15 20
Electricity consumption rate Q [MW]
0
50
100
150
200
250
300In
vers
e d
em
and f
unct
ion U
′ (Q)
[/M
Wh]
electricity price
[It’s called the inverse demand function, because the demand function is
the function you get from reversing the axes. The demand function Q(λ)
gives the demand is as a function of the price.]
59
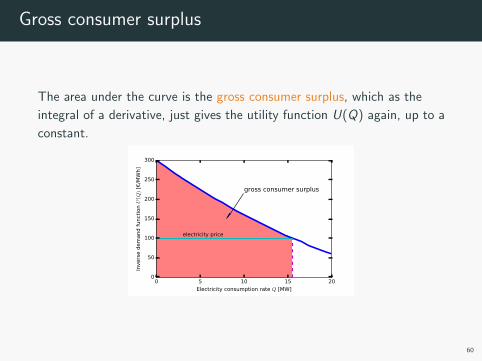
Gross consumer surplus
The area under the curve is the gross consumer surplus, which as the
integral of a derivative, just gives the utility function U(Q) again, up to a
constant.
0 5 10 15 20
Electricity consumption rate Q [MW]
0
50
100
150
200
250
300
Invers
e d
em
and f
unct
ion U
′ (Q)
[/M
Wh]
electricity price
gross consumer surplus
60
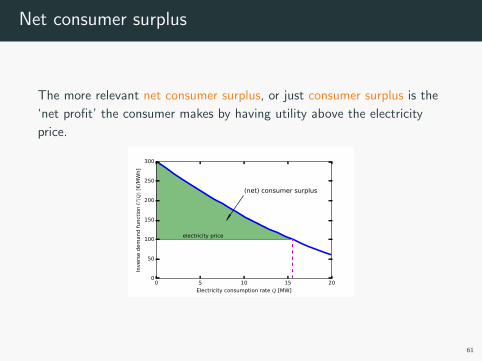
Net consumer surplus
The more relevant net consumer surplus, or just consumer surplus is the
‘net profit’ the consumer makes by having utility above the electricity
price.
0 5 10 15 20
Electricity consumption rate Q [MW]
0
50
100
150
200
250
300
Invers
e d
em
and f
unct
ion U
′ (Q)
[/M
Wh]
electricity price
(net) consumer surplus
61
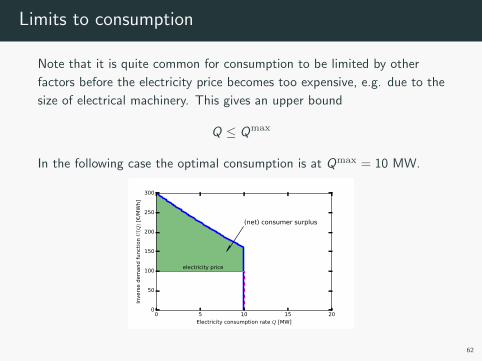
Limits to consumption
Note that it is quite common for consumption to be limited by other
factors before the electricity price becomes too expensive, e.g. due to the
size of electrical machinery. This gives an upper bound
Q ≤ Qmax
In the following case the optimal consumption is at Qmax = 10 MW.
0 5 10 15 20
Electricity consumption rate Q [MW]
0
50
100
150
200
250
300
Invers
e d
em
and f
unct
ion U
′ (Q)
[/M
Wh]
electricity price
(net) consumer surplus
62
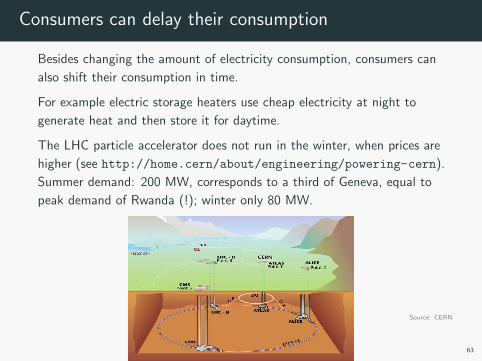
Consumers can delay their consumption
Besides changing the amount of electricity consumption, consumers can
also shift their consumption in time.
For example electric storage heaters use cheap electricity at night to
generate heat and then store it for daytime.
The LHC particle accelerator does not run in the winter, when prices are
higher (see http://home.cern/about/engineering/powering-cern).
Summer demand: 200 MW, corresponds to a third of Geneva, equal to
peak demand of Rwanda (!); winter only 80 MW.
63
Source: CERN
Consumers can also move location
Aluminium smelting is an electricity-intensive process. Aluminium
smelters will often move to locations with cheap and stable electricity
supplies, such as countries with lots of hydroelectric power. For example,
73% of Iceland’s total power consumption in 2010 came from aluminium
smelting.
Aluminium costs around US$ 1500/ tonne to produce.
Electricity consumption: 15 MWh/tonne.
At Germany consumer price of e300 / MWh, this is e4500 / tonne.
Uh-oh!!!
If electricity is 50% of cost, then need $750/tonne to go on electricity ⇒750/15 $/MWh = 50 $/MWh.
64

Copyright
Unless otherwise stated the graphics and text is Copyright c©Tom Brown,
2016.
We hope the graphics borrowed from others have been attributed
correctly; if not, drop a line to the authors and we will correct this.
The source LATEX, self-made graphics and Python code used to generate
the self-made graphics are available on the course website:
http://fias.uni-frankfurt.de/~brown/courses/electricity_
markets/
The graphics and text for which no other attribution are given are
licensed under a Creative Commons Attribution-ShareAlike 4.0
International License.
cba
65
![[9781843761785 - Competition in European Electricity Markets] the Deregulated Electricity Markets in Norway and Sweden- A Tentative Assessment](https://img.pdfslide.net/doc/110x75/55cf8fc7550346703b9fb3ce/9781843761785-competition-in-european-electricity-markets-the-deregulated.jpg)