Embed Size (px)
Citation preview
1325 G Street N.W., Suite 800, Washington, D.C. 2005
(202) 626-5100 www.dcpsc.org
Electricity Price Outlook for September 2019
By John Howley Senior Economist
Office of Technical and Regulatory Analysis
District of Columbia Public Service Commission
The Office of Technical and Regulatory Analysis presents the outlook for wholesale electricity prices each month. This assessment considers trends in electricity futures markets as well as forecasted weather, economic growth, and input fuel prices.
Key Points in this Month’s Outlook
On June 1st, new, lower Standard Offer Service (“SOS”) electric rates took effect resulting in a 5.1 percent average decrease for residential customers and 3.8 percent average decrease for small commercial customers.
Plentiful natural gas in the PJM region is keeping wholesale electricity prices stable.
Natural gas now exceeds coal as a generation fuel source in the PJM region.
Wholesale Electricity Futures Market
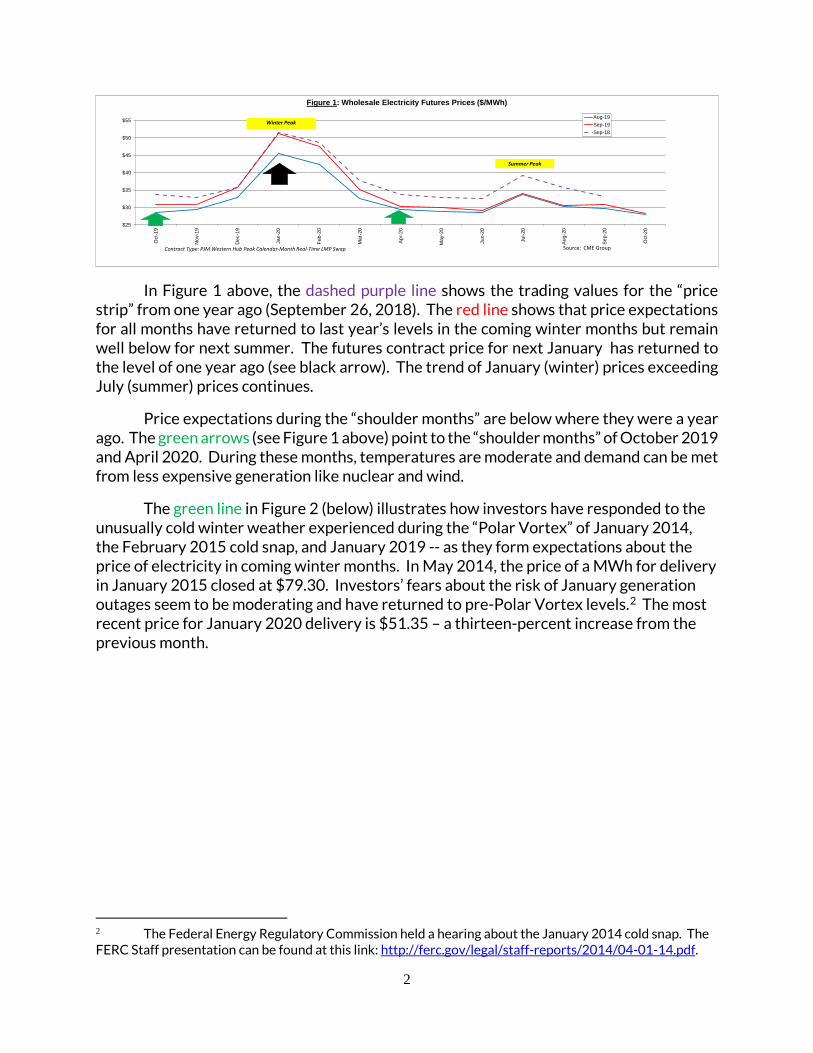
Contracts to deliver electricity in future months are traded for the multi-state region that is served by regional transmission operator PJM Interconnection and includes the District of Columbia. Figure 1 below shows the futures contract “price strips” through September 2020 as settled on August 9, 2019 (blue line), and on September 19, 2019 (red line).1
Because electricity cannot be easily stored, the effect of seasonal temperature changes on the price of future delivery contracts stands out sharply, with yearly peaks in the hot summer months and cold winter ones. Wholesale prices rise to incentivize high-cost generators to turn on their power plants to meet the high demand for electricity to run air conditioning on hot summer days and heating systems on cold winter days.
1 See PJM Western Hub Peak Calendar-Month Real-Time LMP Swap Futures; CME Group.
2
In Figure 1 above, the dashed purple line shows the trading values for the “price strip” from one year ago (September 26, 2018). The red line shows that price expectations for all months have returned to last year’s levels in the coming winter months but remain well below for next summer. The futures contract price for next January has returned to the level of one year ago (see black arrow). The trend of January (winter) prices exceeding July (summer) prices continues.
Price expectations during the “shoulder months” are below where they were a year ago. The green arrows (see Figure 1 above) point to the “shoulder months” of October 2019 and April 2020. During these months, temperatures are moderate and demand can be met from less expensive generation like nuclear and wind.
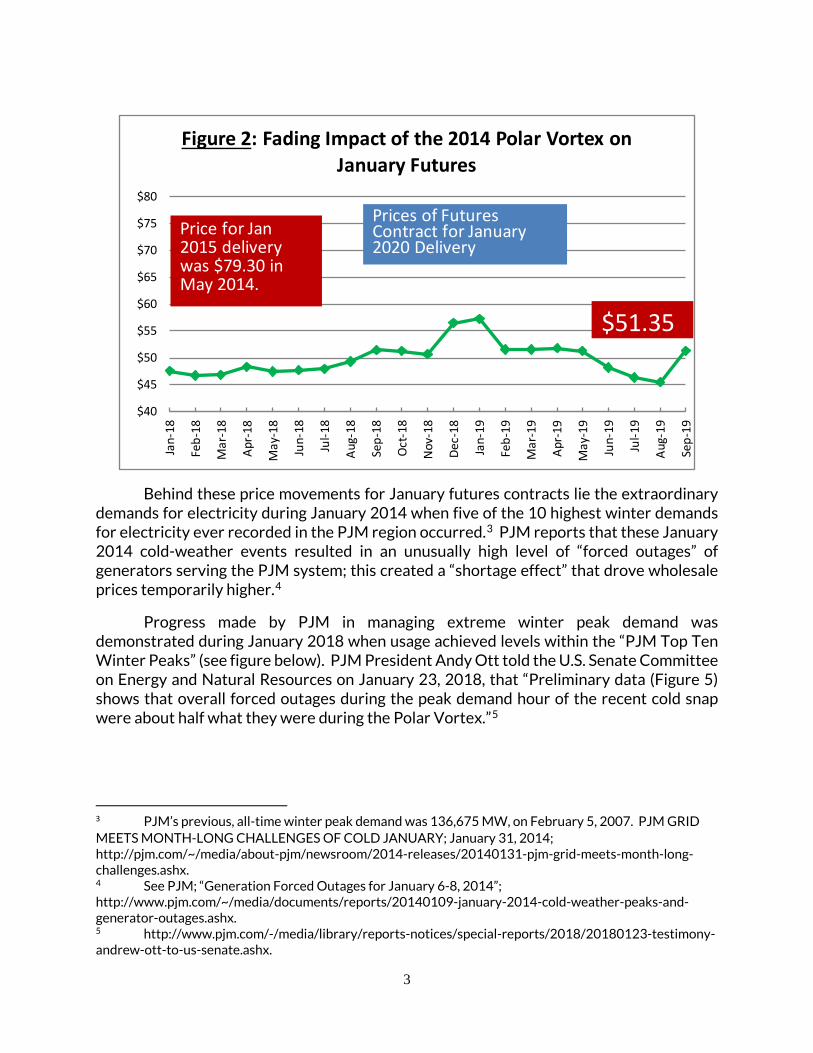
The green line in Figure 2 (below) illustrates how investors have responded to the unusually cold winter weather experienced during the “Polar Vortex” of January 2014, the February 2015 cold snap, and January 2019 -- as they form expectations about the price of electricity in coming winter months. In May 2014, the price of a MWh for delivery in January 2015 closed at $79.30. Investors’ fears about the risk of January generation outages seem to be moderating and have returned to pre-Polar Vortex levels.2 The most recent price for January 2020 delivery is $51.35 – a thirteen-percent increase from the previous month.
2 The Federal Energy Regulatory Commission held a hearing about the January 2014 cold snap. The FERC Staff presentation can be found at this link: http://ferc.gov/legal/staff-reports/2014/04-01-14.pdf.
$25
$30
$35
$40
$45
$50
$55
Oct
-19
Nov
-19
Dec
-19
Jan-
20
Feb-
20
Mar
-20
Apr-2
0
May
-20
Jun-
20
Jul-2
0
Aug-
20
Sep-
20
Oct
-20
Figure 1: Wholesale Electricity Futures Prices ($/MWh)Aug-19Sep-19Sep-18
Source: CME GroupContract Type: PJM Western Hub Peak Calendar-Month Real-Time LMP Swap
Winter Peak
Summer Peak
3
Behind these price movements for January futures contracts lie the extraordinary demands for electricity during January 2014 when five of the 10 highest winter demands for electricity ever recorded in the PJM region occurred.3 PJM reports that these January 2014 cold-weather events resulted in an unusually high level of “forced outages” of generators serving the PJM system; this created a “shortage effect” that drove wholesale prices temporarily higher.4
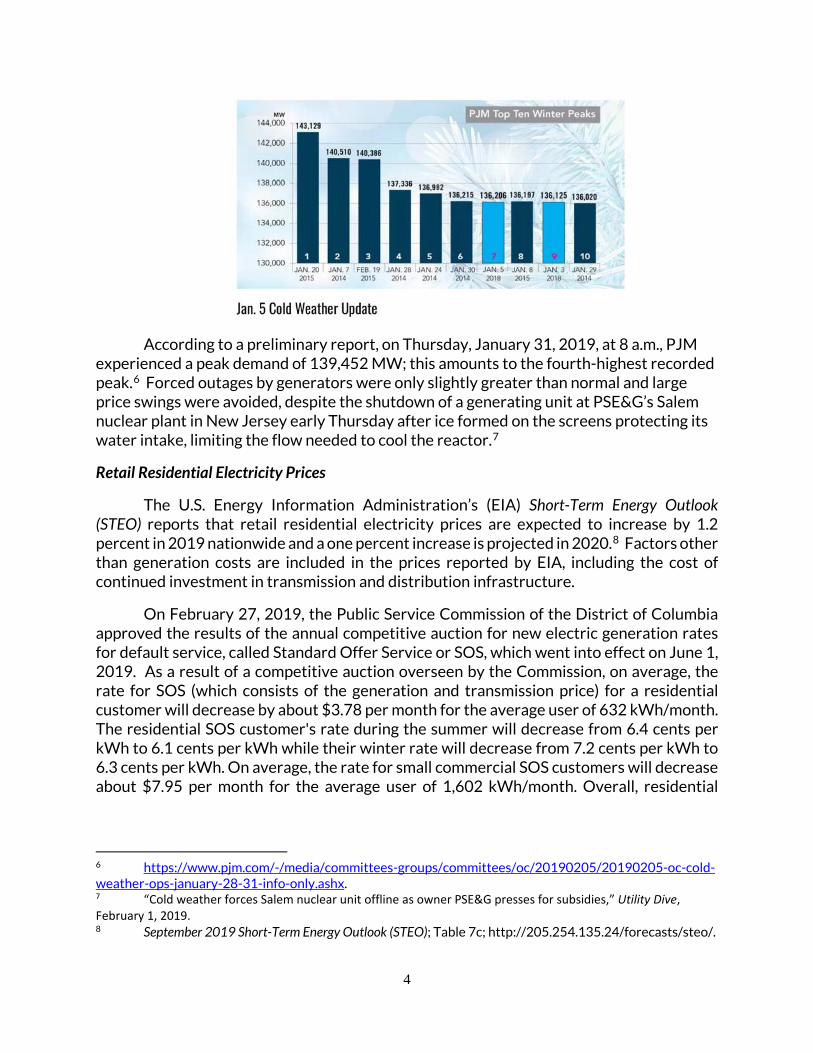
Progress made by PJM in managing extreme winter peak demand was demonstrated during January 2018 when usage achieved levels within the “PJM Top Ten Winter Peaks” (see figure below). PJM President Andy Ott told the U.S. Senate Committee on Energy and Natural Resources on January 23, 2018, that “Preliminary data (Figure 5) shows that overall forced outages during the peak demand hour of the recent cold snap were about half what they were during the Polar Vortex.”5
3 PJM’s previous, all-time winter peak demand was 136,675 MW, on February 5, 2007. PJM GRID MEETS MONTH-LONG CHALLENGES OF COLD JANUARY; January 31, 2014; http://pjm.com/~/media/about-pjm/newsroom/2014-releases/20140131-pjm-grid-meets-month-long-challenges.ashx. 4 See PJM; “Generation Forced Outages for January 6-8, 2014”; http://www.pjm.com/~/media/documents/reports/20140109-january-2014-cold-weather-peaks-and-generator-outages.ashx. 5 http://www.pjm.com/-/media/library/reports-notices/special-reports/2018/20180123-testimony-andrew-ott-to-us-senate.ashx.
$40
$45
$50
$55
$60
$65
$70
$75
$80
Jan-
18
Feb-
18
Mar
-18
Apr-
18
May
-18
Jun-
18
Jul-1
8
Aug-
18
Sep-
18
Oct
-18
Nov
-18
Dec-
18
Jan-
19
Feb-
19
Mar
-19
Apr-
19
May
-19
Jun-
19
Jul-1
9
Aug-
19
Sep-
19
Figure 2: Fading Impact of the 2014 Polar Vortex on January Futures
Prices of Futures Contract for January 2020 Delivery
Price for Jan 2015 delivery was $79.30 in May 2014.
$51.35
4
According to a preliminary report, on Thursday, January 31, 2019, at 8 a.m., PJM experienced a peak demand of 139,452 MW; this amounts to the fourth-highest recorded peak.6 Forced outages by generators were only slightly greater than normal and large price swings were avoided, despite the shutdown of a generating unit at PSE&G’s Salem nuclear plant in New Jersey early Thursday after ice formed on the screens protecting its water intake, limiting the flow needed to cool the reactor.7
Retail Residential Electricity Prices
The U.S. Energy Information Administration’s (EIA) Short-Term Energy Outlook (STEO) reports that retail residential electricity prices are expected to increase by 1.2 percent in 2019 nationwide and a one percent increase is projected in 2020.8 Factors other than generation costs are included in the prices reported by EIA, including the cost of continued investment in transmission and distribution infrastructure.
On February 27, 2019, the Public Service Commission of the District of Columbia approved the results of the annual competitive auction for new electric generation rates for default service, called Standard Offer Service or SOS, which went into effect on June 1, 2019. As a result of a competitive auction overseen by the Commission, on average, the rate for SOS (which consists of the generation and transmission price) for a residential customer will decrease by about $3.78 per month for the average user of 632 kWh/month. The residential SOS customer's rate during the summer will decrease from 6.4 cents per kWh to 6.1 cents per kWh while their winter rate will decrease from 7.2 cents per kWh to 6.3 cents per kWh. On average, the rate for small commercial SOS customers will decrease about $7.95 per month for the average user of 1,602 kWh/month. Overall, residential
6 https://www.pjm.com/-/media/committees-groups/committees/oc/20190205/20190205-oc-cold-weather-ops-january-28-31-info-only.ashx. 7 “Cold weather forces Salem nuclear unit offline as owner PSE&G presses for subsidies,” Utility Dive, February 1, 2019. 8 September 2019 Short-Term Energy Outlook (STEO); Table 7c; http://205.254.135.24/forecasts/steo/.
5
customers will face an average SOS rate decrease of 5.1 percent, while small commercial customers will face an average rate decrease of 3.8 percent.9
The following sections provide a brief discussion of some of the factors affecting this month’s outlook, including the three-month weather forecast, the overall economic outlook, and the prices of fuels used in power generation.
Weather Outlook
Sea-surface temperatures in the equatorial Pacific Ocean influence weather patterns across North America; these so-called La Niña/El Niño conditions are the primary factor in the three-month temperature outlook which, in turn, impacts investor expectations about future electricity prices.
The National Oceanic and Atmospheric Administration’s August 8th El Niño watch indicates that El Niño has transitioned to ENSO-neutral which is favored during the Northern Hemisphere fall 2019 (~75% chance), continuing through spring 2020 (55-60% chance).).10 NOAA notes that, with the end of El Niño conditions, there is some chance of above-normal average temperatures in the mid-Atlantic region through the October-November-December period.11 NOAA expects normal precipitation during the next three months in the mid-Atlantic region. El Niño conditions tend to suppress hurricane activity in the North Atlantic. With the end of El Niño conditions, NOAA has increased the chances for an “above-normal” hurricane season in the North Atlantic, with two to four major hurricanes expected.12
Heating-degree days measure the demand for heating during the winter. EIA reports that heating degree days in our region are projected to be five percent higher in 2020 than in 2019. Projected heating degree days for 2020 are one percent above the ten-year average.13
Cooling-degree days measure the demand for air conditioning during the summer. EIA projects cooling-degree days in the Census region that includes the District of Columbia will be four percent lower in 2020 than the ten-year average. The projection for summer 2020 is eight percent lower than 2019.14 The long-term warming trend continues.15
9 Formal Case No. 1017; Order No. 19838; February 27, 2019. 10 http://www.cpc.ncep.noaa.gov/products/analysis_monitoring/enso_advisory/ensodisc.html. “ENSO” means El Niño Southern Oscillation; “ENSO-neutral” means that neither El Niño nor La Niña conditions are present. 11 http://www.cpc.ncep.noaa.gov/products/predictions/90day/fxus05.html. 12 https://www.noaa.gov/media-release/noaa-increases-chance-for-above-normal-hurricane-season. 13 STEO, Table 9c. 14 STEO; Table 9c. 15 NOAA National Climatic Data Center; Contiguous U.S. Temperature 1896 – 2018.
6
Economic Growth and Electricity Consumption
The outlook for economic activity in 2019 remains one of moderate growth. Real (inflation-adjusted) gross domestic product (GDP) grew by 2.9 percent in 2018 and is projected to grow by 2.3 percent in 2019 and by 2.3 percent in 2020.16 Economic growth is unlikely to affect electricity price trends unless it is sustained above three percent.
EIA forecasts that nationwide residential electricity sales (measured in millions of kilowatthours per day) will decrease by 2.6 percent in 2019, followed by no change in 2020. Nationwide electricity sales for all sectors will decrease by 1.5 percent in 2019, with no increase projected in 2020.17
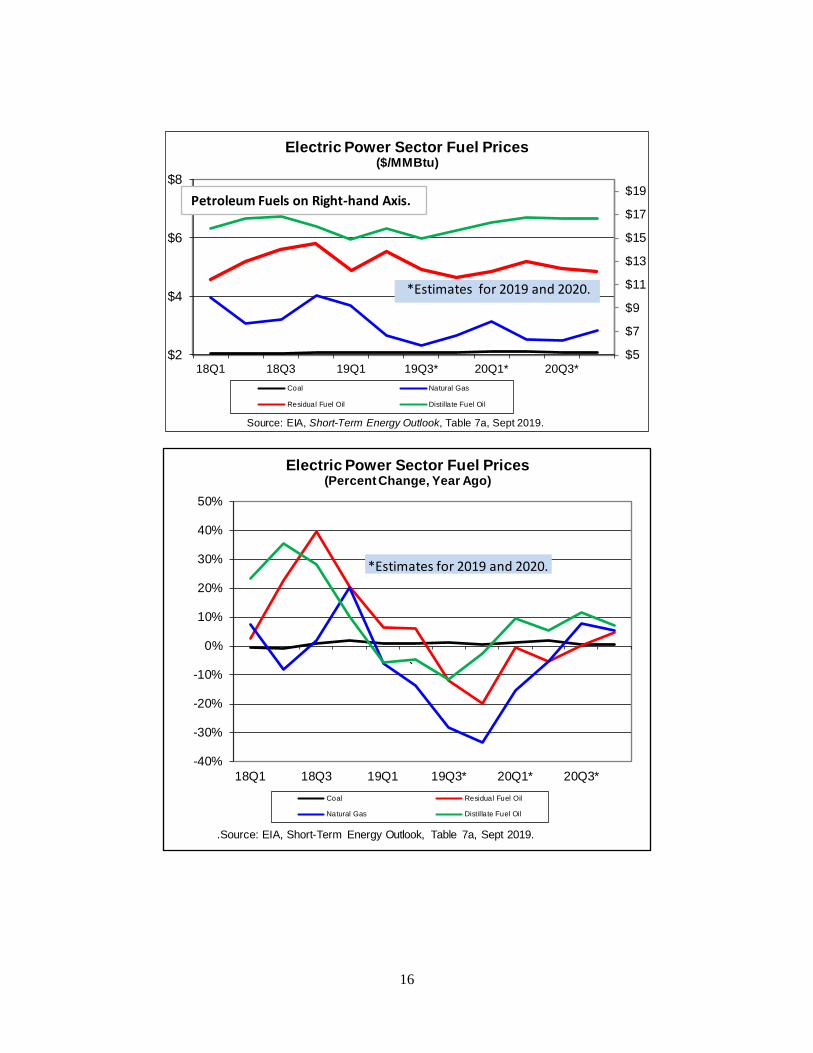
Fuel Prices
In recent years, the cost of fuels for electricity generation has been restrained, with the exception of petroleum-based fuels where the market remains volatile in both directions. This moderate trend is driven by historically low natural gas prices and moderate economic growth. The cost of natural gas for generation is projected to remain below the $3 level in 2019 and 2020.18
Petroleum
The continued rise in U.S. shale output continues to moderate crude oil prices, despite output disruptions overseas.19 North Sea Brent crude averaged $59 per barrel in August, $5 lower than July and $13 lower than in August 2018.20 Brent crude is forecast to average $60 per barrel in the fourth quarter of 2019 and $62 per barrel in 2020, down from an average of $71 per barrel in 2018.21 EIA expects retail gasoline to average $2.56 per gallon in 2019 and $2.63 per gallon in 2020, compared to $2.73 per gallon in 2018.22
The latest data from OPEC shows that exporters made significant output cuts in July.23 Crude oil prices firmed up at the end of August. In mid-September, an attack on Saudi oil facilities caused a small and brief spike in prices. The Wall Street Jouornal reported
16 STEO; Table 1. 17 STEO; Table 7b. 18 STEO, Table 7a. 19 “U.S. Shale Producers Benefit as Oil Disruptions Plague Middle East,” Wall Street Journal; July 22, 2019. 20 STEO, page 1. 21 STEO, page 1. The “North Sea Brent Crude” is the key contract for setting the price of crude oil in international markets. 22 STEO, Table 2. 23 “Oil Climbs on OPEC Output Cuts;” August 27, 2019; https://www.wsj.com/articles/oil-prices-inch-higher-trade-uncertainties-persist-11566867358.
7
on September 26th that Brent crude was trading around $61 per barrel as Saudi Arabia restored output more quickly than expected.24
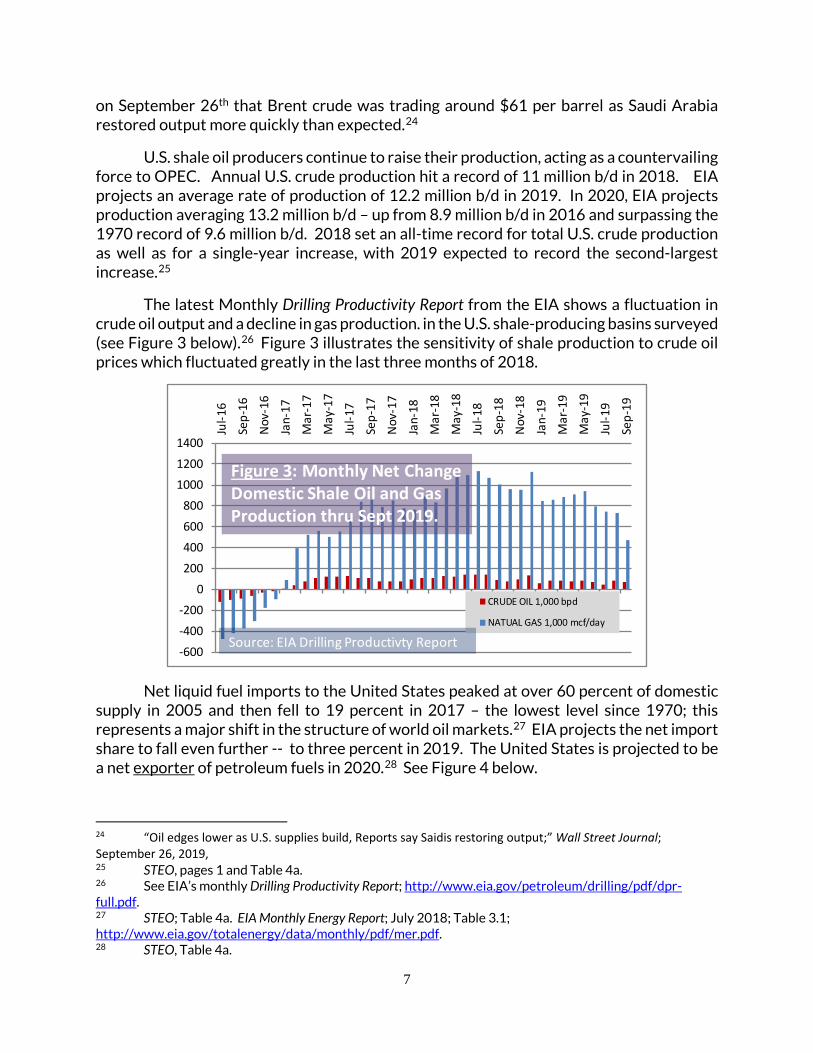
U.S. shale oil producers continue to raise their production, acting as a countervailing force to OPEC. Annual U.S. crude production hit a record of 11 million b/d in 2018. EIA projects an average rate of production of 12.2 million b/d in 2019. In 2020, EIA projects production averaging 13.2 million b/d – up from 8.9 million b/d in 2016 and surpassing the 1970 record of 9.6 million b/d. 2018 set an all-time record for total U.S. crude production as well as for a single-year increase, with 2019 expected to record the second-largest increase.25
The latest Monthly Drilling Productivity Report from the EIA shows a fluctuation in crude oil output and a decline in gas production. in the U.S. shale-producing basins surveyed (see Figure 3 below).26 Figure 3 illustrates the sensitivity of shale production to crude oil prices which fluctuated greatly in the last three months of 2018.
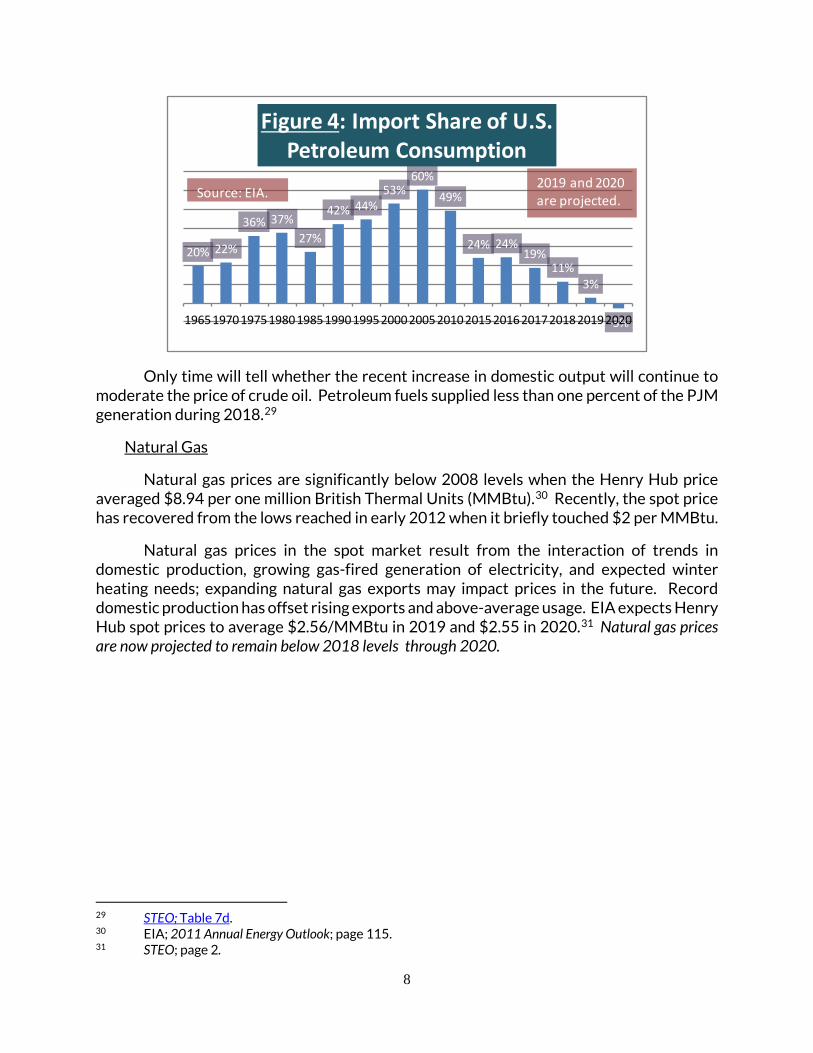
Net liquid fuel imports to the United States peaked at over 60 percent of domestic supply in 2005 and then fell to 19 percent in 2017 – the lowest level since 1970; this represents a major shift in the structure of world oil markets.27 EIA projects the net import share to fall even further -- to three percent in 2019. The United States is projected to be a net exporter of petroleum fuels in 2020.28 See Figure 4 below.
24 “Oil edges lower as U.S. supplies build, Reports say Saidis restoring output;” Wall Street Journal; September 26, 2019, 25 STEO, pages 1 and Table 4a. 26 See EIA’s monthly Drilling Productivity Report; http://www.eia.gov/petroleum/drilling/pdf/dpr-full.pdf. 27 STEO; Table 4a. EIA Monthly Energy Report; July 2018; Table 3.1; http://www.eia.gov/totalenergy/data/monthly/pdf/mer.pdf. 28 STEO, Table 4a.
-600-400-200
0200400600800
100012001400
Jul-1
6
Sep-
16
Nov
-16
Jan-
17
Mar
-17
May
-17
Jul-1
7
Sep-
17
Nov
-17
Jan-
18
Mar
-18
May
-18
Jul-1
8
Sep-
18
Nov
-18
Jan-
19
Mar
-19
May
-19
Jul-1
9
Sep-
19
CRUDE OIL 1,000 bpd
NATUAL GAS 1,000 mcf/day
Source: EIA Drilling Productivty Report
Figure 3: Monthly Net Change Domestic Shale Oil and Gas Production thru Sept 2019.
8
Only time will tell whether the recent increase in domestic output will continue to moderate the price of crude oil. Petroleum fuels supplied less than one percent of the PJM generation during 2018.29
Natural Gas
Natural gas prices are significantly below 2008 levels when the Henry Hub price averaged $8.94 per one million British Thermal Units (MMBtu).30 Recently, the spot price has recovered from the lows reached in early 2012 when it briefly touched $2 per MMBtu.
Natural gas prices in the spot market result from the interaction of trends in domestic production, growing gas-fired generation of electricity, and expected winter heating needs; expanding natural gas exports may impact prices in the future. Record domestic production has offset rising exports and above-average usage. EIA expects Henry Hub spot prices to average $2.56/MMBtu in 2019 and $2.55 in 2020.31 Natural gas prices are now projected to remain below 2018 levels through 2020.
29 STEO; Table 7d. 30 EIA; 2011 Annual Energy Outlook; page 115. 31 STEO; page 2.
20% 22%
36% 37%27%
42% 44%53%
60%49%
24% 24%19%
11%3%
-3%1965197019751980198519901995200020052010201520162017201820192020
Figure 4: Import Share of U.S. Petroleum Consumption
Source: EIA.2019 and 2020 are projected.
9
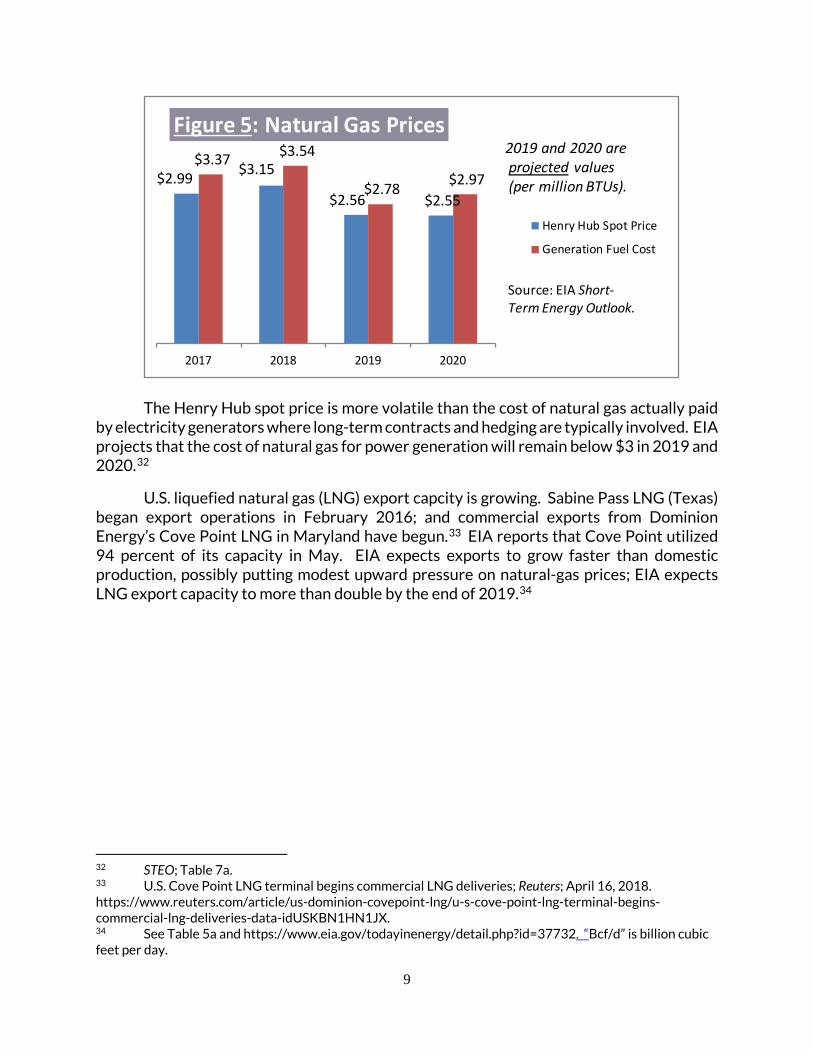
The Henry Hub spot price is more volatile than the cost of natural gas actually paid by electricity generators where long-term contracts and hedging are typically involved. EIA projects that the cost of natural gas for power generation will remain below $3 in 2019 and 2020.32
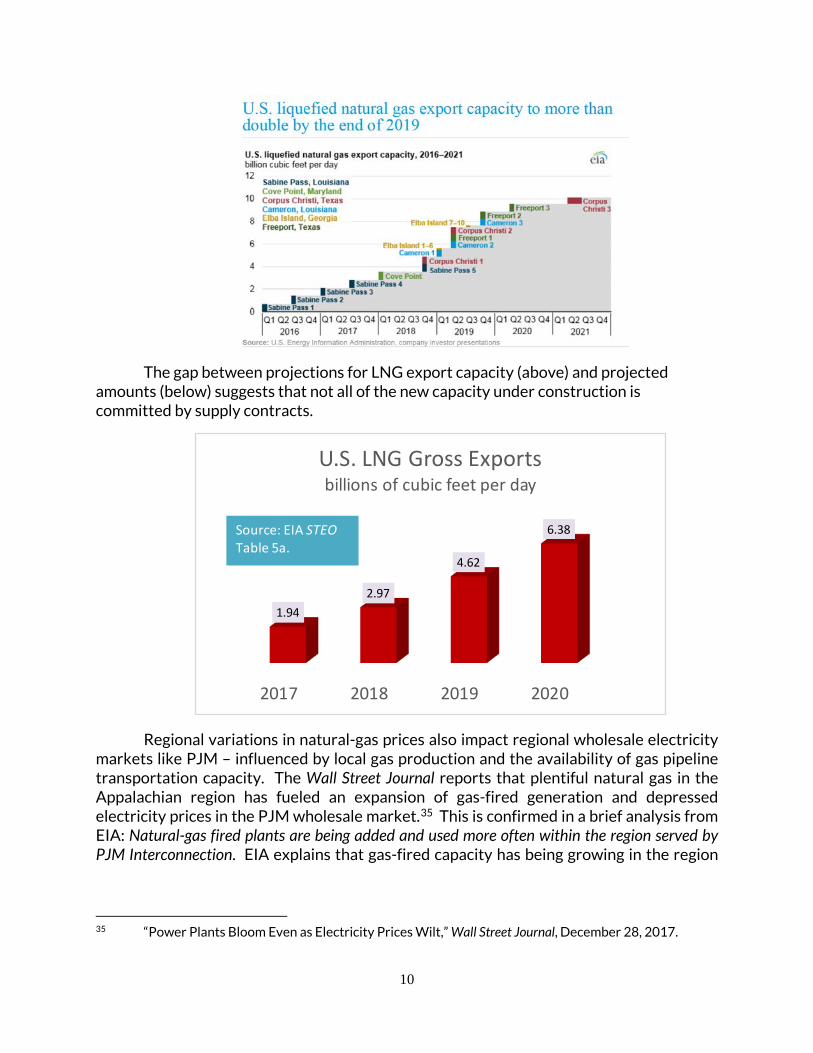
U.S. liquefied natural gas (LNG) export capcity is growing. Sabine Pass LNG (Texas) began export operations in February 2016; and commercial exports from Dominion Energy’s Cove Point LNG in Maryland have begun.33 EIA reports that Cove Point utilized 94 percent of its capacity in May. EIA expects exports to grow faster than domestic production, possibly putting modest upward pressure on natural-gas prices; EIA expects LNG export capacity to more than double by the end of 2019.34
32 STEO; Table 7a. 33 U.S. Cove Point LNG terminal begins commercial LNG deliveries; Reuters; April 16, 2018. https://www.reuters.com/article/us-dominion-covepoint-lng/u-s-cove-point-lng-terminal-begins-commercial-lng-deliveries-data-idUSKBN1HN1JX. 34 See Table 5a and https://www.eia.gov/todayinenergy/detail.php?id=37732. “Bcf/d” is billion cubic feet per day.
$2.99 $3.15
$2.56 $2.55
$3.37 $3.54
$2.78 $2.97
2017 2018 2019 2020
Figure 5: Natural Gas Prices
Henry Hub Spot Price
Generation Fuel Cost
2019 and 2020 areprojected values(per million BTUs).
Source: EIA Short-Term Energy Outlook.
10
The gap between projections for LNG export capacity (above) and projected amounts (below) suggests that not all of the new capacity under construction is committed by supply contracts.
Regional variations in natural-gas prices also impact regional wholesale electricity markets like PJM – influenced by local gas production and the availability of gas pipeline transportation capacity. The Wall Street Journal reports that plentiful natural gas in the Appalachian region has fueled an expansion of gas-fired generation and depressed electricity prices in the PJM wholesale market.35 This is confirmed in a brief analysis from EIA: Natural-gas fired plants are being added and used more often within the region served by PJM Interconnection. EIA explains that gas-fired capacity has being growing in the region
35 “Power Plants Bloom Even as Electricity Prices Wilt,” Wall Street Journal, December 28, 2017.
2017 2018 2019 2020
1.942.97
4.62
6.38
U.S. LNG Gross Exportsbillions of cubic feet per day
Source: EIA STEOTable 5a.
11
and that gas-fired generation has a rising “capacity factor” which combine to increase megawatthours generated by natural gas.36
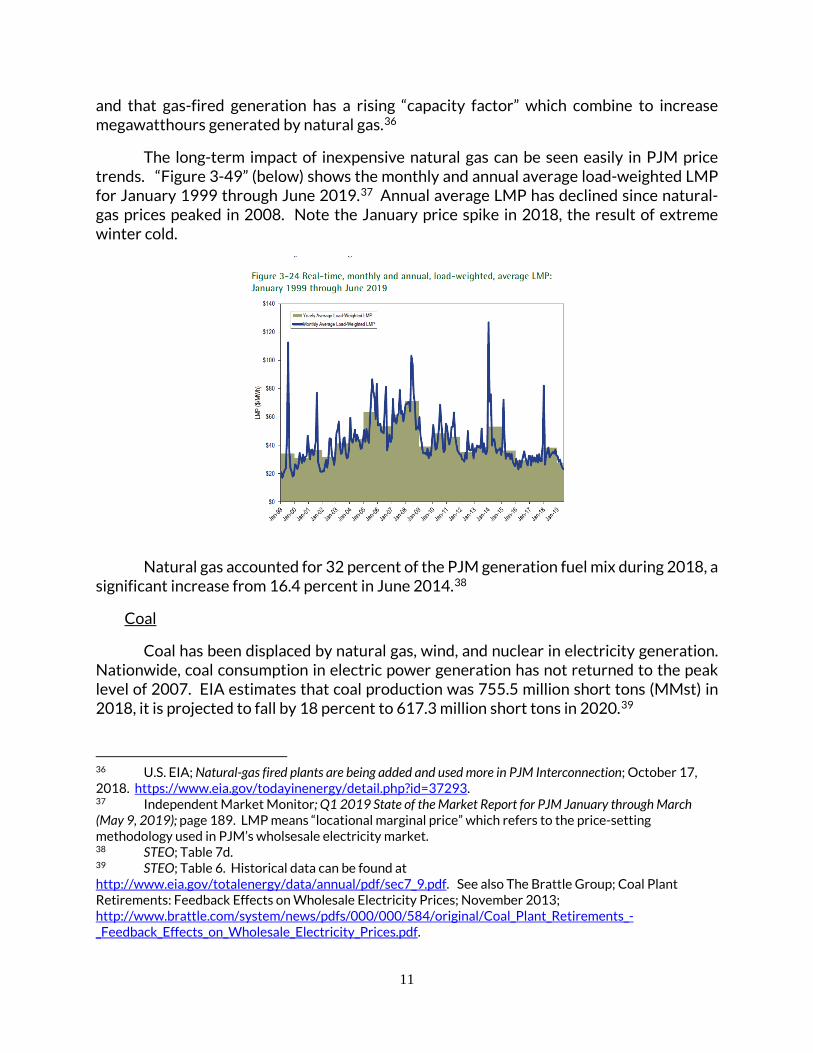
The long-term impact of inexpensive natural gas can be seen easily in PJM price trends. “Figure 3-49” (below) shows the monthly and annual average load-weighted LMP for January 1999 through June 2019.37 Annual average LMP has declined since natural-gas prices peaked in 2008. Note the January price spike in 2018, the result of extreme winter cold.
Natural gas accounted for 32 percent of the PJM generation fuel mix during 2018, a significant increase from 16.4 percent in June 2014.38
Coal
Coal has been displaced by natural gas, wind, and nuclear in electricity generation. Nationwide, coal consumption in electric power generation has not returned to the peak level of 2007. EIA estimates that coal production was 755.5 million short tons (MMst) in 2018, it is projected to fall by 18 percent to 617.3 million short tons in 2020.39
36 U.S. EIA; Natural-gas fired plants are being added and used more in PJM Interconnection; October 17, 2018. https://www.eia.gov/todayinenergy/detail.php?id=37293. 37 Independent Market Monitor; Q1 2019 State of the Market Report for PJM January through March (May 9, 2019); page 189. LMP means “locational marginal price” which refers to the price-setting methodology used in PJM’s wholsesale electricity market. 38 STEO; Table 7d. 39 STEO; Table 6. Historical data can be found at http://www.eia.gov/totalenergy/data/annual/pdf/sec7_9.pdf. See also The Brattle Group; Coal Plant Retirements: Feedback Effects on Wholesale Electricity Prices; November 2013; http://www.brattle.com/system/news/pdfs/000/000/584/original/Coal_Plant_Retirements_-_Feedback_Effects_on_Wholesale_Electricity_Prices.pdf.
12
EIA reports that the delivered price of coal for power generation peaked at $2.39 in 2011. EIA estimates the delivered price of coal averaged $2.06 per MMBtu in 2018, and forecasts $2.09 per MMBtu in 2019 and $2.11 in 2020.40
In the PJM wholesale market that serves the District of Columbia, the cost of natural gas is a more important factor than coal in setting the overall level of wholesale market prices for electricity.41 Coal represented 28 percent of the PJM generation fuel mix during 2018, down from a recent high of 45.2 percent in June 2014.42 As noted above, the natural gas share of PJM generation is rising, in line with national trends. Coal has fallen to third place behind nuclear and natural gas a share of the PJM fuel mix.
Across the United States, coal generation plants are being retired and new natural gas-fired generation plants are being built, mirroring trends in the PJM region. EIA projects that the natural gas share of electricity generation nationwide will rise from 34 percent in 2018 to 37 percent in 2019. Coal’s share of generation will fall to 22 percent in 2020, down from 28 percent in 2018.43 EIA’s forecasted generation shares for coal and natural gas are very sensitive to the natural-gas price forecast.
Renewables
Nationwide, EIA projects that generation of electricity from all nonhydropower renewables will provide more than 11 percent in 2019 and may reach exceed 12 percent in 2020.44 Wind will generate more electricity than hydropower for the first time in 2019. Generation from utility-scale solar is projected to rise by 73 percent between 2017 and 2020.45
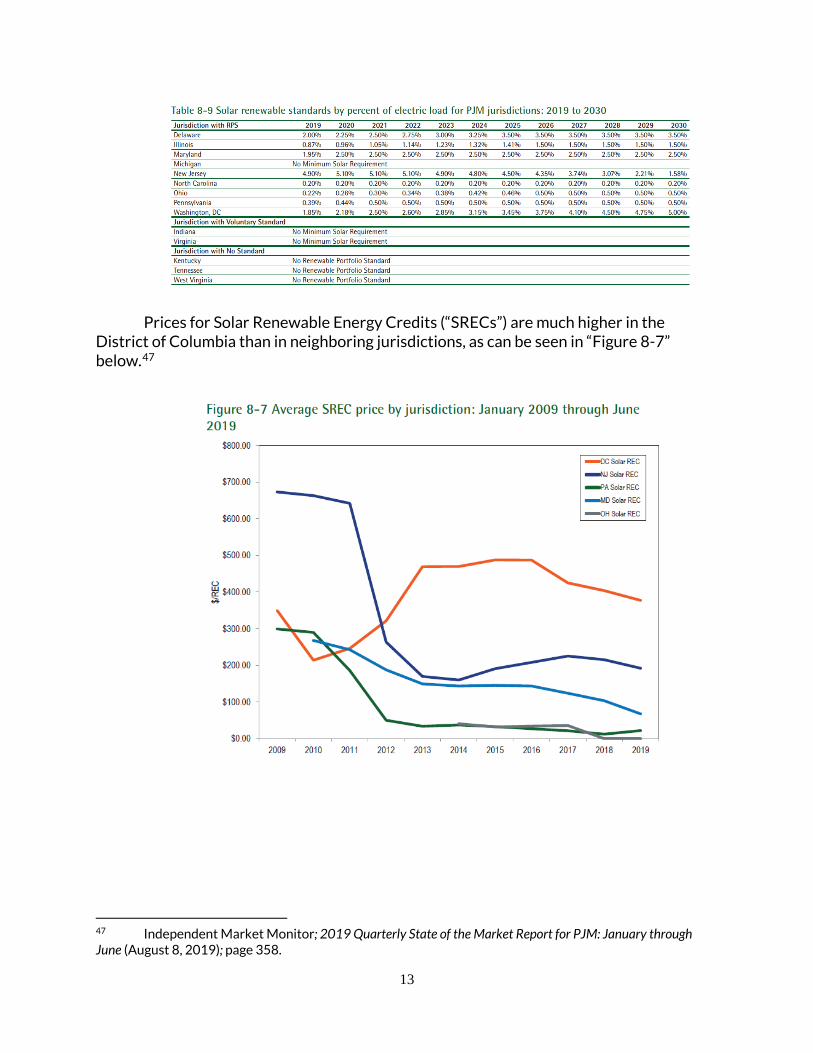
Renewable Portfolio Standards (“RPS”) enacted by many states are stimulating the rapid growth of solar in the PJM market. This stimulus will intensify as scheduled increases will raise the RPS for solar in coming years, as shown in “Table 8-6” below.46
40 STEO; Table 7a. 41 EIA reports prices for coal as delivered under long-term contracts that are less volatile than the spot prices reported for other fossil fuels. See Table 6, STEO. 42 STEO; Table 7d. 43 STEO; page 14. 44 STEO at page 2. 45 STEO at Table 8b. 46 Independent Market Monitor; 2019 Quarterly State of the Market Report for PJM: January through June (August 8, 2019); page 357.
13
Prices for Solar Renewable Energy Credits (“SRECs”) are much higher in the District of Columbia than in neighboring jurisdictions, as can be seen in “Figure 8-7” below.47
47 Independent Market Monitor; 2019 Quarterly State of the Market Report for PJM: January through June (August 8, 2019); page 358.
14
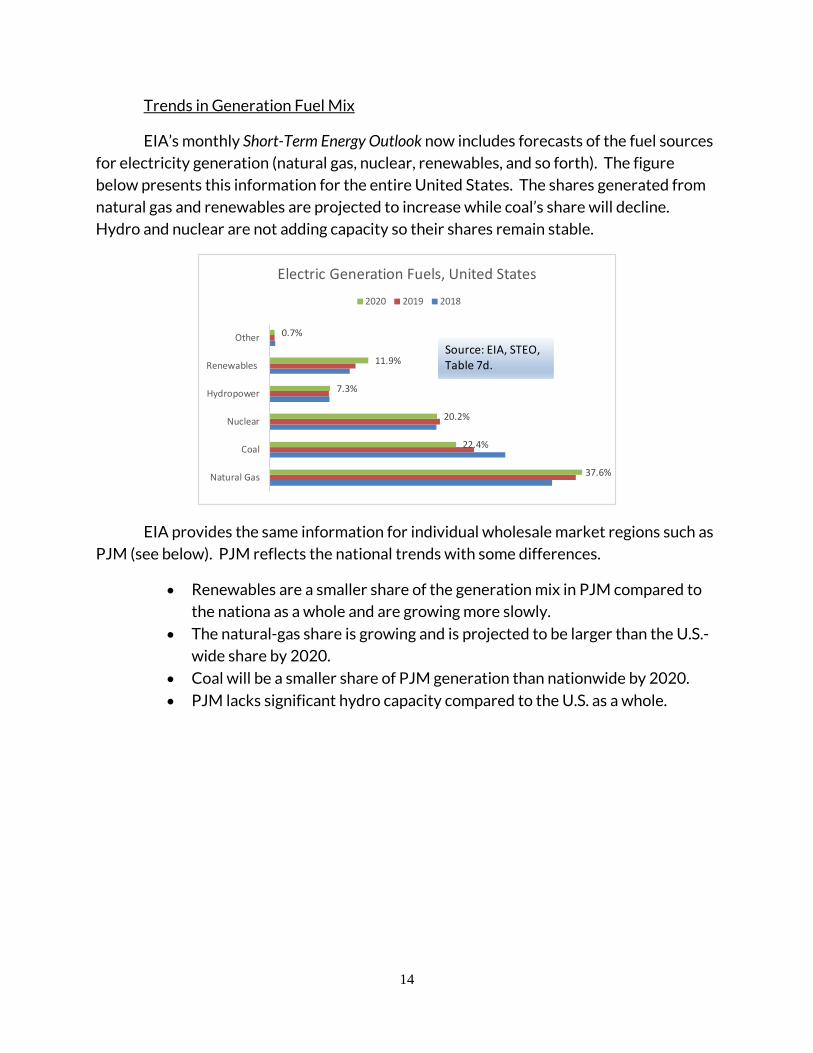
Trends in Generation Fuel Mix
EIA’s monthly Short-Term Energy Outlook now includes forecasts of the fuel sources
for electricity generation (natural gas, nuclear, renewables, and so forth). The figure
below presents this information for the entire United States. The shares generated from
natural gas and renewables are projected to increase while coal’s share will decline.
Hydro and nuclear are not adding capacity so their shares remain stable.
EIA provides the same information for individual wholesale market regions such as
PJM (see below). PJM reflects the national trends with some differences.
• Renewables are a smaller share of the generation mix in PJM compared to the nationa as a whole and are growing more slowly.
• The natural-gas share is growing and is projected to be larger than the U.S.-
wide share by 2020.
• Coal will be a smaller share of PJM generation than nationwide by 2020.
• PJM lacks significant hydro capacity compared to the U.S. as a whole.
37.6%
22.4%
20.2%
7.3%
11.9%
0.7%
Natural Gas
Coal
Nuclear
Hydropower
Renewables
Other
Electric Generation Fuels, United States2020 2019 2018
Source: EIA, STEO, Table 7d.

15
39.4%
19.9%
34.2%
1.4%
4.8%
0.3%
Natural Gas
Coal
Nuclear
Hydropower
Renewables
Other
Electric Generation Fuels, PJM Region2020 2019 2018
Source: EIA, STEO, Table 7d.
16
$5
$7
$9
$11
$13
$15
$17
$19
$2
$4
$6
$8
18Q1 18Q3 19Q1 19Q3* 20Q1* 20Q3*
Electric Power Sector Fuel Prices($/MMBtu)
Coal Natural Gas
Residual Fuel Oil Distillate Fuel Oil
*Estimates for 2019 and 2020.
Source: EIA, Short-Term Energy Outlook, Table 7a, Sept 2019.
Petroleum Fuels on Right-hand Axis.
-40%
-30%
-20%
-10%
0%
10%
20%
30%
40%
50%
18Q1 18Q3 19Q1 19Q3* 20Q1* 20Q3*
Electric Power Sector Fuel Prices(Percent Change, Year Ago)
Coal Residual Fuel Oil
Natural Gas Distillate Fuel Oil
`
*Estimates for 2019 and 2020.
.Source: EIA, Short-Term Energy Outlook, Table 7a, Sept 2019.
`

17
Wholesale Electric Market Assessment Information
Price of Electricity Futures Contracts for August 9 andSeptember 19, 2019
Twelve Month NYMEX Strip Components48
$/MWh (for $/kWh, divide by 1000)
PEPCO DC Zone Locational Marginal Price (Hourly Integrated LMP for the hour ending 1300)49
September 19, 2019: $22.00
The above are wholesale energy prices only. Transmission and distribution rates are not included.
Weather Forecast
1. Current for next few days to one week:
http://www.cnn.com/Weather/
http://home.accuweather.com/
2. National Oceanic and Atmospheric Administration, Climate Prediction Center
Outlook:
http://www.cpc.ncep.noaa.gov/
48 http://www.cmegroup.com/trading/energy/electricity/pjm-western-hub-peak-calendar-month-real-time-lmp.html. 49 http:// http://oasis.pjm.com/system.html.
Aug-19 Sep-19Oct-19 28.60$ 30.85$ Nov-19 29.50$ 30.90$ Dec-19 32.85$ 35.75$ Jan-20 45.50$ 51.35$ Feb-20 42.40$ 47.45$ Mar-20 32.50$ 35.20$ Apr-20 29.40$ 30.40$ May-20 28.95$ 30.05$ Jun-20 28.45$ 29.05$ Jul-20 33.70$ 34.10$ Aug-20 30.30$ 30.65$ Sep-20 29.75$ 30.90$ Oct-20 27.85$ 28.30$