Embed Size (px)
Citation preview
1
Electricity retail competition:
From survival strategies to oligopolistic behaviors
Dominique FINON, CIRED &
Raphaël BOROUMAND, CIRED
Working Paper (submitted to Energy Policy) May 2011
Abstract The advent of retail competition in the electricity industry was concomitant with the explicit emergence of electricity suppliers. Introducing competition at the retail level with strict unbundling was thought to imply major development of “asset-light suppliers” who neither own generating nor distribution assets. This theoretical model was envisioned even in an oligopolistic market, where suppliers compete in price and retail prices should be subsequently aligned on wholesale prices. However, in sharp contrast to this theoretical premise, asset-light suppliers’entry has never eventuated as expected. Entrants bankrupted, left the market, were taken over, or evolved towards integration into generation for market hedging purposes. Because of capacity constraints, retail competition could not be a Bertand-like price competition. Generally in a setting of multimarket competition, retail markets become the field of parallel pricing behaviors. Departing from this unexpected result, the paper shows in a first stage the necessity of vertical integration through physical hedging by comparing the risk profiles of different portfolios of hedging. In a second stage, it studies the effects of market structures on retail pricing behaviors. For this purpose, we compare the British and Norwegian markets, both considered in the literature as benchmarks of competitive markets, but with different multimarket setting, to highlight the price parallelism of British suppliers.
2
1. Introduction In most countries where electricity industries have been liberalized in the most radical way,
the development of retail competition has not given the expected results, particularly for
residential & commercial consumers. In the UK mass market retail competition does not work
effectively for the benefits of customers, as shown by the UK regulator’s inquiry in 2008
(Ofgem Supply probe) and its subsequent radical propositions to enhance retail market
functioning (OFGEM, 2011). Several studies on the Nordic countries (Johnsen and Olsen,
2008; Olsen et al, 2006) are also pointing retail market difficulties particularly in Sweden and
Finland, which result both from consumers information limitation and industrial structures by
contrast to Norwegian retail market.
The reference paradigm of competitive decentralized electricity markets which promotes pure
players in generation and retail requires the unbundling of network activities and retail on one
side; and restrictions in vertical integration between generation and retail, on the other side
(Hunt 2002; Hunt and Shuttleworth, 1997). Therefore, introducing competition at the retail
level was thought to imply the emergence and development of asset-light suppliers who
neither own distribution networks nor generating assets. By offering innovative retail
contracts, asset-light suppliers were expected to generate a fierce price competition between
entrants and regional or national incumbents, themselves vertically broken-up by the
competitive reforms, in their respective former license areas.
In this reference model of competitive decentralized markets, all suppliers have an identical
sourcing cost, aligned on the spot price. In such setting, retail profits are constrained because
suppliers are strongly incentivized to reduce their retail mark ups prices when spot prices are
in a falling trend in order to keep their market shares. The expected resulting competition
either in the standard pure and perfect competition or in the oligopolistic price competition,
was supposed to put pressure on both sourcing costs (including minimizing the hedging costs
of electricity sourcing) and operational costs (billing, marketing, information systems). Under
conditions of transparent information, no switching cost for consumers, and on small entry
and exit costs, electricity retail competition should be on price in a setting of Bertrand-like
competition. As is well known such competition should be fierce with cost-reflective prices
(i.e. to retail prices aligned on wholesale prices) Subsequently, such competitive setting
should result to low profits, even with a small number of competitors.
The reality of retail competition is in sharp contrast to these theoretical premises. Asset-light
suppliers bankrupted, left the market, were taken over, or evolved towards vertical integration
3
into production in every country. Even in Great Britain, presented as a successful liberalized
market with regional incumbents restricted by regulation to acquire generation assets up to
1998 (Helm, 2003; Thomas, 2006), twenty new entrants left the retail market since 2000
despite a pro-competitive institutional environment (Oxera, 2008). The few remaining
entrants are positioned on a niche market (such as supply of “green” electricity from
exclusively renewable sources) with an insignificant total level of market shares (0.5% in
2010). In Norway, another benchmark in terms of electricity liberalization and in which retail
business is very fragmented for historical reasons between hundred of municipalities, there
were some temporary entries on the market, like suppliers having another core business (as
Statoil), or two independent suppliers which succeeded in building up a quite large customers
base, but eventually they gave up the business or have been bought by established retailing-
distribution groups.
Departing from these observations, our paper analyses first the viability of the asset-light
supplier model in liberalized electricity markets. We demonstrate that physical hedging (i.e.
vertical integration into generation) is the only efficient risk management strategy in
liberalized markets. It is confirmed by the fact that most of the markets which have been
liberalized along the decentralized market model are characterized by a move towards
oligopolistic competition between mainly vertically integrated suppliers (Henney, 2006). This
phenomenon raises the issue of imperfect competition on electricity retail markets in a setting
of both oligopoly between vertically integrated suppliers and multimarket competition, which
we analyze in a second step. The purpose of the paper is to explain the progressive structuring
of the retail markets and the type of imperfect competition which results from this by a move
away from the Bertrand-like competition. We adopt an original perspective by analyzing
electricity suppliers as intermediaries whose main function is to manage market risks on
behalf of their customers. Indeed, the complexity of electricity markets and the hourly spot
price variability justify the existence of electricity intermediaries who receive from customers
a “mandate” of delegated risk managers. This function incites them to be vertically integrated
to avoid bankruptcy, which then incite them to depart from a Bertrand-like price competition.
The literature on electricity market can be classified in two categories: an empirical literature
on the social efficiency of retail competition and a theoretical one on models of imperfect
competition. The empirical stream has studied the costs & benefits of extended retail
competition (Green & Mc Daniel, 1998; Joskow, 2000; Littlechild, 2000, 2005, 2009), and
more specifically retail competition benefits for consumers (Waddams Price, 2004 and 2008;
4
Waddams Price & Wilson, 2007), in particular the costs and gains from switching to a new
supplier (Giulietti and al 2004). In the second stream of literature, models of imperfect
competition on the different stages of the electricity industry analyzed the impact of extended
competition on efficiency, in particular the combined effects on generation investments and
wholesale prices (Green, 2004). The impact of vertical relations between producers and
suppliers on the performance of wholesale markets, via the exercise of suppliers’oligopsonic
market power (Bushnell and al, 2008) was also studied. The issues of market power and
market performance were also studied empirically through the eventual lag between the
respective moves of wholesale and retail prices (Johnsen and Olsen, 2008; von der Fehr and
Hansen, 2010; Giulietti and al, 2010).
The paper is organized as follows. Section 2 analyses electricity supply as an intermediation
function focused on risk management and compares numerically the risk profiles of different
sourcing portfolios to show the comparative advantage of physical hedging. Section 3 studies
the effects of the non fulfillment of a Bertrand competition’s conditions on the dynamic of
competition within a multimarket competition. We show how suppliers are prone to adopt
parallel pricing behaviors to maximize their retail mark ups along a wholesale price cycle
when they compete in a multimarket configuration. For that purpose, we compare the British
and the Norwegian retail markets, given that the Norwegian competition is not structured as a
multimarket competition and consequently resembles somewhat to a Bertrand price
competition. Given the absence of data on retail prices to industrial clients, our paper focuses
on retail competition on the residential and commercial segments as all papers in literature on
retail competition do (Giulietti et al, 2010; Davies et al, 2007; Green, 2004).
2. Risk management as the core function of electricity suppliers Through their sourcing for resale, electricity suppliers are market intermediaries. Pure
suppliers buy electricity on the day ahead market, contractually from producers (forward and
or futures contracts of several months), or through virtual power plant (VPP) for delivery to
their residential and/or industrial customers through retail contracts of different durations.
Given that most residential customers are deeply risk averse to short-run price volatility and
equally reluctant to undertake the actions required to continually monitor and control usage,1
they tend ideally to opt for fixed retail prices contracts (Chao and al, 2005). Therefore,
1 In part because customers have limited options to alter usage patterns or to invest in alternative appliances and production technologies, and generally they can obtain financial hedges against fluctuating rates (Chao et al, 2005).
5
electricity is essentially sold through annual retail contracts at a uniform fixed price whatever
the level of spot prices, or through variable price contracts in which the retail price is
readjusted only at few regular steps. In these standard retail contracts, prices are fixed
somewhat above the average cost of service while wholesale prices change every hour or half
hour. By choosing such purchase contracts, customers delegate risk mitigation to suppliers.
This service which consists in inter-temporal smoothing of prices is rewarded through a risk
premium included in the contractual fixed price2. Therefore, by protecting consumers against
intra-annual price variations and intra-week price volatility, fixed retail prices are implicit call
options on quantity limited by the capacity of the connection.
2.1 The risks of electricity intermediation
Intermediaries‘classical functions, as identified by the literature, are informational (Freixas &
Rochet, 1997 ; Allen & Gale, 1997) and transactional (Benston and Smith, 1976 ; Campbell
and Kracaw, 1980 ; Fama, 1980) with two types of intermediaries: physical and financial. The
former (e.g. a discount store) adds value to a product through transformation, conditioning,
and differentiation whereas the latter (e.g. a bank) provide financial expertise and advisory
services to protect savers against the complexity and risks of financial markets. However,
electric intermediaries are neither purely physical nor purely financial intermediaries, but
rather hybrid ones. Indeed, in contrast to classical physical intermediaries, not only electricity
suppliers do not benefit from storage to smooth the consequences of offer and demand
fluctuations on the market, but also they cannot ration the supply to their consumers for two
reasons: they do not physically deliver electricity and the short term demand of electricity is
price-inelastic. Besides, electricity cannot be physically transformed and differentiation of
offers is very limited given electricity’s homogeneity. Differentiation can only be reached
through enrichment of offers (dual fuel contract where electricity and gas supply is bundled,
energy efficiency services, green labeled electricity). Some services (e.g. flexible billing,
maintenance) and pricing innovations can also be offered. Last but not least in terms of
intermediation specificity, electricity suppliers have been imposed by the regulator the
contractual responsibility to settle financially and balance physically their upstream and
downstream portfolios of electricity in order to facilitate the real time system balancing task
2 This risk mitigation effect originates from the difference between low volatility of spot prices over the long term compared to the high volatility of fuel and power prices in the short term (Geman, 2005). Therefore, customers are exposed to trends and only gradually.
6
assumed by the TSO in liberalized electricity systems. This financial matching on very short
term markets (almost on a real time basis without storage) is related to a virtually physical
matching3 between the electricity bought and sold. These specific features give rise to
structural quantity risk and price risk.
An electricity supplier is exposed to a quantity risk on the demand side over a short term
horizon (from a few days, a few hours, to real time exposure) due to unanticipated load
variations, (e.g. related to the imperfect predictability of weather conditions)4. This risk is
amplified for the supply to residential customers where the retail contract is designed in
reference to a “load profile” which organizes an imperfect market segmentation that allows a
collective mechanism of metering instead of metering the consumer real consumption. Since
electricity is not economically storable, all imbalances will have to be instantaneously settled
on the spot market at unforeseeable prices in particular during peak periods when supply is
even more inelastic. This non storability accentuates the complexity inherent to the classical
matching function between any intermediary’s sourcing portfolio and selling portfolio as
annalysed by Hackett (1992), Gehrig (1993), and Spulber (1999). Furthermore, the strong
positive correlation between price and demand in electricity wholesale markets (Stoft, 2002;
Chao et al. 2005), contributes to make any adjustment very costly5. This load/price positive
correlation is an important rationale for hedging.
Another source of quantity risk is the eventual loss of market shares, given customers’ right to
switch suppliers. Market shares variations will generate vertical imbalances constraining
suppliers to sell or buy any over or under-contracted quantity at uncertain spot prices.
Financial losses will occur in the absence of hedging mechanisms capable to match hourly
demand variability. Quantity risks systematically translate into price risks.
The price risk is generated by the discrepancies between the selling price of electricity on the
retail market (generally a one year or more fixed price contract on the residential &
commercial segment or a smoothed indexed price in some other cases) and the price of
complementary spot transactions to offset the disequilibrium between a supplier’s sourcing
portfolio and selling portfolio.
3 The physical matching is virtual since electricity intermediaries have no control on the physical exchange of electricity between producers and consumers. 4 Weather uncertainty can be theoretically mitigated through weather derivatives which exploit the correlation of electricity consumption with temperature. However, due to their speculative feature, difficulty of pricing, and lack of liquidity, weather derivatives are very seldom used by electricity suppliers (Geman, 2005). 5 Indeed, suppliers will need to buy electricity when demand and consequently spot prices are high. Conversely any contractual surplus of electricity will have to be sold when demand and spot prices are low. In both configurations, spot market’s interventions happen at the worst periods.
7
To minimize quantity and price risks, suppliers will aim at investing in physical assets with
different technologies and also contractually hedge a proportion of their aggregated load
requirements through the purchase of hourly electricity blocks with a minimum physical
capacity of 1 MW6. However, in the absence of mathematical models able to measure each
individual stochastic electricity demand, suppliers will define their sourcing by relying on the
imperfect market segmentation of “load profiling”. Besides hedging risks through contractual
sourcing, suppliers can also potentially rely on interruptible retail contracts to manage their
uncertain delivery obligations. With an interruptible retail contract, a supplier virtually sells a
forward contract to its customer and buys a call option from him. The seller of the forward
(i.e. the electricity supplier) can exercise the call option if the electricity spot price exceeds
the strike price, effectively cancelling the forward contract at the time of delivery.
Interruptible contracts allow for interruptions of electricity supply in exchange for either an
overall discount in the contractual price of electricity delivered or for financial compensation
for each interruption (Baldick and al, 2006).
2.2 The need for physical hedging
We now demonstrate through numerical simulations on risk profiles of different hedging
portfolios the necessity to manage risk through physical hedging7. We assume that financial
contracts are efficient risk hedging instruments and perfect substitutes to vertical integration,
as numbers of authors do (Chao et Huntington, 1998; Hunt et Shuttleworth, 1998; Hunt,
2002). We demonstrate in particular that this assumption does not hold since a supplier cannot
reproduce the risk-reducing benefits of physical hedging by contractual hedging. For that
purpose, we set the supplier’s risk management problem in the most competitive retail market
configuration with retail contractual prices aligned on the spot price. In this configuration, the
risk management constraint originates from a quantity risk which is associated to a price risk
on the spot market. The risk profiles of the considered portfolios of hedging are measured
with the traditional Value at Risk (VaR) indicator (Danielsson, 2007). The Value at Risk
(VaR) is an aggregated measure of the total risk of a portfolio of contracts and assets. The
VaR summarizes the expected maximum loss (worst loss) of a portfolio over a target horizon
(one year in this paper) within a given confidence interval (generally 95%). Thus, VaR is
6 Electricity bloc with a capacity below 1 MW (called electricity “ribbon”) cannot be bought in advance (Hunt, 2002). 7 Our methodoly is more detailed in Boroumand, R.H & Zachmann, G., (2009).
8
measured in monetary units, Euros in our paper8. As the maximum loss of a portfolio, the
VaR(95%) is a negative number. Therefore, maximizing the VaR is equivalent to minimizing
the portfolio’s loss. We rely on the Value-at-Risk because it is a relevant measure of the
downside risk of a portfolio and is for example used as preferred criteria for market risk in the
Basel II agreement. The Value-at-Risk for the 95% confidence interval that we use in the
remainder of the paper is the one hundred fiftieth lowest of the 3000 payoffs.
Payoff of the assets and contracts within the portfolios
A supplier is assumed to have concluded a retail contract (the retail contract is given ex ante
and is therefore not a portfolio’s parameter of choice) with its customers that imply stochastic
demand (for ). The demand distribution is known to the supplier and the
uncertainty about the actual demand is completely resolved in time .
To fulfill its retail commitments the supplier can buy electricity on the spot market at the
uncertain spot market price .9 The spot market price distribution is known by the supplier.
To reduce its risk from buying an uncertain amount of electricity at an uncertain price, the
supplier can conclude financial contracts and/or acquire physical generation assets All
contracts (including the retail contract and the physical assets generation volumes) are settled
on the spot market that is assumed to be perfectly liquid. Thus, the payoff streams depend on
a given number of spot market realizations (one year, i.e., 8760 hours). For example, an
annual baseload forward contract implies buying the agreed volume of electricity at the
contractual price for 8760 hours.
In Table 1 five different contracts/assets – namely a retail contract, a forward contract, a semi
baseload power plant, a call option10 on the spot price and a put option on the spot price11
given the spot price – are introduced with their payoff. If for example, the electricity spot
price ( ) is above the strike price of the options ( ), there is a positive payoff of the call
option, while the payoff of the put option is zero. The payoff of the power plant, depends on
the installed capacity of the plant ( ) and its marginal cost ( ). The payoff of the retail
contract is the only one which depends on the stochastic demand . By subtracting the 8 For further details please refer to Ph.Jorion. “Value at risk: The New Benchmark for Managing Financial Risk” Mc Graw Hill, second edition, 2000. 9 We ignore balancing markets. This can be justified by the fact that most of the adjustments of retailers take place in the day ahead market. 10 Many papers develop models with financial options (see for example Willems and Morbee, 2008; Deng and Oren, 2006) 11 A put option on the spot price, gives the supplier the right to sell electricity on the spot market at a given price.
9
expected value ( ) from the gross payoff all contracts/assets are assumed to have zero
expected value. That is, we assume that in a perfect market (no market power, no transaction
costs, full transparency, etc.) arbitrage would not allow for the existence of systematic profits.
Without this postulate, the method for the evaluation of contracts and assets would drive our
results. Indeed, the net loss calculated for each portfolio would be strongly determined by the
valuation method of the assets or contracts within the portfolio. By assuming a zero expected
value, the net loss of different portfolios can be compared without bias inherent to the types of
contracts or assets composing the portfolio.
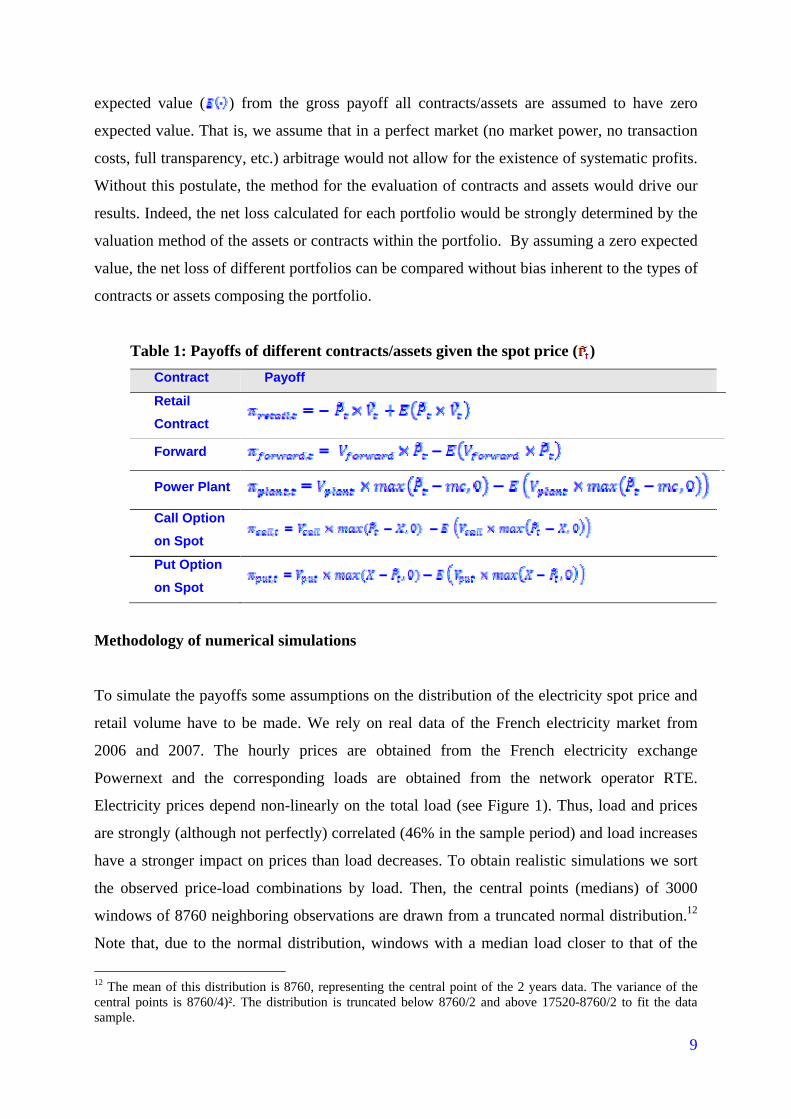
Table 1: Payoffs of different contracts/assets given the spot price ( ) Contract Payoff
Retail Contract
Forward
Power Plant
Call Option on Spot
Put Option on Spot
Methodology of numerical simulations
To simulate the payoffs some assumptions on the distribution of the electricity spot price and
retail volume have to be made. We rely on real data of the French electricity market from
2006 and 2007. The hourly prices are obtained from the French electricity exchange
Powernext and the corresponding loads are obtained from the network operator RTE.
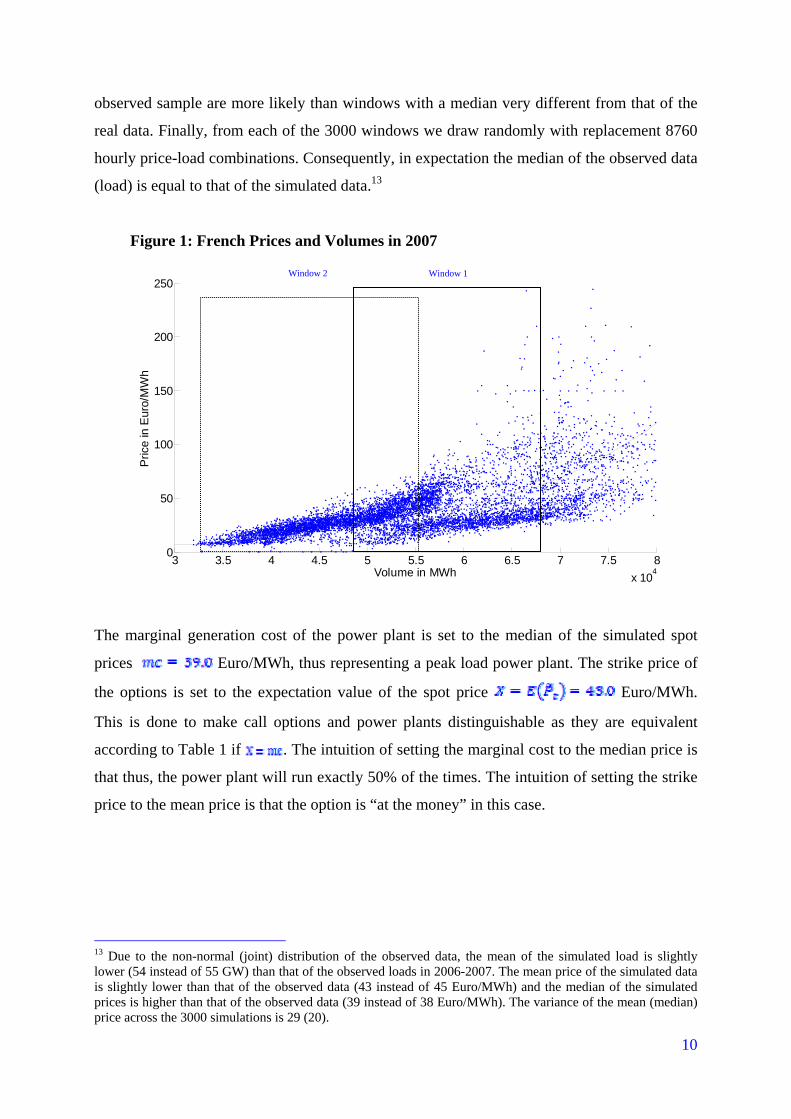
Electricity prices depend non-linearly on the total load (see Figure 1). Thus, load and prices
are strongly (although not perfectly) correlated (46% in the sample period) and load increases
have a stronger impact on prices than load decreases. To obtain realistic simulations we sort
the observed price-load combinations by load. Then, the central points (medians) of 3000
windows of 8760 neighboring observations are drawn from a truncated normal distribution.12
Note that, due to the normal distribution, windows with a median load closer to that of the
12 The mean of this distribution is 8760, representing the central point of the 2 years data. The variance of the central points is 8760/4)². The distribution is truncated below 8760/2 and above 17520-8760/2 to fit the data sample.
10
observed sample are more likely than windows with a median very different from that of the
real data. Finally, from each of the 3000 windows we draw randomly with replacement 8760
hourly price-load combinations. Consequently, in expectation the median of the observed data
(load) is equal to that of the simulated data.13
Figure 1: French Prices and Volumes in 2007
3 3.5 4 4.5 5 5.5 6 6.5 7 7.5 8x 10
4
0
50
100
150
200
250
Volume in MWh
Pric
e in
Eur
o/M
Wh
The marginal generation cost of the power plant is set to the median of the simulated spot
prices Euro/MWh, thus representing a peak load power plant. The strike price of
the options is set to the expectation value of the spot price Euro/MWh.
This is done to make call options and power plants distinguishable as they are equivalent
according to Table 1 if . The intuition of setting the marginal cost to the median price is
that thus, the power plant will run exactly 50% of the times. The intuition of setting the strike
price to the mean price is that the option is “at the money” in this case.
13 Due to the non-normal (joint) distribution of the observed data, the mean of the simulated load is slightly lower (54 instead of 55 GW) than that of the observed loads in 2006-2007. The mean price of the simulated data is slightly lower than that of the observed data (43 instead of 45 Euro/MWh) and the median of the simulated prices is higher than that of the observed data (39 instead of 38 Euro/MWh). The variance of the mean (median) price across the 3000 simulations is 29 (20).
Window 1 Window 2
11
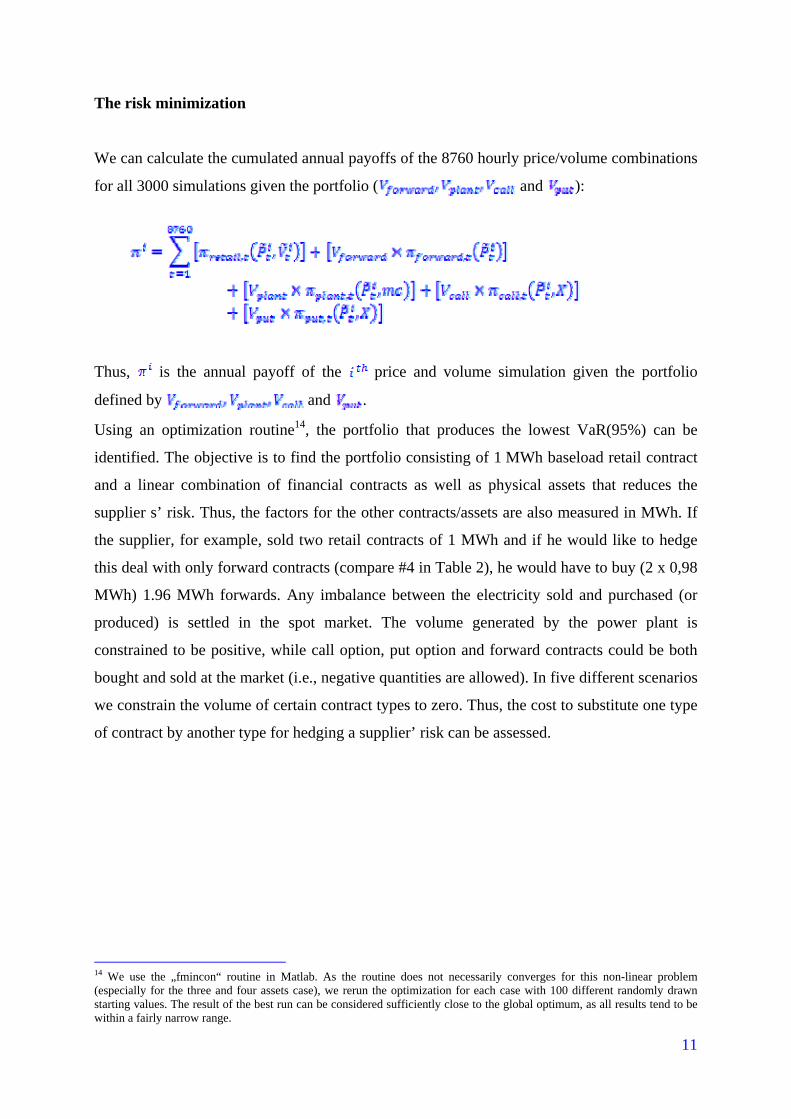
The risk minimization
We can calculate the cumulated annual payoffs of the 8760 hourly price/volume combinations
for all 3000 simulations given the portfolio ( and ):
Thus, is the annual payoff of the price and volume simulation given the portfolio
defined by and .
Using an optimization routine14, the portfolio that produces the lowest VaR(95%) can be
identified. The objective is to find the portfolio consisting of 1 MWh baseload retail contract
and a linear combination of financial contracts as well as physical assets that reduces the
supplier s’ risk. Thus, the factors for the other contracts/assets are also measured in MWh. If
the supplier, for example, sold two retail contracts of 1 MWh and if he would like to hedge
this deal with only forward contracts (compare #4 in Table 2), he would have to buy (2 x 0,98
MWh) 1.96 MWh forwards. Any imbalance between the electricity sold and purchased (or
produced) is settled in the spot market. The volume generated by the power plant is
constrained to be positive, while call option, put option and forward contracts could be both
bought and sold at the market (i.e., negative quantities are allowed). In five different scenarios
we constrain the volume of certain contract types to zero. Thus, the cost to substitute one type
of contract by another type for hedging a supplier’ risk can be assessed.
14 We use the „fmincon“ routine in Matlab. As the routine does not necessarily converges for this non-linear problem (especially for the three and four assets case), we rerun the optimization for each case with 100 different randomly drawn starting values. The result of the best run can be considered sufficiently close to the global optimum, as all results tend to be within a fairly narrow range.
12
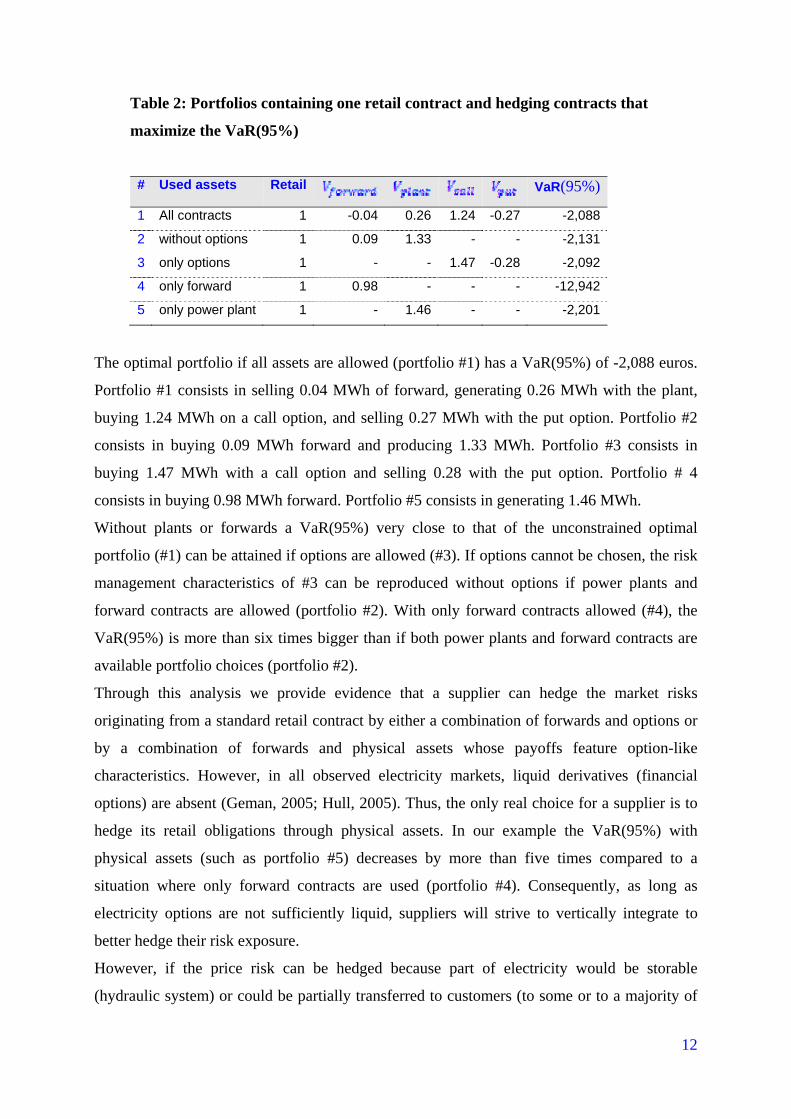
Table 2: Portfolios containing one retail contract and hedging contracts that
maximize the VaR(95%)
# Used assets Retail VaR(95%)
1 All contracts 1 -0.04 0.26 1.24 -0.27 -2,088
2 without options 1 0.09 1.33 - - -2,131
3 only options 1 - - 1.47 -0.28 -2,092
4 only forward 1 0.98 - - - -12,942
5 only power plant 1 - 1.46 - - -2,201
The optimal portfolio if all assets are allowed (portfolio #1) has a VaR(95%) of -2,088 euros.
Portfolio #1 consists in selling 0.04 MWh of forward, generating 0.26 MWh with the plant,
buying 1.24 MWh on a call option, and selling 0.27 MWh with the put option. Portfolio #2
consists in buying 0.09 MWh forward and producing 1.33 MWh. Portfolio #3 consists in
buying 1.47 MWh with a call option and selling 0.28 with the put option. Portfolio # 4
consists in buying 0.98 MWh forward. Portfolio #5 consists in generating 1.46 MWh.
Without plants or forwards a VaR(95%) very close to that of the unconstrained optimal
portfolio (#1) can be attained if options are allowed (#3). If options cannot be chosen, the risk
management characteristics of #3 can be reproduced without options if power plants and
forward contracts are allowed (portfolio #2). With only forward contracts allowed (#4), the
VaR(95%) is more than six times bigger than if both power plants and forward contracts are
available portfolio choices (portfolio #2).
Through this analysis we provide evidence that a supplier can hedge the market risks
originating from a standard retail contract by either a combination of forwards and options or
by a combination of forwards and physical assets whose payoffs feature option-like
characteristics. However, in all observed electricity markets, liquid derivatives (financial
options) are absent (Geman, 2005; Hull, 2005). Thus, the only real choice for a supplier is to
hedge its retail obligations through physical assets. In our example the VaR(95%) with
physical assets (such as portfolio #5) decreases by more than five times compared to a
situation where only forward contracts are used (portfolio #4). Consequently, as long as
electricity options are not sufficiently liquid, suppliers will strive to vertically integrate to
better hedge their risk exposure.
However, if the price risk can be hedged because part of electricity would be storable
(hydraulic system) or could be partially transferred to customers (to some or to a majority of
13
them), then the need for physical hedging would be less pregnant. In a hydraulic system, the
variability of wholesale prices is seasonal rather than hourly, favoring real time pricing and
the subsequent alignment of spot and retail prices. The wholesale price of electricity is aligned
on the long term opportunity cost of hydraulic electricity. The hourly price is much less
volatile than within a thermal system where the marginal cost of electricity would be based on
the gas price (as is the case in Great Britain where gas is the marginal technology). With such
setting of spot price variability, electricity could be sold through (smoothed) real time prices’
contracts to a substantial number of consumers (for instance in Norway in 2008, 65% of
Norwegian customers are on some types of variable price contracts15). With such retail
contracts, suppliers sourcing power from the wholesale market face a lower price risk.
3. Vertical integration, multimarket competition and strategic behaviors In an oligopolistic competition without vertical integration (i.e. by assuming that all suppliers
can source electricity on indefinite quantities from the spot market), retail competition should
be on price (i.e. with retail prices aligned on wholesale prices). Price competition should
subsequently lead to low profits, even with a small number of competitors. Indeed, in absence
of capacity constraints between firms with identical costs, competition for a homogeneous
product looks like a Bertrand price competition respecting three main conditions16 (Tirole,
1988). In presence of partially or completely vertically integrated suppliers, we must depart
from this theoretical assumption. Indeed, suppliers with physical generation assets face
capacity constraints17. The latter impedes any competitor to capture entirely the market. The
hypothetical alternative would be a setting of quantity-competition where retail prices are
misaligned with the marginal price of sourcing, which has to be to be the wholesale spot
price. Indeed, the price of internal transactions between the generation and the supply arms of
15 Standard-variable or spot-price contracts 16 The process leading to such equilibrium is simple: if a firm’s price is higher than those of its competitors, the later would capture all the market. Therefore, the firm has to offer a price slightly inferior but the competitors would react similarly until none of them is in a position to reduce its price, making losses otherwise. In this setting, the only possible equilibrium is the one where the price is aligned on the identical cost of any of the firms. However, there are conditions for such result: product homogeneity (which is the case for electricity), identical costs to reach an equilibrium with all the firms (which is almost the case), but with no capacity constraints (each firm can potentially take all the market). 17 Kreps and Scheinkman (1983) show that the Bertrand equilibrium is analogous to a Cournot equilibrium when limits are imposed on productions by the original capacities of the players.
14
a vertically integrated company is aligned on the spot price in a logic of opportunity cost18.
So we have a theoretical explanation of eventual misalignment of wholesale and retail prices.
In order to explain empirical observations of such misalignments between wholesale and
retail prices on the markets studied (British and Norwegian), we consider another dimension
of electricity retail competition within a country. This dimension, rooted in the institutional
history of an electricity supply system, is the multimarket dimension of retail competition in
the former historic areas of public utilities. Indeed, in each area competition is mainly
between the incumbent and entrants who are themselves incumbent in another area.
Competition can be enlarged to gas and electricity retail markets, given that gas incumbent in
a geographic area (or in its national area when it used to be the national monopoly) compete
with its dual fuel offers against electricity incumbents in their historical areas.
Multimarket competition theory identifies potential entrants as existing firms on adjacent
markets. In such configuration, firms meet the same rivals in several markets, which stabilizes
the competitive game nationally (Gimeno and Woo, 1999). Each supplier is conscious that
any conquering strategy on different regional markets will generate down price alignments of
all competitors in all regional markets and, subsequently a general erosion of profits. Thus, no
supplier has interest in misaligning its pricing strategy from the implicit coordinated strategy,
thus leading to a phenomenon of “mutual forbearance” (Jayachadran et al, 1999). This
phenomenon rooted in the absence of competitive entries in each area explain the emergence
of tacit collusion without need of explicit price agreements (Vives, 1999). Parallel pricing can
emerge in a setting of multimarket competition, in particular when all incumbents are entrants
in other markets. In electricity and gas retail markets, it is a fact that there are very few
entrants in a geographical market which are not incumbents in other geographical markets.
To analyze pricing strategies, we observe asymmetrical time-lags in the pass-through of
wholesale price changes to retail prices or even a misalignment between retail and wholesale
prices alongside a wholesale price cycle. This approach for identifying oligopolistic behavior
in retail competition on a commodity market is inspired by Borenstein et al. (1996 and 1997)
who studied the retail market of two oil product prices (heating oil and gasoline). These
authors showed asymmetry of responses to changes in crude oil price with faster responses to
increases than to decreases for gasoline price, but not for heating fuel. The authors interpreted
18 If the variable cost of the supplier’s marginal equipment electricity is inferior (versus superior) to the spot price, it will benefit respectively the supply (versus generation) arm of the company; the effect on the total mark up is neutral.
15
this as reflecting short-run market power exercised by retail gasoline companies. This short-
run market power is explained by buyers’ imperfect information, comparatively to the heating
fuel market.
On electricity retail markets where competitive pressure is already restricted through product
differentiation and innovation, the lag between retail and wholesale prices movements could
be explained by several factors: the lack of competitive pressures from imperfectly informed
customers, the passiveness of many customers sticked to their historic supplier, and the
incentives of suppliers to adopt parallel pricing behaviors. These incentives are inherent to the
setting of multimarket competition.
To bring to light the parallel retail pricing behaviors subsequent to the vertical integration of
British suppliers, we compare the British retail market with the Norwegian retail market. In
both markets, consumers are well informed and do not support high switching costs by
difference to other retail markets (Henney, 2006, Ofgem, 2008; Olsen et al., 2006; VaasaETT,
2010). We select Norway and Great Britain, because given the price transparency and low
switching cost in both markets, this allows to isolate the dimension “multimarket
competition” as determinant of the competition. This comparison will show different pricing
behaviors alongside a wholesale price cycle.
3. 1. The industrial structures of the British and Norwegian retail markets
We first characterize the industrial structures of the two retail markets.
• The British market structure
Before liberalization, the British retail activity was structured around twelve Regional
Electricity Companies (REC) in England and Wales, two vertical electricity firms in Scotland,
and one national gas distribution incumbent (British Gas-Centrica). The electricity regulation
imposed the vertical separation between generation, transmission and supply, with restriction
on vertical integration between generation and supply for historic suppliers up to 1998 and
with clear unbundling between supply activity and grid. The completion of the liberalization
process on the residential market segment (achieved in 1999) was followed by a strong
market concentration (the twelve historical incumbent suppliers in England and Wales and the
two Scottish suppliers were controlled by only six companies in 2005) while it gave rise to a
multimarket competition on the former historical supply areas. Independent suppliers did not
succeed in developing a sustainable business, as mentioned above. Any entrant in a region is
16
an incumbent in at least one other region, with the notable exception of British Gas-Centrica
which has a singular position by being simultaneously the national gas incumbent in the
former national gas license area, and an electricity entrant in competition with the former
electricity incumbents in all regions. This market structure explains that retail competition
mainly developed by the dual fuel offer, in which consumers are being offered electricity and
gas in a single contract. Selling electricity and gas separately or within a dual fuel offer, their
market shares are stable (figure 3 on electricity market shares) after a first period of fierce
competition consecutive to the opening up of the residential segment in 1998-1999 and
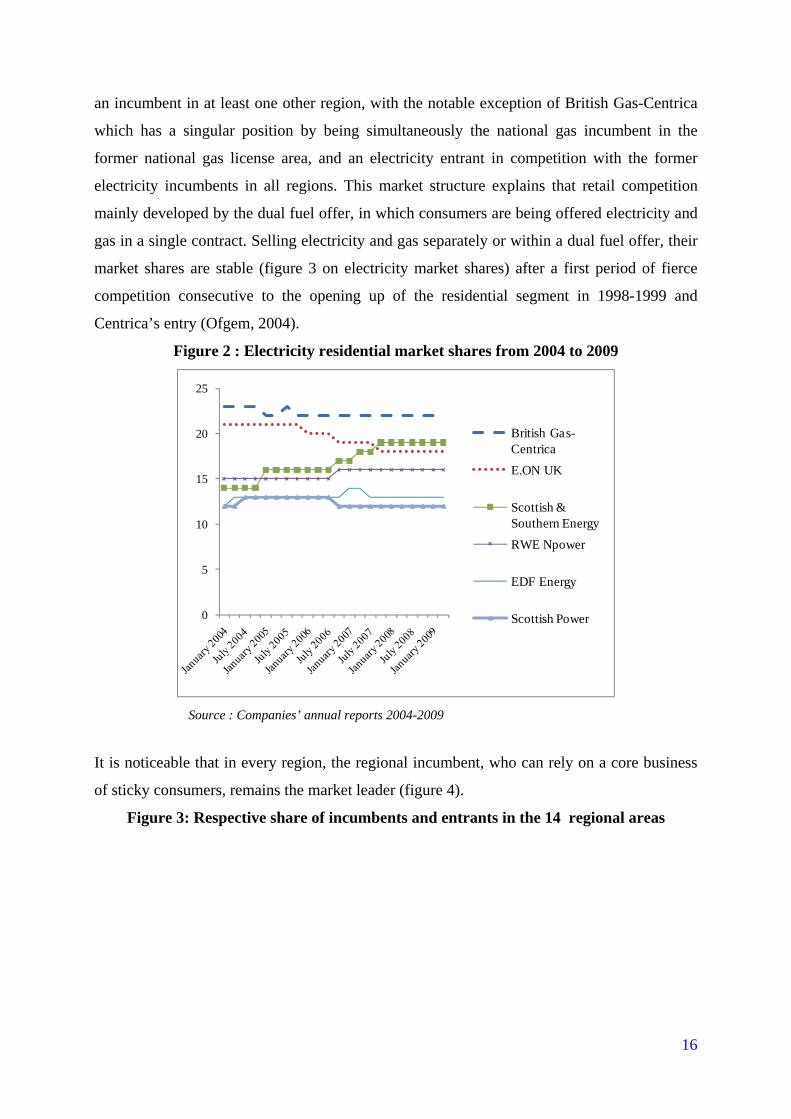
Centrica’s entry (Ofgem, 2004).
Figure 2 : Electricity residential market shares from 2004 to 2009
0
5
10
15
20
25
British Gas-CentricaE.ON UK
Scottish & Southern EnergyRWE Npower
EDF Energy
Scottish Power
Source : Companies’ annual reports 2004-2009
It is noticeable that in every region, the regional incumbent, who can rely on a core business
of sticky consumers, remains the market leader (figure 4).
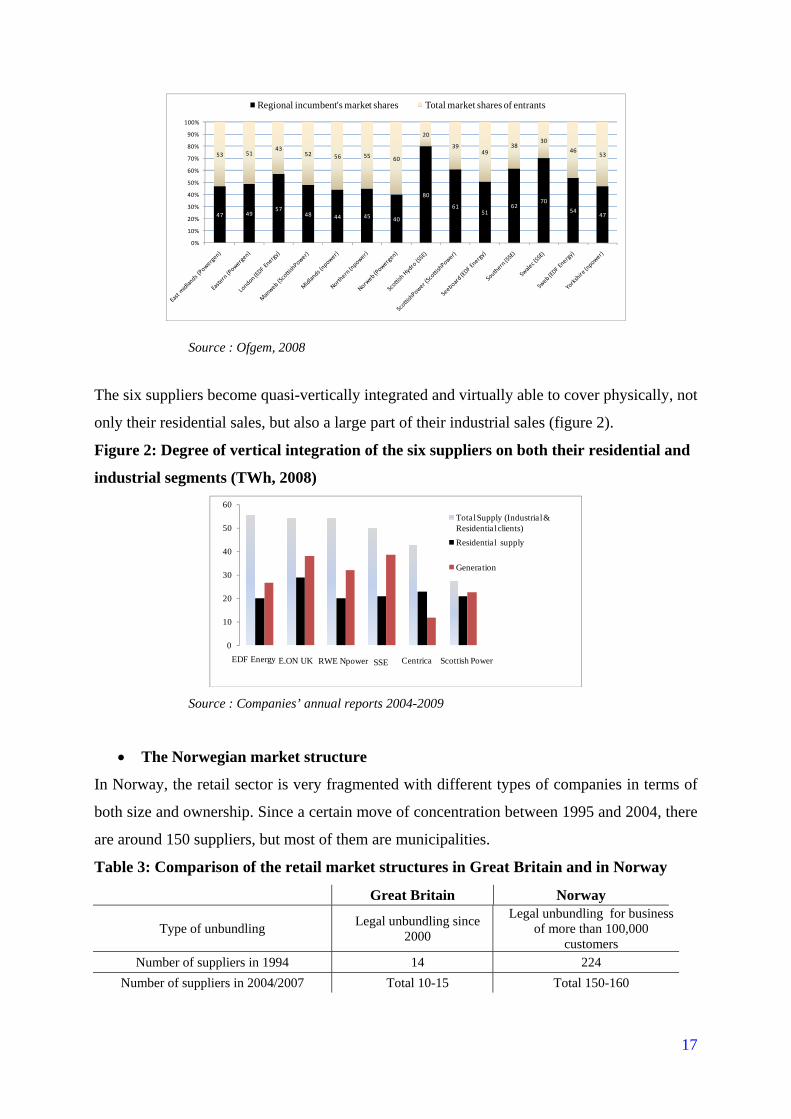
Figure 3: Respective share of incumbents and entrants in the 14 regional areas
17
47 4957
48 44 45 40
80
6151
6270
5447
53 5143
52 56 55 60
20
3949
3830
4653
0%
10%
20%
30%
40%
50%
60%
70%
80%
90%
100%
Regional incumbent's market shares Total market shares of entrants
Source : Ofgem, 2008
The six suppliers become quasi-vertically integrated and virtually able to cover physically, not
only their residential sales, but also a large part of their industrial sales (figure 2).
Figure 2: Degree of vertical integration of the six suppliers on both their residential and
industrial segments (TWh, 2008)
EDF Energy E.ON UK RWE Npower SSE Centrica Scottish Power
0
10
20
30
40
50
60Total Supply (Industrial & Residential clients)Residential supply
Generation
Source : Companies’ annual reports 2004-2009
• The Norwegian market structure
In Norway, the retail sector is very fragmented with different types of companies in terms of
both size and ownership. Since a certain move of concentration between 1995 and 2004, there
are around 150 suppliers, but most of them are municipalities.
Table 3: Comparison of the retail market structures in Great Britain and in Norway Great Britain Norway
Type of unbundling Legal unbundling since 2000
Legal unbundling for business of more than 100,000
customers Number of suppliers in 1994 14 224
Number of suppliers in 2004/2007 Total 10-15 Total 150-160
18
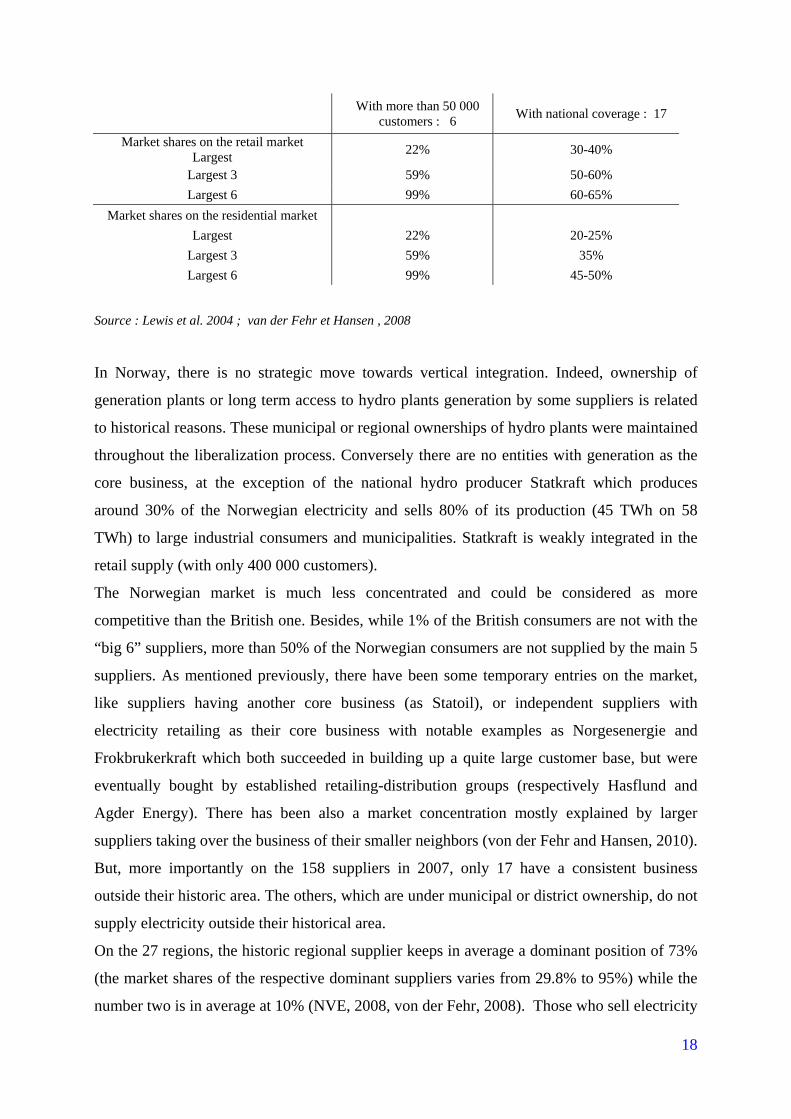
With more than 50 000 customers : 6 With national coverage : 17
Market shares on the retail market Largest 22% 30-40%
Largest 3 59% 50-60% Largest 6 99% 60-65%
Market shares on the residential market Largest 22% 20-25%
Largest 3 59% 35% Largest 6 99% 45-50%
Source : Lewis et al. 2004 ; van der Fehr et Hansen , 2008
In Norway, there is no strategic move towards vertical integration. Indeed, ownership of
generation plants or long term access to hydro plants generation by some suppliers is related
to historical reasons. These municipal or regional ownerships of hydro plants were maintained
throughout the liberalization process. Conversely there are no entities with generation as the
core business, at the exception of the national hydro producer Statkraft which produces
around 30% of the Norwegian electricity and sells 80% of its production (45 TWh on 58
TWh) to large industrial consumers and municipalities. Statkraft is weakly integrated in the
retail supply (with only 400 000 customers).
The Norwegian market is much less concentrated and could be considered as more
competitive than the British one. Besides, while 1% of the British consumers are not with the
“big 6” suppliers, more than 50% of the Norwegian consumers are not supplied by the main 5
suppliers. As mentioned previously, there have been some temporary entries on the market,
like suppliers having another core business (as Statoil), or independent suppliers with
electricity retailing as their core business with notable examples as Norgesenergie and
Frokbrukerkraft which both succeeded in building up a quite large customer base, but were
eventually bought by established retailing-distribution groups (respectively Hasflund and
Agder Energy). There has been also a market concentration mostly explained by larger
suppliers taking over the business of their smaller neighbors (von der Fehr and Hansen, 2010).
But, more importantly on the 158 suppliers in 2007, only 17 have a consistent business
outside their historic area. The others, which are under municipal or district ownership, do not
supply electricity outside their historical area.
On the 27 regions, the historic regional supplier keeps in average a dominant position of 73%
(the market shares of the respective dominant suppliers varies from 29.8% to 95%) while the
number two is in average at 10% (NVE, 2008, von der Fehr, 2008). Those who sell electricity
19
outside their area have not an extended coverage: the Norwegian authority NVE shows that,
11 suppliers are in the top five in 2 to 5 areas, and only 4 suppliers are in 11 or more areas.
Eleven suppliers represent the main competition to the incumbent suppliers and 4 suppliers
seem to be the truly national and effective suppliers. This fragmented structure with no
homogenous positions of respective incumbents in other areas than theirs, do not contribute at
all to the development of a multimarket competition.
Another element influences the Norwegian competitive game. Suppliers who do not compete
in other areas are not endowed with a market culture and do not look for profit maximization.
They do not behave as private players with strategic behaviors. Indeed, local municipalities
own concessions on hydraulic facilities that provide them with cheap power and make easy
for them to strictly follow the Nordpool price to define their retail prices by applying a
constant retail mark up (von der Fehr and Hansen, 2010). Statkraft, the main generator which
is long in generation, sells part of its electricity at cheap prices to municipalities. They use
their own hydro-electricity and the one bought from Stakraft to keep their retail prices at low
levels for their local customers and their non core customers in other areas. Those who do not
look for profit maximization represent a sort of competitive benchmark for the regulator who
relies on them as a “shaming mechanism” against the more highly priced suppliers (Lewis et
al, 2004).
3.2. Wholesale costs and retail mark up: Great Britain versus Norway
Comparing the evolutions of wholesale and retail prices in Great Britain and Norway shows
contrasting results. Alongside the wholesale price cycle, there is not a strong alignment
between spot and retail prices on the British market, as shown by the electricity retail mark up
curve’s evolution (figure 5 as shown by the linear trend curve), while there is a strong
alignment in Norway between wholesale and retail prices leading to a constant mark up.
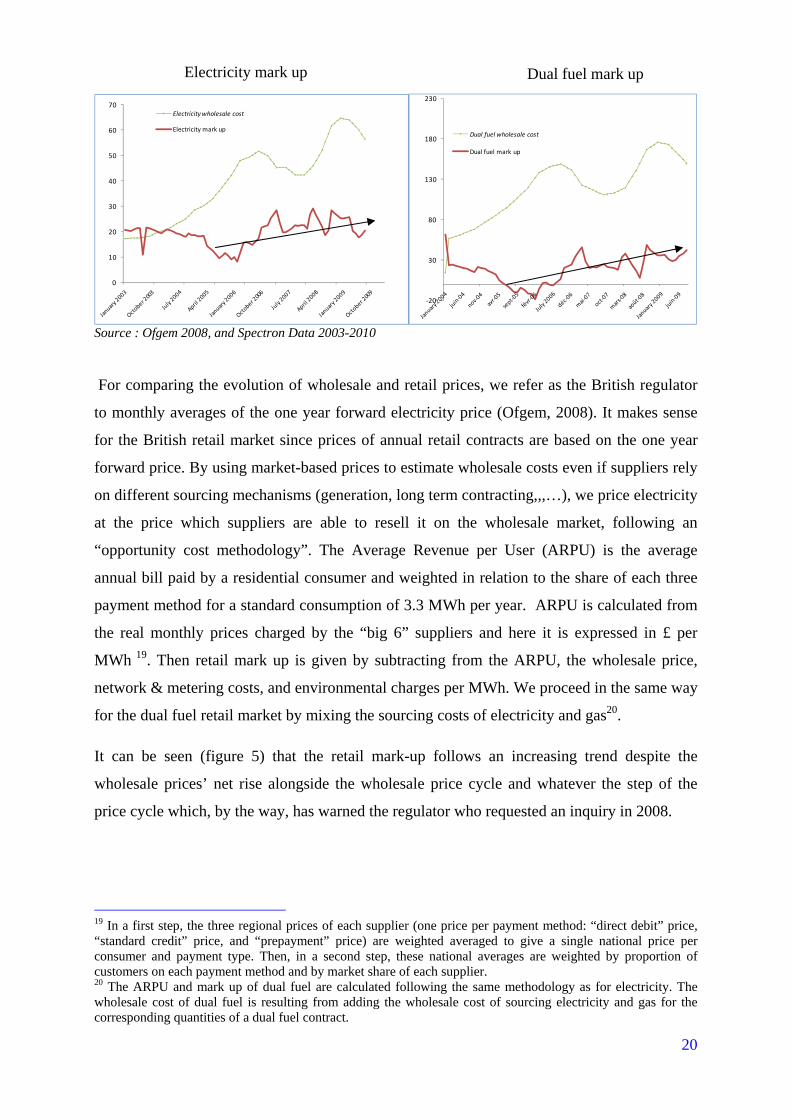
Figure 5 : Trends in year-ahead wholesale price and retail mark-up on electricity and dual fuel retail markets (£ per MWh)
20
0
10
20
30
40
50
60
70Electricity wholesale cost
Electricity mark up
‐20
30
80
130
180
230
Dual fuel wholesale cost
Dual fuel mark up
Source : Ofgem 2008, and Spectron Data 2003-2010
For comparing the evolution of wholesale and retail prices, we refer as the British regulator
to monthly averages of the one year forward electricity price (Ofgem, 2008). It makes sense
for the British retail market since prices of annual retail contracts are based on the one year
forward price. By using market-based prices to estimate wholesale costs even if suppliers rely
on different sourcing mechanisms (generation, long term contracting,,,…), we price electricity
at the price which suppliers are able to resell it on the wholesale market, following an
“opportunity cost methodology”. The Average Revenue per User (ARPU) is the average
annual bill paid by a residential consumer and weighted in relation to the share of each three
payment method for a standard consumption of 3.3 MWh per year. ARPU is calculated from
the real monthly prices charged by the “big 6” suppliers and here it is expressed in £ per
MWh 19. Then retail mark up is given by subtracting from the ARPU, the wholesale price,
network & metering costs, and environmental charges per MWh. We proceed in the same way
for the dual fuel retail market by mixing the sourcing costs of electricity and gas20.
It can be seen (figure 5) that the retail mark-up follows an increasing trend despite the
wholesale prices’ net rise alongside the wholesale price cycle and whatever the step of the
price cycle which, by the way, has warned the regulator who requested an inquiry in 2008.
19 In a first step, the three regional prices of each supplier (one price per payment method: “direct debit” price, “standard credit” price, and “prepayment” price) are weighted averaged to give a single national price per consumer and payment type. Then, in a second step, these national averages are weighted by proportion of customers on each payment method and by market share of each supplier. 20 The ARPU and mark up of dual fuel are calculated following the same methodology as for electricity. The wholesale cost of dual fuel is resulting from adding the wholesale cost of sourcing electricity and gas for the corresponding quantities of a dual fuel contract.
Electricity mark up Dual fuel mark up
21
Comparing the electricity retail mark up with the dual fuel retail mark up highlights the more
competitive dynamic of the dual fuel segment where the mark up is more impacted by
wholesale prices movements (with even a negative mark up between July 2005 and July
2006). From the beginning of liberalization of residential markets to 2005, the former
electricity incumbents and British Gas-Centrica were using the dual fuel offer to price
discriminate between their passive core customers and their new dual fuel customers to corner
market shares in other geographical markets. (Nalebuff, 2004). Then, after stabilization of
market shares, profits have been positive with no impact of price moves, but at a lesser extent
than for the sole supply of electricity. For dual fuel submarket, profits remain lower than for
electricity. This is explained notably by the fact that dual fuel customers are less sticky than
electricity core customers since they have already switched at least once and are presumably
more engaged in the competitive game.
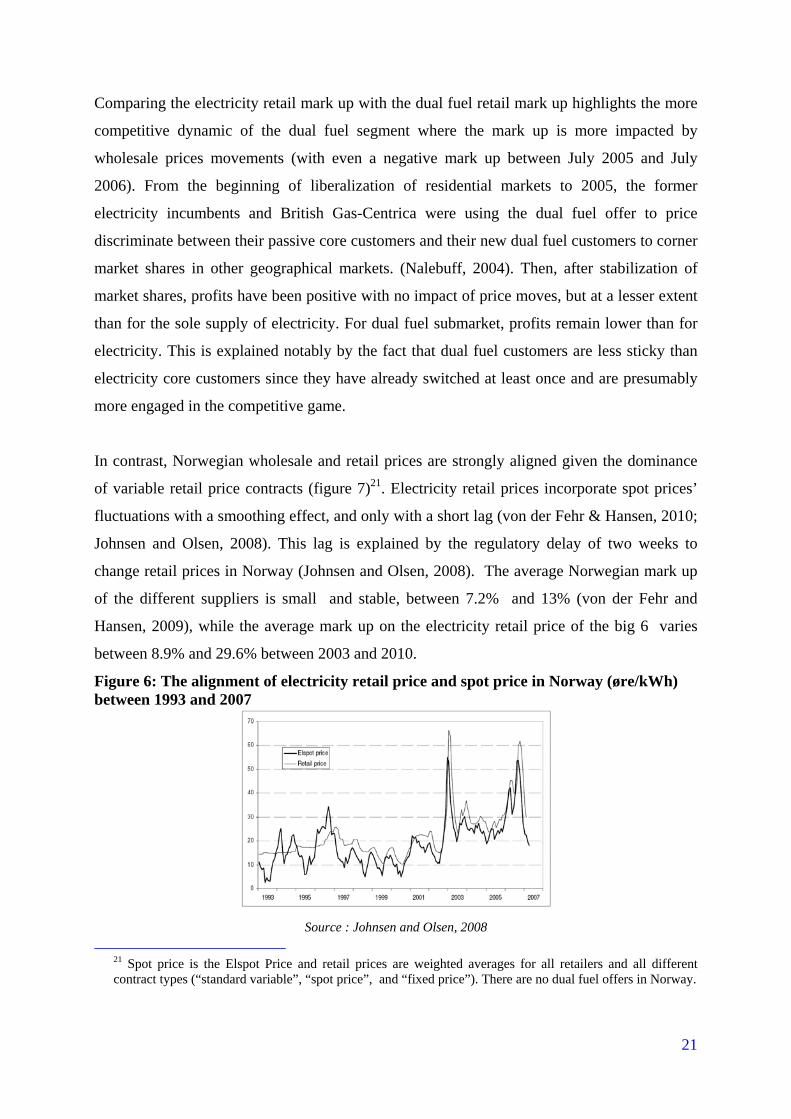
In contrast, Norwegian wholesale and retail prices are strongly aligned given the dominance
of variable retail price contracts (figure 7)21. Electricity retail prices incorporate spot prices’
fluctuations with a smoothing effect, and only with a short lag (von der Fehr & Hansen, 2010;
Johnsen and Olsen, 2008). This lag is explained by the regulatory delay of two weeks to
change retail prices in Norway (Johnsen and Olsen, 2008). The average Norwegian mark up
of the different suppliers is small and stable, between 7.2% and 13% (von der Fehr and
Hansen, 2009), while the average mark up on the electricity retail price of the big 6 varies
between 8.9% and 29.6% between 2003 and 2010.
Figure 6: The alignment of electricity retail price and spot price in Norway (øre/kWh) between 1993 and 2007
Source : Johnsen and Olsen, 2008
21 Spot price is the Elspot Price and retail prices are weighted averages for all retailers and all different contract types (“standard variable”, “spot price”, and “fixed price”). There are no dual fuel offers in Norway.
22
The strong alignment of the retail and wholesale and retail prices (energy part of the retail
price) with a constant and quite small mark up even during periods of large price variations
shows that Norwegian suppliers use the wholesale price as an opportunity cost to their
production. They do not seize the opportunity of having higher mark ups during periods of
prices fall or very low spot prices. A comparison to the British market suggests that it does
not result from differences in customers’ informational and switching costs but is related to
two features. The first one is the fragmented structure of the Norwegian retail market with a
specificity: a number of municipalities which behave virtuously and serve as a benchmark for
the regulator to hinder oligopolistic pricing of active competitors. The second one is the
absence of multimarket competition.
Market institutions allowing customers to be informed and to easily switch are as much
developed in Great Britain and Norway (table 4). The misalignment of retail prices on
wholesale prices comes from the market structure which is not only more concentrated in the
British case but also which corresponds to a multimarket competition.
Table 4. Comparative switching rates in Great Britain and Norway for 2009
Great Britain Norway
Annual Switching 19% 8.1%
Cumulative switching 48% 44%
Source : Ofgem, 2010, “Customer Engagement with the Energy Market – Tracking Survey”, March 2010 (Ipsos Mori) & VaasaETT 2010, World Energy Retail Market Rankings Report 2010
3.3. Individual pricing strategies along the wholesale price cycle in the British and
Norwegian market
The British retail market. Its structure with six vertically integrated suppliers interacting
repeatedly on 15 markets -the 14 historical regional areas and the national gas market area –
without threat of entries leads to a lack of competitive pressure which is reflected in the
parallelism of pricing behaviors (figure 8). In this setting of multimarket competition,
suppliers’ price behaviors show that they all follow one single strategy which consists in
securing short term profits through higher prices than the wholesale market price instead of
offering low prices to corner market shares on a longer run. This process which is
continuously at work alongside the wholesale price cycle is amplified when wholesale prices
decrease.
23
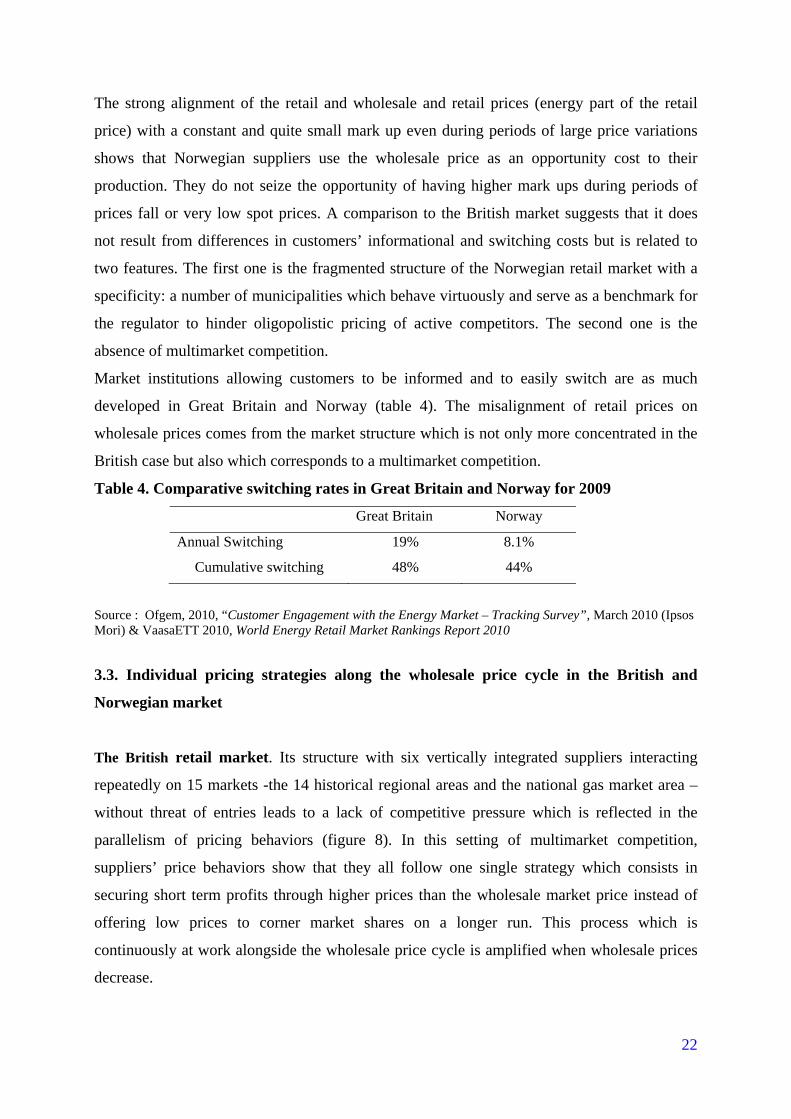
Figure 7: Trends in suppliers’ revenues per MWh and wholesale prices between 2004 and 2008
Note: In the calculations, the retail prices are the averages national prices of each supplier for a standard annual consumption level of 3.3 MWh. The six average prices are calculated from the three prices (one for each payment method) of each supplier in each region (14 regions). Then we divide these resulting six national mean prices by 3.3 in order to compare their evolution to the curve of the smoothed (exponential smoothing) spot price per MWh.
Source: ConsumerFocus data, 2008, Heren and Ofgem data (2002-2008)
After a first period of fierce competition in the respective historical areas between 1998 and
2003, no supplier had interest in misaligning its pricing strategy from implicitly coordinated
pricing between each another. Figure 8 highlights the parallelism in rapid increases of the
retail standard contractual prices offered by the “big 6” suppliers when the wholesale price
increases, while no systematic decreases are observed when the wholesale prices fell. We
refer in this sub-section to the spot price instead to the 1-year forward price as done above
since the suppliers themselves claim that their retail prices increases are consecutives to spot
prices’ raises while they even do not follow the spot price downwards move after the change
of the wholesale price (Ofgem, 2008).
Analysis of individual annual contract prices shows clearly that suppliers increased their
prices between January 2004 and December 2008 on different but very close periods in
relation to spot price increases As shown by figure 8, wholesale price fell strongly between
January 2006 and June 2007 and again from December 2007 with no significant effects on
retail prices in 2007 and even 2008. Consequently, whatever the level of wholesale prices, not
only mark-ups are maintained in periods of fall of wholesale prices, but in fact increased
leading to an asymmetric pattern.
24
Suppliers justified these price increases by the raise of spot prices due conjointly to gas price
increases and the introduction of a carbon price (Ofgem, 2008). However, when spot prices
fell strongly from 2006 (figure 8), the fall was very partially transferred to retail prices
arguing that their weighted average cost of sourcing was above the spot price. On average
because of the retail prices’ parallelism, net increase had no impact on market shares between
2004 and 2009 (figure 4), showing that a high level of switching (19 % in 2009 for instance)
is not evidence of a lively competition. So with the help of this set of multimarket
competition, suppliers prefer to adopt parallel pricing behaviors in order to benefit from a
collective market power which enables profit maximization to the detriment of consumers’
surplus. Suppliers rely on their basis of passive customers and market leadership position in
their former historic regions to maintain high profits whatever the level of spot prices.
The Norwegian situation. In Norway, there are no parallel pricing behaviors despite the
numerous points of contacts within a market structure which could be perceived a priori as a
multimarket one. In fact as mentioned, there are only 4 suppliers coming from the larger
municipalities or district utilities which have a national coverage and around 10 which are a
bit diversified in no more than 4 areas. And this fragmented structure with no homogenous
diversification of the respective incumbents in other areas than theirs, do not lead to a
multimarket competition. With the geographical retail prices published by the Norwegian
Competition Authority since mid-2003, von der Fehr and Hansen (2009) show that the
average mark up of retail prices over wholesale prices is small.
Moreover, most suppliers kept their mark up constant, during the price cycles reflecting the
scarcity or the abundance of hydrologic conditions, although there are very few exceptions of
both upwards and downwards adjustments. These authors show that there is no systematic
difference between the five larger suppliers’ prices. Their mark ups have also tended to move
downwards to a bit lower level, which is explained by the threat of new entrants coming in
with lower mark ups than those of incumbents (von der Fehr and Hansen, 2009). The
existence of a competitive pricing benchmark with the municipalities, helps also the
Competition Authority to exert pressures to limit excessive pricing from larger suppliers in
their historic area where they tend to display higher prices on their passive customers. To sum
up on the Norwegian market, the retail prices follow quite strictly the wholesale prices with a
markup that remains low. This contrasts with what is observed in an oligopolistic multimarket
configuration with parallel pricing behaviors.
25
To sum up, while the multi-market competition setting naturally emanate from historical
structured of electricity industry at the distribution stage by the liberalization process in
numerous countries, this comparison shows that, even when the conditions of information
transparency and absence of switching costs are realized, multi-market competition setting
helps adoption of parallel behavior in pricing. Norwegian retail market structure which is not
in this setting allows to a Bertrand like price competition to develop.
4. Conclusion
As intermediaries in the very specific trade of a non-storable commodity and with a short term
price-inelastic demand which impedes any rationing of demand, electricity suppliers are
strongly incentivized to rely on physical hedging to manage their quantity and price risks
given the radical uncertainty of hourly electricity demand. This, on the other hand implies a
vicious cycle. The more suppliers are vertically integrated, the less likely is the development
of a liquid contract market, thus forcing asset-light suppliers to leave the market, be acquired
by generators, or to move towards vertical integration. So it explains the move towards
vertical integration in the countries which had been liberalized in the most radical way.
But vertical integration does not allow the development of Bertrand like competition.
Retailers do not behave as asset-light suppliers of a homogeneous product in a competitive
market. As they mutually compete within their respective historic areas while entrants cannot
survive, they can adopt parallel pricing behaviors whatever their differences in levels of
physical hedging and average wholesale costs. This setting enables them to transform spot
price rises and falls into profits and to exercise a collective market power at the expense of
consumers. This contrasts with the initial objectives of retail competition and questions about
its potential benefits for residential customers.
This suggests one recommendation and one general statement. First, for improving retail
competition, traditional remedies to limit the incumbent brand’s advantage, to improve
consumer’ information and lower switching costs are obviously not sufficient. It will be
necessary to break vertical integration in the retail in order to be close to the conditions of
Bertrand-like competition. In this perspective, the British regulator proposed in March 2011
that the big 6 make available between 10% and 20% of their power generation into the market
through a regular Mandatory Auction (Ofgem 2011). Even if it is a courageous measure
going in the relevant direction, our analysis suggests that for reaching conditions in order that
a Bertrand-like price competition develops which helps to compress retailers’margin at a
26
reasonable level, there is a necessity of an almost complete de-verticalization between retail
and generation. In any case, such a measure would make complex suppliers’ hedging.
However, a complementary solution for the de-verticalization of suppliers could lie in the
development of a liquid market for financial options with different maturities, as suggested by
our exercise on portfolios’ risk profiles (section 2.2) and it could not be possible without an
initiative from the regulator or the government to organize such a market for selling relevant
options. After all and so the Brazilian market is partly designed in this manner on a basis of
options contracts between generators and retailers (Bajay, 2006).
Second, we could doubt that there is a remedy to the lack of competitive pressure in any retail
market which is in a setting of multimarket competition. This setting appears to be inherent to
electricity and gas retail markets and rooted in the history of electricity and gas distribution,
given that competition in this field could not be activated by intensive innovations which
would breakdown the incumbents’ advantage as it does in the telecom industry. The poor
performances of retail markets invite to join the doubts expressed by skeptical economists as
Richard Green (1998) and Paul Joskow (2000) who were favourable to electricity markets
liberalization, when residential retail markets were opened to competition in Great Britain and
North America.