Embed Size (px)
Citation preview
FARMACIA, 2013, Vol. 61, 6
1054
ELECTROCHEMICAL AND SPECTRAL STUDY OF CYCLODEXTRINS INTERACTIONS WITH SOME PHARMACEUTICAL SUBSTANCES LUMINIŢA FRITEA, MIHAELA TERTIŞ, TAMARA LIANA TOPALĂ, ROBERT SĂNDULESCU*
«Iuliu Haţieganu»University of Medicine and Pharmacy, Faculty of Pharmacy, Analytical and Inorganic Chemistry Departments, 4 Pasteur St 400349 Cluj-Napoca, Romania, *corresponding author: [email protected]
Abstract
The influence of cyclodextrins on the electrochemical response of some pharmaceutical molecules has been investigated on carbon paste electrode (CPE) using cyclic voltammetry (CV) and square wave voltammetry (SWV). The oxidation peak of the analytes is shifted to internal positive potential values and the current intensity is decreased, modifications which can be explained by the formation of inclusion complexes. FTIR studies were used to confirm the complexation. Carbon paste electrodes modified with β-cyclodextrin (CPE/ β-CD) showed an enhanced electrochemical response of ascorbic and uric acid in comparison with the unmodified carbon paste electrode.
Rezumat
Influenţa ciclodextrinelor asupra răspunsului electrochimic al unor substanţe farmaceutice a fost studiatǎ cu ajutorul voltametriei ciclice şi voltametriei cu undǎ pǎtratǎ, folosind electrozi pastǎ de carbon. Deplasarea potenţialelor de oxidare ale analiţilor spre valori puternic pozitive şi scăderea intensităţii curentului de pic, pot fi atribuite formǎrii complecşilor de incluziune, confirmatǎ şi cu ajutorul spectrelor FTIR. Rǎspunsul electrochimic al acidului ascorbic şi acidului uric pe electrozii pastǎ de carbon modificaţi cu β-ciclodextrinǎ, este superior celui obţinut pe electrozi pastǎ de carbon nemodificaţi.
Keywords: β-cyclodextrin, carbon paste electrode, voltammetry, uric acid,
ascorbic acid
Introduction
Cyclodextrins (CDs) are macrocyclic oligosugars most commonly composed of 6, 7 or 8 glucosidic units linked by α 1-4 bonds. Native cyclodextrins (α-, β-, γ-cyclodextrin) are obtained by enzymatic degradation of starch. In order to enhance physico-chemical properties of parent CDs, there were synthesized numerous modified CDs. The shape of CD looks like a truncated cone with a narrow side formed by primary hydroxyl groups and a wider side by secondary hydroxyl groups. They have a relatively hydrophobic cavity, while the outer surface is hydrophilic. The most important characteristic of CDs is the formation of inclusion complexes
FARMACIA, 2013, Vol. 61, 6
1055
with various guest molecules implying non-covalent forces such as Van der Waals interactions, hydrophobic interactions and hydrogen bonding. The formation of host-guest complexes with CD is the subject of extensive electrochemical, chromatographic, calorimetric and spectral studies. CDs are widely applied in pharmaceutical formulations to enhance the solubility, stability and bioavailability of drug molecules [7, 17].
The formation of inclusion complexes between CDs and various molecules is the subject of many articles [8, 13, 14, 18, 21].
Several methods were used in order to characterise the inclusion complexes between CDs and different molecules. Among these it can be mentioned: NMR [16, 24, 2], UV-Vis spectrophotometry [24], IR spectroscopy [24, 2], fast atom bombardment mass spectrometry [24], X ray-crystallography [4], differential scanning calorimetry [11], thermogravimetry/differential thermal analysis [23] and electrochemical methods [10, 18, 2, 20, 24]. In the case of the inclusion complex formed between acetaminophen and β-CD, UV-visible absorption and fluorescence spectroscopy were used to characterize the complexation [8], while the encapsulation of purine derivates by CD in solution was studied by fluorescence spectroscopy which enables the calculation of the association constants of the biding process [1].
The characterization of the CDs behavior in solution was investigated by several electrochemical methods such as potentiometry, cyclic voltammetry, differential pulse voltammetry, square wave voltammetry [7, 17]. The influence of the addition of CD is observed by the decrease in the peak current and also a shift to more positive potential values due to the inclusion complexes with smaller diffusion coefficient [18, 20].
CDs can be used to modify carbon paste electrodes in order to enhance the sensitivity and selectivity of analyte determination in pharmaceuticals, biological samples and soft drinks. The preconcentration of the substance on the electrode surface is based on the formation of inclusion complexes between the CD host and the analyte guest [3, 5, 6, 9, 12, 19].
The influence of β-cyclodextrin on the electrochemical response of ascorbic acid ((5R)-[(1S)-1,2-dihydroxyethyl]-3,4-dihydroxyfuran-2(5H)-one), uric acid (7,9-Dihydro-1H-purine-2,6,8(3H)-trione), caffeine (1,3,7-trimethyl-1H-purine-2,6(3H,7H)-dione-3,7-dihydro-1,3,7-trimethyl-1H-purine-2,6-dione), caffeine citrate (1,3,7-trimethylpurine-2,6-dione; 2-hydroxypropane-1,2,3-tricarboxylic acid), theophylline (1,3-dimethyl-7H-purine-2,6-dione), aminophylline (1,3-dimethyl-7H-purine-2,6-dione;
FARMACIA, 2013, Vol. 61, 6
1056
ethane-1,2-diamine) and acetaminophen (N-(4-hydroxyphenyl)acetamide) using carbon paste electrodes was studied. The inclusion complexes were characterized by FTIR spectra. On the other hand the advantages of carbon paste electrodes modified with β-cyclodextrin in the determination of ascorbic acid and uric acid are presented.
Materials and Methods
β-CD was purchased from Merck, acetaminophen from Sigma, caffeine, caffeine citrate, theophylline, uric acid, ascorbic acid, aminophylline were purchased from Fluka. The 0.1M phosphate buffer solution (PBS) at pH 7.4 and pH 7.2 were prepared using sodium dihydrogen phosphate and sodium monohydrogen phosphate from Fluka. The 0.1M acetate buffer at pH 4 was prepared using acetic acid and sodium acetate from Fluka. All the reagents were used without further purification and were of analytical grade. All aqueous solutions were prepared with ultrapure water. All the measurements were performed at room temperature (22-25oC).
The electrochemical experiments were carried out with an Autolab PGSTAT 12 potentiostat equipped with GPES 4.9 software, using a traditional three electrodes system. The carbon paste electrode was used as the working electrode, with an Ag/AgCl, KCl 3M as reference electrode and a platinum wire as the counter electrode.
The FTIR spectra were registered on a Jasco FT/IR-4100 spectrophotometer equipped with Jasco Spectra Manager Version 2 software on wavenumber 550-4000 cm-1. The solid samples were obtained after evaporation of the same solvent used in electrochemical analysis.
Preparation of the carbon paste working electrodes The carbon paste (CP) was prepared by hand-mixing graphite
powder with melted solid paraffin in a ratio of 3:1(w/w) to ensure easy manipulation. The electrode was constructed by packing the carbon paste into the tip of the Teflon cavity (d = 4 mm; h = 5 mm), provided with a copper wire which assures the electric contact. The surface was then smoothed with a smooth white paper while a light manual pressure was applied to the electrode tip until a shiny surface was obtained.
The 5% β-CD modified carbon paste was prepared in two different ways. Solid β-CD powder was mixed with graphite powder and melted solid paraffin (3:1) until the paste was homogenous. This composition was packed into the tip of the Teflon tube. The electrode surface was brushed up
FARMACIA, 2013, Vol. 61, 6
1057
whenever necessary by removing a small layer of carbon paste and replacing it with a new one.
An aqueous solution of β-CD 10-2 M (2.2mL of β-CD solution was added to 475mg of carbon paste in order to obtain 5% β-CD modified carbon paste) was added to melted solid paraffin and graphite powder in a ratio of 1:3. The mixture was homogenized in a mortar and the aqueous phase was allowed to evaporate at about 70°C. This composition was packed into the tip of the Teflon tube. The electrode surface was brushed up whenever necessary by removing a small layer of carbon paste and replacing with a new one.
The optimal parameters for square wave voltammetry (SWV) were: frequency 15Hz, amplitude 25mV and step potential 2mV, and for cyclic voltammetry (CV) a scan rate of 100mV·s-1 was used. The mixtures were obtained by vortexing the solutions 5 minutes at 400 rpm in order to allow the formation of inclusion complexes. The uric acid solution was prepared by ultrasonication for 10 minutes and heating up to 60°C to solve the powder. All the other solutions were prepared by ultrasonication for 3 minutes.
Results and Discussion
The electrochemical behavior of uric acid, ascorbic acid, aminophylline, caffeine, caffeine citrate, theophylline and acetaminophen in the presence of β-cyclodextrin
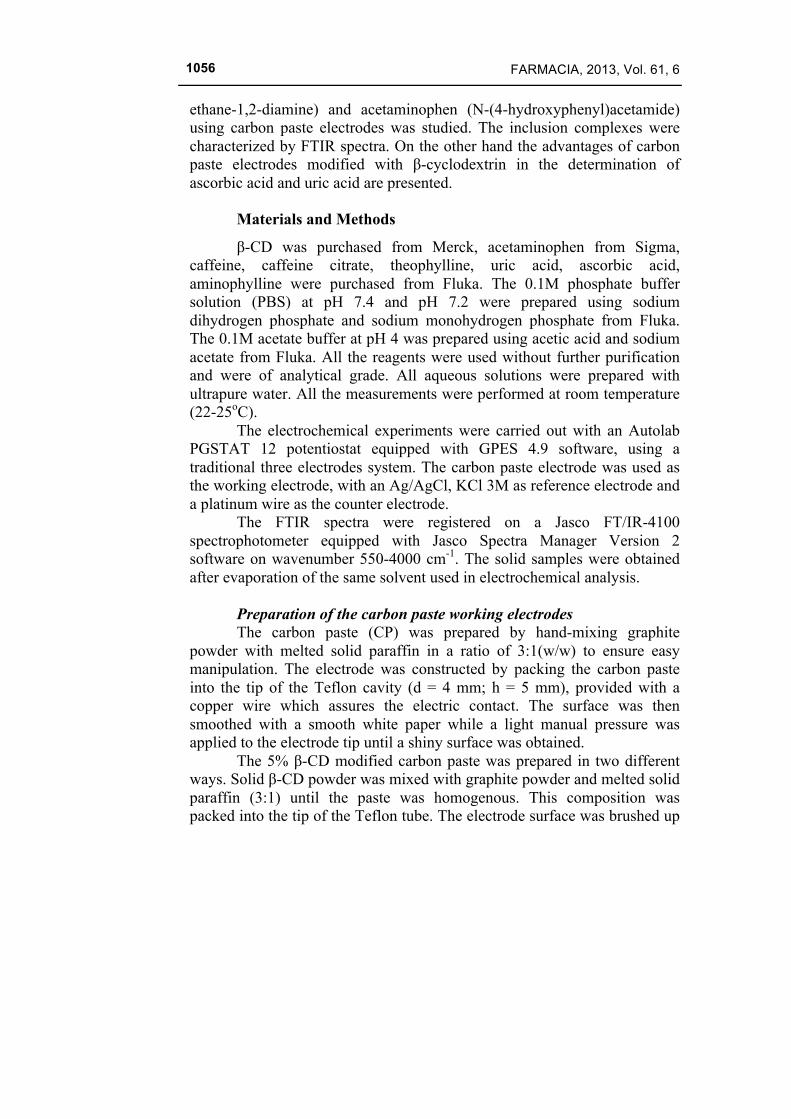
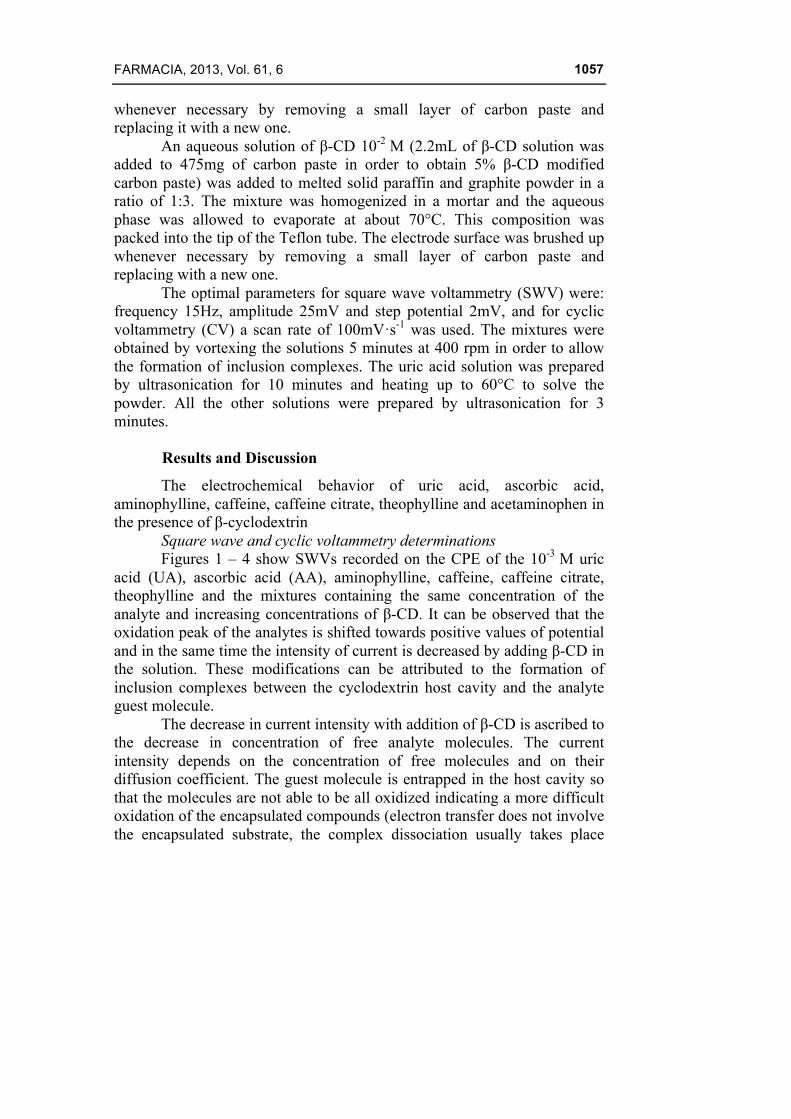
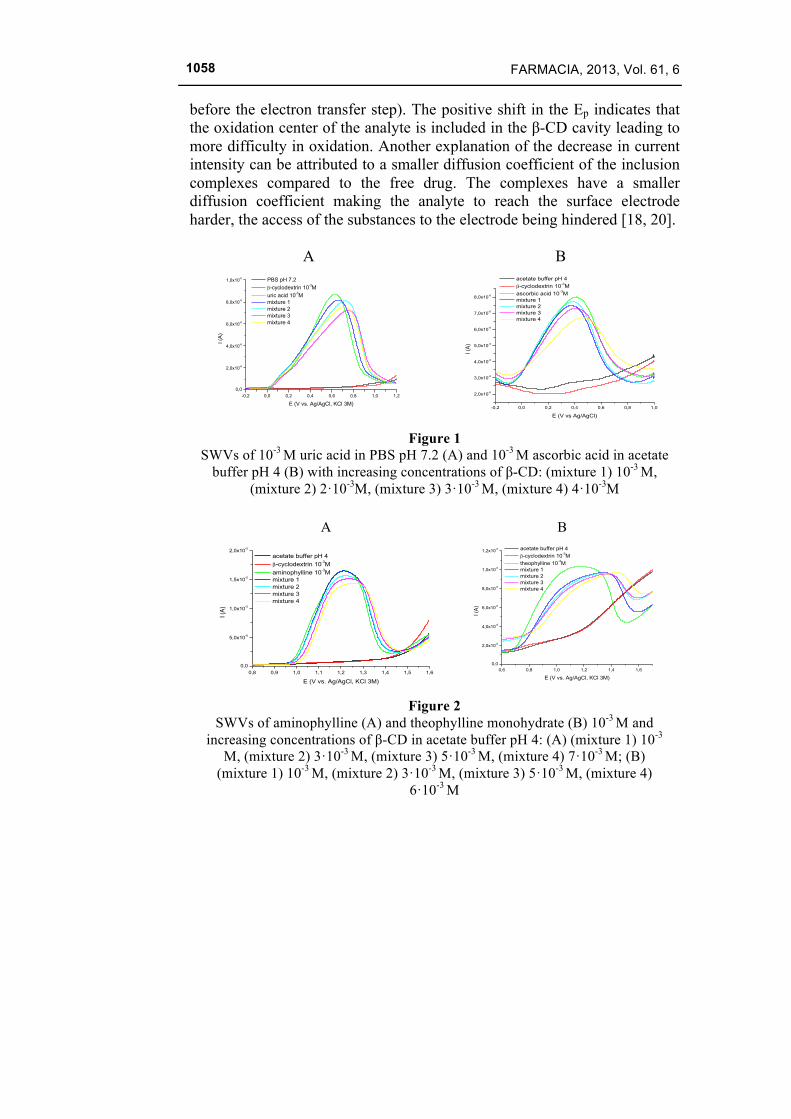
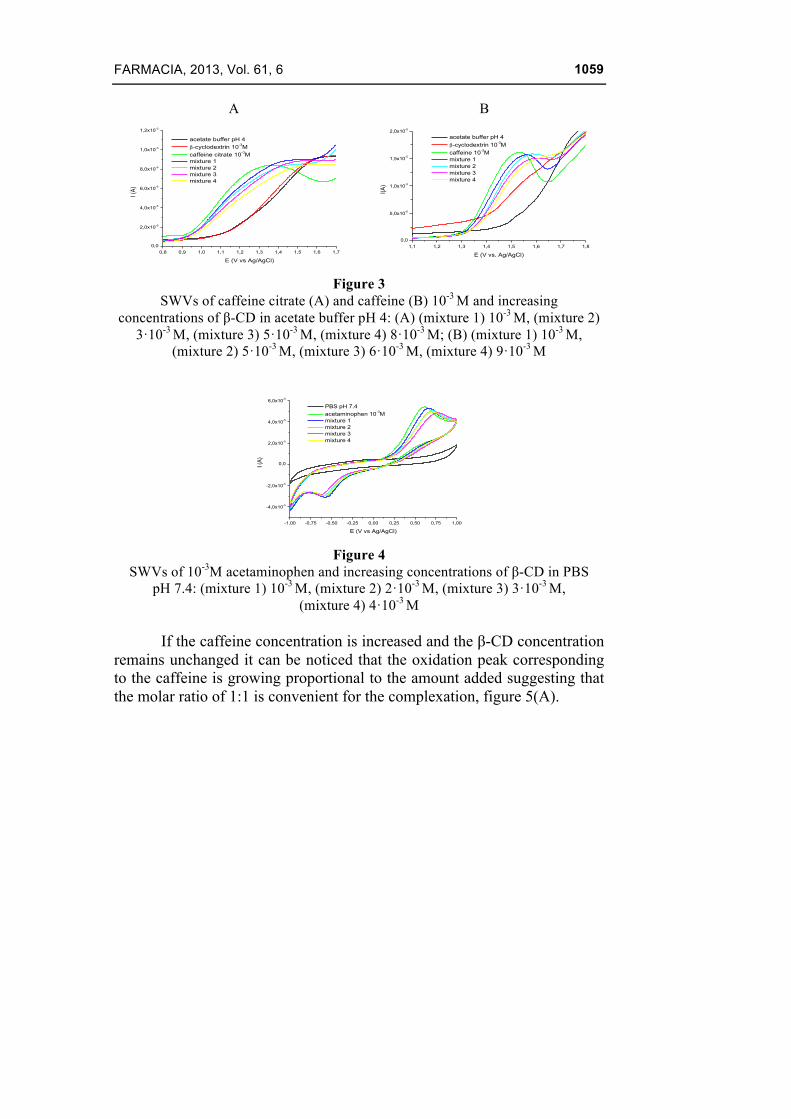
Square wave and cyclic voltammetry determinations Figures 1 – 4 show SWVs recorded on the CPE of the 10-3 M uric
acid (UA), ascorbic acid (AA), aminophylline, caffeine, caffeine citrate, theophylline and the mixtures containing the same concentration of the analyte and increasing concentrations of β-CD. It can be observed that the oxidation peak of the analytes is shifted towards positive values of potential and in the same time the intensity of current is decreased by adding β-CD in the solution. These modifications can be attributed to the formation of inclusion complexes between the cyclodextrin host cavity and the analyte guest molecule.
The decrease in current intensity with addition of β-CD is ascribed to the decrease in concentration of free analyte molecules. The current intensity depends on the concentration of free molecules and on their diffusion coefficient. The guest molecule is entrapped in the host cavity so that the molecules are not able to be all oxidized indicating a more difficult oxidation of the encapsulated compounds (electron transfer does not involve the encapsulated substrate, the complex dissociation usually takes place
FARMACIA, 2013, Vol. 61, 6
1058
before the electron transfer step). The positive shift in the Ep indicates that the oxidation center of the analyte is included in the β-CD cavity leading to more difficulty in oxidation. Another explanation of the decrease in current intensity can be attributed to a smaller diffusion coefficient of the inclusion complexes compared to the free drug. The complexes have a smaller diffusion coefficient making the analyte to reach the surface electrode harder, the access of the substances to the electrode being hindered [18, 20].
A
-0,2 0,0 0,2 0,4 0,6 0,8 1,0 1,20,0
2,0x10⁻⁶
4,0x10⁻⁶
6,0x10⁻⁶
8,0x10⁻⁶
1,0x10⁻⁵
I (A
)
E (V vs. Ag/AgCl, KCl 3M)
PBS pH 7.2 β-cyclodextrin 10-3M uric acid 10-3M mixture 1 mixture 2 mixture 3 mixture 4
B
-0,2 0,0 0,2 0,4 0,6 0,8 1,0
2,0x10⁻⁶
3,0x10⁻⁶
4,0x10⁻⁶
5,0x10⁻⁶
6,0x10⁻⁶
7,0x10⁻⁶
8,0x10⁻⁶
I (A)
E (V vs Ag/AgCl)
acetate buffer pH 4 β-cyclodextrin 10-3M ascorbic acid 10-3M mixture 1 mixture 2 mixture 3 mixture 4
Figure 1
SWVs of 10-3 M uric acid in PBS pH 7.2 (A) and 10-3 M ascorbic acid in acetate buffer pH 4 (B) with increasing concentrations of β-CD: (mixture 1) 10-3 M,
(mixture 2) 2·10-3M, (mixture 3) 3·10-3 M, (mixture 4) 4·10-3M
A
0,8 0,9 1,0 1,1 1,2 1,3 1,4 1,5 1,60,0
5,0x10⁻⁶
1,0x10⁻⁵
1,5x10⁻⁵
2,0x10⁻⁵
I (A)
E (V vs. Ag/AgCl, KCl 3M)
acetate buffer pH 4 β-cyclodextrin 10-3M aminophylline 10-3M mixture 1 mixture 2 mixture 3 mixture 4
B
0,6 0,8 1,0 1,2 1,4 1,60,0
2,0x10⁻⁶
4,0x10⁻⁶
6,0x10⁻⁶
8,0x10⁻⁶
1,0x10⁻⁵
1,2x10⁻⁵
I (A)
E (V vs. Ag/AgCl, KCl 3M)
acetate buffer pH 4 β-cyclodextrin 10-3M theophylline 10-3M mixture 1 mixture 2 mixture 3 mixture 4
Figure 2
SWVs of aminophylline (A) and theophylline monohydrate (B) 10-3 M and increasing concentrations of β-CD in acetate buffer pH 4: (A) (mixture 1) 10-3
M, (mixture 2) 3·10-3 M, (mixture 3) 5·10-3 M, (mixture 4) 7·10-3 M; (B) (mixture 1) 10-3 M, (mixture 2) 3·10-3 M, (mixture 3) 5·10-3 M, (mixture 4)
6·10-3 M
FARMACIA, 2013, Vol. 61, 6
1059
A
0,8 0,9 1,0 1,1 1,2 1,3 1,4 1,5 1,6 1,70,0
2,0x10⁻⁶
4,0x10⁻⁶
6,0x10⁻⁶
8,0x10⁻⁶
1,0x10⁻⁵
1,2x10⁻⁵
I (A)
E (V vs Ag/AgCl)
acetate buffer pH 4 β-cyclodextrin 10-3M caffeine citrate 10-3M mixture 1 mixture 2 mixture 3 mixture 4
B
1,1 1,2 1,3 1,4 1,5 1,6 1,7 1,80,0
5,0x10⁻⁶
1,0x10⁻⁵
1,5x10⁻⁵
2,0x10⁻⁵
I(A)
E (V vs. Ag/AgCl)
acetate buffer pH 4 β-cyclodextrin 10-3M caffeine 10-3M mixture 1 mixture 2 mixture 3 mixture 4
Figure 3
SWVs of caffeine citrate (A) and caffeine (B) 10-3 M and increasing concentrations of β-CD in acetate buffer pH 4: (A) (mixture 1) 10-3 M, (mixture 2)
3·10-3 M, (mixture 3) 5·10-3 M, (mixture 4) 8·10-3 M; (B) (mixture 1) 10-3 M, (mixture 2) 5·10-3 M, (mixture 3) 6·10-3 M, (mixture 4) 9·10-3 M
-1,00 -0,75 -0,50 -0,25 0,00 0,25 0,50 0,75 1,00
-4,0x10⁻⁵
-2,0x10⁻⁵
0,0
2,0x10⁻⁵
4,0x10⁻⁵
6,0x10⁻⁵
I (A)
E (V vs Ag/AgCl)
PBS pH 7.4 acetaminophen 10-3M mixture 1 mixture 2 mixture 3 mixture 4
Figure 4
SWVs of 10-3M acetaminophen and increasing concentrations of β-CD in PBS pH 7.4: (mixture 1) 10-3 M, (mixture 2) 2·10-3 M, (mixture 3) 3·10-3 M,
(mixture 4) 4·10-3 M
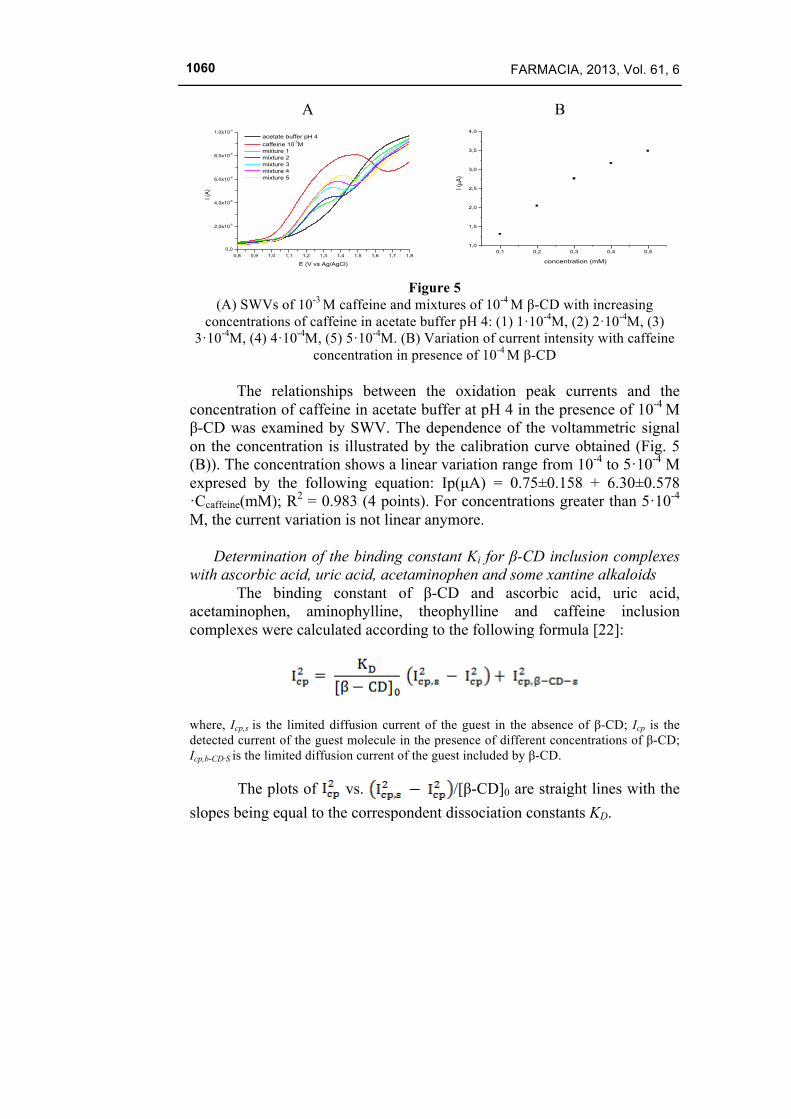
If the caffeine concentration is increased and the β-CD concentration remains unchanged it can be noticed that the oxidation peak corresponding to the caffeine is growing proportional to the amount added suggesting that the molar ratio of 1:1 is convenient for the complexation, figure 5(A).
FARMACIA, 2013, Vol. 61, 6
1060
A
0,8 0,9 1,0 1,1 1,2 1,3 1,4 1,5 1,6 1,7 1,80,0
2,0x10⁻⁶
4,0x10⁻⁶
6,0x10⁻⁶
8,0x10⁻⁶
1,0x10⁻⁵
I (A)
E (V vs Ag/AgCl)
acetate buffer pH 4 caffeine 10-3M mixture 1 mixture 2 mixture 3 mixture 4 mixture 5
B
0,1 0,2 0,3 0,4 0,51,0
1,5
2,0
2,5
3,0
3,5
4,0
concentration (mM)
I (µA
)
Figure 5
(A) SWVs of 10-3 M caffeine and mixtures of 10-4 M β-CD with increasing concentrations of caffeine in acetate buffer pH 4: (1) 1·10-4M, (2) 2·10-4M, (3)
3·10-4M, (4) 4·10-4M, (5) 5·10-4M. (B) Variation of current intensity with caffeine concentration in presence of 10-4 M β-CD
The relationships between the oxidation peak currents and the
concentration of caffeine in acetate buffer at pH 4 in the presence of 10-4 M β-CD was examined by SWV. The dependence of the voltammetric signal on the concentration is illustrated by the calibration curve obtained (Fig. 5 (B)). The concentration shows a linear variation range from 10-4 to 5·10-4 M expresed by the following equation: Ip(µA) = 0.75±0.158 + 6.30±0.578 ·Ccaffeine(mM); R2 = 0.983 (4 points). For concentrations greater than 5·10-4
M, the current variation is not linear anymore. Determination of the binding constant Ki for β-CD inclusion complexes
with ascorbic acid, uric acid, acetaminophen and some xantine alkaloids The binding constant of β-CD and ascorbic acid, uric acid,
acetaminophen, aminophylline, theophylline and caffeine inclusion complexes were calculated according to the following formula [22]:
where, Icp,s is the limited diffusion current of the guest in the absence of β-CD; Icp is the detected current of the guest molecule in the presence of different concentrations of β-CD; Icp,b-CD·S is the limited diffusion current of the guest included by β-CD.
The plots of vs. /[β-CD]0 are straight lines with the slopes being equal to the correspondent dissociation constants KD.
FARMACIA, 2013, Vol. 61, 6
1061
The equations for these straight lines and the values for the binding constants for all the inclusion complexes formed between β-CD and the above mentioned compounds are presented in Table I.
Table I
Ki values of β-CD inclusion complexes, calculated by electrochemical current method. Guest
molecule Host
molecule
Ki (M-1)
β-CD
AA 243.90
UA 666.66
AC 161.29
AM 80.65
TH 909.09
CA 1111.11
AA=ascorbic acid; UA=uric acid; AC=acetaminophen; AM=aminophylline; TH=teophylline; CA=caffeine.
From the inverse of the slope KD, the binding constant Ki was evaluated and the obtained values are in agreement with the results presented in literature for other inclusion complexes of β-CD [22].
Infrared (FTIR) studies of the inclusion complexes In order to confirm the observations concerning the inclusion
complexes, the FTIR measurements on the substances with β-CD were performed. The solid samples were obtained by evaporation of the same solvent used in electrochemical analysis. In the case where acetate buffer was used as solvent, there can be observed two peaks at 1583 cm-1 and 1400 cm-1 corresponding to the COO- asymmetric and symmetric stretches. PBS presents no remarkable influence on the FTIR spectra.
Analyzing the FTIR spectra of the inclusion complexes it can be easily observed that there appear major modifications of the peaks: shift, attenuation and disappearance of some absorption bands.
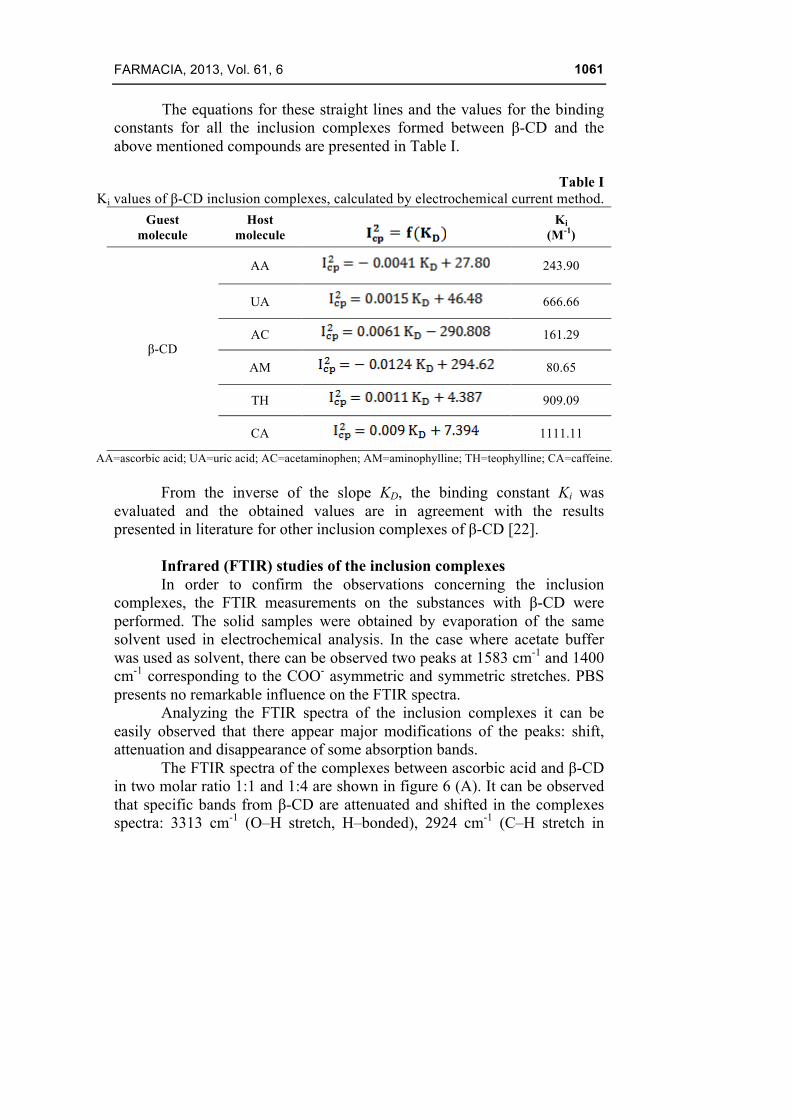
The FTIR spectra of the complexes between ascorbic acid and β-CD in two molar ratio 1:1 and 1:4 are shown in figure 6 (A). It can be observed that specific bands from β-CD are attenuated and shifted in the complexes spectra: 3313 cm-1 (O–H stretch, H–bonded), 2924 cm-1 (C–H stretch in
FARMACIA, 2013, Vol. 61, 6
1062
alkanes), 1338-1020 cm-1 (C–O stretch in alcohols and ethers), 946-754 cm-
1 (carbohydrates bands), 605-574 cm-1 (ether band). Some bands of ascorbic acid are diminished in the spectra of complexes: 1752 cm-1 (C=O stretch in carbonyl), 1652 cm-1 (–C=C– stretch), 1023 cm-1 (C–O stretch in alcohols and ethers), 754 cm-1 (=C–H band), 628 cm-1 (C-O band in ether). The four small O–H stretches at 3523, 3406, 3310, 3206 cm-1 disappear in complexes being hidden in the broad band at 3277 cm-1 from β-CD. Other bands of ascorbic acid are no more present in complexes: 3005 cm-1 (=C–H stretch), 1496 cm-1 (C–C stretch in–ring), 1455 cm-1 (C–H band), and 1312-1110 cm-
1 (C–O stretch), 987-683 cm-1 (=C–H band).
A
4000 3500 3000 2500 2000 1500 1000 500
20
Wavenumber (cm-1)
T (%
)
1:1 complex 1:4 complex ascorbic acid β-cyclodextrin
B
4000 3500 3000 2500 2000 1500 1000 500
20
T (%
)
Wavenumber (cm-1)
1:1 complex 1:4 complex uric acid β-cyclodextrin
Figure 6 FTIR spectra of β-CD, ascorbic acid (A), uric acid (B) and inclusion complexes
Figure 6 (B) shows the FTIR spectra of uric acid-β-CD complexes.
The vibration bands from β-CD which are attenuated and shifted in these complexes are almost the same like in the case of ascorbic complexes above. The bands of uric acid from 2986 cm-1, 2916 cm-1 (CH3 asymmetric and N-H stretch in imidazol), 1024 cm-1 (N-H stretching, C-N stretch in pirimidine), 874 cm-1 (N-H out-of-plane bending) are strongly diminished and shifted in complexes. Some bands have disappeared in the complexes spectra: 2817-2024 cm-1 (ν CH3 asymmetric and N-H stretch, asymmetric stretch of C=C), 1652-1435 cm-1 (C=O stretch in unsaturated carbonyl, asymmetric deformation of NH3, CH2-CO bending, δ CH2 scissoring), 1398-1348-1299 cm-1 (CH2-CO deformation, νC=O, ν CN in imidazole), 1120 cm-1 (N-H stretching, C-N stretch in pirimidine), 989-572 cm-1 (C-C stretch, N-H out-of-plane bending, C-N stretching of aromatic).
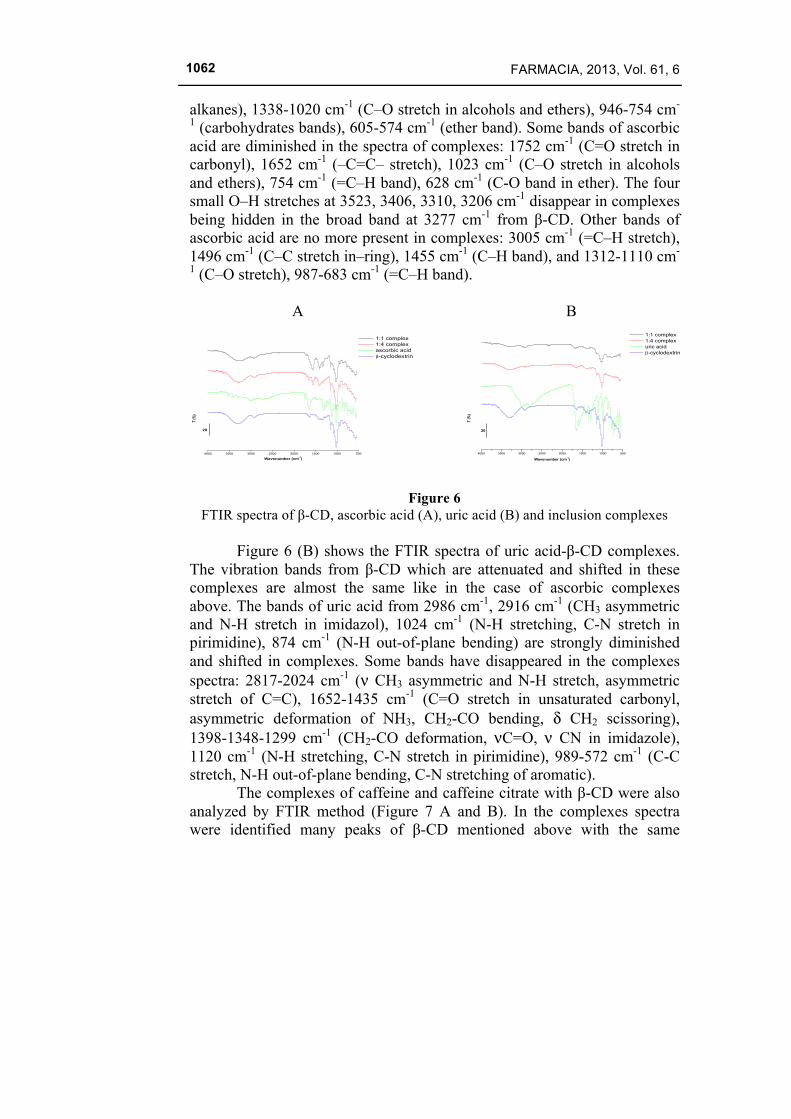
The complexes of caffeine and caffeine citrate with β-CD were also analyzed by FTIR method (Figure 7 A and B). In the complexes spectra were identified many peaks of β-CD mentioned above with the same
FARMACIA, 2013, Vol. 61, 6
1063
modifications. The vibration bands of citrate caffeine which can be identified in the complexes are attenuated: 1753-1696-1646 cm-1 (C=O stretch in unsaturated cetones, carboxilic acid), 1239 cm-1 (CN stretch in imidazole), 911 cm-1 (O–H band in carboxilic acid), 849-673 cm-1 (δ CH). On the other hand, many peaks of citrate caffeine disappear in complexes: 3471-3215-3167 cm-1 (O–H, NH stretch, H–bonded), 3119 cm-1 (CH stretch in imidazole), 1761-1706 cm-1 (C=O stretch), 1374 cm-1 (δ CH in citrate), 1313 cm-1 (C–N stretch in imidazole), 1208-1189 cm-1 (C–O stretch), 1172-1032 cm-1 (C-N stretch in pyrimidine), 977-763 cm-1 (δ CH, NH, ring).
In the complexes of caffeine with β-CD there can be noticed many bands of caffeine strongly attenuated and shifted: 3112 cm-1 (C–H stretch in imidazole), 1692 cm-1 (C=O stretch), 1480-1455 cm-1 (C–C stretch in–ring), 1283-1237 cm-1 (C-N stretch in imidazole), 924 cm-1 (δ NH), 758 cm-1 (δ CH). Other bands disappear: 1598-1402 cm-1 (ν CC), 1187-1073 cm-1 (ν CN), 972-608 cm-1 (δ CH, ring, NH).
A
4000 3500 3000 2500 2000 1500 1000 500
20
T (%
)
Wavenumber (cm-1)
1:1 complex 1:5 complex caffeine citrate β-cyclodextrin
B
4000 3500 3000 2500 2000 1500 1000 500
20
T (%
)
Wavenumber (cm-1)
1:1 complex 1:5 complex caffeine β-cyclodextrin
Figure 7
FTIR spectra of β-CD, caffeine citrate (A), caffeine (B) and inclusion complexes The FTIR spectra of inclusion complexes between theophylline and
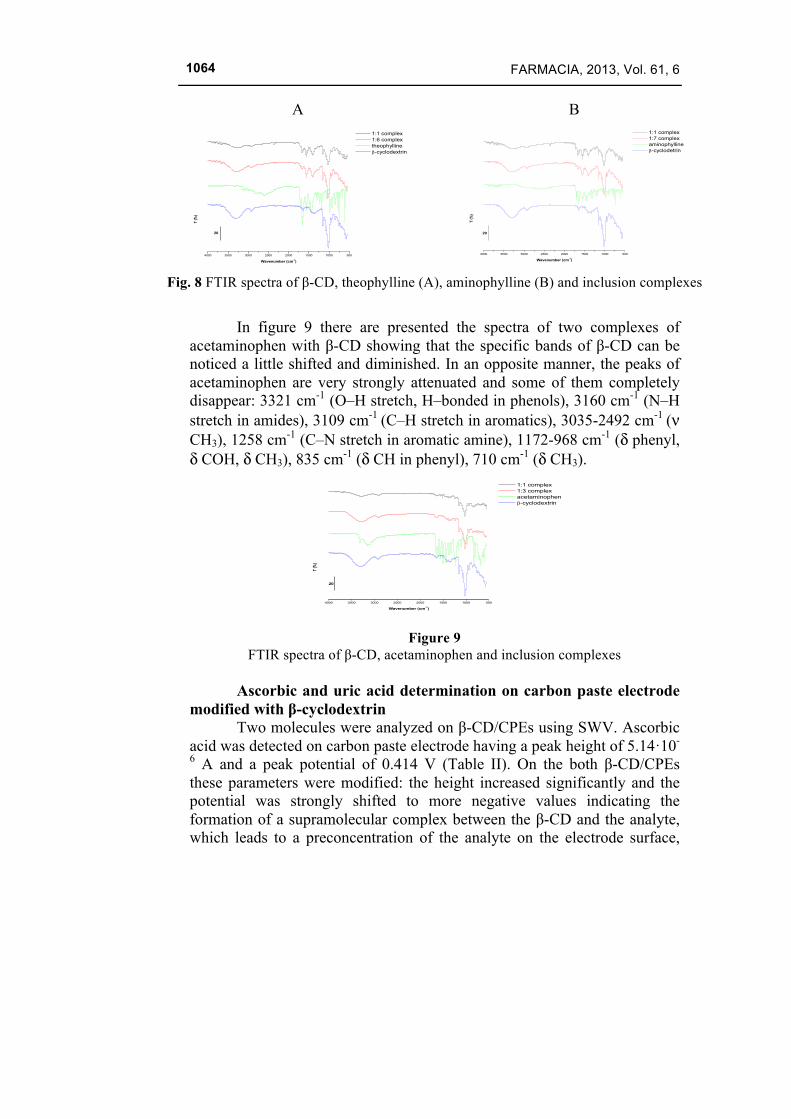
β-CD are shown in figure 8 (A). The two complexes preserve the main peaks of β-CD but the most of the theophylline bands are attenuated and shifted: 3120 cm-1 (ν CH in imidazole), 2982-2924 cm-1 (ν NH imidazole), 1705-1661 cm-1 (C=O stretch), 1284-1239 cm-1 (C–N stretch imidazole), 1186 cm-1 (C–N stretch pirimidine), 846-609 cm-1 (δ CH, NH) [15]. Some peaks of theophylline have disappeared in the complexes spectra: 3058-2822-2597 cm-1 (C–H stretch imidazole), 1047 cm-1 (C–N stretch in pirimidine), and 913 cm-1 (δ NH). The spectral behavior of aminophylline complexes is similar to that of theophylline ones (Figure 8 B).
FARMACIA, 2013, Vol. 61, 6
1064
A
4000 3500 3000 2500 2000 1500 1000 500
20
T (%
)
Wavenumber (cm-1)
1:1 complex 1:6 complex theophylline β-cyclodextrin
B
4000 3500 3000 2500 2000 1500 1000 500
20
T (%
)
Wavenumber (cm-1)
1:1 complex 1:7 complex aminophylline β-cyclodetrin
Fig. 8 FTIR spectra of β-CD, theophylline (A), aminophylline (B) and inclusion complexes
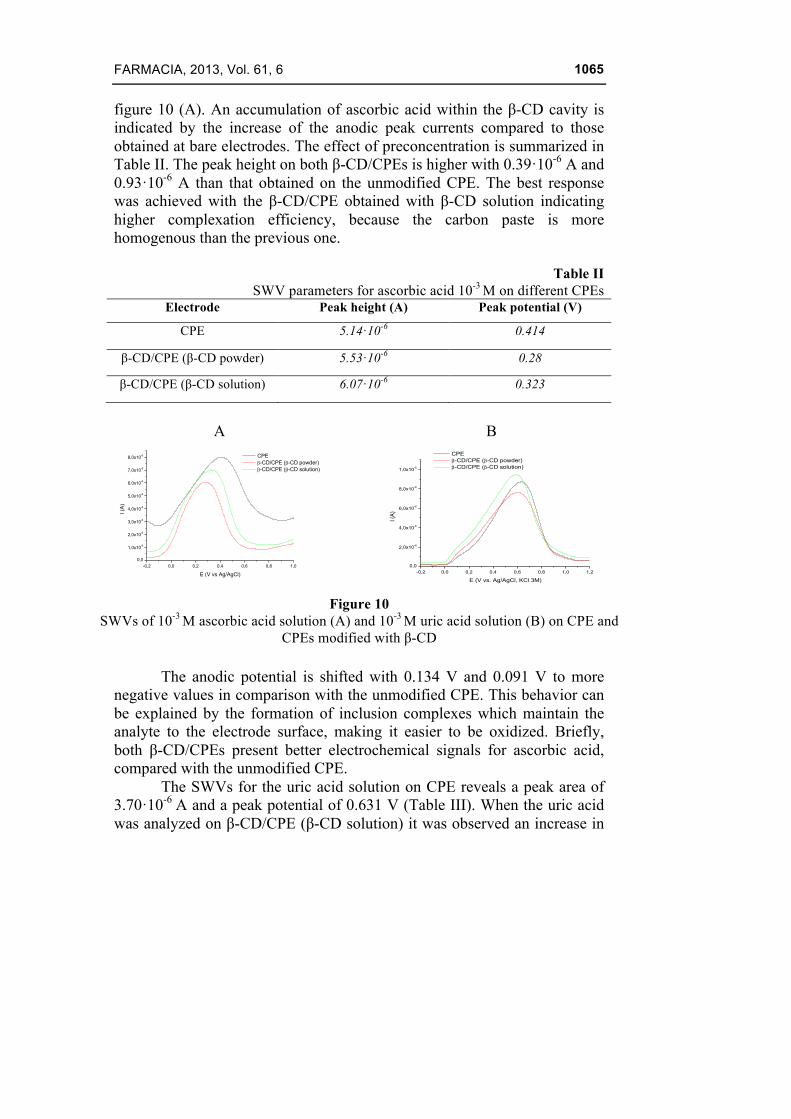
In figure 9 there are presented the spectra of two complexes of
acetaminophen with β-CD showing that the specific bands of β-CD can be noticed a little shifted and diminished. In an opposite manner, the peaks of acetaminophen are very strongly attenuated and some of them completely disappear: 3321 cm-1 (O–H stretch, H–bonded in phenols), 3160 cm-1 (N–H stretch in amides), 3109 cm-1 (C–H stretch in aromatics), 3035-2492 cm-1 (ν CH3), 1258 cm-1 (C–N stretch in aromatic amine), 1172-968 cm-1 (δ phenyl, δ COH, δ CH3), 835 cm-1 (δ CH in phenyl), 710 cm-1 (δ CH3).
4000 3500 3000 2500 2000 1500 1000 500
20
T (%)
Wavenumber (cm-1)
1:1 complex 1:3 complex acetaminophen β-cyclodextrin
Figure 9
FTIR spectra of β-CD, acetaminophen and inclusion complexes
Ascorbic and uric acid determination on carbon paste electrode modified with β-cyclodextrin
Two molecules were analyzed on β-CD/CPEs using SWV. Ascorbic acid was detected on carbon paste electrode having a peak height of 5.14·10-
6 A and a peak potential of 0.414 V (Table II). On the both β-CD/CPEs these parameters were modified: the height increased significantly and the potential was strongly shifted to more negative values indicating the formation of a supramolecular complex between the β-CD and the analyte, which leads to a preconcentration of the analyte on the electrode surface,
FARMACIA, 2013, Vol. 61, 6
1065
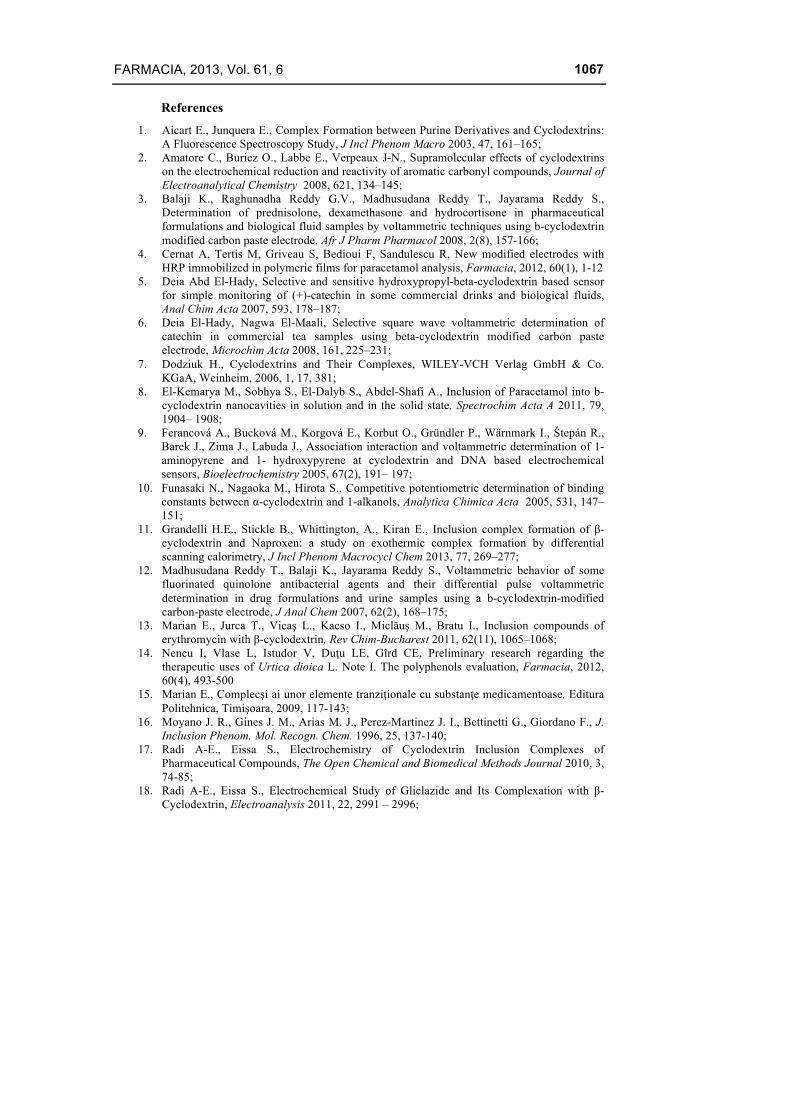
figure 10 (A). An accumulation of ascorbic acid within the β-CD cavity is indicated by the increase of the anodic peak currents compared to those obtained at bare electrodes. The effect of preconcentration is summarized in Table II. The peak height on both β-CD/CPEs is higher with 0.39·10-6 A and 0.93·10-6 A than that obtained on the unmodified CPE. The best response was achieved with the β-CD/CPE obtained with β-CD solution indicating higher complexation efficiency, because the carbon paste is more homogenous than the previous one.
Table II SWV parameters for ascorbic acid 10-3 M on different CPEs
Electrode Peak height (A) Peak potential (V)
CPE 5.14·10-6 0.414
β-CD/CPE (β-CD powder) 5.53·10-6 0.28
β-CD/CPE (β-CD solution) 6.07·10-6 0.323
A
-0,2 0,0 0,2 0,4 0,6 0,8 1,00,0
1,0x10⁻⁶
2,0x10⁻⁶
3,0x10⁻⁶
4,0x10⁻⁶
5,0x10⁻⁶
6,0x10⁻⁶
7,0x10⁻⁶
8,0x10⁻⁶
I (A
)
E (V vs Ag/AgCl)
CPE β-CD/CPE (β-CD powder) β-CD/CPE (β-CD solution)
B
-0,2 0,0 0,2 0,4 0,6 0,8 1,0 1,20,0
2,0x10⁻⁶
4,0x10⁻⁶
6,0x10⁻⁶
8,0x10⁻⁶
1,0x10⁻⁵
I (A)
E (V vs. Ag/AgCl, KCl 3M)
CPE β-CD/CPE (β-CD powder) β-CD/CPE (β-CD solution)
Figure 10
SWVs of 10-3 M ascorbic acid solution (A) and 10-3 M uric acid solution (B) on CPE and CPEs modified with β-CD
The anodic potential is shifted with 0.134 V and 0.091 V to more
negative values in comparison with the unmodified CPE. This behavior can be explained by the formation of inclusion complexes which maintain the analyte to the electrode surface, making it easier to be oxidized. Briefly, both β-CD/CPEs present better electrochemical signals for ascorbic acid, compared with the unmodified CPE.
The SWVs for the uric acid solution on CPE reveals a peak area of 3.70·10-6 A and a peak potential of 0.631 V (Table III). When the uric acid was analyzed on β-CD/CPE (β-CD solution) it was observed an increase in

FARMACIA, 2013, Vol. 61, 6
1066
the current response to 8.81·10-6A and a shift to less positive potential 0.589 V in comparison to the CPE, figure 10 (B). The inclusion complex formed may be responsible for the preconcentration of the uric acid to the electrode surface, facilitating the oxidation.
Table III
SWV parameters for 10-3M uric acid on different CPEs Electrode Peak height (A) Peak potential (V)
CPE 8.31·10-6 0.631 β-CD/CPE (β-CD powder) 7.20·10-6 0.605 β-CD/CPE (β-CD solution) 8.81·10-6 0.589
The above differences from the voltammograms can be attributed to
the immobilization of β-CD on the carbon paste leading to the modification of the electrode surface, that cause an increase in the signal due to the substance accumulation, probably by formation of inclusion complex uric acid-β-CD.
Conclusions
The effect of β-CD on the electrochemical behavior of the above mentioned substances (uric acid, ascorbic acid, aminophylline, caffeine, caffeine citrate, theophylline and acetaminophen) indicates a decrease in the peak current and a positive shift in the anodic peak potential. These changes can be explained by the formation of inclusion complexes with β-CD which leads to a more difficult oxidation. The variations of the peak current (decrease and positive shift) are attributed to the decrease of the free analyte and to the decrease of the diffusion coefficient with the formation of inclusion complexes.
Regarding the FTIR determination it can be noticed that the modifications of vibration bands of the analytes and β-CD consisting in shift, attenuation and disappearance in complexes spectra indicate the formation of inclusion complexes. This spectral study confirms the observations revealed by electrochemical analysis concerning the formation of inclusion complexes between the substances mentioned above and β-CD.
β-CD/CPEs present advantages for the determination of ascorbic and uric acid such as enhanced sensitivity, simple, fast and low cost procedure. Neither accumulation time, nor accumulation potential is required for the sensitive measurements of ascorbic and uric acid. No electrochemical pretreatment of the electrode is necessary.
FARMACIA, 2013, Vol. 61, 6
1067
References
1. Aicart E., Junquera E., Complex Formation between Purine Derivatives and Cyclodextrins: A Fluorescence Spectroscopy Study, J Incl Phenom Macro 2003, 47, 161–165;
2. Amatore C., Buriez O., Labbe E., Verpeaux J-N., Supramolecular effects of cyclodextrins on the electrochemical reduction and reactivity of aromatic carbonyl compounds, Journal of Electroanalytical Chemistry 2008, 621, 134–145;
3. Balaji K., Raghunadha Reddy G.V., Madhusudana Reddy T., Jayarama Reddy S., Determination of prednisolone, dexamethasone and hydrocortisone in pharmaceutical formulations and biological fluid samples by voltammetric techniques using b-cyclodextrin modified carbon paste electrode, Afr J Pharm Pharmacol 2008, 2(8), 157-166;
4. Cernat A, Tertis M, Griveau S, Bedioui F, Sandulescu R, New modified electrodes with HRP immobilized in polymeric films for paracetamol analysis, Farmacia, 2012, 60(1), 1-12
5. Deia Abd El-Hady, Selective and sensitive hydroxypropyl-beta-cyclodextrin based sensor for simple monitoring of (+)-catechin in some commercial drinks and biological fluids, Anal Chim Acta 2007, 593, 178–187;
6. Deia El-Hady, Nagwa El-Maali, Selective square wave voltammetric determination of catechin in commercial tea samples using beta-cyclodextrin modified carbon paste electrode, Microchim Acta 2008, 161, 225–231;
7. Dodziuk H., Cyclodextrins and Their Complexes, WILEY-VCH Verlag GmbH & Co. KGaA, Weinheim, 2006, 1, 17, 381;
8. El-Kemarya M., Sobhya S., El-Dalyb S., Abdel-Shafi A., Inclusion of Paracetamol into b-cyclodextrin nanocavities in solution and in the solid state, Spectrochim Acta A 2011, 79, 1904– 1908;
9. Ferancová A., Bucková M., Korgová E., Korbut O., Gründler P., Wärnmark I., Štepán R., Barek J., Zima J., Labuda J., Association interaction and voltammetric determination of 1-aminopyrene and 1- hydroxypyrene at cyclodextrin and DNA based electrochemical sensors, Bioelectrochemistry 2005, 67(2), 191– 197;
10. Funasaki N., Nagaoka M., Hirota S., Competitive potentiometric determination of binding constants between α-cyclodextrin and 1-alkanols, Analytica Chimica Acta 2005, 531, 147–151;
11. Grandelli H.E., Stickle B., Whittington, A., Kiran E., Inclusion complex formation of β-cyclodextrin and Naproxen: a study on exothermic complex formation by differential scanning calorimetry, J Incl Phenom Macrocycl Chem 2013, 77, 269–277;
12. Madhusudana Reddy T., Balaji K., Jayarama Reddy S., Voltammetric behavior of some fluorinated quinolone antibacterial agents and their differential pulse voltammetric determination in drug formulations and urine samples using a b-cyclodextrin-modified carbon-paste electrode, J Anal Chem 2007, 62(2), 168–175;
13. Marian E., Jurca T., Vicaş L., Kacso I., Miclăuş M., Bratu I., Inclusion compounds of erythromycin with β-cyclodextrin, Rev Chim-Bucharest 2011, 62(11), 1065–1068;
14. Nencu I, Vlase L, Istudor V, Duţu LE, Gîrd CE, Preliminary research regarding the therapeutic uses of Urtica dioica L. Note I. The polyphenols evaluation, Farmacia, 2012, 60(4), 493-500
15. Marian E., Complecşi ai unor elemente tranziţionale cu substanţe medicamentoase, Editura Politehnica, Timişoara, 2009, 117-143;
16. Moyano J. R., Gines J. M., Arias M. J., Perez-Martinez J. I., Bettinetti G., Giordano F., J. Inclusion Phenom. Mol. Recogn. Chem. 1996, 25, 137-140;
17. Radi A-E., Eissa S., Electrochemistry of Cyclodextrin Inclusion Complexes of Pharmaceutical Compounds, The Open Chemical and Biomedical Methods Journal 2010, 3, 74-85;
18. Radi A-E., Eissa S., Electrochemical Study of Gliclazide and Its Complexation with β-Cyclodextrin, Electroanalysis 2011, 22, 2991 – 2996;
FARMACIA, 2013, Vol. 61, 6
1068
19. Rao C.N., Subbarayudu K., Rao C.N., Venkateswarlu P., Electrochemical reduction behaviour of donepezil at b-cyclodextrin modified carbon paste electrode, Portugaliae Electrochim Acta 2010, 28(5), 349-357;
20. Song J.P., Guo Y.J., Shuang S.M., Dong C., Study on the supramolecular systems of two basic violets with cyclodextrins by MWNTs/Nafion modified glassy carbon electrode, Chinese Chem Lett, 2009, 20, 981–984;
21. Vicaş L., Bota S., Moisa C., Ganea M., Evaluation study of the inclusion complex of captopril-β-cyclodextrin, Farmacia 2007, 55(1), 93 – 97;
22. Vilar M., Navarro M., Determination of cyclodextrin inclusion constant for aromatic carbonyl compounds through spectrophotometric and electrochemical methods, Electrochimica Acta 2010, 56, 305–313.
23. Xu P., Jiang X., Zhou C., Tang K., Study on inclusion interaction of hydrophilic 2 chloromandelic acid with hydroxypropyl-β-cyclodextrin, J Incl Phenom Macrocycl Chem 2013, 77, 447–453;
24. Zheng L., Xiong L., Li J., Li X., Sun J., Yang S., Xia J., Synthesis of a novel β-cyclodextrin derivative with high solubility and the electrochemical properties of ferrocene-carbonyl-β-cyclodextrin inclusion complex as an electron transfer mediator, Electrochemistry Communications 2008, 10, 340–345.
__________________________________ Manuscript received: January 15th 2013

![Cyclodextrins on Wikipedia - Cyclolab 4. In the Chemistry portal there is a forum on cyclodextrins on the following issues [7]: · Cyclodextrin topology · Chemical Structure · Industrial](https://img.pdfslide.net/doc/110x75/5ac09ed37f8b9a4e7c8c12c7/cyclodextrins-on-wikipedia-cyclolab-4-in-the-chemistry-portal-there-is-a-forum.jpg)