Embed Size (px)
Citation preview
ACTAUNIVERSITATIS
UPSALIENSISUPPSALA
2021
Digital Comprehensive Summaries of Uppsala Dissertationsfrom the Faculty of Science and Technology 2026
Electrochemical characterizationsof conducting redox polymers withproton traps
Enabling proton cycling in aprotic systems for highpotential energy storage
LISA ÅKERLUND
ISSN 1651-6214ISBN 978-91-513-1175-3urn:nbn:se:uu:diva-438906
Dissertation presented at Uppsala University to be publicly examined in Polhemsalen,Ångströmlaboratoriet, Lägerhyddsvägen 1, Uppsala, Thursday, 20 May 2021 at 09:30 forthe degree of Doctor of Philosophy. The examination will be conducted in English. Facultyexaminer: Professor Carita Kvarnström (University of Turku).
AbstractÅkerlund, L. 2021. Electrochemical characterizations of conducting redox polymers withproton traps. Enabling proton cycling in aprotic systems for high potential energy storage.Digital Comprehensive Summaries of Uppsala Dissertations from the Faculty of Science andTechnology 2026. 79 pp. Uppsala: Acta Universitatis Upsaliensis. ISBN 978-91-513-1175-3.
Floods, droughts and unpredictable weather could be the new reality for millions of people in anear future, unless we drastically decrease our greenhouse gas emissions to prevent the globalaverage temperature from increasing even further. Material innovations will most certainly beessential for many of the technical solutions needed in order to tackle environmental issues.One major challenge is how to deal with the massive energy demand, following the averagelifestyle of today, in a way that is both reliable and sustainable. Renewable energy sources havea varying output over time, hence cannot meet the demand for electricity by themselves. Tobuffer between demand and production, new ways to store the renewably produced energy arecrucial. From a life cycle aspect conventional battery types are far from sustainable, and, withthe increasing number of electronic devices for numerous applications, we need new options.
This thesis explores conducting redox polymers (CRPs), which can be utilized as organiccathode materials in high potential energy storage. Hydroquinone (HQ) was applied as thecapacity carrying pendant group, and by the introduction of a proton trap functionality thehigh reduction potential of quinone-proton cycling was achieved also in aprotic electrolytes.The high reduction potential allows for redox matching with the polymer backbone, crucial forCRPs to work as energy storage materials without any additives, and this was studied by in situconductance with IDA. In situ EQCM was applied in order to examine the cycling chemistry,and the constant mass uptake during the full oxidation cycle (and reverse during the reductioncycle) indicated uptake of charge compensating ions. Further, the proton trap functionality andits effectiveness were investigated by compositional variation, FTIR and variation of electrolyte.In situ UV/Vis was applied in order to study the electronic transitions of the bandgap, the chargecarriers and the pendant group redox conversion.
The results presented introduce a new route for utilizing protonated forms of quinones ascapacity carriers in aprotic media, by incorporating a proton trap in the material. The batteryprototypes point to the versatility of the proton trap materials, having reversible proton cyclingalso when the electrolyte contains metal salts. With dual-ion type batteries the cycling chemistryof the anode is disconnected from the cathode, which allows for free choice of anode material.
Keywords: Conducting redox polymers, Proton trap, Quinones, Organic energy storage,Organic batteries
Lisa Åkerlund, Department of Materials Science and Engineering, Nanotechnology andFunctional Materials, Box 534, Uppsala University, SE-751 21 Uppsala, Sweden.
© Lisa Åkerlund 2021
ISSN 1651-6214ISBN 978-91-513-1175-3urn:nbn:se:uu:diva-438906 (http://urn.kb.se/resolve?urn=urn:nbn:se:uu:diva-438906)

To my family, who provide all the love and energy necessary for me to
recharge during the intermittent successes and failures known to the
life of a doctoral student. Additionally, refilling the caffeine
and electrolyte levels are alsonecessary to provide crucial dopants
during thesis production.

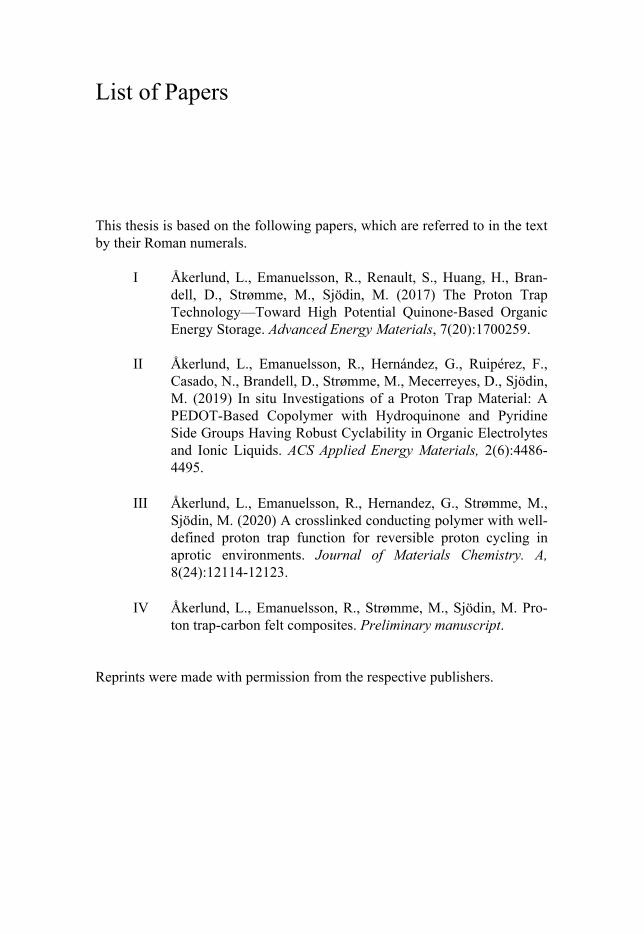
List of Papers
This thesis is based on the following papers, which are referred to in the text by their Roman numerals.
I Åkerlund, L., Emanuelsson, R., Renault, S., Huang, H., Bran-
dell, D., Strømme, M., Sjödin, M. (2017) The Proton Trap Technology—Toward High Potential Quinone‐Based Organic Energy Storage. Advanced Energy Materials, 7(20):1700259.
II Åkerlund, L., Emanuelsson, R., Hernández, G., Ruipérez, F., Casado, N., Brandell, D., Strømme, M., Mecerreyes, D., Sjödin, M. (2019) In situ Investigations of a Proton Trap Material: A PEDOT-Based Copolymer with Hydroquinone and Pyridine Side Groups Having Robust Cyclability in Organic Electrolytes and Ionic Liquids. ACS Applied Energy Materials, 2(6):4486-4495.
III Åkerlund, L., Emanuelsson, R., Hernandez, G., Strømme, M.,
Sjödin, M. (2020) A crosslinked conducting polymer with well-defined proton trap function for reversible proton cycling in aprotic environments. Journal of Materials Chemistry. A, 8(24):12114-12123.
IV Åkerlund, L., Emanuelsson, R., Strømme, M., Sjödin, M. Pro-
ton trap-carbon felt composites. Preliminary manuscript.
Reprints were made with permission from the respective publishers.
My contribution to the included papers
Paper I: I participated in the planning of the study and performed all the experimental work and data analysis, except for organic synthesis and bat-tery monitoring. I wrote the initial manuscript and contributed to the contin-ued writing process.
Paper II: I participated in the planning of the study and performed all the experimental work and data analysis, except for organic synthesis, computa-tional chemistry (molecular dynamics) and battery monitoring. I wrote the initial manuscript and contributed to the continued writing process.
Paper III: I participated in the planning of the study and performed all the experimental work and data analysis, except for organic synthesis and bat-tery monitoring. I wrote the initial manuscript and contributed to the contin-ued writing process.
Paper IV: I participated in the planning of the study and performed all the experimental work and data analysis, except for ASAP and TGA measure-ments and organic synthesis. I wrote the initial manuscript.
Also published
Åkerlund, L., Emanuelsson, R., Hernández, G., Ruipérez, F., Casado, N., Brandell, D., Strømme, M., Mecerreyes, D., Sjödin, M. (2019). The proton trap - a new route to organic energy storage. Organic Battery Days, Jena, Germany
Åkerlund, L. (2019). The proton trap: a new route to organic energy storage. Mirai Seminar, Stockholm and Uppsala, Sweden
Åkerlund, L., Emanuelsson, R., Strømme, M., & Sjödin, M. (2019). The proton trap battery - enabling reversible hydroquinone energy storage in organic electrolytes. SweGRIDS Annual Conference, Stockholm, Sweden
Sjödin, M., Emanuelsson, R., Wang, H., Åkerlund, L., Sterby, M., Huang, H., Gogoll, A., Strømme, M. (2018). Organiska batterier för hållbar och ökad energi-effektivitet i lokal energilagring. Framtidens Elsystem, Stock-holm, Sweden
Åkerlund, L., Emanuelsson, R., Strømme, M., & Sjödin, M. (2018). The proton trap – a new route to high potential organic energy storage. Gordon Research Conference: Electronic Processes in Organic Materials, Barga, Italy
Åkerlund, L. (2018). En uppkopplad värld behöver hållbara energilösning-ar. http://ciennce.se/en-uppkopplad-varld-behover-hallbara-energilosningar/
Åkerlund, L. (2017). Morgondagens organiska batterier. https://ciennce.se/morgondagens-organiska-batterier/
Sjödin, M., Emanuelsson, R., Sterby, M., Åkerlund, L., Huang, H., Huang, X., Gogoll, A., Strømme, M. (2017). Organic Batteries Based on Quinone-Substituted Conducting Polymers. 17th IUPAC International Symposium on MacroMolecular Complexes (MMC-17), Tokyo, Japan
Åkerlund, L. (2016). Organic battery materials. SweGRIDS board meeting, Stockholm, Sweden
Åkerlund, L., Emanuelsson, R., Gogoll, A., Strømme, M., & Sjödin, M. (2016). Quinone based Conducting Redox Polymers for Renewable Energy Storage. ISPE XV; 15th International Symposium on Polymer Electrolytes, Uppsala, Sweden Åkerlund, L., Emanuelsson, R., Gogoll, A., Strømme, M., & Sjödin, M. (2016). Organic Materials for Renewable Energy Storage. SweGRIDS PhD Conference, Stockholm, Sweden Åkerlund, L., Emanuelsson, R., Gogoll, A., Strømme, M., & Sjödin, M. (2016). Quinone based Conducting Redox Polymers for Renewable Energy Storage. 67th Annual Meeting of the International Society of Electrochemis-try, The Hague, The Netherlands
Åkerlund, L., Emanuelsson, R., Strømme, M., & Martin, S. (2016). Conduct-ing Redox Polymers for Renewable Energy Storage. ASMCS 2016: Materi-als for Tomorrow, Gothenburg, Sweden
Åkerlund, L., Emanuelsson, R., Strømme, M., & Sjödin, M. (2016). Organic Polymeric Materials for Renewable Energy Storage. Gordon Research Con-ference: Electronic Processes in Organic Materials, Barga, Italy
Åkerlund, L. (2015). Lisa Åkerlunds krokiga väg till forskningen. http://www.radioscience.se/uncategorized/8-lisa-akerlunds-krokiga-vag-till-forskningen/
Åkerlund, L., Emanuelsson, R., Sjödin, M., & Strømme, M. (2015). Organic Polymeric Materials for Renewable Batteries. Pacific polymer conference 14, Kauai, HI, USA
Åkerlund, L., Sjödin, M., & Strømme, M. (2015). Renewable Materials for Rechargeable Battery Applications. The 4th SweGRIDS Conference, Uppsala, Sweden
Contents
1. Introduction ................................................................................................... 13
2. Aim of thesis ................................................................................................. 15
3. Batteries, capacitors and battery characteristics ........................................... 16
4. Organic electroactive materials for electrical energy storage ...................... 20 Conducting polymers ................................................................................... 21
Polymerization ......................................................................................... 21 Conductivity ............................................................................................ 23
Redox active groups for charge storage ....................................................... 26 Quinone electrochemistry ....................................................................... 26 Proton trap materials and hydrogen bonding .......................................... 27
CRPs ............................................................................................................. 28 Redox matching ....................................................................................... 29
5. Electrochemistry ........................................................................................... 30 Electrochemical techniques .......................................................................... 32
CV and scan rate dependence ................................................................. 34 Galvanostatic charge and discharge (GCD) ........................................... 36
Electrochemical polymerization .................................................................. 37 In situ characterizations ................................................................................ 38
Conductivity ............................................................................................ 38 Electrochemical quartz crystal microbalance (EQCM) .......................... 39 Ultraviolet-visible spectroscopy (UV/Vis) ............................................. 40 Fourier transform infrared (FTIR) spectroscopy .................................... 41
6. Proton trap materials – enabling proton cycling in aprotic environments ... 43 Proton trap molecules ................................................................................... 44 Composition of random copolymers ........................................................... 47 Hydrogen bonding ........................................................................................ 49 Redox matching of proton trap-CRPs .......................................................... 50 Internal proton cycling and pKa dependence ............................................... 52
Kinetics .................................................................................................... 55 In situ spectroscopy ...................................................................................... 56
In situ UV/Vis .......................................................................................... 57 In situ FTIR .............................................................................................. 59

EQCM: Monitoring the mass change .......................................................... 60 Morphology .................................................................................................. 62 Battery prototypes ........................................................................................ 63
Fast charging ............................................................................................ 64 Self-discharge .......................................................................................... 65
Proton trap-Carbon felt (CF) composites .................................................... 65
Concluding remarks and future perspective ..................................................... 68
Svensk sammanfattning .................................................................................... 70
Acknowledgement ............................................................................................ 73
References ......................................................................................................... 76
Abbreviations
ATR-FTIR BG BQ CB CE CRP CV GCD EDOT EDX/EDS EQCM Fc HF HOMO HQ or QH2
IDALIB LUMO PEDOT PG PDP Pyr Q RE RM SEM SHE SQ TGA UV/Vis VB WE
Attenuated total reflectance-fourier transform infrared Bandgap 1,4-benzoquinone Conduction band Counter electrode Conducting redox polymer Cyclic voltammetry Galvanostatic charge discharge 3,4-ethylenedioxythiophene Energy-dispersive X-ray spectroscopy Electrochemical quartz crystal microbalance Ferrocene Heat flow Highest occupied molecular orbital Hydroquinone Interdigitated array electrodeLithium ion battery Lowest unoccupied molecular orbital Poly(3,4-ethylenedioxythiophene) Pendant group Post-deposition polymerization Pyridine Quinone Reference electrode Redox molecule Scanning electron microscopy Standard hydrogen electrode Semiquinone Thermogravimetric analysis Ultraviolet-visible (spectroscopy) Valence band Working electrode
Important symbols
Symbol Name Unit A Area m2 (or cm2) Abs Absorbance - a Activity - E Energy Wh Ed Energy density Wh/kg E or U Potential V E0 Standard potential V E0’ Formal potential V Ep Peak potential V E Bandgap energy J (or eV) F Faraday constant C/mol G Conductance S ΔG0 Gibbs free energy J/mol I or i Current A M Molar mass g/mol m Mass kg n Amount of substance mol Q Capacity Ah q Charge C R Gas constant J/mol/K R Resistance Ω T Temperature K t Time s v Scan rate V/s ρ Resistivity Ωm z Number of electrons or charges - λ Wavelength nm σ Conductivity S/m
13
1. Introduction
“Energy cannot be created or destroyed, it can only be changed from one form to another.” Albert Einstein
As simple as it sounds, this statement is fundamental for everything around us. From the membranes governing the ion flux in a cell to our planets changing atmosphere and the everyday needs of modern lives. Most of the energy we use comes from the sun, where it is transformed from chemically bound energy to heat and photons during fusion of two hydrogen atoms into helium. When sunlight hits the Earth the energy is harvested by photosyn-thesis in plants, retransforming it into chemically bound energy, which fur-ther provides us with food to eat and oxygen to breathe. With modern tech-nologies it is also possible to harvest the radiation from the sun by solar cells, and indirectly by harvesting wind and wave energy, which originates from the sun, through transformation between energy bound in different entities.
In the modern lifestyle we are constantly connected, heated, fueled and all in all energized. Cheap and available, straight from the walls, the supply of electricity is not considered a luxury anymore but rather something we take for granted. This ability to use electrical energy on demand originates in a constant and reliable energy production, but in a near future this situation could be about to change, as we now stand upon great challenges. The com-mitment to keep global warming below 2 °C was agreed upon at COP21 in Paris at the end of 2015,1 and development of new technologies are needed in order to fully avoid a climate collapse. Steering into a CO2-neutral world will be difficult and requires that electricity is both produced and stored sus-tainably, using renewable resources.2 This aim requires a circular thinking, which steers us towards a full transition from fossils to renewable sources, both for the energy supply and for the material production of the energy storage units needed.3, 4 Even though we have throughout the history been dependent on energy to survive, nowadays the modern society’s demand for energy is in dimensions that require smart storage solutions. It is harder to store the energy than to use it directly as produced, and it costs more. The most suitable energy storage technique depends on the application. For the grid, hydroelectric ponds have conventionally been used as energy reser-voirs, but today more alternatives need to be developed due to the increasing energy production from renewable sources. Batteries, not long ago consid-
14
ered only for small devices, are now a viable alternative for both grid storage (i.e. vanadium redox flow batteries), domestic storage (i.e. Tesla Powerwall) and in transportation (electric vehicles, EV).5 Another energy storage alter-native, which resembles a battery, is capacitors. There are still some im-portant characteristics that separate the two and this will be described further in chapter 3.
In a world where internet of things (IoT) is a global phenomenon, batter-ies are essential also for smartphones and other portable gadgets.6 In portable IoT devices as well as EVs – now covering everything from bicycles to cars, trucks and ferries – a durable and lightweight battery is required where the lithium ion battery (LIB) is the most important player. Although EVs have attracted most of the focus, batteries are also found in everything from sen-sors and small electronics (e.g. thermometers and flash lights) to start batter-ies (lead-acid batteries) in cars, and here other factors than weight and capac-ity can be of higher importance.4, 7, 8 As a matter of fact, lead-acid batteries, invented more than 150 years ago, are still dominating the amount of battery capacity installed. The demand for batteries is, just as the energy storage sector in general, ever increasing: both regarding high performance batteries (lithium ion chemistries and beyond), and low performance batteries (e.g. lead-acid). The ever increasing demand for batteries allows for more battery chemistries to be used, and also puts a higher pressure on the material sus-tainability.9, 10 With a diversity of battery chemistries available different de-vices can be tuned with specific applications. With the goal of a CO2-neutral world, it is paramount that the increased battery capacity is stored in more sustainably sourced materials, such as organic materials, that does not re-quire mining and can be processed at lower temperatures.2, 4, 8, 11 To make this possible, a better understanding of such materials is needed.12, 13
In this thesis, organic energy storage materials, with the possibility to complement the current battery market, are presented and characterized. The organic materials are designed as conducting redox polymers (CRP). CRPs are defined as the combination of a redox active molecule (RM) that pro-vides the main part of the capacity, with a conducting polymer backbone that provides inherent conductivity as the polymer becomes doped.14-17 Addition-ally, the insoluble polymer backbone inhibits dissolution of the active mate-rial. The conducting polymer will though only enable electron transport from the RM if their activities reside in the same potential region, or else conduct-ing additives are needed.18 The focus has been on utilizing quinones (Q) as RM, since they provide two electrons at a high reduction potential, and fur-ther to use these materials together with organic electrolytes, where an addi-tional functionality – a proton trap – is required for the redox matching to be sustained. The proton trap, which in this thesis is constituted by a pyridine unit, enables the Q to include protons in the redox reaction also in aprotic electrolytes.
15
2. Aim of thesis
The aim of this work has been to investigate conducting redox polymers (CRPs) as energy storage materials, specifically utilizing hydroquinone (HQ) as the main capacity contributor in aprotic environments. Redox reactions that include protons and take place in aprotic environments are rare but if managed could improve the energy density of a battery, hence the primary focus has been on the function of proton traps utilized in aprotic environ-ments for HQ-functionalized CRPs.
The specific aims of the papers included in this thesis are as follows: To study the electrochemistry, focusing on the proton trap ability,
of copolymers based on the combination of HQ- and Pyridine-EDOT monomers (Paper I & II).
To study redox matching, kinetics and mass transport of HQ-based CRPs in aprotic environments utilizing proton traps (Paper I, II & III).
To study the chemical and electronic transitions of CRPs by in
situ spectroscopy (Paper II & III).
To study internally hydrogen bonded proton trap materials, with a controlled deposition method, in batteries and in carbon felt com-posites (Paper III & IV).
16
3. Batteries, capacitors and battery characteristics
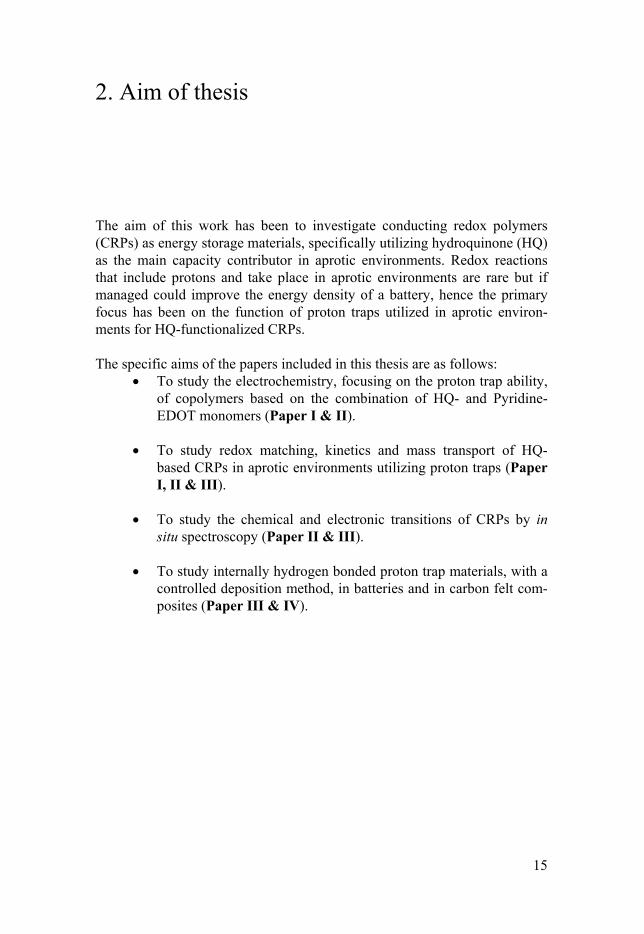
In 2019, the invention of lithium ion batteries (LIBs) was rewarded the No-bel Prize, indicating the importance for the modern society. A conventional LIB is illustrated in Figure 1 and it consists of two compositionally different electrodes: a negative electrode (anode during discharge) and a positive elec-trode (cathode during discharge), depending on their relative reduction po-tentials.19
Figure 1. Schematic illustration of the chemical composition of a conventional lithi-um ion battery.
17
A battery’s capacity is defined by the charge it can deliver, hence it is affect-ed by the number of electrons, z, that take part in the anode (1) and cathode (2) redox reactions:20
→ + (1)
→ (2)
The half-cell reactions (1) and (2) can be combined into the general redox reaction:
↔ (3)
The specific energy, or gravimetric energy density, is the energy per weight (Wh/kg) and the volumetric energy density is the energy per volume (Wh/l). For LIBs the negative electrode is normally lithium intercalated graphite or lithium titanate oxide, whereas the positive electrode exists in many different chemistries, such as lithium nickel manganese cobalt oxide, lithium nickel cobalt aluminum oxide, and lithium iron phosphate, which differ in capacity, power, life span, safety and cost.21 When discussing the importance of these properties in a practical context the capacity is limiting the driving range (of EVs) and the power output is limiting the charging rate, whereas the cycle life often display a capacity retention of ~80% after 1000 (charging) cycles.22
A separator is placed between the electrodes and soaked in electrolyte, current collectors are connected to the anode and cathode to collect and transport the charges, and finally a casing (e.g. pouch cell or coin cell) keeps everything together. The cell capacity is stated in Ah and the energy densi-ty in Wh. The capacity corresponds to the amount of charge you get when discharging your battery at a specific rate, known as the C-rate. At one C the charge is delivered at a one hour discharge rate. At increased C-rate (often above 1 C) a decrease in delivered capacity is often seen.
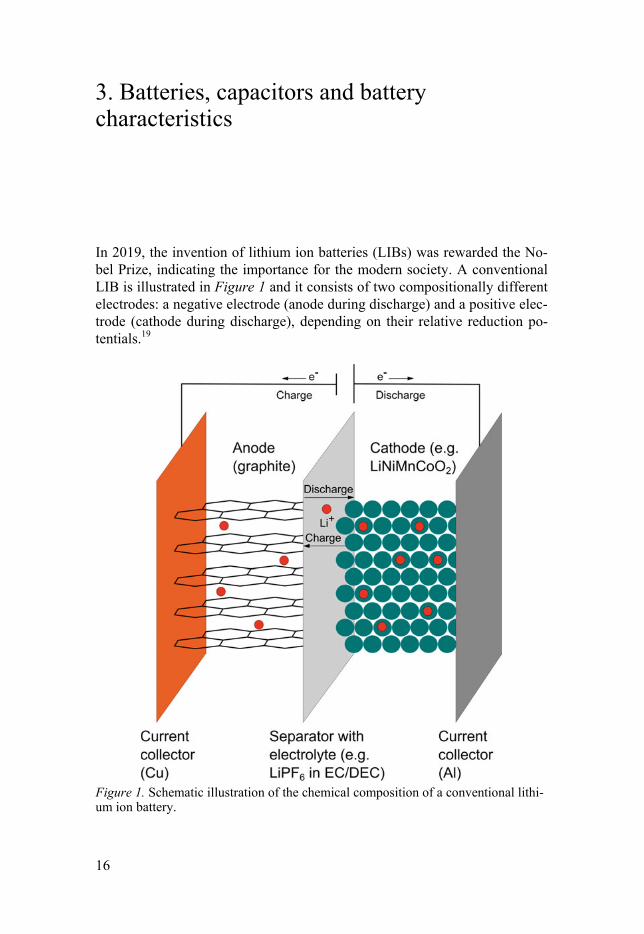
For specific capacity or specific energy the charge is then divided by the mass of the active material, providing Ah/kg or Wh/kg as specified earlier. In research, one often refers to the specific (theoretical) capacity in mAh/g of one electrode, which is then further normalized to the amount of active mate-rial. This provides a skewed number if a high amount of additives, such as conducting agents and binders, are used and it is difficult to compare these numbers to electrodes where the whole material is included.23 The potential difference (in V) between the negative and positive electrode, i.e. the poten-tial difference of their respective redox reactions, is referred to as the cell potential, (Figure 2). is often desired to be as high as possible, as this enhances . The relationship is stated in Equation 4 where it is clear
18
that two parameters can be adjusted, and , as to enhance the energy density:
For practical applications bigger battery packs can be used. When a high voltage is required the cells are put in series, to provide a voltage consisting of times the number of cells. If instead a high current is needed the batteries can be put in parallel and then the capacity will multiply with the number of cells.
Figure 2. A potential scale of the respective electrode reactions in a battery, provid-ing the overall cell potential, .
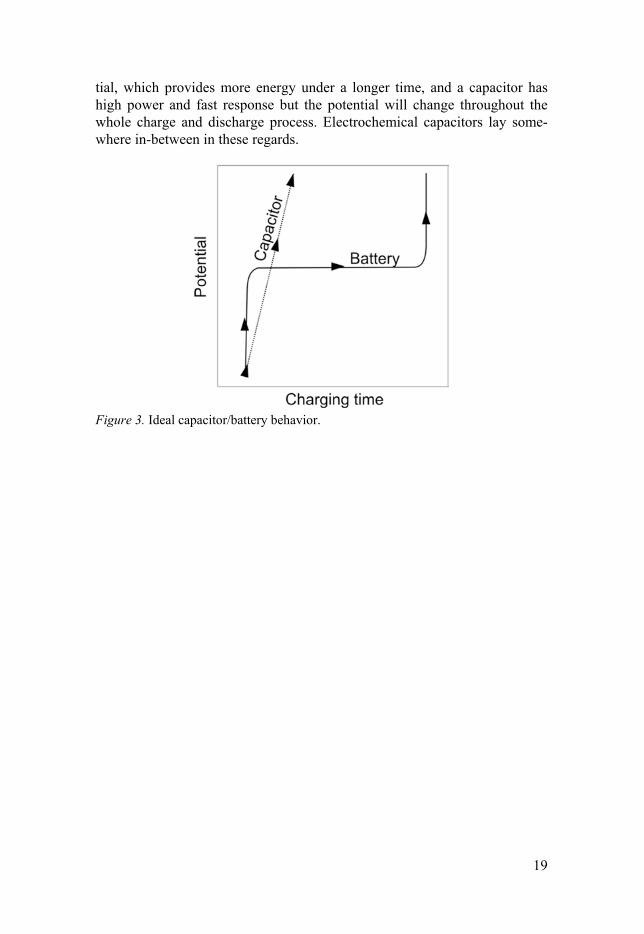
A capacitor is a more “simple” energy storage unit than a battery and is often used in applications where high power is needed without a high demand on the capacity. A conventional capacitor (a plate capacitor) consists of two conductors (often the same material) separated by a dielectric (solid) medi-um over which an electric field is generated. The charge is stored directly on the electrodes, and no redox reactions occur. There are also electrostatic double layer capacitors, which store energy by the separation of charges in the interface between an electrode and an electrolyte. The interface consists of opposite charges in a double layer, called the Helmholtz layer.24 The charge separation between the electrode and electrolyte is much smaller than the separation between the two plates of a conventional capacitor. Addition-ally, electrochemical capacitors (more recently referred to as super or ultra-capacitors) often consist of a combined double layer capacitance and pseu-docapacitance.25 They are not true capacitors per se since charges are pro-duced from redox reactions, but as they provide a capacitor-like behavior, with a sloping potential during the charge and discharge cycle (Figure 3), they are referred to as capacitors for practical purposes. For instance, con-ducting polymers, which will be presented in more detail in the next chapter, can be applied as supercapacitor material.26 The behavior of a battery is in-stead dependent on the state of charge, and produces a relatively stable po-tential (different plateaus for each type of battery) for a long time.19
The performance difference between a battery and a capacitor are mainly that a battery can provide a high capacity during a close to constant poten-
∗ (4)
19
tial, which provides more energy under a longer time, and a capacitor has high power and fast response but the potential will change throughout the whole charge and discharge process. Electrochemical capacitors lay some-where in-between in these regards.
Figure 3. Ideal capacitor/battery behavior.
20
4. Organic electroactive materials for electrical energy storage
The field of organic batteries has significantly increased during the last cou-ple of years and developed from small soluble redox molecules and conduct-ing polymers as capacitor materials into more advanced materials targeting higher capacity, stability and a wider understanding on how organic materi-als for energy storage actually work.12, 27-33
Organic energy storage materials, such as HQ, anthraquinone and naph-thoquinone, can be used with aqueous electrolytes and cycle protons in pro-ton batteries.34-36 On the other hand, aqueous electrolytes are limited by the water stability window of about 1V, which significantly limits the energy density. Recently, a number of organic materials have been tested as organic cathodes in LIBs where they cycle Li-ions.37-40 Hybrid Li-organic batteries have the possibility to replace the expensive and ethically problematic co-balt-containing cathodes.39 The two presented battery types are both exam-ples of rocking chair type batteries, where the same ion is cycled back and forth between the anode and the cathode, as in Figure 19. 19 A third example is when the cycling ion of the anode and the cycling ion of the cathode dif-fer. This is called a dual-ion battery and has the advantage that one can choose freely the anode and cathode materials, e.g. to target specific parame-ters such as stability, cost, potential range, etc.8 Additionally, the power den-sity can be improved.41 The disadvantage of this battery type is that the elec-trolyte becomes much more expensive as it must contain enough ions for the charge compensation process. Which electrode has the anions or cations depends on the respective cycling chemistry, and both ions must have good transport properties in the electrolyte. During charge compensation the ions are stored in the electrodes, and at the same time enough ions must be pre-sent in the electrolyte to provide good conductivity, unless there is a simul-taneous uptake and release of both anions and cations (referred to as a rock-ing chair dual-ion battery).42
The chosen system for battery prototypes in this thesis is the dual-ion type, where organic CRP materials are applied as the cathode material. In this chapter the constituents of CRPs and their main characteristics as organ-ic electroactive materials are presented.
21
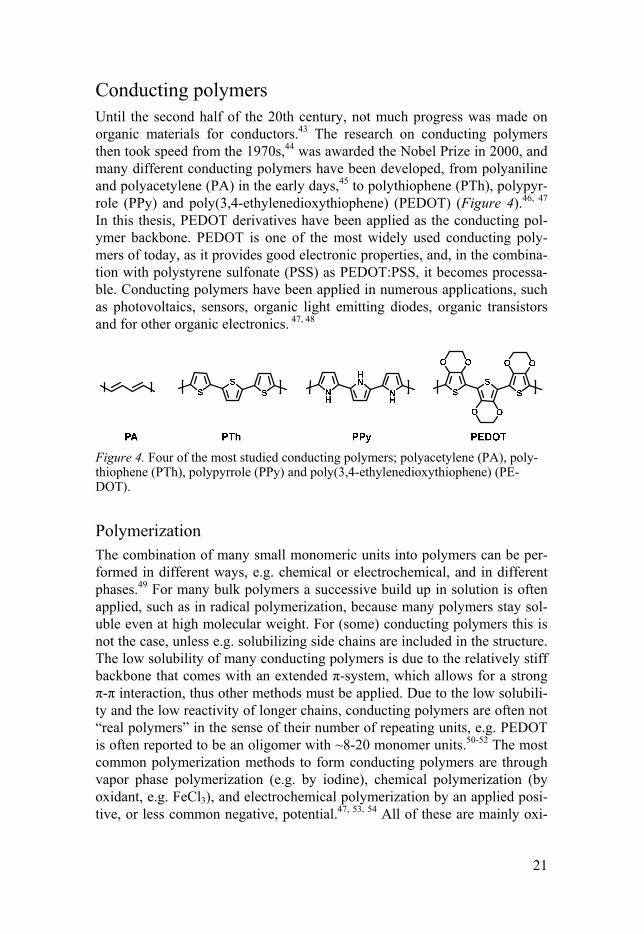
Conducting polymers Until the second half of the 20th century, not much progress was made on organic materials for conductors.43 The research on conducting polymers then took speed from the 1970s,44 was awarded the Nobel Prize in 2000, and many different conducting polymers have been developed, from polyaniline and polyacetylene (PA) in the early days,45 to polythiophene (PTh), polypyr-role (PPy) and poly(3,4-ethylenedioxythiophene) (PEDOT) (Figure 4).46, 47 In this thesis, PEDOT derivatives have been applied as the conducting pol-ymer backbone. PEDOT is one of the most widely used conducting poly-mers of today, as it provides good electronic properties, and, in the combina-tion with polystyrene sulfonate (PSS) as PEDOT:PSS, it becomes processa-ble. Conducting polymers have been applied in numerous applications, such as photovoltaics, sensors, organic light emitting diodes, organic transistors and for other organic electronics. 47, 48
Figure 4. Four of the most studied conducting polymers; polyacetylene (PA), poly-thiophene (PTh), polypyrrole (PPy) and poly(3,4-ethylenedioxythiophene) (PE-DOT).
Polymerization The combination of many small monomeric units into polymers can be per-formed in different ways, e.g. chemical or electrochemical, and in different phases.49 For many bulk polymers a successive build up in solution is often applied, such as in radical polymerization, because many polymers stay sol-uble even at high molecular weight. For (some) conducting polymers this is not the case, unless e.g. solubilizing side chains are included in the structure. The low solubility of many conducting polymers is due to the relatively stiff backbone that comes with an extended π-system, which allows for a strong π-π interaction, thus other methods must be applied. Due to the low solubili-ty and the low reactivity of longer chains, conducting polymers are often not “real polymers” in the sense of their number of repeating units, e.g. PEDOT is often reported to be an oligomer with ~8-20 monomer units.50-52 The most common polymerization methods to form conducting polymers are through vapor phase polymerization (e.g. by iodine), chemical polymerization (by oxidant, e.g. FeCl3), and electrochemical polymerization by an applied posi-tive, or less common negative, potential.47, 53, 54 All of these are mainly oxi-
22
dative polymerization methods (reductive polymerization is less common but can sometimes be applied).44
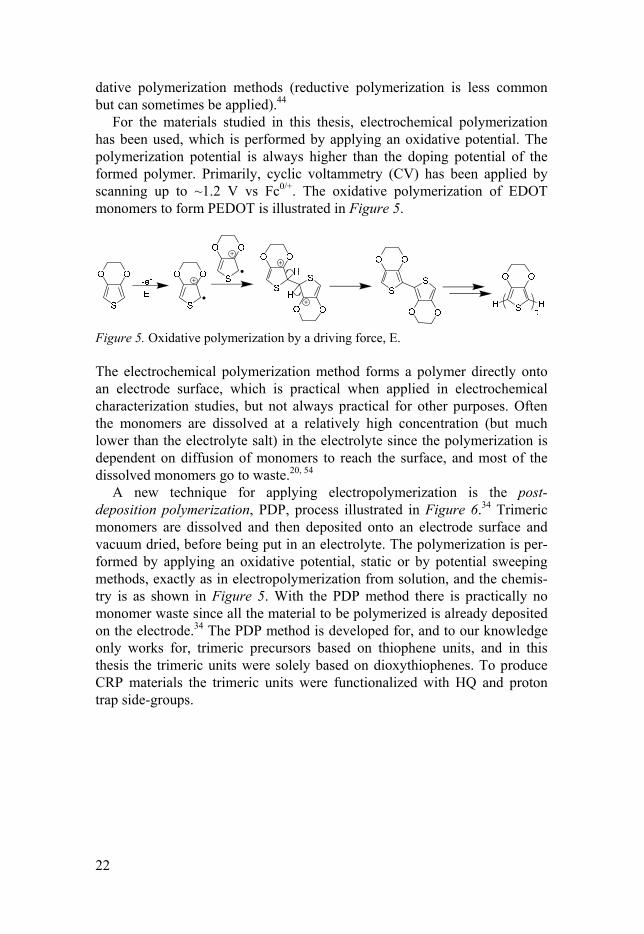
For the materials studied in this thesis, electrochemical polymerization has been used, which is performed by applying an oxidative potential. The polymerization potential is always higher than the doping potential of the formed polymer. Primarily, cyclic voltammetry (CV) has been applied by scanning up to ~1.2 V vs Fc0/+. The oxidative polymerization of EDOT monomers to form PEDOT is illustrated in Figure 5.
Figure 5. Oxidative polymerization by a driving force, E.
The electrochemical polymerization method forms a polymer directly onto an electrode surface, which is practical when applied in electrochemical characterization studies, but not always practical for other purposes. Often the monomers are dissolved at a relatively high concentration (but much lower than the electrolyte salt) in the electrolyte since the polymerization is dependent on diffusion of monomers to reach the surface, and most of the dissolved monomers go to waste.20, 54
A new technique for applying electropolymerization is the post-deposition polymerization, PDP, process illustrated in Figure 6.34 Trimeric monomers are dissolved and then deposited onto an electrode surface and vacuum dried, before being put in an electrolyte. The polymerization is per-formed by applying an oxidative potential, static or by potential sweeping methods, exactly as in electropolymerization from solution, and the chemis-try is as shown in Figure 5. With the PDP method there is practically no monomer waste since all the material to be polymerized is already deposited on the electrode.34 The PDP method is developed for, and to our knowledge only works for, trimeric precursors based on thiophene units, and in this thesis the trimeric units were solely based on dioxythiophenes. To produce CRP materials the trimeric units were functionalized with HQ and proton trap side-groups.
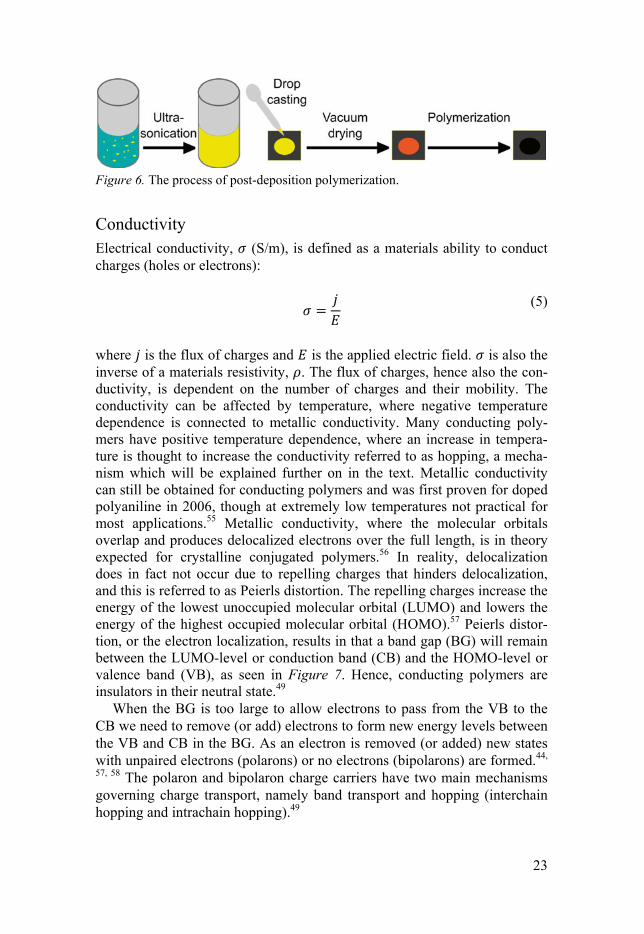
23
Figure 6. The process of post-deposition polymerization.
Conductivity Electrical conductivity, (S/m), is defined as a materials ability to conduct charges (holes or electrons):
(5)
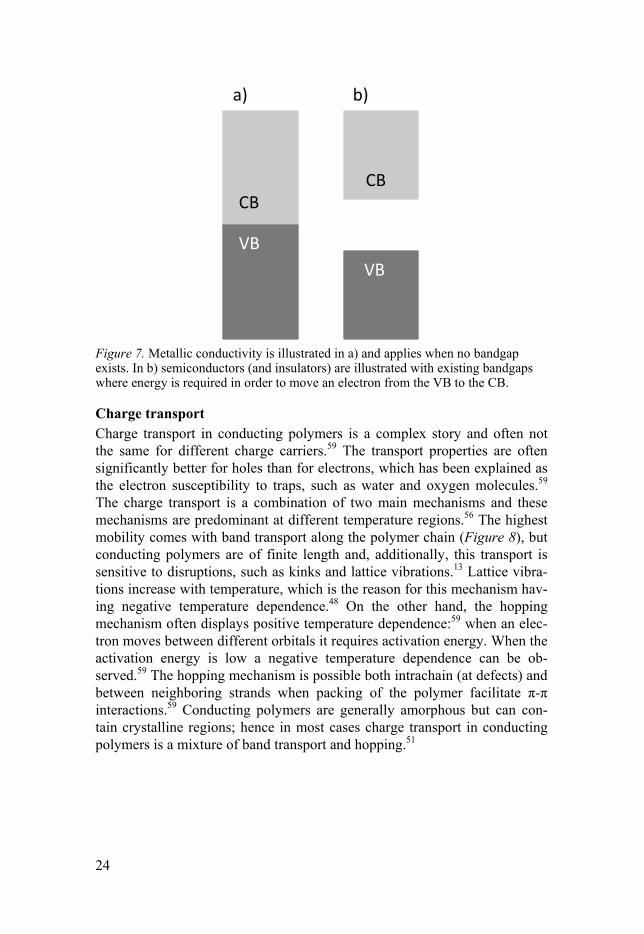
where is the flux of charges and is the applied electric field. is also the inverse of a materials resistivity, . The flux of charges, hence also the con-ductivity, is dependent on the number of charges and their mobility. The conductivity can be affected by temperature, where negative temperature dependence is connected to metallic conductivity. Many conducting poly-mers have positive temperature dependence, where an increase in tempera-ture is thought to increase the conductivity referred to as hopping, a mecha-nism which will be explained further on in the text. Metallic conductivity can still be obtained for conducting polymers and was first proven for doped polyaniline in 2006, though at extremely low temperatures not practical for most applications.55 Metallic conductivity, where the molecular orbitals overlap and produces delocalized electrons over the full length, is in theory expected for crystalline conjugated polymers.56 In reality, delocalization does in fact not occur due to repelling charges that hinders delocalization, and this is referred to as Peierls distortion. The repelling charges increase the energy of the lowest unoccupied molecular orbital (LUMO) and lowers the energy of the highest occupied molecular orbital (HOMO).57 Peierls distor-tion, or the electron localization, results in that a band gap (BG) will remain between the LUMO-level or conduction band (CB) and the HOMO-level or valence band (VB), as seen in Figure 7. Hence, conducting polymers are insulators in their neutral state.49
When the BG is too large to allow electrons to pass from the VB to the CB we need to remove (or add) electrons to form new energy levels between the VB and CB in the BG. As an electron is removed (or added) new states with unpaired electrons (polarons) or no electrons (bipolarons) are formed.44,
57, 58 The polaron and bipolaron charge carriers have two main mechanisms governing charge transport, namely band transport and hopping (interchain hopping and intrachain hopping).49
24
Figure 7. Metallic conductivity is illustrated in a) and applies when no bandgap exists. In b) semiconductors (and insulators) are illustrated with existing bandgaps where energy is required in order to move an electron from the VB to the CB.
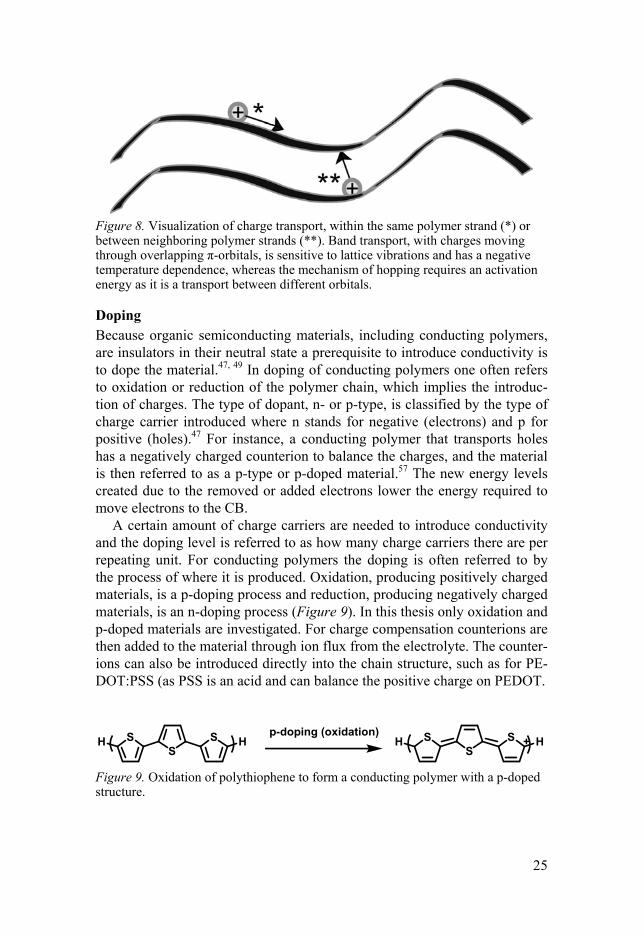
Charge transport Charge transport in conducting polymers is a complex story and often not the same for different charge carriers.59 The transport properties are often significantly better for holes than for electrons, which has been explained as the electron susceptibility to traps, such as water and oxygen molecules.59 The charge transport is a combination of two main mechanisms and these mechanisms are predominant at different temperature regions.56 The highest mobility comes with band transport along the polymer chain (Figure 8), but conducting polymers are of finite length and, additionally, this transport is sensitive to disruptions, such as kinks and lattice vibrations.13 Lattice vibra-tions increase with temperature, which is the reason for this mechanism hav-ing negative temperature dependence.48 On the other hand, the hopping mechanism often displays positive temperature dependence:59 when an elec-tron moves between different orbitals it requires activation energy. When the activation energy is low a negative temperature dependence can be ob-served.59 The hopping mechanism is possible both intrachain (at defects) and between neighboring strands when packing of the polymer facilitate π-π interactions.59 Conducting polymers are generally amorphous but can con-tain crystalline regions; hence in most cases charge transport in conducting polymers is a mixture of band transport and hopping.51
a) b)
CB
VB
CB
VB
25
Figure 8. Visualization of charge transport, within the same polymer strand (*) or between neighboring polymer strands (**). Band transport, with charges moving through overlapping π-orbitals, is sensitive to lattice vibrations and has a negative temperature dependence, whereas the mechanism of hopping requires an activation energy as it is a transport between different orbitals.
Doping Because organic semiconducting materials, including conducting polymers, are insulators in their neutral state a prerequisite to introduce conductivity is to dope the material.47, 49 In doping of conducting polymers one often refers to oxidation or reduction of the polymer chain, which implies the introduc-tion of charges. The type of dopant, n- or p-type, is classified by the type of charge carrier introduced where n stands for negative (electrons) and p for positive (holes).47 For instance, a conducting polymer that transports holes has a negatively charged counterion to balance the charges, and the material is then referred to as a p-type or p-doped material.57 The new energy levels created due to the removed or added electrons lower the energy required to move electrons to the CB.
A certain amount of charge carriers are needed to introduce conductivity and the doping level is referred to as how many charge carriers there are per repeating unit. For conducting polymers the doping is often referred to by the process of where it is produced. Oxidation, producing positively charged materials, is a p-doping process and reduction, producing negatively charged materials, is an n-doping process (Figure 9). In this thesis only oxidation and p-doped materials are investigated. For charge compensation counterions are then added to the material through ion flux from the electrolyte. The counter-ions can also be introduced directly into the chain structure, such as for PE-DOT:PSS (as PSS is an acid and can balance the positive charge on PEDOT.
Figure 9. Oxidation of polythiophene to form a conducting polymer with a p-doped structure.
SS S HH +
SSS HH
p-doping (oxidation)
26
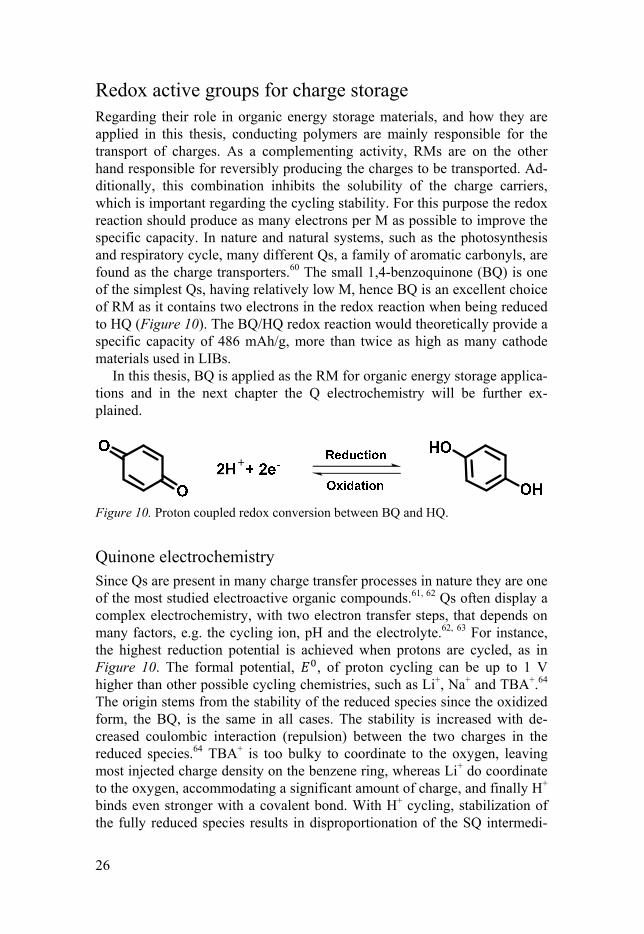
Redox active groups for charge storage Regarding their role in organic energy storage materials, and how they are applied in this thesis, conducting polymers are mainly responsible for the transport of charges. As a complementing activity, RMs are on the other hand responsible for reversibly producing the charges to be transported. Ad-ditionally, this combination inhibits the solubility of the charge carriers, which is important regarding the cycling stability. For this purpose the redox reaction should produce as many electrons per M as possible to improve the specific capacity. In nature and natural systems, such as the photosynthesis and respiratory cycle, many different Qs, a family of aromatic carbonyls, are found as the charge transporters.60 The small 1,4-benzoquinone (BQ) is one of the simplest Qs, having relatively low M, hence BQ is an excellent choice of RM as it contains two electrons in the redox reaction when being reduced to HQ (Figure 10). The BQ/HQ redox reaction would theoretically provide a specific capacity of 486 mAh/g, more than twice as high as many cathode materials used in LIBs.
In this thesis, BQ is applied as the RM for organic energy storage applica-tions and in the next chapter the Q electrochemistry will be further ex-plained.
Figure 10. Proton coupled redox conversion between BQ and HQ.
Quinone electrochemistry Since Qs are present in many charge transfer processes in nature they are one of the most studied electroactive organic compounds.61, 62 Qs often display a complex electrochemistry, with two electron transfer steps, that depends on many factors, e.g. the cycling ion, pH and the electrolyte.62, 63 For instance, the highest reduction potential is achieved when protons are cycled, as in Figure 10. The formal potential, , of proton cycling can be up to 1 V higher than other possible cycling chemistries, such as Li+, Na+ and TBA+.64 The origin stems from the stability of the reduced species since the oxidized form, the BQ, is the same in all cases. The stability is increased with de-creased coulombic interaction (repulsion) between the two charges in the reduced species.64 TBA+ is too bulky to coordinate to the oxygen, leaving most injected charge density on the benzene ring, whereas Li+ do coordinate to the oxygen, accommodating a significant amount of charge, and finally H+ binds even stronger with a covalent bond. With H+ cycling, stabilization of the fully reduced species results in disproportionation of the SQ intermedi-
27
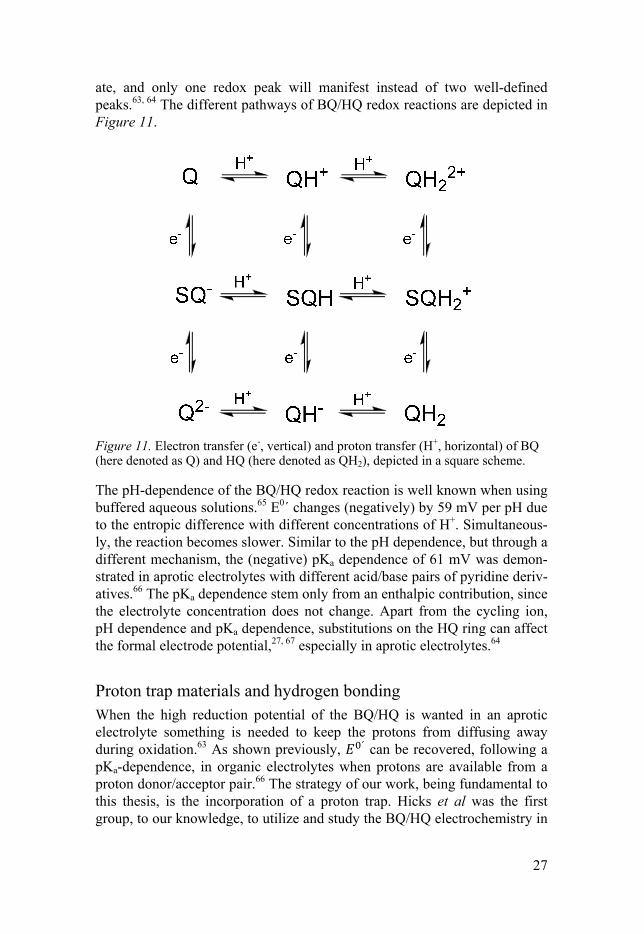
ate, and only one redox peak will manifest instead of two well-defined peaks.63, 64 The different pathways of BQ/HQ redox reactions are depicted in Figure 11.
Figure 11. Electron transfer (e-, vertical) and proton transfer (H+, horizontal) of BQ (here denoted as Q) and HQ (here denoted as QH2), depicted in a square scheme.
The pH-dependence of the BQ/HQ redox reaction is well known when using buffered aqueous solutions.65 E0´ changes (negatively) by 59 mV per pH due to the entropic difference with different concentrations of H+. Simultaneous-ly, the reaction becomes slower. Similar to the pH dependence, but through a different mechanism, the (negative) pKa dependence of 61 mV was demon-strated in aprotic electrolytes with different acid/base pairs of pyridine deriv-atives.66 The pKa dependence stem only from an enthalpic contribution, since the electrolyte concentration does not change. Apart from the cycling ion, pH dependence and pKa dependence, substitutions on the HQ ring can affect the formal electrode potential,27, 67 especially in aprotic electrolytes.64
Proton trap materials and hydrogen bonding When the high reduction potential of the BQ/HQ is wanted in an aprotic electrolyte something is needed to keep the protons from diffusing away during oxidation.63 As shown previously, ´ can be recovered, following a pKa-dependence, in organic electrolytes when protons are available from a proton donor/acceptor pair.66 The strategy of our work, being fundamental to this thesis, is the incorporation of a proton trap. Hicks et al was the first group, to our knowledge, to utilize and study the BQ/HQ electrochemistry in
28
aprotic electrolytes through a larger molecule in which pyridine was cova-lently attached on two sides of a HQ aromatic ring.68 In their work they demonstrated a reversible redox reaction for the molecule in TBAPF6/MeCN, comparable to the apparent single wave of two close con-secutive 1e- 1H+ transfer steps of BQ/HQ (going from the top left to the bot-tom right in Figure 11) under buffered aqueous conditions. The apparent single ´ originates from the lowering in energy of the second electron transfer due to hydrogen bonding (described as hydrogen bonded electron transfer).60, 65 This is different than the two separated waves normally seen for BQ in aprotic electrolytes where the SQ is stabilized.65, 69 The hydrogen bond lowers the energy of the second reduction of the BQ (Q-/Q2- in Figure 11), bringing the two waves closer together (the peak to peak separation is calculated in water to be 37 mV).65 Hicks et al also found that the pKa of the covalently attached base had an opposite effect on ´ compared to the study by Emanuelsson et al, where pyridine as proton acceptor was dissolved in the electrolyte and resulted in a higher ´ of the BQ/HQ the higher the pKa of the pyridine. But, as substitutions on the HQ ring also affect ´ it is a difficult task to determine exactly what pKa value both the pyridine and HQ moieties actually have.
When protons stay in the material as it is charged (during oxidation) counterions (anions) are cycled into the material for charge compensation. Hence, the Q manifests proton cycling, but the cycling ion of the whole ma-terial is the charge compensating anion from the electrolyte.
CRPs One way to achieve the wanted properties of a battery material from organic molecules is to use a conducting polymer backbone in combination with a RM as pendant group (PG). In this way the properties of conductivity and insolubility brought by the polymer backbone can be utilized together with the capacity of the RM in the same polymer. For this combination to be ap-plicable it is vital that the two parts are redox matched, meaning the polymer must be conducting over the whole redox process.18, 67 It is important to be aware of that adding substituents or by using an unsuitable linker unit to the RM the torsion angle can be affected as well as the packing and π-π overlap in and between chains, which might affect the conductivity,16, 70 hence the conductance window is often not the same for a conducting polymer on its own as when applied as backbone in a CRP.27, 35 Additionally, one also needs to have a matching electrolyte system, in which the ion transport is fast enough for the energy storage material to cycle reversibly at a reasonable scan rate and where the electrolyte is stable over the potential region applied, to get a fully viable system for practical applications.

29
Redox matching Important for the two functionalities is that redox matching is achieved, meaning that the backbone must provide conductivity in the potential region of the PG redox process; otherwise the electrons will not reach the current collector. For instance, substitutions can affect the conductance and redox matching by electronic interactions or twisting.70-72 Conductance measure-ment by IDA is a suitable method to assess redox matching, and this method will be explained in the next chapter.
30
5. Electrochemistry
The rise of electrochemistry can be assigned to Luigi Galvani with his work on electric responses in animals and the Galvanic cell.73 Shortly thereafter Volta proposed the first battery (the electric pile), and subsequently water electrolysis, electroplating and thermoelectricity were discovered.20, 74-76 After Georg Ohm (Equation 6) and Michael Faraday (Equation 7) had stated their fundamental laws around 1830, the electrochemical cell was developed further by John Daniell.76 Faraday and Daniell are seen as the fathers of elec-trochemistry, although experiments connected to electrochemistry, such as electromagnetism and static electricity, have been documented since the 16th century. Electrochemistry is primarily used as a means to produce electricity (i.e. current) or as a driving force for chemical reactions:
/ (6)
where is the current, is the resistance and (also referred to as ) is the voltage. Faraday proposed that77:
the amount of chemical change produced by current at an electrode-electrolyte boundary is proportional to the quantity of electricity used,
and:
the amounts of chemical changes produced by the same quantity of electricity in different substances are proportional to their equivalent weights.
From the meaning of these statements, it implies that the mass of a com-pound and the loss or gain of electrons is related to the change in electricity. The quantity of this electricity change is one Faraday, (C/V), per mole electrons:
∗ (7)
where is the Avogadro constant (mol-1) and is the elementary charge of one electron (1.602*10-19 C).
31
Electron transfer reactions, as the general redox reaction in Equation 3, are governed by Faradays law and are referred to as faradaic processes, and for these reactions standard electrode potentials, , apply. is defined for each reaction at equilibrium (all activities at unity) during standard condi-tions. The half reactions in Equation 1 and Equation 2 each provide a reac-tion potential and , respectively, relative to the standard hydrogen electrode (SHE). As the half reactions combine into the redox re-action in Equation 3 also a combined reaction potential, , can be constructed:
(8)
The resulting , i.e. the potential required to drive the reaction, can be positive or negative depending on the direction and is governed by the standard Gibbs free energy, (Equation 9):
∆ (9)
For a reversible electrochemical process at equilibrium, based on changes in , Nernst equation was derived (Equation 10).20 This equation relates to
the formal potential, ´, with the activities of the species undergoing re-duction and oxidation:
´= + ln
(10)
where is the gas constant and is the temperature. For dissolved species the activities are usually unknown and the bulk concentrations are generally applied instead of .
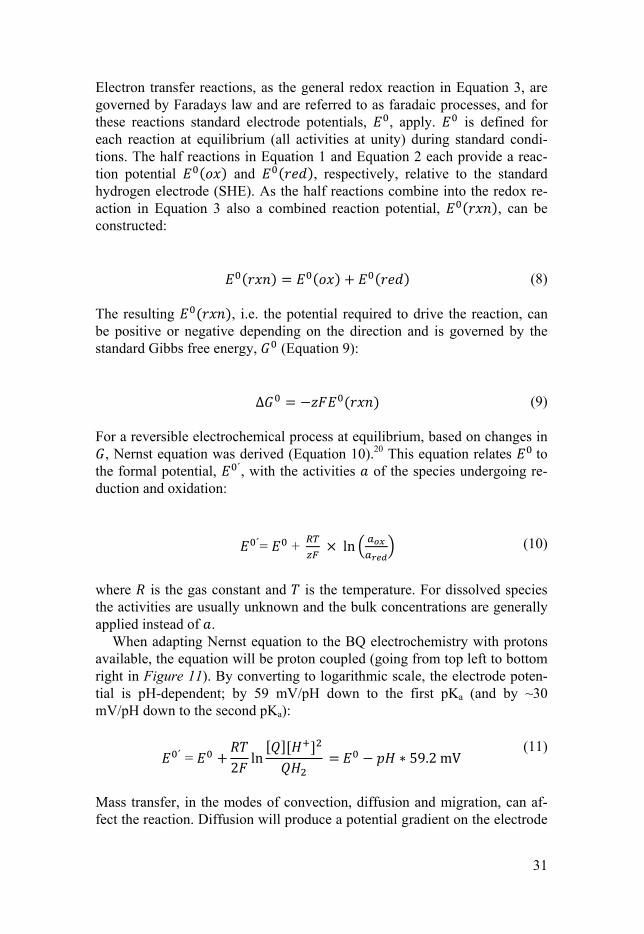
When adapting Nernst equation to the BQ electrochemistry with protons available, the equation will be proton coupled (going from top left to bottom right in Figure 11). By converting to logarithmic scale, the electrode poten-tial is pH-dependent; by 59 mV/pH down to the first pKa (and by ~30 mV/pH down to the second pKa):
´ =
2ln ∗ 59.2mV
(11)
Mass transfer, in the modes of convection, diffusion and migration, can af-fect the reaction. Diffusion will produce a potential gradient on the electrode
32
surface, called the diffusion layer, which results in that an overpotential is needed to reach the whole material. If the electron transfer kinetics are fast the species at the surface can be viewed as having the same concentration as the bulk concentration. Then we will have a Nernstian reaction as the species will be at equilibrium with the potential of the electrode.
Other processes that occur on an electrode and give rise to a current re-sponse without applying electron transfer are called non-faradaic. Non-faradaic processes can affect the interface and consume current as an effect of changed structure, surface and solution composition. For instance, the processes that govern capacitors and intercalation electrodes, such as the anodes applied in LIBs, are non-faradaic.
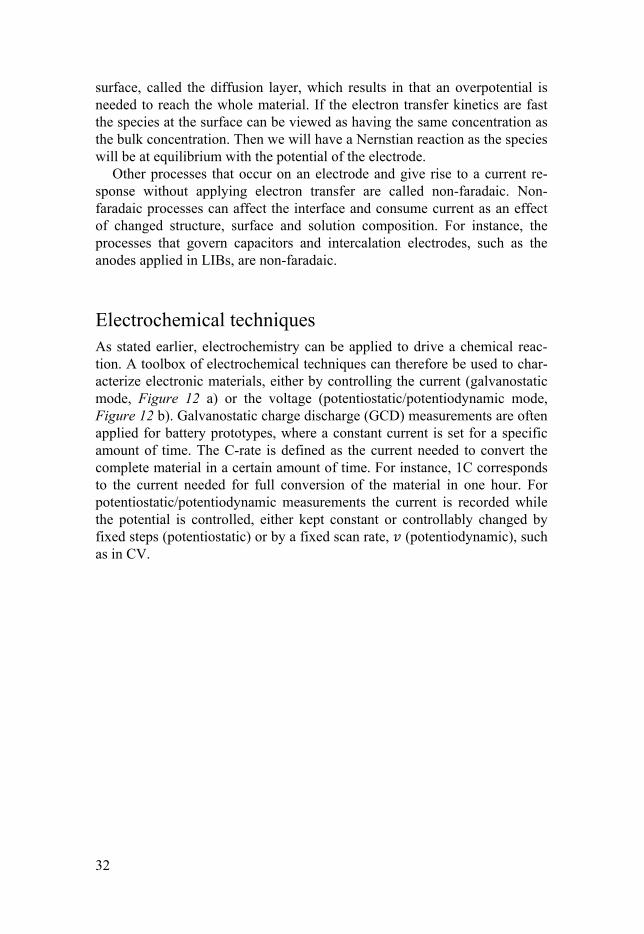
Electrochemical techniques As stated earlier, electrochemistry can be applied to drive a chemical reac-tion. A toolbox of electrochemical techniques can therefore be used to char-acterize electronic materials, either by controlling the current (galvanostatic mode, Figure 12 a) or the voltage (potentiostatic/potentiodynamic mode, Figure 12 b). Galvanostatic charge discharge (GCD) measurements are often applied for battery prototypes, where a constant current is set for a specific amount of time. The C-rate is defined as the current needed to convert the complete material in a certain amount of time. For instance, 1C corresponds to the current needed for full conversion of the material in one hour. For potentiostatic/potentiodynamic measurements the current is recorded while the potential is controlled, either kept constant or controllably changed by fixed steps (potentiostatic) or by a fixed scan rate, (potentiodynamic), such as in CV.
33
Figure 12. Illustrated responses of different electrochemical techniques. a) A gal-vanostatic charge discharge curve, at a constant current, and b) a potentiodynamic measurement, CV, displaying an oxidation and reduction scan in which the potential is changed stepwise by a fixed scan rate.
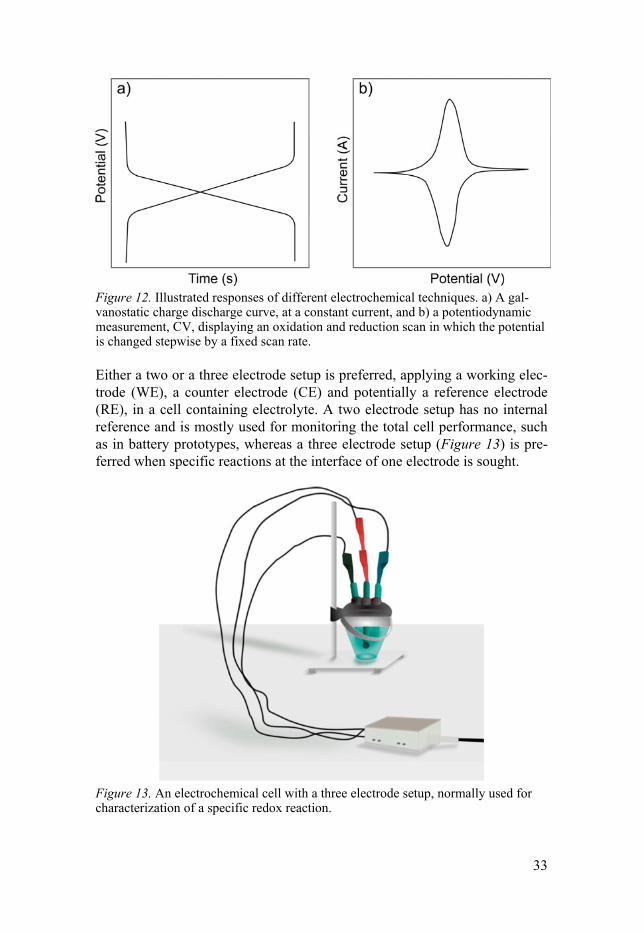
Either a two or a three electrode setup is preferred, applying a working elec-trode (WE), a counter electrode (CE) and potentially a reference electrode (RE), in a cell containing electrolyte. A two electrode setup has no internal reference and is mostly used for monitoring the total cell performance, such as in battery prototypes, whereas a three electrode setup (Figure 13) is pre-ferred when specific reactions at the interface of one electrode is sought.
Figure 13. An electrochemical cell with a three electrode setup, normally used for characterization of a specific redox reaction.
34
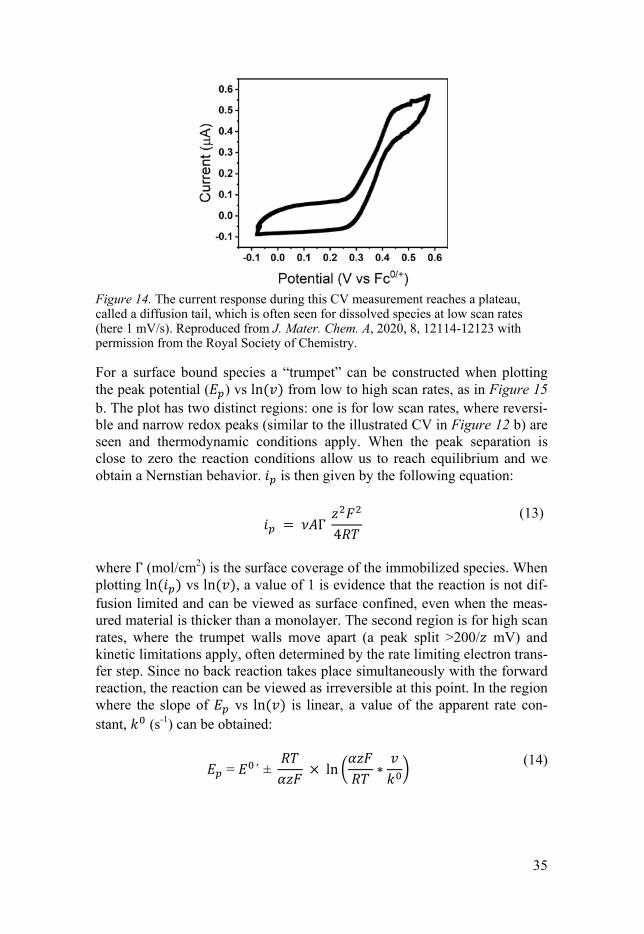
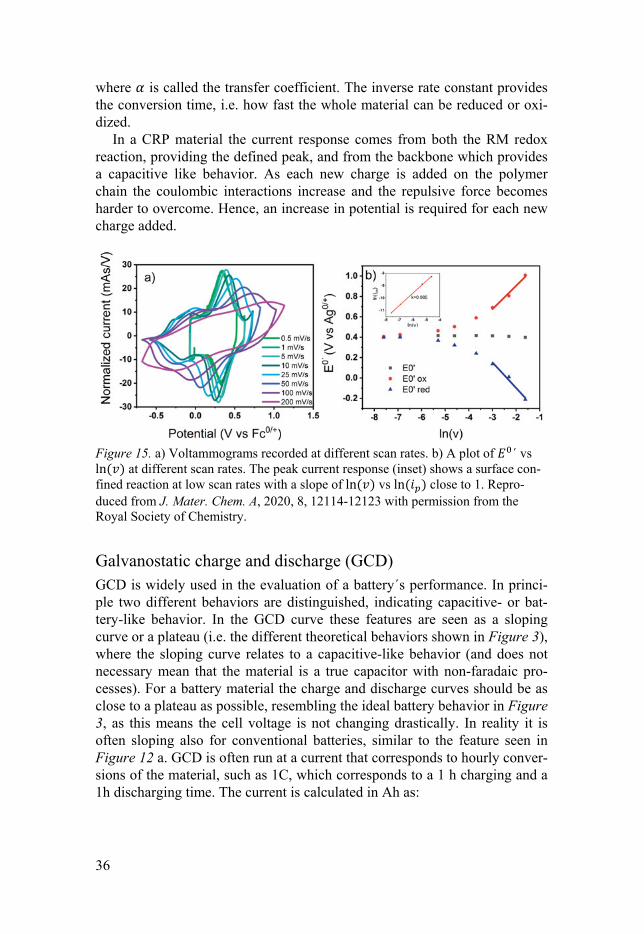
CV and scan rate dependence CV is a versatile method used frequently in electrochemical experiments as it is easy to use and can provide a lot of information by a simple setup. It is a potentiodynamic method, where the potential is changed stepwise by a set (in V/s), and the current response is monitored (Figure 12 b). When sweep-ing towards more positive potentials oxidation reactions take place at the WE, whereas reduction reactions take place during the reverse sweep to-wards more negative potentials. For a reversible redox reaction the oxidation peak ( ) and the reduction peak ( ) should be of equal size. By record-ing the current response and at many different scan rates, such as in Fig-ure 15, one can for instance determine if and where a reaction can be ap-proximated to Nernst reaction. This is referred to as the scan rate depend-ence and the method is used both for adsorbed species and for dissolved species. When Nernst equation cannot be approximated, kinetic limitations apply.
For a dissolved species, diffusion limitations generally apply, as these species need to reach the WE from the bulk, hence a diffusion tail, becoming longer with decreasing , is characteristic (Figure 14). The peak current ( ) is then proportional to / as
0.4463
/
(12)
where (cm2) is the area of the electrode, (cm2/s) is the diffusion coeffi-cient and is the molar concentration (mol/cm3) of the dissolved species. A plot of ln vs ln should have a slope of 0.5. This relationship applies not only to dissolved species but to all species restricted by diffusion limita-tions (regarding e.g. counterions, electron transport, proton transport), which is often the case when applying thick films on the electrode surface.
35
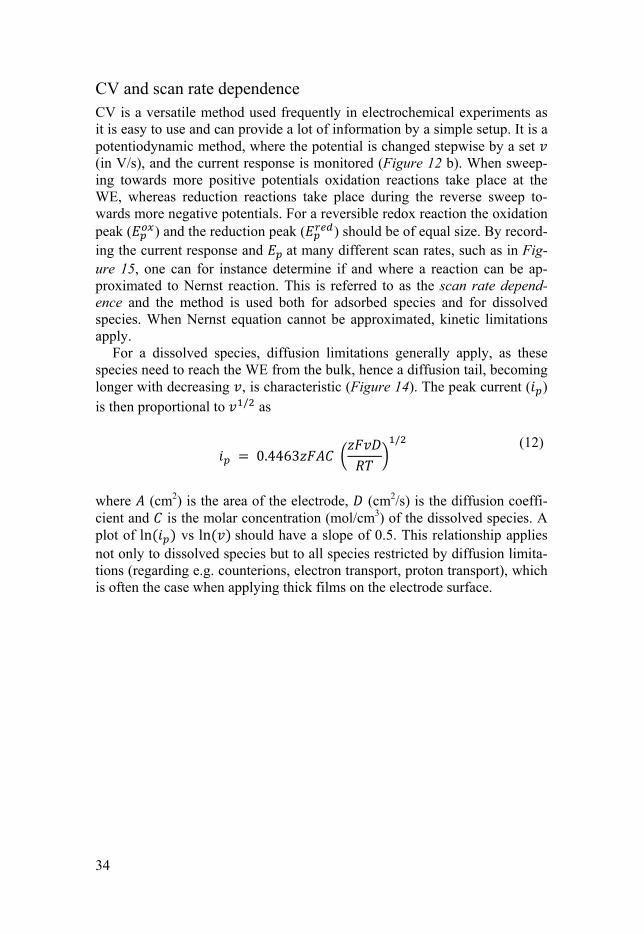
Figure 14. The current response during this CV measurement reaches a plateau, called a diffusion tail, which is often seen for dissolved species at low scan rates (here 1 mV/s). Reproduced from J. Mater. Chem. A, 2020, 8, 12114-12123 with permission from the Royal Society of Chemistry.
For a surface bound species a “trumpet” can be constructed when plotting the peak potential ( ) vs ln from low to high scan rates, as in Figure 15 b. The plot has two distinct regions: one is for low scan rates, where reversi-ble and narrow redox peaks (similar to the illustrated CV in Figure 12 b) are seen and thermodynamic conditions apply. When the peak separation is close to zero the reaction conditions allow us to reach equilibrium and we obtain a Nernstian behavior. is then given by the following equation:
Г
4
(13)
where Г (mol/cm2) is the surface coverage of the immobilized species. When plotting ln vs ln , a value of 1 is evidence that the reaction is not dif-fusion limited and can be viewed as surface confined, even when the meas-ured material is thicker than a monolayer. The second region is for high scan rates, where the trumpet walls move apart (a peak split >200/ mV) and kinetic limitations apply, often determined by the rate limiting electron trans-fer step. Since no back reaction takes place simultaneously with the forward reaction, the reaction can be viewed as irreversible at this point. In the region where the slope of vs ln is linear, a value of the apparent rate con-stant, (s-1) can be obtained:
= ´ ± ln ∗
(14)
36
where is called the transfer coefficient. The inverse rate constant provides the conversion time, i.e. how fast the whole material can be reduced or oxi-dized.
In a CRP material the current response comes from both the RM redox reaction, providing the defined peak, and from the backbone which provides a capacitive like behavior. As each new charge is added on the polymer chain the coulombic interactions increase and the repulsive force becomes harder to overcome. Hence, an increase in potential is required for each new charge added.
Figure 15. a) Voltammograms recorded at different scan rates. b) A plot of ´ vs ln at different scan rates. The peak current response (inset) shows a surface con-fined reaction at low scan rates with a slope of ln vs ln close to 1. Repro-duced from J. Mater. Chem. A, 2020, 8, 12114-12123 with permission from the Royal Society of Chemistry.
Galvanostatic charge and discharge (GCD) GCD is widely used in the evaluation of a battery´s performance. In princi-ple two different behaviors are distinguished, indicating capacitive- or bat-tery-like behavior. In the GCD curve these features are seen as a sloping curve or a plateau (i.e. the different theoretical behaviors shown in Figure 3), where the sloping curve relates to a capacitive-like behavior (and does not necessary mean that the material is a true capacitor with non-faradaic pro-cesses). For a battery material the charge and discharge curves should be as close to a plateau as possible, resembling the ideal battery behavior in Figure 3, as this means the cell voltage is not changing drastically. In reality it is often sloping also for conventional batteries, similar to the feature seen in Figure 12 a. GCD is often run at a current that corresponds to hourly conver-sions of the material, such as 1C, which corresponds to a 1 h charging and a 1h discharging time. The current is calculated in Ah as:
37
1 ∗
3600
(15)
where (g) is the mass of the material.
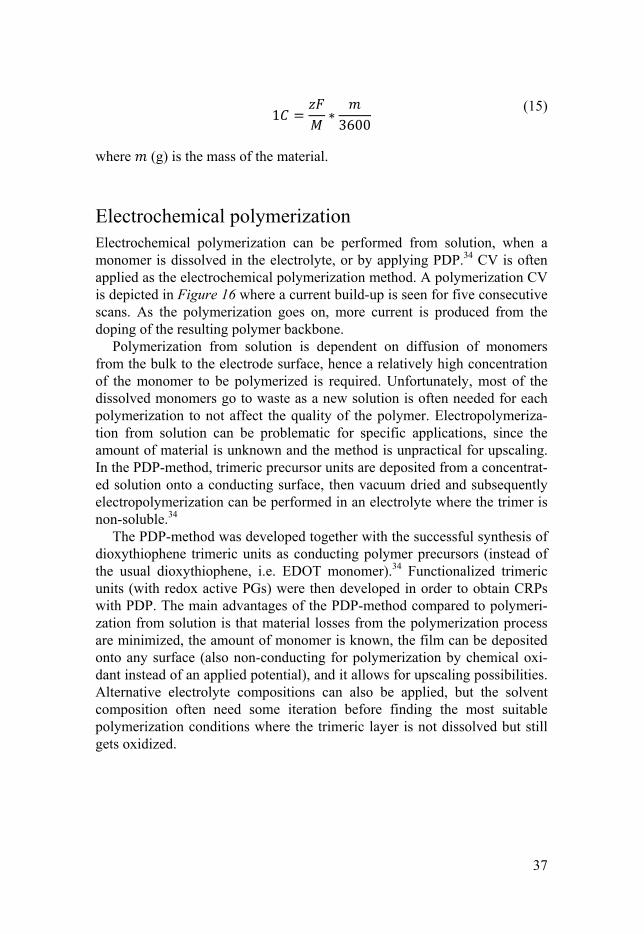
Electrochemical polymerization Electrochemical polymerization can be performed from solution, when a monomer is dissolved in the electrolyte, or by applying PDP.34 CV is often applied as the electrochemical polymerization method. A polymerization CV is depicted in Figure 16 where a current build-up is seen for five consecutive scans. As the polymerization goes on, more current is produced from the doping of the resulting polymer backbone.
Polymerization from solution is dependent on diffusion of monomers from the bulk to the electrode surface, hence a relatively high concentration of the monomer to be polymerized is required. Unfortunately, most of the dissolved monomers go to waste as a new solution is often needed for each polymerization to not affect the quality of the polymer. Electropolymeriza-tion from solution can be problematic for specific applications, since the amount of material is unknown and the method is unpractical for upscaling. In the PDP-method, trimeric precursor units are deposited from a concentrat-ed solution onto a conducting surface, then vacuum dried and subsequently electropolymerization can be performed in an electrolyte where the trimer is non-soluble.34
The PDP-method was developed together with the successful synthesis of dioxythiophene trimeric units as conducting polymer precursors (instead of the usual dioxythiophene, i.e. EDOT monomer).34 Functionalized trimeric units (with redox active PGs) were then developed in order to obtain CRPs with PDP. The main advantages of the PDP-method compared to polymeri-zation from solution is that material losses from the polymerization process are minimized, the amount of monomer is known, the film can be deposited onto any surface (also non-conducting for polymerization by chemical oxi-dant instead of an applied potential), and it allows for upscaling possibilities. Alternative electrolyte compositions can also be applied, but the solvent composition often need some iteration before finding the most suitable polymerization conditions where the trimeric layer is not dissolved but still gets oxidized.
38
Figure 16. Polymerization of monomers from solution (10 mM in 0.1 M TBAPF6/MeCN).
In situ characterizations Combined with electrochemical measurements in situ techniques can be applied to monitor (potential- or current dependent) time resolved changes. The main targets of investigation (and the in situ techniques applied) in this thesis are conductivity, mass changes, electronic transitions and structural changes.
Conductivity Conductivity is of utmost importance for a material that is to be used in elec-trochemical applications, such as in batteries. Without conductivity no charges can be transported and the wanted redox reactions will be lost. When dimensions of the studied material are unknown the conductivity cannot be specified and instead conductance, the extrinsic property, is measured.78 The measurements can be performed under different conditions, such as in vari-ous temperatures, as to evaluate the activation barrier for charge transport, or in different media, for instance to evaluate the dopant ion or solvent effect.
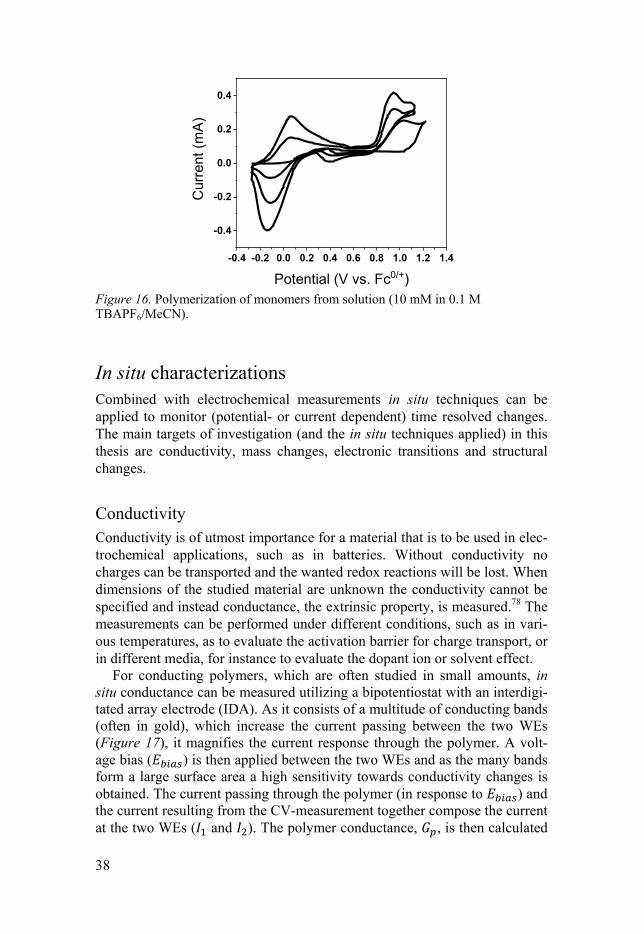
For conducting polymers, which are often studied in small amounts, in situ conductance can be measured utilizing a bipotentiostat with an interdigi-tated array electrode (IDA). As it consists of a multitude of conducting bands (often in gold), which increase the current passing between the two WEs (Figure 17), it magnifies the current response through the polymer. A volt-age bias ( ) is then applied between the two WEs and as the many bands form a large surface area a high sensitivity towards conductivity changes is obtained. The current passing through the polymer (in response to ) and the current resulting from the CV-measurement together compose the current at the two WEs ( and ). The polymer conductance, , is then calculated
-0.4 -0.2 0.0 0.2 0.4 0.6 0.8 1.0 1.2 1.4
-0.4
-0.2
0.0
0.2
0.4
Cur
rent
(m
A)
Potential (V vs. Fc0/+)
39
through Equation 16, where corresponds to the current difference be-tween and .
I2
(16)
A corresponding CV profile of the polymer redox conversion can be con-structed using the sum of currents ( and ), which corresponds to the cur-rent to and from the CE. When applying electrochemical polymerization the polymer build up can be monitored, as the conductance is elevated when the polymer connects WE 1 and 2. Further, the conductivity of the constructed polymer can then be monitored during potential scanning as to see the dop-ing onset.
Figure 17. Bipotentiostatic conductance measurements using an IDA electrode. During polymerization the conductance, derived from the bias current, often corre-lates with a color change (the polymer is often black).
Electrochemical quartz crystal microbalance (EQCM) EQCM is a sensitive in situ technique that measures minute changes in fre-quency during electrochemical experiments with the use of a metal (usually gold) coated quartz crystal electrode. This method can be applied for thin films where a uniform thickness is assumed and it can monitor very small mass changes. The mass changes are converted from the frequency change, as described by Sauerbrey,79 through Equation 17:
∆ = ∆
2
(17)
40
where is the mass change, is the measured frequency change, is the reference frequency, the area of the active surface, is the quartz crystal density, and is the AT-cut quartz constant. Combined with an electrochemical method, such as CV, EQCM can be applied to define what M per charge that is adsorbed/released over specific regions of interests (e.g. over the doping region or during a specific redox reaction). These specific mass changes can originate from counter ion uptake, exchange of ions and/or solvent between the film and the electrolyte, or the deposition or dissolution of a film. For Equation 17 to be valid the measured film must be thin and uniform, and be assumed to not deform under pressure.
Ultraviolet-visible spectroscopy (UV/Vis) UV/Vis is a tool to monitor species that absorb UV and visible light. These species are often organic molecules that contain double bonds, as double bonds can provide electronic transitions with the energy corresponding to the UV/Vis wavelengths. In UV/Vis the absorbed wavelength corresponds to the energy difference between the HOMO and the LUMO in a molecule, or be-tween the VB and the CB in a polymer. As the energy is inversely propor-tional to the wavelength, the higher in energy the shorter the wavelength:
/ (18)
where is the Plancks constant, is the speed of light and is the wave-length.
With in situ spectroscopy one can visualize what bonds are changing (e.g. forming and breaking) during an electrochemical measurement.
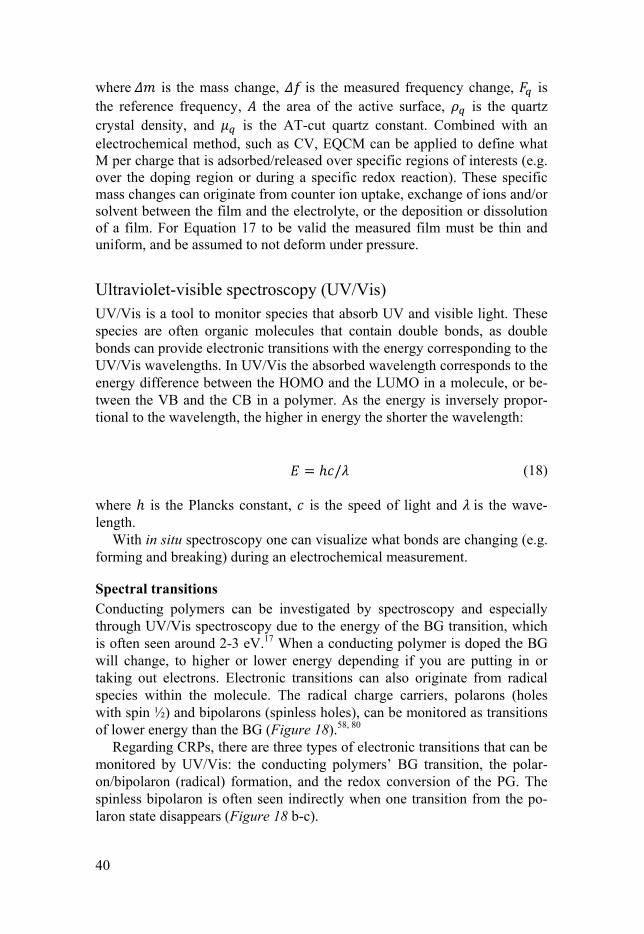
Spectral transitions Conducting polymers can be investigated by spectroscopy and especially through UV/Vis spectroscopy due to the energy of the BG transition, which is often seen around 2-3 eV.17 When a conducting polymer is doped the BG will change, to higher or lower energy depending if you are putting in or taking out electrons. Electronic transitions can also originate from radical species within the molecule. The radical charge carriers, polarons (holes with spin ½) and bipolarons (spinless holes), can be monitored as transitions of lower energy than the BG (Figure 18).58, 80
Regarding CRPs, there are three types of electronic transitions that can be monitored by UV/Vis: the conducting polymers’ BG transition, the polar-on/bipolaron (radical) formation, and the redox conversion of the PG. The spinless bipolaron is often seen indirectly when one transition from the po-laron state disappears (Figure 18 b-c).
41
Figure 18. Spectral transitions of conducting polymers. a) Neutral (undoped) poly-mer with only one transition, the BG (*). b) When electrons are removed from the VB unpaired electrons are left at new energy levels closer to the CB and holes are created as charge carriers. Holes have spin ½ and two spectral transitions (**) apart from the BG that can be monitored by UV/Vis. c) After a certain amount of doping nearby holes recombine to form bipolarons, which are spinless charge carriers. The-se species have only one spectral transition, meaning that one transition compared to the polaron state is lost.
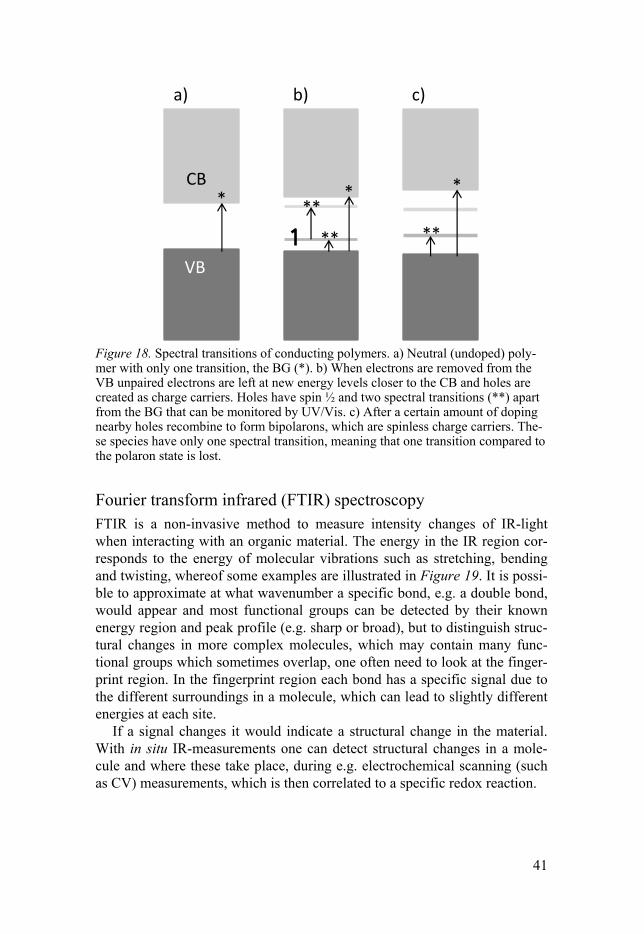
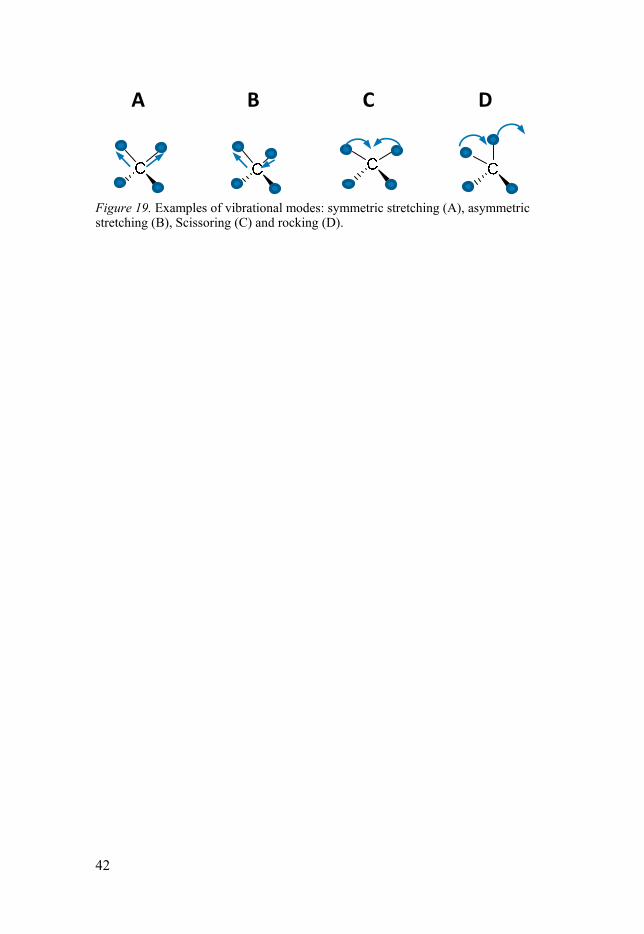
Fourier transform infrared (FTIR) spectroscopy FTIR is a non-invasive method to measure intensity changes of IR-light when interacting with an organic material. The energy in the IR region cor-responds to the energy of molecular vibrations such as stretching, bending and twisting, whereof some examples are illustrated in Figure 19. It is possi-ble to approximate at what wavenumber a specific bond, e.g. a double bond, would appear and most functional groups can be detected by their known energy region and peak profile (e.g. sharp or broad), but to distinguish struc-tural changes in more complex molecules, which may contain many func-tional groups which sometimes overlap, one often need to look at the finger-print region. In the fingerprint region each bond has a specific signal due to the different surroundings in a molecule, which can lead to slightly different energies at each site.
If a signal changes it would indicate a structural change in the material. With in situ IR-measurements one can detect structural changes in a mole-cule and where these take place, during e.g. electrochemical scanning (such as CV) measurements, which is then correlated to a specific redox reaction.
a)
CB
VB
b) c)
*
**
**
**
**
42
Figure 19. Examples of vibrational modes: symmetric stretching (A), asymmetric stretching (B), Scissoring (C) and rocking (D).
A B C D
43
6. Proton trap materials – enabling proton cycling in aprotic environments
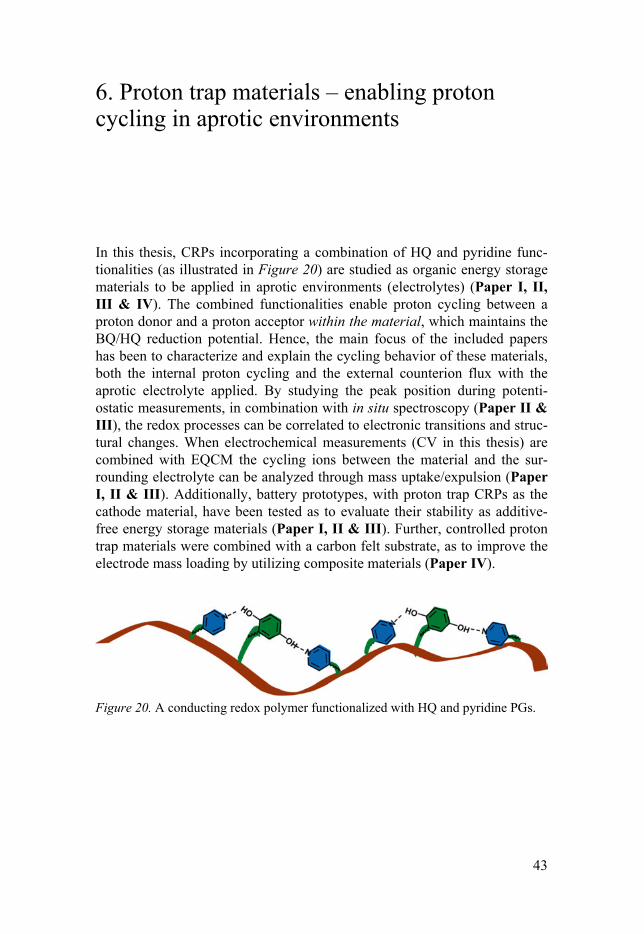
In this thesis, CRPs incorporating a combination of HQ and pyridine func-tionalities (as illustrated in Figure 20) are studied as organic energy storage materials to be applied in aprotic environments (electrolytes) (Paper I, II, III & IV). The combined functionalities enable proton cycling between a proton donor and a proton acceptor within the material, which maintains the BQ/HQ reduction potential. Hence, the main focus of the included papers has been to characterize and explain the cycling behavior of these materials, both the internal proton cycling and the external counterion flux with the aprotic electrolyte applied. By studying the peak position during potenti-ostatic measurements, in combination with in situ spectroscopy (Paper II & III), the redox processes can be correlated to electronic transitions and struc-tural changes. When electrochemical measurements (CV in this thesis) are combined with EQCM the cycling ions between the material and the sur-rounding electrolyte can be analyzed through mass uptake/expulsion (Paper I, II & III). Additionally, battery prototypes, with proton trap CRPs as the cathode material, have been tested as to evaluate their stability as additive-free energy storage materials (Paper I, II & III). Further, controlled proton trap materials were combined with a carbon felt substrate, as to improve the electrode mass loading by utilizing composite materials (Paper IV).
Figure 20. A conducting redox polymer functionalized with HQ and pyridine PGs.
44
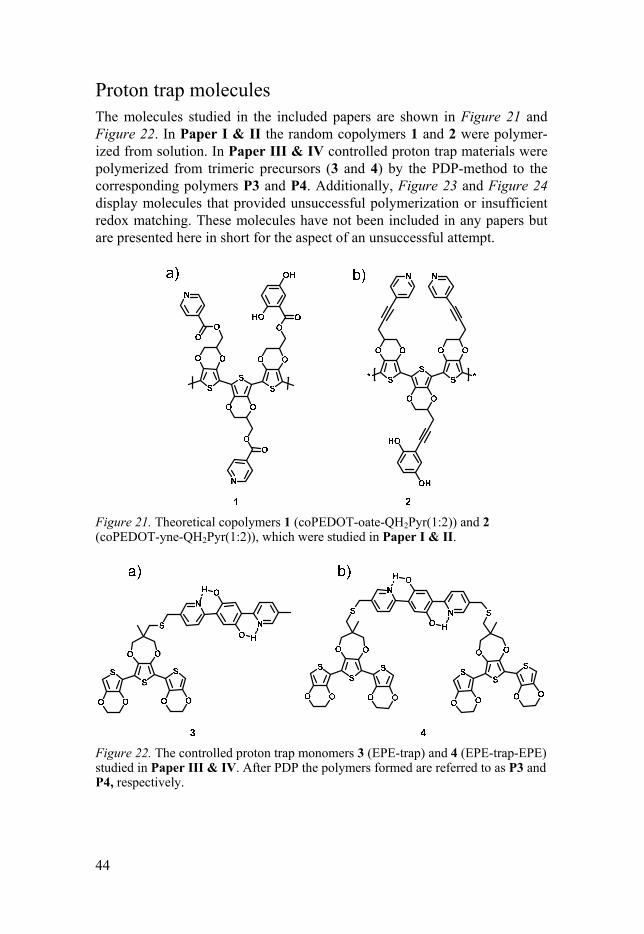
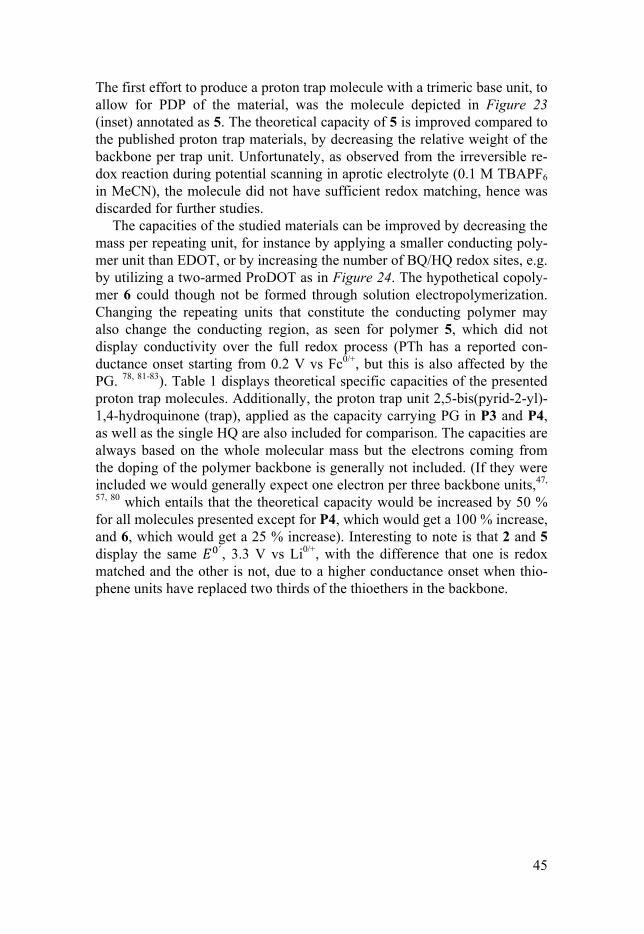
Proton trap molecules The molecules studied in the included papers are shown in Figure 21 and Figure 22. In Paper I & II the random copolymers 1 and 2 were polymer-ized from solution. In Paper III & IV controlled proton trap materials were polymerized from trimeric precursors (3 and 4) by the PDP-method to the corresponding polymers P3 and P4. Additionally, Figure 23 and Figure 24 display molecules that provided unsuccessful polymerization or insufficient redox matching. These molecules have not been included in any papers but are presented here in short for the aspect of an unsuccessful attempt.
Figure 21. Theoretical copolymers 1 (coPEDOT-oate-QH2Pyr(1:2)) and 2 (coPEDOT-yne-QH2Pyr(1:2)), which were studied in Paper I & II.
Figure 22. The controlled proton trap monomers 3 (EPE-trap) and 4 (EPE-trap-EPE) studied in Paper III & IV. After PDP the polymers formed are referred to as P3 and P4, respectively.
45
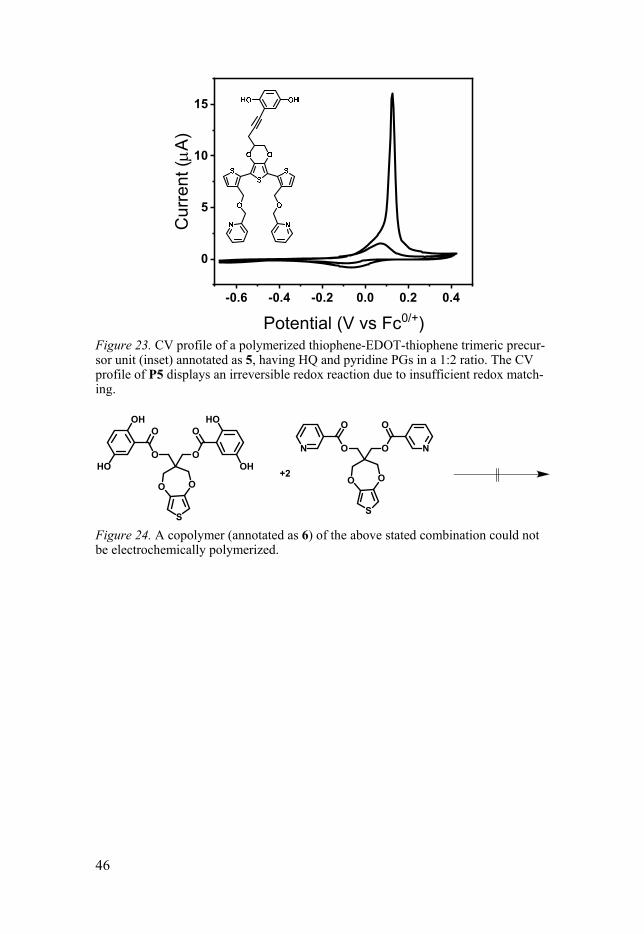
The first effort to produce a proton trap molecule with a trimeric base unit, to allow for PDP of the material, was the molecule depicted in Figure 23 (inset) annotated as 5. The theoretical capacity of 5 is improved compared to the published proton trap materials, by decreasing the relative weight of the backbone per trap unit. Unfortunately, as observed from the irreversible re-dox reaction during potential scanning in aprotic electrolyte (0.1 M TBAPF6 in MeCN), the molecule did not have sufficient redox matching, hence was discarded for further studies.
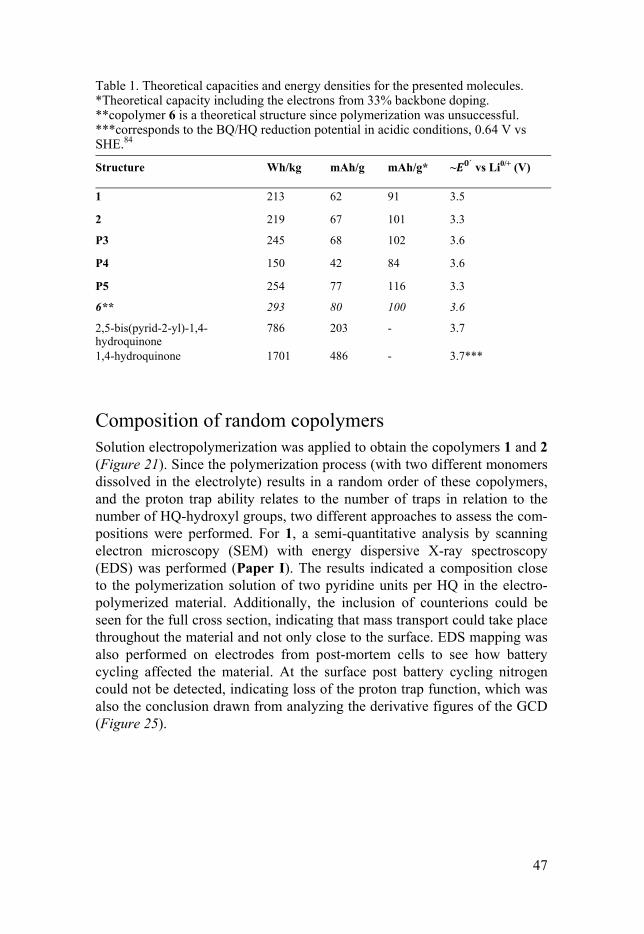
The capacities of the studied materials can be improved by decreasing the mass per repeating unit, for instance by applying a smaller conducting poly-mer unit than EDOT, or by increasing the number of BQ/HQ redox sites, e.g. by utilizing a two-armed ProDOT as in Figure 24. The hypothetical copoly-mer 6 could though not be formed through solution electropolymerization. Changing the repeating units that constitute the conducting polymer may also change the conducting region, as seen for polymer 5, which did not display conductivity over the full redox process (PTh has a reported con-ductance onset starting from 0.2 V vs Fc0/+, but this is also affected by the PG. 78, 81-83). Table 1 displays theoretical specific capacities of the presented proton trap molecules. Additionally, the proton trap unit 2,5-bis(pyrid-2-yl)-1,4-hydroquinone (trap), applied as the capacity carrying PG in P3 and P4, as well as the single HQ are also included for comparison. The capacities are always based on the whole molecular mass but the electrons coming from the doping of the polymer backbone is generally not included. (If they were included we would generally expect one electron per three backbone units,47,
57, 80 which entails that the theoretical capacity would be increased by 50 % for all molecules presented except for P4, which would get a 100 % increase, and 6, which would get a 25 % increase). Interesting to note is that 2 and 5 display the same ´, 3.3 V vs Li0/+, with the difference that one is redox matched and the other is not, due to a higher conductance onset when thio-phene units have replaced two thirds of the thioethers in the backbone.
46
Figure 23. CV profile of a polymerized thiophene-EDOT-thiophene trimeric precur-sor unit (inset) annotated as 5, having HQ and pyridine PGs in a 1:2 ratio. The CV profile of P5 displays an irreversible redox reaction due to insufficient redox match-ing.
Figure 24. A copolymer (annotated as 6) of the above stated combination could not be electrochemically polymerized.
-0.6 -0.4 -0.2 0.0 0.2 0.4
0
5
10
15
Cur
rent
(A
)
Potential (V vs Fc0/+)
S
O O
O O
OOOH
HO
HO
OH
S
O O
O O
OO
NN
+2
47
Table 1. Theoretical capacities and energy densities for the presented molecules. *Theoretical capacity including the electrons from 33% backbone doping. **copolymer 6 is a theoretical structure since polymerization was unsuccessful. ***corresponds to the BQ/HQ reduction potential in acidic conditions, 0.64 V vs SHE.84
Structure Wh/kg mAh/g mAh/g* ~ ´ vs Li0/+ (V)
1 213 62 91 3.5
2 219 67 101 3.3
P3 245 68 102 3.6
P4 150 42 84 3.6
P5 254 77 116 3.3
6** 293 80 100 3.6
2,5-bis(pyrid-2-yl)-1,4-hydroquinone
786 203 - 3.7
1,4-hydroquinone 1701 486 - 3.7***
Composition of random copolymers Solution electropolymerization was applied to obtain the copolymers 1 and 2 (Figure 21). Since the polymerization process (with two different monomers dissolved in the electrolyte) results in a random order of these copolymers, and the proton trap ability relates to the number of traps in relation to the number of HQ-hydroxyl groups, two different approaches to assess the com-positions were performed. For 1, a semi-quantitative analysis by scanning electron microscopy (SEM) with energy dispersive X-ray spectroscopy (EDS) was performed (Paper I). The results indicated a composition close to the polymerization solution of two pyridine units per HQ in the electro-polymerized material. Additionally, the inclusion of counterions could be seen for the full cross section, indicating that mass transport could take place throughout the material and not only close to the surface. EDS mapping was also performed on electrodes from post-mortem cells to see how battery cycling affected the material. At the surface post battery cycling nitrogen could not be detected, indicating loss of the proton trap function, which was also the conclusion drawn from analyzing the derivative figures of the GCD (Figure 25).
48
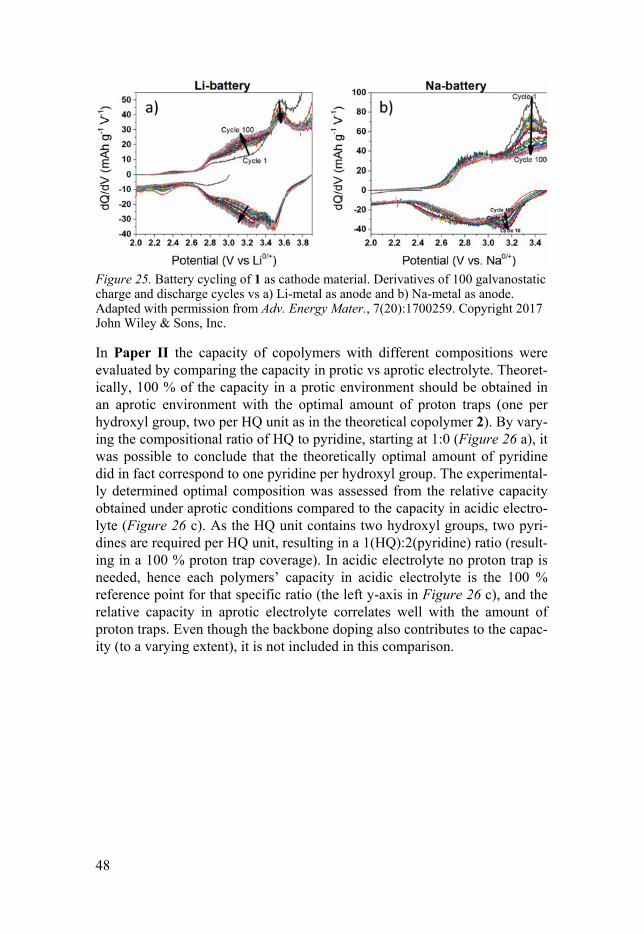
Figure 25. Battery cycling of 1 as cathode material. Derivatives of 100 galvanostatic charge and discharge cycles vs a) Li-metal as anode and b) Na-metal as anode. Adapted with permission from Adv. Energy Mater., 7(20):1700259. Copyright 2017 John Wiley & Sons, Inc.
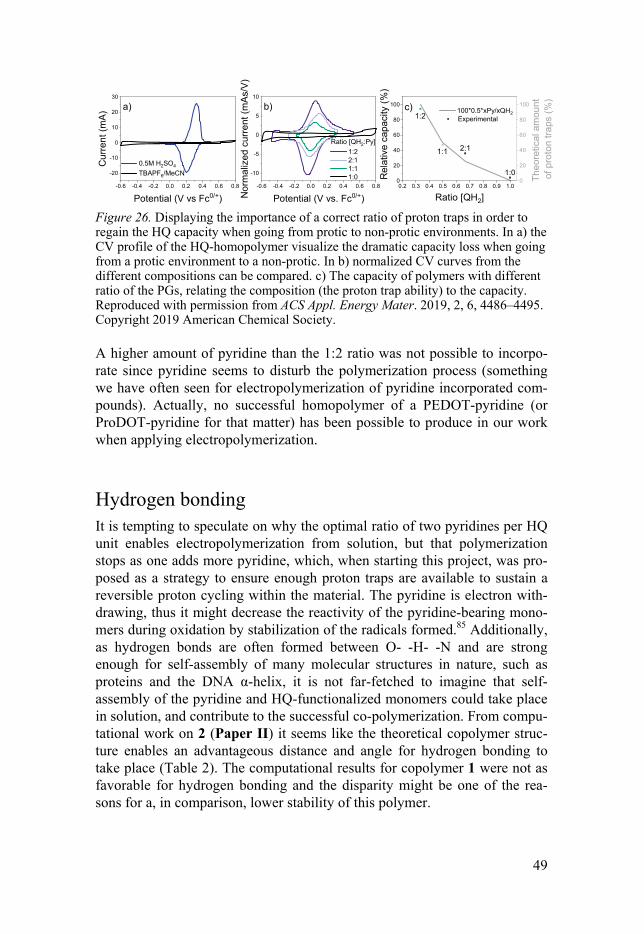
In Paper II the capacity of copolymers with different compositions were evaluated by comparing the capacity in protic vs aprotic electrolyte. Theoret-ically, 100 % of the capacity in a protic environment should be obtained in an aprotic environment with the optimal amount of proton traps (one per hydroxyl group, two per HQ unit as in the theoretical copolymer 2). By vary-ing the compositional ratio of HQ to pyridine, starting at 1:0 (Figure 26 a), it was possible to conclude that the theoretically optimal amount of pyridine did in fact correspond to one pyridine per hydroxyl group. The experimental-ly determined optimal composition was assessed from the relative capacity obtained under aprotic conditions compared to the capacity in acidic electro-lyte (Figure 26 c). As the HQ unit contains two hydroxyl groups, two pyri-dines are required per HQ unit, resulting in a 1(HQ):2(pyridine) ratio (result-ing in a 100 % proton trap coverage). In acidic electrolyte no proton trap is needed, hence each polymers’ capacity in acidic electrolyte is the 100 % reference point for that specific ratio (the left y-axis in Figure 26 c), and the relative capacity in aprotic electrolyte correlates well with the amount of proton traps. Even though the backbone doping also contributes to the capac-ity (to a varying extent), it is not included in this comparison.
49
Figure 26. Displaying the importance of a correct ratio of proton traps in order to regain the HQ capacity when going from protic to non-protic environments. In a) the CV profile of the HQ-homopolymer visualize the dramatic capacity loss when going from a protic environment to a non-protic. In b) normalized CV curves from the different compositions can be compared. c) The capacity of polymers with different ratio of the PGs, relating the composition (the proton trap ability) to the capacity. Reproduced with permission from ACS Appl. Energy Mater. 2019, 2, 6, 4486–4495. Copyright 2019 American Chemical Society.
A higher amount of pyridine than the 1:2 ratio was not possible to incorpo-rate since pyridine seems to disturb the polymerization process (something we have often seen for electropolymerization of pyridine incorporated com-pounds). Actually, no successful homopolymer of a PEDOT-pyridine (or ProDOT-pyridine for that matter) has been possible to produce in our work when applying electropolymerization.
Hydrogen bonding It is tempting to speculate on why the optimal ratio of two pyridines per HQ unit enables electropolymerization from solution, but that polymerization stops as one adds more pyridine, which, when starting this project, was pro-posed as a strategy to ensure enough proton traps are available to sustain a reversible proton cycling within the material. The pyridine is electron with-drawing, thus it might decrease the reactivity of the pyridine-bearing mono-mers during oxidation by stabilization of the radicals formed.85 Additionally, as hydrogen bonds are often formed between O- -H- -N and are strong enough for self-assembly of many molecular structures in nature, such as proteins and the DNA α-helix, it is not far-fetched to imagine that self-assembly of the pyridine and HQ-functionalized monomers could take place in solution, and contribute to the successful co-polymerization. From compu-tational work on 2 (Paper II) it seems like the theoretical copolymer struc-ture enables an advantageous distance and angle for hydrogen bonding to take place (Table 2). The computational results for copolymer 1 were not as favorable for hydrogen bonding and the disparity might be one of the rea-sons for a, in comparison, lower stability of this polymer.
-0.6 -0.4 -0.2 0.0 0.2 0.4 0.6 0.8
-20
-10
0
10
20
30
-0.6 -0.4 -0.2 0.0 0.2 0.4 0.6 0.8
-10
-5
0
5
10
c)b)C
urr
ent
(mA
)
Potential (V vs Fc0/+)
0.5M H2SO4
TBAPF6/MeCN
a)
No
rma
lized
cur
rent
(m
As/
V)
Potential (V vs. Fc0/+)
Ratio [QH2:Py]
1:2 2:1 1:1 1:0
0.2 0.3 0.4 0.5 0.6 0.7 0.8 0.9 1.00
20
40
60
80
100
1:0
2:11:1
Re
lativ
e c
ap
aci
ty (
%)
Ratio [QH2]
Experimental1:2
0
20
40
60
80
100 100*0.5*xPy/xQH2
The
oret
ical
am
ount
o
f p
roto
n tr
aps
(%
)
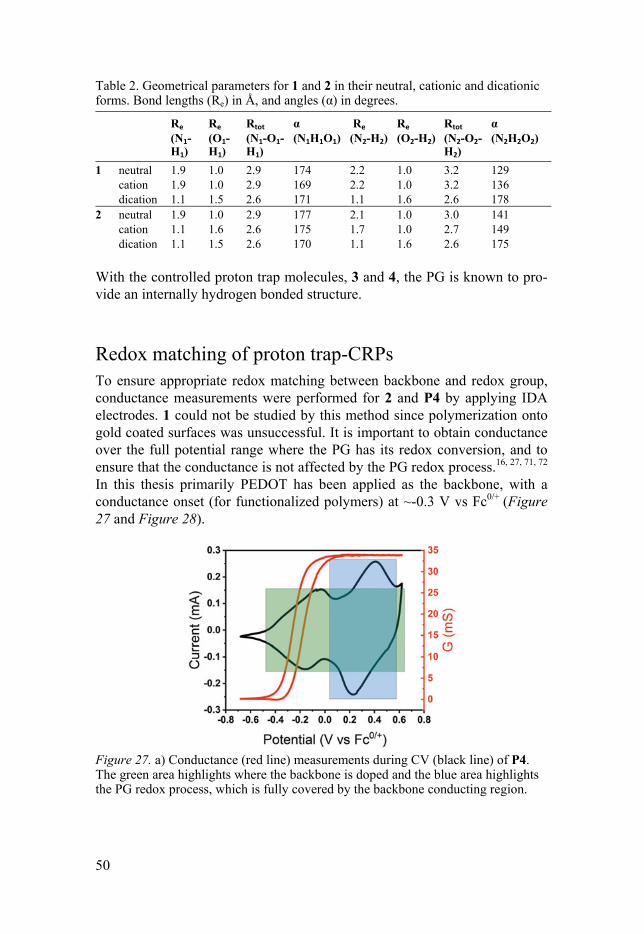
50
Table 2. Geometrical parameters for 1 and 2 in their neutral, cationic and dicationic forms. Bond lengths (Re) in Å, and angles (α) in degrees.
Re
(N1-H1)
Re
(O1-H1)
Rtot
(N1-O1-H1)
α (N1H1O1)
Re
(N2-H2) Re
(O2-H2) Rtot
(N2-O2-H2)
α (N2H2O2)
1 neutral 1.9 1.0 2.9 174 2.2 1.0 3.2 129 cation 1.9 1.0 2.9 169 2.2 1.0 3.2 136 dication 1.1 1.5 2.6 171 1.1 1.6 2.6 178 2 neutral 1.9 1.0 2.9 177 2.1 1.0 3.0 141 cation 1.1 1.6 2.6 175 1.7 1.0 2.7 149 dication 1.1 1.5 2.6 170 1.1 1.6 2.6 175 With the controlled proton trap molecules, 3 and 4, the PG is known to pro-vide an internally hydrogen bonded structure.
Redox matching of proton trap-CRPs To ensure appropriate redox matching between backbone and redox group, conductance measurements were performed for 2 and P4 by applying IDA electrodes. 1 could not be studied by this method since polymerization onto gold coated surfaces was unsuccessful. It is important to obtain conductance over the full potential range where the PG has its redox conversion, and to ensure that the conductance is not affected by the PG redox process.16, 27, 71, 72 In this thesis primarily PEDOT has been applied as the backbone, with a conductance onset (for functionalized polymers) at ~-0.3 V vs Fc0/+ (Figure 27 and Figure 28).
Figure 27. a) Conductance (red line) measurements during CV (black line) of P4. The green area highlights where the backbone is doped and the blue area highlights the PG redox process, which is fully covered by the backbone conducting region.
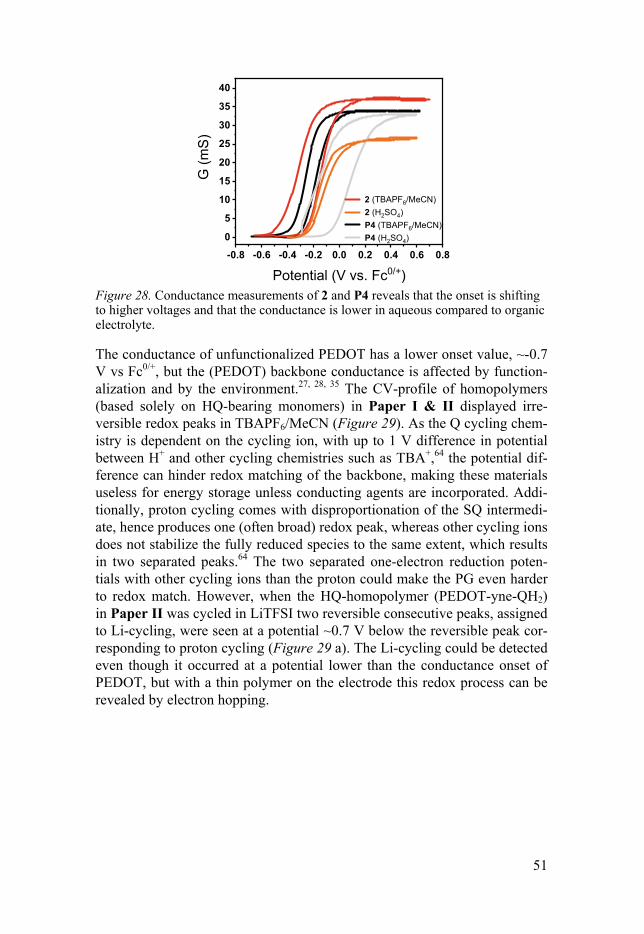
51
Figure 28. Conductance measurements of 2 and P4 reveals that the onset is shifting to higher voltages and that the conductance is lower in aqueous compared to organic electrolyte.
The conductance of unfunctionalized PEDOT has a lower onset value, ~-0.7 V vs Fc0/+, but the (PEDOT) backbone conductance is affected by function-alization and by the environment.27, 28, 35 The CV-profile of homopolymers (based solely on HQ-bearing monomers) in Paper I & II displayed irre-versible redox peaks in TBAPF6/MeCN (Figure 29). As the Q cycling chem-istry is dependent on the cycling ion, with up to 1 V difference in potential between H+ and other cycling chemistries such as TBA+,64 the potential dif-ference can hinder redox matching of the backbone, making these materials useless for energy storage unless conducting agents are incorporated. Addi-tionally, proton cycling comes with disproportionation of the SQ intermedi-ate, hence produces one (often broad) redox peak, whereas other cycling ions does not stabilize the fully reduced species to the same extent, which results in two separated peaks.64 The two separated one-electron reduction poten-tials with other cycling ions than the proton could make the PG even harder to redox match. However, when the HQ-homopolymer (PEDOT-yne-QH2) in Paper II was cycled in LiTFSI two reversible consecutive peaks, assigned to Li-cycling, were seen at a potential ~0.7 V below the reversible peak cor-responding to proton cycling (Figure 29 a). The Li-cycling could be detected even though it occurred at a potential lower than the conductance onset of PEDOT, but with a thin polymer on the electrode this redox process can be revealed by electron hopping.
-0.8 -0.6 -0.4 -0.2 0.0 0.2 0.4 0.6 0.8
0
5
10
15
20
25
30
35
40
2 (TBAPF6/MeCN)
2 (H2SO4)
P4 (TBAPF6/MeCN)
P4 (H2SO4)
G (
mS
)
Potential (V vs. Fc0/+)
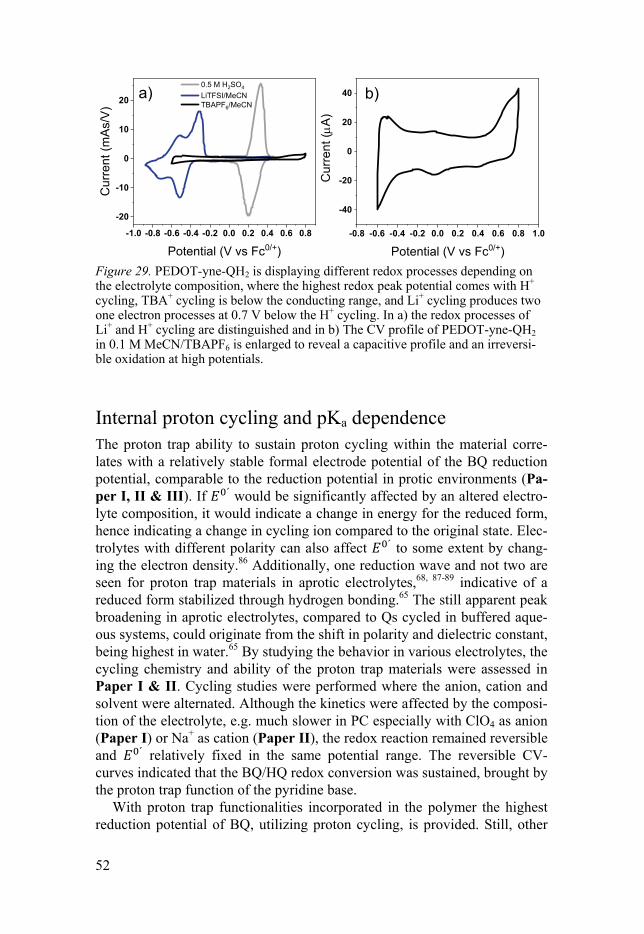
52
Figure 29. PEDOT-yne-QH2 is displaying different redox processes depending on the electrolyte composition, where the highest redox peak potential comes with H+ cycling, TBA+ cycling is below the conducting range, and Li+ cycling produces two one electron processes at 0.7 V below the H+ cycling. In a) the redox processes of Li+ and H+ cycling are distinguished and in b) The CV profile of PEDOT-yne-QH2 in 0.1 M MeCN/TBAPF6 is enlarged to reveal a capacitive profile and an irreversi-ble oxidation at high potentials.
Internal proton cycling and pKa dependence The proton trap ability to sustain proton cycling within the material corre-lates with a relatively stable formal electrode potential of the BQ reduction potential, comparable to the reduction potential in protic environments (Pa-per I, II & III). If ´ would be significantly affected by an altered electro-lyte composition, it would indicate a change in energy for the reduced form, hence indicating a change in cycling ion compared to the original state. Elec-trolytes with different polarity can also affect ´ to some extent by chang-ing the electron density.86 Additionally, one reduction wave and not two are seen for proton trap materials in aprotic electrolytes,68, 87-89 indicative of a reduced form stabilized through hydrogen bonding.65 The still apparent peak broadening in aprotic electrolytes, compared to Qs cycled in buffered aque-ous systems, could originate from the shift in polarity and dielectric constant, being highest in water.65 By studying the behavior in various electrolytes, the cycling chemistry and ability of the proton trap materials were assessed in Paper I & II. Cycling studies were performed where the anion, cation and solvent were alternated. Although the kinetics were affected by the composi-tion of the electrolyte, e.g. much slower in PC especially with ClO4 as anion (Paper I) or Na+ as cation (Paper II), the redox reaction remained reversible and ´ relatively fixed in the same potential range. The reversible CV-curves indicated that the BQ/HQ redox conversion was sustained, brought by the proton trap function of the pyridine base.
With proton trap functionalities incorporated in the polymer the highest reduction potential of BQ, utilizing proton cycling, is provided. Still, other
-1.0 -0.8 -0.6 -0.4 -0.2 0.0 0.2 0.4 0.6 0.8
-20
-10
0
10
20a)
Cur
rent
(m
As/
V)
Potential (V vs Fc0/+)
0.5 M H2SO4
LiTFSI/MeCN TBAPF6/MeCN
-0.8 -0.6 -0.4 -0.2 0.0 0.2 0.4 0.6 0.8 1.0
-40
-20
0
20
40
Cu
rren
t (A
)
Potential (V vs Fc0/+)
b)
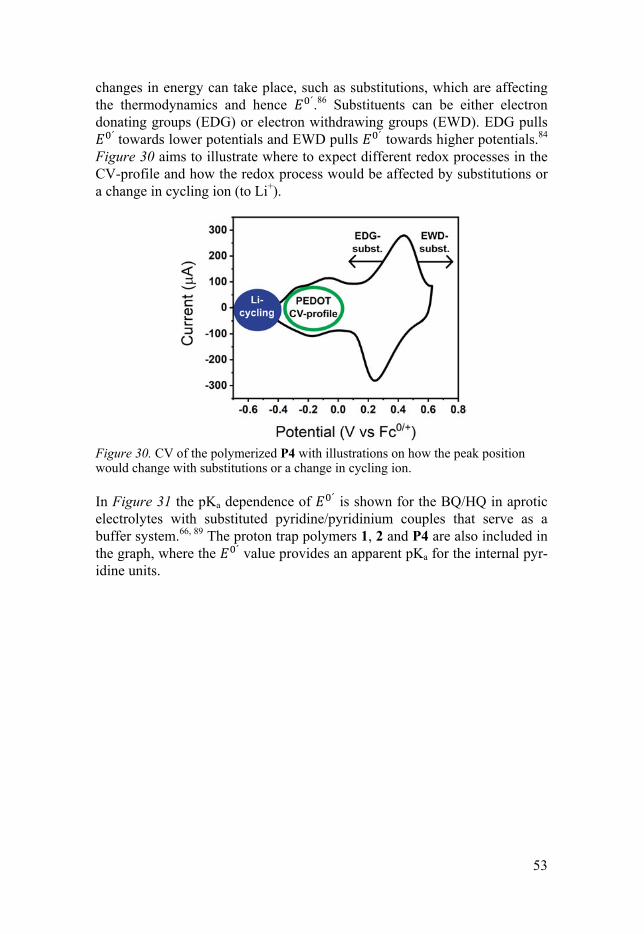
53
changes in energy can take place, such as substitutions, which are affecting the thermodynamics and hence ´.86 Substituents can be either electron donating groups (EDG) or electron withdrawing groups (EWD). EDG pulls
´towards lower potentials and EWD pulls ´ towards higher potentials.84 Figure 30 aims to illustrate where to expect different redox processes in the CV-profile and how the redox process would be affected by substitutions or a change in cycling ion (to Li+).
Figure 30. CV of the polymerized P4 with illustrations on how the peak position would change with substitutions or a change in cycling ion.
In Figure 31 the pKa dependence of ´ is shown for the BQ/HQ in aprotic electrolytes with substituted pyridine/pyridinium couples that serve as a buffer system.66, 89 The proton trap polymers 1, 2 and P4 are also included in the graph, where the ´ value provides an apparent pKa for the internal pyr-idine units.
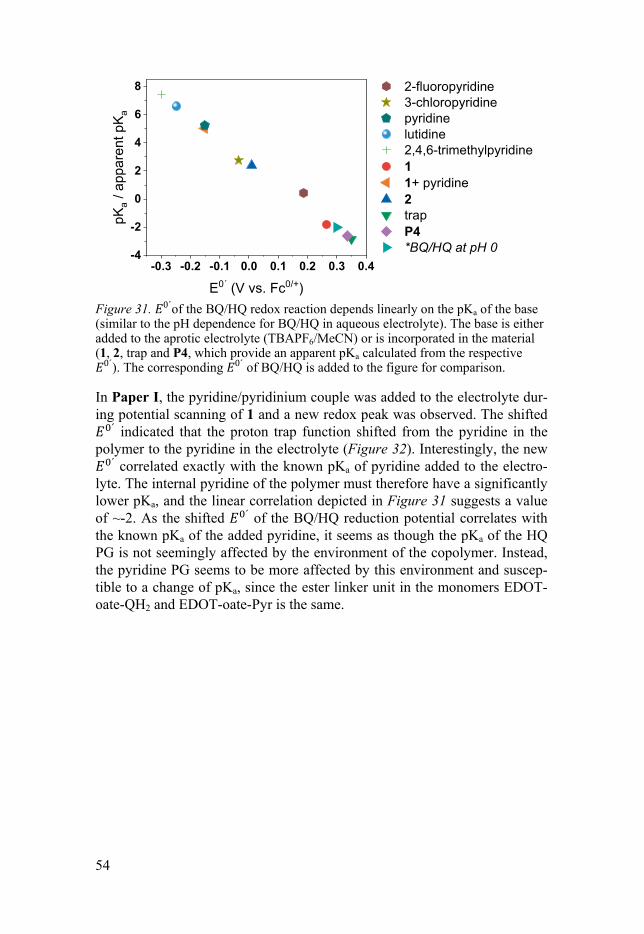
54
Figure 31. 0´of the BQ/HQ redox reaction depends linearly on the pKa of the base (similar to the pH dependence for BQ/HQ in aqueous electrolyte). The base is either added to the aprotic electrolyte (TBAPF6/MeCN) or is incorporated in the material (1, 2, trap and P4, which provide an apparent pKa calculated from the respective 0´). The corresponding 0´ of BQ/HQ is added to the figure for comparison.
In Paper I, the pyridine/pyridinium couple was added to the electrolyte dur-ing potential scanning of 1 and a new redox peak was observed. The shifted
´ indicated that the proton trap function shifted from the pyridine in the polymer to the pyridine in the electrolyte (Figure 32). Interestingly, the new
´ correlated exactly with the known pKa of pyridine added to the electro-lyte. The internal pyridine of the polymer must therefore have a significantly lower pKa, and the linear correlation depicted in Figure 31 suggests a value of ~-2. As the shifted ´ of the BQ/HQ reduction potential correlates with the known pKa of the added pyridine, it seems as though the pKa of the HQ PG is not seemingly affected by the environment of the copolymer. Instead, the pyridine PG seems to be more affected by this environment and suscep-tible to a change of pKa, since the ester linker unit in the monomers EDOT-oate-QH2 and EDOT-oate-Pyr is the same.
-0.3 -0.2 -0.1 0.0 0.1 0.2 0.3 0.4-4
-2
0
2
4
6
8 2-fluoropyridine 3-chloropyridine pyridine lutidine 2,4,6-trimethylpyridine 1 1+ pyridine 2 trap P4 *BQ/HQ at pH 0
pKa /
app
are
nt p
Ka
E0´ (V vs. Fc0/+)
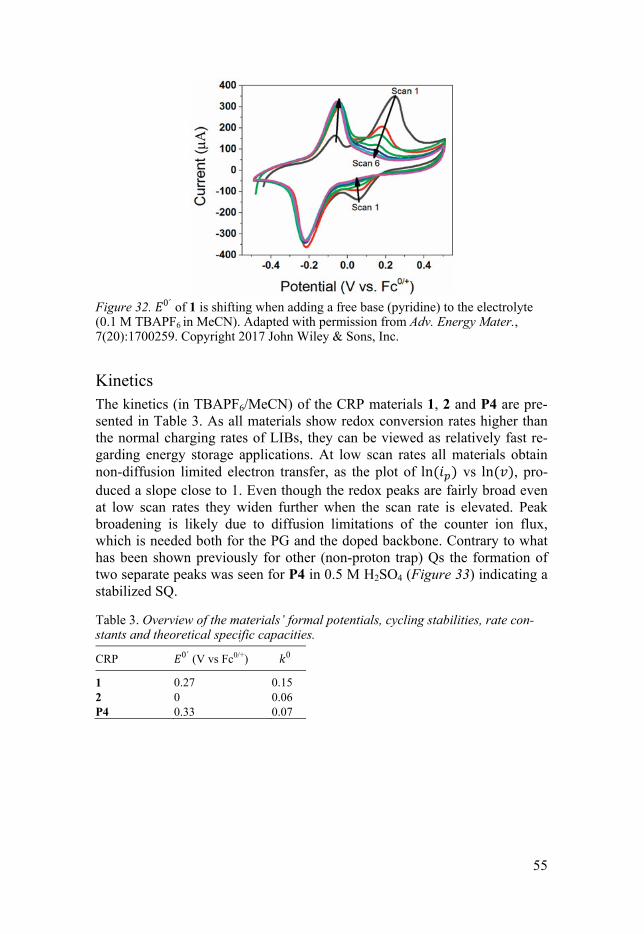
55
Figure 32. 0´ of 1 is shifting when adding a free base (pyridine) to the electrolyte (0.1 M TBAPF6 in MeCN). Adapted with permission from Adv. Energy Mater., 7(20):1700259. Copyright 2017 John Wiley & Sons, Inc.
Kinetics The kinetics (in TBAPF6/MeCN) of the CRP materials 1, 2 and P4 are pre-sented in Table 3. As all materials show redox conversion rates higher than the normal charging rates of LIBs, they can be viewed as relatively fast re-garding energy storage applications. At low scan rates all materials obtain non-diffusion limited electron transfer, as the plot of ln vs ln , pro-duced a slope close to 1. Even though the redox peaks are fairly broad even at low scan rates they widen further when the scan rate is elevated. Peak broadening is likely due to diffusion limitations of the counter ion flux, which is needed both for the PG and the doped backbone. Contrary to what has been shown previously for other (non-proton trap) Qs the formation of two separate peaks was seen for P4 in 0.5 M H2SO4 (Figure 33) indicating a stabilized SQ.
Table 3. Overview of the materials’ formal potentials, cycling stabilities, rate con-stants and theoretical specific capacities.
CRP 0´ (V vs Fc0/+) 0
1 0.27 0.15 2 0 0.06 P4 0.33 0.07
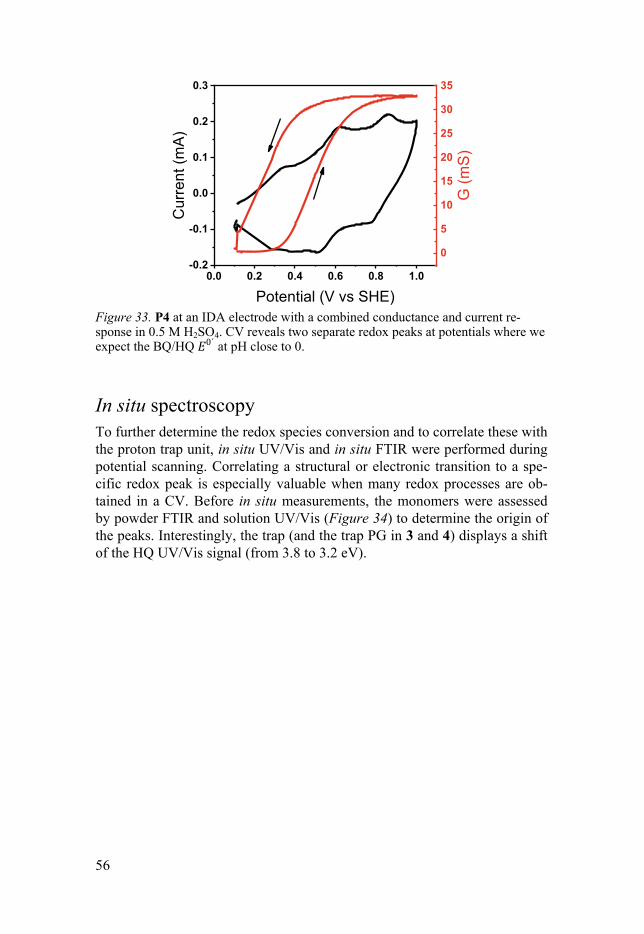
56
Figure 33. P4 at an IDA electrode with a combined conductance and current re-sponse in 0.5 M H2SO4. CV reveals two separate redox peaks at potentials where we expect the BQ/HQ 0´ at pH close to 0.
In situ spectroscopy To further determine the redox species conversion and to correlate these with the proton trap unit, in situ UV/Vis and in situ FTIR were performed during potential scanning. Correlating a structural or electronic transition to a spe-cific redox peak is especially valuable when many redox processes are ob-tained in a CV. Before in situ measurements, the monomers were assessed by powder FTIR and solution UV/Vis (Figure 34) to determine the origin of the peaks. Interestingly, the trap (and the trap PG in 3 and 4) displays a shift of the HQ UV/Vis signal (from 3.8 to 3.2 eV).
0.0 0.2 0.4 0.6 0.8 1.0-0.2
-0.1
0.0
0.1
0.2
0.3
Cur
ren
t (m
A)
Potential (V vs SHE)
0
5
10
15
20
25
30
35
G (
mS
)
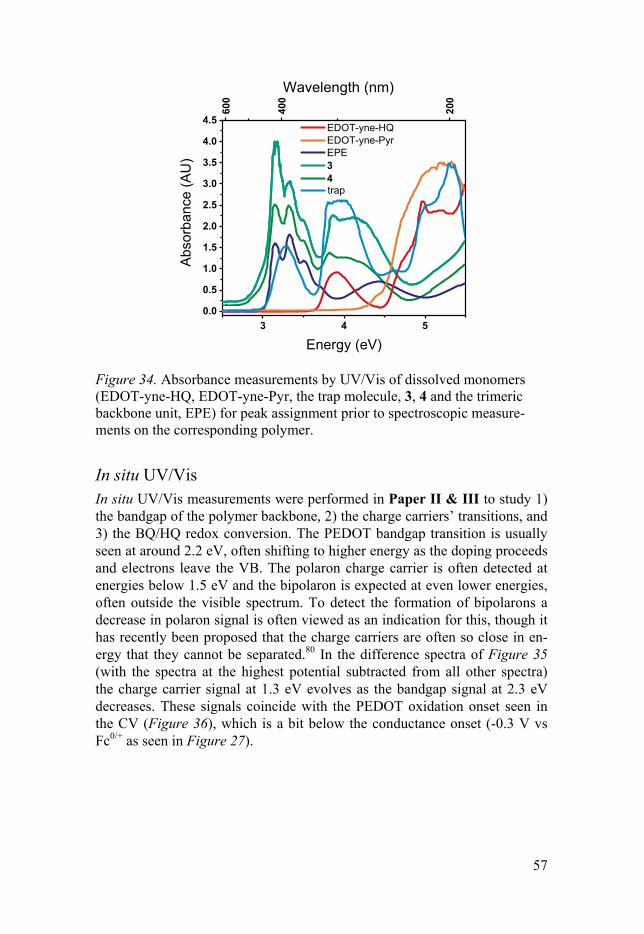
57
Figure 34. Absorbance measurements by UV/Vis of dissolved monomers (EDOT-yne-HQ, EDOT-yne-Pyr, the trap molecule, 3, 4 and the trimeric backbone unit, EPE) for peak assignment prior to spectroscopic measure-ments on the corresponding polymer.
In situ UV/Vis In situ UV/Vis measurements were performed in Paper II & III to study 1) the bandgap of the polymer backbone, 2) the charge carriers’ transitions, and 3) the BQ/HQ redox conversion. The PEDOT bandgap transition is usually seen at around 2.2 eV, often shifting to higher energy as the doping proceeds and electrons leave the VB. The polaron charge carrier is often detected at energies below 1.5 eV and the bipolaron is expected at even lower energies, often outside the visible spectrum. To detect the formation of bipolarons a decrease in polaron signal is often viewed as an indication for this, though it has recently been proposed that the charge carriers are often so close in en-ergy that they cannot be separated.80 In the difference spectra of Figure 35 (with the spectra at the highest potential subtracted from all other spectra) the charge carrier signal at 1.3 eV evolves as the bandgap signal at 2.3 eV decreases. These signals coincide with the PEDOT oxidation onset seen in the CV (Figure 36), which is a bit below the conductance onset (-0.3 V vs Fc0/+ as seen in Figure 27).
3 4 5
0.0
0.5
1.0
1.5
2.0
2.5
3.0
3.5
4.0
4.5 EDOT-yne-HQ EDOT-yne-Pyr EPE 3 4
Abs
orba
nce
(AU
)
Energy (eV)
600
400
200
trap
Wavelength (nm)
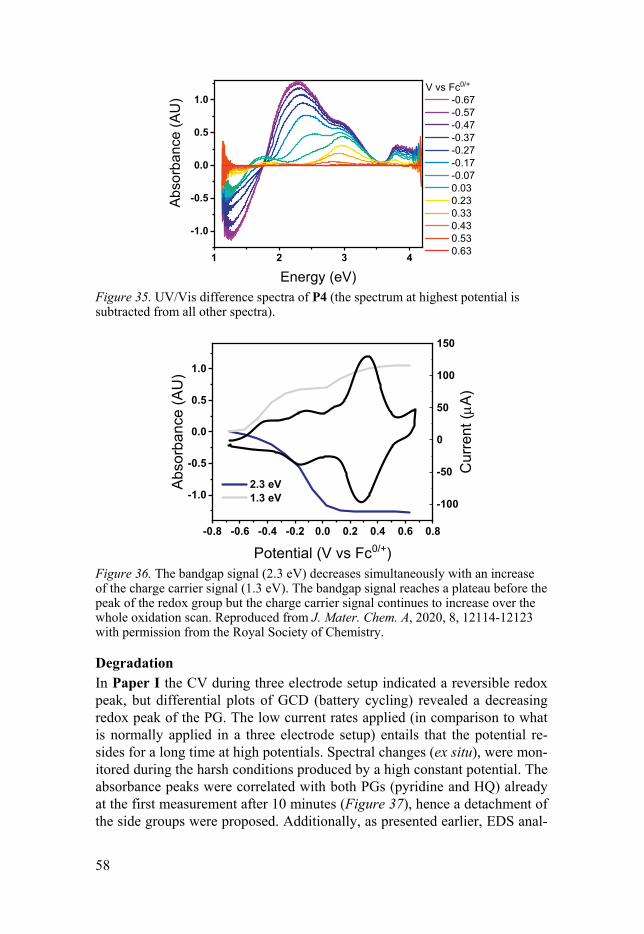
58
Figure 35. UV/Vis difference spectra of P4 (the spectrum at highest potential is subtracted from all other spectra).
Figure 36. The bandgap signal (2.3 eV) decreases simultaneously with an increase of the charge carrier signal (1.3 eV). The bandgap signal reaches a plateau before the peak of the redox group but the charge carrier signal continues to increase over the whole oxidation scan. Reproduced from J. Mater. Chem. A, 2020, 8, 12114-12123 with permission from the Royal Society of Chemistry.
Degradation In Paper I the CV during three electrode setup indicated a reversible redox peak, but differential plots of GCD (battery cycling) revealed a decreasing redox peak of the PG. The low current rates applied (in comparison to what is normally applied in a three electrode setup) entails that the potential re-sides for a long time at high potentials. Spectral changes (ex situ), were mon-itored during the harsh conditions produced by a high constant potential. The absorbance peaks were correlated with both PGs (pyridine and HQ) already at the first measurement after 10 minutes (Figure 37), hence a detachment of the side groups were proposed. Additionally, as presented earlier, EDS anal-
1 2 3 4
-1.0
-0.5
0.0
0.5
1.0
Abs
orba
nce
(AU
)
Energy (eV)
V vs Fc0/+
-0.67 -0.57 -0.47 -0.37 -0.27 -0.17 -0.07 0.03 0.23 0.33 0.43 0.53 0.63
-0.8 -0.6 -0.4 -0.2 0.0 0.2 0.4 0.6 0.8
-1.0
-0.5
0.0
0.5
1.0
2.3 eV 1.3 eV
Abs
orba
nce
(AU
)
Potential (V vs Fc0/+)
-100
-50
0
50
100
150
Cur
rent
(A
)
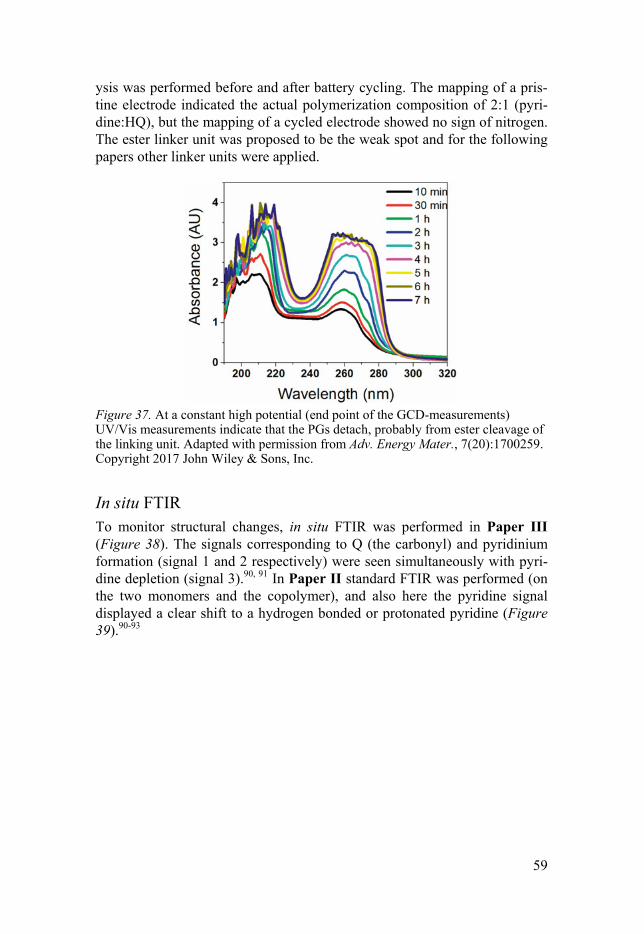
59
ysis was performed before and after battery cycling. The mapping of a pris-tine electrode indicated the actual polymerization composition of 2:1 (pyri-dine:HQ), but the mapping of a cycled electrode showed no sign of nitrogen. The ester linker unit was proposed to be the weak spot and for the following papers other linker units were applied.
Figure 37. At a constant high potential (end point of the GCD-measurements) UV/Vis measurements indicate that the PGs detach, probably from ester cleavage of the linking unit. Adapted with permission from Adv. Energy Mater., 7(20):1700259. Copyright 2017 John Wiley & Sons, Inc.
In situ FTIR To monitor structural changes, in situ FTIR was performed in Paper III (Figure 38). The signals corresponding to Q (the carbonyl) and pyridinium formation (signal 1 and 2 respectively) were seen simultaneously with pyri-dine depletion (signal 3).90, 91 In Paper II standard FTIR was performed (on the two monomers and the copolymer), and also here the pyridine signal displayed a clear shift to a hydrogen bonded or protonated pyridine (Figure 39).90-93
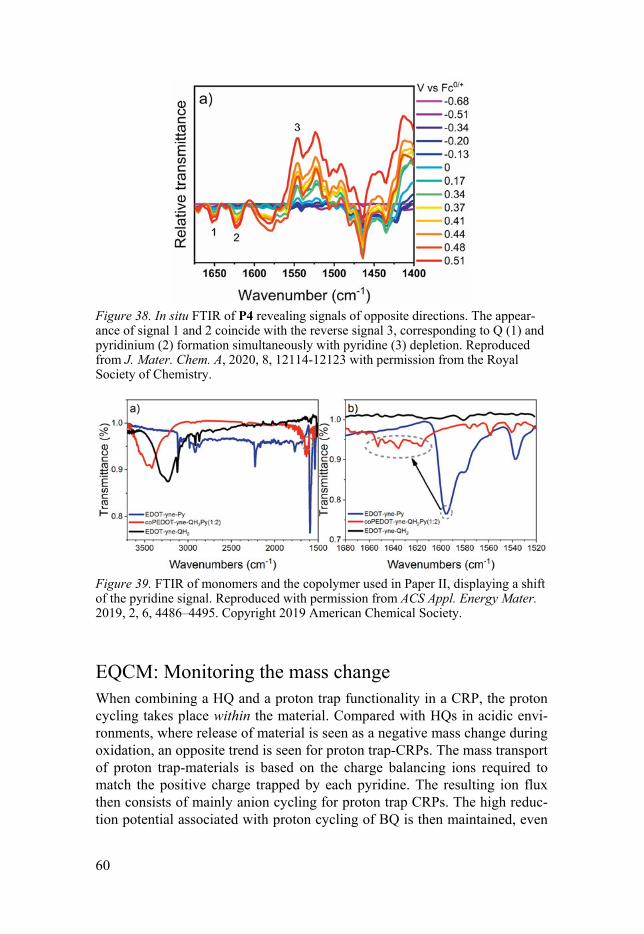
60
Figure 38. In situ FTIR of P4 revealing signals of opposite directions. The appear-ance of signal 1 and 2 coincide with the reverse signal 3, corresponding to Q (1) and pyridinium (2) formation simultaneously with pyridine (3) depletion. Reproduced from J. Mater. Chem. A, 2020, 8, 12114-12123 with permission from the Royal Society of Chemistry.
Figure 39. FTIR of monomers and the copolymer used in Paper II, displaying a shift of the pyridine signal. Reproduced with permission from ACS Appl. Energy Mater. 2019, 2, 6, 4486–4495. Copyright 2019 American Chemical Society.
EQCM: Monitoring the mass change When combining a HQ and a proton trap functionality in a CRP, the proton cycling takes place within the material. Compared with HQs in acidic envi-ronments, where release of material is seen as a negative mass change during oxidation, an opposite trend is seen for proton trap-CRPs. The mass transport of proton trap-materials is based on the charge balancing ions required to match the positive charge trapped by each pyridine. The resulting ion flux then consists of mainly anion cycling for proton trap CRPs. The high reduc-tion potential associated with proton cycling of BQ is then maintained, even
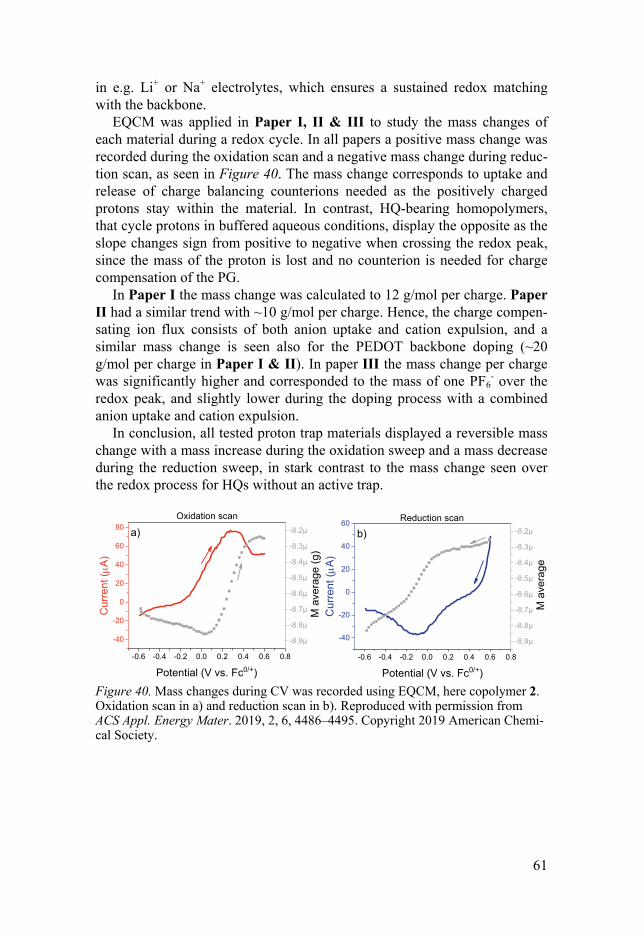
61
in e.g. Li+ or Na+ electrolytes, which ensures a sustained redox matching with the backbone.
EQCM was applied in Paper I, II & III to study the mass changes of each material during a redox cycle. In all papers a positive mass change was recorded during the oxidation scan and a negative mass change during reduc-tion scan, as seen in Figure 40. The mass change corresponds to uptake and release of charge balancing counterions needed as the positively charged protons stay within the material. In contrast, HQ-bearing homopolymers, that cycle protons in buffered aqueous conditions, display the opposite as the slope changes sign from positive to negative when crossing the redox peak, since the mass of the proton is lost and no counterion is needed for charge compensation of the PG.
In Paper I the mass change was calculated to 12 g/mol per charge. Paper II had a similar trend with ~10 g/mol per charge. Hence, the charge compen-sating ion flux consists of both anion uptake and cation expulsion, and a similar mass change is seen also for the PEDOT backbone doping (~20 g/mol per charge in Paper I & II). In paper III the mass change per charge was significantly higher and corresponded to the mass of one PF6
- over the redox peak, and slightly lower during the doping process with a combined anion uptake and cation expulsion.
In conclusion, all tested proton trap materials displayed a reversible mass change with a mass increase during the oxidation sweep and a mass decrease during the reduction sweep, in stark contrast to the mass change seen over the redox process for HQs without an active trap.
Figure 40. Mass changes during CV was recorded using EQCM, here copolymer 2. Oxidation scan in a) and reduction scan in b). Reproduced with permission from ACS Appl. Energy Mater. 2019, 2, 6, 4486–4495. Copyright 2019 American Chemi-cal Society.
-0.6 -0.4 -0.2 0.0 0.2 0.4 0.6 0.8
-40
-20
0
20
40
60
80
Potential (V vs. Fc0/+)
Cur
rent
(A
)
-8.9µ
-8.8µ
-8.7µ
-8.6µ
-8.5µ
-8.4µ
-8.3µ
-8.2µ
Oxidation scan
M a
vera
ge (
g)
a)
-0.6 -0.4 -0.2 0.0 0.2 0.4 0.6 0.8
-40
-20
0
20
40
60
b)
Potential (V vs. Fc0/+)
Cu
rren
t (
A)
Reduction scan
-8.9µ
-8.8µ
-8.7µ
-8.6µ
-8.5µ
-8.4µ
-8.3µ
-8.2µ M
ave
rage
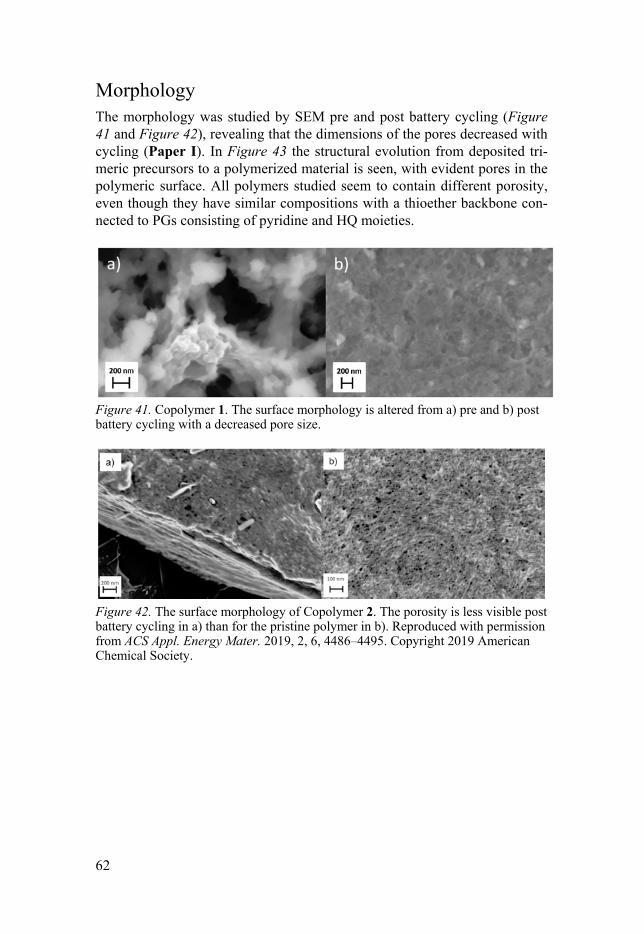
62
Morphology The morphology was studied by SEM pre and post battery cycling (Figure 41 and Figure 42), revealing that the dimensions of the pores decreased with cycling (Paper I). In Figure 43 the structural evolution from deposited tri-meric precursors to a polymerized material is seen, with evident pores in the polymeric surface. All polymers studied seem to contain different porosity, even though they have similar compositions with a thioether backbone con-nected to PGs consisting of pyridine and HQ moieties.
Figure 41. Copolymer 1. The surface morphology is altered from a) pre and b) post battery cycling with a decreased pore size.
Figure 42. The surface morphology of Copolymer 2. The porosity is less visible post battery cycling in a) than for the pristine polymer in b). Reproduced with permission from ACS Appl. Energy Mater. 2019, 2, 6, 4486–4495. Copyright 2019 American Chemical Society.
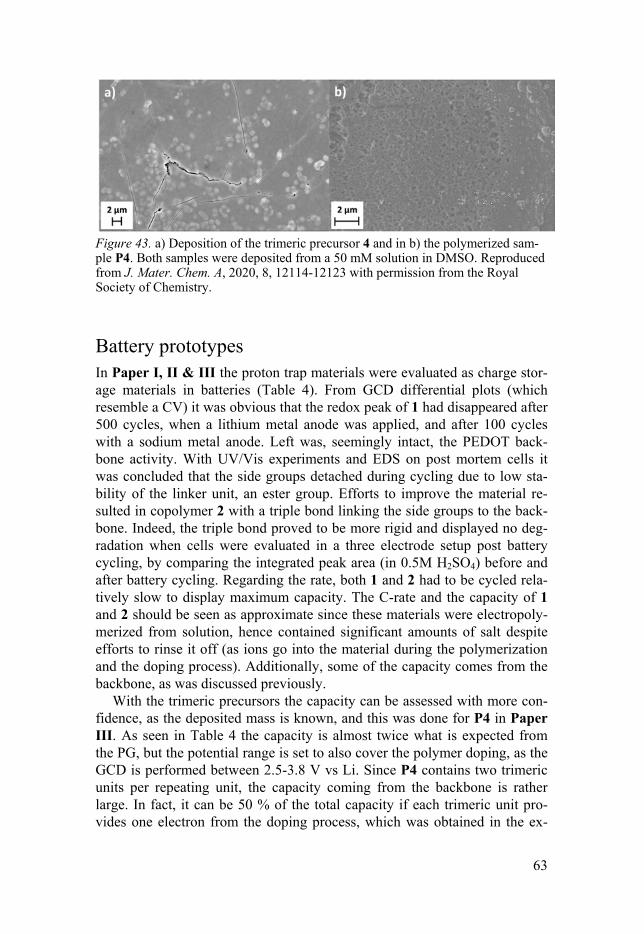
63
Figure 43. a) Deposition of the trimeric precursor 4 and in b) the polymerized sam-ple P4. Both samples were deposited from a 50 mM solution in DMSO. Reproduced from J. Mater. Chem. A, 2020, 8, 12114-12123 with permission from the Royal Society of Chemistry.
Battery prototypes In Paper I, II & III the proton trap materials were evaluated as charge stor-age materials in batteries (Table 4). From GCD differential plots (which resemble a CV) it was obvious that the redox peak of 1 had disappeared after 500 cycles, when a lithium metal anode was applied, and after 100 cycles with a sodium metal anode. Left was, seemingly intact, the PEDOT back-bone activity. With UV/Vis experiments and EDS on post mortem cells it was concluded that the side groups detached during cycling due to low sta-bility of the linker unit, an ester group. Efforts to improve the material re-sulted in copolymer 2 with a triple bond linking the side groups to the back-bone. Indeed, the triple bond proved to be more rigid and displayed no deg-radation when cells were evaluated in a three electrode setup post battery cycling, by comparing the integrated peak area (in 0.5M H2SO4) before and after battery cycling. Regarding the rate, both 1 and 2 had to be cycled rela-tively slow to display maximum capacity. The C-rate and the capacity of 1 and 2 should be seen as approximate since these materials were electropoly-merized from solution, hence contained significant amounts of salt despite efforts to rinse it off (as ions go into the material during the polymerization and the doping process). Additionally, some of the capacity comes from the backbone, as was discussed previously.
With the trimeric precursors the capacity can be assessed with more con-fidence, as the deposited mass is known, and this was done for P4 in Paper III. As seen in Table 4 the capacity is almost twice what is expected from the PG, but the potential range is set to also cover the polymer doping, as the GCD is performed between 2.5-3.8 V vs Li. Since P4 contains two trimeric units per repeating unit, the capacity coming from the backbone is rather large. In fact, it can be 50 % of the total capacity if each trimeric unit pro-vides one electron from the doping process, which was obtained in the ex-
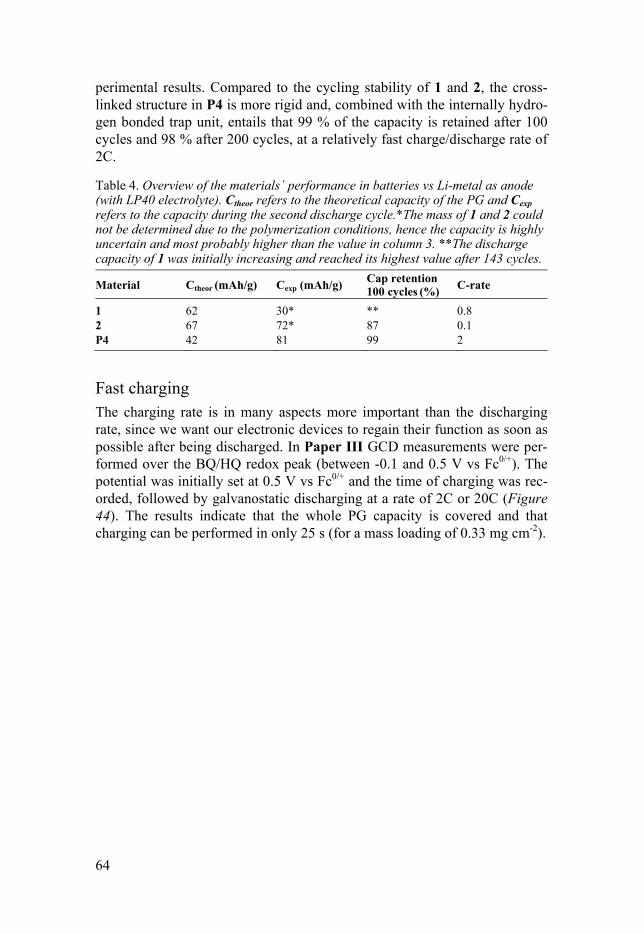
64
perimental results. Compared to the cycling stability of 1 and 2, the cross-linked structure in P4 is more rigid and, combined with the internally hydro-gen bonded trap unit, entails that 99 % of the capacity is retained after 100 cycles and 98 % after 200 cycles, at a relatively fast charge/discharge rate of 2C.
Table 4. Overview of the materials´ performance in batteries vs Li-metal as anode (with LP40 electrolyte). Ctheor refers to the theoretical capacity of the PG and Cexp refers to the capacity during the second discharge cycle.*The mass of 1 and 2 could not be determined due to the polymerization conditions, hence the capacity is highly uncertain and most probably higher than the value in column 3. **The discharge capacity of 1 was initially increasing and reached its highest value after 143 cycles.
Material Ctheor (mAh/g) Cexp (mAh/g) Cap retention 100 cycles (%)
C-rate
1 62 30* ** 0.8 2 67 72* 87 0.1 P4 42 81 99 2
Fast charging The charging rate is in many aspects more important than the discharging rate, since we want our electronic devices to regain their function as soon as possible after being discharged. In Paper III GCD measurements were per-formed over the BQ/HQ redox peak (between -0.1 and 0.5 V vs Fc0/+). The potential was initially set at 0.5 V vs Fc0/+ and the time of charging was rec-orded, followed by galvanostatic discharging at a rate of 2C or 20C (Figure 44). The results indicate that the whole PG capacity is covered and that charging can be performed in only 25 s (for a mass loading of 0.33 mg cm-2).
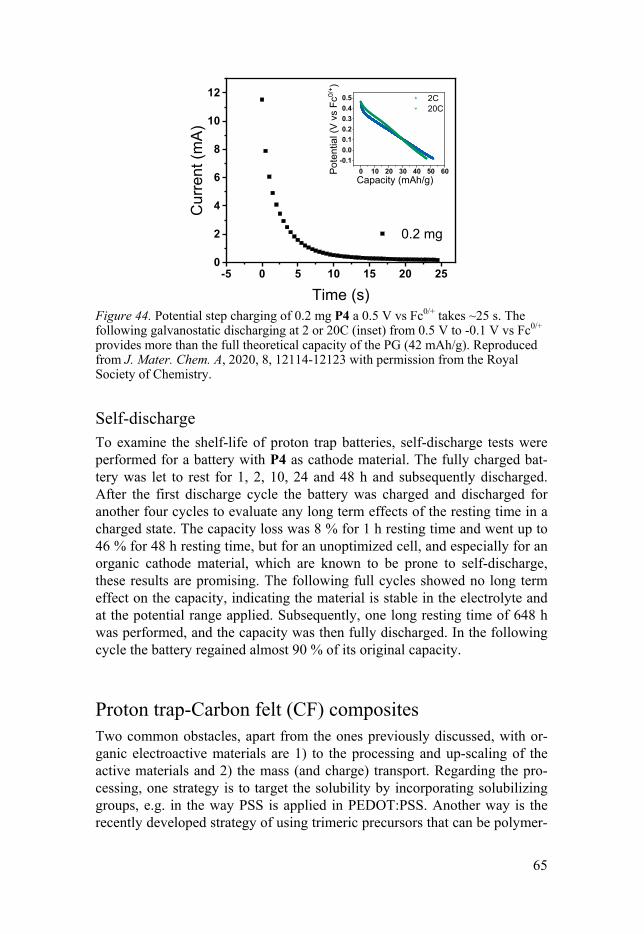
65
Figure 44. Potential step charging of 0.2 mg P4 a 0.5 V vs Fc0/+ takes ~25 s. The following galvanostatic discharging at 2 or 20C (inset) from 0.5 V to -0.1 V vs Fc0/+
provides more than the full theoretical capacity of the PG (42 mAh/g). Reproduced from J. Mater. Chem. A, 2020, 8, 12114-12123 with permission from the Royal Society of Chemistry.
Self-discharge To examine the shelf-life of proton trap batteries, self-discharge tests were performed for a battery with P4 as cathode material. The fully charged bat-tery was let to rest for 1, 2, 10, 24 and 48 h and subsequently discharged. After the first discharge cycle the battery was charged and discharged for another four cycles to evaluate any long term effects of the resting time in a charged state. The capacity loss was 8 % for 1 h resting time and went up to 46 % for 48 h resting time, but for an unoptimized cell, and especially for an organic cathode material, which are known to be prone to self-discharge, these results are promising. The following full cycles showed no long term effect on the capacity, indicating the material is stable in the electrolyte and at the potential range applied. Subsequently, one long resting time of 648 h was performed, and the capacity was then fully discharged. In the following cycle the battery regained almost 90 % of its original capacity.
Proton trap-Carbon felt (CF) composites Two common obstacles, apart from the ones previously discussed, with or-ganic electroactive materials are 1) to the processing and up-scaling of the active materials and 2) the mass (and charge) transport. Regarding the pro-cessing, one strategy is to target the solubility by incorporating solubilizing groups, e.g. in the way PSS is applied in PEDOT:PSS. Another way is the recently developed strategy of using trimeric precursors that can be polymer-
-5 0 5 10 15 20 250
2
4
6
8
10
12
0 10 20 30 40 50 60
-0.1
0.0
0.1
0.2
0.3
0.4
0.5 2C 20C
Pot
en
tial (
V v
s F
c0/+
)
Capacity (mAh/g)
Time (s)
0.2 mg
Cur
rent
(m
A)
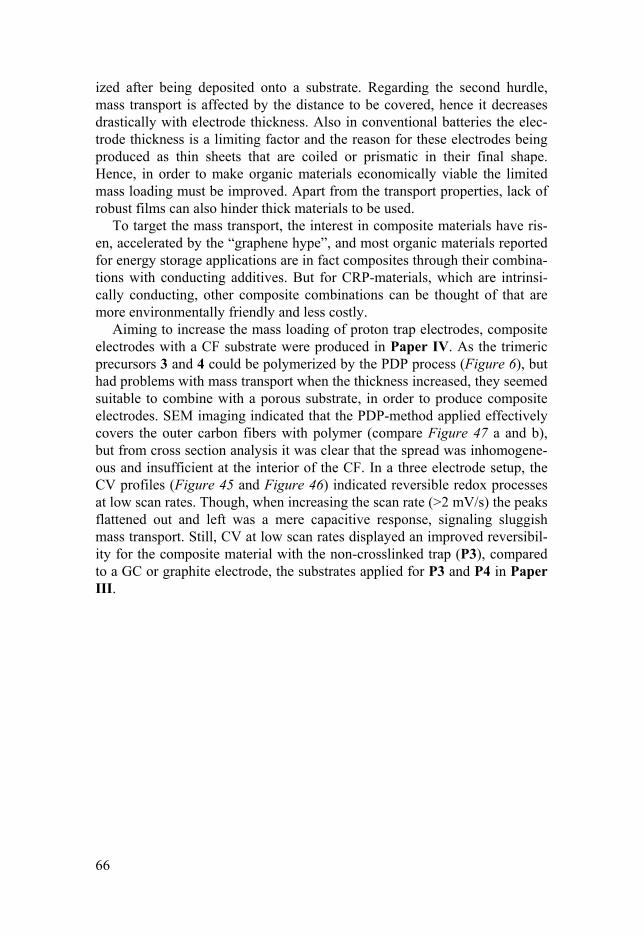
66
ized after being deposited onto a substrate. Regarding the second hurdle, mass transport is affected by the distance to be covered, hence it decreases drastically with electrode thickness. Also in conventional batteries the elec-trode thickness is a limiting factor and the reason for these electrodes being produced as thin sheets that are coiled or prismatic in their final shape. Hence, in order to make organic materials economically viable the limited mass loading must be improved. Apart from the transport properties, lack of robust films can also hinder thick materials to be used.
To target the mass transport, the interest in composite materials have ris-en, accelerated by the “graphene hype”, and most organic materials reported for energy storage applications are in fact composites through their combina-tions with conducting additives. But for CRP-materials, which are intrinsi-cally conducting, other composite combinations can be thought of that are more environmentally friendly and less costly.
Aiming to increase the mass loading of proton trap electrodes, composite electrodes with a CF substrate were produced in Paper IV. As the trimeric precursors 3 and 4 could be polymerized by the PDP process (Figure 6), but had problems with mass transport when the thickness increased, they seemed suitable to combine with a porous substrate, in order to produce composite electrodes. SEM imaging indicated that the PDP-method applied effectively covers the outer carbon fibers with polymer (compare Figure 47 a and b), but from cross section analysis it was clear that the spread was inhomogene-ous and insufficient at the interior of the CF. In a three electrode setup, the CV profiles (Figure 45 and Figure 46) indicated reversible redox processes at low scan rates. Though, when increasing the scan rate (>2 mV/s) the peaks flattened out and left was a mere capacitive response, signaling sluggish mass transport. Still, CV at low scan rates displayed an improved reversibil-ity for the composite material with the non-crosslinked trap (P3), compared to a GC or graphite electrode, the substrates applied for P3 and P4 in Paper III.
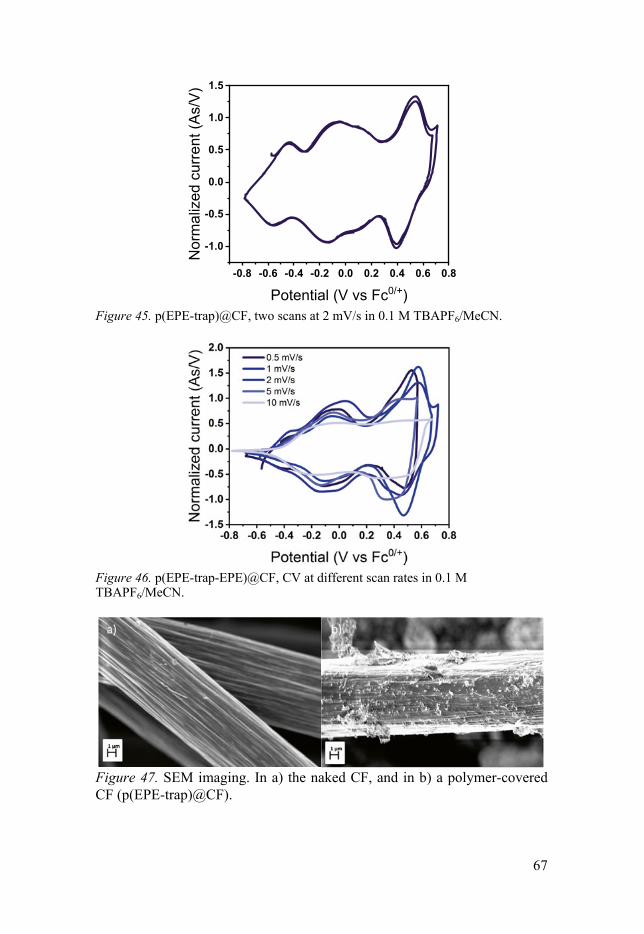
67
Figure 45. p(EPE-trap)@CF, two scans at 2 mV/s in 0.1 M TBAPF6/MeCN.
Figure 46. p(EPE-trap-EPE)@CF, CV at different scan rates in 0.1 M TBAPF6/MeCN.
Figure 47. SEM imaging. In a) the naked CF, and in b) a polymer-covered CF (p(EPE-trap)@CF).
-0.8 -0.6 -0.4 -0.2 0.0 0.2 0.4 0.6 0.8
-1.0
-0.5
0.0
0.5
1.0
1.5
Nor
mal
ized
cur
rent
(A
s/V
)
Potential (V vs Fc0/+)
68
Concluding remarks and future perspective
For long, the focus of battery development has been on increased energy density and reduced cost. Now it is due time to expand that focus and give as much attention to the sustainability aspect. Not all batteries need to provide the same energy density, since there are numerous of applications for batter-ies where parameters such as temperature stability, charging rate, cycle life, recyclability and biocompatibility can be of higher importance. A diversity of battery chemistries, answering to different needs, will probably exist in the future and organic matter based batteries will be one of them.
In this thesis, CRP materials based on PEDOT as the polymer backbone functionalized with HQ and pyridine side groups were explored as organic energy storage materials. Regarding the random copolymers, compositional analysis indicated an ideal ratio between the pyridine and the HQ units, con-cluded from a comparative study of the relative capacity in organic vs protic electrolyte. With reversible redox reactions in aprotic electrolytes even the uncontrolled random copolymers point to the suitability of proton trap mate-rials for high potential organic energy storage applications. With the subse-quent controlled proton trap materials, produced from trimeric precursors through the PDP-method, the activity and stability could be assessed due to the known weight and capacity.
In situ studies were performed where electronic and structural changes were recorded spectroscopically during CV-measurements. The polaron and bandgap transitions from the polymer backbone, as well as the HQ and BQ transitions of the capacity carrying PG could be detected.
The proton trap functionality, enabling usage in any (aprotic) electrolyte, and the resulting proton cycling at high potential of the HQ, bring forward a promising candidate for sustainable energy storage. The high stability and relatively fast cycling in ILs can possibly be applied for high temperature batteries where ILs can be applied as to increase the stability of the electro-lyte. Still, optimization of the active material, in order to increase the capaci-ty, and of the battery composition is left uncharted.
To develop the materials further, as to approach optimal stability and re-dox matching, other conducting polymers could be evaluated as backbones for CRP-materials, along with substitutions on the Q-ring. In this thesis only pyridine has been applied as the proton acceptor, but other bases should also be possible. As the pyridine ring seems to affect the polymerizability of EDOT monomers perhaps other bases could have a less effect on this matter.

69
Further, the radical formation would be interesting to investigate by in situ EPR, for instance the SQ that usually forms in aprotic environment, which here was seen in protic environment for P4 (Figure 33).
The three main causes for the ever increasing demand for energy storage is: the transition to renewable energy production for the grid, an increasing number of electronic devices and smart gadgets, and electrification of the transport sector. The aim here is not to replace all batteries with proton trap devices, but the extreme demand for energy storage requires many different battery chemistries to be developed, answering to varying specifications from e.g. cycling stability and charging rate to biodegradability and recycla-bility.
70
Svensk sammanfattning
Batterier är idag en självklarhet i våra liv, såväl i hemmet, på arbetsplatsen som när vi är på ute på språng. En sådan självklarhet, precis som med vatten i kranen, är det sällan man funderar över mer än ifall batteriet är tillräckligt laddat eller ej, men kanske borde vi fundera mer kring våra elektriska appa-rater och batterierna de drivs med. Batterier i eldrivna bilar medför en för-bättrad luftkvalitet genom att inte släppa ut några avgaser när de används, dock sker utsläppen någon annanstans, nämligen under själva tillverkningen.
Dagens batterier kräver gruvdrift, vilket ses som en smutsig verksamhet som både kräver stora mängder energi och vatten, förutom att det även för-stör marken där de finns. Ofta återfinns gruvorna, varifrån vi utvinner våra batterimineral, i mindre bemedlade länder där ofta markanvändare blir så att säga överkörda: det är inte bara specifikt gruvhålets inverkan på naturen som är negativt för lokalborna utan även den nedsmutsning som gruvbrytnings-processen resulterar i, vilket kan leda till förgiftad mark på en större yta un-der många år framåt, då man inte kommer kunna använda marken för att exempelvis odla mat på.
Utvecklingen av batterimaterial går framåt, och likaså återvinningsproces-sen, vilken i framtiden kommer att bli en självklar del i batteriernas livscy-kel, men där är vi inte än idag. Med det ständigt ökande behovet av batte-rikapacitet kommer framtidens batterier troligen finnas i många olika ke-miska sammansättningar. Med utökad valbarhet kommer man lättare att kunna anpassa batterier efter den tilltänkta applikationen, vilket kan kräva olika typer av egenskaper i fokus. Alla batterier bör självklart vara så säkra som möjligt, framförallt de för personlig användning. Batterier till bilar skall exempelvis ha så hög kapacitet per viktenhet som möjligt, klara det klimat där de skall användas (exempelvis temperaturskiftningar) och kunna laddas snabbt när det behövs. Relativt desamma egenskaper gäller för portabel elektronik såsom mobiltelefoner och laptops. För annan småelektronik krävs ofta inte samma laddningskapacitet, utan där kan exempelvis laddningsstabi-litet och kostnad vara viktigare. Startbatterier till bilar är en annan vanlig applikation. Där används bly-syra-batterier, vilka baseras på 150 år gammal teknik. På senare tid har även stationära batterier för energilagring till nätet börjat produceras. Ofta består dessa av flödesbatterier, vilka har en gigantisk volym eftersom energin lagras i lösta molekyler i tankar och lösningarna pumpas runt genom ett membran.
71
Batterier går även att göras från organiskt material. Det som krävs av ett elektrodmaterial är först och främst laddningskapacitet, det vill säga energin i batteriet som skall användas för att driva elektroniken, samt ledningsför-måga för att kunna leda energin. Dessa två förmågor återfinns i polymera material kallade ledande redoxpolymerer (CRP). CRP-material består av en redoxgrupp, som står för huvuddelen av laddningskapaciteten, samt en le-dande polymer. Den ledande polymeren i sin tur, vilket namnet antyder, leder ström. En redoxgrupp som ofta används, så också i denna avhandling, är kinonen. Den återfinns som laddningsbärare i många naturliga system, såsom i fotosyntesen. Hydrokinonen, 1,4-dihydroxybensen, har en låg vikt och producerar två elektroner samt två protoner då den oxideras. Detta ger sammantaget en hög teoretisk specifik kapacitet på 486 mAh/g vilket är mer än dubbelt så mycket som katodmaterialen i dagens litiumjonbatterier. Ge-nom att koppla den på en ledande polymer så får man ett batterimaterial som inte behöver några additiv för att fungera. För att maximera spänningen och därmed också energidensiteten för ett batterimaterial så är organiska elektro-lyter bättre än vattenbaserade. Vattenbaserade elektrolyter begränsas av vattenoxidation samt vätereduktion, vilka tillsammans utgör ett potential-fönster på drygt 1 V. Med organiska elektrolyter kan potentialfönstret istället utökas till 4-5 V. Dock medför organiska elektrolyter en annan begränsning, i och med användandet av hydrokinonen och dess protonkopplade elektron-överföring, nämligen att de är aprotiska. Detta resulterar i att de protoner som avges under oxidationen diffunderar bort och blir svårtillgängliga då de behövs för att ge en reversibel reduktionscykel. För att kunna nyttja hydro-kinonen som laddningsbärare i organiska elektrolyter behövs därför något som håller kvar protonerna så att de finns tillgängliga i materialet vid redukt-ionen. För att ta hand om protonerna då de avges från hydrokinonen kan protonfällor användas i form av pyridiner, vilka är svaga baser. För att ener-gilagringsfunktionen skall fungera behövs även, som tidigare nämnts, led-ningsförmåga vilket kan ges av en ledande polymer. Dock måste ledande polymerer vara dopade för att kunna leda ström, vilket görs vid olika poten-tialer för olika polymerer, där laddningsbärare skapas i form av hål eller elektroner. Dopningen, och därmed även ledningsförmågan, måste ske före laddningsbärarens (här hydrokinonens) redoxreaktion, vilket benämns som redoxmatchning. Om redoxmatchning inte finns blir materialet oanvändbart för energilagring om inte andra ledningsadditiv tillförs.
I denna avhandling har CRP-material använts bestående av hydrokinoner som laddningsbärare och pyridingrupper som protonfångare, vilka är kopp-lade till EDOT-baserade ledande polymerkedjor, i syfte att utveckla hög-potentialmaterial för organisk energilagring. Materialen har huvudsakligen undersökts i organiska elektrolyter för att utröna cyklingsstabiliteten hos dessa kinonbaserade CRPs med protonfällor där protonerna annars kan dif-fundera iväg. CRP-materialen i avhandlingen består dels av sampolymerer producerade från lösning vilka därmed har en slumpartad, icke-kontrollerad,
72
struktur, samt av kontrollerade polymerer producerade genom deponering med efterföljande polymerisering (en process kallad PDP) av funktional-iserade trimerenheter. De sistnämnda har förutom en kontrollerad struktur även en känd massa vilket ger större möjlighet att kvantitativt kontrollera materialets energilagringsfunktion. Materialen i denna avhandling har vidare studerats med avseende på redoxmatchning, kinetik, masstransport samt elektronöverföringar och strukturella förändringar i molekylen. Detta har undersökts genom in situ metoder såsom konduktansmätningar (med IDA), svephastighetsstudier, EQCM, UV/Vis och FTIR. Materialens yta har stude-rats mikroskopiskt med SEM före och efter battericykling samt före och efter deponering, bland annat i genomskärning, samt med EDS för uppskattning av materialets sammansättning. Slutligen har batteriprototyper, där litiumme-tall använts som anod, analyserats med avseende på främst cyklingsstabilitet. Uppskalningsförsök har gjorts i form av kompositmaterial, där en ledande kolfilt har använts som elektrodsubstrat vilket protonfälletrimererna depone-rats på. Kompositmaterialen har resulterat i en ökning av de kontrollerade materialen från 0,33 till 5 mg/cm2 elektrodyta.
Arbetet som presenteras i denna avhandling visar att CRP-material med protonfällor fungerar för energilagring utan att några additiv tillsätts, så länge redoxmatching finns mellan den ledande polymeren och den redoxak-tiva sidogruppen. Vidare möjliggör applicering av protonfällor att hydroki-noner kan cykla protoner reversibelt även i organiska elektrolyter, något som medför att protonfällematerial kan användas i organisk energilagring för högpotentialapplikationer.

73
Acknowledgement
I will always remember the years (2015-2021) as a PhD student at the divi-sion of Nanotechnology and Functional Materials (NFM) in Uppsala and the people I have met during this time. In one way or another all of you have contributed to the work of this thesis, by friendship, knowledge or help in other ways.
First and foremost, I want to give a big thank you to my main supervisor, Prof. Martin Sjödin, the leader of the battery group within NFM: you have helped me throughout these years with your huge scientific knowledge and guidance. Your fundamental understanding of electrochemistry and peda-gogical way of explaining it to us PhDs has been invaluable!
Then I want to thank my supervisor, Dr Rikard Emanuelsson, who with admirable organic synthesis skills made most of the molecules used in this thesis (after realizing during the first year that we would never make it to thesis production with my own synthesis skills)! You always make time for me and my questions, whether they are relevant or not =) Thank you also for the company during stroller walks with our children, and hang outs at the playground.
Big thanks to my supervisor Prof. Maria Strømme, head of NFM, always super busy but will still find the time for you! You always come with posi-tive and encouraging comments and no one has a better hawk’s eye for find-ing errors in a text. I miss our lunch runs, 5-10 times up the steepest hill of Uppsala, to make effective training with little time. I have also appreciated the early morning coffee together when not many others are at work and we talk about the latest trail run or interesting book one has read.
I also want to thank my supervisor Prof. Adolf Gogoll, always kind and helpful, who introduced me to the work and synthesis labs at BMC during the first year.
A big thank you to the past members of the battery group; Li, Xiao and Christoffer for interesting discussions during meetings and at conferences. To Huan, for your kindness and being a joke-machine during long days in the lab. To Hao, for being an excellent travel companion and friend. A spe-cial thank you to Mia, who I shared the main part of my studies with. You were a rock both in the lab and outside of Ångström. Thank you also for the times you spent with Sixten, he adores you!
Thank you to all the present colleagues and friends in the organic battery group; Christian, my roomie, for the many discussions, lunch walks and

74
early swim training, and for briefing all your interesting ideas with me (un-less I’m in the zone). Thank you Rebecka, Felicia, Philipp, Tyran, Carlos and Josep, for interesting discussions during group meetings and literature seminars and for great company in the electrochemistry lab. Thanks to Kouki Oka, our Japanese colleague, always bringing gifts and sweets from Japan and always working with a smile and a lot of energy.
Thanks also to the rest of the NFM-group: Anna, Ribooga, Evgenii, Xuey-ing, Shengyang, Christos, Michelle and Lulu, good luck when it is your time for defence! Thanks also to former colleagues and friends: Maria, Simon and Alex, for the many social nights and early coffee together, Cecilia, Viviana and Chris, for the many laughters and lunch runs, Sara, for the hang outs and play dates with our kids and especially for taking care of Sixten when I was in labor with Astrid! And to the seniors and post-docs; Natalia, Albert, Ken, Jonas, Ocean, Chao, Johan, Carlos and Petter, thank you for the scientific knowledge you have shared, the open discussions, and for the great company during lunches and social events. Thanks Teresa for being a great training partner and friend, your laughter is contagious and you even look happy when you’re angry!
Thanks to Prof. Daniel Brandell, Dr Guiomar Hernández, Dr Stéven Re-nault, Dr Nerea Casado and Dr Fernando Ruipérez for great collaborations.
And thanks to everyone else who helped me; with administrative stuff, rescuing a computer failure or when I got lost in some other matter: Ingrid Ringård, Jonatan Bagge, Maria Skoglund, Jörgen Olsson, and probably many more…
Thanks to the people at BMC where I spent some months: Magnus, San-dra, Anna and Michael, for the synthesis tips and tricks, interesting discus-sions and fika times!
I also want to give a big thank you (Eskerrik asko!) to Prof. David Mecer-reyes and his research group in the beautiful city of Donostia-San Sebastián, where I stayed during a research visit for 6-months. You were all so kind, helpful and welcoming, even though I did not speak any Spanish (or Basque) when I arrived! I will always remember this time and I hope to come back and visit someday.
My gratitude goes also to Energimyndigheten and SweGRIDS for financ-ing this research, and for the annual conference providing networking and interesting discussions.
Thank you also to InnoEnergy PhD School, which was a great opportuni-ty for networking and interesting courses across Europe, and providing the funding for the mobility to Spain.
Thanks also to all other scholarships I have obtained in order to go to in-teresting conferences with inspiring seminars and recharging venues. This is the bonus of being a PhD =)
For the people outside of Ångström, Thank you Hanna and Emma, for everything we have shared since the first days at Chalmers, I would never

75
have survived without you! Thank you Lina, my dear cousin, for always being so fun and the best supporter. And thank you Julia (and Martin) for the many dinners and weekends together, to put the mind off work for a while!
Thanks Hanna de la Motte and Maria Abrahamsson, for the MSc Thesis work that introduced me to the complexity of electrochemistry, which by a coincidence brought me to Uppsala.
And last but not least, thanks to my beloved family: my brothers Jens and Per, my dear grandparents Karin and Sture, who have inspired me to adven-tures and always been my biggest supporters, and my parents Kristina and Karl-Erik; I said that I would definitely never become an engineer like the two of you because it seemed so boring to be on the computer all the time! Could I have been more wrong =) Dad, you disappeared way too early and I am so sad my kids will never meet you. We will always miss you ♥
A big thanks to my parents in law, Eric and Mona, always providing care and support for our family, and taking care of the kids when we need to have our hands free.
Finally, my own little family: Victor, with love and kindness, always be-ing by my side through good times and bad times (and sleepless times). Six-ten, my amazing and energetic 4-year old, born in the midst of a PhD; you made me realize what is important in life! And my wonderful daughter Astrid, born in the midst of a pandemic; thank you for sleeping a bit better than your brother. I love you all!
76
References
1. U. N. T. Collection, Journal, 2015. 2. D. Larcher and J. M. Tarascon, Nat. Chem., 2015, 7, 19-29. 3. H. Chen, M. Armand, G. Demailly, F. Dolhem, P. Poizot and J.-M. Tarascon,
ChemSusChem, 2008, 1, 348-355. 4. M. Armand and J. M. Tarascon, Nature, 2008, 451, 652-657. 5. B. Dunn, H. Kamath and J.-M. Tarascon, Science, 2011, 334, 928-935. 6. A. Toor, A. Wen, F. Maksimovic, A. M. Gaikwad, K. S. J. Pister and A. C.
Arias, Nano energy, 2021, 82, 105666. 7. M. R. Palacin and A. de Guibert, Science, 2016, 351, 1253292. 8. T. Placke, A. Heckmann, R. Schmuch, P. Meister, K. Beltrop and M. Winter,
Joule, 2018, 2, 2528-2550. 9. W. Lv, Z. Wang, H. Cao, Y. Sun, Y. Zhang and Z. Sun, ACS Sustain. Chem.
Eng., 2018, 6, 1504-1521. 10. K. Oka, C. Strietzel, R. Emanuelsson, H. Nishide, K. Oyaizu, M. Strømme
and M. Sjödin, Electrochem. commun., 2019, 105, 106489. 11. C. Friebe, A. Lex-Balducci and U. S. Schubert, ChemSusChem, 2019, 12,
4093-4115. 12. S. Wang, F. Li, A. D. Easley and J. L. Lutkenhaus, Nat. Mater., 2019, 18, 69-
75. 13. R. Noriega, J. Rivnay, K. Vandewal, F. P. Koch, N. Stingelin, P. Smith, M.
F. Toney and A. Salleo, Nat. Mater., 2013, 12, 1038-1044. 14. K. S. Park, S. B. Schougaard and J. B. Goodenough, Adv. Mater., 2007, 19,
848-851. 15. S. S. Zhu and T. M. Swager, Adv. Mater., 1996, 8, 497-500. 16. C. Karlsson, H. Huang, M. Strømme, A. Gogoll and M. Sjödin, J. Phys.
Chem. C, 2014, 118, 23499-23508. 17. G. Zotti, A. Berlin, G. Pagani, G. Schiavon and S. Zecchin, Adv. Mater.,
1995, 7, 48-52. 18. B. J. Holliday and T. M. Swager, ChemComm, 2005, DOI:
10.1039/B408479A, 23-36. 19. T. Reddy, Linden's Handbook of Batteries, 4th Edition, McGraw-Hill Educa-
tion, 2010. 20. A. J. F. Bard, L. R. , Electrochemical methods: Fundamentals and Applicati-
ons, John Wiley & Sons, New York, second edn., 2001. 21. J. T. Warner, Lithium-Ion Battery Chemistries: A Primer, Elsevier, Ox-
ford;San Diego;, 2019. 22. Y. Lu and J. Chen, Nat. Rev. Chem., 2020, 4, 127-142. 23. J. Betz, G. Bieker, P. Meister, T. Placke, M. Winter and R. Schmuch, Adv.
Energy Mater., 2019, 9, 1803170. 24. B. E. Conway, J. O. M. Bockris and I. A. Ammar, Trans. Faraday Soc.,
1951, 47, 756. 25. B. E. Conway, J. Electrochem. Soc., 1991, 138, 1539-1548.
77
26. Z. Wang, P. Tammela, P. Zhang, M. Strømme and L. Nyholm, J. Mater. Chem. A, 2014, 2, 16761-16769.
27. H. Wang, R. Emanuelsson, H. Liu, K. Edström, F. Mamedov, M. Strømme and M. Sjödin, ACS Appl. Energy Mater., 2019, 2, 7162-7170.
28. M. Sterby, R. Emanuelsson, F. Mamedov, M. Strømme and M. Sjödin, Elec-trochim. Acta, 2019, 308, 277-284.
29. F. Otteny, V. Perner, D. Wassy, M. Kolek, P. Bieker, M. Winter and B. Es-ser, ACS Sustain. Chem. Eng., 2020, 8, 238-247.
30. C. Karlsson, C. Strietzel, H. Huang, M. Sjödin and P. Jannasch, ACS Appl. Energy Mater., 2018, 1, 6451-6462.
31. T. B. Schon, B. T. McAllister, P. F. Li and D. S. Seferos, Chem. Soc. Rev., 2016, 45, 6345-6404.
32. A. Mauger, C. Julien, A. Paolella, M. Armand and K. Zaghib, Materials, 2019, 12, 1770.
33. B. Häupler, A. Wild and U. S. Schubert, Adv. Energy Mater., 2015, 5, 1402034.
34. C. S. Strietzel, M.; Huang, H.; Strømme, M.; Emanuelsson, R.; Sjödin M., Angew. Chem., Int. Ed.. 2020, 59, 9631-9638.
35. R. Emanuelsson, M. Sterby, M. Stromme and M. Sjodin, J. Am. Chem. Soc., 2017, 139, 4828-4834.
36. B. Yang, L. Hoober-Burkhardt, S. Krishnamoorthy, A. Murali, G. K. S. Pra-kash and S. R. Narayanan, J. Electrochem. Soc., 2016, 163, A1442-A1449.
37. Y. Liang, Z. Tao and J. Chen, Adv. Energy Mater., 2012, 2, 742-769. 38. J. Xie and Q. Zhang, J. Mater. Chem. A, 2016, 4, 7091-7106. 39. S. Renault, D. Brandell and K. Edstrom, ChemSusChem, 2014, 7, 2859-2867. 40. J. J. Shea and C. Luo, ACS Appl. Mater. Interfaces, 2020, 12, 5361-5380. 41. C. Y. Chan, P.-K. Lee, Z. Xu and D. Y. W. Yu, Electrochim. Acta, 2018,
263, 34-39. 42. S. Perticarari, Y. Sayed-Ahmad-Baraza, C. Ewels, P. Moreau, D. Guyomard,
P. Poizot, F. Odobel and J. Gaubicher, Adv. Energy Mater., 2018, 8, 1701988.
43. T. M. Swager, Macromolecules, 2017, 50, 4867-4886. 44. G. Inzelt, Conducting polymers: a new era in electrochemistry, Springer,
Heidelberg;New York;, 2nd edn., 2012. 45. C. K. Chiang, C. R. Fincher, Y. W. Park, A. J. Heeger, H. Shirakawa, E. J.
Louis, S. C. Gau and A. G. MacDiarmid, Phys. Rev. Lett., 1977, 39, 1098-1101.
46. J. Roncali, P. Blanchard and P. Frère, J. Mater. Chem., 2005, 15, 1589. 47. J. Heinze, B. A. Frontana-Uribe and S. Ludwigs, Chem. Rev., 2010, 110,
4724-4771. 48. J. L. Bredas, D. Beljonne, V. Coropceanu and J. Cornil, Chem. Rev., 2004,
104, 4971-5004. 49. M. Geoghegan and G. Hadziioannou, Polymer electronics, Oxford University
Press, Oxford, First edn., 2013. 50. L. D. S. Lapitan, B. J. V. Tongol and S.-L. Yau, Electrochim. Acta, 2012, 62,
433-440. 51. M. N. Gueye, A. Carella, J. Faure-Vincent, R. Demadrille and J.-P.
Simonato, Prog. Mater. Sci., 2020, 108, 100616. 52. T. Takano, H. Masunaga, A. Fujiwara, H. Okuzaki and T. Sasaki,
Macromolecules, 2012, 45, 3859-3865. 53. P. Novak, K. Muller, K. S. Santhanam and O. Haas, Chem. Rev., 1997, 97,
207-282.
78
54. J. Kim, J. Lee, J. You, M.-S. Park, M. S. A. Hossain, Y. Yamauchi and J. H. Kim, Mater. Horiz., 2016, 3, 517-535.
55. K. Lee, S. Cho, S. H. Park, A. J. Heeger, C. W. Lee and S. H. Lee, Nature, 2006, 441, 65-68.
56. O. Bubnova, Z. U. Khan, H. Wang, S. Braun, D. R. Evans, M. Fabretto, P. Hojati-Talemi, D. Dagnelund, J. B. Arlin, Y. H. Geerts, S. Desbief, D. W. Breiby, J. W. Andreasen, R. Lazzaroni, W. M. Chen, I. Zozoulenko, M. Fahlman, P. J. Murphy, M. Berggren and X. Crispin, Nat. Mater., 2014, 13, 190-194.
57. J. L. Bredas and G. B. Street, Acc. Chem. Res., 1985, 18, 309-315. 58. M. Nowak, S. D. D. V. Rughooputh, S. Hotta and A. J. Heeger, Macromole-
cules, 1987, 20, 965-968. 59. V. Coropceanu, J. Cornil, D. A. da Silva Filho, Y. Olivier, R. Silbey and J. L.
Bredas, Chem. Rev., 2007, 107, 926-952. 60. K. S. Feldman, D. K. Hester, 2nd and J. H. Golbeck, Bioorg Med Chem Lett,
2007, 17, 4891-4894. 61. J. Q. Chambers, in Quinonoid Compounds, 1974, 2010, pp. 737-791. 62. P. S. Guin, S. Das and P. C. Mandal, Int J Electrochem., 2011, 2011, 1-22. 63. T. M. Alligrant, J. C. Hackett and J. C. Alvarez, Electrochim. Acta, 2010, 55,
6507-6516. 64. H. Wang, R. Emanuelsson, A. Banerjee, R. Ahuja, M. Strømme and M.
Sjödin, J. Phys. Chem. C, 2020, 124, 13609-13617. 65. M. Quan, D. Sanchez, M. F. Wasylkiw and D. K. Smith, J. Am. Chem. Soc.,
2007, 129, 12847-12856. 66. R. Emanuelsson, H. Huang, A. Gogoll, M. Strømme and M. Sjödin, J. Phys.
Chem. C, 2016, 120, 21178-21183. 67. M. Sterby, R. Emanuelsson, X. Huang, A. Gogoll, M. Strømme and M.
Sjödin, Electrochim. Acta, 2017, 235, 356-364. 68. T. Trefz, M. K. Kabir, R. Jain, B. O. Patrick and R. G. Hicks, Can. J. Chem.,
2014, 92, 1010-1020. 69. P. D. Astudillo, J. Tiburcio and F. J. González, J. Electroanal. Chem., 2007,
604, 57-64. 70. J. L. Brédas, G. B. Street, B. Thémans and J. M. André, J. Chem. Phys.,
1985, 83, 1323. 71. C. Karlsson, H. Huang, M. Strømme, A. Gogoll and M. Sjödin, J. Phys.
Chem. C, 2013, 117, 23558-23567. 72. C. Karlsson, H. Huang, M. Strømme, A. Gogoll and M. Sjödin, RSC Adv.,
2015, 5, 11309-11316. 73. M. Piccolino, Brain Res. Bull., 1998, 46, 381-407. 74. L. Fabbrizzi, Angew. Chem., Int. Ed.. 2019, 58, 5810-5822. 75. C. H. Hamann, A. Hamnett and W. Vielstich, Electrochemistry, Wiley-VCH,
Weinheim, 2. completely rev. and updat edn., 2007. 76. J. S. Jayson, Am. J. Phys., 2014, 82, 60-65. 77. W. B. Jensen, J. Chem. Educ., 2012, 89, 1208-1209. 78. G. Salinas and B. A. Frontana-Uribe, ChemElectroChem, 2019, 6, 4105-
4117. 79. G. Sauerbrey, Z. Phys., 1959, 155, 206-222. 80. I. Zozoulenko, A. Singh, S. K. Singh, V. Gueskine, X. Crispin and M.
Berggren, ACS Appl Polym Mater, 2019, 1, 83-94. 81. L. Yang, X. Huang, A. Gogoll, M. Strømme and M. Sjödin, J. Phys. Chem.
C, 2015, 119, 18956-18963. 82. P. Reinold, K. Bruchlos and S. Ludwigs, Polym. Chem., 2017, 8, 7351-7359.
79
83. X. Huang, L. Yang, J. Bergquist, M. Strømme, A. Gogoll and M. Sjödin, J. Phys. Chem. C, 2015, 119, 27247-27254.
84. M. T. Huynh, C. W. Anson, A. C. Cavell, S. S. Stahl and S. Hammes-Schiffer, J. Am. Chem. Soc., 2016, 138, 15903-15910.
85. H. G. Viehe, Z. Janousek, R. Merenyi and L. Stella, Acc. Chem. Res., 1985, 18, 148-154.
86. M. E. Peover, J. Chem. Soc., 1962, DOI: 10.1039/jr9620004540, 4540. 87. L. Åkerlund, R. Emanuelsson, G. Hernández, M. Strømme and M. Sjödin, J.
Mater. Chem. A, 2020, 8, 12114-12123. 88. L. Åkerlund, R. Emanuelsson, G. Hernández, F. Ruipérez, N. Casado, D.
Brandell, M. Strømme, D. Mecerreyes and M. Sjödin, ACS Appl. Energy Ma-ter., 2019, 2, 4486-4495.
89. L. Åkerlund, R. Emanuelsson, S. Renault, H. Huang, D. Brandell, M. Strømme and M. Sjödin, Adv. Energy Mater., 2017, 7, 1700259.
90. D. Cook, Can. J. Chem., 1961, 39, 2009-2024. 91. V. Balevicius, R. Bariseviciute, K. Aidas, I. Svoboda, H. Ehrenberg and H.
Fuess, Phys. Chem. Chem. Phys., 2007, 9, 3181-3189. 92. R. Langner and G. Zundel, J. Chem. Soc., Faraday Trans., 1995, 91, 3831-
3838. 93. B. Golec, P. Das, M. Bahou and Y.-P. Lee, J. Phys. Chem. A, 2013, 117,
13680-13690.
Acta Universitatis UpsaliensisDigital Comprehensive Summaries of Uppsala Dissertationsfrom the Faculty of Science and Technology 2026
Editor: The Dean of the Faculty of Science and Technology
A doctoral dissertation from the Faculty of Science andTechnology, Uppsala University, is usually a summary of anumber of papers. A few copies of the complete dissertationare kept at major Swedish research libraries, while thesummary alone is distributed internationally throughthe series Digital Comprehensive Summaries of UppsalaDissertations from the Faculty of Science and Technology.(Prior to January, 2005, the series was published under thetitle “Comprehensive Summaries of Uppsala Dissertationsfrom the Faculty of Science and Technology”.)
Distribution: publications.uu.seurn:nbn:se:uu:diva-438906
ACTAUNIVERSITATIS
UPSALIENSISUPPSALA
2021


![Supplementary Informations Calix[4]phyrin based redox ... · 1 Supplementary Informations Calix[4]phyrin based redox architectures: towards new molecular tools for electrochemical](https://img.pdfslide.net/doc/110x75/5fe0a043f1a067315a77d374/supplementary-informations-calix4phyrin-based-redox-1-supplementary-informations.jpg)
![Complementing Nanoscale Galvanic Exchange with Redox ... · [2] Galvanic exchange is a classic electrochemical redox process thermodynamically driven by the difference in the redox](https://img.pdfslide.net/doc/110x75/5f6916c0235e487474390740/complementing-nanoscale-galvanic-exchange-with-redox-2-galvanic-exchange-is.jpg)