Embed Size (px)
Citation preview

Int. J. Electrochem. Sci., 6 (2011) 1522 - 1536
International Journal of
ELECTROCHEMICAL SCIENCE
www.electrochemsci.org
Electrochemical Parameters of Equiaxed and Columnar Grain
Arrays of a Pb1wt%Sn Alloy for Lead-Acid Battery
Applications
Wislei R. Osório1,*
, Leandro C. Peixoto2, Amauri Garcia
2
1 School of Applied Sciences / FCA, University of Campinas, UNICAMP, Campus Limeira, 1300,
Pedro Zaccaria St. , Jd. Sta Luiza, 13484-350 Limeira, SP, Brazil 2
Department of Materials Engineering, University of Campinas, UNICAMP, P.O. Box 6122, 13083–
970 Campinas, SP, Brazil *E-mail: [email protected]
Received: 9 March 2011 / Accepted: 23 April 2011 / Published: 1 May 2011
The aim of this study is to evaluate the effect of different macro-morphologies of an as-cast Pb-
1wt.%Sn alloy on the electrochemical behaviour in a 0.5 M H2SO4 solution at 25 oC. Equiaxed and
columnar morphologies containing coarse and fine cellular spacings were produced. Cylindrical
permanent low-carbon steel and a water-cooled unidirectional solidification system were employed
permitting the polidirectional and unidirectional samples be produced, respectively, and to be
experimentally examined as a function of the grain size. Electrochemical impedance spectroscopy
(EIS) diagrams, potentiodynamic polarization curves and an equivalent circuit analysis were used to
evaluate the electrochemical response. It was found that an equiaxed macrostructure, independently of
having coarse or fine grains, tends to yield higher corrosion resistance than a columnar macrostructure.
The pre-programming of the macromorphology of as-cast Pb-Sn alloys can be used as an alternative
way to produce components of lead-acid batteries with improved electrochemical corrosion behaviour
Keywords: Pb-Sn alloys, lead-acid battery grids, grain macrostructure, electrochemical resistance
1. INTRODUCTION
During casting a wide range of the operational conditions may produce different
macrostructural morphologies. Nowadays there exists a great concern in industrial environment with
the production and development of materials presenting a reasonable range of properties, e.g.
mechanical properties and corrosion resistance. Modifications on the grid manufacturing processes
have been tried by lead-acid batteries manufacturers in order to decrease battery grid weight as well as

Int. J. Electrochem. Sci., Vol. 6, 2011
1523
to reduce the production costs, and to increase the battery life-time cycle and the corrosion-resistance
[1-5]. Lead-acid batteries are widely applied in automotive and telecommunication services [2-3]. A
number of their components are generally produced by different casting processes, such as
conventional continuous casting, continuous cast-expanded and cast-rolled, and conventional casting
which provide a wide range of cooling rates [1-2].
It is well-known that the grain structure of a casting may take many forms during solidification,
being characterized by both the macrostructure and the microstructure. The macrostructure is a
structural morphology that generally consists of three different zones: chill, columnar and equiaxed
zones [6-9]. The growth direction of columnar grains is controlled by heat flow conditions during
solidification and the preferential crystallography growth direction, giving rise to anisotropic
properties [8-9]. The equiaxed structure is characterized by grains, which are randomly oriented and
grow equally in all directions to produce a material that is macroscopically isotropic [8-9]. In the as-
cast state, an alloy macrostructuraly characterized with columnar or equiaxed grains (macrostructure)
may possess within individual grains a dendritic or cellular network (microstructure) of continuously
varying solute content, second phases and possibly porosity and inclusions [10]. The growth of regular
cells is favored by low growth rate and low level of solute content during solidification of alloys, while
dendrite growth is provided by high growth rates and/or high solute content [11-12].
Considering the correlations between mechanical properties and grain size, it has generally
been found that the grain size reduction increases the tensile strength of metallic alloys [13]. The
electrochemical corrosion behaviour can also be connected with both the macrostructural morphology
and microstructural cellular or dendritic arrays. In this sense, some studies have focused on the
characterization of cellular and dendritic growth of Pb alloys. It was reported [14-19] that
microstructures having coarse cells are associated with better corrosion resistance than fine cellular
microstructures when considering experimental studies on Pb-Sb and Pb-Sn alloys subjected to
corrosion tests in a 0.5 M H2SO4 solution. Razaei and Damiri [4] have also reported that the control of
solidification variables has an important role on the electrochemical behaviour of lead-acid battery grid
alloys. In this sense, lead-acid battery manufacturers should alternatively consider the pre-
programming of the resulting microstructure of binary alloys by controlling solidification variables as
an important tool for the improvement of the corrosion response.
The present study aims to contribute to the development of correlations between equiaxed and
columnar grain morphologies of as-cast Pb-1wt.%Sn alloys and the corresponding electrochemical
behaviour in a 0.5M H2SO4 solution at 25 oC. The effects of both equiaxed and columnar grains,
typically obtained in polidirectionally and unidirectionally solidified castings, respectively, on the
corrosion resistance were examined.
2. EXPERIMENTAL PROCEDURE
Pb-1wt.%Sn alloy samples were prepared from commercially pure metals: Pb (99.89 wt%) and
Sn (99.99 wt%). The mean impurities were: Fe (0.10%), Si (0.07%), Cu (0.02%), besides other
elements with concentration less than 50 ppm. In order to obtain polidirectionally equiaxed grains, a

Int. J. Electrochem. Sci., Vol. 6, 2011
1524
permanent low-carbon steel (SAE 1020) mould (Fig. 1) with an internal diameter of 50 mm, a height
of 50 mm and a wall thickness of 3 mm was used. Two experiments were carried out: i) mould surface
polished and kept at the room temperature (±25 oC) and ii) mould surface completely covered with an
insulating alumina layer (of about 1 mm thick) with the mould pre-heated at 200 oC (±5
oC). The
former condition has permitted higher cooling rates to be attained during solidification (of about 10
K/s) and the latter has induced lower cooling rates (of about 0.5 K/s).
(a) (b) (c)
Figure 1. (a) Typical unidirectionally and (b) polidirectionally solidified castings macrostructures of a
Pb-1wt.%Sn alloy: (c) is a magnification detail of Fig.1 (b) and (d) is the permanent steel
mold.
A water-cooled unidirectional solidification system was also used in the experiments in order to
produce directionally columnar grains of Pb-Sn alloy samples. This system was designed in such way
that the heat was extracted only through the water-cooled bottom, promoting vertical upward
5mm
50 mm
(d)
50 mm

Int. J. Electrochem. Sci., Vol. 6, 2011
1525
directional solidification. From the water-cooled bottom to the top of the unidirectionally solidified
casting a wide range of cooling rates are obtained. More details concerning this solidification set-up
can be obtained in previous articles [11-12, 14-19].
All as-cast specimens were sectioned from the center of the ingot, ground, polished and etched
to reveal the macrostructure (the etchant was a mixture of aqueous solutions: 3:1 (in volume) HNO3
solution and 6:1 (in volume) ammonium molybdate). The samples were polished and etched by a 37
cm3
glacial acetic acid and 15 cm3of hydrogen peroxide solution at room temperature for
metallography. The microstructural characterization was carried out by using an optical microscopy
associated with an image processing system Neophot 32 (Carl Zeiss, Esslingen, Germany) and Leica
Quantimet 500 MC (Leica Imaging Systems Ltd, Cambridge, England) [19-20].
In order to evaluate the electrochemical corrosion behaviour of the Pb-1wt.%Sn alloy samples,
electrochemical corrosion tests were performed in a 1cm2 circular area of ground (600 grit SiC finish)
sample surfaces. Electrochemical impedance spectroscopy (EIS) measurements began after an initial
delay of 30 minutes for the samples to reach a steady-state condition. The tests were carried out with
the samples immersed in a stagnant and naturally aerated 500 cm3 of a 0.5 M H2SO4 solution at 25ºC
under a pH of about 0.9 (±0.05). A potentiostat (EG & G Princeton Applied Research, model 273A)
coupled to a frequency analyzer system (Solartron model 1250), a glass corrosion cell kit with a
platinum counter-electrode and a saturated calomel reference electrode (SCE) were used to perform the
EIS tests. The potential amplitude was set to 10 mV, peak-to-peak (AC signal), with 6 points per
decade and the frequency range was set from 100 mHz to 100 kHz. The samples were further ground
to a 1200 grit SiC finish, followed by distilled water washing and air drying before measurements.
Potentiodynamic measurements were also carried out in the aforementioned solution at 25oC
using a potentiostat at the same positions where the EIS tests were carried out. Using an automatic data
acquisition system, the potentiodynamic polarization curves were plotted and both corrosion rate and
potential were estimated by Tafel plots by using both anodic and cathodic branches at a scan rate of 0.2
mV s-1
from -250 mV (SCE) to +250 mV (SCE). This mentioned potentiodynamic range corresponds
to -1200 mV and -700 mV vs. Hg/Hg2SO4 electrode (MSE). Although the SCE electrode is not
commonly used in lead-acid system studies, a SCE electrode can also be used as a reference electrode
since the one inconvenient is the fact that chloride may contaminate the electrolyte, and other is to
convert from SCE to MSE or other potential scales (ASTM G3).
Duplicate tests for EIS and potentiodynamic polarization curves were carried out. In order to
supply quantitative support for discussions of these experimental EIS results, an appropriate model
(ZView version 2.1b) for equivalent circuit quantification has also been used.
3. RESULTS AND DISCUSSION
3.1. Macrostructural observations
Fig. 1 shows both the resultant unidirectionally and polidirectionally solidified castings
macrostructures for Pb-1wt.%Sn alloy. It can be seen that the growth of columnar grains prevailed

Int. J. Electrochem. Sci., Vol. 6, 2011
1526
along the entire casting length due to the water-cooled unidirectional system, as shown in Fig. 1(a). On
the other hand, the growth of equiaxed grains has prevailed along the entire casting when a permanent
mould was used, as depicted in Fig. 1(d). The mean grain size of coarse equiaxed and coarse columnar
macrostructures of Pb-1wt.%Sn alloy castings is about 7 (±1.8) mm.
Typical microstructures observed at the cross sections of the Pb-1wt.%Sn alloy castings are
shown in Fig. 2. It is important to remark that independently of the casting equiaxed or columnar
macromorphologies, the resulting microstructure consists of a completely cellular array, constituted by
a Pb-rich matrix (α-phase: solid solution of Sn in Pb) with a eutectic mixture in the intercellular
regions. The Pb-rich cellular matrix is depicted by dark regions with the intercellular eutectic mixture
being represented by light regions.
Figure 2. Typical cellular morphologies along the cross sections of the Pb-1wt.%Sn alloy castings: (a
and b) are coarse and (c and d) fine cellular spacings.
Coarse Columnar Cells
c = 96 (±5) m; dT/dt = 0.7oC/s
Coarse Equiaxed Cells
c = 180 (±15) m; dT/dt = 0.3oC/s
(a)
(b)
Fine Columnar Cells
c = 39 (±8) m; dT/dt = 1.8oC/s
Fine Equiaxed Cells
c = 34 (±5) m; dT/dt = 2.2oC/s
(c)
(d)

Int. J. Electrochem. Sci., Vol. 6, 2011
1527
Although a completely columnar grain prevailed along the casting length, the water-cooled
mould imposes higher values of cooling rates near the casting/chill surface (bottom of the casting) and
a decreasing profile along the casting length. This provides fine spacings close to the casting cooled
surface and coarser ones far from it [14-19]. As reported in previous studies [17-18], an experimental
power law relates the cellular spacing with the cooling rate: c = 65 (dT/dt)-0.5
. Although there exists a
variation of cellular spacings along the casting, in order to permit the corrosion behaviour of the cell
array of a unidirectionally (columnar) solidified macrostructure with the cells array of equiaxed grains
to be compared, only two orders of magnitude of cell size were considered: coarse (c = ± 100 m) and
fine (c = ± 40 m) columnar cells, as shown in Fig. 2.
These coarse and fine columnar cellular spacings are associated with cooling rates of 0.7 K/s
and 1.8 K/s, respectively, which correspond to positions of about 60mm and 30mm from the bottom of
the casting, respectively.
Considering the equiaxed grains, the cellular spacings solidified under low cooling rates (i.e.
0.3 K/s using insulated and pre-heated permanent mould) were about 180 m (±15 m) while the
cellular spacings of about 30 m (±2.5) were attained under higher cooling rates (i.e. 2.2 K/s using
permanent mould at room temperature). Fig. 2 depicts the typical cellular equiaxed morphologies
along the cross sections of the Pb-1wt.%Sn alloy castings.
3.2. Electrochemical behaviour measurements and equivalent circuit analysis
Fig. 3(a) depicts the Bode and Bode-phase diagrams representing the modulus of impedance (
/Z/ ) and phase angle ( ) as a function of the frequency ( F ). At least two time constants can be
associated to the kinetics of corrosion of coarse and fine cellular arrays of the Pb-1wt.%Sn alloy as
depicted in the Bode-phase plots of Fig. 3(a). It can be seen in a frequency range from 103 to 10
5 Hz, a
first time constant which can be associated with the reaction between the electrolyte and the tin-rich
phase in the intercellular region.
At low frequencies, in a range of about 0.1 and 40 Hz, the second time constant appears and
can be correlated to the reaction with the Pb-rich matrix. At frequencies between 10 Hz and 103 Hz,
interpretation of the nature and formation of the double electronic layer can be made, as discussed by
Mansfeld [20]. It can clearly be seen that the equiaxed structure provides a different kinetics (higher
growth rate) of double layer formation.
The resulting moduli of impedance ( /Z/ ) at 0.1 Hz are 2.7 k cm-2
and 0.2 k cm-2
for
equiaxed and columnar arrays, respectively. It is important to remember that equiaxed and columnar
grain morphologies have c of about 96 (±5) m and 180 (±15) m, respectively. Considering the
Bode-phase diagrams, maximum phase angles (máx.) of about 66o in 19Hz and 54 degrees in 39Hz are
observed for equiaxed and columnar cell spacings, respectively.
Experimental and simulated Nyquist plots are shown in Fig. 3(b). A higher semi-arc diameter
can be observed for the equiaxed sample if compared with that of the columnar sample. Both
components ZReal (in-phase) and the ZImaginary (out-of-phase) also show an appreciable increase (of
about 10 times) if the results of both samples are compared.

Int. J. Electrochem. Sci., Vol. 6, 2011
1528
Figure 3. (a) Experimental EIS diagrams (Bode and Bode-phase) e (b) experimental and simulated
Nyquist results for equiaxed and columnar coarse morphologies of the Pb-1wt.%Sn alloy in a
0.5 M H2SO4 solution at room temperature.
10-2
10-1
100
101
102
103
104
105
106
100
101
102
103
104
Modulu
s o
f Im
pedance (
Z )
[c
m-2]
Frequency ( F) [ Hz ]
Equiaxed array
Collumnar array
Pb-1wt.%Sn alloy
Coarse microstructures -20
-10
0
10
20
30
40
50
60
70
80
max.
Ph
ase
()
[ D
eg
ree
s ]
max.
(a)
0 100 200 500 1000 1500 2000 2500 3000
0
40
80
120
160
600
800
1000
0 2 4 6 8 10 12 14 16 18 200
2
4
6
8
10
12
14
Z Real
[ cm2 ]
Z Im
ag
ina
ry [
cm
2 ]
Pb-1wt.%Sn alloy
Coarse microstructures
Z Real
[ cm2 ]
Equiaxed array
Columnar array
Simulated ( ZView )
Z Im
ag
ina
ry [
cm
2 ]
(b)

Int. J. Electrochem. Sci., Vol. 6, 2011
1529
Figure 4. (a) Experimental EIS diagrams (Bode and Bode-phase) e (b) experimental and simulated
Nyquist results for equiaxed and columnar fine morphologies of the Pb-1wt.%Sn alloy in a 0.5
M H2SO4 solution at room temperature.
10-2
10-1
100
101
102
103
104
105
106
100
101
102
103
104
Modulu
s o
f Im
pedance (
Z )
[c
m-2]
Frequency ( F) [ Hz ]
Equiaxed array
Collumnar arrayPb-1wt.%Sn alloy
Fine microstructures -20
-10
0
10
20
30
40
50
60
70
80
max.
Ph
ase
()
[ D
eg
ree
s ]
max.
(a)
0 20 40 400 600 800 1000 1200
0
10
20
200
400
600
0 5 10 15 20 250
4
8
12
16
20
Z Real
[ cm2 ]
Z Im
ag
ina
ry [
cm
2 ]
Pb-1wt.%Sn alloy
Fine microstructures
Z Real
[ cm2 ]
Columnar array
Equiaxed array
Simulated ( ZView )
Z Im
ag
ina
ry [
cm
2 ]
(b)

Int. J. Electrochem. Sci., Vol. 6, 2011
1530
An interesting observation in Nyquist plots is that at low ZReal and ZImaginary a smaller capacitive
semi-arc is formed for the equiaxed sample, as shown in the corner (right left) of Fig. 3(b). Another
interesting observation from the results of the columnar sample is the slight trend to form a straight
line with a slope of 45o at lower frequencies, which can be due to induced oxide film formation
(product of corrosion).
Fig. 4 (a) also shows Bode and Bode-phase plots of fine microstructures (equiaxed and
columnar morphologies) which have also evidenced two time constants: i. observed between 103 to 10
5
Hz and ii. from 30 to 250 Hz. Similarly to the previous discussion, the first and second time constants
can also be associated with the reaction between the electrolyte and the tin-rich phase and the reaction
with the Pb-rich matrix, respectively. The corresponding / Z / at 0.1 Hz are 1.2 k cm-2
and 60 cm-2
.
The corresponding máx. values are 56o in 39 Hz and 37
o in 235 Hz which permits to conclude that / Z /
and máx decreased when compared to the corresponding values of the coarse structures. Besides, máx
is associated with higher frequencies which also give indications that a coarse structure tends to exhibit
lower susceptibility to corrosion action than a fine one. Fig. 4(b) depicts experimental and simulated
Nyquist plots. Higher capacitive semi-arcs are related to the equiaxed sample considering both
components ZReal and ZImaginary. It can also be observed the smaller capacitive semi-arc at low ZReal and
ZImaginary favoring the equiaxed sample. These experimental impedance parameters, give clear
indications that the coarse array of the Pb-1wt.%Sn alloy can be related to better electrochemical
behaviour when compared with the results which correspond to the fine array.
An equivalent circuit analysis has also been conducted, which is similar to those developed in
some previous articles [14-19, 22-27]. The proposed equivalent circuit used to fit the experimental data
is shown in Fig. 5. The impedance parameters obtained by the ZView® software, are shown in Table 1.
The fitting quality was evaluated by chi-squared (2) values of about 20 10
-4, as shown in Table 1.
Figure 5. Proposed equivalent circuit used to obtain impedance parameters.
The interpretations of the physical elements of the proposed equivalent circuit are similar to
those reported in previous studies [14-19, 22-27]. Rel denotes the electrolyte resistance which in Bode
plot is expressed in a high frequency limit (F > 1 kHz), R1 is the charge transfer resistance, and R2 (F <

Int. J. Electrochem. Sci., Vol. 6, 2011
1531
0.1 Hz) stands for a polarization resistance due to the participation of adsorbed intermediates. ZCPE(1)
and ZCPE(2) denote the double layer capacitance and the capacitance associated with the polarization
resistance R2. The parameters n1 and n2 are correlated to the phase angle, varying between -1 and 1. A
constant-phase element representing a shift from an ideal capacitor was used instead of the capacitance
itself, for simplicity. The impedance of a phase element is defined as ZCPE = [C (j) n
]-1
[14-19, 22-27],
where C is the capacitance; j is the electric current; is the frequency and -1 ≤ n ≤ 1. The value of n
seems to be also associated with the non-uniform distribution of current as a result of roughness and
surface defects [14-19]. Simulated and experimental results in Nyquist plots were shown in Figs. 3(b)
and 4(b).
Table 1 – Impedance parameters for the equiaxial and columnar Pb-1wt.%Sn alloy samples in
a 0.5 M H2SO4 solution at room temperature.
Coarse cellular morphology
Parameters Equiaxed array
c = 180 (±15) m
Columnar array
c = 96 (±5) m
Rel (cm-2
) 6.1 5.4
ZCPE (1) (Fcm-2
) 125 (± 15) 360 (± 19)
ZCPE (2) (Fcm-2
) 39 (± 1) 12 (± 3)
n1 0.65 0.60
n2 0.94 0.91
R1 (cm-2
) 17 (± 1) 13 (± 2)
R2 (cm-2
) 3000 (± 98) 1500 (± 185)
2 22 10
-4 18 10
-4
Fine cellular morphology
Parameters Equiaxed array Columnar array
Rel (cm-2
) 5.8 5.4
ZCPE (1) (Fcm-2
) 302 (± 25) 316 (± 18)
ZCPE (2) (Fcm-2
) 34 (± 5) 11 (± 8)
n1 0.65 0.57
n2 0.94 0.89
R1 (cm-2
) 13 (± 3) 120 (± 2)
R2 (cm-2
) 1400 (± 150) 180 (± 22)
2 17 10
-4 30 10
-4
In Table 1, the obtained values of R1 and R2 for fine cellular morphologies are lower than the
corresponding values for coarse morphologies. These results induce that the coarse cellular array has
better electrochemical behaviour than the fine cellular structure. When comparing these parameters
between equiaxed and columnar arrays, it can be seen that polarization resistances are favoring the
equiaxed grains in both coarse and fine arrays. These observations are in agreement with the EIS
parameters aforementioned.

Int. J. Electrochem. Sci., Vol. 6, 2011
1532
10-7
10-6
10-5
10-4
10-3
10-2
-0.70
-0.65
-0.60
-0.55
-0.50
-0.45
-0.40
-0.35
-0.30
Pb-1wt.%Sn alloy
Coarse microstructures
iPP
= 775 (± 12) Acm-2
Pote
ntia
l vs.
SC
E (
E
)
[ V
]
Current density ( i ) [ A/cm2 ]
Equiaxed
Columnar
i = 11.2 (± 4.3) Acm-2;
E = -528mV
i = 5.56 (± 1.8) Acm-2
E = -521mV
iPP
= 258 (± 10) Acm-2
(a)
10-7
10-6
10-5
10-4
10-3
10-2
-0.70
-0.65
-0.60
-0.55
-0.50
-0.45
-0.40
-0.35
-0.30
Pb-1wt.%Sn alloy
Fine microstructures
iPP
= 715 (± 10) Acm-2
Pote
ntial vs.
SC
E (
E
)
[ V
]
Current density ( i ) [ A/cm2 ]
Equiaxed
Columnar
i = 46 (± 5) Acm-2;
E = -538mV
i = 36.7 (± 2.8) Acm-2
E = -545mV
iPP
= 255 (± 6) Acm-2
(b)
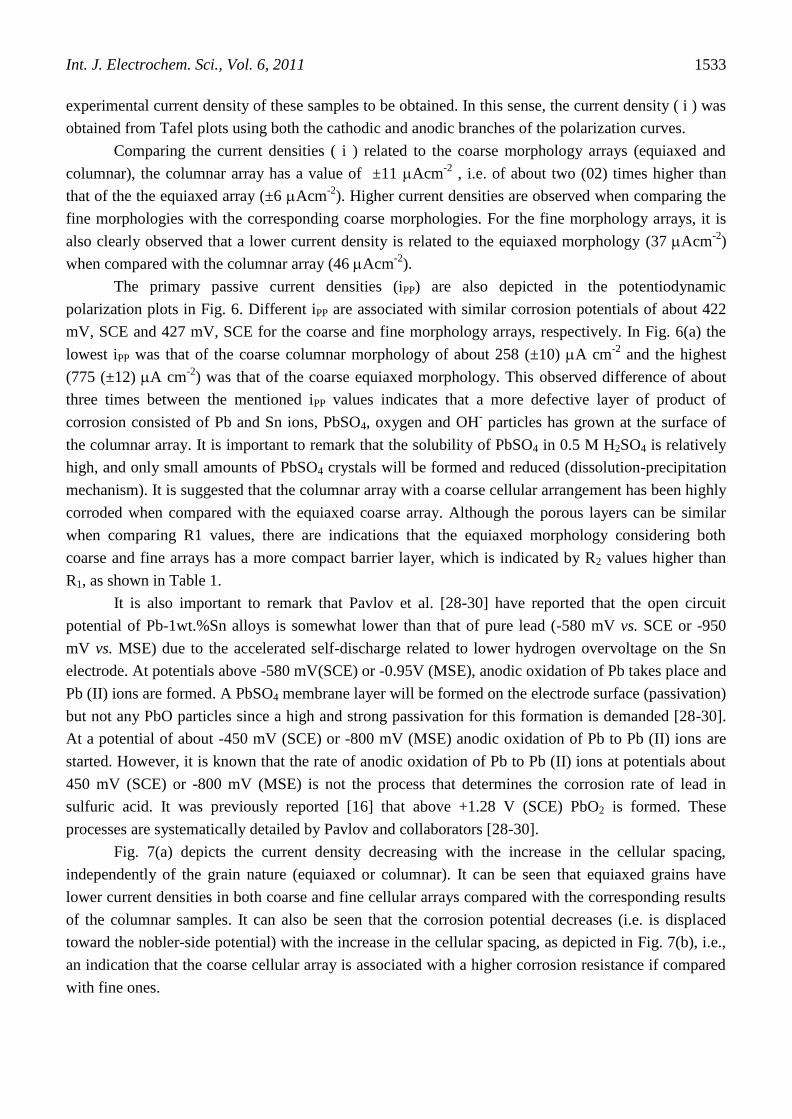
Figure 6. (a) Experimental potentiodynamic polarization curves of Pb-1wt.%Sn alloy samples in a
0.5M H2SO4 solution at 25oC for (a) coarse and (b) fine cellular arrays.
Fig. 6 depicts partial potentiodynamic polarization curves (from -0.70 to -0.30 V vs. SCE) for
both equiaxed and columnar samples presenting coarse and fine cellular arrays of a Pb-1%Sn alloy. It
is important to remark that these polarization tests were performed in order to permit the resulting
Int. J. Electrochem. Sci., Vol. 6, 2011
1533
experimental current density of these samples to be obtained. In this sense, the current density ( i ) was
obtained from Tafel plots using both the cathodic and anodic branches of the polarization curves.
Comparing the current densities ( i ) related to the coarse morphology arrays (equiaxed and
columnar), the columnar array has a value of ±11 Acm-2
, i.e. of about two (02) times higher than
that of the the equiaxed array (±6 Acm-2
). Higher current densities are observed when comparing the
fine morphologies with the corresponding coarse morphologies. For the fine morphology arrays, it is
also clearly observed that a lower current density is related to the equiaxed morphology (37 Acm-2
)
when compared with the columnar array (46 Acm-2
).
The primary passive current densities (iPP) are also depicted in the potentiodynamic
polarization plots in Fig. 6. Different iPP are associated with similar corrosion potentials of about 422
mV, SCE and 427 mV, SCE for the coarse and fine morphology arrays, respectively. In Fig. 6(a) the
lowest iPP was that of the coarse columnar morphology of about 258 (±10) A cm-2
and the highest
(775 (±12) A cm-2
) was that of the coarse equiaxed morphology. This observed difference of about
three times between the mentioned iPP values indicates that a more defective layer of product of
corrosion consisted of Pb and Sn ions, PbSO4, oxygen and OH- particles has grown at the surface of
the columnar array. It is important to remark that the solubility of PbSO4 in 0.5 M H2SO4 is relatively
high, and only small amounts of PbSO4 crystals will be formed and reduced (dissolution-precipitation
mechanism). It is suggested that the columnar array with a coarse cellular arrangement has been highly
corroded when compared with the equiaxed coarse array. Although the porous layers can be similar
when comparing R1 values, there are indications that the equiaxed morphology considering both
coarse and fine arrays has a more compact barrier layer, which is indicated by R2 values higher than
R1, as shown in Table 1.
It is also important to remark that Pavlov et al. [28-30] have reported that the open circuit
potential of Pb-1wt.%Sn alloys is somewhat lower than that of pure lead (-580 mV vs. SCE or -950
mV vs. MSE) due to the accelerated self-discharge related to lower hydrogen overvoltage on the Sn
electrode. At potentials above -580 mV(SCE) or -0.95V (MSE), anodic oxidation of Pb takes place and
Pb (II) ions are formed. A PbSO4 membrane layer will be formed on the electrode surface (passivation)
but not any PbO particles since a high and strong passivation for this formation is demanded [28-30].
At a potential of about -450 mV (SCE) or -800 mV (MSE) anodic oxidation of Pb to Pb (II) ions are
started. However, it is known that the rate of anodic oxidation of Pb to Pb (II) ions at potentials about
450 mV (SCE) or -800 mV (MSE) is not the process that determines the corrosion rate of lead in
sulfuric acid. It was previously reported [16] that above +1.28 V (SCE) PbO2 is formed. These
processes are systematically detailed by Pavlov and collaborators [28-30].
Fig. 7(a) depicts the current density decreasing with the increase in the cellular spacing,
independently of the grain nature (equiaxed or columnar). It can be seen that equiaxed grains have
lower current densities in both coarse and fine cellular arrays compared with the corresponding results
of the columnar samples. It can also be seen that the corrosion potential decreases (i.e. is displaced
toward the nobler-side potential) with the increase in the cellular spacing, as depicted in Fig. 7(b), i.e.,
an indication that the coarse cellular array is associated with a higher corrosion resistance if compared
with fine ones.

Int. J. Electrochem. Sci., Vol. 6, 2011
1534
0 20 40 60 80 100 120 140 160 180 2000
10
20
30
40
50
60
Fine
equiaxed
Fine columnar
Coarse equiaxed
Cellular spacings (c) / m
Curr
ent
density (
i )
/ A
x c
m-2 Experimental data
Coarse columnar
(a)
20 40 60 80 100 120 140 160 180 200-550
-545
-540
-535
-530
-525
-520
-515
-510
Fine equiaxed
Fine columnarCoarse equiaxed
Cellular spacings (c) / m
Co
rro
sio
n p
ote
ntia
l (
Ecorr
) /
m
V (
SC
E)
Experimental data
Coarse columnar
(b)
Figure 7. (a) Experimental current density and (b) corrosion potential as a function of cellular spacings
of Pb-1wt.%Sn alloy samples with coarse and fine cellular arrays into columnar and equiaxed
grains.
The present experimental results have shown that the control of as-cast structures by
manipulating solidification processing variables can be used as an alternative way to produce
components of lead-acid batteries with higher corrosion resistance. In this context, a high cooling rate

Int. J. Electrochem. Sci., Vol. 6, 2011
1535
casting process will induce a deleterious effect on the general electrochemical behaviour for dilute Pb-
Sn alloys when considering conventional manufacturing of lead-acid battery components.
4. CONCLUSIONS
The following conclusions can be drawn from the present experimental investigation:
The experimental EIS diagrams, impedance parameters, potentiodynamic polarization
curves and the fitted equivalent circuit parameters have shown that coarse equiaxed grains spacings
tend to yield higher corrosion resistance than columnar grains with coarse cellular arrays. Similarly a
fine equiaxed grain structure is predisposed to yield higher electrochemical behaviour than a columnar
structure with fine cellular spacing for an as-cast Pb-1wt.%Sn alloy. Such trends are intimately
associated with: i. the reduction of cellular boundaries of coarse cellular arrays when compared with
finer cells, since the boundary has proved to be more susceptible to the corrosion action; ii. the
reduction of equiaxed grain boundaries when compared with the cellular boundaries inside the
columnar grain.
The manipulation of solidification processing variables permits the as-cast structural
morphologies to be controlled. Thus, the control of cooling rate during casting can be used as an
alternative way to produce battery components of dilute Pb-Sn alloys with improved electrochemical
corrosion behaviour.
ACKNOWLEDGEMENTS
The authors acknowledge the financial support provided by FAEPEX- UNICAMP, CNPq (The
Brazilian Research Council) and FAPESP (The Scientific Research Foundation of the State of São
Paulo, Brazil).
References
1. R.D. Prengaman, J. Power Sources, 95 (2001) 224
2. R.D. Prengaman, J. Power Sources, 158 (2006) 1110
3. M.D. Achtermann, M.E. Greenlee, J. Power Sources, 33 (1991) 87
4. B. Rezaei, S. Damiri, J. Solid State Electrochem, 9 (2005) 590
5. M. Shiota, T. Kameda, K. Matsui, N. Hirai, T. Tanaka, J. Power Sources, 144 (2005) 358
6. M. C. Flemings, Solidification Processing, McGraw Hill (1974)
7. J. Campbell: Castings, Butterworth-Heinemann, Oxford, United Kingdom (1991)
8. C. A. Siqueira, N. Cheung, A. Garcia, Metall. Mater. Trans. A, 33, (2002) 2107
9. W. R. Osório, C. M.A. Freire, A. Garcia, J. Mater. Sci. , 40 (2005) 4493
10. D. Dubé, A. Couture, Y. Carbonneaut, M. Fiset, R. Angers, R. Tremblay, Int. J. Cast Met. Res., 11
(1998) 139
11. D.M. Rosa, J.E. Spinelli. I.L. Ferreira, A. Garcia, Metall. Mater. Trans A, 39 (2008) 2161
12. O.L. Rocha, C.A. Siqueira, A. Garcia, Mater. Sci. Eng. A, 347 (2003) 59
13. N. J. Petch, J. Iron Steel Inst. 174 (1953) 25
14. W.R. Osório, D.M. Rosa, A. Garcia, J. Power Sources, 175 (2008) 595
15. W.R. Osório, C. Aoki, A. Garcia, J. Power Sources, 185 (2008) 1471

Int. J. Electrochem. Sci., Vol. 6, 2011
1536
16. L.C. Peixoto, W.R. Osório, A. Garcia, J. Power Sources,192 (2009) 724
17. W.R. Osório, L.C. Peixoto, A. Garcia, J. Power Sources, 194 (2009) 1120
18. L.C. Peixoto, W.R. Osório, A. Garcia, J. Power Sources, 195 (2010) 621
19. W.R. Osório, L.C. Peixoto, A. Garcia, J. Power Sources, 195 (2010) 1726
20. F. Mansfeld, M.W. Kendig, J. Electrochem. Soc.,135 (1998) 828
21. J. Pan, D. Thierry, C. Leygraf, Electrochim. Acta, 41 (1996) 1143
22. M. Kliskic, J. Radosevic, S. Gudic ,M. Smith, Electrochim. Acta, 43 (1998) 3241
23. S. Gudic, J. Radosevic, M. Kliskic, Electrochim. Acta, 47 (2002) 3009
24. W.R. Osório, N. Cheung, L.C. Peixoto, A. Garcia, Int. J. Electrochem. Sci., 4 (2009) 820
25. I.E. Castañeda, J.G. Gonzalez-Rodriguez, G. Dominguez-Patiño, R. Sandoval-Jabalera, M.A.Neri-
Flores, JG. Chacon-Nava, A. Martinez-Villafañe, Int. J. Electrochem. Sci., 6 (2011) 404
26. H .A. Barham, S. A. Brahim, Y. Rozita, K. A. Mohamed, Int. J. Electrochem. Sci., 6 (2011) 181
27. J.A. Ruiz1, I. Rosales1, J.G. Gonzalez-Rodriguez1,,J. Uruchurtu, Int. J. Electrochem. Sci., 5 (2010)
593
28. D. Pavlov, M. Bojinov, T. Laitinen, G. Sundholm, Electrochim. Acta, 36 (1991) 2087
29. D. Pavlov, M. Bojinov, T. Laitinen, G. Sundholm, Electrochim. Acta, 36 (1991) 2081
30. D. Pavlov, B. Monahov, G. Sundholm, T. Laitinen, J. Electroanal. Chem., 305 (1991) 57
© 2011 by ESG (www.electrochemsci.org)


![Predicting the columnar-to-equiaxed transition for a ...pmt.usp.br/academic/martoran/Publicacoes/ActaMat 2008.pdf · Predicting the columnar-to-equiaxed transition for a ... [9],](https://img.pdfslide.net/doc/110x75/5cec906188c99319498d6130/predicting-the-columnar-to-equiaxed-transition-for-a-pmtuspbracademicmartoranpublicacoesactamat.jpg)