Embed Size (px)
Citation preview
Int. J. Electrochem. Sci., 3 (2008) 609 - 630
�������������������
����������� ����
������� www.electrochemsci.org
Electrochemical Study of Iron Oxide Deposits in Weathered Archaeological Glass
Antonio Doménech-Carbó1,*, María Teresa Doménech-Carbó2, Laura Osete-Cortina2
Departament de Química Analítica. Universitat de València. Dr. Moliner, 50, 46100 Burjassot (València) Spain Institut de Restauració del Patrimoni/Departament de Conservació i Restauració. Universitat Politécnica de València. Camí de Vera 14, 46022, València, Spain *E-mail: [email protected] Received: 4 December 2007 / Accepted: 12 February 2008 / Online published: 20 March 2008 The chemical and crystallographic composition of iron oxide deposits resulting from the alteration of glasses was studied using the voltammetry of microparticles approach upon sample attachment to paraffin-impregnated graphite electrodes immersed into aqueous HCl. Square wave voltammetry allows to characterize amorphous, highly hydrated iron oxides, crystalline hematite and goethite and their hydrated forms are recorded in weathered glasses. Samples from five archaeological sites in the Valencian Community (Spain) were studied using this approach. It is suggested that formation of different iron oxide deposits results from the existence of a significant gradient of water concentration within the gel layer formed throughout the weathering process. Keywords: archaeological glass, iron deposits, weathering, electrochemistry
1. INTRODUCTION
The alteration of glass in natural environments is a very complex process depending on a wide variety of factors such as glass composition and heat treatment, temperature, time, pH and composition of the aqueous phase, exposure to micro-organisms, sunlight, etc. [1].
Following Bunker [2], Morgenstein et al. [3], and Silvestri et al. [4], the processes involved in the alteration of glass can be divided into: 1) dissolution (congruent or incongruent) of the glass into the aqueous phase, 2) glass hydration, and 3) simultaneous diffusion-hydration and dissolution. Glass hydration can be produced via a) diffusion of water molecules, hydronium and/or hydroxyl ions into the glass, b) ion exchange between alkali and alkaline earth ions in the glass with the hydronium ions from the aqueous phase, c) base exchange during diffusion of molecular water into the glass, diffusion
Int. J. Electrochem. Sci., Vol. 3, 2008
610
of gases into/out of the glass, d) hydration of transition metal ions occupying modifier sites in the glass, sorption and desorption of ions from transition metal hydroxide and oxyhydroxide deposits in the gel and in the glass, and recrystallization of such materials in the gel. The reaction of aqueous media with glass can produce a hydrated glass phase designated in the following as a gel.
Extensive literature exists on the interaction between aqueous solution and glass, and different kinetic and thermodynamic models have been proposed by different authors [5-13]. The most general kinetic approaches describe glass corrosion as a result of the combination of i) the dissolution of silicate matrix, ii) interdiffusion of moveable ions, and, iii) precipitation of solution components on the glass surface and/or precipitation of formerly dissolved glass components [14]. Such models do not describe pH dependence and selective leaching so that Helebrant et al. [13] have recently suggested that both thermodynamic and kinetic approaches should be taken into account for describing glass corrosion behaviour.
Different textural morphologies have been described in the alteration of soda lime and other glasses. Morgenstein et al. [3] differentiates two main types of corrosion styles: pitting dissolution, developed as small dissolution pit features, and hair-channel-gel-lamination hydration, producing relatively uniform hydration laminations resulting from hydration microchannels perpendicular to the glass surface.
Alteration of glasses in underground environments results frequently in the formation of zones rich in Mn, Ca, P and Fe [15-17]. This accumulation may be external in origin, since the above elements are common constituents of soil as a result of breakdown of silicate minerals [16,18]. It is known that under anaerobic conditions, water-soluble Mn(II) and Fe(II) species predominate in waterlogged soils. However, in aerobic environments, such species are readily oxidized to Mn(IV) and Fe(III), respectively, giving insoluble oxides and hydroxides through a relatively complex chemistry.
Iron and manganese are frequently added to glass during its manufacturing. Fe(II) provides a green hue to the glass whereas manganese dioxide is often added during glass production for oxidizing Fe(II) to Fe(III) then providing a purple tint from Mn(III) to offset the straw tint from the Fe(III) [19-22]. It has been suggested that manganese ions existing in the glass may be leached from their network site by substitution and then undergo oxidation and migration to form black and brown compounds such as pyrolusite (MnO2), manganite (MnO(OH)), Braunite (Mn2O3), Hausmannite (Mn3O4) [23]. Knight [24] proposed that both manganese and iron, released from the glass matrix during the corrosion process, as the cause of discolouration in archaeological glass. Accordingly, browning of glasses can be associated to the transport of iron and manganese ions and the deposition and eventually re-dissolution of their insoluble products.
In this context, we describe the application of solid-state voltammetric methods for obtaining information on the crystallinity and composition of iron compounds in alteration crusts of archaeological glasses. From the development of carbon paste electrodes by Kuwana and French [25], application of electrochemical techniques for analyzing solid materials has claimed increasing attention. Voltammetric methods devoted to the identification, speciation, and relative quantitation of solid materials attached to carbon paste electrodes were developed in the 70's and 80's by Brainina and Lesunova [26] and Bauer et Gaillochet [27]. In the last two decades, the development by Scholz et al. of the abrasive stripping voltammetry, based on the mechanical transference of solid microparticles to
Int. J. Electrochem. Sci., Vol. 3, 2008
611
paraffin-impregnated graphite electrodes, has extended the scope of solid state electroanalysis, as illustrated in recent extensive reviews [28,29]. The voltammetry of microparticles has been applied to characterize iron oxides [30-36], iron pigments [37,38] and manganese oxides [39]. This methodology has been previously applied to the speciation of iron, manganese, tin and lead in archaeological ceramics, glass and glazes [40-42] including preliminary results on manganese/iron-rich alterations in archaeological glasses [43].
The current work is devoted to the description of the electrochemistry of iron centres in archaeological glass in order to discern between possible different forms of iron oxide/hydroxide deposits resulting from the weathering of glass, and relating electrochemical data with the characteristics of the alteration process.
2. EXPERIMENTAL PART
2.1. Reference materials
A series of commercial pigments supplied by Kremer, namely, Spanish hematite (K48651, HEQ), Sienna raw (K40430, SR), Brown Sienna raw (K40050, TS), Red Bole (K40503, RE), Caput mortum (K48720, CM), French ochre (K40010, FO), French ochre red (K40020, FR), French ochre orange (K40030, FN), red clay (K40700, RC), Italian umber (K40700, IU), Spanish ochre (K11584, SO), and extrafine Spanish ochre (K11585, SE) were used. Synthetic specimens of hematite (HE) were prepared, following Rochester and Topham [44], by adding a 10 w/v % solution of sodium hydroxide in nanopure water dropwise, with stirring, to a 10 w/v% solution of iron(III) chloride containing ca. 5 g FeCl3. The resulting brown ferrigel precipitate was left overnight at a pH within the range 7-10 and then washed with copious amounts of water by repeated decantations. When the supernatant liquid showed no trace of chloride ions and was no longer alkaline, the ferrigel was filtered off and dried in an oven at 383 K. The final conversion to oxide was performed by heating the dried ferrigel in air at 600 K. Additionally, Fe2O3 (Aldrich, HEM) was used as reference hematite-based materials. Synthetic acicular goethite specimens (GO) were prepared, following the procedure Ruan et al. [45], from a ferrous salt involving the oxidation of FeCl2.4H2O solution buffered with bicarbonate. Cyprus umber (Kremer, K40610, CU) and greenish natural umber (Kremer, K40612, GU) were taken as reference materials for amorphous iron oxide materials.
2.2. Samples
Microsamples from 14 fragments of archaeological glass from six archeological sites in the Valencian Region, Spain, were taken with the help of a microscalpel. Samples were:
a) Irregular fragments of flasks or jars found in an ancient house in the archaeological site of Angel street in Manises (Silo S.I-11), 16th-17th century. Sample M1 corresponds to a blue fragment,
Int. J. Electrochem. Sci., Vol. 3, 2008
612
samples M2 and M3 correspond to colourless fragments, all provided by the Ceramic Museum of Manises.
b) Translucent and very thin glass fragments from the necropolis (Tomb VE-1.011) of the archaeological site of "Partida de Mura" in Llíria, Roman period. Samples L1 and L2.
c) Irregular translucent fragments of glass from the archaeological site of L'Almoina in Valencia, 13th-15th century. Fragments A1 (brown glass), A2 (colourless handle of a vessel) and A3 (brown glass).
d) Translucent fragments of glass irregular in shape proceeding from an archaeological site located in the foundation of the Mansion of Dos Aguas Marquis where actually is placed the National Museum of Ceramic in Valencia. Samples D1 (light green), D2 and D3 (colourless).
e) Irregular fragments of bottles, vessels and jars found in a mediaeval house in Paterna (Silo 5, 15th-16th century). Fragments PP1 (green), PP2 (colourless) and PP4 (light green).
All the fragments exhibited typical browning and a corrosion layer or crust of laminated
structure with iridiscent, milky-like and semiopaque appearance as a result of weathering. In addition, frosting, cracking and pitting were observed.
The composition of the glass samples was previously reported [43]. Silica content in unaltered glass cores of samples M1 to M3, PP1 to PP4 and D3 falls in the 60-65% range. For samples L1, L2, A1 to A3, D1 and D2 the silica content was higher, between 65 and 79%. The values of Na2O and CaO content, ranging from 8.5 to 18% and from 5% to 12%, respectively, lead to consider the studied glasses as soda lime silicate glasses. The content in K2O was between 0.5 and 2.5% for samples L1, L2, A1 to A3 and D1 to D3. In samples M1 to M3 and PP1 to PP4 the K2O content was higher, ranging from 2.5 to 10.8%, suggesting that additions of potash raw materials was used in those centres of production.
The presence of iron oxide and manganese oxide in proportion larger than 0.5% and 1%, respectively, is considered indicative of the existence of a deliberate addition of such components during glass preparation (Pinto, 1991). Accordingly, deliberated iron additions probably occurred in samples M1, M3, L1, A1, A3, PP1, and PP4. Following the above criterion, deliberated additions of manganese occurred in the production of samples A1, and PP1.
2.3. Instrumentation and procedures
Voltammetric experiments were performed in HCl (Panreac) plus NaCl (Panreac) soutions in nanopure water, total concentration 1.0 M. Paraffin-impregnated graphite electrodes (PIGEs) consist on cylindrical rods of 5 mm diameter of graphite impregnated under vacuum by paraffin. Preparation details are described by Scholz et al. [28]. The samples (ca. 10-20 µg) were accurately powdered in an agate mortar and pestle and then placed on a glazed porcelain tile forming a spot of finely distributed material. Then the lower end of the PIGE was gently rubbed over that spot of sample and finally cleaned with a tissue paper to remove ill-adhered particles.
Int. J. Electrochem. Sci., Vol. 3, 2008
613
All electrochemical experiments were performed at 298 K in well-deaerated HCl solutions under an atmosphere of Ar. A sample-modified composite electrode was used as a working electrode, a Pt-wire auxiliary electrode and a AgCl (3M NaCl)/Ag reference electrode completed the three-electrode cell. Square wave voltammograms (SQWVs) were obtained with BAS CV 50W and CH I420 equipments after immersion of modified electrodes in well deaerated solutions at 298 K. The potential scan was routinely initiated at +1.0 V in the negative direction.
Morphological characterization of iron corrosion products present in the collection of archaeological glasses studied was carried out by means a transmission electron microscope Philips CM10 with Keen view camera soft imaging system was used operating at 100 kV.
Samples from iron corrosion products were prepared by grinding a few micrograms of the samples in an agate mortar and then dispersing them by the help of an ultrasonic bath in dichloroethane. A drop of the dispersions was poured on TEM grids pre-treated with a polymer film layer with holes in order to improve the images obtained.
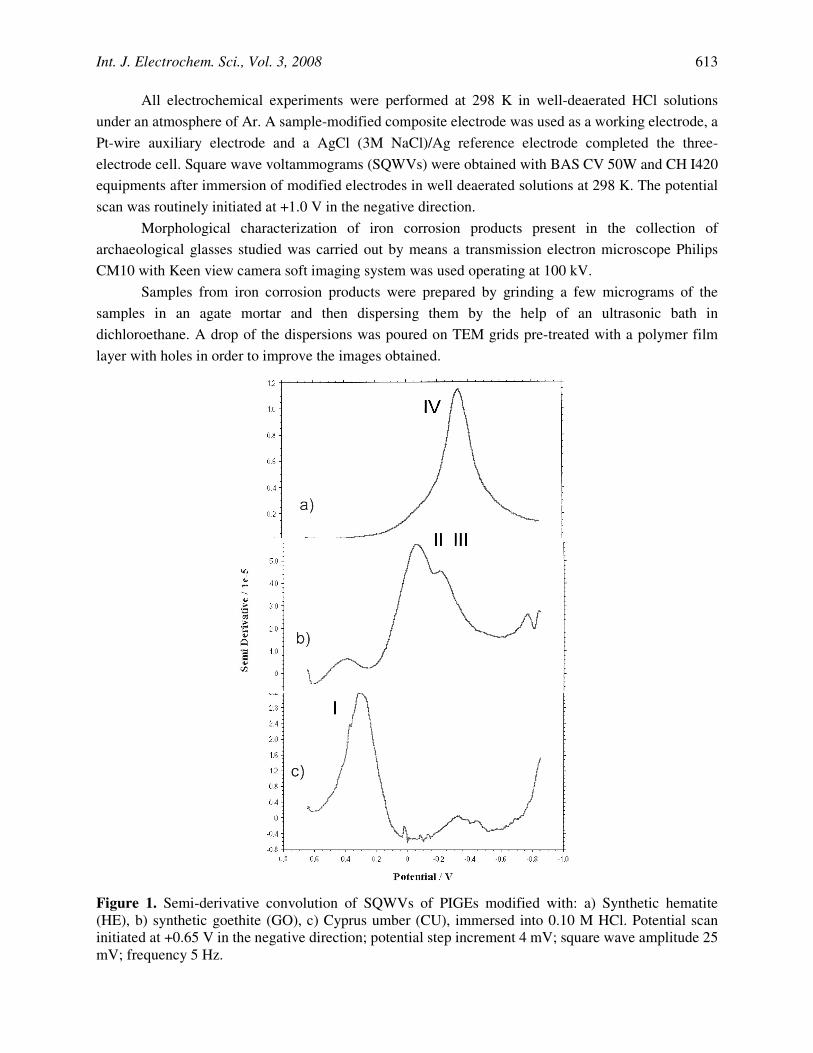
Figure 1. Semi-derivative convolution of SQWVs of PIGEs modified with: a) Synthetic hematite (HE), b) synthetic goethite (GO), c) Cyprus umber (CU), immersed into 0.10 M HCl. Potential scan initiated at +0.65 V in the negative direction; potential step increment 4 mV; square wave amplitude 25 mV; frequency 5 Hz.
Int. J. Electrochem. Sci., Vol. 3, 2008
614
3. RESULTS AND DISCUSSION
3.1. Electrochemistry of iron oxide materials
Figure 1 shows the square wave voltammetric response recorded for a) hematite, b) goethite-based ochre, and c) amorphous iron oxide in contact with 0.10 M HCl, after semi-derivative convolution. For hematite, (Fig. 1a), a prominent reduction peak appears at -450 mV vs. AgCl/Ag whereas for goethite pigment (Fig. 1b), overlapping peaks appear at -15 and -200 mV. For an essentially amorphous iron pigment, Cyprus natural umber, the main reduction peak at +250 mV is accompanied by weak signals at 0 and -450 mV, denoting the presence of small amouts of hematite and goethite.
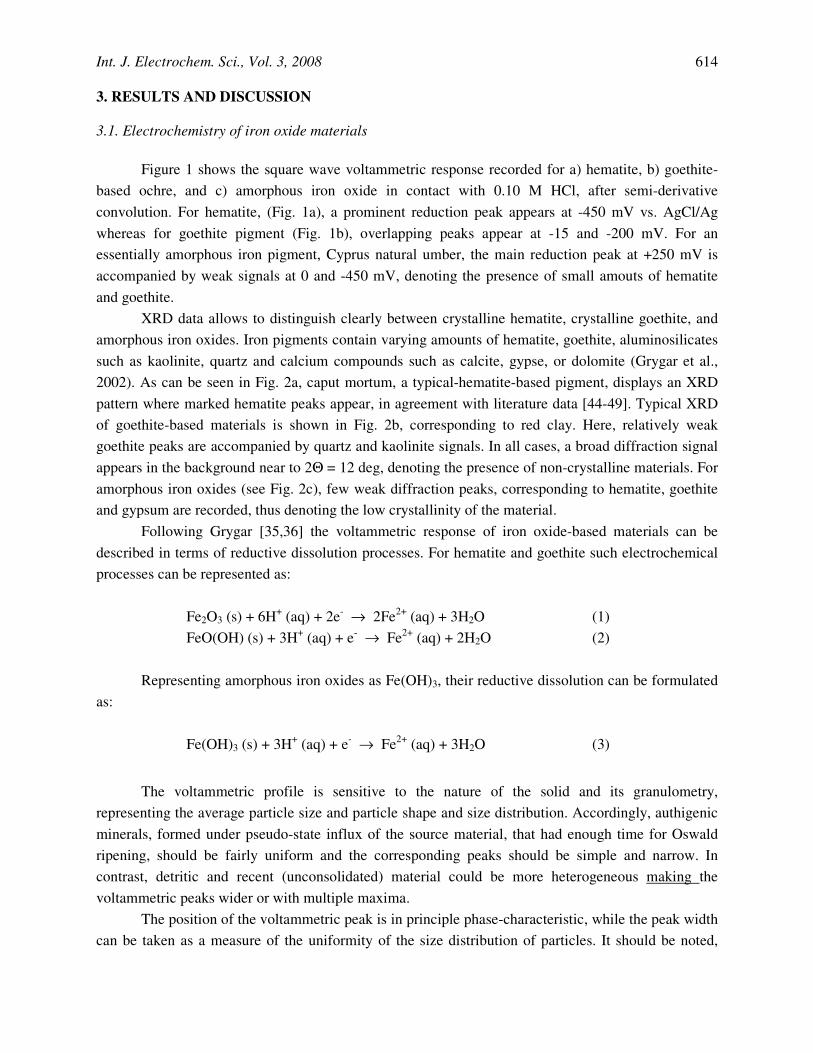
XRD data allows to distinguish clearly between crystalline hematite, crystalline goethite, and amorphous iron oxides. Iron pigments contain varying amounts of hematite, goethite, aluminosilicates such as kaolinite, quartz and calcium compounds such as calcite, gypse, or dolomite (Grygar et al., 2002). As can be seen in Fig. 2a, caput mortum, a typical-hematite-based pigment, displays an XRD pattern where marked hematite peaks appear, in agreement with literature data [44-49]. Typical XRD of goethite-based materials is shown in Fig. 2b, corresponding to red clay. Here, relatively weak goethite peaks are accompanied by quartz and kaolinite signals. In all cases, a broad diffraction signal appears in the background near to 2Θ = 12 deg, denoting the presence of non-crystalline materials. For amorphous iron oxides (see Fig. 2c), few weak diffraction peaks, corresponding to hematite, goethite and gypsum are recorded, thus denoting the low crystallinity of the material.
Following Grygar [35,36] the voltammetric response of iron oxide-based materials can be described in terms of reductive dissolution processes. For hematite and goethite such electrochemical processes can be represented as:
Fe2O3 (s) + 6H+ (aq) + 2e- → 2Fe2+ (aq) + 3H2O (1) FeO(OH) (s) + 3H+ (aq) + e- → Fe2+ (aq) + 2H2O (2)
Representing amorphous iron oxides as Fe(OH)3, their reductive dissolution can be formulated
as:
Fe(OH)3 (s) + 3H+ (aq) + e- → Fe2+ (aq) + 3H2O (3)
The voltammetric profile is sensitive to the nature of the solid and its granulometry, representing the average particle size and particle shape and size distribution. Accordingly, authigenic minerals, formed under pseudo-state influx of the source material, that had enough time for Oswald ripening, should be fairly uniform and the corresponding peaks should be simple and narrow. In contrast, detritic and recent (unconsolidated) material could be more heterogeneous making the voltammetric peaks wider or with multiple maxima.
The position of the voltammetric peak is in principle phase-characteristic, while the peak width can be taken as a measure of the uniformity of the size distribution of particles. It should be noted,
Int. J. Electrochem. Sci., Vol. 3, 2008
615
however [38], that peaks are shifted cathodically on increasing particle size, and anodically with increasing departures of stoichiometry. The peak width can be taken as a measure of the uniformity of pigment particles.
Figure 2. XRD patterns of: a) caput mortum (CM); b) bole (RB); c) greenish natural umber (GU). H. hematite; G: goethite; K: kaolinite; Q: quartz; Y: gypsum.
Int. J. Electrochem. Sci., Vol. 3, 2008
616
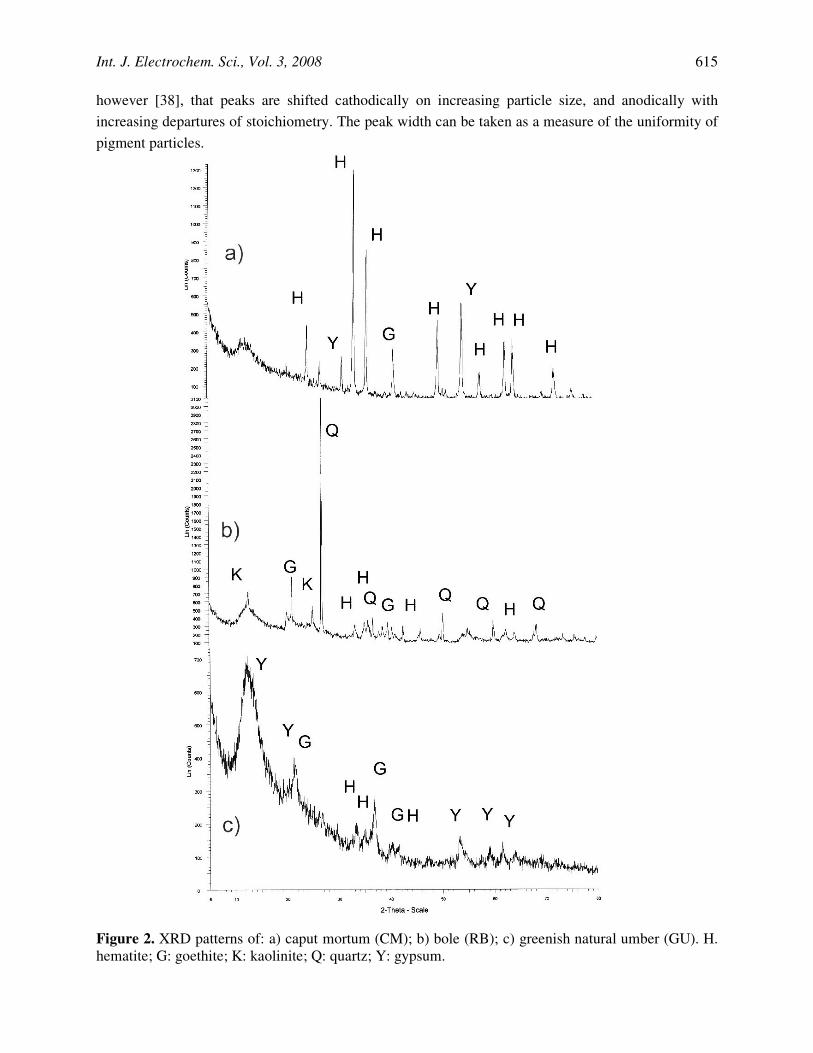
Thus, Fig. 3 compares the SQWV response of two different hematite-based materials. The main peak at -450 mV is accompanied by a shoulder ca. -250 and +250 mV, associated to hematite [44,47,50] and amorphous iron oxides. In order to characterize iron oxides, one can take peaks at +250 mV (I) as characteristic of amorphous materials and peak ca. 0 mV (II) as goethite-characteristic. Signals at potentials between -100 and -300 mV (III) can be attributed to hydrated forms of hematite-based and goethite-based phases, while the peak at -450 mV (IV) can be assigned to crystalline hematite. Reduction of Fe2+ to Fe metal occurs at potentials more negative than -0.75 V [37].
Figure 3. SQWVs of PIGEs modified with hematite from: a) Spanish hematite (HEQ, Kremer pigment), b) Fe2O3 (HEM, Aldrich reagent), immersed into 0.10 M HCl. Potential scan initiated at +0.65 V in the negative direction; potential step increment 4 mV; square wave amplitude 25 mV; frequency 5 Hz.
In all cases, the shape of voltammetric curves remains essentially unchanged for HCl
concentrations between 1 and 10-3 M, the unique relevant feature being the negative shift of peak potentials on increasing the pH. Variation of the voltammetric profile with the square wave frequency, f, was also studied. This is an important parameter because low frequencies allow to investigate short-time processes, while long frequencies provides information on (relatively) long-time ones. Since the studied electrochemical processes involve different processes (proton/ion insertion, lattice construction/disintegration, ion diffusion, etc.) with different rates, variation of square wave frequency provides kinetic information. In the studied materials, the shape of the voltammograms varied significantly on varying the square wave frequency. For frequencies above 10-15 Hz, the peaks become ill-resolved, while for frequencies below 5 Hz, the peaks at more positive potentials vanishes.
Int. J. Electrochem. Sci., Vol. 3, 2008
617
This suggests that the kinetics of the proton-assisted electron transfer process described by Eqs. (1) and (2) is relatively slow for crystalline materials.
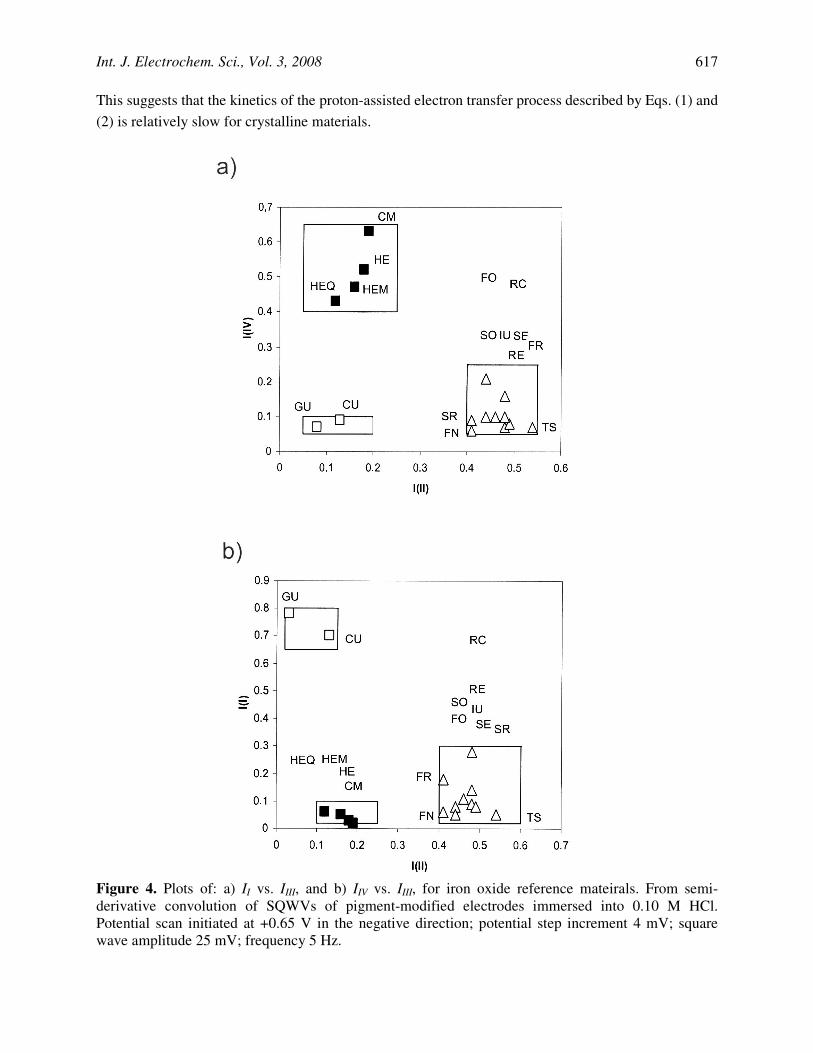
Figure 4. Plots of: a) II vs. IIII, and b) IIV vs. IIII, for iron oxide reference mateirals. From semi-derivative convolution of SQWVs of pigment-modified electrodes immersed into 0.10 M HCl. Potential scan initiated at +0.65 V in the negative direction; potential step increment 4 mV; square wave amplitude 25 mV; frequency 5 Hz.
Int. J. Electrochem. Sci., Vol. 3, 2008
618
The voltammograms of all hematite-based materials (HE, HEM, HEQ, and CM) was found to be similar, as can be seen in Fig. 3 (and Fig. 1a) for: a) Spanish hematite (HEM) and b) commercial iron oxide (HE). The main peak at -450 mV is accompanied by a shoulder ca. -250 and +250 mV, associated with and amorphous iron oxides.
The voltammograms of ochre-type materials consisted mainly of overlapping peaks II and III, as shown in Fig. 1b, eventually accompanied by weak peaks I and IV. This patterns was found for GO, SR, TS, RB, FO, FR, FG, RC, SO, SE specimens. Finally, umbers CU and GU displayed a essentially identical profile, consisting of a prominent peak I accompanied by weak overlapping peaks II and III.
Electrochemical identification of the pigments can be derived from shape-characterizing parameters, as recently discussed [51]. Since it is not possible to control the exact amount of sample deposited in the electrode surface, peak current values varied from one experiment to another. However the voltammetric profile and the peak potentials exhibited an excellent repeatability for different measures on freshly modified electrodes. Accordingly, peak currents for signals at +250 (I), 0 (II), -250 (III), and -400 mV (IV) were used for material characterization. To improve peak resolution, semi-derivative convolution of data was systematically performed.
To characterize iron oxide compounds three peak current ratios were defined, namely: a) iIV/(iI+iII+iIII+iIV) (= I(IV)), which can be taken as a measure of the molar fraction of crystalline hematite with respect to total iron oxide forms; b) iII/(iI+iII+iIII+iIV) (= I(II)), representative of the fraction of crystalline goethite, and, c) iI/(iI+iII+iIII+iIV) (= I(I)), representative of the relative amount of amorphous iron oxide specimens. Two-dimension diagrams combining II, III and IIV, allows for a clear distinction between different iron oxide materials. As can be seen in Fig. 4, the diagram points representative of hematite-based materials are clearly separated from that representative of typical ochres and umbers.
3.2. Electrochemistry of glass samples
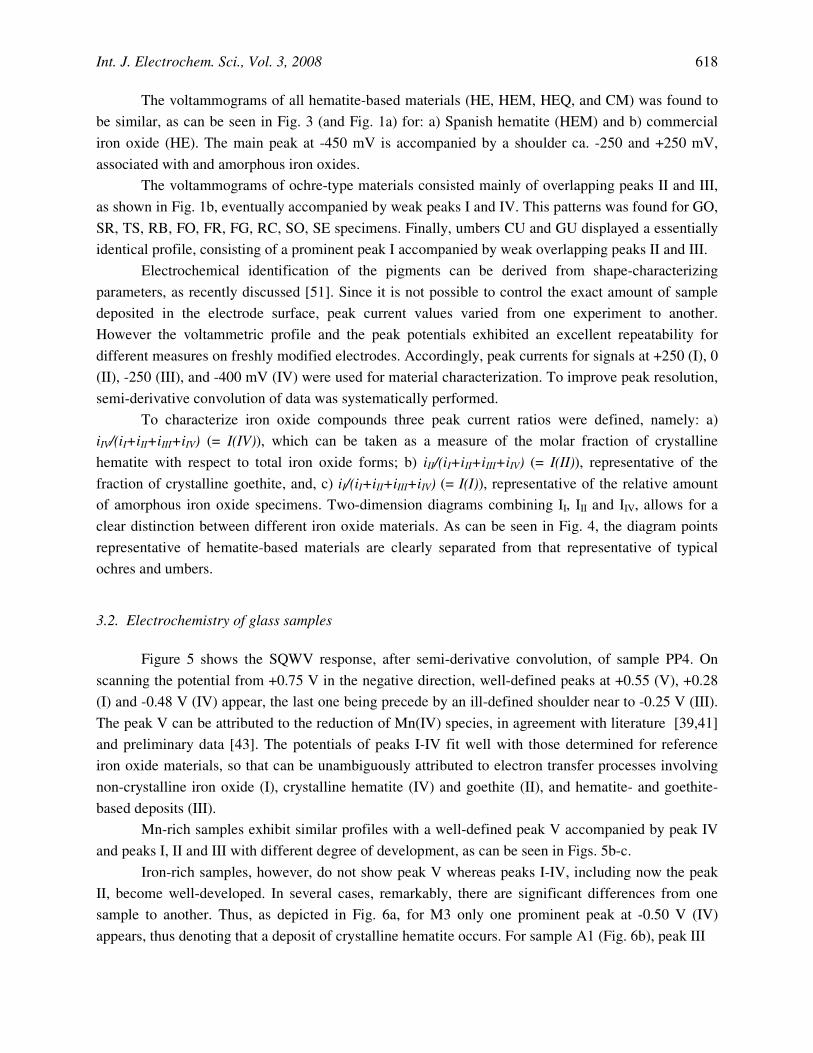
Figure 5 shows the SQWV response, after semi-derivative convolution, of sample PP4. On scanning the potential from +0.75 V in the negative direction, well-defined peaks at +0.55 (V), +0.28 (I) and -0.48 V (IV) appear, the last one being precede by an ill-defined shoulder near to -0.25 V (III). The peak V can be attributed to the reduction of Mn(IV) species, in agreement with literature [39,41] and preliminary data [43]. The potentials of peaks I-IV fit well with those determined for reference iron oxide materials, so that can be unambiguously attributed to electron transfer processes involving non-crystalline iron oxide (I), crystalline hematite (IV) and goethite (II), and hematite- and goethite-based deposits (III).
Mn-rich samples exhibit similar profiles with a well-defined peak V accompanied by peak IV and peaks I, II and III with different degree of development, as can be seen in Figs. 5b-c.
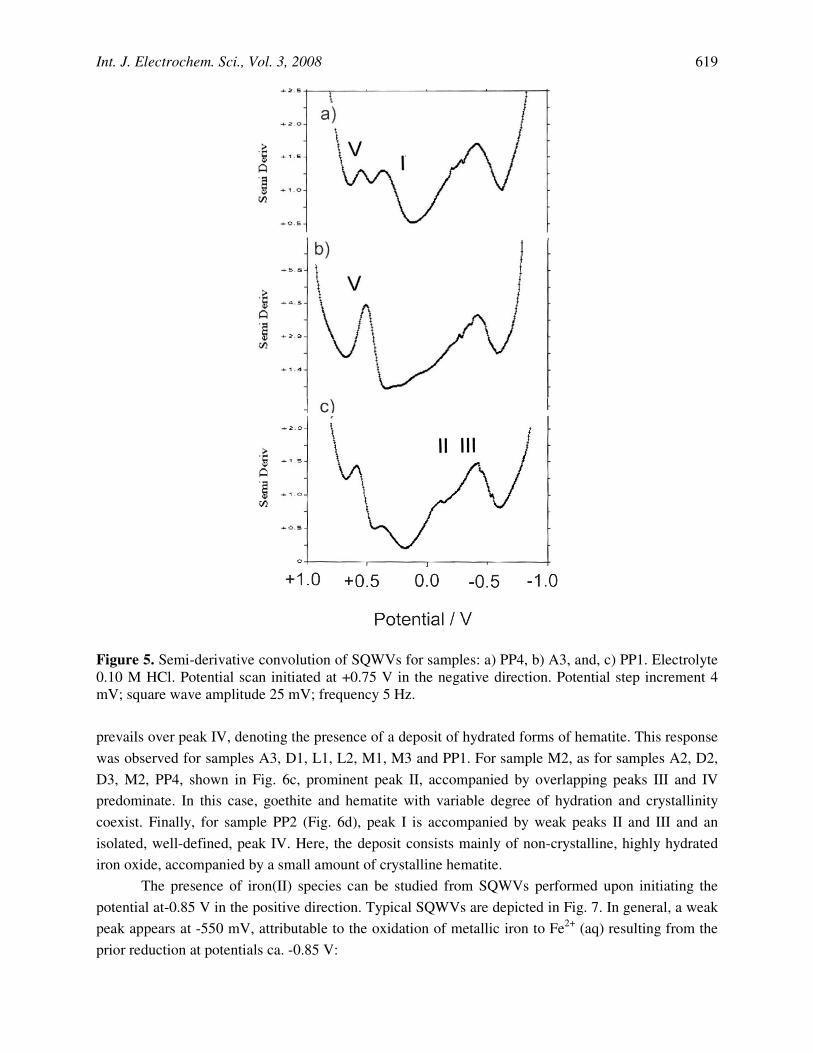
Iron-rich samples, however, do not show peak V whereas peaks I-IV, including now the peak II, become well-developed. In several cases, remarkably, there are significant differences from one sample to another. Thus, as depicted in Fig. 6a, for M3 only one prominent peak at -0.50 V (IV) appears, thus denoting that a deposit of crystalline hematite occurs. For sample A1 (Fig. 6b), peak III
Int. J. Electrochem. Sci., Vol. 3, 2008
619
Figure 5. Semi-derivative convolution of SQWVs for samples: a) PP4, b) A3, and, c) PP1. Electrolyte 0.10 M HCl. Potential scan initiated at +0.75 V in the negative direction. Potential step increment 4 mV; square wave amplitude 25 mV; frequency 5 Hz.
prevails over peak IV, denoting the presence of a deposit of hydrated forms of hematite. This response was observed for samples A3, D1, L1, L2, M1, M3 and PP1. For sample M2, as for samples A2, D2, D3, M2, PP4, shown in Fig. 6c, prominent peak II, accompanied by overlapping peaks III and IV predominate. In this case, goethite and hematite with variable degree of hydration and crystallinity coexist. Finally, for sample PP2 (Fig. 6d), peak I is accompanied by weak peaks II and III and an isolated, well-defined, peak IV. Here, the deposit consists mainly of non-crystalline, highly hydrated iron oxide, accompanied by a small amount of crystalline hematite.
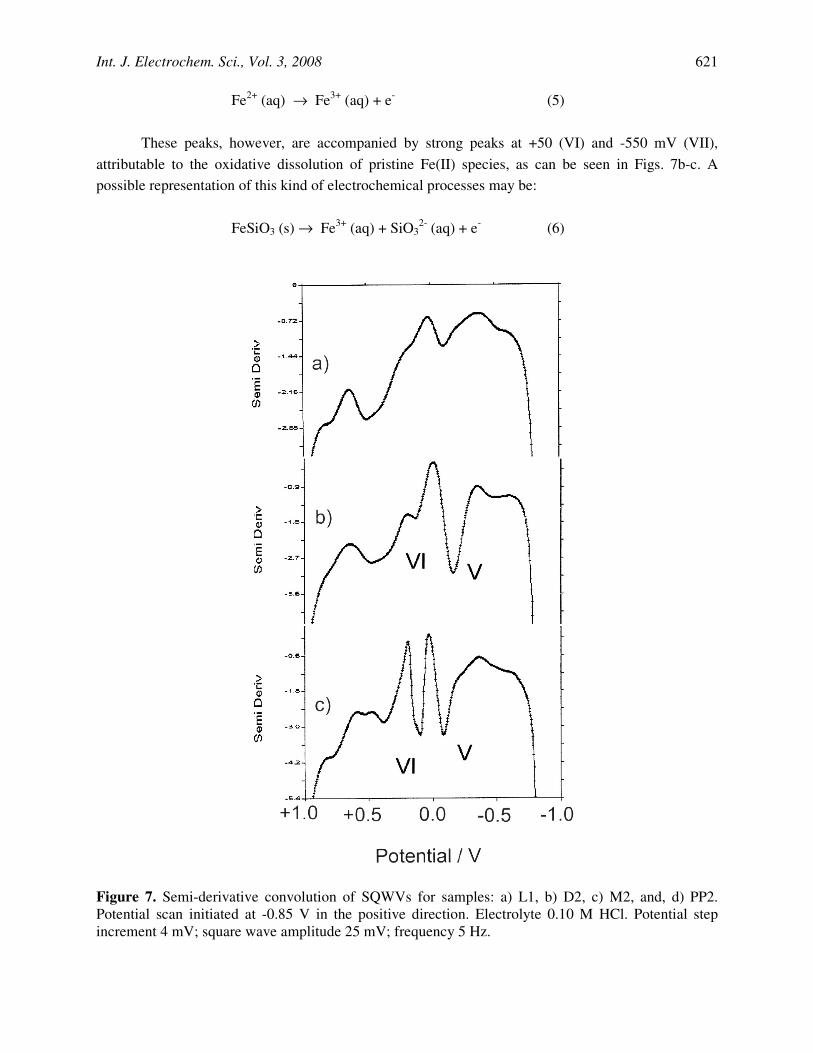
The presence of iron(II) species can be studied from SQWVs performed upon initiating the potential at-0.85 V in the positive direction. Typical SQWVs are depicted in Fig. 7. In general, a weak peak appears at -550 mV, attributable to the oxidation of metallic iron to Fe2+ (aq) resulting from the prior reduction at potentials ca. -0.85 V:
Int. J. Electrochem. Sci., Vol. 3, 2008
620
Figure 6. Semi-derivative convolution of SQWVs for samples: a) M3, b) A1, c) M2, and, d) D!. Potential scan initiated at +0.75 V in the negative direction. Electrolyte 0.10 M HCl. Potential step increment 4 mV; square wave amplitude 25 mV; frequency 5 Hz.
Fe (s) → Fe2+ (aq) + 2e- (4)
As shown in Fig. 7a, a second broad peak near to +350 mV also appears. This electrochemical
process corresponds to the oxidation of Fe2+ ions to Fe3+ ones in solution phase [39]:
Int. J. Electrochem. Sci., Vol. 3, 2008
621
Fe2+ (aq) → Fe3+ (aq) + e- (5)
These peaks, however, are accompanied by strong peaks at +50 (VI) and -550 mV (VII), attributable to the oxidative dissolution of pristine Fe(II) species, as can be seen in Figs. 7b-c. A possible representation of this kind of electrochemical processes may be:
FeSiO3 (s) → Fe3+ (aq) + SiO3
2- (aq) + e- (6)
Figure 7. Semi-derivative convolution of SQWVs for samples: a) L1, b) D2, c) M2, and, d) PP2. Potential scan initiated at -0.85 V in the positive direction. Electrolyte 0.10 M HCl. Potential step increment 4 mV; square wave amplitude 25 mV; frequency 5 Hz.
Int. J. Electrochem. Sci., Vol. 3, 2008
622
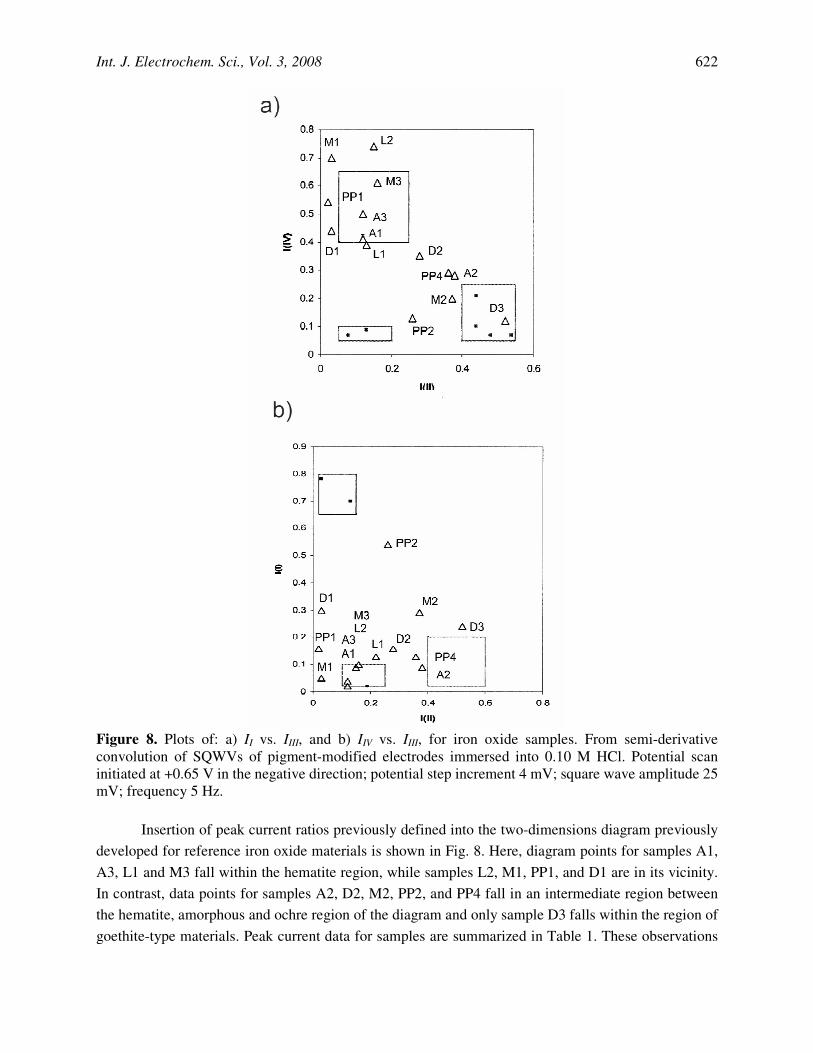
Figure 8. Plots of: a) II vs. IIII, and b) IIV vs. IIII, for iron oxide samples. From semi-derivative convolution of SQWVs of pigment-modified electrodes immersed into 0.10 M HCl. Potential scan initiated at +0.65 V in the negative direction; potential step increment 4 mV; square wave amplitude 25 mV; frequency 5 Hz.
Insertion of peak current ratios previously defined into the two-dimensions diagram previously
developed for reference iron oxide materials is shown in Fig. 8. Here, diagram points for samples A1, A3, L1 and M3 fall within the hematite region, while samples L2, M1, PP1, and D1 are in its vicinity. In contrast, data points for samples A2, D2, M2, PP2, and PP4 fall in an intermediate region between the hematite, amorphous and ochre region of the diagram and only sample D3 falls within the region of goethite-type materials. Peak current data for samples are summarized in Table 1. These observations
Int. J. Electrochem. Sci., Vol. 3, 2008
623
suggest that: i) crystalline hematite is a frequent, almost ubiquotous, component of iron oxide deposits; ii) hematite is accompanied by amorphous hydrated iron oxides; iii) rarely crystalline goethite is formed. These ideas are consistent with TEM data.
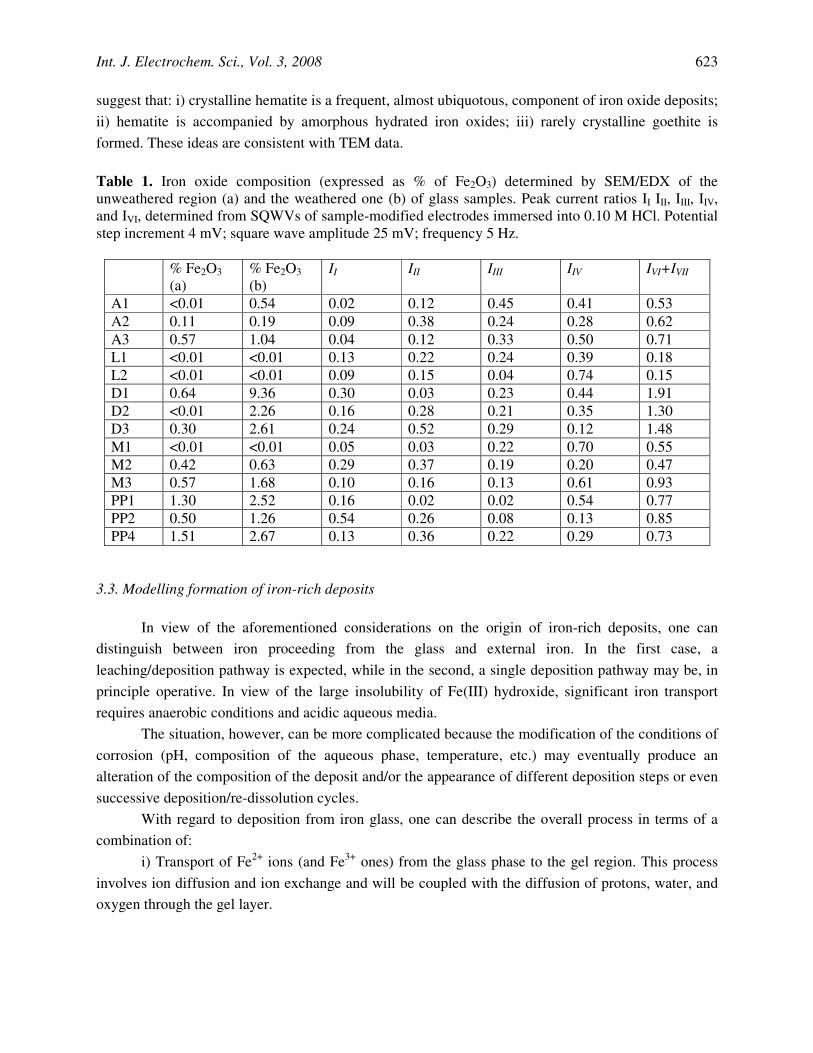
Table 1. Iron oxide composition (expressed as % of Fe2O3) determined by SEM/EDX of the unweathered region (a) and the weathered one (b) of glass samples. Peak current ratios II III, IIII, IIV, and IVI, determined from SQWVs of sample-modified electrodes immersed into 0.10 M HCl. Potential step increment 4 mV; square wave amplitude 25 mV; frequency 5 Hz.
% Fe2O3 (a)
% Fe2O3 (b)
II III IIII IIV IVI+IVII
A1 <0.01 0.54 0.02 0.12 0.45 0.41 0.53 A2 0.11 0.19 0.09 0.38 0.24 0.28 0.62 A3 0.57 1.04 0.04 0.12 0.33 0.50 0.71 L1 <0.01 <0.01 0.13 0.22 0.24 0.39 0.18 L2 <0.01 <0.01 0.09 0.15 0.04 0.74 0.15 D1 0.64 9.36 0.30 0.03 0.23 0.44 1.91 D2 <0.01 2.26 0.16 0.28 0.21 0.35 1.30 D3 0.30 2.61 0.24 0.52 0.29 0.12 1.48 M1 <0.01 <0.01 0.05 0.03 0.22 0.70 0.55 M2 0.42 0.63 0.29 0.37 0.19 0.20 0.47 M3 0.57 1.68 0.10 0.16 0.13 0.61 0.93 PP1 1.30 2.52 0.16 0.02 0.02 0.54 0.77 PP2 0.50 1.26 0.54 0.26 0.08 0.13 0.85 PP4 1.51 2.67 0.13 0.36 0.22 0.29 0.73
3.3. Modelling formation of iron-rich deposits
In view of the aforementioned considerations on the origin of iron-rich deposits, one can distinguish between iron proceeding from the glass and external iron. In the first case, a leaching/deposition pathway is expected, while in the second, a single deposition pathway may be, in principle operative. In view of the large insolubility of Fe(III) hydroxide, significant iron transport requires anaerobic conditions and acidic aqueous media.
The situation, however, can be more complicated because the modification of the conditions of corrosion (pH, composition of the aqueous phase, temperature, etc.) may eventually produce an alteration of the composition of the deposit and/or the appearance of different deposition steps or even successive deposition/re-dissolution cycles.
With regard to deposition from iron glass, one can describe the overall process in terms of a combination of:
i) Transport of Fe2+ ions (and Fe3+ ones) from the glass phase to the gel region. This process involves ion diffusion and ion exchange and will be coupled with the diffusion of protons, water, and oxygen through the gel layer.
Int. J. Electrochem. Sci., Vol. 3, 2008
624
ii) Deposition of Fe(III) oxides and/or hydroxyoxides in the gel region via reaction of Fe2+ ions with dissolved oxygen. Apart from thermodynamic considerations, the kinetic of the nucleation and growth processes can be relevant.
The thermodynamics of the overall deposition process can be described in terms of the redox
potentials of the processes described by Eqs. (1)-(3) and that of the O2/H2O couple, the reactions yielding hematite, goethite, and "iron(III) hydroxide" being:
4Fe2+ (gel) + O2 (gel) + 4H2O (gel) → 2Fe2O3 (s) + 8H+ (gel) (7) 4Fe2+ (gel) + O2 (gel) + 6H2O (gel) → 4FeO(OH) (s) + 8H+ (gel) (8) 4Fe2+ (gel) + O2 (gel) + 10H2O (gel) → 4Fe(OH)3 (s) + 8H+ (gel) (9)
where (g) denotes the gel phase. Interestingly, all three processes involve 2 protons for each Fe2+ but the number of involved water molecules is of 1.0, 1.5, and 2.5 per Fe2+, respectively.
A similar situation takes place for the deposition from Fe3+ ions coming from the glass or transported by the electrolyte, the precipitation of hematite, goethite and "iron hydroxide" being represented as:
2Fe3+ (gel) + 3H2O (gel) → Fe2O3 (s) + 6H+ (gel) (10) Fe3+ (gel) + 2H2O (gel) → FeO(OH) (s) + 3H+ (gel) (11) Fe3+ (gel) + 3H2O (gel) → Fe(OH)3 (s) + 3H+ (gel) (12)
Since the deposition reaction occurs presumably in the gel layer where there is a limited
concentration of water, those differences can be relevant for the appearance of one precipitate or another.
Using standard redox potentials in aqueous solution and free enthalpies of formation of the involved compounds [52-55], one can arrive to the following expressions for the redox potential of the reactions described by Eqs. (7)-(9) (all in V at 298 K):
[ ] [ ][ ] )13(log
4059.0
50.0)( 8
42
42
+
+
+=H
OHFephematE OX
[ ] [ ][ ] )14(log
4059.0
49.0)( 8
62
42
+
+
+=H
OHFepgoetE OX
[ ] [ ][ ] )15(log
4059.0
77.0)( 8
102
42
+
+
+=H
OHFephidroxE OX
Figure 9 illustrates de variation of the redox potential described by Eqs. (13)-(15), representative of the thermochemical spontaneity of the deposition reactions (7)-(9), respectively. It can be seen that, regardless the pH and Fe2+ and O2 concentrations, the deposition of Fe(OH)3 is
Int. J. Electrochem. Sci., Vol. 3, 2008
625
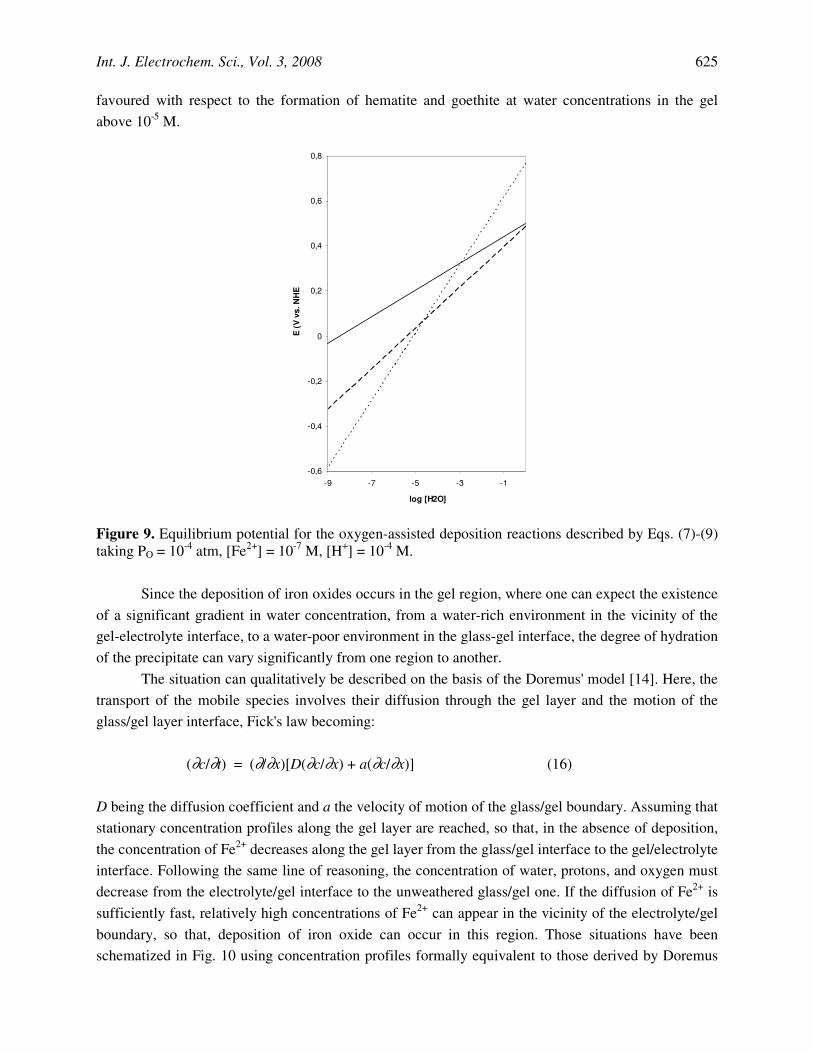
favoured with respect to the formation of hematite and goethite at water concentrations in the gel above 10-5 M.
-0,6
-0,4
-0,2
0
0,2
0,4
0,6
0,8
-9 -7 -5 -3 -1
log [H2O]
E (
V v
s. N
HE
)
Figure 9. Equilibrium potential for the oxygen-assisted deposition reactions described by Eqs. (7)-(9) taking PO = 10-4 atm, [Fe2+] = 10-7 M, [H+] = 10-4 M.
Since the deposition of iron oxides occurs in the gel region, where one can expect the existence
of a significant gradient in water concentration, from a water-rich environment in the vicinity of the gel-electrolyte interface, to a water-poor environment in the glass-gel interface, the degree of hydration of the precipitate can vary significantly from one region to another.
The situation can qualitatively be described on the basis of the Doremus' model [14]. Here, the transport of the mobile species involves their diffusion through the gel layer and the motion of the glass/gel layer interface, Fick's law becoming:
(∂c/∂t) = (∂/∂x)[D(∂c/∂x) + a(∂c/∂x)] (16)
D being the diffusion coefficient and a the velocity of motion of the glass/gel boundary. Assuming that stationary concentration profiles along the gel layer are reached, so that, in the absence of deposition, the concentration of Fe2+ decreases along the gel layer from the glass/gel interface to the gel/electrolyte interface. Following the same line of reasoning, the concentration of water, protons, and oxygen must decrease from the electrolyte/gel interface to the unweathered glass/gel one. If the diffusion of Fe2+ is sufficiently fast, relatively high concentrations of Fe2+ can appear in the vicinity of the electrolyte/gel boundary, so that, deposition of iron oxide can occur in this region. Those situations have been schematized in Fig. 10 using concentration profiles formally equivalent to those derived by Doremus
Int. J. Electrochem. Sci., Vol. 3, 2008
626
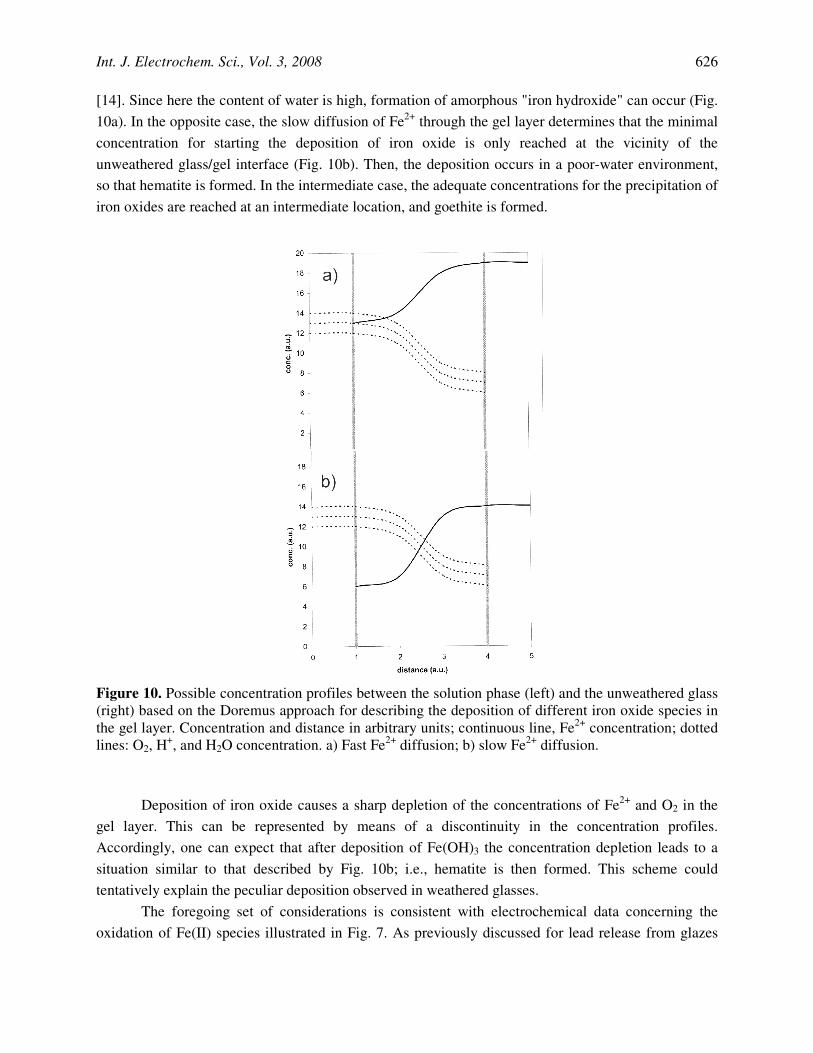
[14]. Since here the content of water is high, formation of amorphous "iron hydroxide" can occur (Fig. 10a). In the opposite case, the slow diffusion of Fe2+ through the gel layer determines that the minimal concentration for starting the deposition of iron oxide is only reached at the vicinity of the unweathered glass/gel interface (Fig. 10b). Then, the deposition occurs in a poor-water environment, so that hematite is formed. In the intermediate case, the adequate concentrations for the precipitation of iron oxides are reached at an intermediate location, and goethite is formed.
Figure 10. Possible concentration profiles between the solution phase (left) and the unweathered glass (right) based on the Doremus approach for describing the deposition of different iron oxide species in the gel layer. Concentration and distance in arbitrary units; continuous line, Fe2+ concentration; dotted lines: O2, H+, and H2O concentration. a) Fast Fe2+ diffusion; b) slow Fe2+ diffusion.
Deposition of iron oxide causes a sharp depletion of the concentrations of Fe2+ and O2 in the gel layer. This can be represented by means of a discontinuity in the concentration profiles. Accordingly, one can expect that after deposition of Fe(OH)3 the concentration depletion leads to a situation similar to that described by Fig. 10b; i.e., hematite is then formed. This scheme could tentatively explain the peculiar deposition observed in weathered glasses.
The foregoing set of considerations is consistent with electrochemical data concerning the oxidation of Fe(II) species illustrated in Fig. 7. As previously discussed for lead release from glazes
Int. J. Electrochem. Sci., Vol. 3, 2008
627
[42], the weathering process can also be regarded in terms of a reaction of microparticles whose advance is given by a reaction conversion coefficient, y, given by:
)17()0(
)(1
=−=
tmtm
yo
where m(t) and mo(t=0) are the masses of undissolved material at time t and at the beginning of the reaction (t = 0), respectively. Then, a time-dependence of y of the type:
)18(1 xtbey −−=
can be taken, b and x being two kinetic parameters. Accordingly, if iron oxide deposits proceeds exclusively from the release of Fe(II) species in the original glass, the concentration of such species, cII, at a time t must satisfy the relationship:
)19(xtbulkglassunweath
IIII ebcc −=
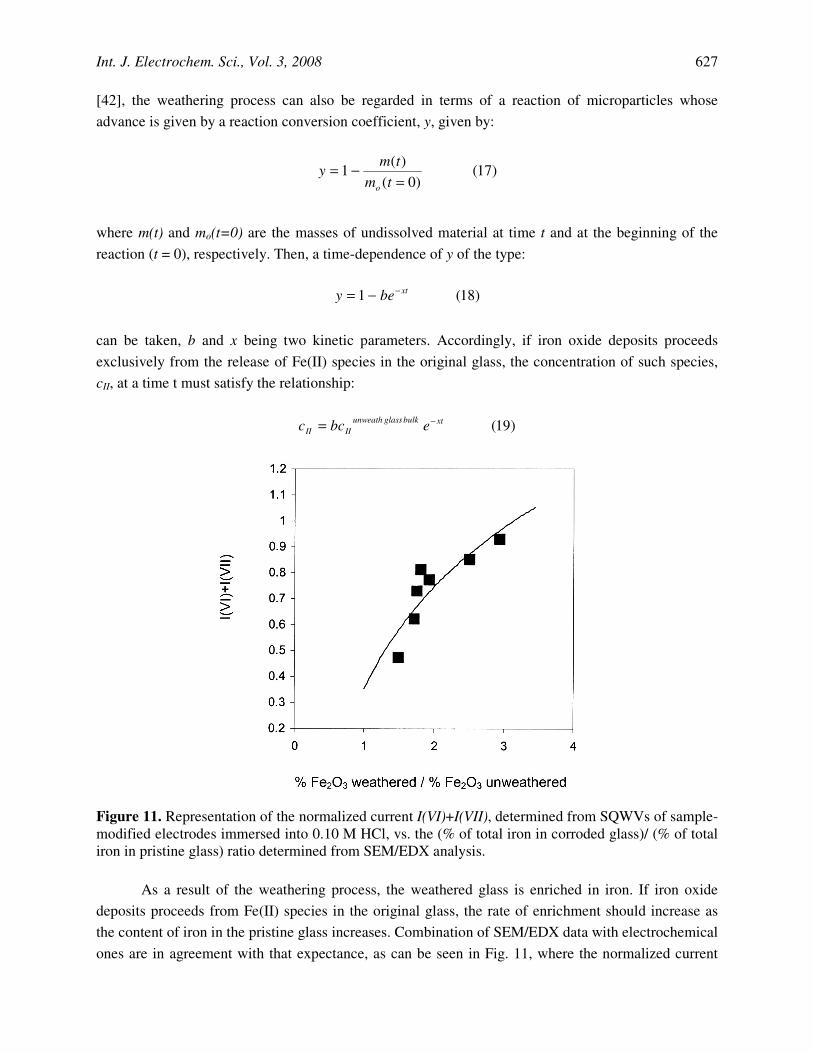
Figure 11. Representation of the normalized current I(VI)+I(VII), determined from SQWVs of sample-modified electrodes immersed into 0.10 M HCl, vs. the (% of total iron in corroded glass)/ (% of total iron in pristine glass) ratio determined from SEM/EDX analysis.
As a result of the weathering process, the weathered glass is enriched in iron. If iron oxide deposits proceeds from Fe(II) species in the original glass, the rate of enrichment should increase as the content of iron in the pristine glass increases. Combination of SEM/EDX data with electrochemical ones are in agreement with that expectance, as can be seen in Fig. 11, where the normalized current
Int. J. Electrochem. Sci., Vol. 3, 2008
628
I(VI)+I(VII) (= (iVI+iVII)/(iI+iII+iIII+iIV), representative of the Fe(II) content relative to the iron oxide deposits, is plotted as a function of the (% of total iron in corroded glass)/ (% of total iron in pristine glass) ratio determined from SEM/EDX analysis. Pertinent data are summarized in Table 1.
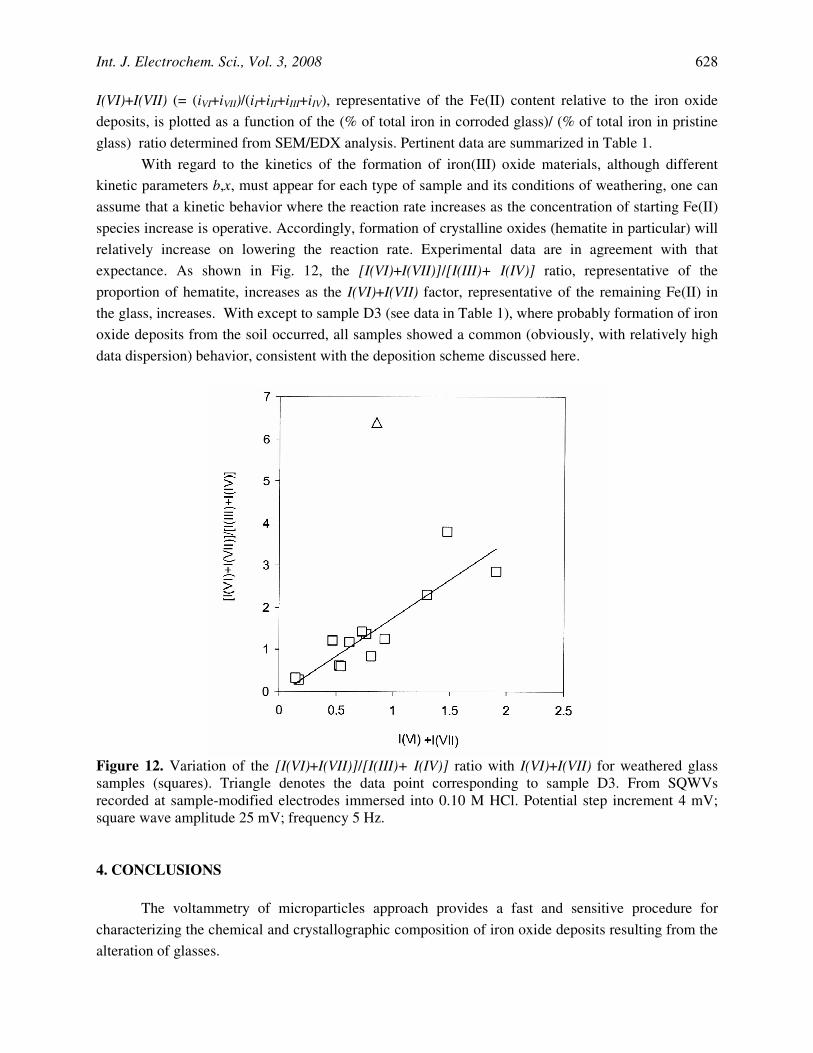
With regard to the kinetics of the formation of iron(III) oxide materials, although different kinetic parameters b,x, must appear for each type of sample and its conditions of weathering, one can assume that a kinetic behavior where the reaction rate increases as the concentration of starting Fe(II) species increase is operative. Accordingly, formation of crystalline oxides (hematite in particular) will relatively increase on lowering the reaction rate. Experimental data are in agreement with that expectance. As shown in Fig. 12, the [I(VI)+I(VII)]/[I(III)+ I(IV)] ratio, representative of the proportion of hematite, increases as the I(VI)+I(VII) factor, representative of the remaining Fe(II) in the glass, increases. With except to sample D3 (see data in Table 1), where probably formation of iron oxide deposits from the soil occurred, all samples showed a common (obviously, with relatively high data dispersion) behavior, consistent with the deposition scheme discussed here.
Figure 12. Variation of the [I(VI)+I(VII)]/[I(III)+ I(IV)] ratio with I(VI)+I(VII) for weathered glass samples (squares). Triangle denotes the data point corresponding to sample D3. From SQWVs recorded at sample-modified electrodes immersed into 0.10 M HCl. Potential step increment 4 mV; square wave amplitude 25 mV; frequency 5 Hz.
4. CONCLUSIONS
The voltammetry of microparticles approach provides a fast and sensitive procedure for characterizing the chemical and crystallographic composition of iron oxide deposits resulting from the alteration of glasses.
Int. J. Electrochem. Sci., Vol. 3, 2008
629
Upon attachment of submicrosamples of weathered glass layers to PIGEs, well-defined voltammetric responses were obtained in contact with HCl electrolytes. Well-defined peaks characterizing the presence of amorphous, highly hydrated iron oxides, crystalline hematite and goethite and their hydrated forms are recorded in the potential range between +300 and -600 mV vs. AgCl/Ag. Manganese dioxide forms produce well-defined voltammetric signals at potentials between +700 and +400 mV.
Samples from five archaeological sites in the Valencian Community (Spain) were studied using this approach. The most frequent case consists of deposits where amorphous iron oxide coexists with crystalline hematite. In some cases the deposit is almost exclusively formed by hematite crystals, while in other few cases, amorphous iron oxide prevails largely. Only in two samples the iron oxide deposit is formed by hydrated goethite.
Thermochemical aspects of the formation of different iron deposits as a result of the release of iron ions from the glass are discussed using electrochemical data. Apart from kinetic considerations, it is suggested that formation of different iron oxide deposits results from the existence of a significant gradient of water concentration within the gel layer formed throughout the weathering process.
ACKNOWLEDGEMENTS Financial support from Generalitat Valenciana I+D Project CTIDIB/2004/197 and the Spanish Government and European Union (I+D+I MCYT and FEDER Found) Projects CTQ2004-06754-CO3-01 and -02 and CQT2005-09339-CO3-01 and 02 is gratefully acknowledged. References 1. R. Newton and S. Davison, Conservation of Glass, Butterworth Heineman, London (1989). 2. B.C. Bunker, J. Non-Cryst. Solids, 179 (1994) 300. 3. M.E. Morgenstein, C.L. Wicket and A. Barkatt, J. Archaeol. Sci. 26 (1996) 1193. 4. A. Silvestri, G. Molin and G. Salviulo, J. Non-Cryst. Solids, 351 (2005) 1338. 5. M.A. Rana and R.W. Douglas, Phys. Chem. Glass. 2 (1961) 179. 6. P. Aagaard and H.C. Helgeson, Am. J. Sci. 282 (1982) 237. 7. B. Grambow, in: Advances in Ceramics (G.G. Wicks, W.A. Ross, editors) American ceramic
Society, Columbus (1984), p. 474. 8. J.L. Crosovier, J. Honnorez and J.P. Eberhart, Geochim. Cosmochim. Acta, 51 (1987) 2977. 9. H. Scholze, J. Non-Cryst. Solids, 102 (1988) 1. 10. C. Macquet and J.H. Thomassin, Appl. Clay Sci. 7 (1992) 17. 11. J.E. Mungall and R.F. Martin, Geochim. Cosmochim. Acta, 58 (1994) 75. 12. R. Conradt, J. Nucl. Mater. 298 (2001) 19. 13. A. Helebrant, A. Jiricka and J. Jiricková, Glass Sci. Technol. 77C (2004) 85. 14. R.H. Doremus, J. Non-Cryst. Solids, 19 (1975) 137. 15. G.A. Cox and B.A. Ford, J. Mater. Sci. 24 (1989) 3146. 16. G.A. Cox and B.A. Ford, J. Mater. Sci. 28 (1993) 5637. 17. J. Sterpenich and G. Libourel, Chem. Geol. 171 (2001) 181. 18. J.F. Collins, S.W and Buol, Soil Sciences, 110 (1970) 111. 19. D.C.W. Sanderson and J.R. Hunter, Sci. Archaeol. 23 (1981) 27. 20. P. Costagliola, G. Baldi, C. Cipriani, E. Pecchioni and A. Buccianti, J. Cultural Heritage, 1 (2000)
287.
Int. J. Electrochem. Sci., Vol. 3, 2008
630
21. P. Mirti, P. Davit and M. Gulmini, Anal. Bioanl. Chem. 372 (2002) 221. 22. D. Watkinson, L. Weber and K. Anheuser, Archaeometry, 47 (2005) 69. 23. A. Pinto, Vitrea, 7 (1991) 27. 24. B. Knight, in: Preprints of the ICO Copenhagen Congress (A. Roy, P. Smith, editors).
International Institute for Conservation, London (1964) pp. 99-104. 25. T. Kuwana and W.G. French, Anal. Chem. 36 (1964) 241. 26. Kh. Z. Brainina and R.P. Lesunova, J. Anal. Chem. USSR 29 (1974) 1123. 27. D. Bauer and M. Ph. Gaillochet, Electrochim. Acta (1974) 597. 28. F. Scholz and B. Meyer, Electroanalytical Chemistry a Series of Advances (A.J. Bard, I.
Rubinstein, editors). Marcel Dekker, New York (1998) pp. 1-87. 29. T. Grygar, F. Marken, U. Schröder and F. Scholz, Coll. Czech. Chem. Commun., 67 (2002) 163. 30. M.T. Mouhandess, F. Chassagneux and O. Vittori, J. Electroanal. Chem. 131 (1982) 367. 31. M.T. Mouhandess, F. Chassagneux, O. Vittori, A. Accary and R.M. Reeves, J. Electroanal. Chem.
181 (1984) 93. 32. P. Encinas, L. Lorenzo, M.L. Tascón, M.D. Vázquez and P. Sánchez-Batanero, J. Electroanal.
Chem. 371 (1994) 161. 33. T. Grygar, Coll. Czech. Chem. Commun. 60 (1995) 1261. 34. T. Grygar, Coll. Czech. Chem. Commun. 61 (1996) 93. 35. T. Grygar, J. Electroanal. Chem. 405 (1996) 117. 36. T. Grygar, J. Solid State Electrochem. 2 (1998) 127. 37. A. Doménech, M.T. Doménech, J.V. Gimeno, F. Bosch and M.C. Saurí, Analyst, 126 (2001) 1764. 38. T. Grygar, P. Bezdicka, D. Hradil, A. Doménech, F. Marken and L. Pikna, Analyst, 127 (2002)
1100. 39. S. Bakardjieva, P. Bezdicka, T. Grygar and P. Vorm, J. Solid State Electrochem. 4 (2000) 306. 40. A. Doménech, M.T. Doménech, M. Moya, J.V. Gimeno and F. Bosch, Electroanalysis, 12 (2000)
120. 41. A. Doménech, M.T. Doménech and L. Osete, Electroanalyis, 13 (2001) 927. 42. A. Doménech and M.T. Doménech, Electroanalysis, 17 (2005) 1959. 43. A. Doménech, M.T. Doménech and L. Osete, Microchim. Acta, 154 (2006) 123. 44. C.H. Rochester and S.A. Topham, J. Chem. Soc. Faraday Trans. 1, 75 (1979) 1073. 45. H.D. Ruan, R.L. Frost and J.T. Kloprogge, Spectrochim. Acta A, 57 (2001) 2575. 46. F. Watari, J. Van Landuyt, P. Delavignette, S. Amelinckx and N. Igata, Physica Status Solidi A-
Applied Research, 73 (1982) 215. 47. E. Wolska and U. Schwertmann, Zeit. Kristallogr. 189 (1989) 223. 48. E. Wolska and W. Szajda, J. Mater. Sci. 20 (1985) 4407. 49. M.P. Pomiès, M. Menu and C. Vignaud, J. Eur. Ceram. Soc. 19 (1999) 1605. 50. Y.S.Mendelovici, Mater. Chem. 5 (1980) 37. 51. A. Doménech, M.T. Doménech and H.G.M. Edwards, Electroanalysis 19 (2007) 1890. 52. B.S. Hemingway, Amer. Mineral. 75 (1990) 781. 53. I. Diakonov, I. Khodakovsky, J. Schott and E. Sergeeva, Eur. J. Mineral. 6 (1994) 967. 54. J. Majzlan, K.-D. Grevel and A. Navrotsky, Amer. Mineral. 88 (2003) 855. 55. L. Mazeina and A. Navrotsky, Clays Clay Miner. 53 (2005) 113. © 2008 by ESG (www.electrochemsci.org)


![Electrochemical miRNA Biosensors: The Benefits of ...€¦ · electrochemical nanobiosensors [6, 7]. The electrochemical nanobiosensors are pulling together the advantages of electrochemical](https://img.pdfslide.net/doc/110x75/5f5dab2fa5702b13b4580399/electrochemical-mirna-biosensors-the-benefits-of-electrochemical-nanobiosensors.jpg)