Embed Size (px)
Citation preview
Turk J Chem
(2013) 37: 325 – 334
c⃝ TUBITAK
doi:10.3906/kim-1111-4
Turkish Journal of Chemistry
http :// journa l s . tub i tak .gov . t r/chem/
Research Article
Electrochemistry of 2,6-diaminopurine on multiwall carbon nanotube modified
glassy carbon electrode
Ebru MAVIOGLU AYAN, Sukriye ULUBAY KARABIBEROGLU, Zekerya DURSUN∗
Department of Chemistry, Faculty of Science, Ege University, 35100 Bornova, Izmir, Turkey
Received: 02.11.2011 • Accepted: 28.11.2012 • Published Online: 10.06.2013 • Printed: 08.07.2013
Abstract: The electrochemical oxidation of 2,6-diaminopurine (2,6-DAP) was studied in pH 7.4 phosphate buffer solution
on multiwall carbon nanotube modified glassy carbon electrode (MWCNT/GCE) over a temperature range of 20 to 50 C
using cyclic voltammetry. 2,6-DAP oxidation on MWCNT/GCE showed a well-defined and irreversible oxidation peak
at about 0.72 V vs. Ag/AgCl at pH 7.4. The oxidation potential of 2,6-DAP linearly varied with pH over the range of
3.0 to 10.0 with a slope of –0.0547 V/pH, implying that 2 protons were accompanied by 2 electrons transferred in the
electrochemical reaction. The activation energy, Ea, of oxidation reaction was found to be 33.10 ± 1.88 kJ/mol. The
differential pulse voltammetric determination of 2,6-DAP was also studied. The peak currents increased linearly with
increasing of the 2,6-DAP concentration range from 0.4 µmol/L to 80 µmol/L. The linear regression equation appeared
as Ip /µA = –(1.66 ± 0.42) + (4.21 ± 0.11) [2,6-DAP]/µmol/L, R2 = 0.9982, and the detection limit (S/N = 3)
was 3 × 10⁻⁷ ± 0.015 mol/L (n =3). The electrocatalytic oxidation of 2,6-DAP on MWCNT/GCE showed that acid
pretreated multiwall carbon nanotube can be used in new applications in electrochemical determinations of biologically
important compounds.
Key words: Carbon nanotubes, 2,6-diaminopurine, activation energy, voltammetry
1. Introduction
Purine and pyrimidine derivatives are fundamental compounds in biological systems, playing an essential role
in various biological processes such as energy transduction and cell signaling.1−3 Substituted purines and
pyrimidines constitute the backbone of DNA bases and RNA molecules. The clinical efficiency of several purine
derivatives has been responsible for their use in human cancer therapy, virus infection, and vascular diseases.
These, including 2,6-diaminopurine, 8-azoguanine, 6-mercaptopurine, thioguanine, 6-chloropurine, and other
derivatives, are comparatively effective as anticancer agents.4,5
Determination of extracellular concentrations of purines is very important because changes in the con-
centrations can indicate several dysfunctions or diseases.6 Many methods have been developed for the detection
and quantification of purine bases in nucleic acids. Among them, the most commonly used are the spectroscopic
methods,7,8 chromatography,9,10 and capillary electrophoresis,11 although the voltammetric methods are prac-
tically suited for the analysis of these purines. In these methods, polythionine/gold nanoparticles/multiwall car-
bon nanotube modified glassy carbon electrode (GCE),12 Nafion–ruthenium oxide pyrochlore modified GCE,13
∗Correspondence: [email protected]
325

MAVIOGLU AYAN et al./Turk J Chem
carbon nanotube modified GCE,14−18 mercury electrode,19,20 and so on were used for determination of purines
and purine derivatives.
2,6-Diaminopurine (2,6-DAP) is obtained from adenine, substituting an additional amino group into
position 2. It is one of a large class of compounds, analogs of natural purines, that show pharmacological
properties as antimetabolites of nucleic acid metabolism. 2,6-DAP has been shown to act as a growth inhibitor
of bacteria and mammalian cells.21−24 Determination of 2,6-DAP was studied by differential pulse voltammetry
at graphite electrodes in pH 7 phosphate buffer solution and the linear range for 2,6-DAP was found as ranging
from 1.0 × 10⁻⁶ to 5.0 × 10⁻⁴ mol/L.21 Electrochemical oxidation of aminopurines and their complexes
with Cu(I) was investigated on a pencil graphite electrode by voltammetric technique. The determination of
aminopurines was based on the formation of a complex between cuprous ions and aminopurine molecules, its
adsorption on the electrode surface, and dissolution by oxidative stripping.25
Because carbon nanotube (CNT) has outstanding advantages such as high conductivity, high chemical
stability, and extremely high mechanical strength and modulus, it is widely used in many fields, including
in nanoelectronic devices, electron field emission sources, and potential hydrogen storage materials. In addi-
tion, CNTs are used as electrode materials in the electroanalytical field for their good capability of electron
transfer.26−28 It has been reported that CNT modified electrodes were successfully applied to study and de-
termine many biological and organic molecules, such as dopamine,30−32 ascorbic acid,33,34 uric acid, 34,35
cytochrome C36 NADH,37 amino acids,38 hydrazine,39 nitrite, 40 adenine and guanine,14,41,42 and DNA.43
A search of the literature clearly reveals that there are no reports for activation energy and voltam-
metric determination of 2,6-diaminopurine on multiwall carbon nanotube modified glassy carbon electrode
(MWCNT/GCE). In this paper, for the first time, the MWCNT/GCE was used to obtain the activation energy
depending on temperature by measuring the peak current and peak potential of 2,6-DAP on cyclic voltammo-
grams. The differential pulse voltammetric technique was also used for sensitive determination of 2,6-DAP.
2. Experimental
2.1. Chemicals
MWCNTs were purchased from Aldrich Chem. with a diameter of 110–170 nm, a length of 5–9 µm, and
purity of 90%, and they were purified with concentrated HNO3 . 2,6-DAP was supplied by Aldrich Chem. All
other reagents were of analytical grade and used without any further purification. The buffer solutions were
prepared from acetic acid/sodium acetate (0.1 mol/L), sodium dihydrogenphosphate/disodium monohydrogen
phosphate, and boric acid/sodium metaborate in the pH range of 3.0–10.0. Stock solution of 2,6-DAP was
prepared daily with ultrapure water (Millipore Milli Q System, 18.2 Ω). All electrochemical measurements
were obtained under pure N2 atmosphere.
2.2. Apparatus
Voltammetric measurements were carried out using a Bas 100B electrochemical analyzer and IviumStat &
IviumStat.XR electrochemical interface and impedance analyzer with a 3-electrode system consisting of a
working electrode (bare GCE and MWCNT-GCE), a platinum wire counter electrode, and an Ag/AgCl (sat.
KCl) reference electrode. Cyclic voltammetry (CV) and differential pulse (dp) mode were used throughout the
electroanalytical studies. The pH measurements were made with a WTW handheld 330i ion analyzer pH meter.
A Philips XL-30S SEM was used for the characterization of carbon nanotubes on the electrode surfaces.
326

MAVIOGLU AYAN et al./Turk J Chem
The CV curves were obtained under nitrogen flow in the experiments of variable temperature. Tempera-
tures were kept constant by water circulation through a double wall cell, which was connected to a Polyscience
901 Refrigerated Circulator.
2.3. Pretreatment of multiwall carbon nanotube and preparation of modified electrodes
The MWCNT, as received, was pretreated with concentrated HNO3 for purification and activation as follows:
0.1 g of MWCNT was boiled in approximately 4 mL of concentrated HNO3 for 30 min and then washed many
times with ultrapure water. The acid-treated MWCNT was dispersed in DMF to get a black suspension by
ultrasonic bath. Before modification, GCE was activated by polishing with a different grade of Al2O3 slurry
(0.05–3.0 µmol/L) on a synthetic cloth, then rinsing with pure water and ultrasonication for 3 min in an
ultrapure water and ethanol mixture. A 10-µL MWCNT suspension was injected on the preconditioned bare
GCE surface and then the solvent (DMF) of the suspension on the GCE surface was evaporated at 55 C at
least 2 h to fabricate the MWCNT/GCE.
3. Results and discussion
3.1. Scanning electron microscopy and electrochemical impedance spectroscopy characterizations
of MWCNT/GCE
The surface morphology of MWCNT modified GCE was studied by recording SEM images (Figure 1A). The
image clearly indicates the deposition of MWCNT at the electrode surface. Figure 1B illustrates the results of
electrochemical impedance spectroscopy (EIS) on bare GCE and MWCNT/GCE in the presence of 10 mmol/L
Fe(CN)3−/4−6 + 0.1 mol/L KCl solution. At the bare GCE, a semicircle of about 1334 Ω in diameter with an
almost straight tail line can be seen. However, the diameter of the high frequency semicircle was noticeably
reduced to 990 Ω (found by extrapolation from Figure 1B) by the surface modification of the MWCNT,
suggesting that a significant acceleration of the redox reaction Fe(CN)3−/4−6 occurred on the MWCNT surface.
In Figure 1B, the slope of the curve is almost equal to 1, indicating that a mass controlled process takes place
on the MWCNT/GCE surface.
3.2. Cyclic voltammetry characteristics of 2,6-diaminopurine on the MWCNT/GCE
The voltammetric behavior of 1.0 × 10⁻⁵ mol/L 2,6-DAP at the bare GCE (in Figure 2 inset) and MWCNT-
GCE (curve b) are shown in Figure 2. A small broad oxidation peak for 2,6-DAP was observed at 0.78 V
vs. Ag/AgCl, at bare GCE in pH 7.4 PBS. In the case of MWCNT/GCE, the main anodic peak (A1) at
0.70 V vs. Ag/AgCl was related to the oxidation of 2,6-DAP. No cathodic peak was observed on the reverse
scan, which displayed that 2,6-DAP oxidation was an electrochemically irreversible process at both bare and
modified electrodes. On scanning in the negative direction, 2 peaks were displayed due to reduction of the
oxidation product (C1) and adsorption process (C2). The peak current signal increased significantly with its
peak potential shifting negatively for about 0.08 V vs. Ag/AgCl. A high electrocatalytic activity was observed
at MWCNT/GCE towards the oxidation of 2,6-DAP at pH 7.4 PBS by means of significant peak current increase
and peak potential shift.
327

MAVIOGLU AYAN et al./Turk J Chem
Figure 1. A) SEM images of MWCNT/GCE and B) electrochemical impedance curves of bare GCE (⃝) and
MWCNT/GCE ( [U+FFFF])
E/V (vs. Ag/AgCl)
E/V (vs. Ag/AgCl)
I/µ
A
I/µ
A
6
4
2
0
0.0 0.5 1.0b
a
Figure 2. Cyclic voltammograms of 1.0 × 10⁻⁵ mol/L 2,6-diaminopurine oxidation at the bare GCE (inset) with
absence (a) and presence (b) on MWCNT/GCE in pH 7.4 PBS. Scan rate: 0.05 V/s.
Successive cyclic voltammograms were recorded in a solution of 1.0 × 10⁻⁵ mol/L 2,6-DAP for pH 7.4
PBS at the MWCNT/GCE in the case of the narrow potential range from –0.25 V to 0.80 V (Figure 3A).
The oxidation of 2,6-DAP, peak A1 , appears at 0.70 V. In the second CV scan, new 2 oxidation peaks, A2
and A3 , were observed at 0.38 V and 0.50 V vs. Ag/AgCl, and their currents had almost no change with
the increasing of the CV scan number. In the reverse potential scan, cathodic peak C1 is observed at 0.35 V
vs. Ag/AgCl, but the peak current is smaller than the A1 current, suggesting that the oxidation product of
328

MAVIOGLU AYAN et al./Turk J Chem
2,6-DAP is very unstable and undergoes hydrolysis on the electrode surface. According to cyclic voltammetric
results, a 2-step electrode process can be suggested for 2,6-diaminopurine’s possible oxidation mechanism at
the modified electrode surface. In the first step, the oxidation process of 2,6-diaminopurine can be explained
by transfer of 2 electrons to produce 2,6-diamino-8-hydroxypurine (II in Figure 4), and in the second step,
the product of the first step can be oxidized after 2-electron transfer for producing the corresponding unstable
diimine intermediates, given as III in Figure 4. In the end of the electrode process, the final-forming oxidation
products were hydrolyzed in water to the ultimate compounds, such as parabonic acid, oxaluric acid, urea,
ammonia, allontoin, and guanidine.1,23,44
E/V (vs. Ag/AgCl)
(b)
I/µ
A
E/V (vs. Ag/AgCl)
(b)
I/µ
A
80
60
40
20
0
–20
–40
–60
–80
–1.2 –1.0 –0.8 –0.6 –0.4 –0.2 0.0 0.2 0.4 0.6 0.8 1.0
A2 A
1
A1
A3
C1
C2
C1
1st scan
6th scan
1st scan
6th scan
6th scan
1st scan
Figure 3. Cyclic voltammograms of 1.0 × 10⁻⁵ mol/L 2,6-diaminopurine oxidation at MWCNT/GCE consecutively
recorded for A) narrow potential and B) large potential in pH 7.4 PBS. Scan rate: 0.05 V/s.
N
NN
N
H
NH2
NH2
H2O
-2e, -2H+
N
N
HN
N
H
NH2
NH2
O-2e, -2H
+
N
NN
N
NH2
NH2
O
I II III
Figure 4. Proposed reaction mechanism for the electrochemical oxidation of 2,6-diaminopurine.
When the CVs were recorded in the large potential range from –1.00 V to 0.80 V (Figure 3B), only
an oxidation peak appeared at 0.70 V vs. Ag/AgCl due to the oxidation of 2,6-DAP. After the first current
potential CV scan, 2 new oxidation peaks, A2 and A3 , were observed at 0.38 V and 0.50 V, and their currents
increased with the increasing of the CV scan number. These peaks correspond to the oxidation of the product
of oxidation of 2,6-DAP, 2,6-diamino-8-hydroxypurine, which is strongly adsorbed on the electrode surface. At
the same time, the oxidation current of 2,6-DAP decreases gradually with the number of potential scans due to
the decrease in the available electrode surface because of the adsorption of 2,6-diamino-8-hydroxypurine. In the
329
MAVIOGLU AYAN et al./Turk J Chem
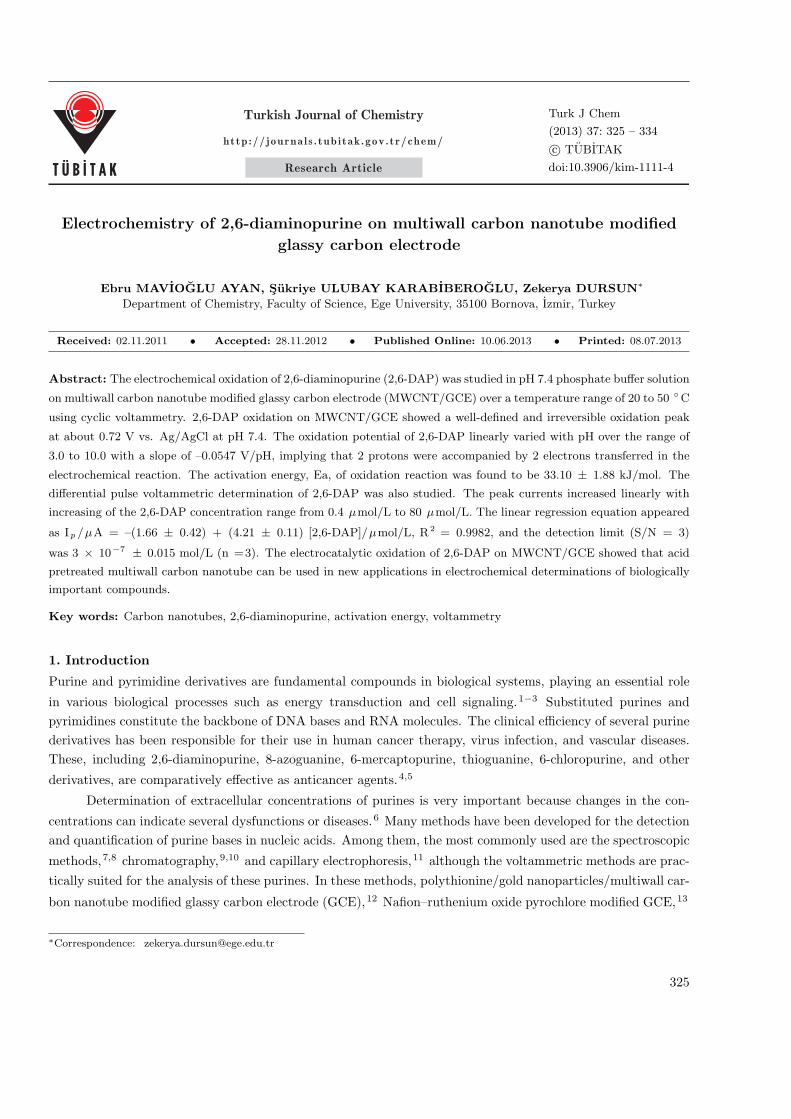
reverse cathodic potential scan, a second reduction peak, C2 , was observed at –0.73 V, and its height increased
with the increasing of the CV scan number. The larger potential CV scan showed that the increasing of the C2
peak height is strongly affected by A2 peak height and its peak current directly correlated with the C2 peak
current increasing.
At the end of consecutive CV scans, the electrode was washed with deionized water and transferred to the
supporting electrolyte. The oxidation peak of 2,6-DAP was observed in the supporting electrolyte, which did
not contain 2,6-DAP. This result shows the adsorption of 2,6-diamino-8-hydroxypurine at the MWCNT/GCE.
According to the CV results in Figures 3A and 3B, the narrow potential range clearly showed a stable
oxidation peak current at 0.70 V vs. Ag/AgCl for recording of repetitive CV scan. This is important for the
study of the quantitative determination of 2,6-DAP with differential pulse voltammetry at MWCNT/GCE.
The effect of pH on the electrochemical oxidation of 2,6-DAP was studied over a wide pH range between
3.0 and 10.0 using CV. The cyclic voltammograms were all recorded for 1.0 × 10⁻⁵ mol/L 2,6-DAP at
MWCNT/GCE. The peak potential was shifted to more negative values with increasing pH (Figure 5). Although
a higher oxidation peak current was obtained at pH 6.0, pH 7.4 was chosen as the supporting electrolyte for
biological pH in future voltammetric studies of 2,6-DAP. The potential is dependent linearly on pH over the
whole range as follows:
Ep/V = (1.1082± 0.0117)− (0.0547± 0.0017)pH (1)
The variation of Ep with pH could provide valuable information on the 2,6-DAP oxidation process. The peak
potential was observed to decrease linearly versus increasing pH with a slope of 0.054 ± 0.0017 V/pH, which
suggests that the same number of protons and electrons were involved in the oxidation process of 2,6-DAP.
(a) (b)
2 4 6 8 10 12
pH of supporting electrolyte
2 4 6 8 10 12
pH of supporting electrolyte
18
16
14
12
10
8
6
4
2
1.0
0.9
0.8
0.7
0.6
0.5
I p/µ
A
Ep/V
(v
s. A
g/A
gC
l)
Figure 5. Effect of pH on the oxidation on A) Ip and B) Ep of 1.0 × 10⁻⁵ mol/L 2,6-DAP at MWCNT/GCE (Ep /V
= (1.1082 ± 0.0117) – (0.0547 ± 0.0017) pH).
The scan rate effect on peak current and peak potential of 1.0 × 10⁻⁵ mol/L 2,6-DAP was studied over
the range of 50–225 mV/s at MWCNT/GCE in 0.1 M PBS (pH 7.4) by cyclic voltammetry. The peak current
increased linearly and followed the relationship of
330

MAVIOGLU AYAN et al./Turk J Chem
Ip/µA = (0.382 ± 0.103) + (0.9386 ± 0.0207) v1/2 /(mV/s)1/2 (R2 = 0.9961) depending on the
square root of the scan rate, which suggested diffusion control on the MWCNT/GCE surface electrode process,
as shown in Figure 6A. The peak potential also shifted linearly with the square root of the scan rate and the
curve equation was:
Ep/V = (0.6300 ± 0.0021) + (0.0064 ± 0.0002) v1/2/(mV/s)1/2 (R2 = 0.9961).
(a) (b)
0 2 4 6 8 10 12 14 16
v1/2/(mV/s)1/2
0 2 4 6 8 10 12 14 16
v1/2/(mV/s)1/2
16
14
12
10
8
6
4
2
0
0.78
0.76
0.74
0.72
0.70
0.68
0.66
0.64
0.62
I p/µ
A
Ep/V
(v
s. A
g/A
gC
l)
Figure 6. Variation of 1.0 × 10⁻⁵ mol/L 2,6-DAP oxidation A) peak current (Ip/µA = (0.382 (0.103) + (0.9386
(0.0207)v1/2 /(mV/s)1/2) and B) peak potential versus the square root of the scan rate (50–225 mV/s), Ep/V = (0.6300
(0.0021) + (0.0064 (0.0002) v1/2 /(mV/s)1/2 .
Those data also showed that an irreversible electrode reaction takes place on the MWCNT/GCE surface
(Figure 6B).
3.3. Calculation of the activation energy of 2,6-DAP on the MWCNT/GCE depending on tem-
perature
The effect of temperature on electrochemical oxidation of 2,6-DAP was studied for 1.0 × 10⁻⁵ mol/L 2,6-DAP
in the temperature range between 21 and 49 C. The peak current was increased by increasing the temperature
while the peak potential shifted to negative values (Figure 7A). This indicates that the temperature increase
causes the oxidation procedure to take place more easily on the MWCNT/GCE surface, due to the decrease in
the activation energy.
The activation energy, Ea, can be calculated as outlined by Da Silva et al., where the rate of electrode
processes can be expressed in terms of peak current (Ip) of the energy of the reactant.45
Ip = Ip exp(−Ea/RT ), (2)
where Ip is a constant, Ea is the activation energy, R is the gas constant, and T is Kelvin temperature. Da
Silva et al. demonstrated that activation energy is a function of the overpotential (η), which is related to αT
by the following the equation:46
Eηa = Ea− αTFη, (3)
where αT is the transfer coefficient at constant temperature and F is the Faraday constant.
331

MAVIOGLU AYAN et al./Turk J Chem
3.6
3.4
3.2
3.0
2.8
2.6
2.4
2.2
2.0
0.69
0.68
0.67
0.66
0.65
0.64
0.63
0.62290 300 310 320 0.0031 0.0032 0.0033 0.0034
T/K 1/T/K
(a) (b)
Ep/V
(v
s. A
g/A
gC
l)
In (
I p/µ
A)
Figure 7. A) Temperature dependence of the oxidation potentials of 2,6-DAP in pH 7.4 PBS and B) Arrhenius plot for
2,6-DAP oxidation at 0.72 V.
Ea can be calculated from ln Ip /µA = f (1/T) (Arrhenius plot) by using the following relation:
(d ln IpdT−1
)=
(−Eη
a
R
)(4)
The slope of the plot in Figure 7B is –Ea/R with a value of –3981.6 ± 227.1. Ea was found to be 33.10 ± 1.88
kJ/mol. The activation energy of 2,6-DAP oxidation on bare GCE was also determined as 45.00 ± 2.01 kJ/mol,
which was higher than that on the MWCNT/GCE. It was shown that the oxidation reaction of 2,6-DAP took
place more easily compared to that on bare GCE.
3.4. Differential pulse voltammetric determination of 2,6-DAP
Differential pulse voltammetry (DPV) was used for the quantitative determination of 2,6-DAP. The peak current
of DPV was linearly proportional to the concentration of 2,6-DAP. The DPV and calibration curves for oxidation
of 2,6-DAP in pH 7.4 PBS at MWCNT/GCE are shown in Figures 8 and 9, respectively. The peak currents
increased linearly with increasing 2,6-DAP in the concentration range from 0.4 µmol/L to 80 µ mol/L. The
linear regression equation is Ip/µA = –(1.66 ± 0.42) + (4.21 ± 0.11) [2,6-DAP]/µmol/L with R2 = 0.9982,
and the detection limit (S/N = 3) is 3 × 10⁻⁷ ± 0.015 mol/L (n = 3) (Figure 9).
3.5. Stability of the MWCNT/GCE
The long-term storage stability of the MWCNT/GCE was studied by keeping the electrode in phosphate buffer
solution (pH 7.4) at room temperature. The performance of MWCNT/GCE for the detection of 1.0 × 10⁻⁵
mol/L 2,6-DAP was tested in PBS of pH 7.4 for 1 week. Over the first 2 days, the oxidation of the 2,6-DAP
signal decreased by 1.81%, and the oxidation current response maintained 92% of the original peak current
value after 1 week. Therefore, the electrode could be used for almost 1 week without any significant error.
332

MAVIOGLU AYAN et al./Turk J Chem
60
50
40
30
20
10
0.4 0.5 0.6 0.7 0.8
E/V (vs. Ag/AgCl)
I/µ
A
h
a
40
30
20
10
0 20 40 60 80 100
[2,6-DAP]/(µmol/L)
I/µ
AFigure 8. DPVs at MWCNT/GCE in 0.1 M pH 7.40
PBS; 2,6-DAP concentrations (a–h): 4.0 × 10⁻⁷ to 8.0 ×10⁻⁶ mol/L.
Figure 9. Calibration curve for 2,6-DAP concentrations
from 0.4 µmol/L to 80 µmol/L. (Ip /µA = –(1.66 ± 0.42)
+ (4.21 ± 0.11) [2,6-DAP]/µmol/L).
4. Conclusion
The electrochemical behavior of 2,6-DAP was studied by the electroanalytical method at a glassy carbon
electrode modified with MWCNTs. A well-defined irreversible peak was obtained for oxidation of 2,6-DAP.
The oxidation of 2,6-DAP at the MWCNT/GCE is a diffusion-controlled process involving 2 protons and 2
electrons. The activation energy also was determined by using temperature dependence of peak current and
peak potential. The differential pulse voltammetric determination of 2,6-DAP was also studied. The peak
currents increased linearly with increasing 2,6-DAP in the range from 0.4 µmol/L to 80 µmol/L. The linear
regression equation was found as Ip/µA = –(1.66 ± 0.42) + (4.21 ± 0.11) [2,6-DAP]/µmol/L, R2 = 0.9982,
and the detection limit (S/N = 3) was 3.0 × 10⁻⁷ ± 0.015 mol/L (n = 3).
Acknowledgments
The authors are grateful for the careful review of the manuscript by Prof Dr Mehmet Yurekli.
References
1. Diculescu, V. C.; Piedade, J. A. P.; Maria, A.; Brett, O. Bioelectrochem. 2007, 70, 141–146.
2. Goyal, R. N.; Gupta, V. K.; Oyama, M.; Bachheti, N. Talanta 2007, 71, 1110–1117.
3. Simoni, R. E.; Gomes, L. N. L. F.; Scalco, F. B.; Oliveira, C. P. H.; Neto, F. R. A.; Oliveria, M. L. C. J. Inherit.
Metab. Dis. 2007, 30, 295–309.
4. Nayan, R.; Dey, A. K. Z. Naturforsch. 1972, 27, 688–690.
5. Yan, X.; Li, H.; Xu, Z.; Li, W. Bioelectrochem. 2009, 74, 310–314.
6. Xie, X.; Yang, K.; Sun, D. Colloid. Surface. B 2008, 67, 261–264.
7. Amri, C. E.; Maurel, M. C.; Baronc, M. H. Spectrochim. Acta Part A 2005, 61, 2049–2056.
8. Amri, C. E.; Baronc, M. H.; Maurel M. C. Spectrochim. Acta Part A 2003, 59, 2645–2654.
333

MAVIOGLU AYAN et al./Turk J Chem
9. Gill, B. D.; Indyk, H. E. Int. Dairy J. 2007, 17, 596–605.
10. Ganzera, M.; Vrabl, P.; Worle, E.; Burgstaller, W.; Stuppner, H. Anal. Biochem. 2006, 359, 132–140.
11. Yeh, C. F.; Jiang, S. J. Analyst 2002, 127, 1324–1327.
12. Liu, H.; Wang, G.; Chen, D.; Zhang, W.; Li, C.; Fang, B. Actuat. B Chem. 2008, 128, 414–421.
13. Zen, J. M.; Chang, M. R.; Ilangovan, G. Analyst 1999, 124, 679–684.
14. Zhang, R.; Wang X.; Chen, C. Electroanal. 2007, 19, 1623–1627.
15. Lu, S. Microchem. J. 2004, 77, 37–42.
16. Abdullin, T. I.; Nikitina, I. I.; Bondar, O. V. Russ. J. Electrochem. 2008, 44, 1444–1448.
17. Wang, J.; Kawde, A. N.; Musameh, M. Analyst 2003, 128, 912–916.
18. Lu, B. Y.; Li, H.; Deng, H.; Xu, Z.; Li, W. S.; Chen, H. Y. J. Electroanal. Chem. 2008, 621, 97–102.
19. Jelen, F.; Kourilova, A.; Pecinka, P.; Palecek, E. Bioelectrochem. 2004, 63, 249–252.
20. Trnkova, L.; Friml, J.; Dracka, O. Bioelectrochem. 2001, 54, 131–136.
21. Szurley, E.; Toth, A. B. Anal. Chim. Acta 1983, 154, 323–327.
22. Astwood, D.; Lippincott, T.; Deysher, M.; D’Amico, C.; Szurley, E.; Toth, A. B. J. Electroanal. Chem. 1983, 159,
295–312.
23. Yao, T.; Musha, S. Bull. Chem. Soc. Japan 1979, 52, 2307–2311.
24. Mavioglu, E. Determination of the Thermodynamic Stability Constants and Thermodynamic Parameters of Metal
Complexes of Some Purines, MSc Thesis, Ege University, 2001.
25. Aladag, N.; Trnkova, L.; Kourilova, A.; Ozsoz, M.; Jelen, F. Electroanal. 2010, 22, 1675–1681.
26. Agui, L.; Sedeno, P. Y.; Pingarron, J. M. Anal. Chim. Acta 2008, 622, 11–47.
27. Liu, G.; Riechers, S. L.; Mellen, M. C.; Lin, Y. Electrochem. Comm. 2005, 7, 1163–1169.
28. Wang, Y. R.; Hu, P.; Liang, Q. L.; Luo, G. A.; Wang, Y. M. Chin. J. Anal. Chem. 2008, 36, 1011–1016.
29. Trojanowicz, M. Trend. Anal. Chem. 2006, 25, 480–489.
30. Jo, S.; Jeong, H.; Bae, S. R.; Jeon, S. Microchem. J. 2008, 88, 1–6.
31. Wang, H. S.; Li, T. H.; Jia, W. L.; Xu, H. Y. Biosens. Bioelectron. 2006, 22, 664–669.
32. Dursun, Z.; Gelmez, B. Electroanalysis 2010, 22, 1106–1114.
33. Shahrokhian, S.; Zare-Mehrjardi, H. R. Electroanal. 2007, 19, 2234–2242.
34. Habibi, B.; Pournaghi-Azar, M. H. Electrochim. Acta 2010, 55, 5492–5498.
35. Yan, Q.; Zhao, F.; Liu, G.; Zeng, B. Electroanal. 2006, 18, 1075–1080.
36. Wu, Y.; Hu, S. Colloid. Surf. B 2005, 41, 299–304.
37. Zhang, M.; Gorski, W. J. Am. Chem. Soc. 2005, 127, 2058–2059.
38. Luque, G. L.; Ferrayra, N. F.; Rivas, G. A. Talanta 2007, 71, 1282–1287.
39. Dai, X.; Wildgoose, G. G.; Compton, R. G. Analyst 2006, 131, 1241–1247.
40. Guo, M.; Chen, J.; Li, J.; Tao, B.; Yao, S. Anal. Chim. Acta 2005, 532, 71–77.
41. Heng, L. Y.; Chou, A.; Yu, J.; Chen, Y.; Gooding, J. J. Electrochem. Comm. 2005, 7, 1457–1462.
42. Ye, Y.; Ju, H. Biosens. Bioelectron. 2005, 21, 735–741.
43. Xu, Y.; Ye, X.; Yang, L.; He, P.; Fang Y. Electroanal. 2006, 18, 1471–1478.
44. Goyal, R. N.; Kumar, A.; Mittal, A. J. Chem. Soc. Perkin Trans. 1991, 2, 1369–1375.
45. Da Silva, L. M.; De Faria, L. A.; Boodts, J. F. C. Electrochim. Acta 2003, 48, 699–709.
46. Miller, B.; Chen, A.; Electrochim. Acta 2005, 50, 2203–2212.
334