Embed Size (px)
Citation preview

Solid State Ionics 40/41 ( 1990) 255-257
North-Holland
ELECTROGRAVIMETRIC ANALYSIS - A POTENTIAL TECHNIQUE FOR STUDYING PROTON CONDUCTING HYDRATES
Suresh CHANDRA and Ajay KUMAR Physics Department, Banaras Hindu University, Varanasi 221005, India
Due to vehicular transport of species like H+, OH-, NH: etc., in some proton conductors under dc field, gases Ha, NH3 etc.
are discharged at the electrodes resulting in a change of mass. The technique of monitoring this change in mass as a function of
applied field and time has been named by us as electrogravimetric analysis (EGA). The electrodissociation kinetics can be further
studied by noting the differential change in mass; it is called differential electrogravimetric analysis (DEGA). Typical EGA and
DEGA results on ammonium paratungstate pentahydrate (APT*SH,O) are reported in this paper.
1. Introduction
Our experimental investigations on some of the solid proton conductors [ l-5 ] have shown the evo- lution of Hz, NH3, O2 etc., gases at the respective electrodes on the application of dc electric field due to the ion transport like H+, NH:, OH-, etc. The evolution of gases results in the loss of mass of the proton conducting solids which has been monitored as a function of applied dc electric field and time. This technique has been named by us as electrogra- vimetric analysis (EGA) [ 6 ] like thermogravime- tric analysis (TGA), where the change in mass is monitored as a function of temperature and time. In this paper some EGA results on APT.SH,O are dis- cussed. Apart from this, the present paper deals with the importance of studying the differential change in mass (differential electrogravimetric analysis, DEGA) as a function of applied dc field and time. The DEGA results for APT. 5Hz0 are also discussed below.
To pumping
Fig. 1. Schematic diagram showing the sample holder used in
EGA/DEGA experiments.
be such that the electrical dc bias could be applied without disturbing the balance. Metallic grid/mesh electrodes fixed to the pellet of the sample were used as the porous electrodes permitting gas evolution (if any) [ 6 1. Desiccant was kept inside the chamber of the sample holder to maintain the humidity level low.
3. Results and discussion
2. Experimental
The experimental arrangement for EGA/DEGA is shown in fig. 1. The electrical balance of Linseis TGA/DTG/DTA unit (TYP 2045) was used for EGA/DEGA experiments with a modified sample holder. The sample holder, as shown in fig. 1, has to
The EGA and the DEGA results on APT*5Hz0 are shown in fig. 2. On the application of dc electric field, a change in mass of the sample was observed in EGA. The change in mass is due to the evolution of gases H2 and NH3 at the cathode and O2 at the anode as seen by Chandra et al. [ 71 during their cou-
0167-2738/90/$03.50 0 Elsevier Science Publishers B.V. (North-Holland )
256 S. Chandra. A. Kumar /EGA for studying proton conducting hydrates
Time in hour
0 0.1 0.2 0.3 04 0 _L_----
I ,’ ?&;. 5H20
R.H.< 20%
- -0.22
z e
CURVE A EGA
- -0.3
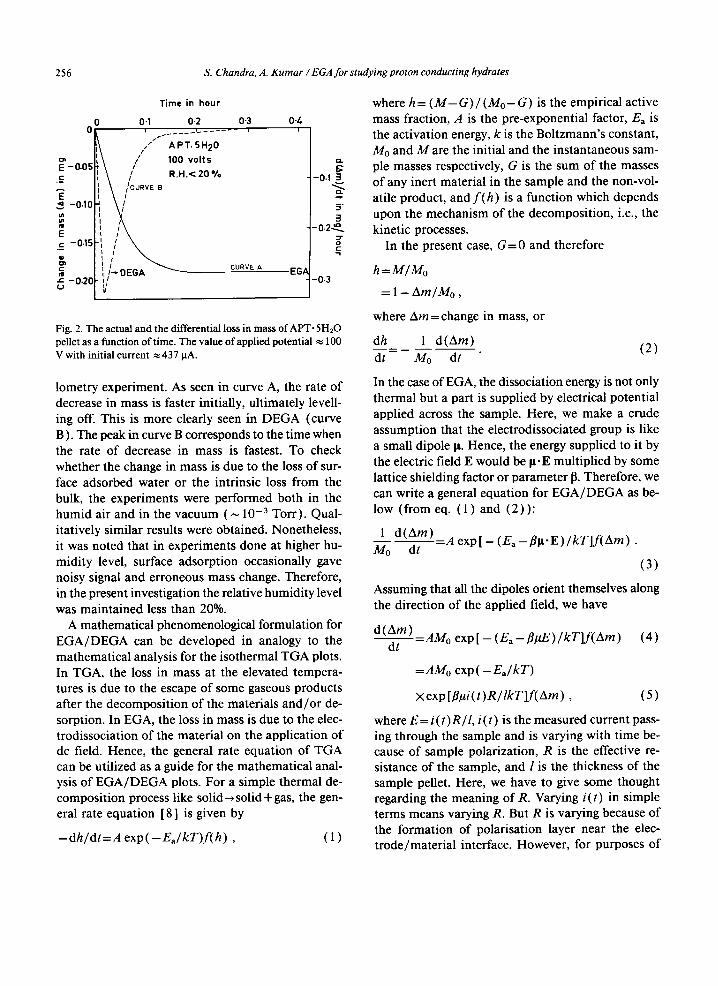
Fig. 2. The actual and the differential loss in mass of APT-5HzO
pellet as a function of time. The value of applied potential = 100
V with initial current z 437 FA.
where h= (M-G)/(M,,-G) is the empirical active mass fraction, A is the pre-exponential factor, E, is the activation energy, k is the Boltzmann’s constant, MO and A4 are the initial and the instantaneous sam- ple masses respectively, G is the sum of the masses of any inert material in the sample and the non-vol- atile product, and f( h) is a function which depends upon the mechanism of the decomposition, i.e., the kinetic processes.
In the present case, G=O and therefore
h=M/M,
=l-Am/M,,,
where Am=change in mass, or
(2)
lometry experiment. As seen in curve A, the rate of decrease in mass is faster initially, ultimately levell- ing off. This is more clearly seen in DEGA (curve B ) . The peak in curve B corresponds to the time when the rate of decrease in mass is fastest. To check whether the change in mass is due to the loss of sur- face adsorbed water or the intrinsic loss from the bulk, the experiments were performed both in the humid air and in the vacuum (N 10e3 Ton-). Qual- itatively similar results were obtained. Nonetheless, it was noted that in experiments done at higher hu- midity level, surface adsorption occasionally gave noisy signal and erroneous mass change. Therefore, in the present investigation the relative humidity level was maintained less than 20%.
A mathematical phenomenological formulation for
EGA/DEGA can be developed in analogy to the mathematical analysis for the isothermal TGA plots. In TGA, the loss in mass at the elevated tempera- tures is due to the escape of some gaseous products after the decomposition of the materials and/or de- sorption. In EGA, the loss in mass is due to the elec- trodissociation of the material on the application of dc field. Hence, the general rate equation of TGA can be utilized as a guide for the mathematical anal- ysis of EGA/DEGA plots. For a simple thermal de- composition process like solid+solid+gas, the gen- eral rate equation [ 81 is given by
-dh/dt=Aexp( -E,lkT)f(h) , (1)
In the case of EGA, the dissociation energy is not only thermal but a part is supplied by electrical potential applied across the sample. Here, we make a crude assumption that the electrodissociated group is like a small dipole p. Hence, the energy supplied to it by the electric field E would be p-E multiplied by some lattice shielding factor or parameter B. Therefore, we can write a general equation for EGA/DEGA as be- low (from eq. (1) and (2)):
--!-w=Aexp[-(E,-pp*E)/kTlf(Am). M,, dt
(3)
Assuming that all the dipoles orient themselves along the direction of the applied field, we have
d(Am) -=A& exp[ - (E, -P,uE)lkTlf(Am)
dt (4)
=A&, exp( -EJkT)
xexp[P~i(t)RllkTlf(Am) , (5)
where E = i ( t ) R / 1, i ( t ) is the measured current pass- ing through the sample and is varying with time be- cause of sample polarization, R is the effective re- sistance of the sample, and 1 is the thickness of the sample pellet. Here, we have to give some thought regarding the meaning of R. Varying i(t) in simple terms means varying R. But R is varying because of the formation of polarisation layer near the elec- trode/material interface. However, for purposes of

S. Chandra, A. Kumar /EGA for studying proton conducting hydrates 251
10
t
*-From EGA
x- From DEGA
dL___ 500 LOO 300 200 100
i(t) in PA
Fig. 3.lg[ -d(Am)/dt] versus i(t) curve.
l-
0 o-05 0.10 0.15 0.20 0.25
Time in hour
Fig. 4. Variation of lg(fi@/lkT) with time.
calculation of E in eq. (4), Rbulk as Roti.+,, vlmple is a valid assumption deep inside the bulk as polaris- ation layer is thin. So a plot between lg[ -d(Am) / dt] versus i(t) should be linear with slope jIpR/lkT.
However, we see that the plot in fig. 3 is non-linear
with varying slope. This means that the assumption R bulk z Rotigina~ sample is not valid. The resistance is:
R= 1 conductance
1 cX
number of charge carriers ’
(mobility remaining the same) .
Therefore, the results of fig. 3 indicate that the num- ber of carriers is changing with time, n(t). This may
be expected, since with time more and more disso- ciable groups have given their charge carriers and at subsequent times the value of n(t) is becoming less and less. Therefore jIp.R/lkT should increase with time as n(t) is decreasing (and hence R increasing) with time as shown in fig. 4.
Acknowledgement
The financial support from the Department of Non-Conventional Energy Sources (Government of India) is gratefully acknowledged.
References
[ 11 S. Chandra, Superionic solids - principle and application
(North-Holland, Amsterdam, 1981).
[2] S. Chandra, in: Superionic solids and solid electrolytes -
recent trends, eds. A.L. Laskar and S. Chandra (Academic
Press, New York, 1989).
[ 31 S. Chandra, Mater. Sci. Forum 1 ( 1984) 153.
[4] S. Chandra, N. Singh and S.A. Hashmi, Proc. Indian Nat.
Sci. Acad. 52 ( 1986) 338.
[ 51 S. Chandra’in: Solid state ionic devices, eds. B.V.R. Chowdari
and S. Radhakrishna (World Scientific, Singapore, 1988) p.
265.
[6] S. Chandra and A. Kumar, Mat. Res. Bull. 24 (1989) 417. [ 71 S. Chandra, SK Tolpadi and S.A. Hashmi, J. Phys.: Conden.
Matt. 1 (1989) 9101. [8] C.D. Doyle, in: Techniques and methods of polymer
evaluation, eds. P.E. Slade, Jr. and L.T. Jenkins, Vol. 1
(Marcel Dekker, New York, 1966) p. 113.


![New Techniques in Corolling Gas Hydrates [Recovered] Techniques in Corolling Gas Hydrates... · New Techniques in Controlling Gas Hydrates ... Ethane Propane ... • When hydrates](https://img.pdfslide.net/doc/110x75/5b865c467f8b9a195a8ca7ef/new-techniques-in-corolling-gas-hydrates-recovered-techniques-in-corolling-gas.jpg)