Embed Size (px)
Citation preview

Ee
MD
a
ARRAA
KESGUP
1
aestd
tpcm(fcis
0h
Journal of Chromatography A, 1280 (2013) 16– 22
Contents lists available at SciVerse ScienceDirect
Journal of Chromatography A
j our na l ho me p ag e: www.elsev ier .com/ locate /chroma
lectromembrane surrounded solid phase microextraction: A novel approach forfficient extraction from complicated matrices
aryam Rezazadeh, Yadollah Yamini ∗, Shahram Seidi, Behnam Ebrahimpourepartment of Chemistry, Tarbiat Modares University, P.O. Box 14115-175, Tehran, Iran
r t i c l e i n f o
rticle history:eceived 20 November 2012eceived in revised form 6 January 2013ccepted 7 January 2013vailable online 16 January 2013
eywords:lectromembrane extractionolid phase microextractionas chromatographyrinelasma
a b s t r a c t
In the present work, electromembrane surrounded solid phase microextraction (EM-SPME) is introducedfor the first time. The organic liquid membrane, which consists of 2-nitrophenyl octyl ether (NPOE), wasimmobilized in the pores of a hollow fiber (HF) and the basic analytes migrated in an electrical fieldfrom aqueous sample solution through the liquid membrane and into aqueous acceptor phase and thenthey were adsorbed on the solid sorbent, which acts as the cathode. Effective parameters such as com-position of organic liquid membrane, pH of donor and acceptor phases, applied voltage and extractiontime were optimized for extraction of amitriptyline (AMI) and doxepin (DOX) as model analytes andfigures of merit of the method were investigated in pure water, human plasma, and urine samples. Toextract the model analytes from 24 mL neutral sample solution across organic liquid membrane andinto aqueous acceptor phase, 120 V electrical potential was applied for 20 min and finally the drugswere adsorbed on a carbonaceous cathode. Regardless of high sample cleanup, which make the proposedmethod suitable for the analysis of drugs from complicated matrices, extraction efficiencies in the range of
−1
3.1–11.5% and good detection limits (less than 5 ng mL ) with admissible repeatability and reproducibil-ity (intra- and inter-assay precisions ranged between 4.0–8.5% and 7.5–12.2%, respectively) were obtainedfrom different extraction media. Linearity of the method was studied in the range of 2.0–500.0 ng mL−1and 5.0–500.0 ng mL−1 for AMI and DOX, respectively and coefficient of determination higher than0.9947 were achieved. Finally, the proposed method was applied for the analysis of AMI and DOX in
real samples.. Introduction
Sample preparation is still the most important challenge for thenalysis of different compounds from various complex matrices,specially biological fluids. During the last decade, new modernample preparation methods with respect to simplification, minia-urization, and minimization of the organic solvent usage have beeneveloped.
Solid phase microextraction (SPME) and liquid phase microex-raction (LPME) are miniaturized techniques; introduced for theseurposes [1,2]. SPME requires a small amount of extraction phaseoated on a solid support. Selectivity of this technique is deter-ined by composition of the extraction phase. Headspace SPME
HS-SPME) mode is a suitable method for extraction of analytesrom dirty matrices. However, only appreciably volatile compounds
ould be effectively extracted using HS-SPME. Since in directmmersion SPME (DI-SPME), the fiber is directly exposed to theample, the efficiency is increased especially for nonvolatile or∗ Corresponding author. Tel.: +98 21 82883417; fax: +98 21 88006544.E-mail address: [email protected] (Y. Yamini).
021-9673/$ – see front matter © 2013 Elsevier B.V. All rights reserved.ttp://dx.doi.org/10.1016/j.chroma.2013.01.034
© 2013 Elsevier B.V. All rights reserved.
ionizable compounds. However, the use of DI-SPME is limitedin complicated matrices due to fiber saturation, which decreasesthe fiber lifetime and extraction efficiency. Therefore, neither HS-SPME nor DI-SPME is useful for extraction of analytes from verydirty samples containing nonvolatile or high molecular interfer-ing compounds. To overcome these drawbacks, micro-solid-phaseextraction (�-SPE), involving the use of a sorbent wrapped in aporous membrane sheet, was introduced [3,4] and SPME usingHF membranes has been developed to protect the extraction fiber[5–8]. Also, combination of electrosorption and SPME (ES-SPME)was studied for extraction of charged species from water samples[9–11]. Thus, the selectivity and efficiency of DI-SPME for extrac-tion of ionic analytes could be improved by application of electricalpotential to the extraction fiber [12]. However, it still suffers fromthe problems DI-SPME faced and despite the potentials of the tech-nique to improve the extractability; it is not recommended forextraction from complicated matrices. Instead of common SPMEfibers, carbonaceous materials such as pencil lead could act as asuitable sorbent in ES-SPME due to its conductive nature, high
thermal stability, availability, and low cost [9].Hollow fiber-based liquid phase microextraction (HF-LPME) hasbeen employed as a simple sample preparation method since 1999[2]. High cleanup and preconcentration factor are some advantages

omato
otcosmah(ftboapoepwtsotctico
eptiTls
tn
Fo
M. Rezazadeh et al. / J. Chr
f HF-LPME technique. HF-LPME is an effective method for extrac-ion of compounds from complicated matrices and provides cleanhromatograms. One of the advantages of HF-LPME is eliminationf possible carry-over problems since the hollow fiber is not expen-ive and can be discarded after each extraction. The extractionechanism in HF-LPME is based on passive diffusion, which is a rel-
tively slow process, so that common extraction times of 30–50 minave been reported [13]. Therefore, electromembrane extractionEME) was introduced using an electrical field as an effective drivingorce to increase the extraction efficiency and reduce the extractionime of conventional HF-LPME [14] and some improvements haveeen made on EME so far [15–21]. The basis of EME is migrationf ionized compounds in an electrical field, from sample solutioncross supported liquid membrane (SLM) into aqueous acceptorhase. The attempts to figure out the transportation mechanismsf the ions through the organic phase in EME technique could notxplain the exact extraction mechanism, up to now. However, theermeation of a fully ionized analyte across a lipophilic membraneas studied, recently [22]. It was demonstrated that there are two
ransfer mechanisms, due to naked ions and ion-pairs. Also, resultshow that transfer via ion-pairs occurs at a rate that is close to 3rders of magnitude higher than the ionic one [22]. Since the accep-or phase is an aqueous solution and direct injection of water mayause some problems for gas chromatography (GC) instrument,here are some difficulties in coupling EME with GC. However, GCs simpler, faster, and less expensive than high performance liquidhromatography and it can easily be coupled with different typesf sensitive detectors.
Amitriptyline (AMI) and doxepin (DOX) have been used to treatndogenous depression, phobic states, panic attacks, neuropathicain states, and pediatric enuresis. Due to their relatively narrowherapeutic/toxic index, monitoring their levels in biological fluidss necessary for effective and appropriate patient treatment [23,24].o get rid of the inherent complexity of biological samples, whichimits the selectivity and sensitivity of the determinations, using
ome sample preparation techniques is needed prior to analysis.In the present work, combination of electrically enhancedhree-phase LPME and SPME is introduced for the first time as aovel and efficient method for extraction of ionizable analytes from
ig. 1. Equipment used for the EM-SPME method and mechanism of transport across liqu, aq, and f represent the organic, the aqueous and the carbonaceous fiber, respectively.
gr. A 1280 (2013) 16– 22 17
complicated matrices. A 120 V electrical field was applied to makethe model analytes migrate from sample solution through the SLMinto an aqueous phase, which was located inside the lumen ofHF. The analytes were afterward adsorbed on the solid adsorbent,which was also the cathode. Finally, the sorbent was directlyintroduced into GC-FID injection port. The analytes were desorbedand transferred into the column for separation and analysis. Theproposed method not only offers high sample cleanup, whichenables SPME technique to the analysis of ionized compound incomplex matrices, but using electrical potential as an effectivedriving force may increase the extraction efficiency.
2. Experimental
2.1. EM-SPME equipment
The equipment used for the extraction procedure is shown inFig. 1. A 24 mL vial with an internal diameter of 2.5 cm and a heightof 5.5 cm was used. The platinum electrode used in this work, withdiameters of 0.25 mm, was obtained from Pars Pelatine (Tehran,Iran). The electrodes were coupled to a power supply model 8760T3with a programmable voltage in the range of 0–600 V and witha current output in the range of 0–500 mA from Paya PajooheshPars (Tehran, Iran). During the extraction, the EM-SPME unit wasstirred with a stirring speed in the range of 0–1250 rpm by a heater-magnetic stirrer model 3001 from Heidolph (Kelheim, Germany)using a 1.5 cm × 0.3 cm magnetic bar.
2.2. Chemicals and materials
AMI and DOX were purchased from Razi Pharmaceutical Com-pany (Tehran, Iran). The chemical structure and physicochemicalproperties of the drugs are provided in Table 1. 2-Nitrophenyl octylether (NPOE), tris-(2-ethylhexyl) phosphate (TEHP), and di-(2-ethylhexyl) phosphate (DEHP) were purchased from Fluka (Buchs,
Switzerland). Dihexyl ether, 1-octanol, and octanoic acid wereobtained from Merck (Darmstadt, Germany). All the chemicals usedwere of analytical reagent grades. The porous HF used for theSLM was a PPQ3/2 polypropylene HF from Membrana (Wuppertal,id–liquid–liquid–solid boundaries. The flux of the analytes is presented by “i” and

18 M. Rezazadeh et al. / J. Chromatogr. A 1280 (2013) 16– 22
Table 1Chemical structures, pKa, log P, and therapeutic concentrations (TCs) of AMI and DOX.
Chemical structure IUPAC name Abbreviation pKaa log Pa TC (ng mL−1)a
3-(10,11-Dihydro-5H-dibenzo[a,d]cyclohepten-5-ylidene)-N,N-dimethyl-1-propanamine
AMI 9.4 4.94 100–200
3–Dibenz[b,e]oxepin-11(6H)-ylidene-N,N-dimethyl-1-propanamine
DOX 9.0 2.40 20–150
GaYd
(cp3
fUahcsetd
2
aw30ctapwa
2
mTwfa
a Ref. [26].
ermany) with inner diameter of 0.6 mm, wall thickness of 200 �mnd pore size of 0.2 �m. Ultrapure water was obtained from aoung Lin 370 series aquaMAX purification instrument (Kyounggi-o, Korea).
The HB pencil lead fibers with the diameter of 0.3 mm (OwnerSeoul, Korea)) were purchased from local market. The fibers wereonditioned by heating under N2 atmosphere from the room tem-erature to 350 ◦C by a ramp of 3 ◦C min−1, held for 120 min at50 ◦C, and then were allowed to cool to the ambient temperature.
Drug-free human plasma (blood group A+ and O+) was obtainedrom the Iranian Blood Transfusion Organization (Tehran, Iran).rine samples were collected from two persons who tookmitriptyline 25 mg, orally after 1 h and 24 h and one person whoad not consumed the drugs at all (as match matrix for plotting thealibration curves). The samples were stored at −4 ◦C, thawed, andhaken before extraction. A stock solution containing 1 mg mL−1 ofach analyte was prepared in methanol and stored at −4 ◦C pro-ected from light. Working standard solutions were prepared byilution of the stock solution in methanol.
.3. Gas chromatography conditions
Separation and detection of AMI and DOX were performed usingn Agilent 7890A gas chromatograph (Palo Alto, CA, USA) equippedith a split-splitless injector and a flame ionization detector (FID). A
0 m HP-5 Agilent fused-silica capillary column (0.32 mm i.d. and.25 �m film thickness) was applied for separation of the targetompounds. Helium (purity 99.999%) was used as the carrier gas athe constant flow rate of 0.6 mL min−1. The temperatures of injectornd detector were set at 280 and 300 ◦C, respectively. The injectionort was operated at the splitless mode. Oven temperature programas 160 ◦C for 3 min, increased to 280 ◦C with a ramp of 30 ◦C min−1,
nd held at 280 ◦C for 3 min.
.4. EM-SPME procedure
Twenty-four milliliters of the sample solution containing theodel analytes in pure water was transferred into the sample vial.
o impregnate the organic liquid membrane in the pores of the HFall, a 2.8 cm piece of the HF was cut out and dipped in the NPOE
or 5 s and then the excess of the organic solvent was gently wipedway by blowing air with a Hamilton syringe. Also, pure water
was introduced into the lumen of the HF as the acceptor phaseby a microsyringe and then the lower end of the HF was mechan-ically sealed. The pencil lead fiber (the cathode) was introducedinto the lumen of the HF. The HF containing the cathode, togetherwith the SLM and the acceptor solution, was afterward directedinto the sample solution. The platinum anode was led directlyinto the sample solution. The electrodes were subsequently cou-pled to the power supply and the extraction unit was placed ona stirrer with stirring rate of 1250 rpm. When the extraction wascompleted, the pencil lead was retracted into the SPME syringe nee-dle. The tractable nature of pencil lead facilitated its insertion intothe SPME syringe. The carbonaceous fiber was well fitted into thesyringe plunger by pushing the pencil lead with a little force. Then,the pencil lead was inserted into the GC injection port for thermaldesorption of the analytes at 280 ◦C for 2 min.
3. Results and discussion
Effective parameters should be optimized to achieve the bestextraction conditions. Variables that can affect extraction effi-ciency include composition of the supported liquid membrane(SLM), donor and acceptor phases’ compositions, extraction time,applied voltage, and stirring rate. Also, the effect of desorptiontime on the extraction signal was investigated. Desorption timewas studied in the range of 0.5–5.0 min while the desorptiontemperature was 280 ◦C. Efficiency of thermal desorption wasimproved as desorption time increased from 0.5 to 2.0 min. Thechromatographic signal slightly increased after 2.0 min, but des-orption of some interferences from the pencil lead fiber resultedin crowded chromatograms. Thus, desorption time of 2.0 min wasselected. Stirring rate could increase the kinetics and efficiencyof extraction by increasing the mass transfer and reducing thethickness of double layer around SLM. The effect of stirring rate onextractability was investigated up to 1250 rpm. A stirring rate of700 rpm was chosen due to formation of intense vortex into samplesolution and bubble formation around the HF at higher rates. Thepresence of high content of ionic substances causes an increasein the value of the ion balance (�), which is defined as the ratio of
the total ionic concentration in the sample solution to that in theacceptor solution [25], which in turn decreases the flux of analytesacross the SLM. In fact, with increasing concentration of otherions in the sample solution competition between these ions and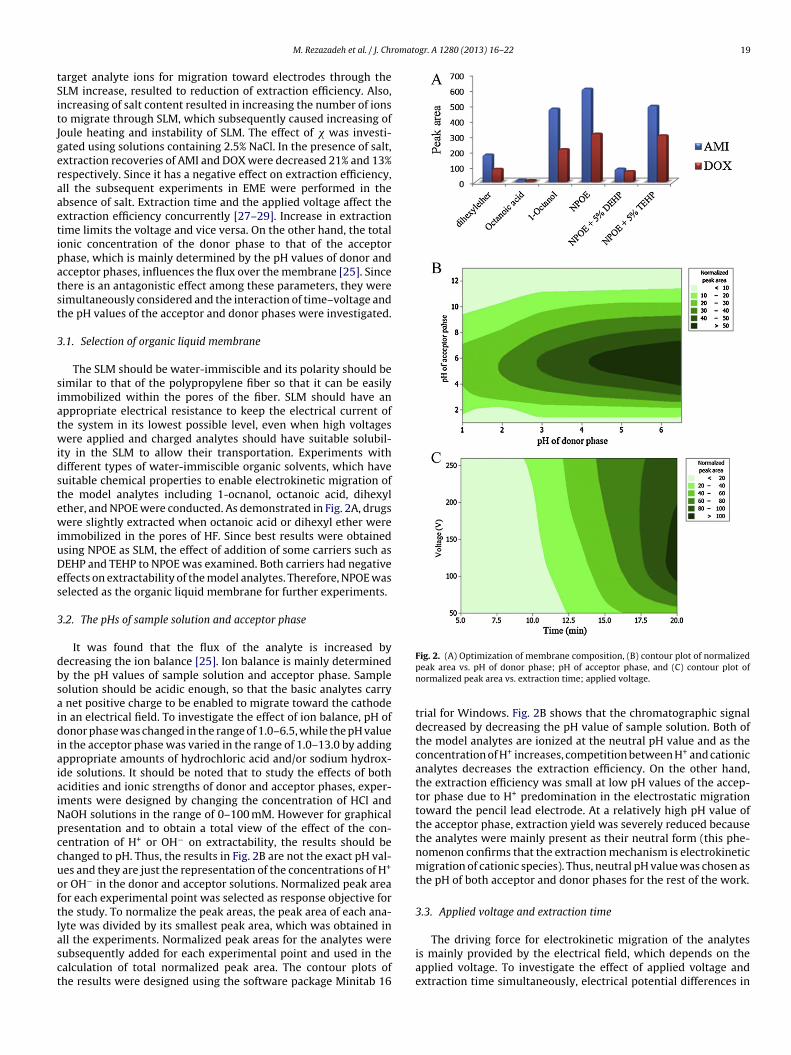
omatogr. A 1280 (2013) 16– 22 19
tSitJgeraaetipatst
3
siatwidstewiuDes
3
dbsaidiaiaiNpccuoftlasct
M. Rezazadeh et al. / J. Chr
arget analyte ions for migration toward electrodes through theLM increase, resulted to reduction of extraction efficiency. Also,ncreasing of salt content resulted in increasing the number of ionso migrate through SLM, which subsequently caused increasing ofoule heating and instability of SLM. The effect of � was investi-ated using solutions containing 2.5% NaCl. In the presence of salt,xtraction recoveries of AMI and DOX were decreased 21% and 13%espectively. Since it has a negative effect on extraction efficiency,ll the subsequent experiments in EME were performed in thebsence of salt. Extraction time and the applied voltage affect thextraction efficiency concurrently [27–29]. Increase in extractionime limits the voltage and vice versa. On the other hand, the totalonic concentration of the donor phase to that of the acceptorhase, which is mainly determined by the pH values of donor andcceptor phases, influences the flux over the membrane [25]. Sincehere is an antagonistic effect among these parameters, they wereimultaneously considered and the interaction of time–voltage andhe pH values of the acceptor and donor phases were investigated.
.1. Selection of organic liquid membrane
The SLM should be water-immiscible and its polarity should beimilar to that of the polypropylene fiber so that it can be easilymmobilized within the pores of the fiber. SLM should have anppropriate electrical resistance to keep the electrical current ofhe system in its lowest possible level, even when high voltagesere applied and charged analytes should have suitable solubil-
ty in the SLM to allow their transportation. Experiments withifferent types of water-immiscible organic solvents, which haveuitable chemical properties to enable electrokinetic migration ofhe model analytes including 1-ocnanol, octanoic acid, dihexylther, and NPOE were conducted. As demonstrated in Fig. 2A, drugsere slightly extracted when octanoic acid or dihexyl ether were
mmobilized in the pores of HF. Since best results were obtainedsing NPOE as SLM, the effect of addition of some carriers such asEHP and TEHP to NPOE was examined. Both carriers had negativeffects on extractability of the model analytes. Therefore, NPOE waselected as the organic liquid membrane for further experiments.
.2. The pHs of sample solution and acceptor phase
It was found that the flux of the analyte is increased byecreasing the ion balance [25]. Ion balance is mainly determinedy the pH values of sample solution and acceptor phase. Sampleolution should be acidic enough, so that the basic analytes carry
net positive charge to be enabled to migrate toward the cathoden an electrical field. To investigate the effect of ion balance, pH ofonor phase was changed in the range of 1.0–6.5, while the pH value
n the acceptor phase was varied in the range of 1.0–13.0 by addingppropriate amounts of hydrochloric acid and/or sodium hydrox-de solutions. It should be noted that to study the effects of bothcidities and ionic strengths of donor and acceptor phases, exper-ments were designed by changing the concentration of HCl andaOH solutions in the range of 0–100 mM. However for graphicalresentation and to obtain a total view of the effect of the con-entration of H+ or OH− on extractability, the results should behanged to pH. Thus, the results in Fig. 2B are not the exact pH val-es and they are just the representation of the concentrations of H+
r OH− in the donor and acceptor solutions. Normalized peak areaor each experimental point was selected as response objective forhe study. To normalize the peak areas, the peak area of each ana-yte was divided by its smallest peak area, which was obtained in
ll the experiments. Normalized peak areas for the analytes wereubsequently added for each experimental point and used in thealculation of total normalized peak area. The contour plots ofhe results were designed using the software package Minitab 16Fig. 2. (A) Optimization of membrane composition, (B) contour plot of normalizedpeak area vs. pH of donor phase; pH of acceptor phase, and (C) contour plot ofnormalized peak area vs. extraction time; applied voltage.
trial for Windows. Fig. 2B shows that the chromatographic signaldecreased by decreasing the pH value of sample solution. Both ofthe model analytes are ionized at the neutral pH value and as theconcentration of H+ increases, competition between H+ and cationicanalytes decreases the extraction efficiency. On the other hand,the extraction efficiency was small at low pH values of the accep-tor phase due to H+ predomination in the electrostatic migrationtoward the pencil lead electrode. At a relatively high pH value ofthe acceptor phase, extraction yield was severely reduced becausethe analytes were mainly present as their neutral form (this phe-nomenon confirms that the extraction mechanism is electrokineticmigration of cationic species). Thus, neutral pH value was chosen asthe pH of both acceptor and donor phases for the rest of the work.
3.3. Applied voltage and extraction time
The driving force for electrokinetic migration of the analytesis mainly provided by the electrical field, which depends on theapplied voltage. To investigate the effect of applied voltage andextraction time simultaneously, electrical potential differences in

20 M. Rezazadeh et al. / J. Chromatogr. A 1280 (2013) 16– 22
Table 2Figures of merit of EM-SPME-GC-FID for analysis of AMI and DOX in water, urine, and plasma samples.
Sample Analyte LOD (ng mL−1) Linearity (ng mL−1) R2 ER%
Water AMI 0.5 2.0–500 0.9947 11.5DOX 2.0 5.0–500 0.9973 4.2
Urine AMI 1.0 2.5–500 0.9986 10.4DOX 2.5 5.0–500 0.9978 4.0
t5dpmsdaltwtmttspaeF
3
thA
otoo
E
aa
TA
Plasma AMI 1.0
DOX 5.0
he range of 50–260 V were applied for extraction durations of–20 min. As demonstrated in Fig. 2C, maximum amounts of therugs were adsorbed into the pencil lead fiber when electricalotential of 120 V was applied. It is worthy to note that electrolysisay occur as a result of increasing of the electrical current of the
ystem. Since EME system has relatively high electrical resistanceue to presence of the organic solvent between the electrodes, andlso the surfaces of electrodes are very small, the current level isow by applying 120 V electrical potential. Therefore, H2 genera-ion on the surface of the cathode is negligible and no bobblesere observed during the extraction process. More increase in
he voltage results in decreasing of normalized peak area due toass transfer resistance and built-up of a boundary layer of ions at
he interfaces at both sides of SLM or saturation of the analyte inhe acceptor phase. Also, as pH slightly increased in the acceptorolution due to electrolysis, analyte back-extraction into the donorhase leads to reduction of extraction efficiency. Furthermore, a rel-tively low voltage leads to extraction protraction. Therefore, thextraction efficiency is improved by increasing the extraction time.inally, 120 V was applied for 20 min to obtain the best results.
.4. Method validation
Figures of merit of the proposed method were investigated inhree different media including pure water, human plasma, anduman urine, according to recommendations of the Food and Drugdministration (FDA).
Linearity was studied for AMI and DOX by the analysis of extractsbtained from the aliquots of each sample in triplicates. The extrac-ion recovery (ER) was defined as the percentage of the numberf moles of the analyte adsorbed into the sorbent (nf) to thoseriginally present in the sample solution (ni).
R (%) = nf × 100 (1)
niThe coefficient of variation (CV%) was determined by intra-nd inter-assays and by five- and three-replicate measurements,t three concentrations (25, 100, and 400 ng mL−1), respectively.
able 3ccuracy, precision, and relative recovery of the proposed method for determination of A
Analyte Conc. (ng mL−1) Accuracy (error %)
Intra-assay (n = 3) Inter-assay (n = 3)
Wa Ub Pc W U P
AMI 25 +0.2 +3.4 +3.1 −1.2 −0.8 +0.9
100 −0.2 +8.2 −3.0 −2.5 −4.5 +2.3
400 +1.7 −2.0 −0.1 −5.4 +6.9 −8.6
DOX 25 −6.3 −8.1 −9.5 +0.8 −1.6 +2.6
100 +6.6 −6.5 −2.7 −2.2 +6.5 +5.5
400 −1.6 −6.2 +0.6 −4.4 +10.0 −8.9
a W: Water.b U: Urine.c P: Plasma.d Relative recovery.
5.0–500 0.9977 5.910.0–500 0.9968 3.1
Accuracy was determined by triplicate analysis of samples con-taining known amounts of the analyte at three concentrations inthe range of expected concentrations. The relative recovery (RR%)and accuracy (Error%) were calculated by the following equations:
RR% = Cfound − Creal
Cadded× 100 (2)
Error% = RR% − 100 (3)
where Cfound, Creal, and Cadded are the concentrations (ng mL−1)of analyte after addition of known amount of standard into the realsample, the concentration of analyte in real sample, and the con-centration of known amount of standard which was spiked into thereal sample, respectively.
The results summarized in Table 2 show that EM-SPME couldeffectively be employed for the analysis of model drugs even fromcomplicated matrices such as biological fluids. To improve masstransfer of the analytes, human plasma and urine samples werediluted 1:3 and 1:1, respectively, with pure water and the pH valuewas adjusted to 6.5 by addition of proper amounts of hydrochlo-ric acid and/or sodium hydroxide solutions. The model drugs wereeffectively extracted with recoveries in the range of 3.1%–11.5%.The calibration plots were linear up to 500 ng mL−1 with coefficientof determination (R2) greater than 0.9947. Intra- and inter-assayprecisions ranged between 4.0–8.5% and 7.5–12.2%, respectively(Table 3). Also, calculated Error% for the analytes in the rangeof −8.9% to +10.0% for different matrices demonstrates that theproposed method offers acceptable accuracy even in complicatedmatrices such as human plasma and urine samples. The limits ofdetection (LODs) were determined by analyzing a series of spikedsamples (n = 3) with decreasing analyte concentrations and wereless than 5 ng mL−1 and the limits of quantitation were less than10 ng mL−1.
Comparison of proposed EM-SPME with other solid phase-basedmethods for extraction of AMI and DOX is provided in Table 4. One
can see that along with simple equipment, EM-SPME offers excel-lent recoveries and LODs in a relatively short time. Since the organicliquid membrane amplifies the electrical resistance of the system,it is possible to apply high voltages, which reinforce the electricalMI and DOX in pure water and drug-free urine and plasma samples.
Precision (CV%) RRd%
Intra-assay (n = 5) Inter-assay (n = 3)
W U P W U P W U P
8.5 4.2 5.3 9.6 11.0 10.0 100.2 103.4 103.16.9 5.5 4.0 8.2 8.8 10.2 99.8 108.2 97.05.2 4.3 4.3 7.5 7.9 8.1 101.7 98.0 99.9
5.5 4.4 3.9 9.5 9.9 10.7 93.7 92.4 90.55.8 6.0 5.7 11.7 12.2 9.5 106.6 93.5 97.35.1 4.4 5.5 10.9 9.0 10.4 98.4 93.8 100.6

M. Rezazadeh et al. / J. Chromatogr. A 1280 (2013) 16– 22 21
Table 4Comparison of figures of merit of EM-SPME with other analytical techniques for determination of AMI and DOX.
Analytical methoda Analyte Matrix LOD (ng mL−1) LOQb (ng mL−1) Extraction time (min) ER% CV% Reference
IT-SPME-LC-MS AMI Urine 0.08 1 30 – 2.0 [30]IT-SPME-LC-MS AMI Plasma 0.07 1 30 – 3.9 [30]dSPME-LC-MS AMI Water – 0.01 40 – 9.9 [31]SPME-GC-NPD AMI Plasma – 12.5 10 0.46 11.5 [32]SPME-GC-NPD DOX Plasma – 12.5 10 0.63 44.6 [32]HS-SPME-GC-MS AMI Hair 0.05 (ng mg−1) – 50 0.4–2.3 – [33]SPME-LC-MS AMI Plasma 0.1 50 30 2.15 14.92 [33]SPME-HPLC-UV AMI Plasma – 75 50 – <10 [34]SPME-MC-LC AMI Urine 3 5 210 – <10.1 [35]EME-SPME AMI Water 0.5 2.0 20 11.5 8.5c This workEME-SPME AMI Urine 1.0 2.5 20 10.4 4.2c This workEME-SPME AMI Plasma 1.0 5.0 20 5.9 5.3c This workEME-SPME DOX Water 2.0 5.0 20 4.2 5.5c This workEME-SPME DOX Urine 2.5 5.0 20 4.0 4.4c This workEME-SPME DOX Plasma 5.0 10.0 20 3.1 3.9c This work
a In-tube (IT), liquid chromatography (LC), mass spectrometry (MS), dual solid phase microextraction (dSPME), nitrogen–phosphorus detector (NPD), high performanceliquid chromatography (HPLC), ultraviolet detector (UV), microcolumn (MC).
b Limit of quantification.c For five-replicate measurements at 25 ng mL−1.
ine, (B
fioeanettnc
3
m
TD
Fig. 3. Chromatograms obtained after extraction of drugs from (A) human ur
eld and extraction recoveries. Also, solitude chromatograms arebtained even by extraction from biological fluids. Therefore, usingxpensive extraction and analysis methods such as in-tube SPMEnd liquid chromatography/mass spectrometry is unnecessary. Noeed for extra sample pretreatment steps is one of the most inter-sting advantages of the proposed method and it is assumed thathe electrical field contributes to break of the bonds between pro-eins and analytes [13]. Thus, EM-SPME could be introduced as aovel and simple technique for efficient extraction of analytes fromomplicated matrices.
.5. Analysis of real samples
In order to evaluate the applicability of the introduced EM-SPMEethod to the analysis of real samples, different human plasma
able 5etermination of AMI and DOX in different urine and plasma samples.
Sample Analyte Creal (ng mL−1) Cadded (ng mL
Plasma 1 AMI nda 50.0
DOX nd 50.0
Plasma 2 AMI nd 50.0
DOX nd 50.0
Urine 1 AMI 153.9 50.0
DOX nd 50.0
Urine 2 AMI nd 50.0
DOX nd 50.0
a Not detected.
) human plasma ((a) non-spiked sample, (b) spiked sample). 1; AMI, 2; DOX.
and urine samples were analyzed. All samples were prepared asexplained in the method validation section. To this end, plasma andurine samples were diluted 1:3 and 1:1, respectively, with purewater and the pH value was adjusted to 6.5 by addition of properamounts of hydrochloric acid and/or sodium hydroxide solutionsand optimal conditions were applied for quantitative analysis.Chromatograms obtained after extraction from human plasma andurine samples are shown in Fig. 3. Thereafter, to determine themethod accuracy, each sample was spiked at 50 ng mL−1 of thedrugs and EM-SPME was carried out to calculate extraction error. ByFDA’s definition, a matrix effect is the direct or indirect alteration or
interference in response due to the presence of unintended analytesor other interfering substances in the sample. Table 5 demonstratesthat results of three-replicate analyses of each sample obtainedby the proposed technique are in satisfactory agreement with the−1) Cfound (ng mL−1) RSD% (n = 3) Error%
49.3 6.0 −1.452.5 4.7 +5.0
50.8 7.6 +1.648.1 3.6 −3.8
204.6 5.5 +1.452.8 6.9 +5.6
49.1 7.3 −1.852.3 8.1 +4.6

2 omato
sr
4
tooafohvwo
R
[
[
[[[[
[[
[[[
[
[[[[
[
[[[
[[
[
2 M. Rezazadeh et al. / J. Chr
piking amounts. No significant matrix effect was observed for theeal samples studied and the method offers acceptable accuracy.
. Conclusions
An efficient electromembrane surrounded solid phase microex-raction technique was introduced for the first time. Afterptimization of effective parameters such as SLM composition, pHf the donor and acceptor phases, extraction time, and applied volt-ge, the method was employed for the analysis of model analytesrom biological fluids and satisfactory results were obtained. Usingrganic liquid membrane not only increases the selectivity, but alsoighly improves sample cleanup and make it possible to apply higholtages that increase extraction recoveries. In this paper, EM-SPMEas introduced as a simple and inexpensive method for the analysis
f nonvolatile or ionizable compound in complicated matrices.
eferences
[1] C.L. Arthur, J. Pawliszyn, Anal. Chem. 62 (1990) 2145.[2] S. Pedersen-Bjergaard, K.E. Rasmussen, Anal. Chem. 71 (1999) 2650.[3] C. Basheer, A.A. Alnedhary, B.S.M. Rao, S. Valiyaveettil, H.K. Lee, Anal. Chem. 78
(2006) 2853.[4] C. Basheer, H.G. Chong, T.M. Hii, H.K. Lee, Anal. Chem. 79 (2007) 6845.[5] F. Barahona, E. Turiel, A. Martín-Esteban, Anal. Chim. Acta 694 (2011) 83.[6] Y. Hu, Y. Wang, Y. Hu, G. Li, J. Chromatogr. A 1216 (2009) 8304.
[7] L. Meng, X. Liu, B. Wang, G. Shen, Z. Wang, M. Guo, J. Chromatogr. B 877 (2009)3645.[8] C. Basheer, H.K. Lee, J. Chromatogr. A 1047 (2004) 189.[9] D. Djozan, T. Baheri, M.H. Pournaghi-Azar, Chromatographia 65 (2007) 45.10] X. Chai, Y. He, D. Ying, J. Jia, T. Sun, J. Chromatogr. A 1165 (2007) 26.
[
[
[
gr. A 1280 (2013) 16– 22
11] J. Zeng, J. Chen, X. Song, Y. Wang, J. Ha, X. Chen, X. Wang, J. Chromatogr. A 1217(2010) 1735.
12] E.D. Conte, D.W. Miller, J. High Resolut. Chromatogr. 19 (1996) 294.13] K.E. Rasmussen, S. Pedersen-Bjergaard, Trends Anal. Chem. 23 (2004) 1.14] S. Pedersen-Bjergaard, K.E. Rasmussen, J. Chromatogr. A 1109 (2006) 183.15] N.J. Petersen, S.T. Foss, H. Jensen, S.H. Hansen, C. Skonberg, D. Snakenborg, J.P.
Kutter, S. Pedersen-Bjergaard, Anal. Chem. 83 (2011) 44.16] A. Slampová, P. Kubán, P. Bocek, J. Chromatogr. A 1234 (2012) 32.17] L.E.E. Eibak, A. Gjelstad, K.E. Rasmussen, S. Pedersen-Bjergaard, J. Pharm.
Biomed. Anal. 57 (2012) 33.18] M. Rezazadeh, Y. Yamini, S. Seidi, A. Esrafili, J. Chromatogr. A 1262 (2012) 214.19] S. Seidi, Y. Yamini, M. Rezazadeh, A. Esrafili, J. Chromatogr. A 1243 (2012) 6.20] T. Sikanen, S. Pedersen-Bjergaard, H. Jensen, R. Kostiainen, K.E. Rasmussen, T.
Kotiaho, Anal. Chim. Acta 658 (2010) 133.21] L.E.E. Eibak, A. Gjelstad, K.E. Rasmussen, S. Pedersen-Bjergaard, J. Chromatogr.
A 1217 (2010) 5050.22] M. Velicky, K.Y. Tam, R.A.W. Dryfe, Anal. Chem. 84 (2012) 2541.23] P.K. Gillman, Br. J. Pharmacol. 151 (2007) 737.24] A.F. Schatzberg, Hum. Psychopharmacol. Clin. Exp. 17 (2002) S17.25] A. Gjelstad, K.E. Rasmussen, S. Pedersen-Bjergaard, J. Chromatogr. A 1174
(2007) 104.26] A.C. Moffat, M.D. Osselton, B. Widdop, L.Y. Galichet, Clarke’s Analysis of Drugs
and Poisons in Pharmaceuticals, Body Fluids and Postmortem Material, 3rd ed.,Pharmaceutical Press, London, 2004.
27] M. Rezazadeh, Y. Yamini, S. Seidi, J. Chromatogr. B 879 (2011) 1143.28] S. Seidi, Y. Yamini, M. Rezazadeh, J. Pharm. Biomed. Anal. 56 (2011) 859.29] S. Seidi, Y. Yamini, A. Heydari, M. Moradi, A. Esrafili, M. Rezazadeh, Anal. Chim.
Acta 701 (2011) 181.30] M.M. Zheng, S.T. Wang, W.K. Hu, Y.Q. Feng, J. Chromatogr. A 1217 (2010) 7493.31] N. Unceta, M.C. Sampedro, N. Kartini Abu Bakar, A. Gómez-Caballero, M.A.
Goicolea, R.J. Barrio, J. Chromatogr. A 1217 (2010) 3392.32] S. Ulrich, J. Martens, J. Chromatogr. B 696 (1997) 217.
33] C. Alves, A.J. Santos-Neto, C. Fernandes, J.C. Rodrigues, F.M. Lanc as, J. MassSpectrom. 42 (2007) 1342.34] M.D. Cantú, D.R. Toso, C.A. Lacerda, F.M. Lanc as, E. Carrilho, M.E. Costa Queiroz,
Anal. Bioanal. Chem. 386 (2006) 256.35] K. Jinno, M. Kawazoe, M. Hayashida, Chromatographia 52 (2000) 309.