Embed Size (px)
Citation preview
ELECTRON METALLOGRAPHY OF ORDERING REACTIONS IN
TITANIUM-ALUMINIUM ALLOYS
A Thesis Submitted for the Degree
of
DOCTOR OF PHILOSOPHY
in the
UNIVERSITY OF LONDON
by
PETER JOHN ASH
Department of Metallurgy Royal School of Mines The Imperial College of Science and Technology LONDON SW7
JANUARY 1973
ABSTRACT
The titanium-aluminium phase diagram has been studied
using electron and light metallography between 22 and 50 atomic
per cent aluminium, and 1000°C to 1250°C.
Observations have been made on thep÷ec martensitic
transformation, the ordering of the phase Ti3A1 and its relation-
ship to the disordered hcp phase« and the high temperature phase p
and the precipitation of the y phase (TiA1). This latter
reaction has similarities to the fcc hcp transformation in
elemental cobalt, but in this case both product and parent phase
are ordered.
Further, some complex networks of dislocations obtained
by reverting the y phase have been studied and analysed, this
'being the first time such networks have observed in a DO19
lattice.
TABLE OF CONTENTS
CHAPTER ONE
INTRODUCTION 1
CHAPTER TWO
LITERATURE REVIEW
3
2.1 Synopsis
2.2 The Titanium-Aluminium Phase Diagram
2.3 The Crystal Structure of Ti3A1 and the Effects of Ordering
3 3
19 2.3.1. Introduction 19 2.3.2. The Structure Factor of the DO
19 Superlattice 21 2.3.3. Antiphase Boundary Contrast in Ti3A1 2.3.4. Dislocations in Ti3A1 2.3.5. Dislocation Contrast
2.4 The Crystal Structure of TiAl
2.4.1. Introduction 2.4.2. The Structure Factor of the Llo Superlattice 2.4.3. Dislocation Arrangements in TiA1
2:5 Martensites in Titanium Alloys
CHAPTER THREE EXPERIMENTAL METHOD
23 26 3o
33 33 33 35 36
41
3.1 Materials
3.2 Alloy Preparation
3.3 Heat Treatment and Specimen Preparation
3.4 Specimens for Electron Metallography
3.5 A Low Temperature Jet Polisher
3.6 Specimens for Light Microscopy
3.7 Examination of Specimens
41 41 42 43 46 48 49
CHAPTER FOUR
EXPERIMENTAL RESULTS 50
4.1 4.2 4.3 4.4 4.5 4.6 4.7 4.8 4.9
Introduction Alloys Quenched from the cc Phase Field Alloys Quenched from the ( cc+ cc2) Phase Field Alloys Quenched from the cc2 Phase Field Alloys Quenched from the f3 Phase Field Alloys Quenched from the ( cc + f3) Phase Field The Possible Peritectoid Reaction ( cc 2 + P ) oc Alloys Containing the y Phase The Peritectoid Reaction ( + y) 4x2
50 50 51 52 52 55 56 56 62
CHAPTER FIVE
DISCUSSION
5.1 Consideration of the Phase Diagram
5.1.1. The Phases Observed 5.1.2. The Peritectoid Reaction (cc2 -f.r3 5.1.3. Antiphase Boundaries in Ti3A1 5.1.4. The Ordering of Ti3A1 5.1.5. The Peritectoid Reaction (cc-Ey ) -1.cc 2
5.2 Observations on the Martensitic cx Transformation 5.2.1. Morphology and Habit Plane- 5.2.2. Twin Related Plates in Ti-Al Martensites 5.2.3. Dislocations in the Martensite 5.2.4. The 'Block' Martensite
85 85 85 85 86 88 91
91 91 94 95 95
5.3 The Precipitation of y 99
5.3.1. Introduction 99 5.3.2. The Effect of Order on the Transformation 101 5.3.3. Dislocation Dissociation in them 2 Tettice 105 5.3.4. Growth of the y Platelets Normal to the Basal
Plane
CHAPTER SIX SUGGESTIONS FOR FURTHER WORK 121
CHAPTER SEVEN
CONCLUSIONS 125
ACKNOWLEDGEMENTS
127
REFERENCES
128
107
5.4 The Networks Observed in the Reverted y Alloys 111
5.4.1. Measurement of Stacking Fault Energy 119
CHId?TER ONE
INTRODUCTION
Despite a number of attempts to elucidate the phase equilibria in titanium
aluminium alloys, considerable confusion still exists about the form of the
phase diagram up to 50 at % titanium. It has been shown (section 2.2)
that two ordered phases exist in these alloys. These are Ti3A1 (c2) which
has the D019 ordered hexagonal structure isomorphous with Mg3Cd and TiAl
(y) which has the Llo tetragonal structure isomorphous with CuAuI.
Above 8 wt % aluminium (n., 16 at %), precipitation of Ti3A1 produces a
marked deterioration in the mechanical properties, notably a drop in
ductility to such an extent that even hot working of the alloys becomes
extremely difficult. However titanium alloys with higher aluminium contents
would be advantageous on two counts. Firstly on weight saving grounds there
is a considerable advantage, the density of aluminium being only 60% that of
titanium. Secondly the price of aluminium is about one quarter to one third
that of titanium (1275 and £1000 a ton respectively).
Because of the confusion as to the exact form of the phase diagram and to
obtain information about the mechanics of the order of m2 (Ti3A1) this
study was undertaken. During the course of the investigation the trans-
formation of cc (disordered hcp) or m2 to y was found to be interesting in
that it has similarities to the allotropic transformation in cobalt
(fcc hcp). The situation in the titanium aluminium case is complicated
by the existence of the ordering, and here the crystal structure change is
hcp,-T4fct.
In deciding upon an experimental technique for this study, the following
factors had to be borne in .aind. One technique for the study of ordering
reactions is x-ray diffraction. However the high ordering temperature of
Ti Al combined with the high reactivity of the alloys would make direct
studies difficult. The study of quenched samples, would still produce a
problem in that if the mechanics of the ordering are to be examined, it is
2
not easy to distinguish between a general low degree of order, and the
existence of small ordered regions in a disordered matrix. The weakness
of superlattice reflections in x-ray studies must also be considered.
Optical metallography presents difficulties since it would be necessary
to distinguish between phases which have the same crystal symmetry
structure differing only by the existence of order in one of the phases.
Furthermore the resolution limit of the optical microscope might well
have proved to be limiting. Hence although optical metallography has
been employed in some circumstances, it was decided to study the
reactions using electron metallography. This has the added advantage
that simultaneous electron diffraction allows one to ascertain in a
qualitative way the degree of order in a given sample.
It was decided to work on alloys containing from 22 to 50 atomic %
aluminium because most investigations limit the upper aluminium content
tot-25 atomic % and it was thought that information about this relatively
little studied region would be useful in understanding the lower
aluminium alloys.
3
CHAPTER TWO
2.1 SYNOPSIS
In this chapter a review is given of the available literature on the
titanium aluminium equilibrium diagram. Whilst every effort has been
made to ensure completeness; the large volume of material available
would have made this part extremely lengthy and tedious. Hence to
a certain extent the review is selective as far as older work is
concerned, but it is hoped it is complete as regards the more recent
work. Consideration is given to the ordered phases Ti3Al and TiAl,
and the effects of order (ie antiphase boundaries, structure factor
changes and dislocation configurations). The final section briefly
considers the p (bcc) to m (hcp) transformation in titanium and its
alloys.
2.2 THE TITANIUM ALUMINIUM PHASE DIAGRAM
This diagram has been the subject of many investigations over the
last twenty years. Even so a great deal of controversy still surrounds
the titanium rich side of the system and the form of the phase diagram
has still not been conclusively established. In earlier works the
existence of the intermediate compound Ti,,,A1 has caused some confusion,
:and it has recently been pointed out that heat treatments in the (m + p)
phase field can cause marked segregation which is. subsequently difficult
to remove.
Before proceeding with a survey of the available literature on this system
it is worthwhile considering two separate and confusing effects which
have been shown to produce spurious microstructures. These are the so
called "two phase syndrome" mentioned above and the results of hydrogen
contamination of the alloys.
4
(1) The Two Phase Syndrome
It has been shown recently by Crossley1
that alloys that are annealed
or hot worked in the (0: + p) field, may undergo severe segregation which
is subsequently difficult to remove by prolonged (>100 hrs) annealing at
temperatures below 1000°C. He showed that an apparent two phase
structure, consisting of two hcp phases in a 16 at % aluminium alloy
after 1000 hrs at 600°C, was in fact single phase by examination with
polarised light microscopy. Examination of the past thermal history of
this alloy and others that also had this ghost structure showed that
they had all either been hot worked or annealed in the (« + 3) phase
field. To confirm the suspicion that this had produced segregation, a
specimen showing this effect was cold pressed 50% and reannealed just
below the «/(« + (3) transus. It was then found to be single phase.
This segregation effect is so severe and persistent that alloys in
this condition have physical and mechanical properties typical of a two
phase material, even to the extent of giving, apparently, two hcp phases
which can be distinguished by x-ray diffraction analysis.
(2) Hydrogen Contamination
It has been shown that hydrogen, either in'solution or precipitated out
as the y hydride (Tili1.75), may affect specimens examined by electron
and light microscopy.
Blackburn and Williams2 have shown that hydrogen can be introduced into
thin foils of these alloys by electropolishing unless the temperature of
the polishing solution is kept low (ie <-25°C). If this precaution is
not taken the precipitation of the hydrides on the (1011) planes may occur.
The problem is magnified if preliminary thinning is done chemically since
hydrogen may become charged into the material and then precipitate out on
final thinning. This effect may be so marked that it obscures the real
structure of the alloy.
Y+Ti A13
1800
1400 P // j / T / 1 / -/
1 1°C /
1 // i
i
// 1
1000 I
LIQUID
600
400 Ti 20 40 60
L+TiAl3
TiAI3+AI
86 AI
a a+y
5
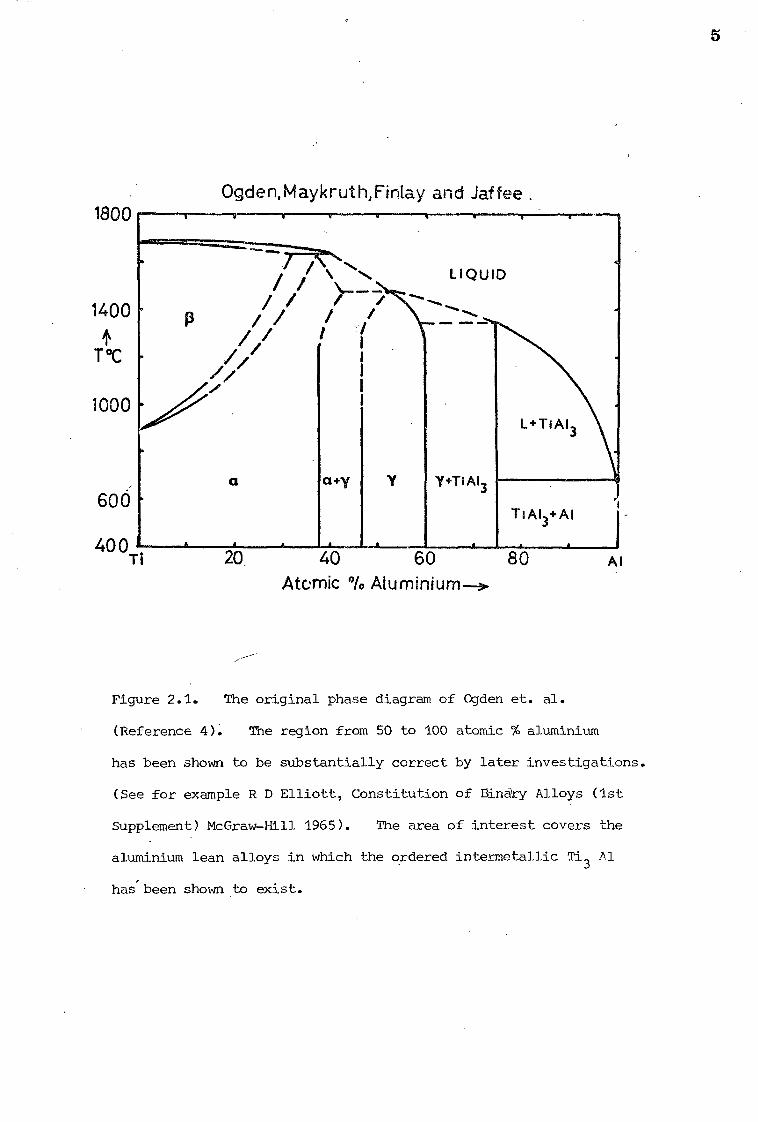
Ogden,Maykruth,Finlay and Jaffee .
Atomic 0/0 Aluminium—A.
Figure 2.1. The original phase diagram of Ogden et. al.
(Reference 4). The region from 50 to 100 atomic % aluminium
has been shown to be substantially correct by later investigations.
(See for example R D Elliott, Constitution of Eindry Alloys (1st
Supplement) McGraw-Hill 1965). The area of interest covers the
aluminium lean alloys in which the ordered intermetallic Ti3 Al
has been shown to exist.
6
Margolin3 has also shown a Ti-6 at % Al alloy containing 150ppm hydrogen
introduced by a Sieverts apparatus, showed both visible hydride
precipitation, and structures similar to martensitic transformation
products without any precipitation. The solution of hydrogen will also
cause a change in the lattic parameters of the'matrix, and hence x-ray
measurements on samples that have been chemically polished may give
anomalous results. This hydrogen charging is almost certainly3 the
cause of the striated structures reported by some workers in low aluminium
alloys (< 20 at %).
The earliest comprehensive study of the Ti-Al system was undertaken by
Ogden, Maykruth, Finaly and Jaffee4, and their diagram is shown in figure
2.1. Using micrographic and x-ray methods on alloys quenched from up to
1100°C, supplemented by thermal analysiS'and melting point determinations,
they confirmed that, as earlier preliminary investigations showed, aluminium
stabilizes the hcp low temperature allotrope of titanium. In this respect
it is somewhat unusual since the majority of elements stabilize the high
temperature bcc form. As well as the already identified compound TiA13
they observed a phase TiAl in the composition range 47.5 to 60 a %
aluminium. The solubility limit of aluminium in m-Ti was found to be
about 38 at % at 1100°C decreasing to about 35 at % at lower temperatures.
X-ray work by Duwez and Taylor5 confirmed many of the results of Ogden et al.
They identified TiAl (y) as having the CuAu or Lao structure with a = 3.97A°
and c = 4.05A°, and as being of variable composition within narrow limits.
A later study by Bumps, Kessler and Hansen6
using similar techniques but
extending the temperature range up to 1400°C broadly speaking showed the
same features. However they found that the cc solid solution forms not
from the melt but by the peritectoid reaction p+ m at 1240°C. There
. are also some minor discrepancies in the positioning of the cc/(c + y) phase
boundaries.
7
However all these workers came to the conclusion that aluminium is a
powerful os stabilizer and also that the limiting solubility of aluminium
in oc-Ti was approximately 37.5 at % at 750°C rising slightly as the
temperature increased.
For several years after the publication of these three studies, various
investigators noted an anomalous decrease in the hot workability of
cc alloys with increasing aluminium content. For example Ogden, Maykruth,
Finlay and Jaffee7
found that with greater than about 15 at % Al, alloys
became increasingly difficult to hot roll at 850°C. Since the base
materials were pure and precautions were taken to avoid the pick up of
oxygen and other interstitials in the preparation of the alloys, they
suspected that the alloys containing more than 15 at % aluminium might
be ordering, but could find no proof of this from x-ray studies. No
other explanation for this change in mechanical properties seemed
plausible however.
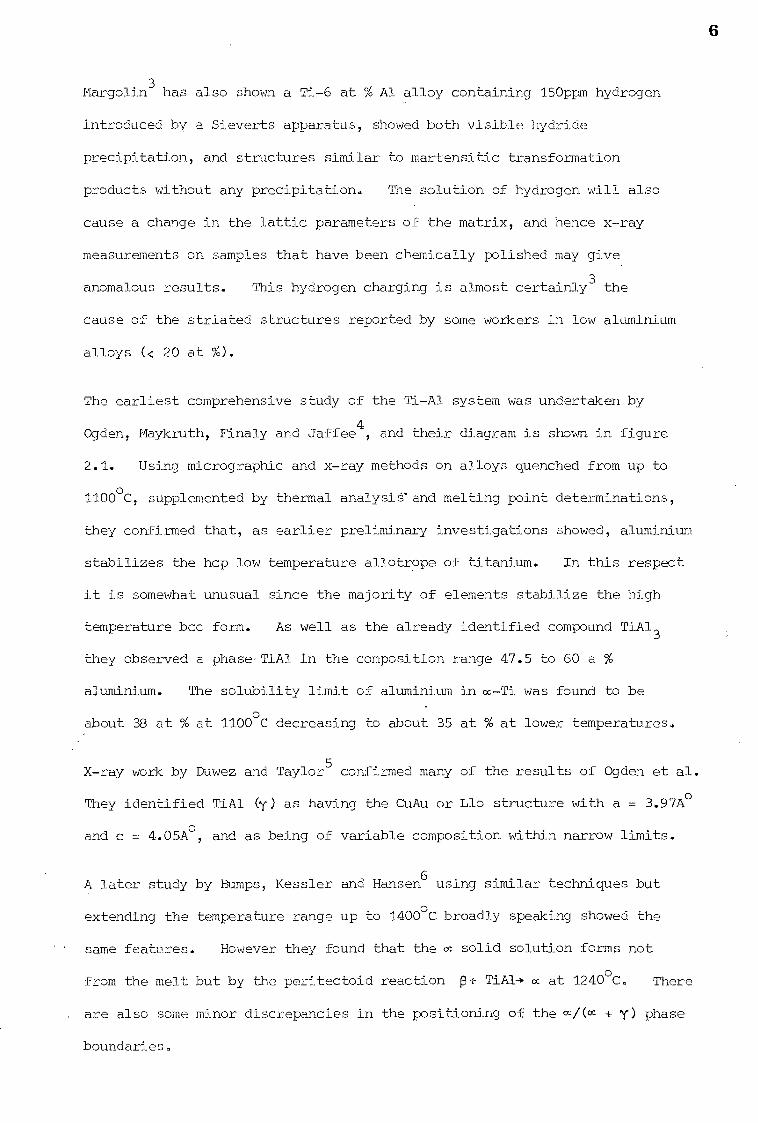
8 Following this, Sagel, Schultz and Zwicker studied alloys containing up
to 40 at % Al, using metallography, electrical resistivity, magnetic and
dilatometry methods and x-ray diffraction. On the basis of this study
they concluded that in'the extensive cc. solid solution field already defined
there were in fact two intermediate compounds m2
and e. Since the
metallographic and x-ray identification of these two phases was difficult,
they relied heavily on the more indirect methods to locate the phase fields.
Their version of the diagram is shown in Figure 2.2.
The x-ray diffraction studies showed hexagonal structure in alloys aged
under the 0:/(0c + p) transus defined by Bumps et al. In some alloys
containing 15 to 16 at % Al doubling of the cc lines occurred. Further,
additional lines were found in patterns from alloys containing 27.5 and
42.5 at %. They interpreted the results as consisting of patterns from
8
1300
1100
900
Tt
700
500
300 0 10 20 30 Atomic % Aluminium —a0.
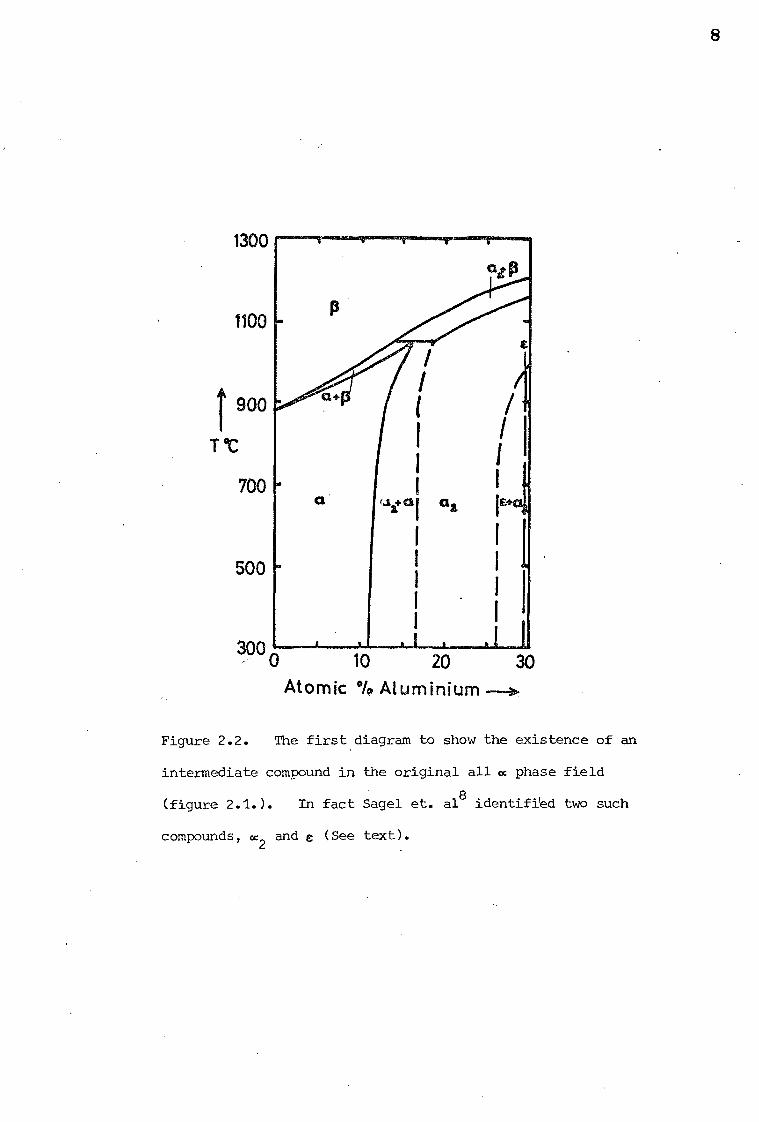
Figure 2.2. The first diagram to show the existence of an
intermediate compound in the original all cc phase field
(figure 2.1.). In fact Sagel et. alb identified two such
compounds, cc2 and e (See text).
9
two phase oc2
and e, and then indexed the two phases as both having
tetragonal symmetry.
Anderko, Sagel and. Zwicker9, however, in the following year stated that
an ordered phase based on Ti3Al had been identified in alloys containing
10 to 28.5 at % Al. This compound was found to have the ID019 structure
(ie an ordered lattice based on the cph structure with the same c
parameter as the disordered structure but twice the a parameter). No
report of the lattice parameters of this phase was given and no mention
is made in this later study of the results of the previous investigation.
Since this time many reports of at least one ordered phase in the original
m phase field have been made.
Clark and Terry10 reported an abrupt discontinuity between the ordered
and disordered state for alloys containing up to 30 at % aluminium between
650oC and 850
oC. No data on the structure was actually given but the
authors reported that the study indicated the existence of Ti3A1.
Ence and Margolin11 '12 identified a compound having a range of solubility
about Ti2Al at 1000°C to 1200°C. They published here diffraction data
for a 25% (although whether weight or atomic % was not stated) alloy
quenched. from 1000°C. They found a = 5.775A°, c = 4.638A° and c/a =
0.803 and a structure isomorphous with Mg3Cd (D019). The authors also
reported the existence of another phase in alloys leaner in aluminium;
later work on this has been reported and is considered below. It is
thought however that the Ti2Al phase they identify here is in fact based
on Ti3Al and in a later paper Margolin
3 concurred with this.
Schroeder13 using neutron diffraction identified Ti Al in the system and
obtained interplanar spacings very close to the proposed Ti2Al phase
parameters as reported by Enc and Margolin11 . He also observed that
all but one of the unidentified lines in the lower aluminium content
alloys (which Ence and Margolin attributed to a second unidentified phase)
10
could be explained in terms of stacking faults in the powdered alloy
samples used.
Goldak and Parr14 also pointed out that the observed intensities
reported by Ence and Margolin11 for their 25% aluminium alloy do not
fit the calculated line intensities for a DO19 structure. In this
paper they reported that well annealed powder samples of a 25 at %
alloy showed superlattice lines below 600°C, and that the intensities
of the observed lines compared extremely well with calculated values for
the DO19
structure.
Another phase which has been reported by Kornilov et al15 is the phase
Ti6A1. However one of the authors (I.I. Kornilov) has since discounted
the existence of this phase16
which was 'detected by Hall coefficient,
resistivity and hardness measurements, and agreed that the results can
be explained as due to crossing of the 4, Ti3A1) transus. This phase
will not therefore be considered further.
In recent years, post 1960, the concensus of opinion has been that only
- — one ordered phase ie Ti3Al exists in the original cc solid solution field
4 proposed by Ogden et at . The only recent study of this system to
include any other compound is that due to the second investigation by Ence
12 and Margolin . They claimed here to have detected two phases; y based
on Ti3Al and based on Ti
2Al.
Tsujimoto and Adachi17 in a recent paper comment on the evidence as
follows. Ence and Margolin claimed that the y and S phases could be
detected by a difference in the optical acitivity of the two phases.
• Tsujimoto and Adachi however show that this apparent change is in fact due
to an etching effect and that lightly polished specimens showed no such
change. Further Ence and Margolin stated that in the two phase oc +y
11
field an equiaxed grain structure was seen, the individual grains being
either all m or all y. These two phases they claimed could be distinguished
by hardness measurements, but Tsujimoto and Adachi demonstrated that such
measurements even within one grain show a marked scatter, and thus the
results are therefore suspect. The original authors themselves commented
on the fact that the (o + y) phase field they proposed did not show
typical two phase behaviour.
Finally one of the authors (Margolin)3 having made a careful x-ray study
of alloys in the y region found that they have an0C-Ti structure and
evidence of Ti3Al superlattice lines was found. Accordingly it was
concluded that no such y phase existed and that the 8 phase must have the
DO19
structure based upon Ti3Al.
The present controversy is now centred about the mode of formation of
Ti3A1 (now designated m2), its critical ordering temperature and the extent
of the m2
phase field. In the concluding section of this review it is
intended to survey the more recent investigations of this system to
demonstrate these uncertainties. The actual structure of the Ti,A1 phase
will be considered separately in section 2.3.
Some recent investigations of the phase equilibria favour a peritectoid
17-20 reaction (m
2 + p)--, whereas other authors find a "closed loop"
region of m2 with the 3 phase transforming first to m 21-27. Examples
of these two differing views are shown in figures 2.3 and 2.4.
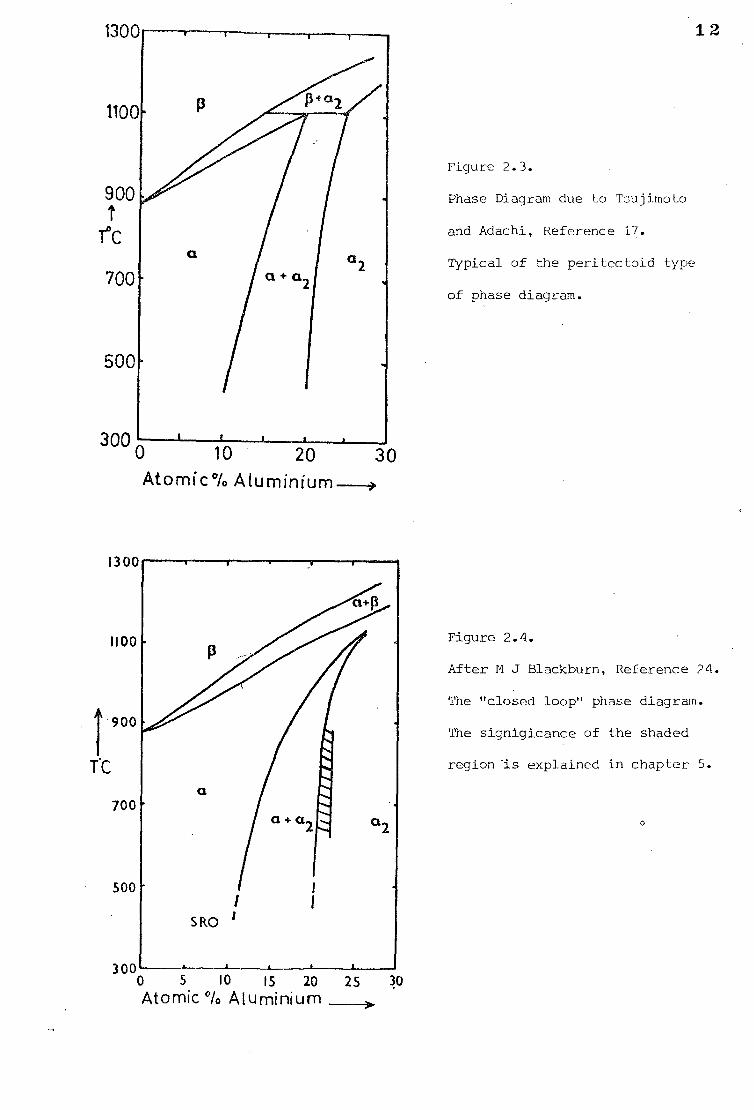
The investigations of Tsujimoto and Adachi,17'18 Sato and Huang,19 and
Clark, Jepson and Lewis20 favour a peritectoid form of the diagram. These
diagrams are shown in figures 2.3, 2.5 and 2.6.
In the case of the m/(« + p) transus ( and the (m + (3)/p transus)). OVL3
Ifidependent investigations show good agreement in the results obtained.
300 0 10 20 30 Atomic Vo
12
Figure 2.3.
Phase Diagram due to Tsujimoto
and Adachi, Reference 17.
Typical of the peritectoid type
of phase diagram.
1300
1100
500
300 0 5 10 15 20 25 30 Atomic 0/0 Aluminium
Figure 2.4.
After M J Blackburn, Reference 24.
The "closed loop" phase diagram.
The signigicance of the shaded
region -is explained in chapter 5.
0
1 900
TC
700
1500 L+6
1300 p
1100
T
900
a 700
5000
a + a 2
1
a2
10
20 30
40 50 Atomic °to Aluminium
+8
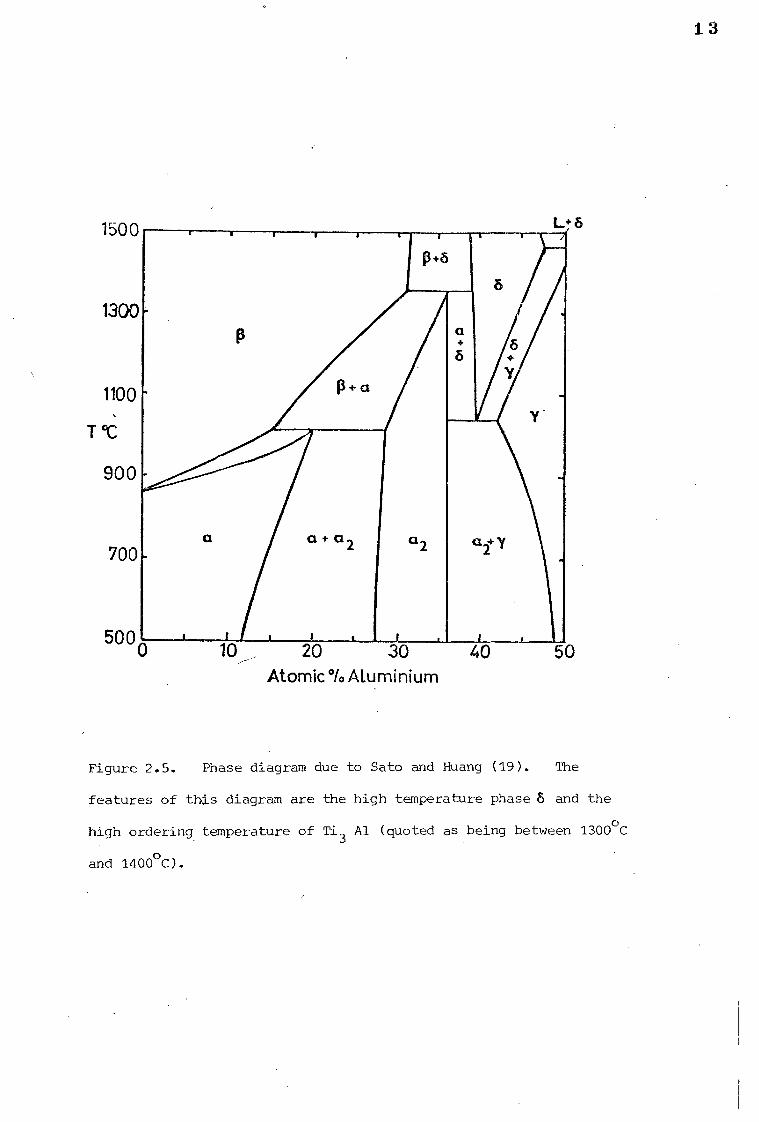
Figure 2.5. Phase diagram due to Sato and Huang (19). The
features of this diagram are the high temperature phase 8 and the
high ordering temperature of Ti3 Al (quoted as being between 1300°C
and 1400°C).
I3
14
However in the case of «2 stability a range of differences is found. It
would seem however that the discrepancies are due to the difficulties in
following the ordering reaction both by light microscopy and using
other physical methods. It would appear that the Ti3A1 phase has a
relatively high critical temperature of the order of 1000°C at 25
at % aluminium.
Tsujimoto and Adachi17 '18 studied alloys containing 14.6, 16.5 and 19.4
at % aluminium by light and electron microscopy and hardness measurements.
No electron microscopical evidence is reported and the results quoted are
mainly light microscopy results. In the case of the 164at % alloy they
state that a structure seen after annealing at 1100°C and then quenching
"may possibly" indicate a peritectoid. The «/(m «2) transus was
taken from the work of Clark, Jepson and Lewis20 and the «/(« + p) transus
from the same source. It should be noted that they used a stepwise
cooling routine which could give rise to the two phase syndrome effect.
The same authors have also studied the Ti-Al-Co28 system where they say
that the binary work is confirmed. However the nature of Co as a p
stabilizing element is well documented29
and hence relatively small
additions may well depress the m/(« + (3) transus sufficiently for the «2
phase then to interact with the p-phase'producing the observed peritectoid,
even if no such interaction occurs in the binary system.
Sato and Huang19
studied alloys containing up to 70 at % aluminium using
electrical resistivity, x-ray measurements and light microscopy. In the
region from 0 to 50 at % aluminium they found «, Ti2A1, p and y together
with a 5th phase which they designate 8 (not to be confused with Ti2A1).
A diagram from their work is shown in figure 2.5. They state that the
8 phase is easily retained on quenching but no other study of the system
has found any such phase. Further although the phase could be retained
thus, they do not give any information about its structure. Another
1 5
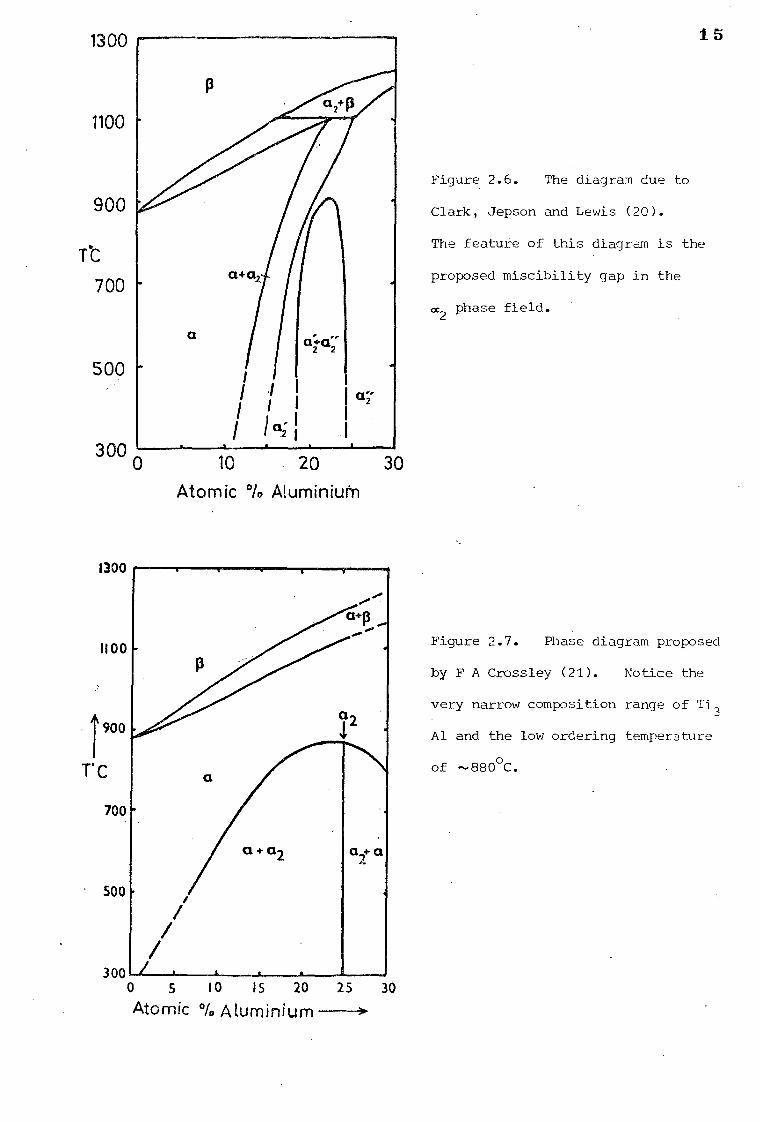
Figure 2.6. The diagram due to
Clark, Jepson and Lewis (20).
The feature of this diagram is the
proposed miscibility gap in the
oc2 phase field.
Atomic Vo Aluminium
1300
1100
1 900
T'C
Figure 2.7. Phase diagram proposed
by F A Crossley (21). Notice the
very narrow composition range of Ti3
Al and the low ordering temperature
of --880oC.
700
• 500
// 300
0 5 Atomic
t
10 15 20 25 30 A tuminium--).
a
a + a2 a2+ a
16
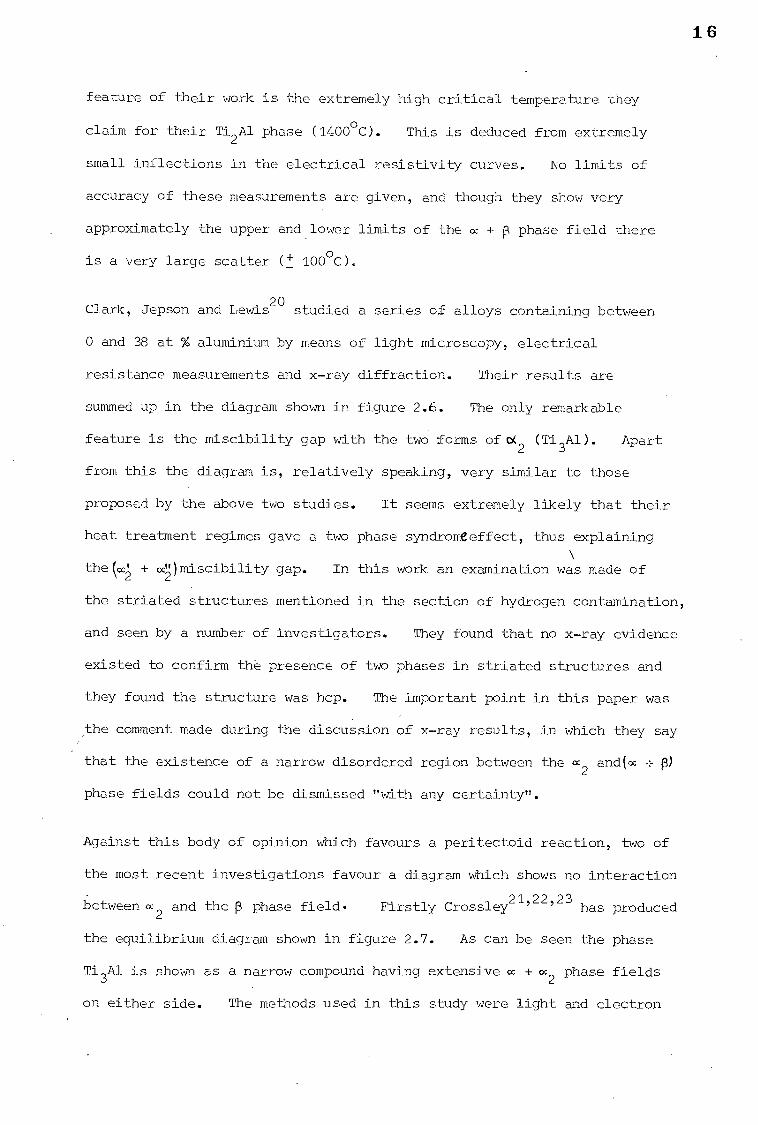
feature of their work is the extremely high critical temperature they
claim for their Ti2Al phase (1400°C). This is deduced from extremely
small inflections in the electrical resistivity curves. No limits of
accuracy of these measurements are given, and though they show very
approximately the upper and lower limits of the « + p phase field there
is a very large scatter ("4- 100°C).
Clark, Jepson and Lewis20 studied a series of alloys containing between
0 and 38 at % aluminium by means of light microscopy, electrical
resistance measurements and x-ray diffraction. Their results are
summed up in the diagram shown in figure 2.6. The only remarkable
feature is the miscibility gap with the two forms of o(2 (Ti3Al). Apart
from this the diagram is, relatively speaking, very similar to those
proposed by the above two studies. It seems extremely likely that their
heat treatment regimes gave a two phase syndromeeffect, thus explaining
the(m + (Vmiscibility gap. In this work an examination was made of
the striated structures mentioned in the section of hydrogen contamination,
and seen by a number of investigators. They found that no x-ray evidence
existed to confirm the presence of two phases in striated structures and
they found the structure was hcp. The important point in this paper was
the comment made during the discussion of x-ray results, in which they say
that the existence of a narrow disordered region between the m2
and(m + p)
phase fields could not be dismissed "with any certainty".
Against this body of opinion which favours a peritectoid reaction, two of
the most recent investigations favour a diagram which shows no interaction
between m2
and the f3 phase field. Firstly Crossley21,22,23 has produced
the equilibrium diagram shown in figure 2.7. As can be seen the phase
Ti3A1 is shown as a narrow compound having extensive m + m2
phase fields
on either side. The methods used in this study were light and electron
17
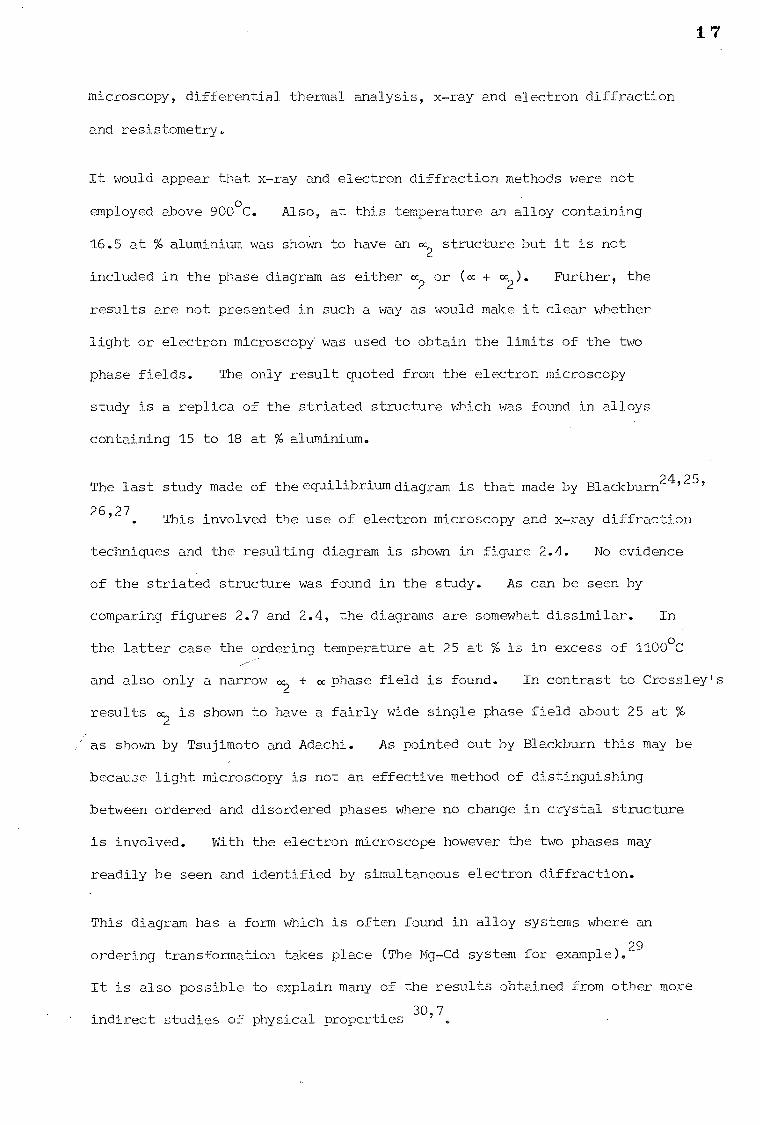
microscopy, differential thermal analysis, x-ray and electron diffraction
and resistometry.
It would appear that x-ray and electron diffraction methods were not
employed above 900°C. Also, at this temperature an alloy containing
16.5 at % aluminium was shown to have an a2 structure but it is not
included in the phase diagram as either m2 or (m + 2). Further, the
results are not presented in such a way as would make it clear whether
light or electron microscopy' was used to obtain the limits of the two
phase fields. The only result quoted from the electron microscopy
study is a replica of the striated structure which was found in alloys
containing 15 to 18 at % aluminium.
The last study made of the equilibrium diagram is that made by Blackburn24'25'
26,27 This involved the use of electron microscopy and x-ray diffraction
techniques and the resulting diagram is shown in figure 2.4. No evidence
of the striated structure was found in the study. As can be seen by
comparing figures 2.7 and 2.4, the diagrams are somewhat dissimilar. In
the latter case the ordering temperature at 25 at % is in excess of 1100°C
and also only a narrow a.2 + a phase field is found. In contrast to Crossley's
results a2 is shown to have a fairly wide single phase field about 25 at %
as shown by Tsujimoto and Adachi. As pointed out by Blackburn this may be
because light microscopy is not an effective method of distinguishing
between ordered and disordered phases where no change in crystal structure
is involved. With the electron microscope however the two phases may
readily be seen and identified by simultaneous electron diffraction.
This diagram has a form which is often found in alloy systems where an
ordering transformation takes place (The Mg-Cd system for example).29
It is also possible to explain many of the results obtained from other more
indirect studies of physical properties 30,7
18
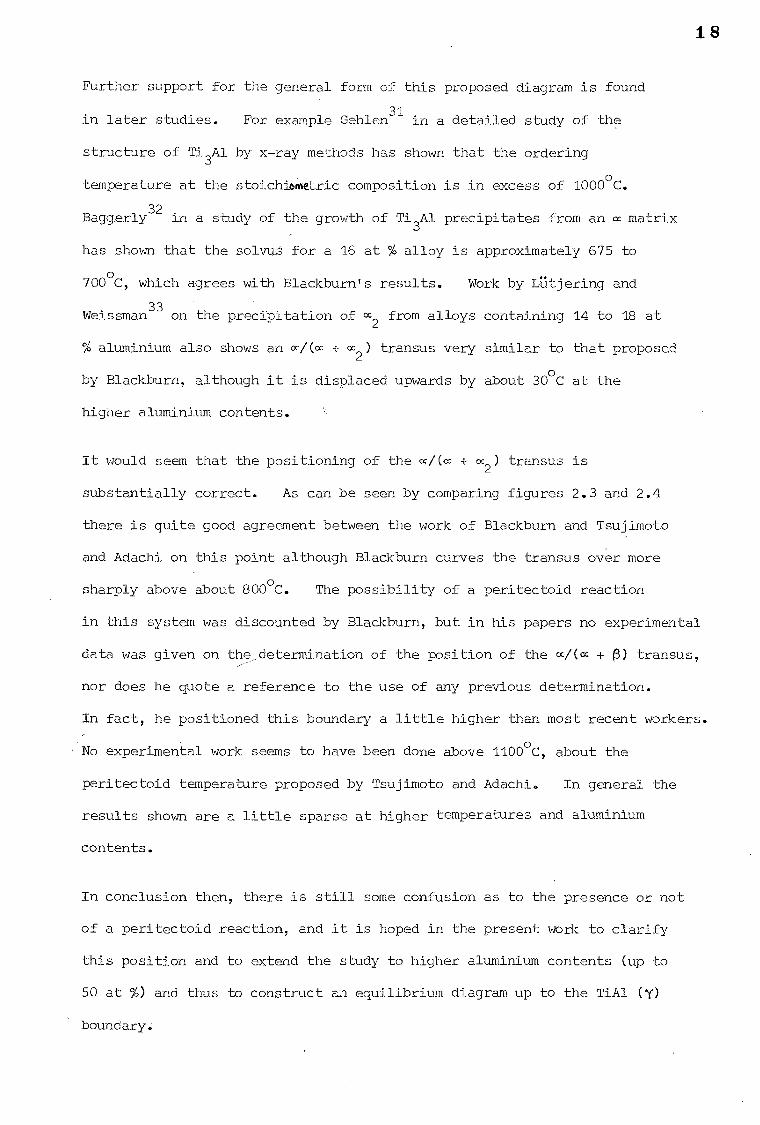
Further support for the general form of this proposed diagram is found
in later studies. For example Gehlen31
in a detailed study of the
structure of Ti3Al by x-ray methods has shown that the ordering
temperature at the stoichi6m'etric composition is in excess of 1000°C.
Baggerly32 in a study of the growth of Ti
3Al precipitates from an m matrix
has shown that the solvu>S for a 16 at % alloy is approximately 675 to
700°C, which agrees with Blackburn's results. Work by Lajering and
Weissman33
on the precipitation of m2 from alloys containing 14 to 18 at
% aluminium also shows an m/(m + m2) transus very similar to that proposed
by Blackburn, although it is displaced upwards by about 30°C at the
higher aluminium contents.
It would seem that the positioning of the m/(m + m2) transus is
substantially correct. As can be seen by comparing figures 2.3 and 2.4
there is quite good agreement between the work of Blackburn and Tsujimoto
and Adachi on this point although Blackburn curves the transus over more
sharply above about 800°C. The possibility of a peritectoid reaction
in this system was discounted by Blackburn, but in his papers no experimental
data was given on the, determination of the position of the m/(m + p) transus,
nor does he quote a reference to the use of any previous determination.
In fact, he positioned this boundary a little higher than most recent workers.
• No experimental work seems to have been done above 1100°C, about the
peritectoid temperature proposed by Tsujimoto and Adachi. In general the
results shown are a little sparse at higher temperatures and aluminium
contents.
In conclusion then, there is still some confusion as to the presence or not
of a peritectoid reaction, and it is hoped in the present work to clarify
this position and to extend the study to higher aluminium contents (up to
50 at %) and thus to construct an equilibrium diagram up to the TiAl (y)
boundary.
19
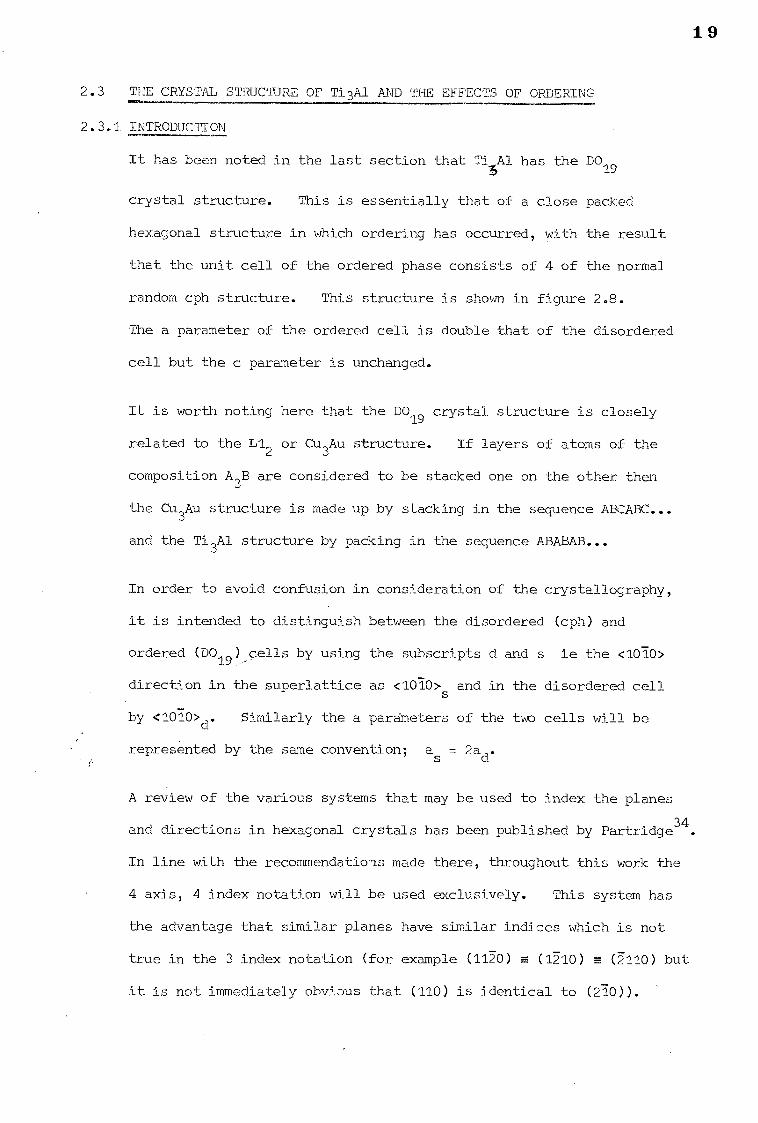
2.3 THE CRYSTAL STRUCTURE OF Ti3A1 AND THE EFFECTS OF ORDERING
2.3.1 INTRODUCTION
It has been noted in the last section that Ti Al has the DO19
crystal structure. This is essentially that of a close packed
hexagonal structure in which ordering has occurred, with the result
that the unit cell of the ordered phase consists of 4 of the normal
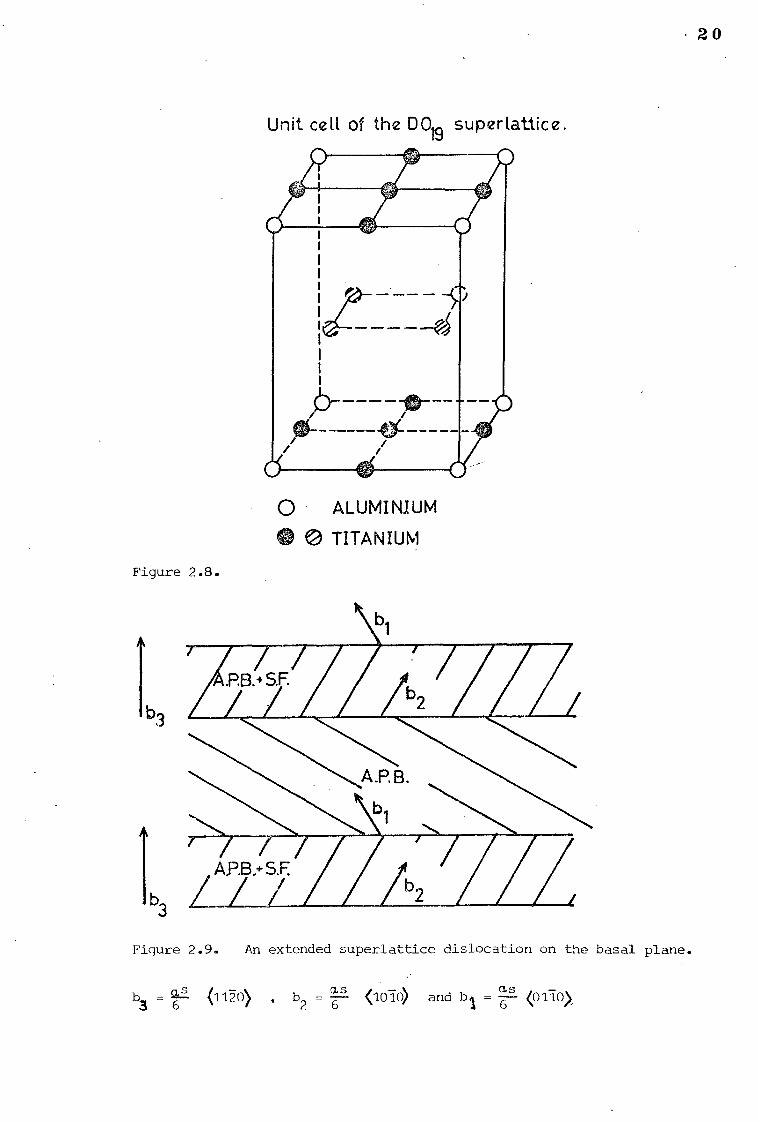
random cph structure. This structure is shown in figure 2.8.
The a parameter of the ordered cell is double that of the disordered
cell but the c parameter is unchanged.
It is worth noting here that the DO19 crystal structure is closely
related to the L12 or Cu
3Au structure. If layers of atoms of the
composition A3B are considered to be stacked one on the other then
the Cu3Au structure is made up by stacking in the sequence ABCABC...
and the Ti3Al structure by packing in the sequence ABABAB...
In order to avoid confusion in consideration of the crystallography,
it is intended to distinguish between the disordered (cph) and
ordered (DO ) cells by using the subscripts d and s ie the <1010> 19:-
direction in the superiattice as <1070>s
and in the disordered cell
by <1010>d. Similarly the a parameters of the two cells will be
represented by the same convention; as = 2a
d.
A review of the various systems that may be used to index the planes
and directions in hexagonal crystals has been published by Partridge34.
In line with the recommendations made there, throughout this work the
4 axis, 4 index notation will be used exclusively. This system has
the advantage that similar planes have similar indices which is not
true in the 3 index notation (for example (1170) E (1210) E (7110) but
it is not immediately obvious that (110) is identical to (270)).
20
Unit cell of the D019 superlattice.
0 ALUMINIUM
0 TITANIUM
Figure 2.8.
3
Figure 2.9. An extended superlattice dislocation on the basal plane.
b = Ck-- (1170) , b = (10-170 and b1 - (Is (0110> 3 6 2 6 1 - -6— ,
21
Also since rational planes do not have rational directions normal
to them, (except in the case of (0001) and 11-Aci0 planes) the
normals to the planes are described in terms of the indices of the
plane.
The indiCes of planes and directions in either cell can easily be
transformed one to the other if it is remembered that for planes
1hkilld
equals 12h 2k. 2i'1 s and that for directions <hkil>
d
Consider for example the (1071)d plane and the [011d direction.
The (10-71)d
plane makes intercepts ad'oo'd' c on the 4 axis. When
the cell orders, these now become iass' . c. Taking reciprocals
in the'conventional way gives the plane (201)s. One represents a
direction as a vector passing through the origin and the lattice
point hkil. The Liolqj d direction then, on ordering will become
E10121
s, o 1
s, c, which simplifies to give 11.012,1
s.
2.3.2 THE STRUCTURE FACTOR OF THE D019 SUPERLATTICE
The structure factor of the DO19
superlattice with perfect long
range order is stated by Marcinkowski35
to be complicated and not
expressable in any simple analytical form. However this is not
the case and an equation is derived below.
The atom positions are:
Al : ClOp; 1/31 2/3,1/2.
Ti : 1/41o; ov2p; 1/21/2p; and 1/3 11/61 1/2", 5/6 11/6)1/2; 5/61 2/3;1/2.
31 (Gehlen has shown that in this structure the atom positions are not
exactly those of the DO19 structure, but that the titanium atoms are
displaced by a very minute amount, so that they in fact bind together
into tetrahedra. This would appear to indicate the presence of a
covalent factor in the bonds between atoms and this is seemingly
confirmed by the work of Collinge and Ho30
who find that the effective
22
number of free electrons drops rapidly on ordering of the lattice.
However these displacements are very small, and do not affect the
resulting structure factor calculations, unless the intensity of a
high angle line is required accurately).
The structure factor may then be written:
F = SOA,1 + exp 27-i(h/3 + 2k/3 .1- f/2)]
+ SOTi exp Tik + exp Tah + exp Ti (h+k)
+ exp 2 Ti (5h/6+ k/6 + 1/2) + exp 2 Ti (h/3 + k/6 + 4/2)
+ exp 2 Ti (5h/61-41.k/6 + 1/2)1
This may be rewritten (equation 1).
F = J
1-1 + exp 2Ti(h+2k + 101 3 7
+ + + exp 2Ti(h+2k - 11 eTi --77 (exp Tih + exp Tik + expni(h+k))]
and hence (equation 2).
F = [1 + exp 2Ti(h+2k + LT .S0Al +1OTi (exp rah + exp ilk + exp Ti (h+k)1 3 2
It can now be seen that the term in the first bracket is the structure
factor for the normal disordered close packed hexagonal cell. Thus
the conditions for a cph structure must be satisfied for a given
reflection to occur. The effect of ordering is to impose additional
restrictions on the allowed reflections as shown in the second bracket.
However it should be realised that the unit cell used here is the
unit cell of the superlattice, and further that the second bracket
does not give any condition whereby complete extinction could occur.
If equation 2 is split into two parts ie
(1) [1 + exp (h+2k + 1)1 = T
3 2
and (2 )[e Al + Se Ti exp ih + exp ik + exp i (h+k))1 =
then the conditions for a given reflection to be seen, and its intensity,
may readily be calculated. Taking * first it will be seen that the
23
condition both h and k are even gives the result
* = 00 A1 ) Any other combination of h and k gives the result
* = eAl SeTi )
Considering now(, and letting h+2k + t be equal to g, it may be 3 2
seen that
+ eig) (1 + er27ig))
=V (2 + 2cos1.(7g))
=i (2 + 2(2cos1 919 - 1))
=V (4 cos2̀.icg)
:. 61 =.1 {4 cos2tit(h+2k + 3 5,
The possible conditions are then summarised in table 2.4.
It can readily seen that on disordering, the structure factor reverts
to 4 times the structure factor for a close packed hexagonal cell
since cc2 has 8 atoms per unit cell whereas a normal cph cell has
2.- Further, fundamental lines are relatively strong, but the
superlattice lines are extremely weak in comparison, being the
difference between two scattering factors.
:2.3.3 ANTIPHASE BOUNDARY CONTRAST IN Ti3A1
Marcinkowski35
has given a detailed account of the contrast mechanism
whereby an antiphase boundary (APB) may be revealed by transmission
electron microscopy, and it is not therefore proposed to go into any
great depth here.
In.this structure, two types of APB may occur. These are antiphase
boundaries of the type as <1120> and as <1010>. The first of these 6 —6-
two is a perfect lattice vector in the disordered cell. It may then
be said to characterise only an antiphase boundary. The second type
(3)
24
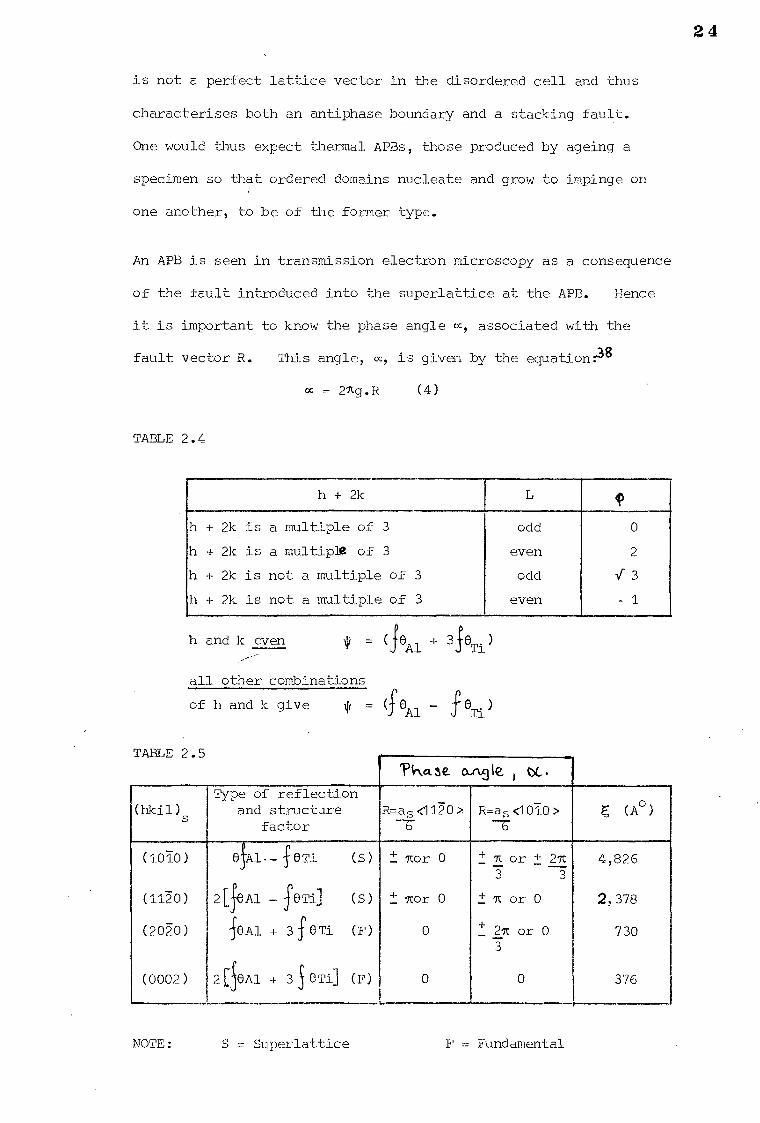
is not a perfect lattice vector in the disordered cell and thus
characterises both an antiphase boundary and a stacking fault.
One would thus expect thermal APBs, those produced by ageing a
specimen so that ordered domains nucleate and grow to impinge on
one another, to be of the former type.
An APB is seen in transmission electron microscopy as a consequence
of the fault introduced into the superlattice at the APB. Hence
it is important to know the phase angle m, associated with the
fault vector R. This angle, cc, is given by the equation 38
cc = 27g.R (4)
TABLE 2.4
h + 2k L
h + 2k is a multiple of 3 odd 0
h + 2k is a multiple of 3 even 2
h + 2k is not a multiple of 3 odd i 3
h + 2k is not a multiple of 3 even - 1
h and k even = 3Se ) Ti
all other combinations ,
of h and k give c = °Ai erri
TABLE 2.5
Phase a% &e. tC•
(hkil)s
Type of reflection and structure
factor R=as <1120 > 6
R=as <1010 > —6
(A0)
(1010) elAl— feTi (S) _ Aor 0 4- A or 1- 27t 4,826 3 3
(1120) 2[ eAl - feTi] (S) Aor 0 ± A or 0 2,378
(2020) i'6A1 + 3feTi (F) 0 2A or 0 _ 730 3-
(0002) 2[ 6A1 + 3 ieTi] (F) 0 0 376
NOTE: S = Superlattice F = Fundamental
25
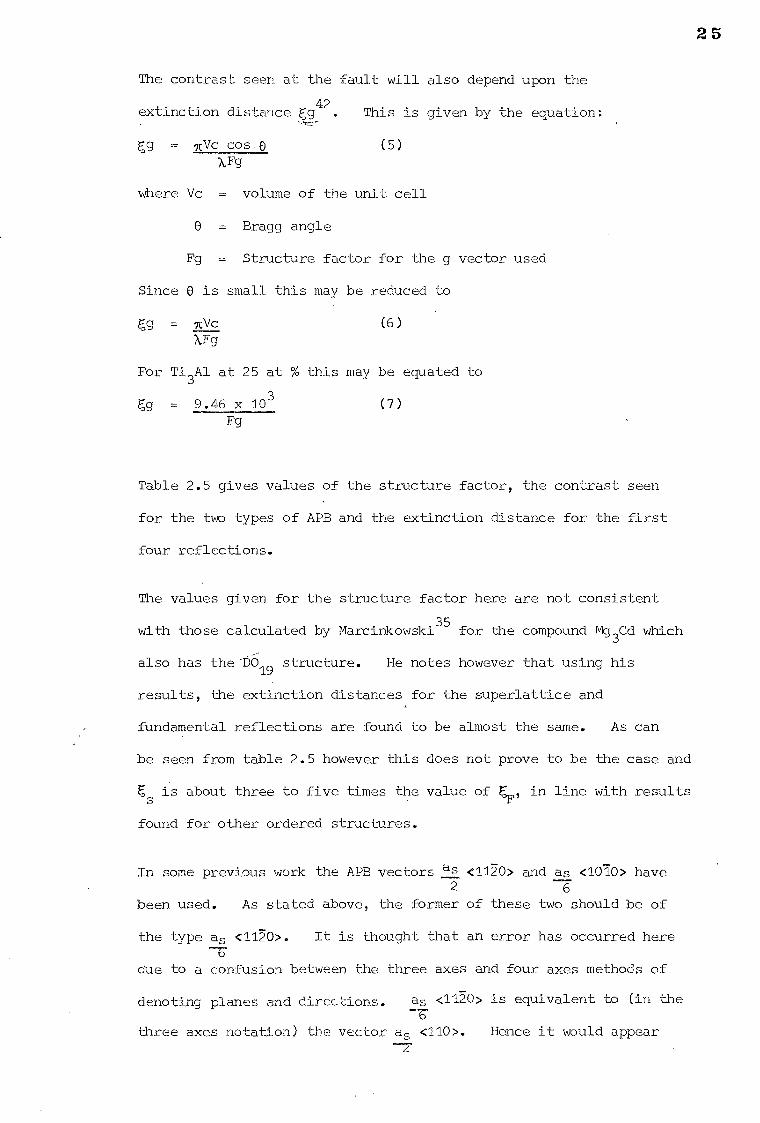
The contrast seen at the fault will also depend upon the
extinction distance g42. This is given by the equation:
t,Lg = 7tVc cos.0 (5) xFg
where Vc = volume of the unit cell
8 = Bragg angle
Fg = Structure factor for the g vector used
Since 0 is small this may be reduced to
g = 7cVc
(6) XFg
For Ti3Al at 25 at % this may be equated to
= 9.46 x 10³ (7) Fg
Table 2.5 gives values of the structure factor, the contrast seen
for the two types of APB and the extinction distance for the first
four reflections.
The values given for the structure factor here are not consistent
with those calculated by Marcinkowski35
for the compound Mg3Cd which
also has the15019
structure. He notes however that using his
results, the extinction distances for the superlattice and
fundamental reflections are found to be almost the same. As can
be seen from table 2.5 however this does riot prove to be the case and
s is about three to five times the value of in line with results
found for other ordered structures.
In some previous work the APB vectors as <1120> and as <1070> have 2 6
been used. As stated above, the former of these two should be of
the type as <1170>. It is thought that an error has occurred here —6"
due to a confusion between the three axes and four axes methods of
denoting planes and directions. as <1120> is equivalent to (in the
three axes notation) the vector as <110>. Hence it would appear
26
that the three index notation has been used and then converted
to the 4 index notation incorrectly.
The value of cc, the phase angle, for the two types of APB are
however in agreement with those calculated in this work.
The value of m for a fault of the type as <1120> will always be 6
zero for a fundamental reflection as table 2.4 shows. However
since the as <1610> fault is an imperfect vector in the disordered 6
lattice it will be visible under some fundamental reflections as a
consequence of the stacking fault contrast.
2.3.4 DISLOCATIONS IN Ti3Al
The possible dislocations and slip systems in close packed
hexagonal metals have been extensively reviewed34'36-39
In this
section the effects of ordering on the dislocations and their motion
will be considered.
The movement of any dislocation in ordered lattice will involve
the creation of an APB. It is therefore energetically more
favourable for dislocations in these alloys to move in groups such
that their total Burgers vector is a superlattice translation. For
example it has been proposed that the as <1120> dislocations in the 6
DO19 structure will move as close bound pairs separated by an APB,
in a manner analogous to an extended dislocation, figure 2.9.
An as <1120> dislocation may move on the (0001) basal plane, the 6
1100! prism planes and the f1011 pyramidal planes. In unalloyed
titanium it has been shown that these are the most common slip systems.
However a limited number of i <1123> type dislocations have been
observed with possible slip planes of k07i1i and 11172. These
latter two systems will not be considered here. Twinning will also
(00011
W1TIA
Type Type 2 Type 1
Type 2 Type 1 y A
B
U)
(2110) Projection B
27
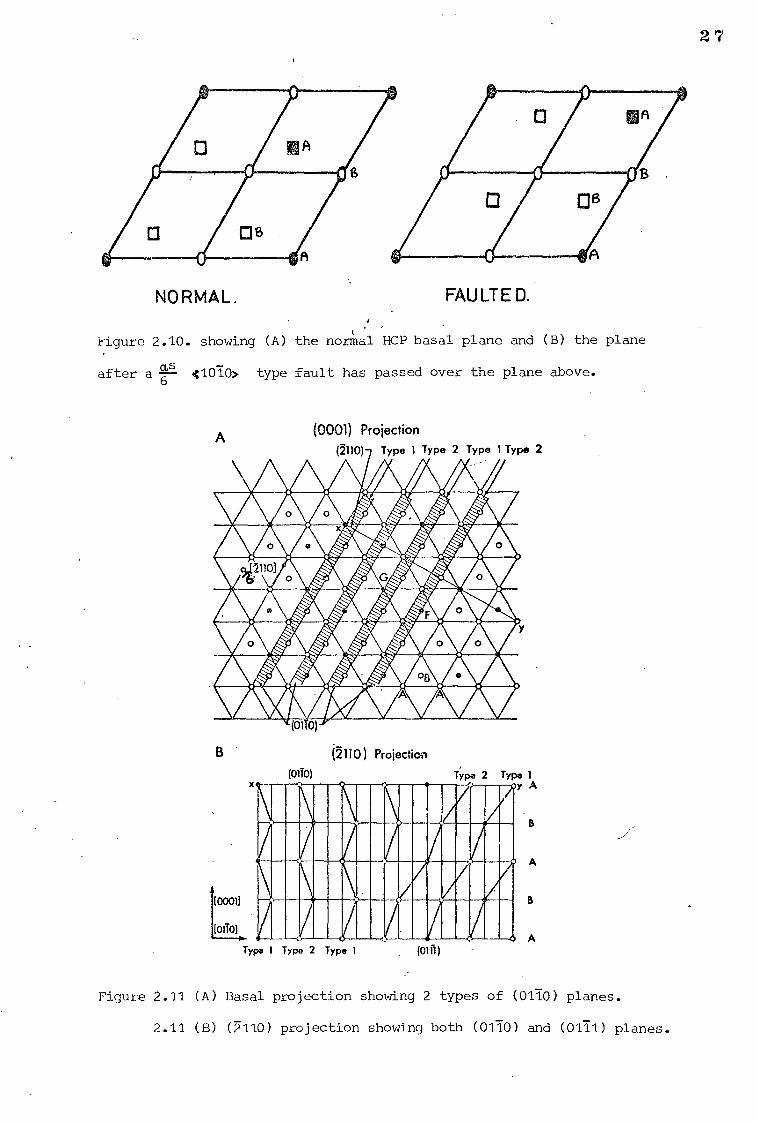
NORMAL. FAULTED.
eigure 2.10. showing (A) the normal HCP basal plane and (B) the plane
s a after a 6 — 41010> type fault has passed over the plane above.
A (0001) Projection
(2110) Type 1 Type 2 Type 1 Type 2
Figure 2.11 (A) Basal projection showing 2 types of (0170) planes.
2.11 (B) (7110) projection showing both (0110) and (0171) planes.
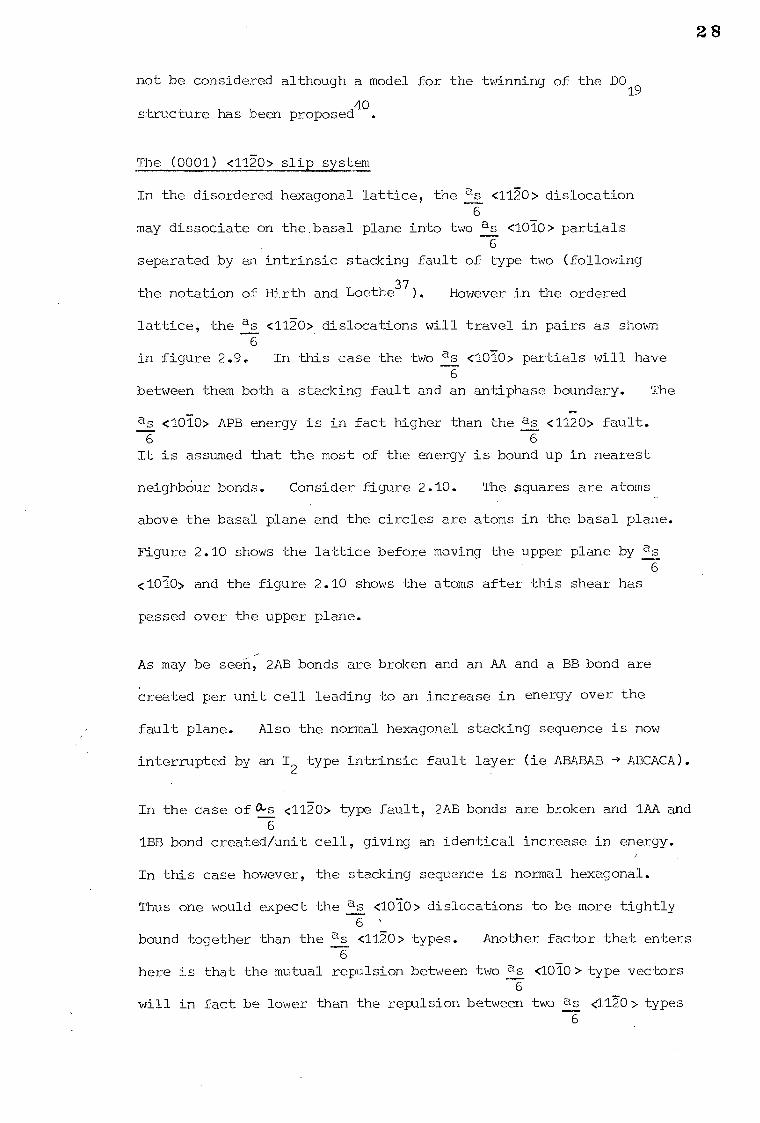
28
not be considered although a model for the twinning of the DO 19
structure has been proposed40.
The (0001) <1170> slip system
In the disordered hexagonal lattice, the as <1120> dislocation 6
may dissociate on the.basal plane into two as <1010> partials 6
separated by an intrinsic stacking fault of type two (following
the notation of Hirth and Loethe37). However in the ordered
lattice, the as <1120> dislocations will travel in pairs as shown 6
in figure 2.9. In this case the two as <1010> partials will have 6
between them both a stacking fault and an antiphase boundary. The
as <1010> APB energy is in fact higher than the as <1120> fault. 6 6 It is assumed that the most of the energy is bound up in nearest
neighbOur bonds. Consider figure 2.10. The squares are atoms
above the basal plane and the circles are atoms in the basal plane.
Figure 2.10 shows the lattice before moving the upper plane by as 6
<1010> and the figure 2.10 shows the atoms after this shear has
passed over the upper plane.
As may be seen, 2AB bonds are broken and an AA and a BB bond are
created per unit cell leading to an increase in energy over the
fault plane. Also the normal hexagonal stacking sequence is now
interrupted by an 12 type intrinsic fault layer (ie ABABAB a ABCACA).
In the case of as <1120> type fault, 2AB bonds are broken and 1AA and 6
1BB bond created/unit cell, giving an identical increase in energy.
In this case however, the stacking sequence is normal hexagonal.
Thus one would expect the as <1010> dislocations to be more tightly 6 '
bound together than the as <1120> types. Another factor that enters 6
here is that the mutual repulsion between two as <M10> type vectors 6
will in fact be lower than the repulsion between two as <1150> types 6
29
since the Burgers vector is of smaller magnitude. Observations
of the dislocations in ordered Mg3Cd have confirmed that this is
indeed the case41.
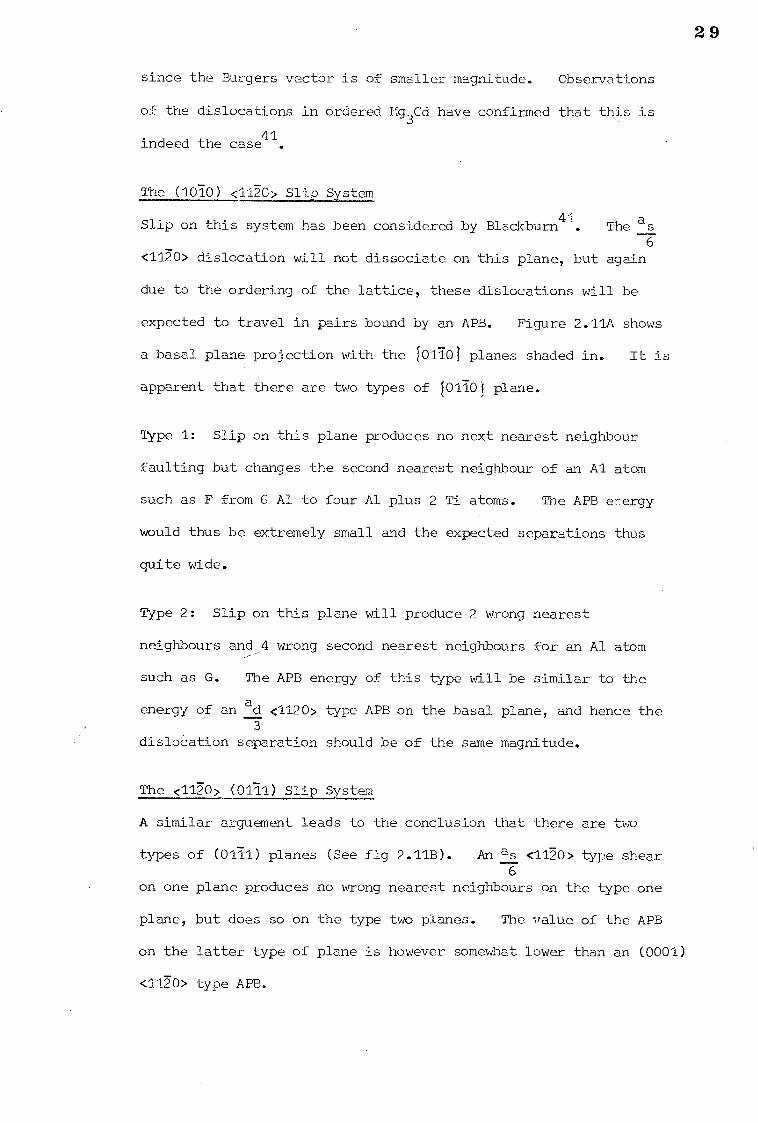
The (1010) <1120> Slip system
Slip on this system has been considered by Blackburn41. The as 6
<1170> dislocation will not dissociate on this plane, but again
due to the ordering of the lattice, these dislocations will be
expected to travel in pairs bound by an APB. Figure 2.11A shows
a basal plane projection with the 101701 planes shaded in. It is
apparent that there are two types of 01701 plane.
Type 1: Slip on this plane produces no next nearest neighbour
faulting but changes the second nearest neighbour of an Al atom
such as F from 6 Al to four Al plus 2 Ti atoms. The APB eflergy
would thus be extremely small and the expected separations thus
quite wide.
Type 2: Slip on this plane will produce 2 wrong nearest
neighbours and 4 wrong second nearest neighbours for an Al atom
such as G. The APB energy of this type will be similar to the
energy of an ad <1120> type APB on the basal plane, and hence the 3
disloCation separation should be of the same magnitude.
The <1120> (0171) Slip System
A similar arguement leads to the conclusion that there are two
types of (0171) planes (See fig 2.1113). An as <1120> type shear 6
on one plane produces no wrong nearest neighbours on the type one
plane, but does so on the type two planes. The value of the APB
on the latter type of plane is however somewhat lower than an (0001)
<1120> type APB.
30
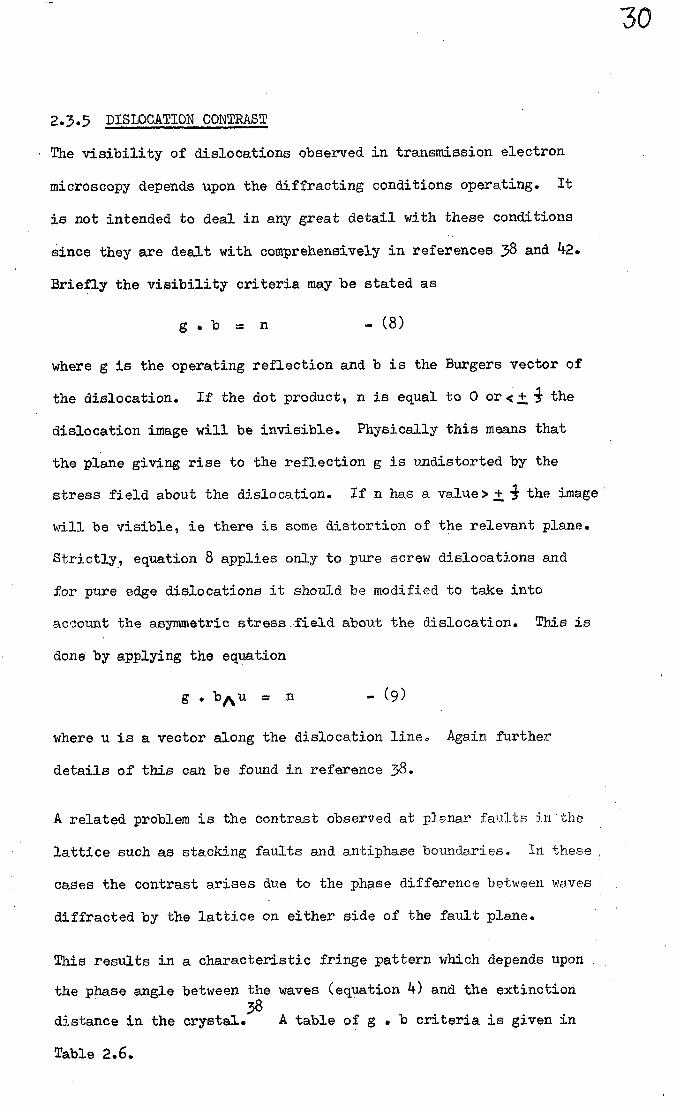
2.3.5 DISLOCATION CONTRAST
• The visibility of dislocations observed in transmission electron
microscopy depends upon the diffracting conditions operating. It
is not intended to deal in any great detail with these conditions
since they are dealt with comprehensively in references 38 and 42.
Briefly the visibility criteria may be stated as
g b = n - (8)
where g is the operating reflection and b is the Burgers vector of
the dislocation. If the dot product, n is equal to 0 or< + the
dislocation image will be invisible. Physically this means that
the plane giving rise to the reflection g is undistorted by the
stress field about the dislocation. If n has a value> + the image
will be visible, ie there is some distortion of the relevant plane.
Strictly, equation 8 applies only to pure screw dislocations and
for pure edge dislocations it should be modified to take into
account the asymmetric stress field about the dislocation. This is
done by applying the equation
g bAu n - (9)
where u is a vector along the dislocation line. Again further
details of this can be found in reference 38.
A related problem is the contrast observed at planar faults in the
lattice such as stacking faults and antiphase boundaries. In these
cases the contrast arises due to the phase difference between waves
diffracted by the lattice on either side of the fault plane.
This results in a characteristic fringe pattern which depends upon
the phase angle between the waves (equation 4) and the extinction 38
distance in the crystal. A table of g b criteria is given in
Table 2.6.
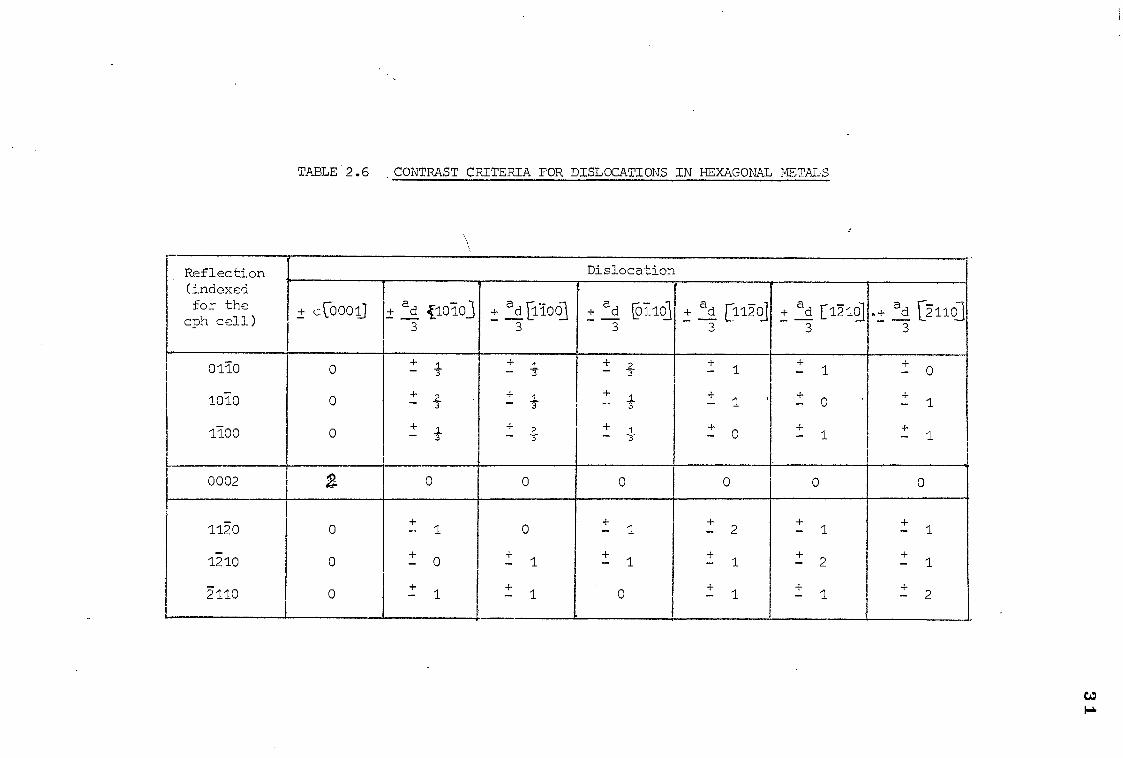
TABLE 2.6 CONTRAST CRITERIA FOR DISLOCATIONS IN HEXAGONAL METALS
Reflection (indexed for the cph cell)
Dislocation
+ c.:0001j + ad {1070 3
_ ad 1700 3
ad N101 - 7
+ ad [1120 3
_ ad [1210 3
.+ ad C2110] 3
0170
1010
17_00
0
0
0
_ i. 3
+ 2 - 3
+ J. - 3
- 3 1.
+ .1 - 3
+ 2 - T
- 3 2
+ J.. - 3
+ 1 - -3'
+ - 1
+ - 1
+ - 0
+ - 1
1- : 0
± 1
- 0
± 1
+ - 1
0002 0 0 0 0 0 0
112-0
1210
2110
0
0
0
+ - 1
+ - 0
+ - 1
0
- 1
+ - 1
+ - 1
+ - 1
0
+ - 2
+ - 1
+ - 1
-+ 1
± 2
- 1
+ - 1
+ 1
1: 2
CAI
(A)
32
(B)
900
T 3 1../
1: (1D-0 2: a 5-1 61 3: a [121] 6-
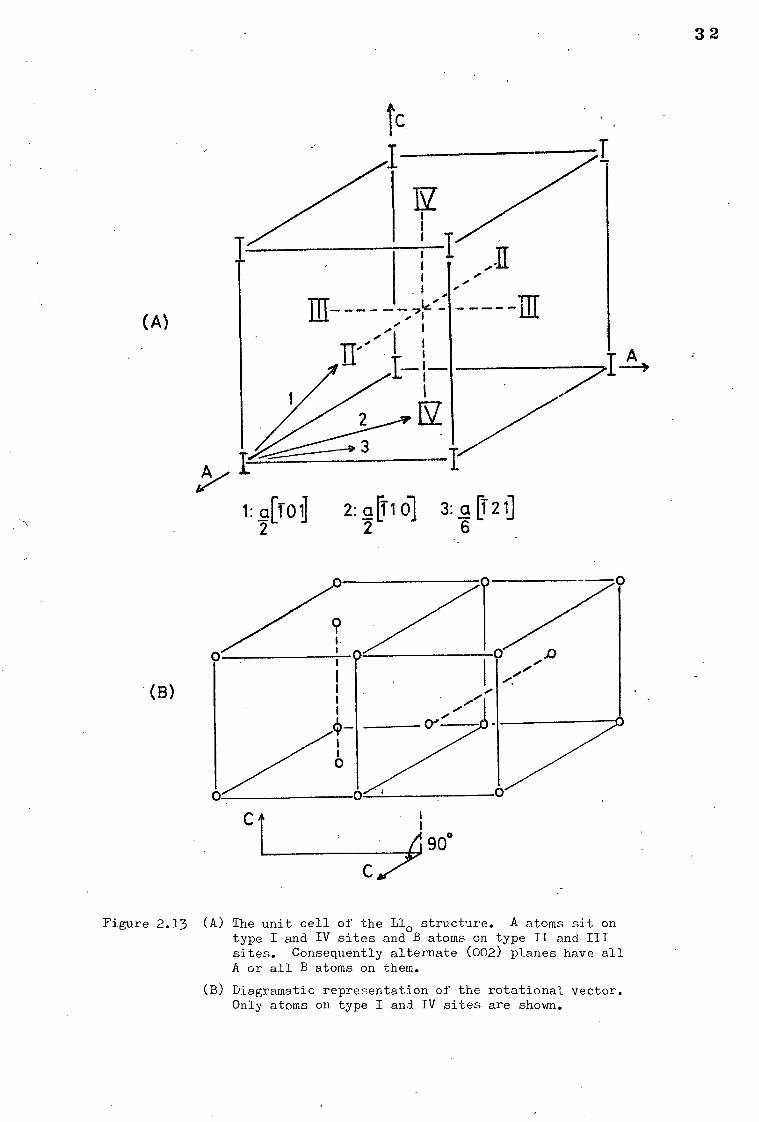
Figure 2.13 (A) The unit cell of the Llo structure. A atoms sit on type I and IV sites and B atoms on type II and III sites. Consequently alternate (002) planes have all A or all B atoms on them.
(B) Diagramatic representation of the rotational vector. Only atoms on type I and IV sites are shown.
33
2.4 THE CRYSTAL STRUCTURE OF y
2.4.1 INTRODUCTION
A brief consideration of the y structure is given for completeness.
TiAl has the L10 (CuAuI) structure. This structure shown in
figure 2.13 is an ordered fcc crystal with titanium atoms on type
and IV sites and aluminium atoms on type II and III sites. This
results in alternate (002) planes being either all titanium or all
aluminium, and hence the structure is distorted into a tetragonal
cell. This tetragonality is very small in the present case, and
the cell will be treated as cubic.
Because of the stacking of the two atom species on alternate (002)
planes, certain unusual features arise. For example, vectors of
the type 4[7011 will obviously place both A and B atoms on wrong
sites, (see figure 2.13A) and hence cause an APB. In the case of
vectors which are perpendicular to the [001] direction this does
not occur and hence no' APB is produced. This will be shown later
to affect the dislocation arrangements in ordered alloys having
this structure. As in the DO19
lattice the vector 10-1-10ii will 2 vector [ 10i]
an APB only, but vectors of the type 1/6 <112> will
characterise both an APB and a stacking fault, except as detailed
beloW. In this structure, a third type of APB is possible. This
arises because the c axis of the cell may lie along any of the
disordered Cube axes [100] [010] and as considered above [0011.
In this case two different orientations of the c axis lead to
domains that are related to each other not by a shear vector but
by a rotation of 90°, as in figure 2.13B.
2.4.2 THE STRUCTURE FACTOR OF TiAl
The structure factor for the 1,10 superlattice confirms the uniqueness
of the c axis, ie:
B
34
(A)
b
a
PLANE
a A A A t [11 0]
A\ /A\ B (111)
6 a Ti a[„2]
(C)
6
APB.SF
2
APB +SF\ \ APB SF only
[0 1ij 2
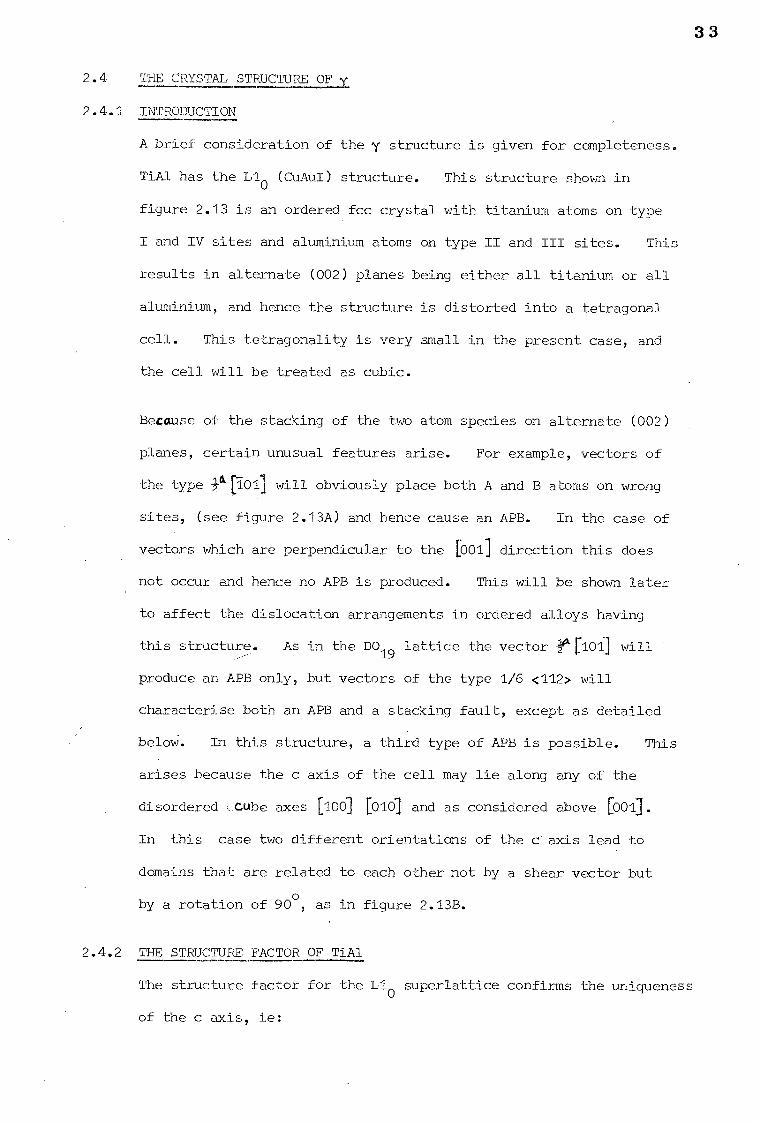
Figure 2. 12 (A) The (III) slip plane in the Llo structure.
(B) An a/2 [110] dislocation that moves on the (III) plane without producing an APB.
(C) The arrangement of a/ 2 (011.3 dislocations, showing the expected pairing, the two unit dislocations bound by an APB.
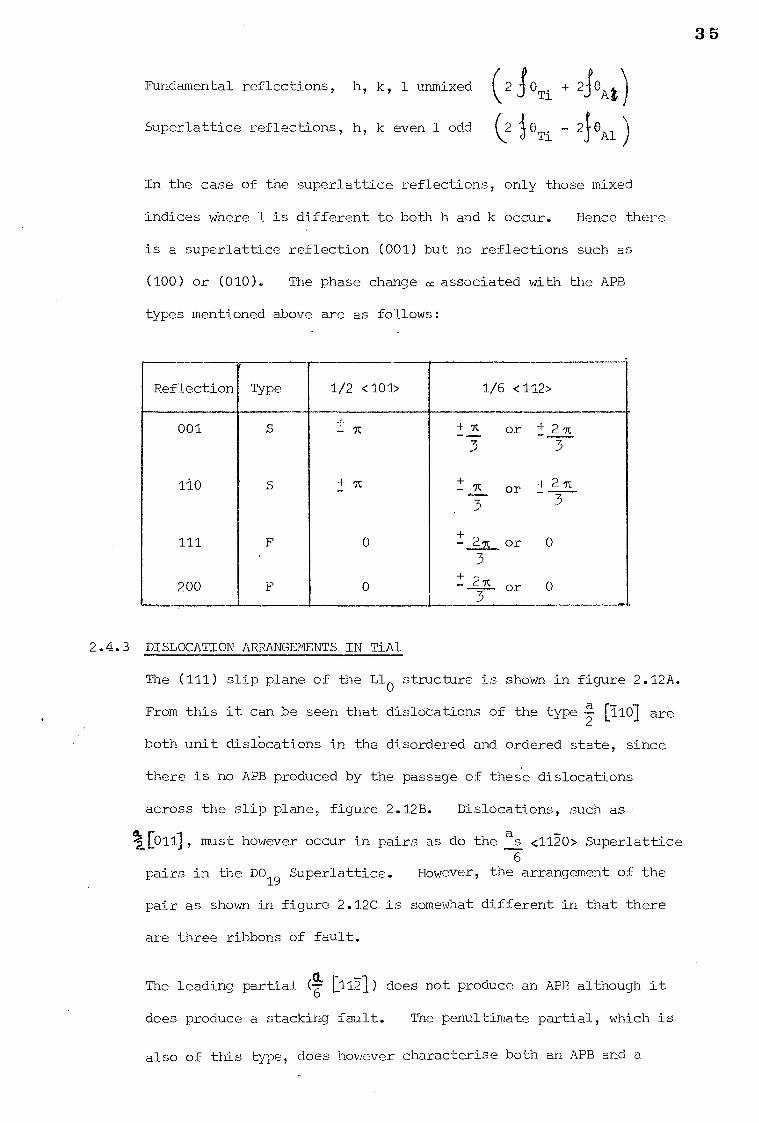
Fundamental reflections, h, k, 1 unmixed ( 246Ti
+ 2S6A4)
Superlattice reflections, h, k even 1 odd (2 i.0Ti - 210 1 Al /
In the case of the superlattice reflections, only those mixed
indices where 1 is different to both h and k occur. Hence there
is a superlattice reflection (001) but no reflections such as
(100) or (010). The phase change cc associated with the APB
types mentioned above are as follows:
Reflection Type 1/2 <101> 1/6 <112>
001
110
111
200
S
S
F
F
+ - gt
7, + _
0
0
4 9, - ___ 3
+ - it
or
or
or
or
1- -____ 3
t 27,
3
- + 2,1
3
0
0
3 _ 27c
3
2.4.3 DISLOCATION ARRANGEMENTS IN TiAl
The (111) slip plane of the Ll0 structure is shown in figure 2.12A.
a r- From this it can be seen that dislocations of the type 2 — L110.1 are
both unit disfocations in the disordered and ordered state, since
there is no APB produced by the passage of these dislocations
across the slip plane, figure 2.12B. Dislocations, such as
a, 10111, must however occur in pairs as do the as <1120> Superlattice 6
pairs in the DO19
Superlattice. However, the arrangement of the
pair as shown in figure 2.12C is somewhat different in that there
are three ribbons of fault.
r The leading partial 6 0121) does not produce an APB although it
does produce a stacking fault. The penultimate partial, which is
also of this type, does however characterise both an APB and a
35
36
stacking fault. This can be seen clearly by considering these
displacements on figure 2.12A.
2.5 MARTENSITES IN TITANIUM ALLOYS
Pure titanium undergoes an allotropic change at 882.5°C from the high
temperature bcc 3 - Ti to the hcp o Ti. If the transformation occurs
on rapid cooling, the product shows equiaxed, serrated edged grains
typical of a massive martensitic reaction. This changes normally on
alloying to the more conventional lenticular type of plate. On slow
cooling the transformation takes place by a conventional nucleation and
growth reaction.
The crystallography of the transition was deduced by Burgers43
originally
for Zr but the same orientation relationship occurs in Ti. He showed
that the transformation takes place by a shear on the !1121ff plahes in the
<111> direction (or vice versa) to give the orientation relationship.
(0001) m //el (011)p
(21I0) m//el(7,11),13
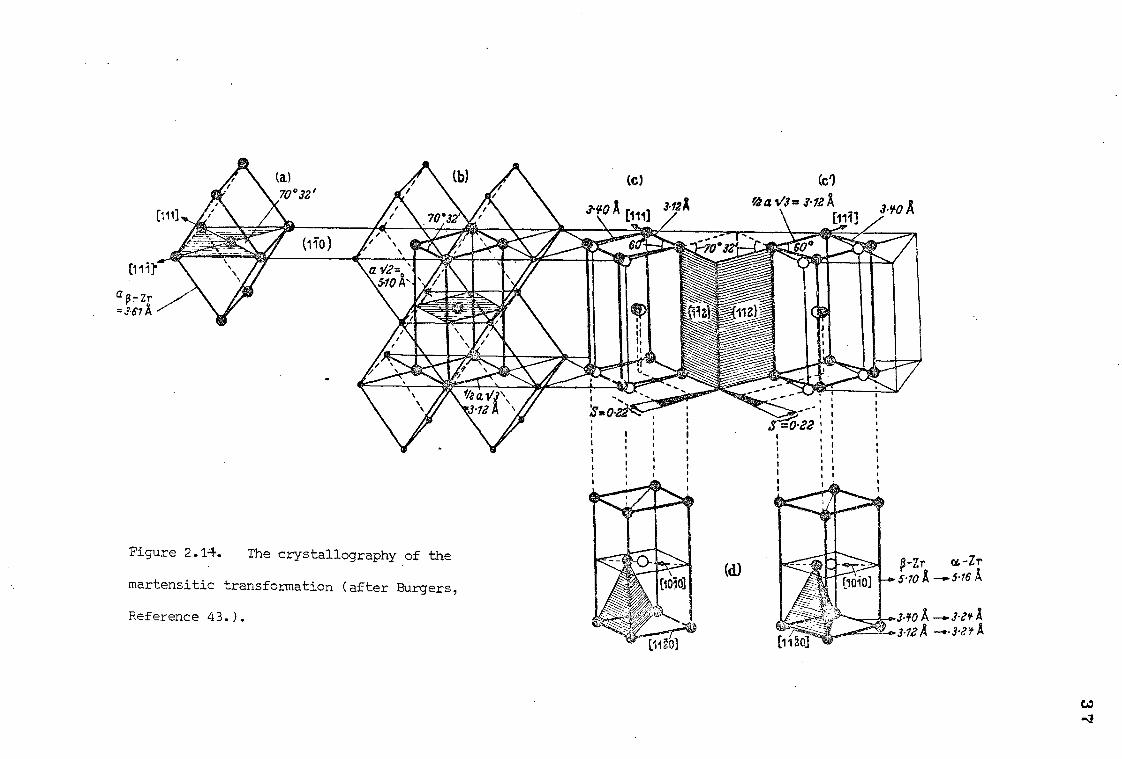
It can be seen in figure 2.14 that the shear reduces the angle between the
planes from 70° 32 to 60° to give two new 11120} m planes. The
central atom of the cell has then to be shifted in the <1010> direction to
the correct position, and further small dilations give the new m -hcp
structure. It can be seen that 1 grain will give 12 new variants (6
illotp planes with 2 <111> directions contained in them).
Barrett, Williams and Cahn44
using back reflection x-ray techniques on
iodide-titanium obtained accurate measurements of the orientation relationship.
If the Burgers relationship is followed exactly the (0001) planes of the
various variants should lie at 60° or 90° to each other (ie the angles
between the original [1100 planes). They find however that there is a
(c) (c1 Vas/3=3.12 A 3-12 310 A DA 3.12A s/
[11i) 3f0 A
P-Zr ac-Zr 5.10 A -.516A
3.5(0 A 3.12A A
Pigure 2.14. The crystallography of the
martensitic transformation (after Burgers,
Reference 43.).
38
deviation from this ideal relationship of 1.5°. Furthermore if one
<1120> is parallel to a <111> then one other <1120> direction should
+ be at 100 32' from this. The measured value was in fact 90 - 0.5.
Thence it was concluded that the (0001) is not quite parallel with
1110113 but deviates from it by about 0.5°. The habit plane was found
to be the 18,9,1213 plane and the deviation from the ideal 111243 habit
plane was assumed to be due to accommodation slip. Later work concurs
with this, showing the habit plane to be very close to 1334dp, and an
analysis of the transformation using the Bowles-Mackenzie theory has
shown that this agrees with theoretical predictions45.
A second habit plane, 1344113 has been observed however in alloys
46-48 containing the transition metals, particularly Mo and Mn. The
plates of this [34443 type, have been found by Hammond and Kelly49 to
contain a fine structure of 11011 type twins and employing an analysis
based on the Bowles-Macken2ie theory, they were able to show that this
type of martensite may be expected, the twins forming to take up the
dilation strains of the transformation. In fact each twin m/p interface
lay on a 133413 plane related so that the general effect was that the
interface lay on the 134413 plane. They were able to relate the
occurrence of this type of habit to the ratio, of the parameters of the
and 13 phase, finding that as a m/a (3 rises the twinned martensite
should become increasingly likely to form, since the dilation strains
increase.
Most of the work on Ti alloy martensites has been concentrated on the
13-stabilised alloys mainly because of their greater commercial interest
and also because the vast majority of elements tend to stabilise the
P-allotrope. It has been shown by Duwez50
that these elements tend to
depress the Ms of the pure element at a rate which is roughly proportional
39
to the fall in the p transus temperature with increased alloying
additions. In contrast to this, Clark et ar'k% have shown that the
Ms_in Ti-Al alloys rises as the aluminium content increases, again at
a rate proportional to the increase in the (3 transus temperature.
A further type of martensite has been reported in titanium alloys.
This was a fct or fcc phase reported by Blackburn52
and subsequently by
other workers53. This has been shown however to be an artefact formed
presumably by spontaneous transformations in thin foils, since no
evidence of its existence has been found by x-ray analysis of bulk samples,
although Hammond and Kelly48 were able to detect it in powder specimens
produced from thin foils. This fcc phase has an a parameter a = 4.5A°.
This is larger than the expected a parameter calculated for the close
packing of Ti atoms (4.13A°) and it has been proposed that this phase is
stabilised by interstitial atoms
Other features that have been reported in the 1330p martensite are:
1) Stacking faults, reported by Williams and Blackburn43
have been
shown to be (by the analysis of the contrast of the dislocations
at the end of the faults) intrinsic 14<10i0> type faults, and be in
the basal plane. It has been noted that higher aluminium contents
favour the formation of these faults.
2) Occasionally 11071A twins have been observed in the martensite
plates52.
3) Twin relations between martensite plates on a {10111 twinning plane
have frequently been reported in (334)pmartensite. An explanation
for this in terms of the transformation from m to p has been given
by Flower, West and Swann55.
There are in fact two ways in which this could be produced.
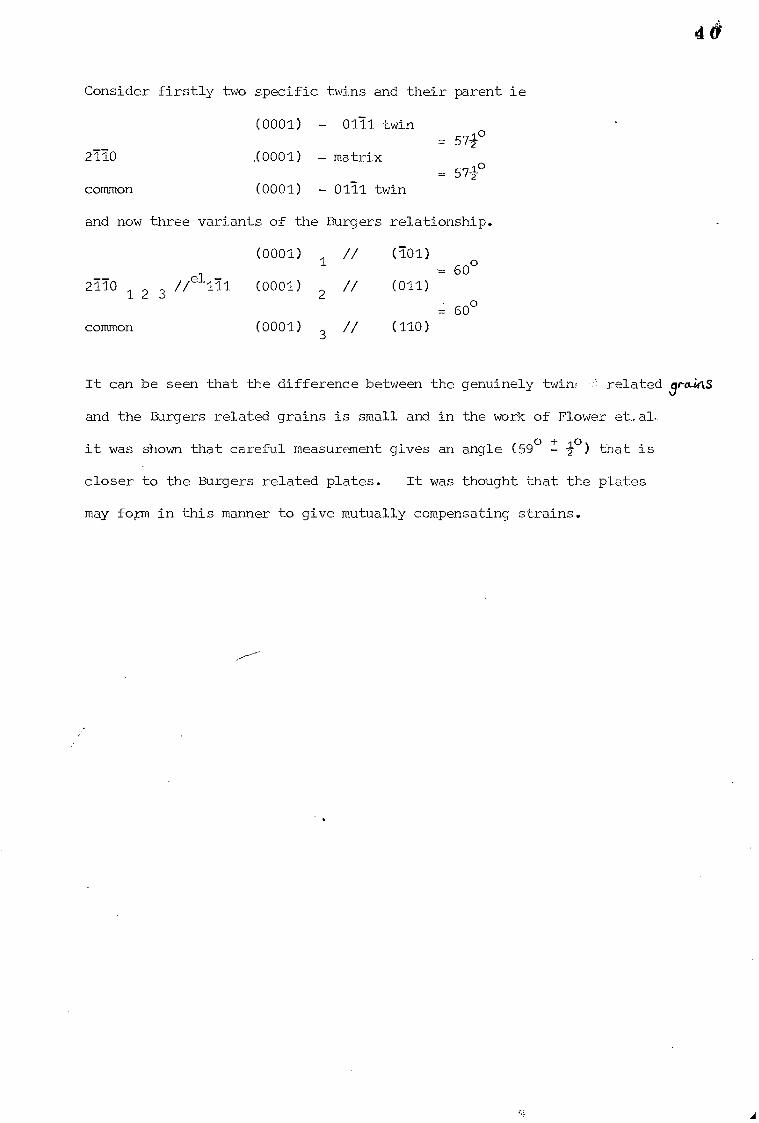
Consider firstly two specific twins and their parent ie
(0001) - 0171 twin 57_210
2110 .(0001) - matrix = 571°
common
(0001) - 0171 twin
and now three variants of the Burgers relationship.
2110 1
common
2 //e1171 3
(0001)
(000 1)
(0001)
1
2
3
//
//
//
(701)
(011)
(110) =
60o
60°
It can be seen that the difference between the genuinely twin. related 3ra_iilS
and the Burgers related grains is small and in the work of Flower et,al,
l it was shown that careful measurement gives an angle (59
o -2-
o - ) that is
closer to the Burgers related plates. It was thought that the plates
may form in this manner to give mutually compensating strains.
41
CHAPTER THREE
EXPERIMENTAL PROCEDURE
3.1 MATERIALS
The alloys in this study were prepared from high purity sponge
titanium supplied by Imperial Metal Industries, and high purity
aluminium (99.999% Al). The impurity contents of the base materials
are given in Table 3.1. in weight per cent.
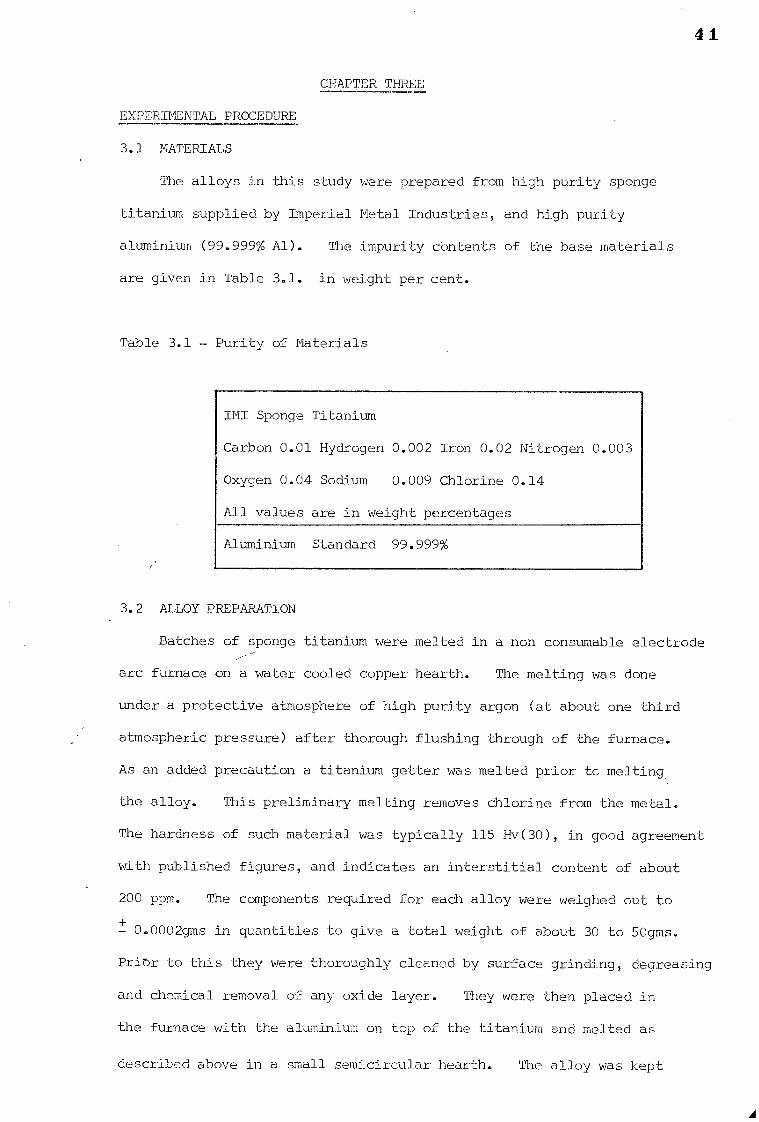
Table 3.1 - Purity of Materials
IMI Sponge Titanium
Carbon 0.01 Hydrogen 0.002 Iron 0.02 Nitrogen 0.003
Oxygen 0.04 Sodium 0.009 Chlorine 0.14
All values are in weight percentages
Aluminium Standard 99.999%
3.2 ALLOY PREPARATION
Batches of sponge titanium were melted in a non consumable electrode
arc furnace on a water cooled copper hearth. The melting was done
under a protective atmosphere of high purity argon (at about one third
atmospheric pressure) after thorough flushing through of the furnace.
As an added precaution a titanium getter was melted prior tc melting,
the alloy. This preliminary melting removes chlorine from the metal.
The hardness of such material was typically 115 Hv(30), in good agreement
with published figures, and indicates an interstitial content of about
200 ppm. The components required for each alloy were weighed out to
± 0.0002gms in quantities to give a total weight of about 30 to 50gms.
Prior to this they were thoroughly cleaned by surface grinding, decreasing
and chemical removal of any oxide layer. They were then placed in
the furnace with the aluminium on top of the titanium and melted as
described above in a small semicircular hearth. The alloy was kept
42
fully molten for about 90 seconds and then allowed to cool. It was
then turned and remelted. This was repeated four times to ensure
homogeniety and then the "button" ingot was remelted in a rod shaped
hearth to give an ingot typically 50mm x 10mm x 10mm. The ingot was
then allowed to cool to room temperature, removed from the furnace and
reweighed. It was found that the weight changes on melting were
within the limits ± 0.06%. Since the changes were very small the
composition of each alloy has been taken to be the weighed composition.
The alloy compositions prepared for this work are given in table 3.2.
It is intended to refer to the alloys in future in terms of the atomic
percentage of Al as shown in column 1 of this table.
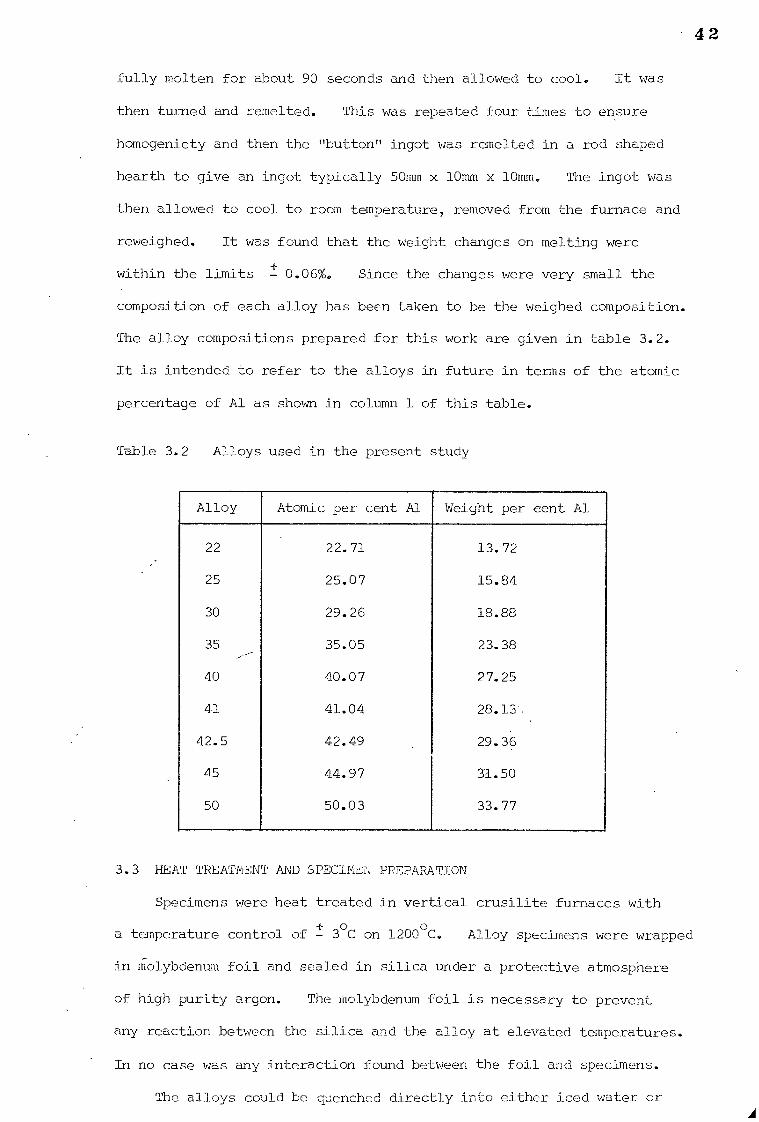
Table 3.2 Alloys used in the present study
Alloy Atomic per cent Al Weight per cent Al
22 22.71 13.72
25 25.07 15.84
30 29.26 18.88
35 35.05 23.38
40 40.07 27.25
41 41.04 28.13,
42.5 42.49 29.36
45 44.97 31.50
50 50.03 33.77
3.3 HEAT TREATMENT AND SPECIMEN PREPARATION.
Specimens were heat treated in vertical crusilite furnaces with
a temperature control of - 3°C on 1200°C. Alloy specimens were wrapped
in molybdenum foil and sealed in silica under a protective atmosphere
of high purity argon. The molybdenum foil is necessary to prevent
any reaction between the silica and the alloy at elevated temperatures.
In no case was any interaction found between the foil and specimens.
The alloys could be quenched directly into either iced water or
43
brine the capsule being smashed on quenching to ensure a rapid quench.
The surface of the specimen, which was inevitably heavily ta:riliSked. -
during the quenching procedure was ground off before any further steps
were taken.
Specimens were cut from the ingot using an oil cooled,
carborundum slitting wheel. The specimens were usually cut to a
thickness of about 5mm from the original 50 x 10 x 10mm ingot, this
size being the most convenient for heat treatments and subsequent
examination. After the desired treatment, three of four slices were
cut 0.25mm thick for electron microscopy specimens and the rest of the
specimen was kept for light microscopy.
3.4 SPECIMENS FOR ELECTRON METALLOGRAPHY •••
The slices described above were fixed to a flat surfaced block
with "Twinstick" adhesive tape and ground down to about 0.08mm in
thickness on a water cooled rotary grinding wheel using successively
fine grades of silicon carbide paper, down to 600 grade for final
polishing. To obtain a flat parallel sided specimen, it was found
convenient to surround the specimen with pieces of broken razor blade
during this process. In order to avoid deforming the specimens the
adhesive was softened by soaking in acetone and they could then be gently
lifted away from the block with a scalpel blade.
Final polishing was done electro-chemically using the window technique.
The solution used here was based upon polishing solution developed by
Blackburn and Williams, but the amount of perchloric acid was increased
slightly, so that the composition was:
250 mis Methanol
150 mis n-butanol
10 mis conc. Perchioric acid
In view of the danger already mentioned of contamination
44
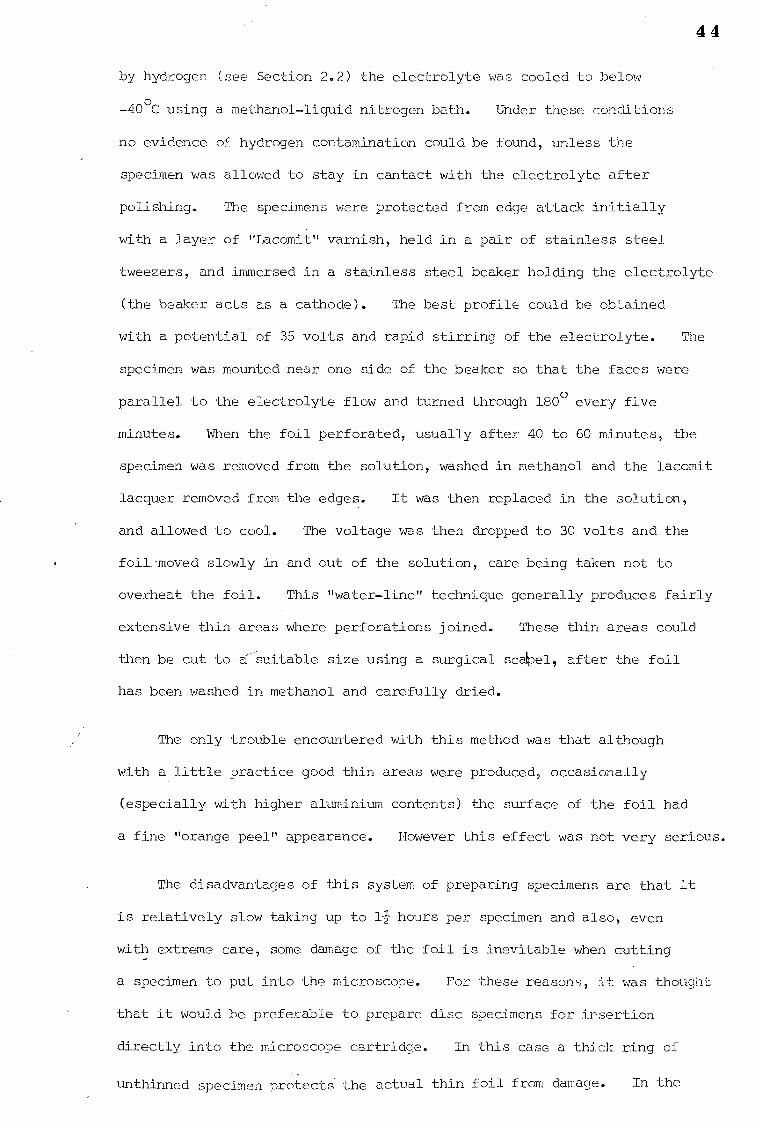
by hydrogen (see Section 2.2) the electrolyte was cooled to below
-40°C using a methanol-liquid nitrogen bath. Under these conditions
no evidence of hydrogen contamination could be found, unless the
specimen was allowed to stay in cantact with the electrolyte after
polishing. The specimens were protected from edge attack initially
with a layer of "Lacomit" varnish, held in a pair of stainless steel
tweezers, and immersed in a stainless steel beaker holding the electrolyte
(the beaker acts as a cathode). The best profile could be obtained
with a potential of 35 volts and rapid stirring of the electrolyte. The
specimen was mounted near one side of the beaker so that the faces were
parallel to the electrolyte flow and turned through 180° every five
minutes. When the foil perforated, usually after 40 to 60 minutes, the
specimen was removed from the solution, washed in methanol and the lacomit
lacquer removed from the edges. It was then replaced in the solution,
and allowed to cool. The voltage was then dropped to 30 volts and the
foil moved slowly in and out of the solution, care being taken not to
overheat the foil. This "water-line" technique generally produces fairly
extensive thin areas where perforations joined. These thin areas could
then be cut to -ef suitable size using a surgical sc*el, after the foil
has been washed in methanol and carefully dried.
The only trouble encountered with this method was that although
with a little practice good thin areas were produced, occasionally
(especially with higher aluminium contents) the surface of the foil had
a fine "orange peel" appearance. However this effect was not very serious.
The disadvantages of this system of preparing specimens are that it
is relatively slow taking up to 11 hours per specimen and also, even
with extreme care, some damage of the foil is inevitable when cutting
a specimen to put into the microscope. For these reasons, it was thought
that it would be preferable to prepare disc specimens for insertion
directly into the microscope cartridge. In this case a thick ring of
unthinned specimen protectS the actual thin foil from damage. In the
45
!Ilk\ '41-1
,7 , I ; T • \ rff VI e • / / • / / •
• W ./.4" `\ ,
777.-2
\\:\
k* S t I LS ..sttS.
141111°'
PTFE Stainless steel
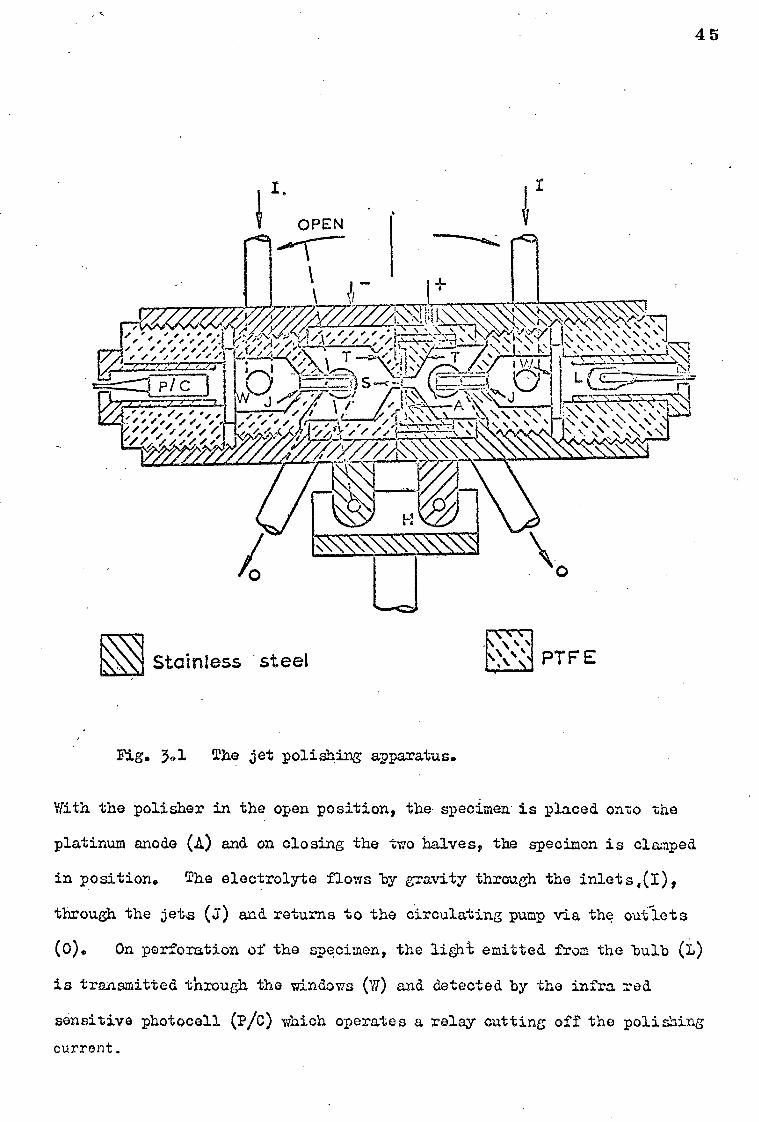
Fig. 30l The jet polishing apparatus.
With the polisher in the open position, the specimen is placed onto the
platinum anode (A) and on closing the two halves, the specimen is clamped
in position. The electrolyte flows by gravity through the inlets ,(I)„
through the jets (s) and returns to the circulating pump via the outlets
(0). On perforation of the specimen, the light emitted from the bulb (L)
is transmitted through the windows (77) and detected by the infra red
sensitive photocell (P/c) which operates a relay cutting off the polishing current.
46
later stages of this project therefore a jet polishing device was
developed following lines already found successful in these laboratories
for the rapid preparation of Fe-Al, Cu-Al-Ni alloys. This polisher
is described in the next section, and has been successful in that
polishing time is reduced drastically to about 10 to 15 minutes. The
thin areas however are not usually as extensive as in a good foil
produced by the window technique, and hence it was not used extensively.
3.5 A LOW TEMPERATURE JET POLISHER
In this laboratory a jet thinning device for the rapid routine
preparation of several different alloys had been developed and full
56 details are available elsewhere. Briefly a disc of a suitable diameter
to fit straight into the microscope cartridge is electropolished whilst
being jetted on both sides with fresh electrolyte. At perforation, a
light source triggers a photocell which switches off the polishing current.
The specimen is then removed, washed and dried. However, as pointed out
in the text, it is necessary to polish titanium alloys at low temperatures
(below - 40°C). Hence the polisher described in the work above had
to be redesigned to take electrolytes at this temperature. A diagram of
the original polisher is shown in figure 3.1 and of the developed version
in figure 3.2 The points that arise are:
(1) In the second version advantage is taken of the fact that a clear
electrolyte is being used and hence a teflon membrane could be employed
instead of the glass window used in the first version, where a semi-opaque
electrolyte (Chrome-Acetic acid) was used. As can be seen this simplifies
construction considerably.
(2) It was thought to be more convenient to construct a holder for the
specimen that could be separated easily from the body of the polisher.
This makes insertion of the specimen easier, and also washing of the
specimen when it has perforated since it may be removed and dipped
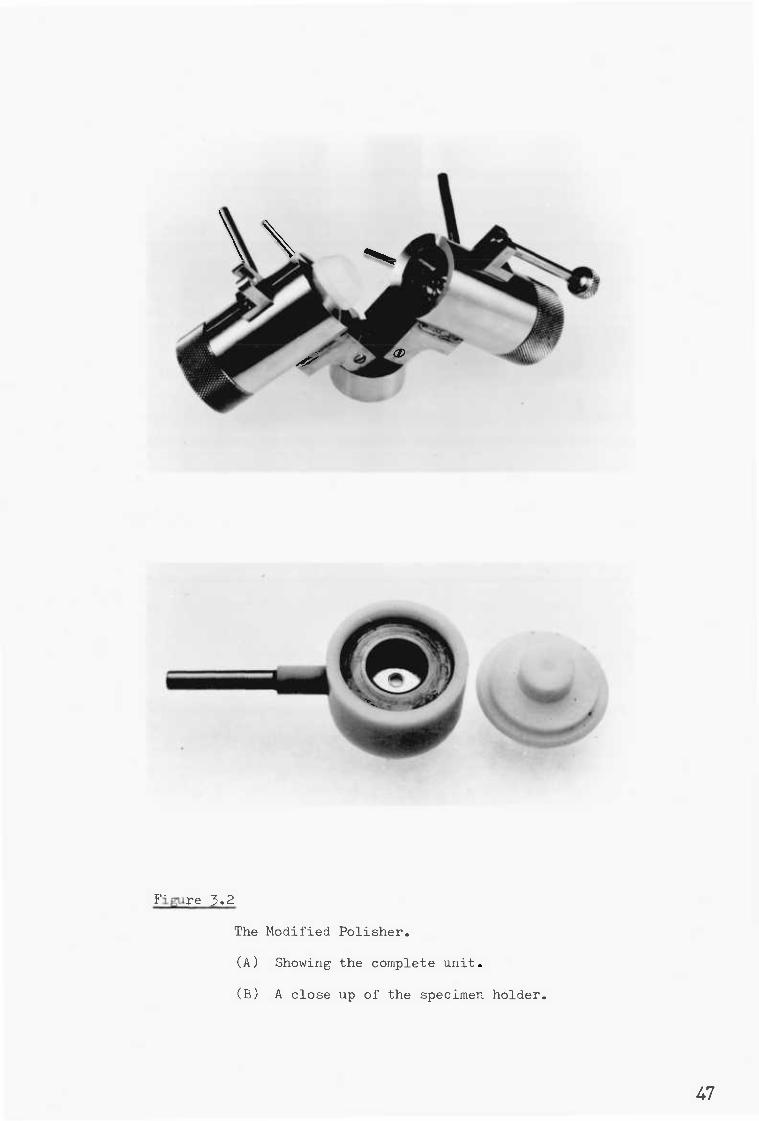
Figure 3.2
The Modified Polisher.
(A) Showing the complete unit.
(B) A close up of the specimen holder.
47
48
straight into a wash bath.
(3) A cooling tank has to be provided. In this case a cooling
reservoir is used containing 250 mis of solution. This reservoir is
dipped into a Dewar of liquid nitrogen, to a depth of about 10 Cats
up the body. In this way the electrolyte could be cooled to below-50°C,
but continuous circulation prevented freezing of the electrolyte in
the tank.
As far as the actual construction of the polisher is concerned,
the only major difficulty was the marked shrinkage of the teflon on
cooling (1.5% on cooling from room temperature to -196°C)'. This was
taken advantage of finally, by machining the teflon pieces oversize,
freezing them in liquid nitrogen and then inserting them into the stainless
steel body. On heating up, the teflon expands and gives an excellent
seal between itself and the steel body. The specimen holder was also
machined a little over the dimensions given to allow for shrinkage in
use, and to give a good seal.
Another practical difficulty was the use of a pump to circulate
the cold, corrosive electrolyte. It was found best to use a peristaltic
pump, and the tubing most resistant to attack by the electrolyte proved
to be silicone rubber tubing. This tubing did perish, but if after
use the system was flushed through with clean methanol, a reasonable
life could be obtained. However the life was considerably shortened
by allowing the electrolyte to remain in contact with the tubing.
This material also remained adequately flexible at low temperatures.
3.6 SPECIMENS FOR LIGHT MICROSCOPY
The light microscopy specimens were ground on successive grades
of silicon carbide papers down to 600 grade and then f.inelly electro-
polished for about five minutes as described above. They were then
49
etched in a solution. containing:
3 mis Hydrofluoric acid
20 mis Nitric Acid (cone)
100 mis Distilled water
The best results were obtained if the specimen was just dipped
in and out of the solution for about twenty five seconds and then
washed with water after the surface had apparently been overetc'ied.
The specimens were then examined and then repolished and etched,
and re-examined.
3.7 EXAMINATION OF SPECIMENS
Thin foils were examined using either a Siemens Elfracdp I or a
modified AEI 6G electron microscope. Standard techniques including
dark field microscopy, selected area diffraction and two beam analysis
of structural defects were employed. Optical microscopy was carried
out using a Reichert projection microscope.
PJA/KR
50
Ate
CHAPTER FOUR
EXPERIMENTAL RESULTS
4.1 Introduction
In order to discuss the results obtained without needless repetition,
it has been decided to present the work in relation to figure 4.1 the
phase diagram that has been drawn as a consequence of the observations
made. The results will therefore be split into relevant sections dealing
with the microstructures of each part of the diagram. In the course
of this investigation no other phases were observed other than m, m2
(Ti3Al), and y (TiA1).
4.2 Alloys Quenched from them Phase Field
Alloys which at the ageing temperature had been in the 0(phase field
were readily identifiable using the electron microscope. When examined,
the microstructure was found to consist of small antiphase
(APR's) having a diameter of typically... 150A°. This structure is shown a
in figure 4.2., which also shows an analysis showing them to be s 6
<1120> type APB's. Such APB's have a phase angle m = 29tg.R of 7t under
the reflection used. Hence the reversal of the contrast observed in
figures 4.2b and c shows that these faults must be of this type rather
than as <1070> faults. It was of course obvious that the faults must 6
be of the former type since at no time was displacement fringe contrast
found with a fundamental reflection as would have been the case with
the latter fault. The small size of these APB's suggests that they
have formed on the quench from the ageing temperature. The superlattice
reflections were always present, quite strongly, in diffraction patterns.
It was not possible to suppress the formation of ordered domains with
the quenching methods used in this study. Notice that the boundaries
lie randomly, not on any specific plane in the foils.
51
The extinction distance y see table 2.040for reflections producing APB
contrast was found to be usually of the same order as the thickness
of the foil, and hence one would not expect fringes to be observed at
the APB's. Very broad fringes could be observed in the APB's when
the value of s (the deviation parameter) was not equal to zero. Also
when the alloy composition deviated from the stoichiometric composition
the APB's could be seen in dark and bright field micrographs taken with
strong fundamental reflections due to the anomalous contrast produced
at the boundary. This effect became more marked as the aluminium
content increased.
4.3 Alloys Quenched from the ( cc-Fcc2) Phase Field
Specimens quenched from this region at high temperatures had a morphology
as shown typically in figure 4.3. There are regions (A) in which no
APB's could be imaged despite the fact that selected area diffraction
showed that they were ordered, and the regions (B) where APB's identical
to those discussed above are seen. Similar reasoning to that above
,leads to the conclusion that the areas (A) were fully ordered at
temperature whereas the (B) areas were disordered. Note that the APB's
in regions B terminate at the dislocations in the interface between the
=and «2. This effectively shows that they are of the type as <117)> 6
dislocations. The appearance of the precipitate shows that it is
ellipsoidal, being extended in the [6oq « direction. This is most clearly seen in figure 4.36 which shows the structure of a 16.5 atomic
% alloy aged for 67 hours at 800°C, and quenched. As can be seen this
alloy is in the(oc+ce2) region to room temperature, and thus the ordered
cc2 precipitate appears bright when imaged with a superlattice
reflection, and the matrix being disordered does not.
52
Examination of these alloys by light microscopy failed to distinguish
between all cc and (cc + m2) structures. In general the small size of
the m2 particles would have precluded direct resolution of them 2
particles with light microscopy. No noticeable change in etching
characteristics of cc, + cc2) and all= 2 alloys could be detected
that could be used reliably to detect the limits of these phase fields.
4.4 Alloys Quenched from them 2 Phase Field
The structure of this phase was confirmed both by x-ray and electron
diffraction to be of the DO19 type. If aged at high temperatures the
structure was comparitively featureless as in any single phase material,
and selected area diffraction gave very strong superlattice reflections.
From this it must be concluded that each individual grain is a single
antiphase domain and that it is highly ordered.
Alloys quenched from them phase field and then subsequently aged in
the ce2 region at about 800°C showed growth of the APB's. No
systematic study of APB growth rates was undertaken, but it was found
convenient to use low temperature anneals to grow the APB's to a
reasonable size for analysis of the vectors in the initial stages of
the project. However it was found that APB growth in this system was
unusual in that subgrain boundaries appeared to be preferential sites
for the nucleation of large APD's, leading to complete annihilation of
APB's about the boundaries before significant growth had occurred
within the grain.
4.5 Alloys Quenched .From el* 4 Phase- 1 ie4
When examined by light microscopy these alloys showed, at both 25 and
22 atomic %, a mixture of large and small,martensite plates, as can be
seen in figure 4.4. Examination in the electron microscope showed that
these two had different internal structures. The larger plates
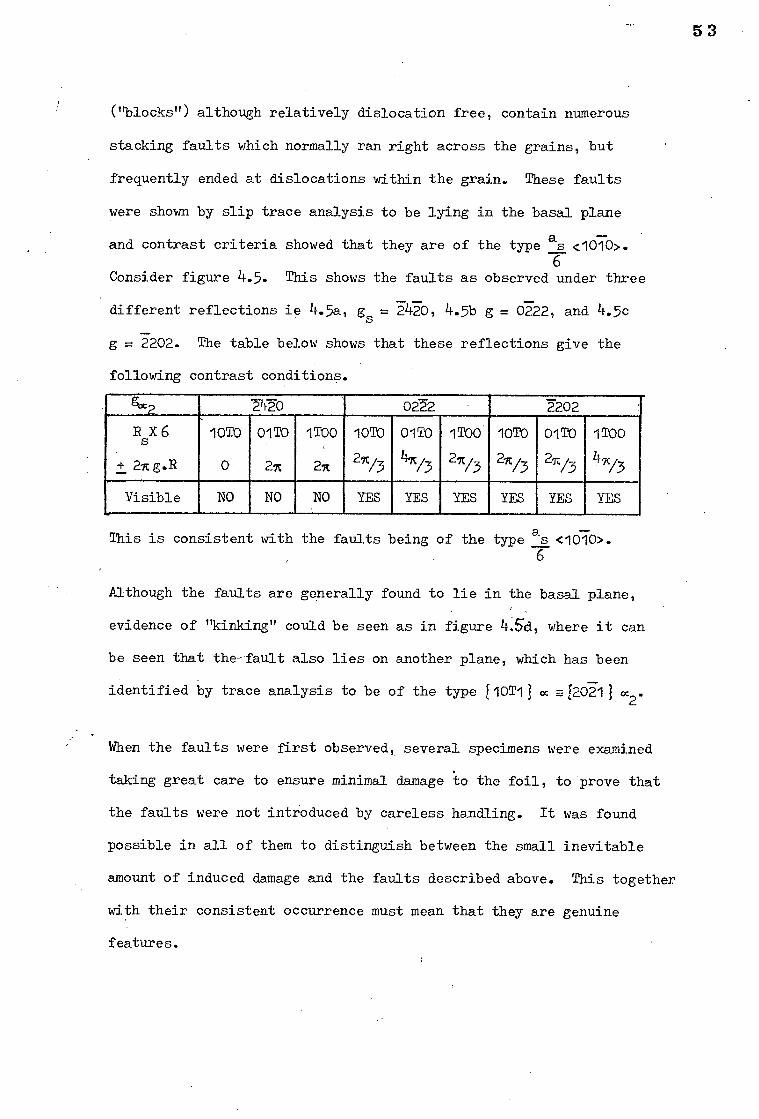
53
("blocks") although relatively dislocation free, contain numerous
stacking faults which normally ran right across the grains, but
frequently ended at dislocations within the grain. These faults
were shown by slip trace analysis to be lying in the basal plane
and contrast criteria showed that they are of the type as <1010>. 6
Consider figure 4.5. This shows the faults as observed under three
different reflections ie 4.5a, gs = 2420, 4.5b g = 0222, and 4.5c
g = 2202. The table below shows that these reflections give the
following contrast conditions.
7470 0222 2202
RsX 6
+ 2wg.R
loTO
0
01 TO
2A
-ITO()
2A
loTo
2A/3
01 TO
n/.3
1Too
21t/3
loTo
21/3
01To
25v3
1Too
47/3
Visible NO NO NO YES YES YES YES YES YES
This is consistent with the faults being of the type as <1010>. 6
Although the faults are generally found to lie in the basal plane,
evidence of "kinking" could be seen as in figure 4Xd, where it can
be seen that the-fault also lies on another plane, which has been
identified by trace analysis to be of the type 110T11 -.71207e" m2.
When the faults were first observed, several specimens were examined
taking great care to ensure minimal damage to the foil, to prove that
the faults were not introduced by careless handling. It was found
possible in all of them to distinguish between the small inevitable
amount of induced damage and the faults described above. This together
with their consistent occurrence must mean that they are genuine
features.

54
As can be seen from figure 4.6 the other form of martensite consists
of "bundles" of plates separated by low angle boundaries. (Selected
area diffraction over a large area such as in figure 4.6a shows a single
well developed diffraction pattern, and a dark field micrograph such
as 4.613 shows that several of the plates appear bright with one
reflection. These facts together with the extremely small displacement
of bend contours over the boundaries indicate that they are of the low
angle type).
Within the plates randomly distributed arrays of dislocations was found.
Two beam analysis of these dislocations (figure 4.7 ab ) shows that
the majority of them must be of the type as <1120>, but that some of 6
them have a Burgers vector, which contains a c component ies< 1123>
■ 3 or c (0001). They must in this case be of the type c <pool', being
visible with an 0002 reflection but invisible under 1120 type reflection.
Dislocations of the type as <1123> would be visible under both 6
reflections g.b being 2 and 2 or 1 respectively. The presence of an
occasional as <1123> dislocation cannot be conclusively discounted in 6
all cases however. Stacking faults in these plates were rarely seen
especially as the aluminium percentage was increased. Figure 4.66 shows
an example of one such fault found. Trace analysis shows that this
fault lay on the basal plahe and once again contrast criteria established
were consistent with it being of the type as <1010> . 6
This type of martensite was found exclusively in alloys having been
quenched from the (m + p) phase fields.
In all the alloys studies there was no evidence of retained p, all the
diffraction patterns obtained being indexable in terms of the
hexagonal cell. Despite this the habit plahe for the martensite has
been shown by a trace analysis technique to be of the type €334 1p.
55
This involves making two assumptions. Firstly that the plate
boundaries are parallel to the original 1 habit plane, and secondly
that the Burgers orientation relationship (see section 2.5) is
followed. By measuring the orientation of the intersection of the
plate boundary with the foil surface in several specimens using
trace analysis and a hcp lattice stereogram, the hexagonal indices
of the plate normal may be found. This is then transferred to a
composite stereographic projection of the cubic p- and the m phase
and the cubic indiv.es determined. To within 20 this was found to be
the pole of a [339 f-3 plane.
The final observation of the lenticular martensite concerns the
observation. of twin related plates. Figure 4.8 c,b,o, show respectively
the diffraction pattern and two dark fields taken from the same region.
Figure 4.8.0t was taken using reflection 1 and 4.86 with reflection 2.
Figure 4.8d, the key to the pattern shows that there are in fact two
patterns, both having a common [1011lm plane, and the initial impression
is that they are ,twin related (hence the matrix and twin notation).
Careful examination of the diffraction pattern shows that they are not
perfectly twin related, but that a rotation of about 3° about the zone
axis has also occurred. One further point is that i10111 m twins
within the plates, reported in several titanium martensites, were not
observed in these alloys.
4.6 Alloys Quenched from the (m ±L3 ) Region
Very: little need to be said in addition about alloys quenched from this
region. As stated above the lenticular martensite was exclusively found,
and the microstructure simply showed this martensite and the a phase.
It was found that the (4 around the transformed p had a similar but not MM.
so dense array of dislocations of the as <1120> type, due presumably 6
to the transformation stresses. This dense array did not penetrate far
into the untransformed m.
56
4.7 The Possible Peritectoid Reaction (=2 + 13)-4 m
The possibility of such a reaction occurring was checked by ageing at
successively higher temperatures, and examining the microstructure of
alloys in this region both by light and electron metallography. At
all times it was found that there was a region of disorderedok between.
the ( ) and (a2 -1-(r) phase fields shown on figure 4.1.
4.8 Alloys Containing the y Phase
Alloys containing greater than 40 at % aluminium were found to have a
two phase structure as shown typically in figure 4.10. These two
phases were identified by electron and x-ray diffraction as being
(depending upon the ageing temperature) either m or =2 and the yphase
based on the compound TiAl. The morphology of the precipitate was not
affected by the degree of order in the hexagonal phase at the ageing
temperature (figure 4.10b and c). At all times the ywas found to be
fully ordered having the Llo (CuAu )structure. No APB's were seen in
the yphase and hence each plate must be a single domain. The
precipitate has.two variants about the [1111 twin plane (figure 4.11)
and A definite orientation relationship was found ie
(0001) cc/Al [111! y
<1120>oc //el <101> y
The habit plane was found to be the (0002) =plane.
The precipitate is partially coherent with the matrix and figure 4.12
shows the interface between =2 and y phases. In the case of the Moire
fringe contrast the interface has been imaged with g = 1120. Hence the
fringes are due to [11201 and [110! plane mismatch.
The lattice parameters of a 40.5 atomic per cent aluminium alloy were
measured by x-ray diffraction. The results of this are given in table
4.1. Using the d value obtained for the [1170! plane, the d for f110
The observed mismatch would correspond to a necessity for as <1120> 6-
dislocations to occur about every 220Ao. At times, the observed
planes was calculated using the formula 42
X = {d1120 d110 - 4.1
d110 d1120
Where X = the measured Moire fringe periodicity. This gave for
X = 160.5A° a value of d110 = 2.83A° which compares well with the
value obtained by x-ray diffraction.
As can be seen from the x-ray figures there is an expansion of about
0.69% along the c axis, together with a contraction along the close
packed directions of 0.969/for <1170> Pel<101> and 1.5% for <1170>//el 0
<110>. In all cases the mismatch is small, and the interface would be
expected to be semicoherent.
5'7
dislocation spacing is between 200 and 250A°, but at others, complex
dislocation arrays were observed at the interface. In some instances
the boundary between the two phases has been found to have lengths of
...1000A° in which no dislocations could be imaged. The dislocations
considered here were, as far as could be ascertained, of the type as 6
<1120> . Despite the important role played by the splitting of these
dislocations into partials in the formation of they plates, and the
low stacking fault energy as shown below, partial dislocations were
. not imaged at the interface of perfect y platelets.
The morphology seen in figure 4.10 develops extremely rapidly at high
temperatures. For example a 42.5 atomic % alloy aged at 1200°C for 15
minutes shows a well developed lamella structure. In order to follow
the initial precipitation of the y therefore, ageing treatments at
lower temperatures were tried. In practice 800°C was found to give a
reasonably rapid but controllable precipitation rate. Further since
the 40 atomic % alloy could be quenched from the all cc or allm 2 phase
58
fields into the cc2 +yphase field, this was the alloy which was
principally studied, and further comments refer to this alloy.
The precipitation rate of the y alters with temperature as follows
(see figure 4.13). At low temperature (below--650°0) the reaction.
is extremely sluggish, very few faults occurring even after prolonged
( >50 hours) heat treatments. Above this temperature the process
speeds up tremendously but rather than thin plates forming dense arrays
of stacking faults are seen. These form rapidly as shown in figure 4.14
showing a 40 atomic % alloy quenched from 1150°C and aged for (a) 5
hours (b) 1 hour and (c) 2 hour at 800°C. (Figure 4.11 is a diffraction
pattern taken from a sample as in 4.14 (a) and typical intense streaking
perpendicular to the basal plane due to the faulting is seen). The
faults do not grow together or coalesce to form unfaulted plates with
longer ageing times.
Above-.950°C rather than this dense array of, faults, thin perfect
plates of yare seen, and as the temperature is raised the width of the
plates increases.
. A point discussed in Chapter 5 is that when quenched directly to room
temperature and examined no faulting was observed whereas with slow
cooling some faulting was seen.
The faults are of the type as < 1010> , and from short time ageing it 6
could be seen that they nucleate preferentially at subgrain boundaries
and to a limited extent from grain boundaries. They also occur by the
splitting of the unit dislocations in the grains (figure 4.15).
59
Each group of faults was found to be made up of faults all having
the same specific as <10.50> fault vector. This is demonstrated in 6
figure 4.17, where figure 4.16a is taken with full 0001 zone pattern,
showing all the faults. Figure 4.16b however is taken with a two beam
condition with g = 1120. As can be seen one set of faults has
disappeared effectively. The g.b criteria for g = 1120 with the three
as< 1010> dislocation vectors shows, that two will be visible and one 6 invisible. Thus all the faults in this one bundle must be of the same
type. Another noticeable effect in the bundles was an alternate wide-
narrow spacing is seen between them in the basal plane.
Specimens containing y plates were aged at temperatures above the oc+ y
transus, for short periods in order to observe the reversion behaviour.
In these it was found that reversion tended to occur by the plates
shrinking back, and the broad edges of the plates had a characteristically
ragged appearance, figure 4.17. In a few cases however networks of
as <1120> dislocations were found lying in the basal plane as in 6 figure 4.18. An-analysis of these faults is difficult owing to the
necessity of obtaining a foil with an L0001] foil normal. Only with
this orientation is a complete analysis possible. Such an analysis is
shown in figures 4.19 and 4.20 for the network shown in figure 4.19,
and a diagram of the net in figure 4.21. Note the symmetry of the
network and the identical radii of curvature of all the nodes.
From these nodes, the fault energy of the as <1010> faults,y1010, 6-
can be calculated, and from the straight segments a measurement of the
as <115D> fault energy y 1120, estimated. For the calculation of y1010 6 the equation due to Friedel 57 has been employed ie
y = Gb2 lnR / - (4.2)
60
Where G = the shear modulus
b = the Burgers vector
R = 1'adius of the node
E = cut off radills = b
A value for the shear modulus of Ti3 Al is not available, and hence the
value for pure titanium, G = 3.5 x 10¹¹ dynes will be assumed. The
other assumed value is that of the cut off radius E., which will be put
equal to the value ofT s <1010> dislocation Burgers vector (1.7A°')..
The radius of the nodes was measured from an enlarged print,at a total
magnification of 166,500 times and an average value of 1,336A° (-1---50e)
was obtained. No correction for projection effects is necessary since
the net was imaged with the basal plane parallel to the photographic
plate. Using these values a value of y 1010 equal to 7.27 ergsAm2 was
obtained.
The inaccuracies in this determination are discussed in the next chapter.
For the calculation of y 1120 the equation due to Read 58 is used ie
y 1120 = Gb2 P--a--2a col - 4.3 ( 1-a
Where b = the Burgers vector
a . Poissons ratio
d = the separation between dislocations
9 anjle_ be:I-toter, tine a-total Gmomil on and ids Again the problem arises that no value of Poissons ratio is available,
and the value for pure titanium has been applied (a = 0.361). The
value of 1120 was found to be 114 ergsAm. Note that although there
is a small separation into partials it is assumed that the stress fields
at the distances involved are equivalent to as <1120> dislocations. 6
61
.4.9 The Peritectoid Reaction cc+y-*Gc2_
In the region shaded in figure 4.1, microstructures such as those
shown in figure 4.22 are seen. This shows an apparent three phase
region ofoc+ =2 +y. Such microstructures persist even after ageing
for in excess of 50 hours and are seen right across the compositional
range from > 40 at % to 50 at % aluminium. The explanation of this
effect is discussed in the next chapter, but this together with the
evidence of the rising value of the ordering temperature are taken
as circumstantial evidence for the existence of the proposed
peritectoid.
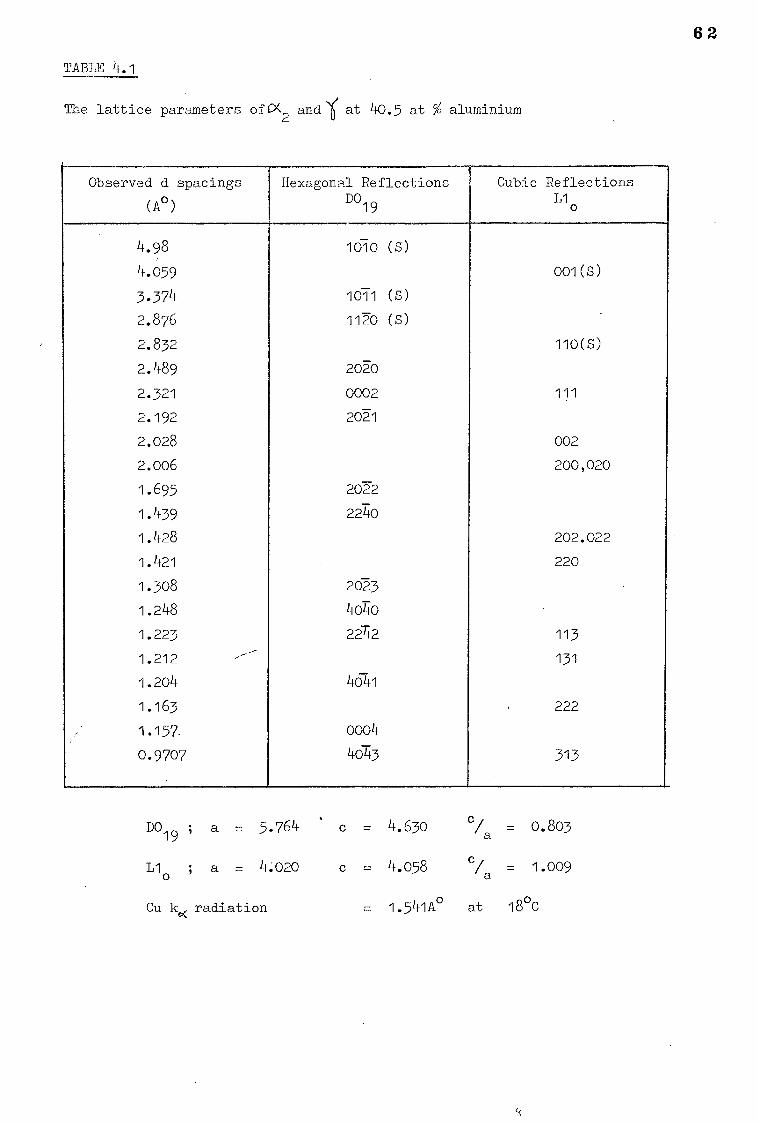
62
TABLE 4.1
The lattice parameters ofC 2 and at 40.5 at % aluminium
Observed d spacings
(e)
Hexauonal Reflections 0 DO19
Cubic Reflections L1o
4.98 10710 (s)
4.059 001(S)
3.374 1071 (s)
2.876 1170 (s)
2.832 110(S)
2.489 2020
2.321 0002 111
2.192 2021
2.028 002
2.006 200,020
1.695 2022
1.439 2240
1.428 202.022
1.421 220
1.308 2023
1.248 464o
1.223 2242 113
1.212 ---- 131
1.204 4641
1.163 222
1.157. 0004
0.9707 4643 313
DO19 ; a = 5.764 c = 4.630
C/a 0.803
Llo a = 4:020 c = 4.058 c/a 1.009
Cu k radiation = 1.541A° at 18°C 0(
ati
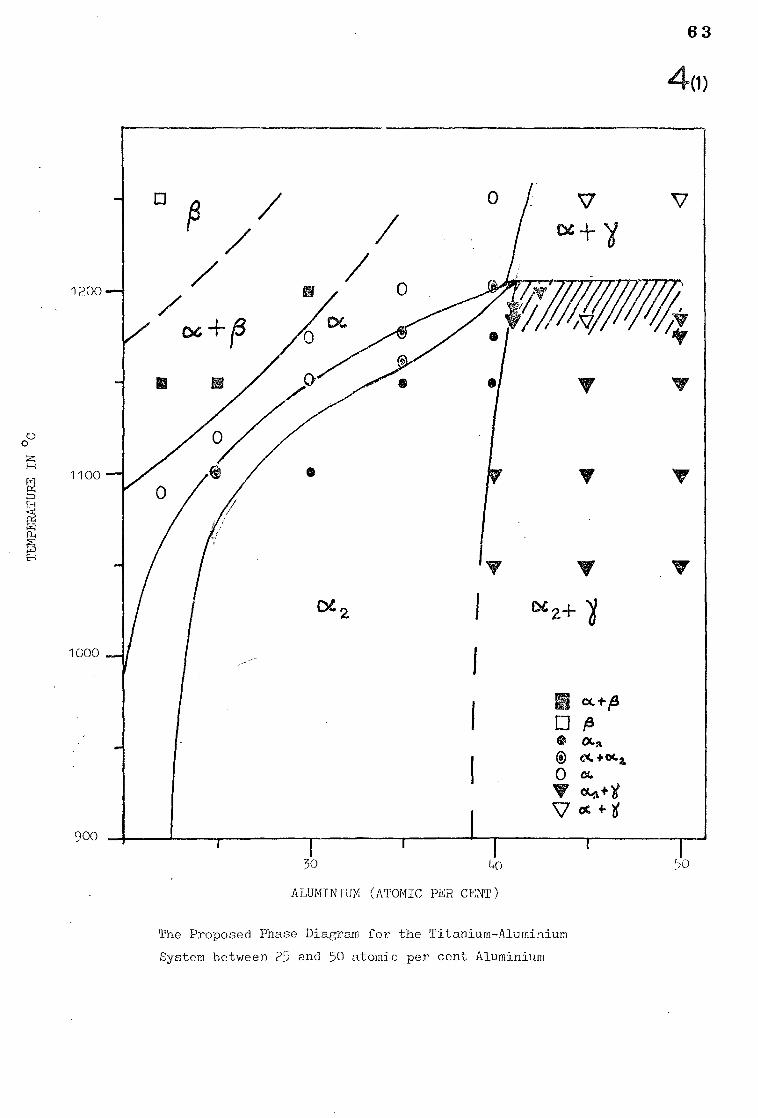
O
z H
TEM
PERA
TURE
63
4w
30
4c)
50
ALUMINIUM (ATOMIC PER CENT)
The Proposed Phase Diagram for the Titanium-Aluminium
System between 25 and 50 atomic per cent Aluminium
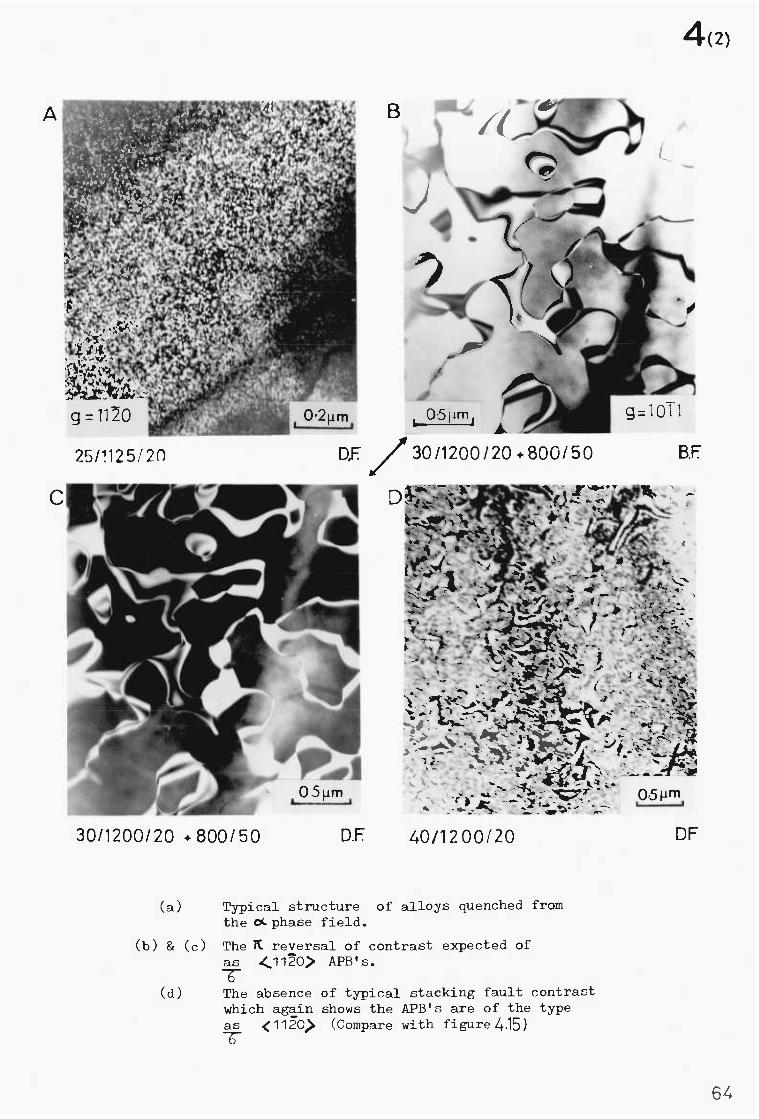
0.2pm
D,F: /30/1200/20 +800/50 25/1125/21) 13.F
30/1200/20 +800/50
05pm
D.F.
4(2)
D3;4„- i. t1;4 10','N. ..,. - ) • • i . +, •
ir4- 4 A . .4 ."4-
e \-....‘' ,.., 00* .. 1, asir ir- - - ...,--7 4 • ••••: 11,& r
1•‘:- lk , +4 1 N 0. . 't . L j,e; .46 it . ' 1 4 4 , , s ?, .3. .'4.,
ir i 4, - -I. . b.'. ,,,a. - 1 • ■ •)-- — •-.4 is•-& ' T • . •• ... _ \
,
r — 1- • 'i - _ . -.i ........ • 4.s., .• ''.
... 3 ,... -
:"1-.1:1.- '"%■•:::%"7"--3P-''". , 1. • 9 •
- ,
.;.-...0. ■;:.N.P.IL-13- r ,.. ' - . - :•• a , ..,t ,......„
. N. ...7 1 , ' • ' ...,
1. N. .. . .. %-• 1.4 :. .. 4 - . :Izr?' ' 0511m -• -_-*--- - .... "'..i.:
40/1200/20 DF
(a) Typical structure of alloys quenched from the at-phase field.
(b) & (c) The lt reversal of contrast expected of as <1170> APB's.
(d) The absence of typical stacking fault contrast which again shows the APB's are of the type as <1120> (Compare with figure4.15)
64
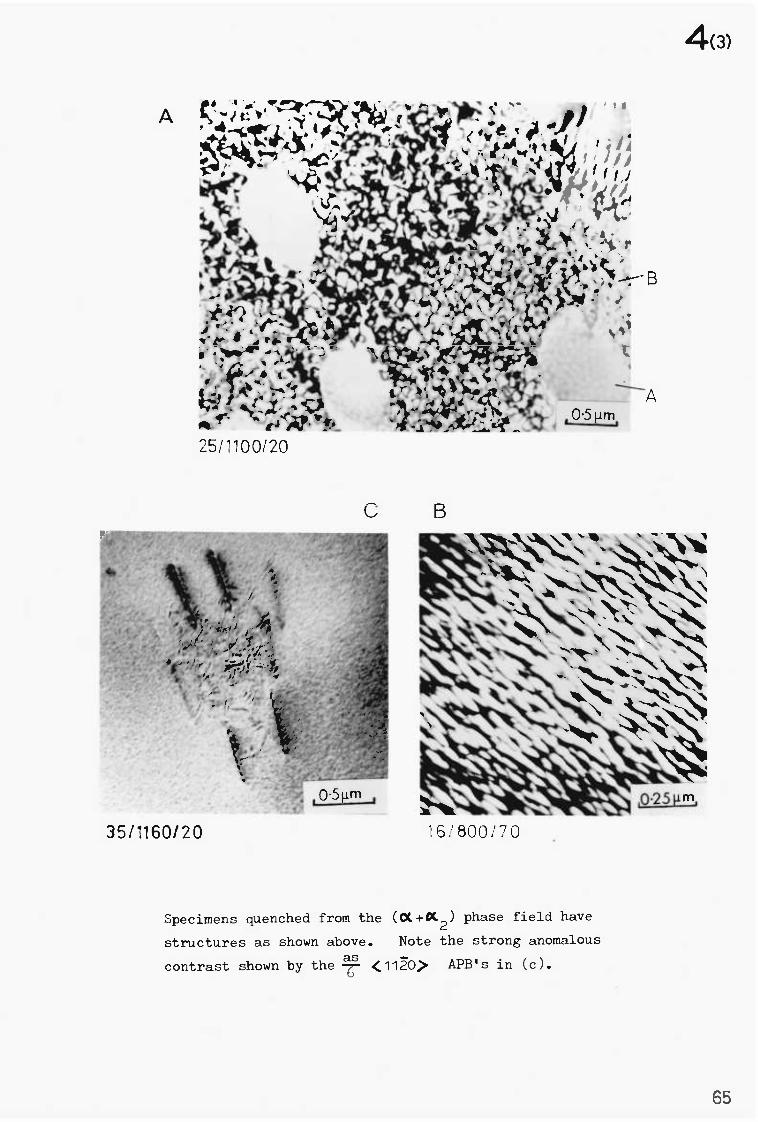
• 0-• maw- 7 . • -..
--Z-N4aitka kb • - • " I
• e'.A1 Air'%4 it I • -
• '
4i3 'k* .44 4/L1.. sit cji
/14
25/1100/20
1.1 04 440
■• .4t*,&7 -
411 4t
'31.. ■At , I.NeA Ay` ,-TOlk4
itt • 4.r.
0.5 µm
,
'
35/1160/20
B
NISK 16.'800/70
4(3)
Specimens quenched from the (CX+0C2) phase field have
structures as shown above. Note the strong anomalous as contrast shown by the 7 <1170> APB's in (c).
65
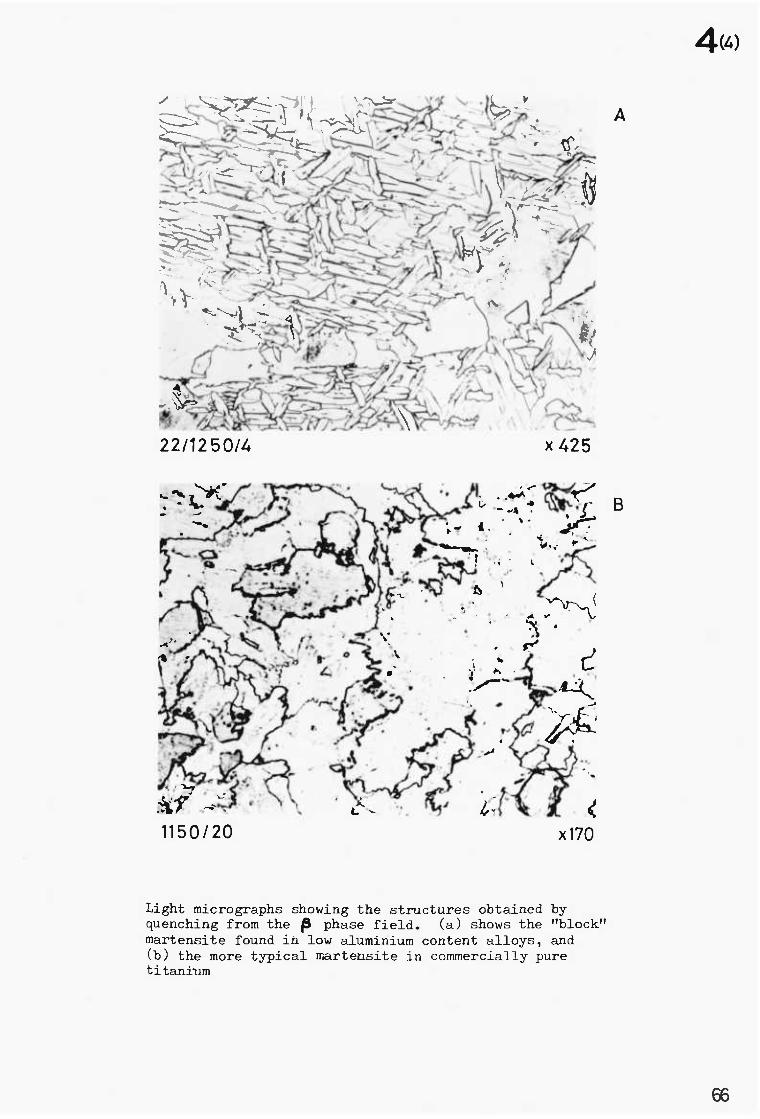
4(4)
A
Light micrographs showing the structures obtained by quenching from the fit phase field. (a) shows the "block" martensite found in low aluminium content alloys, and (b) the more typical martensite in commercially pure titanium
66
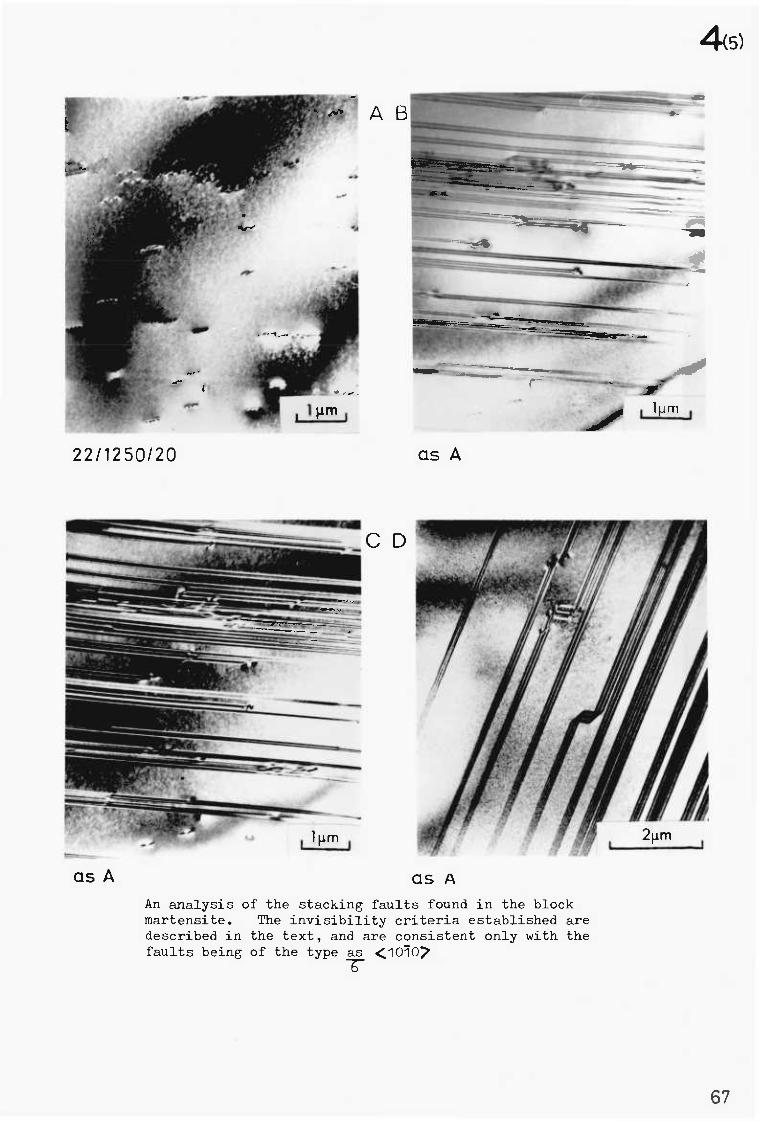
4,;,,,stramosasinixamingnava.
C D
---="■•••• •
111M
45)
22/1250/20 as A
as A aS A
An analysis of the stacking faults found in the block martensite. The invisibility criteria established are described in the text, and are consistent only with the faults being of the type as <1070?
67
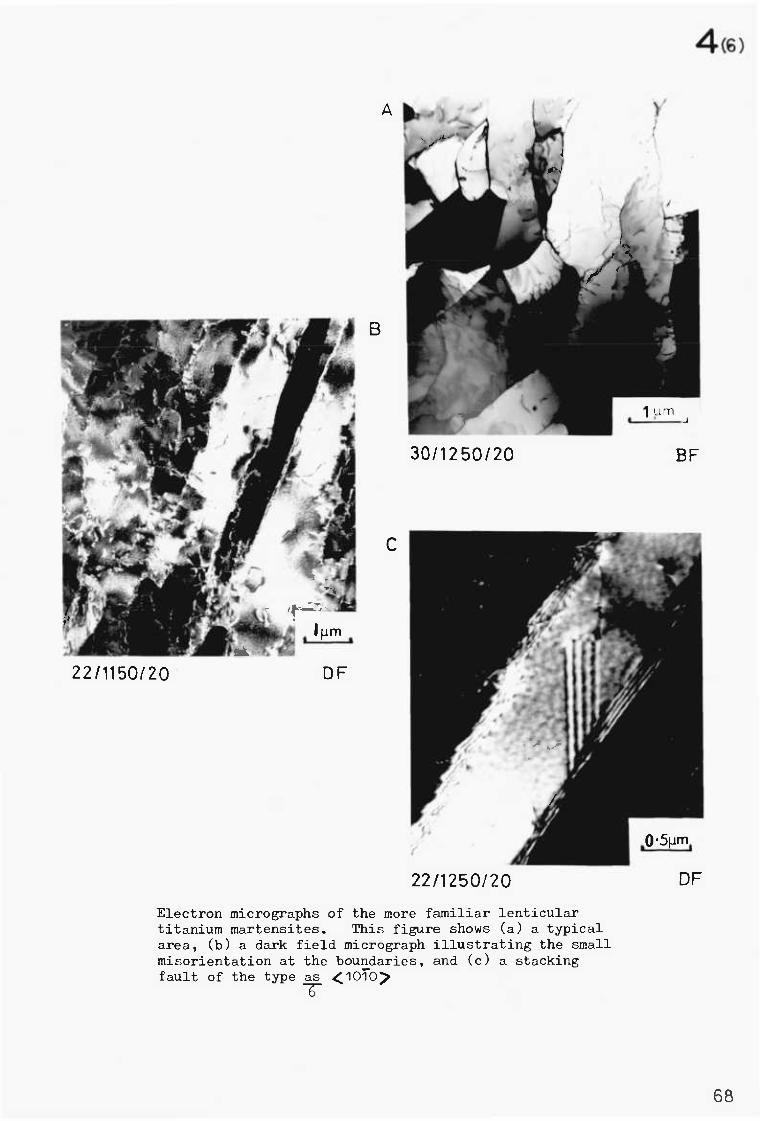
11111/1aw 30/1250/20 BF
DF 22/1150/20
A 0,
DF 22/1250/20 Electron micrographs of the more familiar lenticular titanium martensites. This figure shows (a) a typical area, (b) a dark field micrograph illustrating the small misorientation at the boundaries, and (c) a stacking fault of the type as <1010,
68
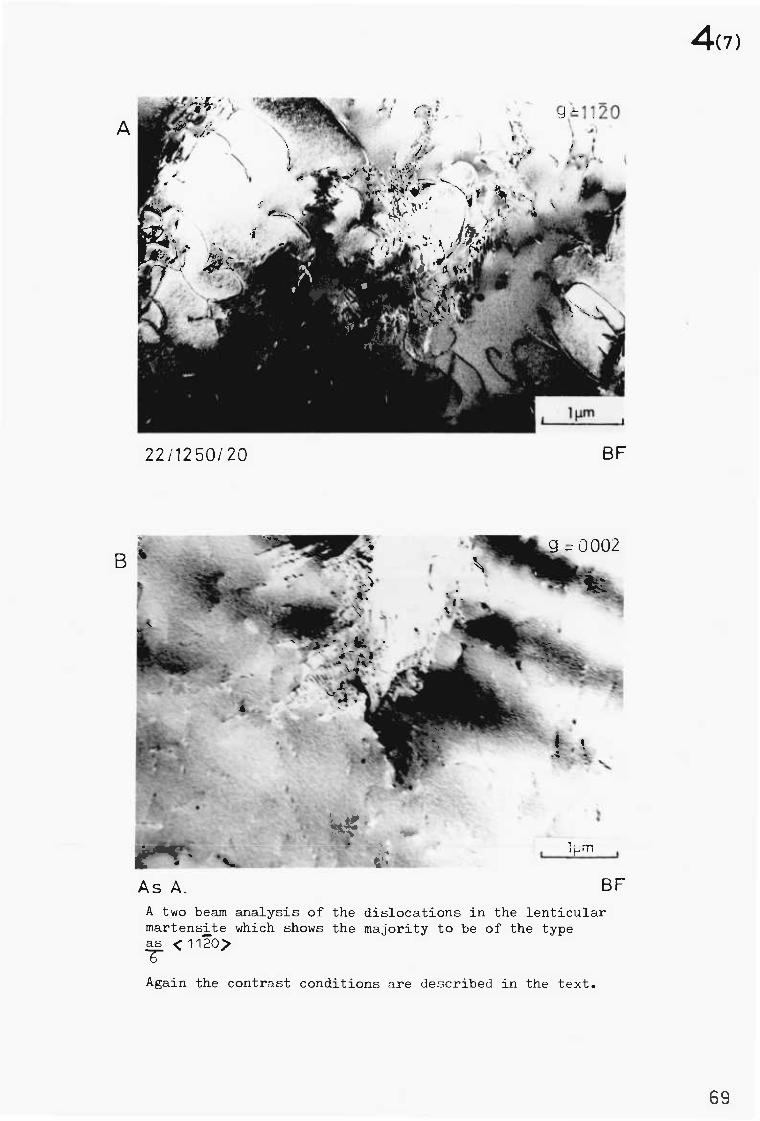
4(7)
22 /1250/ 20
BF
iwo
As A.
BF A two beam analysis of the dislocations in the lenticular martensite which shows the majority to be of the type as <1120>
Again the contrast conditions are described in the text.
69
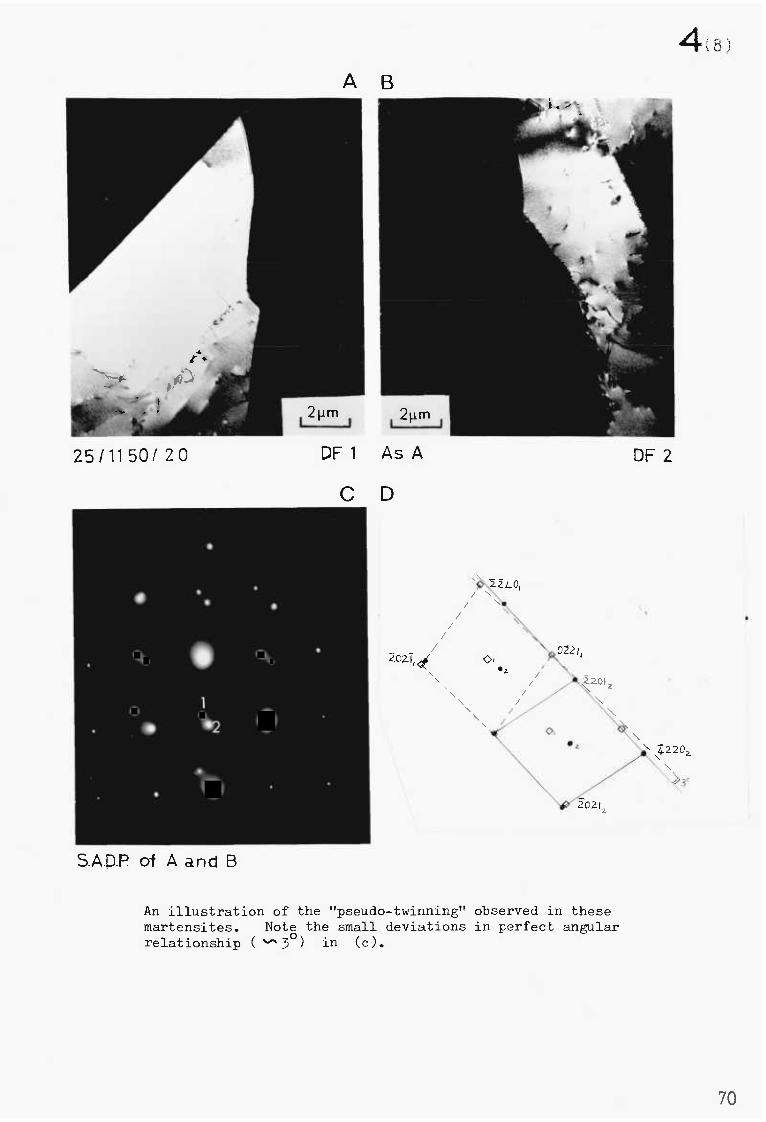
•• • •
• • • •
zoz%!
A B
25/1150/ 20 DF 1 As A DF 2
C D
S.A.P.P. of A and B
An illustration of the "pseudo-twinning" observed in these martensites. Note the small deviations in perfect angular relationship ( `-^ 3°) in (c).
70
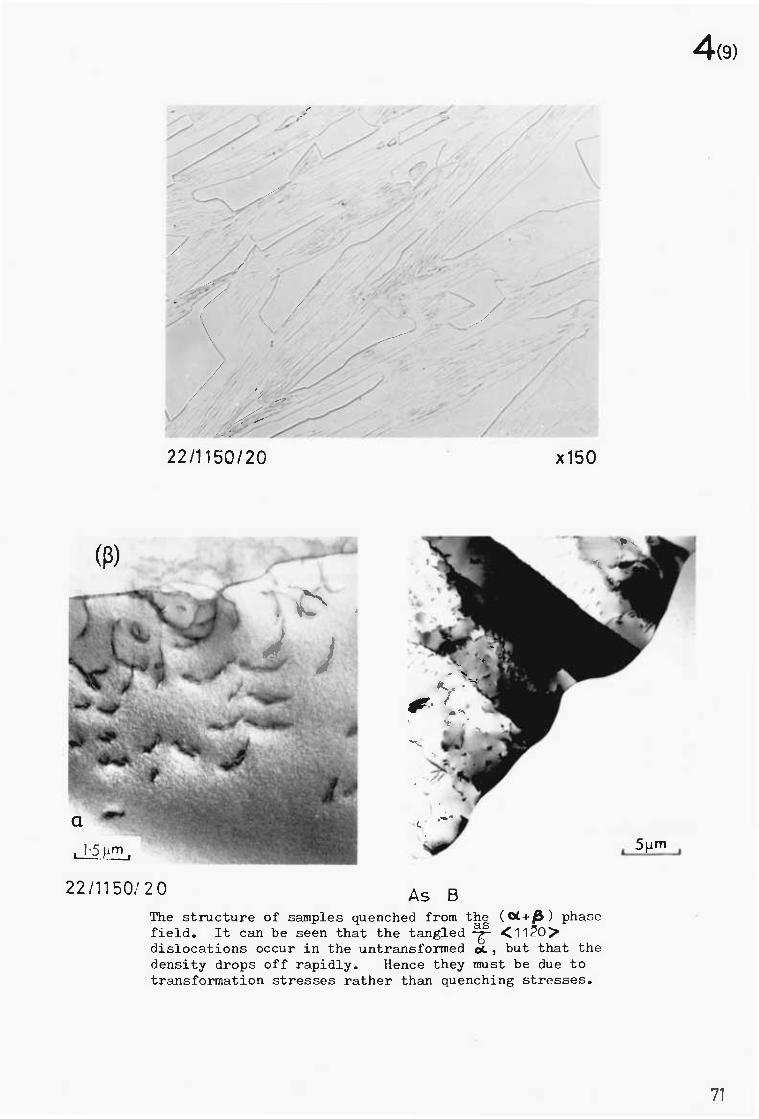
(13)
a 15 urn
22/1150/20
5pm
4(9)
22/1150/20 x150
As B The structure of samples quenched from the (C441) phase field. It can be seen that the tangled <11a)). dislocations occur in the untransformed oc, but that the density drops off rapidly. Hence they must be due to transformation stresses rather than quenching stresses.
71
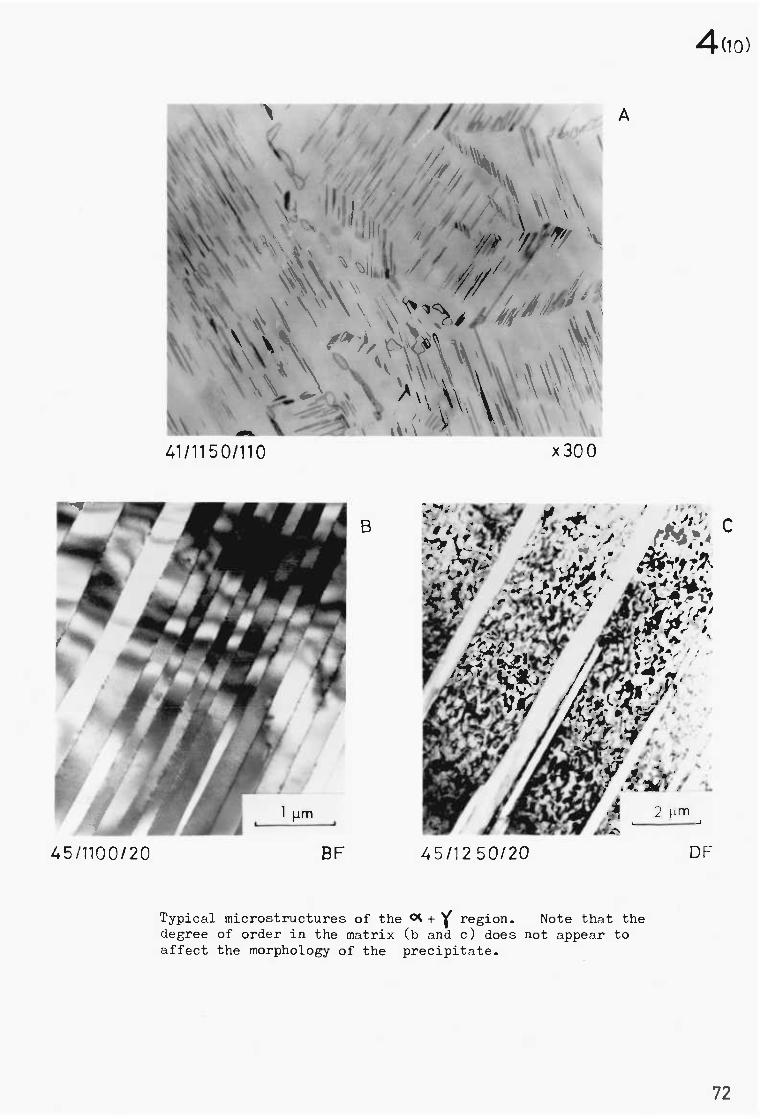
C
4(10)
A
41/1150/110
x300
45/1100/20
BF
45/12 50/20
DF
Typical microstructures of the ot + y region. Note that the degree of order in the matrix (b and c) does not appear to affect the morphology of the precipitate.
72
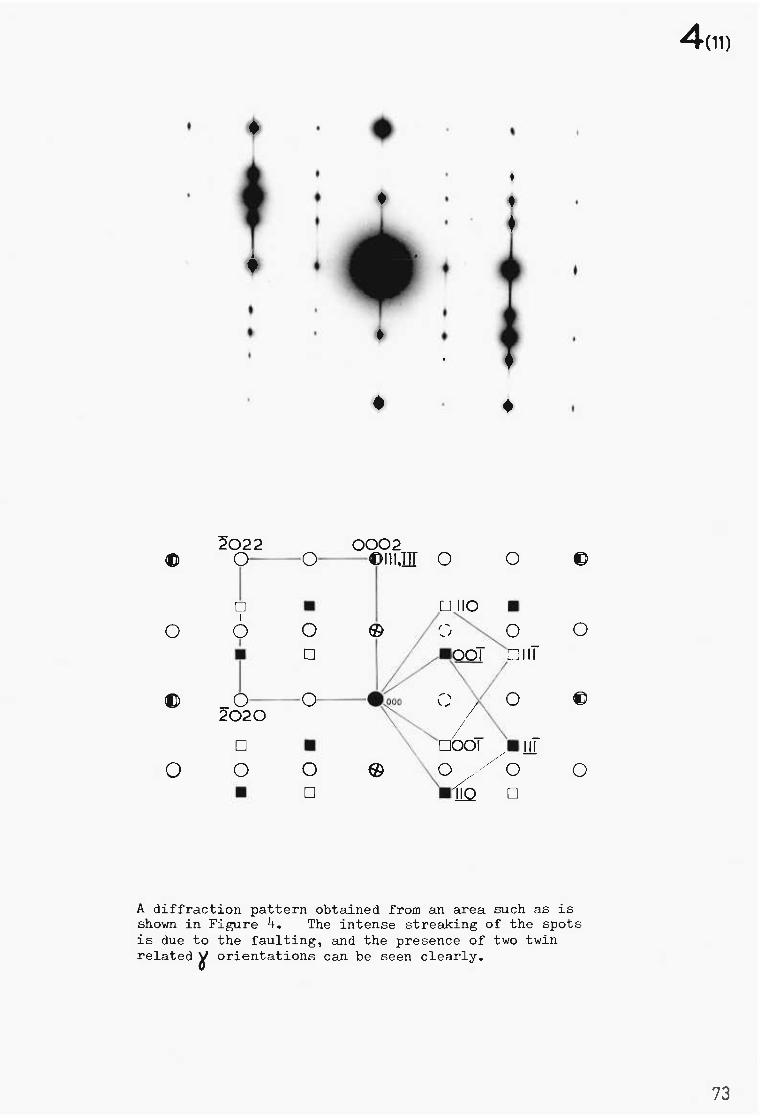
0 0 V / pooT •
/ Ili
0 - 0 0 • llQ L
4(11)
• •
•
•
•
• •
2022
O
2020 E •
O 0 0 • ❑
0002 Ftli,IfT 0 OID 0
❑ • 0 0 • 0
0 0
A diffraction pattern obtained from an area such as is shown in Figure 4. The intense streaking of the spots is due to the faulting, and the presence of two twin related)/ orientations can be seen clearly.
73
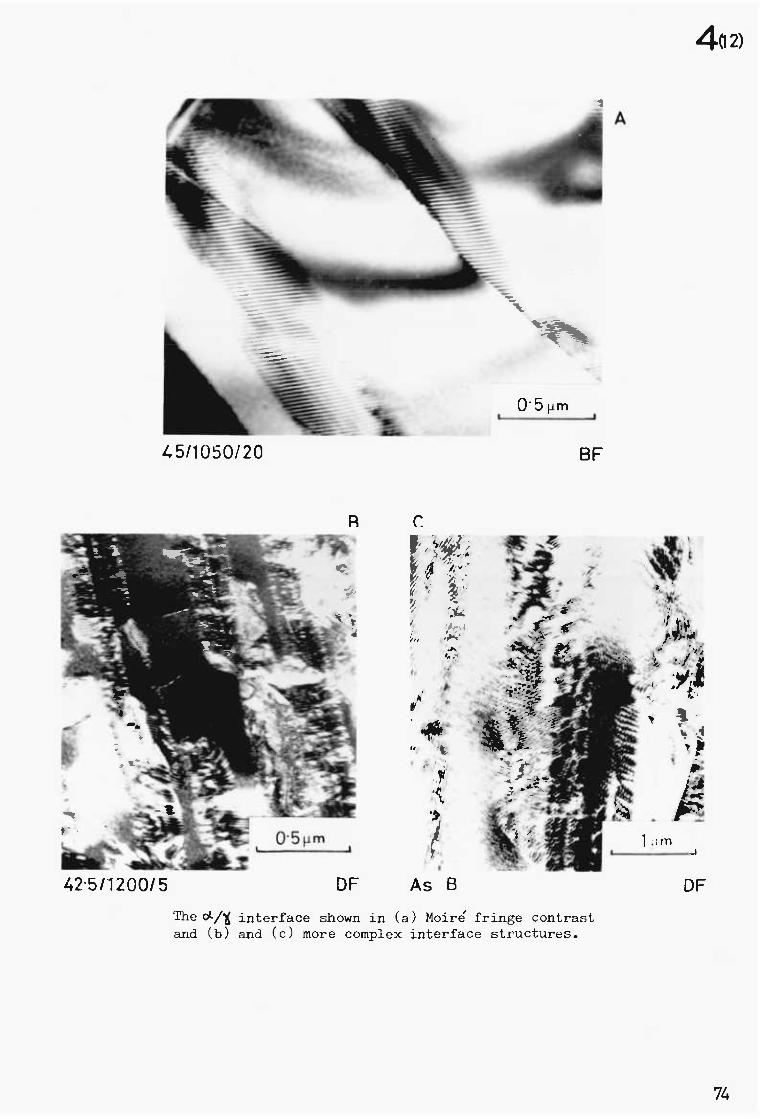
45/1050/20 BF
0.5pm
402)
42.5/1200/5
DF As B
DF
The otA interface shown in (a) Moire fringe contrast and (b) and (c) more complex interface structures.
74
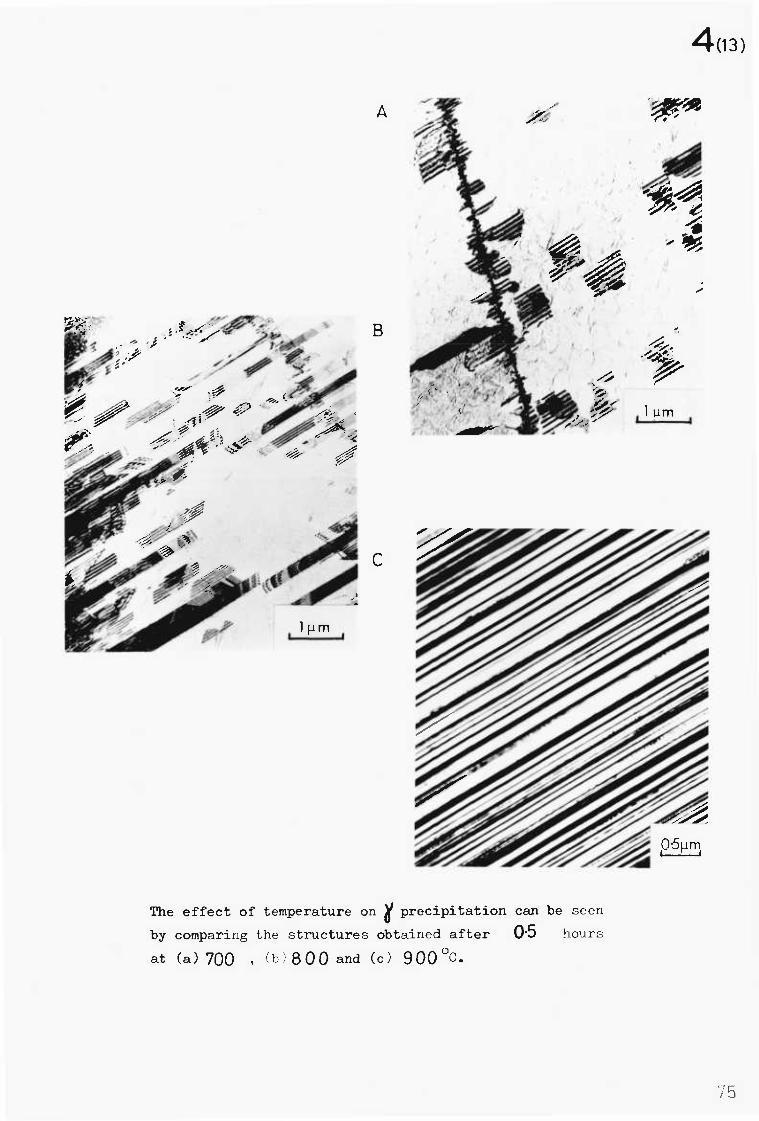
•
1µm
4(13)
The effect of temperature on it precipitation can be seen by comparing the structures obtained after 0.5 hours
at (a) 700 , (b) 800 and (c) 900°C.
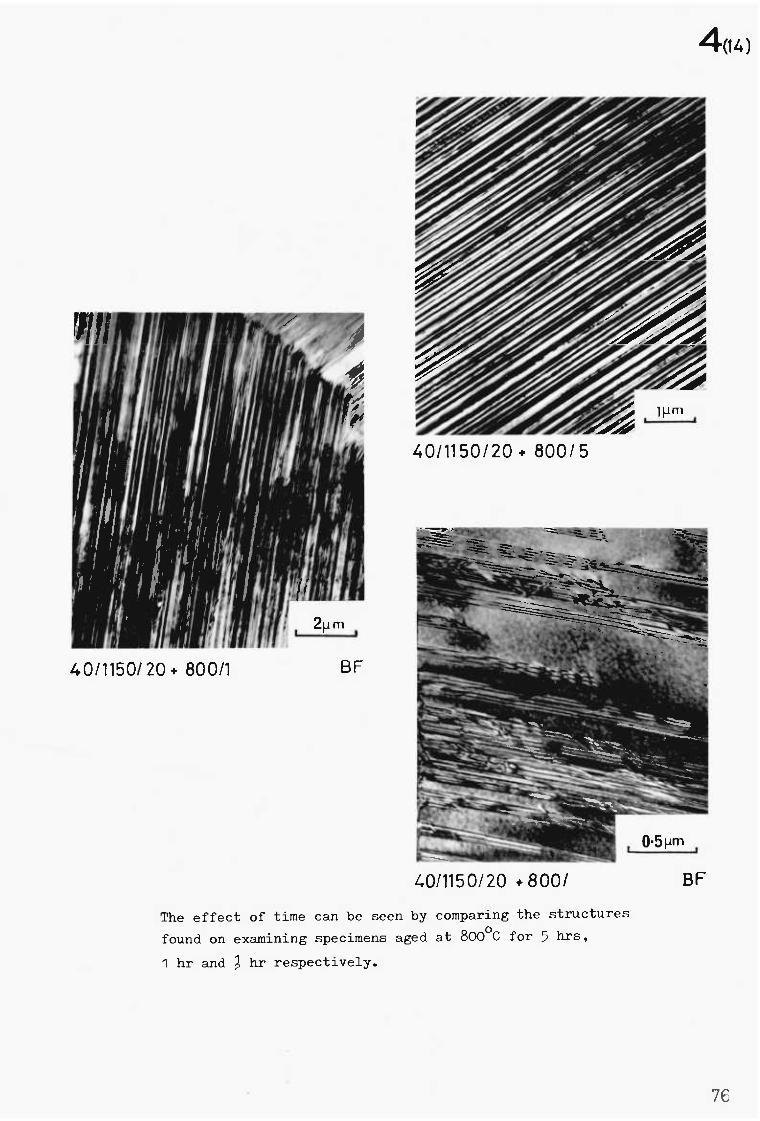
211 m
BF 40/1150/20 + 800/1
BF 40/1150/20 + 800/
0.5[1m
40/1150/20 + 800/5
4(14)
The effect of time can be seen by comparing the structures
found on examining specimens aged at 800°C for 5 hrs,
1 hr and - hr respectively.
76
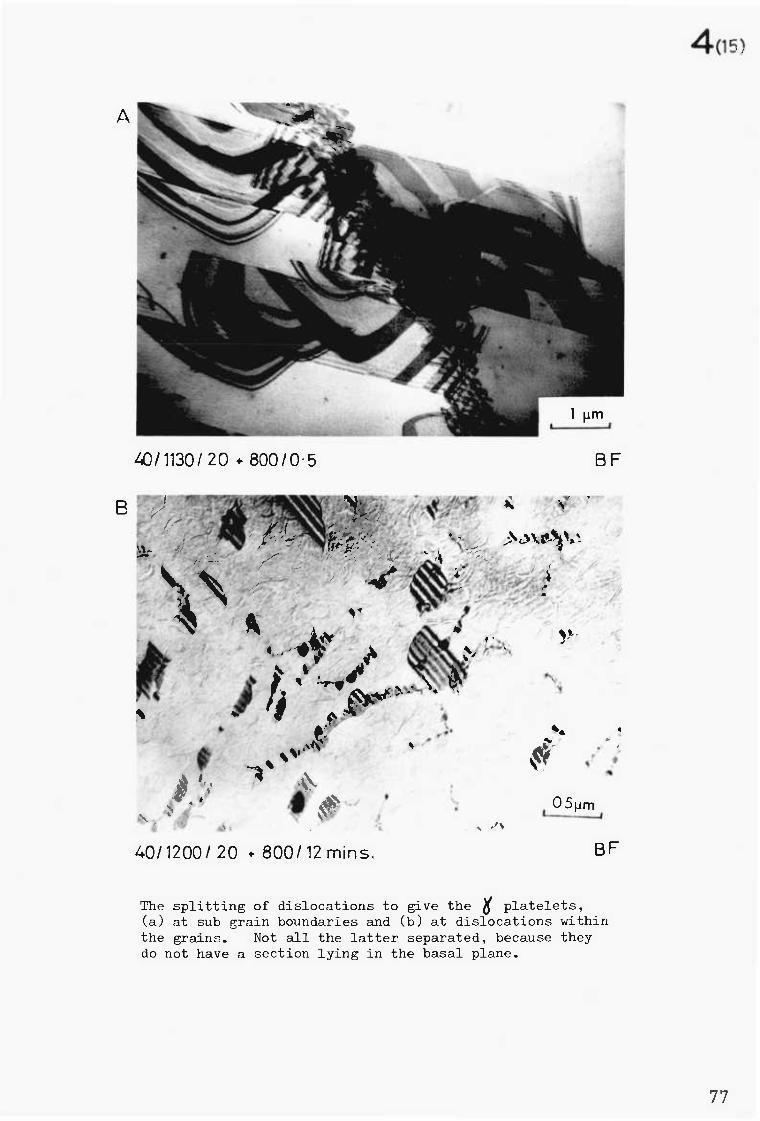
40/1130/ 20 4. 800/0.5 BF
•
•
40/1200/20 * 800/12 mins.
y,.
♦,
0 5 M
BF
The splitting of dislocations to give the g platelets, (a) at sub grain boundaries and (b) at dislocations within the grains. Not all the latter separated, because they do not have a section lying in the basal plane.
) ;
77
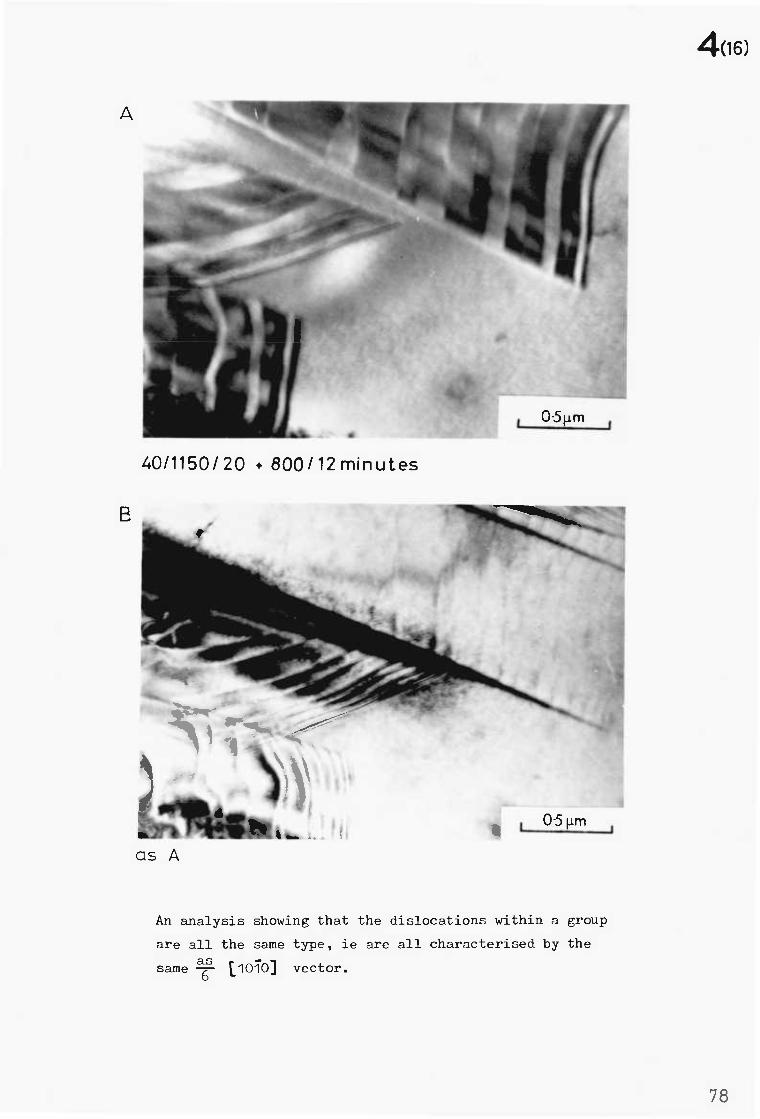
05µm a
41
40/1150/20 4. 800/12minutes
4(16)
An analysis showing that the dislocations within a group
are all the same type, ie are all characterised by the
same [1010] vector.
78
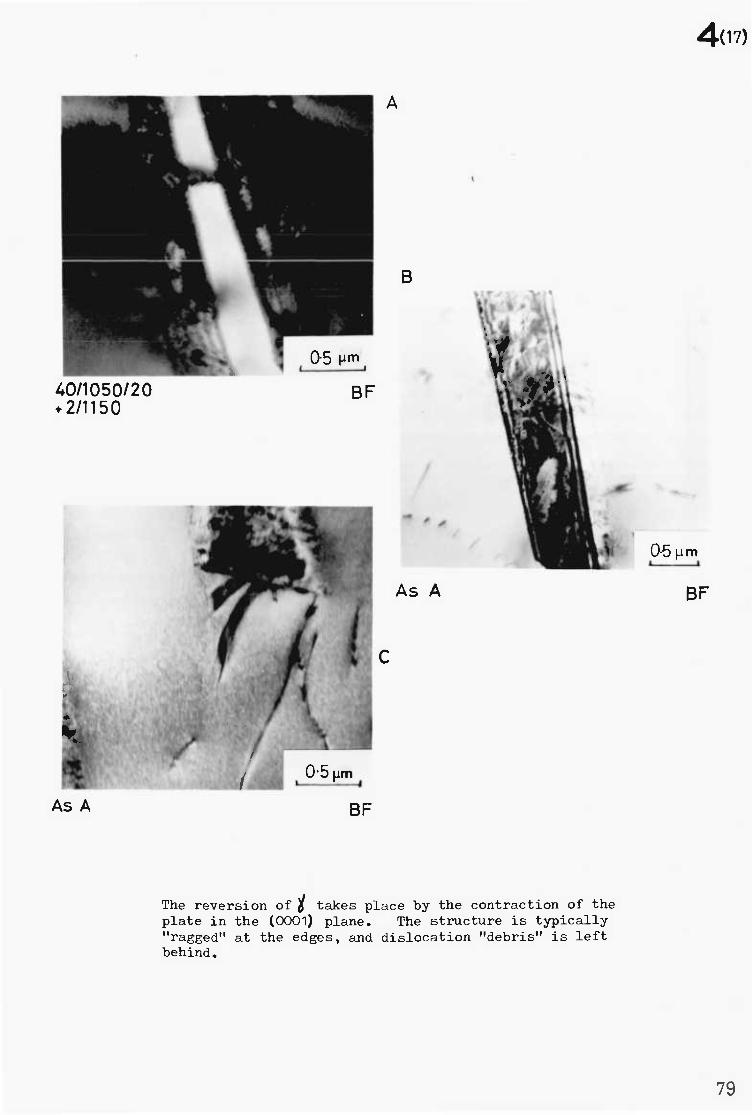
40/1050/20 +2/1150
B
AK
0-5µm
As A BF
BF
4(17)
/ 0.5µm
As A BF
The reversion of i takes place by the contraction of the plate in the (0001) plane. The structure is typically "ragged" at the edges, and dislocation "debris" is left behind.
79
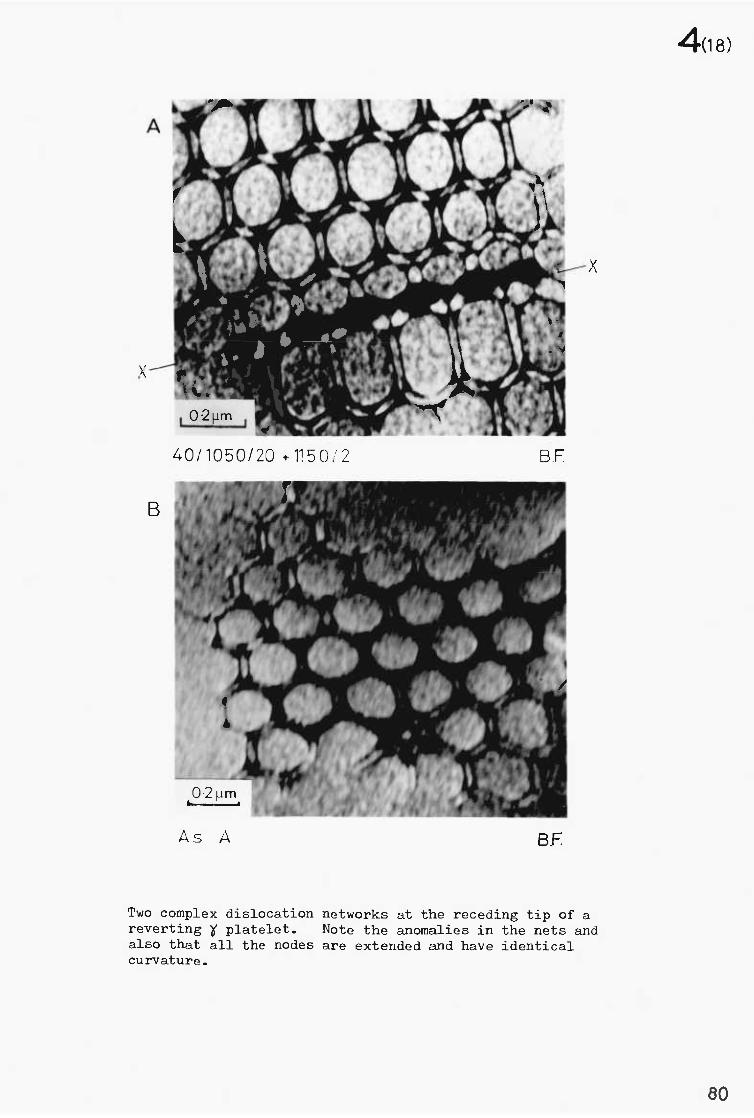
02µm
40/1050/20 +1150,17 B.F.
As A BF.
0.4m
B
4(18)
Two complex dislocation networks at the receding tip of a reverting ' platelet. Note the anomalies in the nets and also that all the nodes are extended and have identical curvature.
80
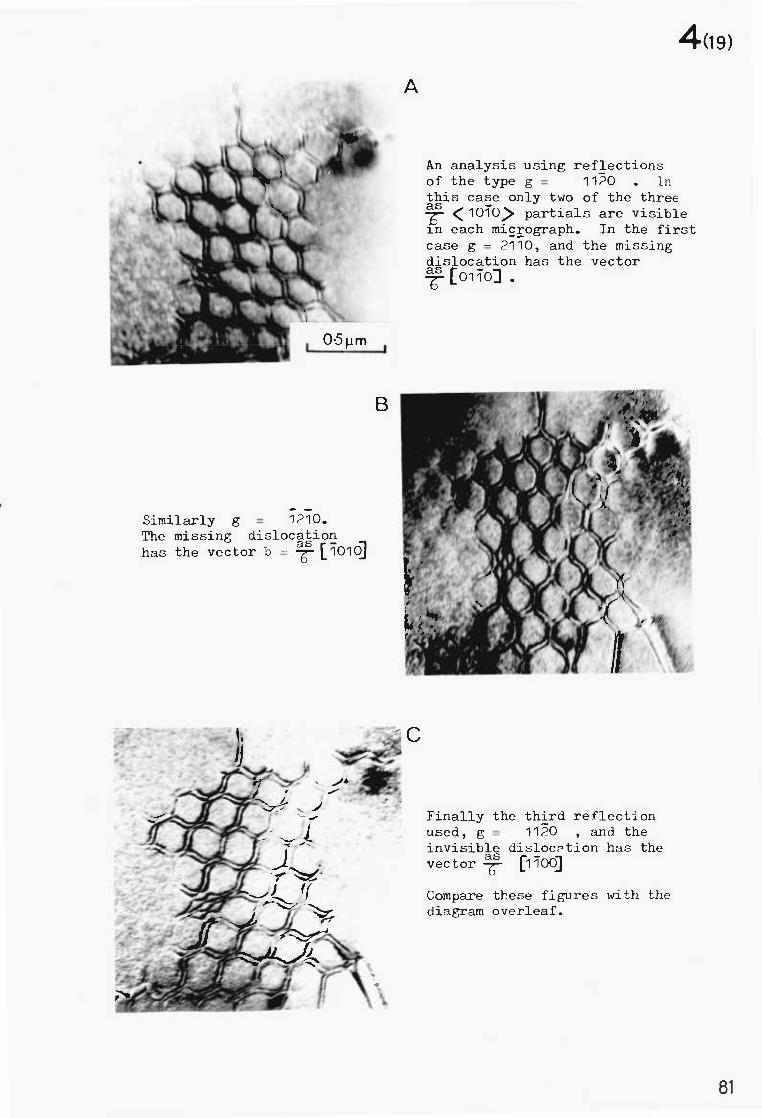
4(19)
A
An analysis using reflections of the type g = 1120 . In this case only two of the three
<1010> partials are visible In each micrograph. In the first case g = 2110, and the missing dislocation has the vector as [0150] .
Similarly g = 1210. The missing dislocation has the vector b = 7-[101C]
Finally the third reflection used, g = 1120 , and the invisible dislocation has the
r vector as LiToqj
Compare these figures with the diagram overleaf.
81
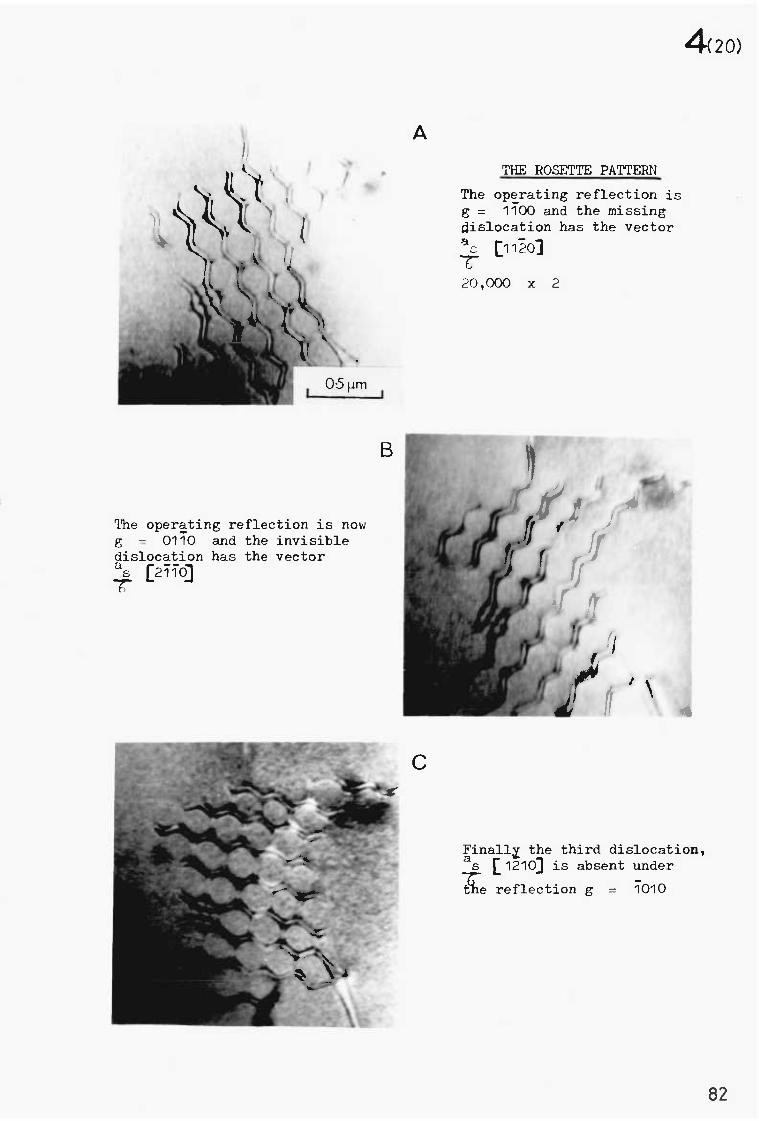
4(20)
A
THE ROSETTE PATTERN
The operating reflection is g = 1100 and the missing dislocation has the vector a [1120]
20,000 x 2
The operating reflection is now g = 0110 and the invisible dislocation has the vector as C21100 Y
B
C
Finally the third dislocation, as [1210 1210] is absent under
the reflection g = 1010
82
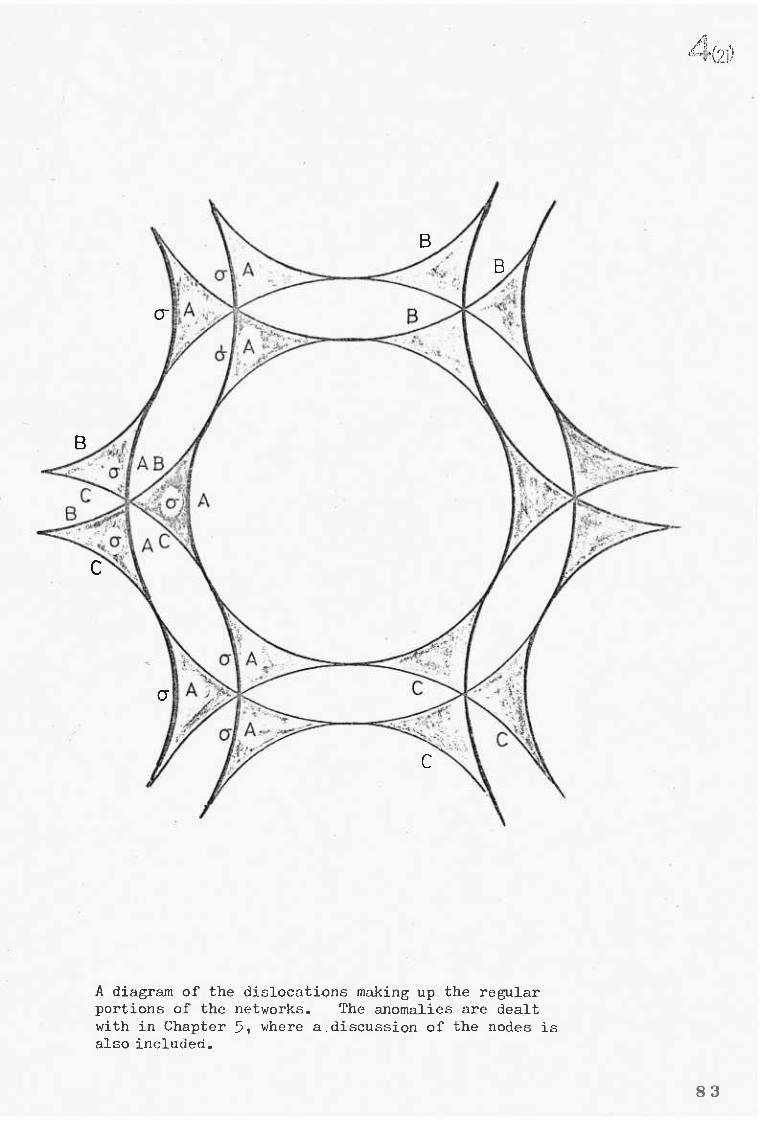
A diagram of the dislocations making up the regular portions of the networks. The anomalies are dealt with in Chapter 5, where a.discussion of the nodes is also included.
vi)
83
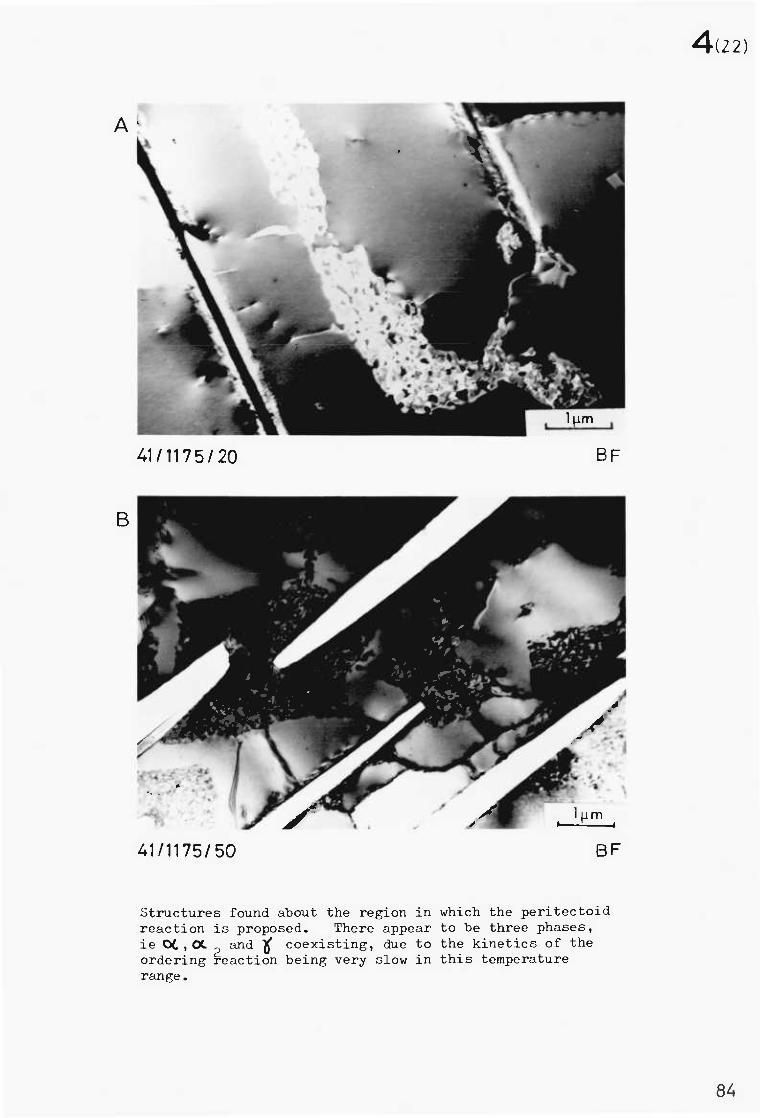
BF 41/1175/20
1µm-S
BF 41/1175/50
4(2 2)
Structures found about the region in reaction is proposed. There appear ie OC,CX and if coexisting, due to ordering reaction being very slow in range.
which the peritectoid to be three phases, the kinetics of the this temperature
84
85
CHAPTER 5
DISCUSSION
5.1 CONSIDERATION OF THE PHASE DIAGRAM
5.1.1 The Phases Observed
No evidence has been found in this study of any other phase other than the
solid solution (m), Ti3 Al (0:2) and Ti Al (y). The presence of p (the bcc
solid solution) at the annealing temperature is inferred from the observation
of martensitic min quenched samples. No p could be retained in the alloys
studied.
This is in agreement with all the most recent investigations of the system
with the exception of the work of Sato and Huang.19
Despite their claim
that a high temperature phase .5 of unspecified crystal structure existed that
could be retained on quenching, no suchiphase was detected in this study.
5.1.2 The Possibility of a Peritietoid Reaction
Because of the controversy about the possibility of a peritectoid reaction
( p-f-tx2) m occurring in this system a careful study was made in this area
of the diagram, involving both quenched and slow cooled specimens(2°C.per min fror
the annealing temperature). Before discussing the results two points must
be re-emphasised. -Firstly Crossley has shown that the two phase syndrome may
have a marked and confusing effect on microstructures observed in samples
quenched or slow cooled through the (cc-4-13 ) region. Secondly the more
indirect methods employed.in previous studies make it difficult to assess theactu
ordering temperature precisely.For example a problem with this proposed reaction
is that no crystal structure change would be involved in a peritectoid reaction
f3+m2
m and despite a variety of claims by certain investigators to be
able to distinguish by etching between m andm2
metallographically it was
found in this work not possible to make a positive distinction between the
two using various etchantS.(Those techniques that involved prolonged immersion
in strong acids should obviously be avoided as has been shown in section 2.2(2).)
The extremely rapid ordering kinetics of them2 phase would again lead to
confusion, since room temperature X-ray diffraction studies on quenched sairples
86
will give misleading indications that the sample was ordered at the
annealing temperature.
The evidence in this study24
of the system firmly supports the form of
diagram proposed by both Blackburn and Crossley21 This evidence can be
summed up as follows. Firstly electron metallography has shown that a
disordered region of m always occurs in between the (m+04) and(m+(3)phase
fields in regions where a peritectoid reaction has been proposed previously.
Secondly no evidence of the peritectoid microstructures found by other
workers has been observed. It is significant that all the works, without
exception, which propose such a diagram have used heat treatment regimes
which have been shown to give rise to gross segregation in them+ p field.
This is particularly clear in the diagram of Clark et al amd must be the
reason for the miscibility gap they claimed existed. One can in fact correlate
this gap approximately with the width of the (0=4-p) phase field.
These results also show that the diagram due to Blackburn24 is substantially
correct since the ordering temperature has found to be far in excess of the
ordering temperature proposed by Crossley21,22 and in good agreement with
the values obtained by Blackburn and other workers. (Chapter 2).
There is the alternative that the differences may be due to different impurity
levels. However this is unlikely since the modern studies have all been
performed on material of comparable impurity levels. The most likely impurity,
oxygen, is not expected to have any marked effect at the levels encountered.
As already pointed out the work of Tsujimoto and Adachi28 on the ternary system
Ti-Al-Co must be regarded with some caution since cobalt is an extremely
potent /3 stabilizer, and fractional percentages may well have a marked effect
on the phase equilibria, especially bearing in mind the narrow temperature
gap between the (m + p ) and (01c2 m) phase fields.
5.1.3 Antiphase Boundaries (APB) in Ti Al 3
In agreement with previous work on superlattices having the DO19
structure
the antiphase boundaries in this material have been found to be of the types
87
as as <1120>(thermal APB's) and -76.<1010>(formed by separation of <1120>
N 24,41 dislocations into partials).
The grown;in APB network showed no preference to lie on specific planes in the
material after extended ageing, which indicates that the APB energy in the
material is isotropic in contrast to some ordered systems where a strong
preference is shown for the APB to lie on specific planes, due to the
anisotropy of the APB energy.35 It was shown by Blackburn41
that the APB
energy calculated as a function of the number of wrong nearest neighbour
bonds created at the fault is comparable on both the (0001), the f01101 and
thef0171Iplanes. However he also showed that there are two types of101101
and 10111 plane. The type mentioned above and also a second type on .uhich
there is no nearest neighbour faulting, merely second nearest neighbour
faulting. It is therefore conceivable that these latter planes might have
been preferred, but this does not occur.
The .2 <1120> superdislocation pairs seen in these alloys are always very
tightly bound together, so much so that careful study is required to show
that they are in fact paired. This could be deduced from the high ordering
temperature of thec42 phase, itself indicative of a fairly high ordering energy.
No separation of - as
<1120> dislocations into partials was observed except in
the special case oftheliphase precipitation discussed later.
No study of APB growth in the material was made. However it was found in
confirmation of prior work24
that the sub-boundaries in the ordered material
appeared to be the site for the preferential growth of APB's leading to
morphologies as shown in this paper. The reason for this effect is obscure,
but there seem; two likely explanations. Firstly that enhanced diffusivity
in the region of the boundary enables preferential growth to take place there.
However one might expect if this were true that grain boundaries would be
better sites than subgrain boundaries but this does not appear to be so.
Alternatively the explanation might be in terms of the climb of dislocations
near the boundary, or even from networks at the boundary leads to Preferential
annihilation of some of the APB's. This would also apply to other ordered
88 systems however, and no similar effect has been reported in other alloys.
The APB's in the system could be easily imaged using anomalous contrast
(i.e.imaging with a strong fundamental spot in either bright or dark field)
when the composition deviated from stoichiometry. This is due to the
rejection of excess aluminium atoms from the growing domain to the boundary,
a tendency which would be more marked as one deviates further from
stoichiometry as was indeed observed. Evidence for such a rejection has
been obtained by Swann59 who showed that APB's at which anomalous contrast
was observed were preferred sites for the nucleation of precipitates. The
successful analysis of this anomalous contrast due to Gemperle et al,6o '
61 is
also based on the segregation of atoms to the APB producing a strain in the
lattice so that the ideal fault vector R is replaced by a new vector equal
to (R + 8) where is a small increment in R due to lattice strains.
5.1.4 The Ordering of Ti3Al
The ordering of the cc2 solid solution to Ti3Al has been shown to be first
order, as in the case of Mg3Cd,62 since there is a two phase region of
(«t-a2) between the and cc phase field. The temperature at which ordering 2
occurs, taken as the temperature of the « 4. (cc +cc) transus rises rapidly up to 2 2
about 30 atomic % aluminium and then more slowly up to the proposed peritectoid
(«+y) -. cc reaction at 1210°C. 2
This present study confirms the cursory investigation made by Blackburn ?
There are however points of divergence. The (a+ 2) region at about 25 atomic
% and upwards is much wider than in the original proposed diagram (figure 2,4)
of Blackburn24 The temperature of the (cc+cc )4cc transus also is shown in
2 2
ref.27 to be at a constant temperature as the aluminium content increases
whereas in the present case it has been shown to rise continuously. Also the
value of Tc seems at all points to be above that proposed by Blackburn by
approximately 30 to 40oC. However despite these detailed differences which can
be reasonably explained by the differences in the completeness of investigation
the general form of both diagrams is identical. It is not clear what
Blackburn's41 extension into the («2+y) region signifies, and he does
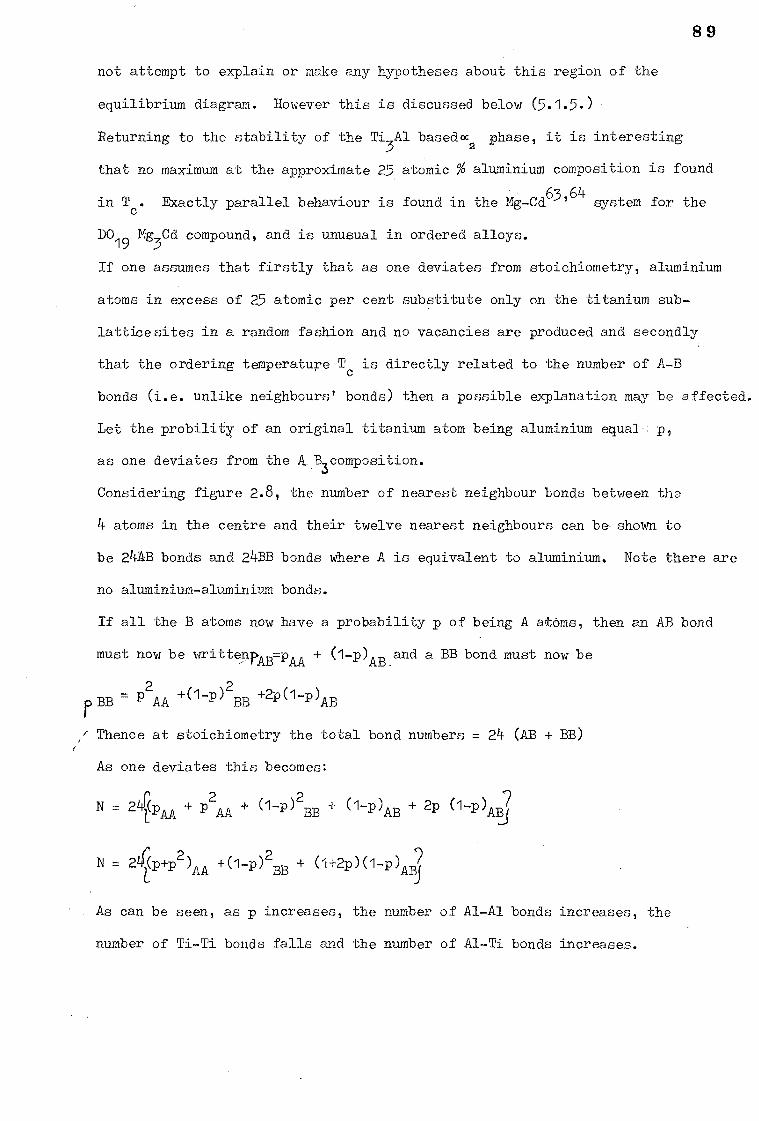
89
not attempt to explain or make any hypotheses about this region of the
equilibrium diagram. However this is discussed below (5.1.5.)
Returning to the stability of the Ti3Al based «z phase, it is interesting
that no maximum at the approximate 25 atomic % aluminium composition is found
in T. Exactly parallel behaviour is found in the Mg-Cd63,64
system for the
DO19
Mg3Cd compound, and is unusual in ordered alloys.
If one assumes that firstly that as one deviates from stoichiometry, aluminium
atoms in excess of 25 atomic per cent substitute only on the titanium sub-
lattice sites in a random fashion and no vacancies are produced and secondly
that the ordering temperature Tc is directly related to the number of A-B
bonds (i.e. unlike neighbours' bonds) then a possible explanation may be affected.
Let the probility of an original titanium atom being aluminium equal p,
as one deviates from the A. yomposition.
Considering figure 2.8, the number of nearest neighbour bonds between the
1+ atoms in the centre and their twelve nearest neighbours can be shown to
be 24AB bonds and 24BB bonds where A is equivalent to aluminium. Note there are
no aluminium-aluminium bonds.
If all the B atoms now have a probability p of being A atoms, then an AB bond
must now be writtenp-B = A PAA 2
P AA 4(1-P)2 2p(1-D P
BB - BB —)AB
if Thence at stoichiometry the total bond numbers = 24 (AB + BB)
As one deviates this becomes:
N = 2 2 -J4.13 + (1-) + p AB 2p p 2
1 AA P 2 + (1-p) AA (1-)AIN
+ (1+2p)(1-p P BB N = 4P+P2)AA 1-(1- )2 )AB7(
As can be seen, as p increases, the number of Al-Al bonds increases, the
number of Ti-Ti bonds falls and the number of Al-Ti bonds increases.
(1-p)AB_and a BB bond must now be
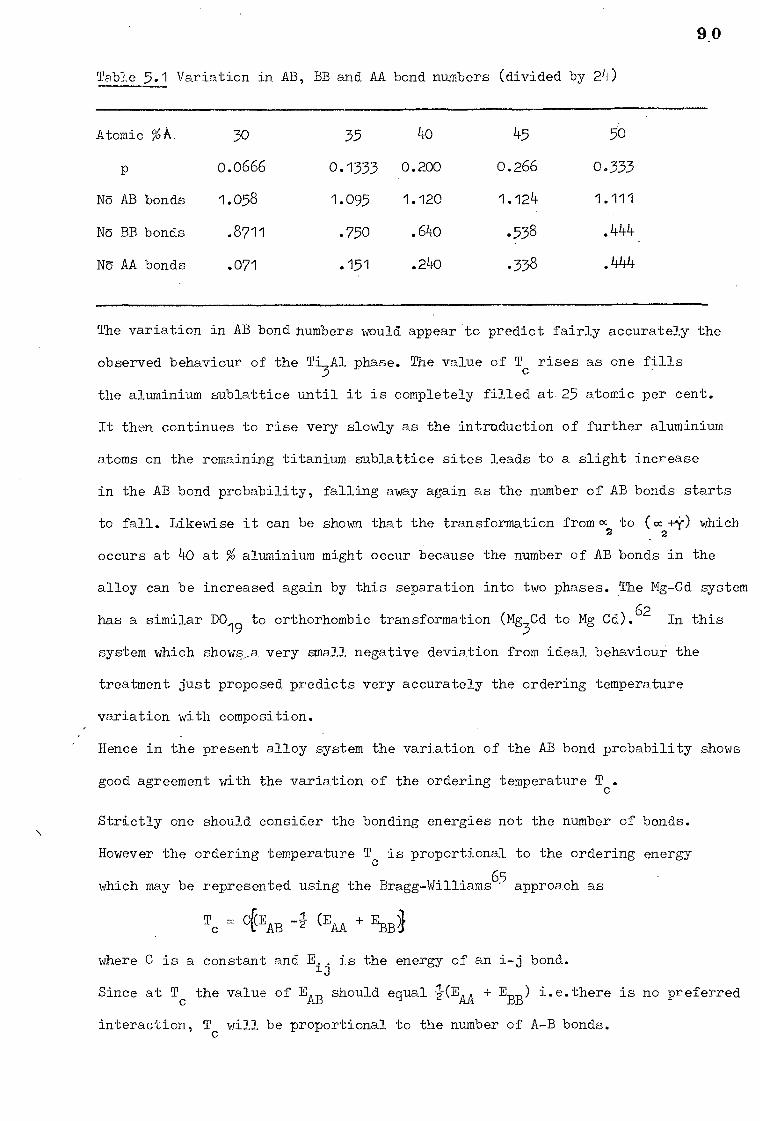
90
Table 5.1 Variation in AB, BB and AA bond numbers (divided by 24)
Atomic %A. 3o 35 4o 45 50
p 0.0666 0.1333 0.200 0.266 0.333
No AB bonds 1.058 1.095 1.120 1.124 1.111
NO BB bonds .8711 .750 .64o .538 .444
No AA bonds .071 .151 .24o .338 .444
The variation in AB bond numbers would appear to predict fairly accurately the
observed behaviour of the Ti3A1 phase. The value of Tc
rises as one fills
the aluminium sublattice until it is completely filled at. 25 atomic per cent.
It then continues to rise very slowly as the introduction of further aluminium
atoms on the remaining titanium sublattice sites leads to a slight increase
in the AB bond probability, falling away again as the number of AB bonds starts
to fall. Likewise it can be shown that the transformation from cc to (a +,0 which 2
occurs at 40 at % aluminium might occur because the number of AB bonds in the
alloy can be increased again by this separation into two phases. The Mg-Cd system
has a similar DO19
to orthorhombic transformation (Mg3Cd to Mg Cd).62 In this
system which shows_a very small negative deviation from ideal behaviour the
treatment just proposed predicts very accurately the ordering temperature
variation with composition.
Hence in the present alloy system the variation of the AB bond probability shows
good agreement with the variation of the ordering temperature T.
Strictly one should consider the bonding energies not the number of bonds.
However the ordering temperature Tc is proportional to the ordering energy
which may be represented using the Bragg-Williams65 approach as
Tc = lEAB 4 (EAA EBB))
where C is a constant and E1. is the energy of an i-j bond.
Since at Tc
the value of EAB should equal 1(EAA EBB) i.e.there is no preferred
interaction, Tc will be proportional to the number of A-B bonds.
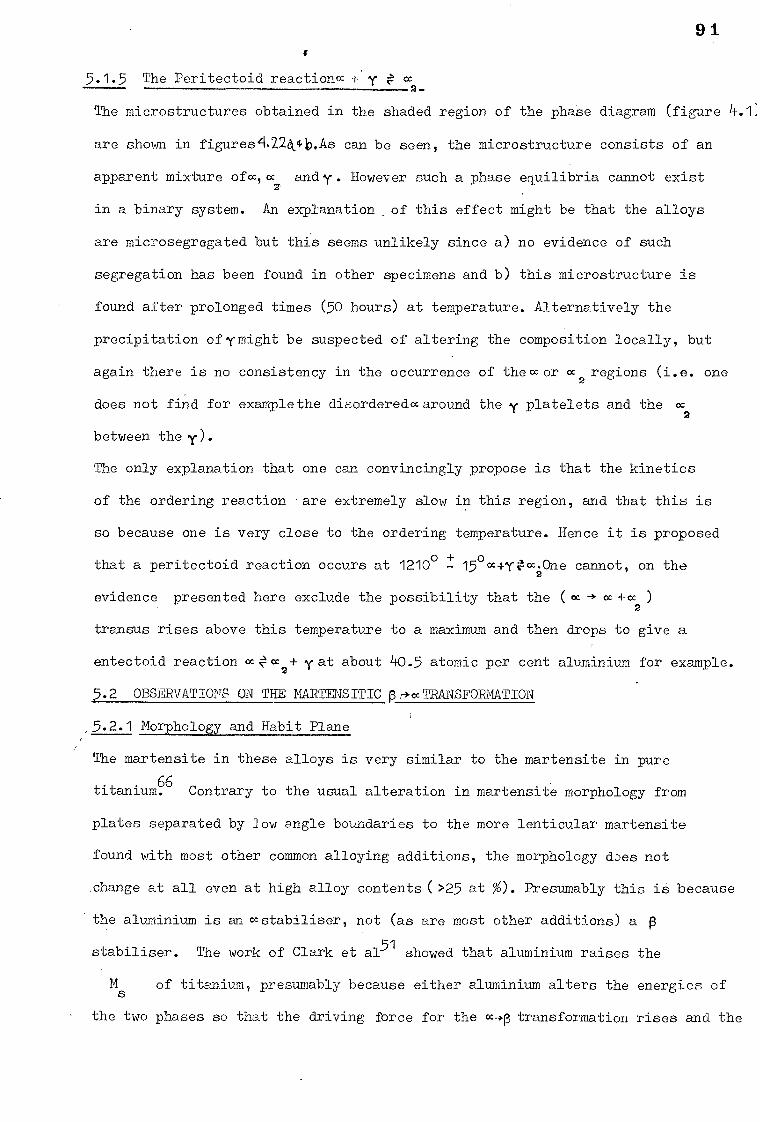
91
5.1.5 The Peritectoid reactionm y a 2
The microstructures obtained in the shaded region of the phase diagram (figure 4.1:
are shown in figures4,224,q.As can be seen, the microstructure consists of an
apparent mixture ofm,m andy. However such a phase equilibria cannot exist
in a binary system. An explanation of this effect might be that the alloys
are microsegregated but this seems unlikely since a) no evidence of such
segregation has been found in other specimens and b) this microstructure is
found after prolonged times (50 hours) at temperature. Alternatively the
precipitation ofy might be suspected of altering the composition locally, but
again there is no consistency in the occurrence of them or m 2 regions (i.e. one
does not find for example the disorderedm around the y platelets and the m 2
between they).
The only explanation that one can convincingly propose is that the kinetics
of the ordering reaction are extremely slow in this region, and that this is
so because one is very close to the ordering temperature. Hence it is proposed
+ that a peritectoid reaction occurs at 1210° 15o cc+yil- cc.2One cannot, on the
evidence presented here exclude the possibility that the (cc '4, m +m ) 2
transus rises above this temperature to a maximum and then drops to give a
entectoid reaction cc 2+ •y at about 40.5 atomic per cent aluminium for example.
5.2 OBSERVATIONS ON THE MARTENSITIC p.+(xTRANSFORMATION
_5.2.1 Morphology and Habit Plane
The martensite in these alloys is very similar to the martensite in pure
titanium66 Contrary to the usual alteration in martensite morphology from
plates separated by low angle boundaries to the more lenticular martensite
found with most other common alloying additions, the morphology does not
.change at all even at high alloy contents (>25 at %). Presumably this is because
the aluminium is an mstabiliser, not (as are most other additions) a p
stabiliser. The work of Clark et al51
showed that aluminium raises the
Ms
of titanium, presumably because either aluminium alters the energies of
the two phases so that the driving force for the transformation rises and the
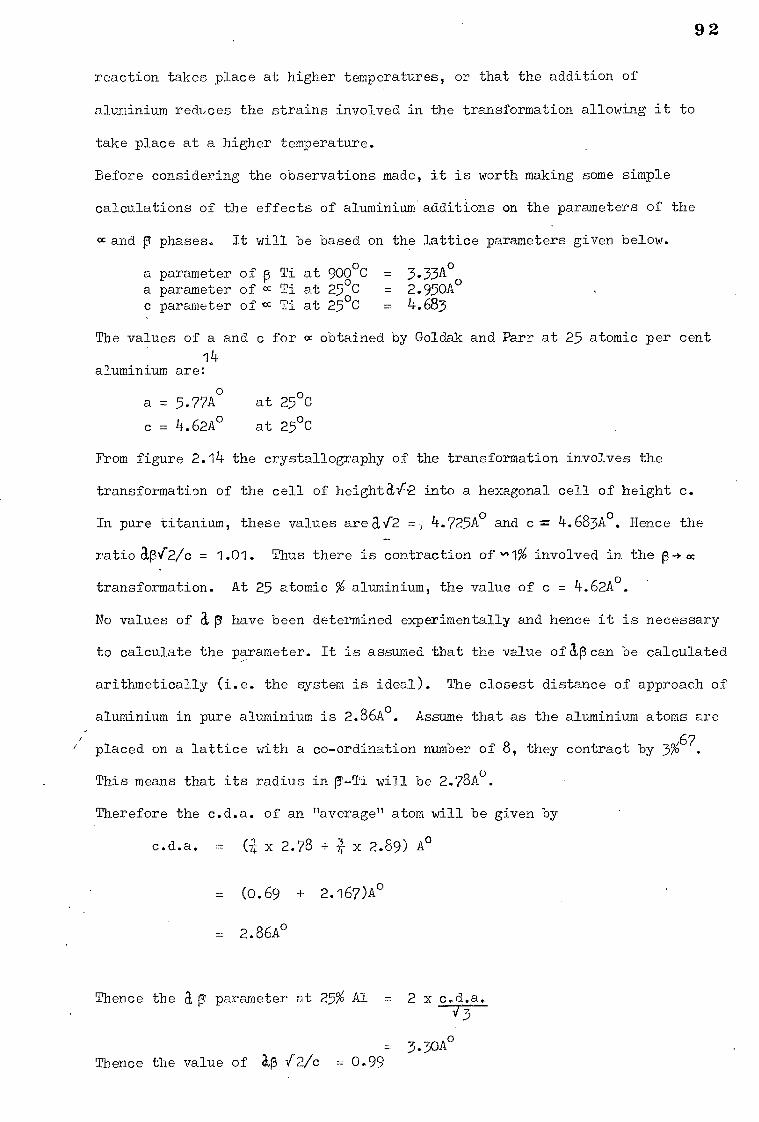
92
reaction takes place at higher temperatures, or that the addition of
aluminium reduces the strains involved in the transformation allowing it to
take place at a higher temperature.
Before considering the observations made, it is worth making some simple
calculations of the effects of aluminium additions on the parameters of the
cc and p phases. It will be based on the lattice parameters given below.
a parameter of f3 Ti at 902°C a parameter of cc Ti at 25°C c parameter of <:c Ti at 25
oC
= = =
3.33A° 2.950A° 4.683
The values of a and c for a obtained by Goldak and Parr at 25 atomic per cent 14
aluminium are: 0
a = 5.77A at 25°C
c = 4.62A° at 25°C
From figure 2.14 the crystallography of the transformation involves the
transformation of the cell of heightal2 into a hexagonal cell of height c.
In pure titanium, these values area,i2 =, 4.725A° and c = 4.683A°. Hence the
ratio aPli2/c = 1.01. Thus there is contraction of %"1% involved in the p--)
transformation. At 25 atomic % aluminium, the value of c = 4.62A°.
No values of a py have been determined experimentally and hence it is necessary
to calculate the parameter. It is assumed that the value ofapcan be calculated
arithmetically (i.e. the system is ideal). The closest distance of approach of
aluminium in pure aluminium is 2.86A°. Assume that as the aluminium atoms are
placed on a lattice with a co-ordination number of 8, they contract by 3%67.
This means that its radius in p-a.i will be 2.78e.
Therefore the c.d.a. of an "average" atom will be given by
c.d.a. = x 2.78 + * x 2.89) A°
= (0.69 + 2.167)A°
= 2.86A°
Thence the a p' parameter at 25% Al = 2 x c.d.a.
= 3.30A° Thence the value of ap /2/c = 0.99
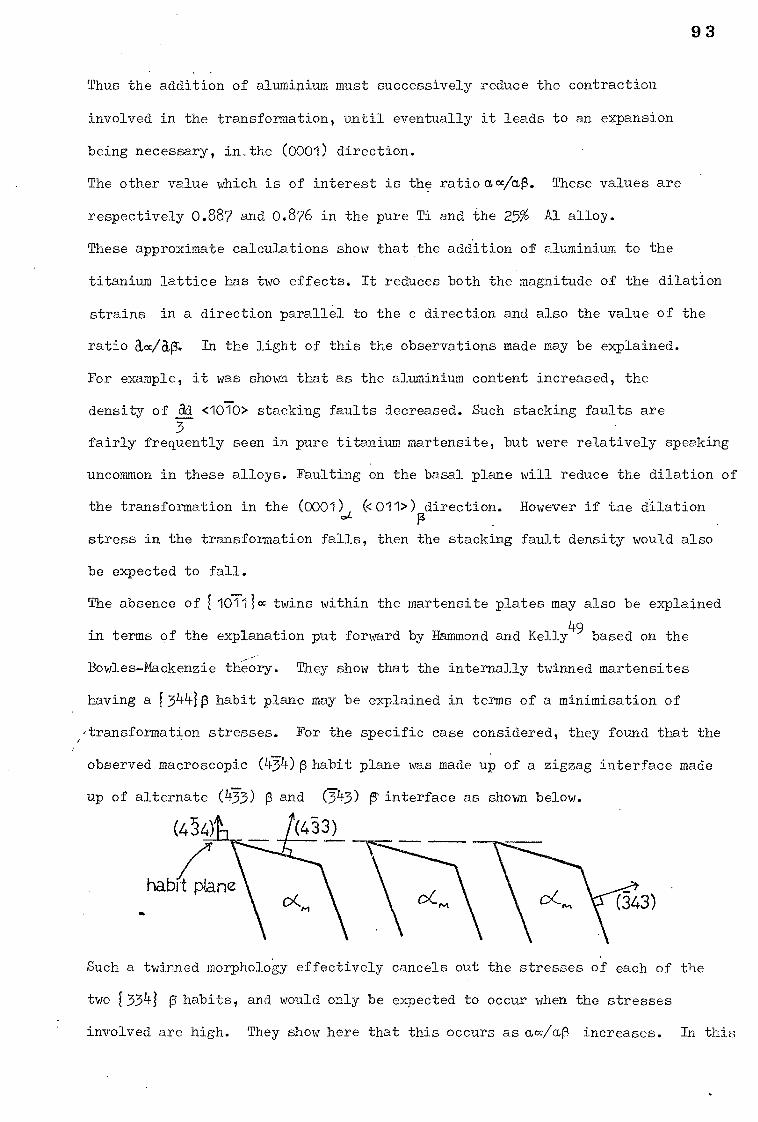
93
Thus the addition of aluminium must successively reduce the contraction
involved in the transformation, until eventually it leads to an expansion
being necessary, inAhe (0001) direction.
The other value which is of interest is the ratio moVal3. These values are
respectively 0.887 and 0.876 in the pure Ti and the 25% Al alloy.
These approximate calculations show that the addition of aluminium to the
titanium lattice has two effects. It reduces both the magnitude of the dilation
strains in a direction parallel to the c direction and also the value of the
ratio a«/,r. In the light of this the observations made may be explained.
For example, it was shown that as the aluminium content increased, the
density of dd ‹1070> stacking faults decreased. Such stacking faults are 3
fairly frequently seen in pure titanium martensite, but were relatively speaking
uncommon in these alloys. Faulting on the basal plane will reduce the dilation of
the transformation in the (0001) ((Oil>) direction. However if tne dilation .L
stress in the transformation falls, then the stacking fault density would also
be expected to fall.
The absence of [10711m twins within the martensite plates may also be explained
in terms of the explanation put forward by Hammond and Kelly49 based on the
- - Bowles-Mackenzie theory. They show that the internally twinned martensites
having a f3441p habit plane may be explained in terms of a minimisation of
transformation stresses. For the specific case considered, they found that the
observed macroscopic (434)3 habit plane was made up of a zigzag interface made
up of alternate (473) F and (745) (3' interface as shown below.
Such a twinned morphology effectively cancels out the stresses of each of the
two [5541 13' habits, and would only be expected to occur when the stresses
involved are high. They show here that this occurs as aola,P increases. In this
9 4 case as has been shown aloove,a„oc/ap falls. Hence one would not expect
110711mtwins to occur, in agreement with the observed behaviour on these
alloys. The same is true for the Ti-Cu68
system at low copper ,contents and
again in this system no twinning was observed.
5.2.2 Twin Related Plates in Ti-Al Martensites
The simplest case of diffraction patterns from twin related Crystals 42
occurs when the twin plane lies parallel to the electron beam. The
twin axis must then lie in the reciprocal lattice plane which corresponds to
the diffraction pattern. In the present case the possibility of twinning
about the flOTlimplane is to be:considered. Hence a diffraction pattern
which contains a 1107f1lmreflection will satisfy this requirement.
In this sample case, the diffraction pattern from the twin can be obtained
by simple rotation. A rotation of 180°,:about the twin axis is identical to
a mirror image of the matrix pattern across the twin axis, and hence having
indexed the matrix the twin reflections are easily identifiable. A necessary
consequence of this is that the twin reflections must occur in straight lines
parallel to the normal to the twin plane, and must also lie on the straight
line joining up matrix reflections parallel to this normal.
A cursory inspection of figure 4.8d seems to indicate that indeed there is a
twin relationship between the two crystals from which this pattern was obtained.
However a closer examination makes it clear that this is not the case, since the
twin reflections do not lie in the same line as the matrix reflections. In
fact it is apparent that there is a rotation about the zone axi:, of 3°. Hence
the f10111(xplane of the apparent twin can be considered to be rotated by 3o
from the pseudo twinning plane of the matrix, and not exactly parallel to it
as would be the case for a genuine twin.
If the plates were related by the Burgers relationship such a small rotation
could be expected. Consider the case of two plates sharing a common L]120j
direction in a 25 atomic % Al-,alloy which has a c/a ratio of 1.602. The
angle between (0001) and the (7(101)0c plane in this case is 61.6° (cf 61.23
for pure Ti).' Assuming the Burgers relationship, the second (0001) plane
95
would be at 59.5° from the first. Rotation of the (1101) plane normal by this • ... —
amount shows that this plane now deviates only 2.7° from the original (1101)cc
normal of the first plate. This then shows that the angular rotation measured
from the diffraction pattern above is consistent with the Burgers relationship
having been obeyed, and the two martensite plates which give rise to the
diffraction pattern shownin figure 4.13d are not twin related.
5.2.3 Dislocations in the Martensite
As shown in section 4.5, the dislocation sub-structure in the martensite plates
as consists of random arrays of <1120> dislocationswhich make up the
Majority of the dislocations, and a small fraction of c(0001) dislocations.
In other titanium alloy systems, the c(0001) dislocations have been found to
have long stright segments lying in the <1170> direction and be edge in character.
Because such dislocations have not been observed in mechanically deformed alloys
it has been proposed that they are a product of the transformation. In these
alloys no such strong tendency has been observed. The random ad <1120> 3
dislocations are frequently seen in the titanium alloy martensites and have
been assumed to arise from a combination of quenching and transformation stresses.
Such a hypothesis is supported in the present work by the observation that in
alloys quenched from„thecc+p region the m phase has a very low dislocation
density except in regions adjacent to the transformed p where the dislocation
density increases markedly up to the density in the transformed p. This strongly
suggests that most of the dislocations are produced by transformation stresses,
rather than quenching stresses or as a consequence of damage to the foil by
handling.
5.2.4 The 'Block' Martensite
A point has already been made in the results section that the morphology and
internal structures of the blocky grains of c formed in the 22 at % alloy quenched
• from 125000 are completely different to the "subgrain" martensite. Such a
substructure has not previously been reported in the literature, but Flower69
has observed some featureless grains not like the normal martensite in pure
titanium specimens.
96
The microstructure shows features that might be expected of a massive
transformation.70 The boundaries are of the high angle type and, rather than
the dense dislocation tangles observed in the martensite, the substructure
consists of the long stacking faults shown in figure/4.5
Because of the confusion that surrounds the term "massive" in the literature
I wish to define more closely the terms massive transformation and phase,
and massive martensite as I use them. The term massive martensite should be
attributed only to transformation products which occur as the result of a shear
:type of transformation. These have the characteristics that there is an
observable surface rumpling and that the product phase does not cross the original
matrix boundaries. However a massive transformation is one in which the
product phase grows by the movement through the parent phase of an interface
which corresponds to a high angle boundary. The parent is converted by a short
range diffusional process at this boundary to the product. It follows therefore
that such a transformation can cross grain boundaries in the parent with ease,
and further that no surface rumpling should occur. (It has been pointed out that
..a surface rumpling may occur if the volume of product and parent phase were
sufficiently different)70. The product in this case is a true massive phase.
The term massive martensite has often been used to describe the martensite
product which up until now I have described as 'sub-grain martensite', in which
a large part of the original grain is converted to a single variant of the
product, consisting of the parallel plates separated by low angle boundaries.
The vast majority of work on titanium alloy martensites is related to alloys
containing the pstabilising elements. The common feature cf all these is that the
Ms falls, and that the martensite morphology changes from massive through lenticular
to acicular (as for example in the titanium copper or titanium molybdenum
systems). In the case of aluminium it has been shown51 that theMs increases with
increased aluminium content.
It is proposed in this case that the rise in the Ms temperature may mean that
the athermally produced nucleus is able to grow by a diffusional (or massive)
process, rather than by the shear (or martensitic)mechanism. Aspointed out above
the diffusion needs only be short range in order that over the boundary between
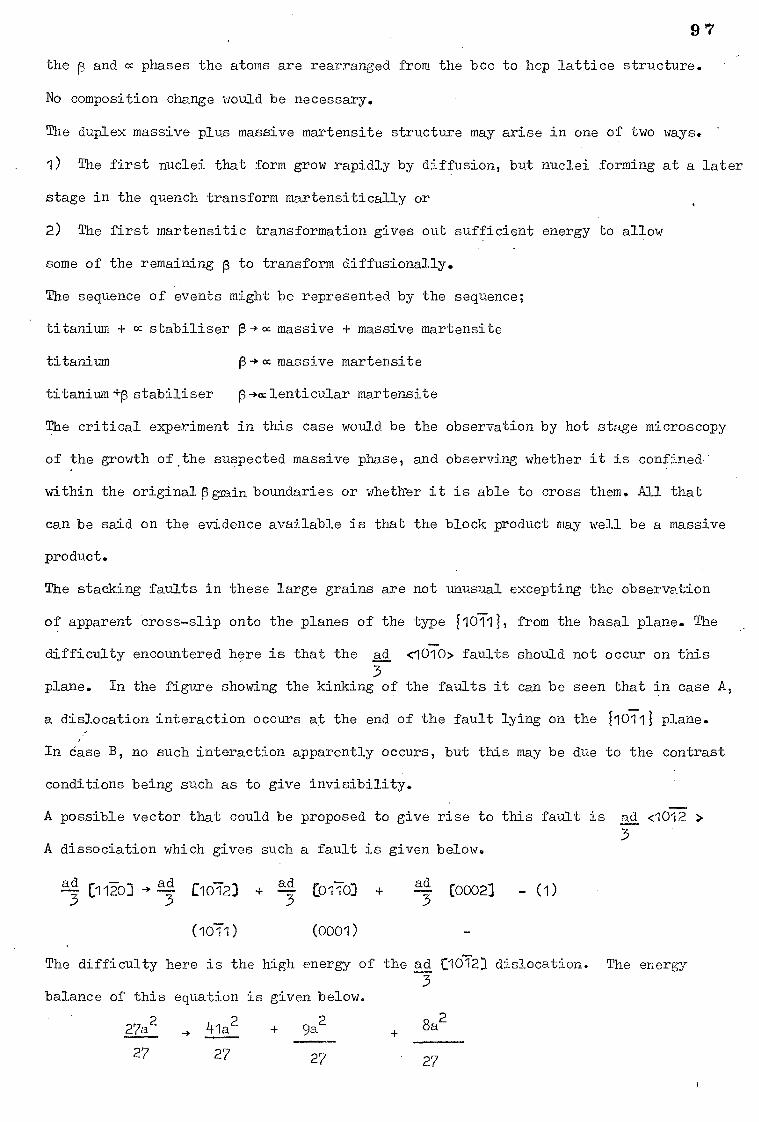
El 7
the , and m phases the atoms are rearranged from the bcc to hcp lattice structure.
No composition change would be necessary.
The duplex massive plus massive martensite structure may arise in one of two ways.
1) The first nuclei that form grow rapidly by diffusion, but nuclei forming at a later
stage in the quench transform martensitically or
2) The first martensitic transformation gives out sufficient energy to allow
some of the remaining p to transform diffusionally.
The sequence of events might be represented by the sequence;
titanium + m stabiliser P-÷m massive + massive martensite
titanium p--)m massive martensite
titanium +p stabiliser p lenticular martensite
The critical experiment in this case would be the observation by hot stage microscopy
of the growth of.the suspected massive phase, and observing whether it is confined
within the original pgrain boundaries or whether it is able to cross them. All that
can be said on the evidence available is that the block product may well be a massive
product.
The stacking faults in these large grains are not unusual excepting the observation
of apparent cross-slip onto the planes of the type f107T.IL from the basal plane. The
difficulty encountered here is that the ad <1010> faults should not occur on this 3
plane. In the figure showing the kinking of the faults it can be seen that in case A,
a dislocation interaction occurs at the end of the fault lying on the 110111 plane.
In case B, no such interaction apparently occurs, but this may be due to the contrast
conditions being such as to give invisibility.
A possible vector that could be proposed to give rise to this fault is ad <1012 > 3
A dissociation which gives such a fault is given below.
ad ad 2.1 ad 7 [11203 - -7 [16-123 + C01703 + — [0002] - (1)
3 3
(1071) (000l)
The difficulty here is the high energy of the ad C1012) dislocation. The energy 3
balance of this equation is given below.
27a2 a 41a2
27 27
+ 9a2
27
8a2
27
98
However in titanium zirconium martensites some contrast evidence has
been obtained which is not inconsistent with faults characterised by a
vector of the type na <161-2>.71
The examination of energies produced by atom matching on the {10111 plane
in this work indicates thatil is equal to 27 not -1. No possible
dislocation reaction to form this vector is proposed. This does present
one possible explanation.
The alternative explanation may be that these are small .10103type twins.
However no diffraction evidence for twinning was obtained, and hence no
definite conclusion can be reached.
9 9
5.3. THE PRECIPITATION OF ‘6,
5.3.1 Introduction
The orientation relationship between the two phases, i.e.
(0001)c4
.2 //el
11111 y
<1170>o:2/ell. <110>y
together with the observation of 'stacking faults in the m2 matrix are both
evidence for the transformation being identical to that observed in
elemental cobalt72, 73 and its alloys,74 and other alloy systems such as
Cu-Ge,75 Al-Ag76 and Cu-Si.77,78 In cobalt the transformation may be
achieved by the passage of a/6 <112> partials over every other close packed
plane, and the crystallography is identical in the case oX the transformations
in the alloy systems. In cobalt this reaction may be regarded as purely
martensitic, the fcc phase being converted into the hcp by a homogenous
shear of s = W2 in the <112> direction on a 1111 plane. If this shear
were homogenous, only half of the atoms in the new structure will be in
the correct position as is obvious since the primitive cell of the new hcp
lattice has two atoms per cell compared with one in the primitive fcc cell.
However the atom shuffles necessary are simplified since they may be achieved
if, as suggested above, 1111 planes are considered to be locked together
in pairs. In elemental cobalt this mechanism adequately describes the reaction
and in the DO19
to L10 transformation the basic crystallography is identical if
the ordering of atoms is ignored.
In any alloy system, some diffusion must be involved in order to attain the
equilibrium concentrations of the parent and product phases. One might
imagine this occurring either concurrently with the separation into partials
or the separation occurring first followed by diffusion to enrich the faults
to the equilibrium y composition.
In the other alloy systems mentioned above, stacking faults are always
observed in samples quenched from above the fcc hcp transus, and it is
frequently proposed that the stacking fault energy (SEE), which is positive
but small above the transus goes to zero,73 and then becomes negative at
100
temperatures below the transformation temperature (Tt). However it seems
more likely that in every case although the SEE is low, it does not become
negative below Tt
which would correspond to the separation then diffusion
case above. If this were so, then there would be very small barrier
energetically for the dissociation process, and all dislocationsin the lattice
should dissociate to give the intermediate non-equilibrium faults. It would
also mean that just above Tt
the dislocations should show some dissociation.
In the case of Al-Ag76 which has been studied by in situ hot stage microscopy
by Hren and Thomas, it was shown that the a/2 <101> dislocations were not
dissociated at all at temperatures just above Tt since they were able to
cross-slip. When quenched to below Tt, they ceased to move, paused, and then
dissociated and the partials spread out on the (1111 plane.
They concluded, from kinetic data that this process was diffusion controlled.
In Cu-Ge,75 Kotval and Honeycombe showed that deformation at room temperature of
a metastable fcc phase quenched from above Tt produced dense faulting
indicating that the fault energy is very low. Such fault bundles did not
however give hcp reflections, but subsequent ageing at 400°C ','0.5Tm) for less
than 5 minutes produced the missing hcp reflections. They also found that the
transformation occurred very rapidly at high temperatures and slowed down very
quickly as the temperature fell.Both in Cu-Ge & Cu-Si75'77faulting is seen at
room temperature after quenching from above Tt. Kinsman77 et al have
suggested that the quenching stresses are sufficient to separate the unit
dislocations with low SJE. In both cases the melting point is relatively low
(Cu-Ge: Tm
1125°K, Tt = 1075°K at 12.5 Wt % Ge, and Cu-Si: Tm = 1173°K,
Tt = 1073°K at 5.09 Wt % Si) and T
t sufficiently high so that significant
diffusion may occur during the quench. Thus it is felt that diffusion
enrichment rather than quenching stresses are responsible for the extensive
separation observed in these alloys. These examples may be realistically
compared with air-cooled Titanium Aluminium samples (TITI 1770 Tt = 1400°K)
especially when the effects of the ordering of the reaction described in the
next section are considered.
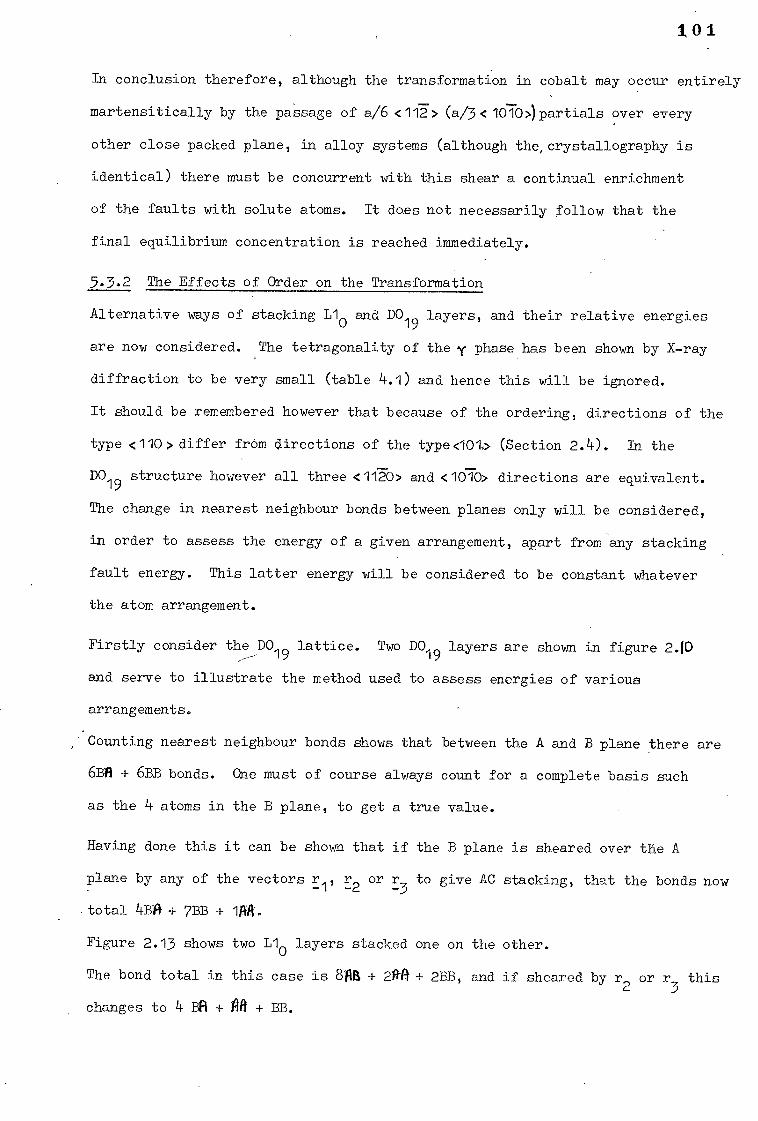
1,01
In conclusion therefore, although the transformation in cobalt may occur entirely
martensitically by the passage of a/6 <112> (a/3<1070>)partials over every
other close packed plane, in alloy systems (although the, crystallography is
identical) there must be concurrent with this shear a continual enrichment
of the faults with solute atoms. It does not necessarily follow that the
final equilibrium concentration is reached immediately.
5.3.2 The Effects of Order on the Transformation
Alternative ways of stacking L10 and DO
19 layers, and their relative energies
are now considered. The tetragonality of they phase has been shown by X-ray
diffraction to be very small (table 4.1) and hence this will be ignored.
It should be remembered however that because of the ordering, directions of the
type <110> differ from directions of the type<101> (Section 2.4). In the
DO19 structure however all three <1120> and <10710> directions are equivalent.
The change in nearest neighbour bonds between planes only will be considered,
in order to assess the energy of a given arrangement, apart from any stacking
fault energy. This latter energy will be considered to be constant whatever
the atom arrangement.
Firstly consider the DO19 lattice. Two DO
19 layers are shown in figure 2.g)
and serve to illustrate the method used to assess energies of various
arrangements.
Counting nearest neighbour bonds shows that between the A and B plane there are
6BA + 6BB bonds. One must of course always count for a complete basis such
as the 4 atoms in the B plane, to get a true value.
Having done this it can be shown that if the B plane is sheared over the A
plane by any of the vectors El, E2 or r3 to give AC stacking, that the bonds now
total 4Bg+ BBB +
Figure 2.13 shows two Llo layers stacked one on the other.
The bond total in this case is 81111 2flff+ 2BB, and if sheared by r2 or r
3 this
changes to 4 BA + AA + BB.
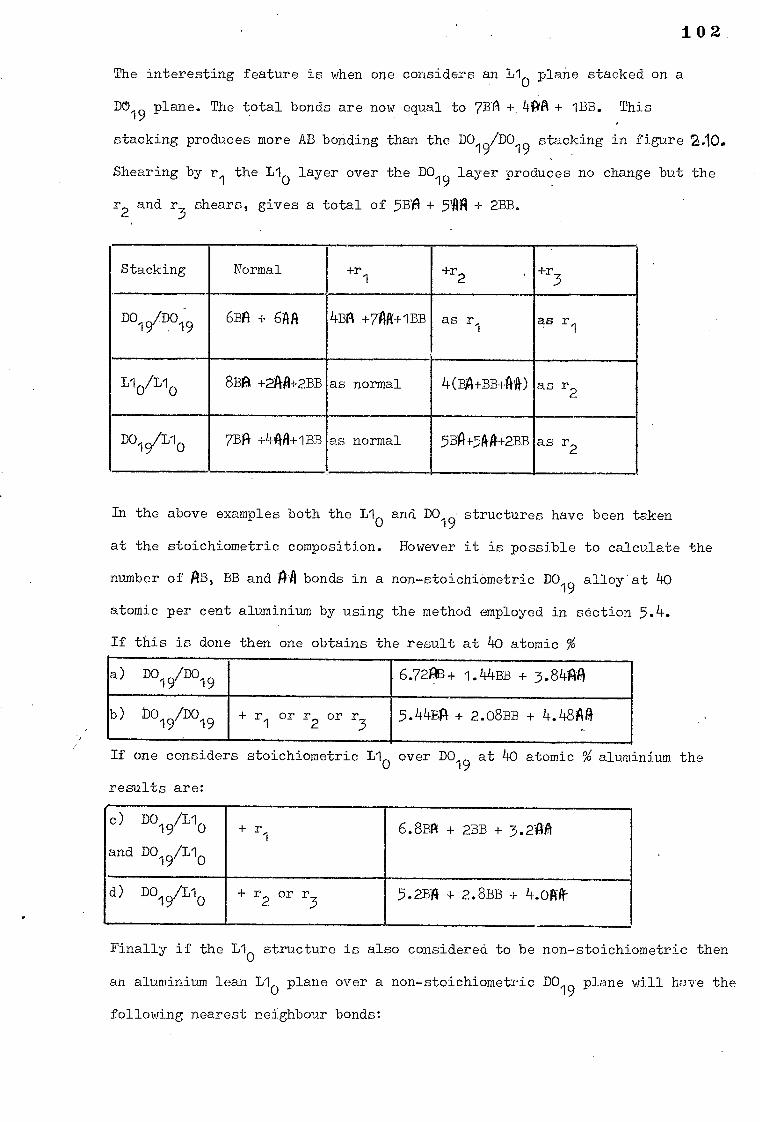
102
The interesting feature is when one considers an L10 plane stacked on a
DO19 plane. The total bonds are now equal to 7BA + 4f1A+ 1BB. This
stacking produces more AB bonding than the D019/D0
19 stacking in figure210.
Shearing by r1
the L10 layer over the DO
19 layer produces no change but the
r2 and r
3 shears, gives a total of 5BA + + 2BB.
Stacking Normal +r1
+r2
+r3
DO19/D019 6BA + CAR 4BA +74R+1BB as r1
as r • 1
L10 /L10 8BA +21141+2BB as normal 4(BA+BB+11-#) as r2
D019/L10 7BA +44A+1BB as normal 5BA+5/141+2BB as r2
In the above examples both the 1,10 and DO
19 structures have been taken
at the stoichiometric composition. However it is possible to calculate the
number of AB, BB and 1I bonds in a non-stoichiometric D019 alloy'at 40
atomic per cent aluminium by using the method employed in section 5.4.
If this is done then one obtains the result at 4o atomic %
D019
/D01 6.729B+ 1.44BB + 3.84AA
b) b019/Do19 + r
1 or r
2 or r3 5.44E14 + 2.08BB + 4.404
If one considers stoichiometric L10 over DO19 at 40 atomic % aluminium the
results are:
c) D019/t10 and D0
19/t10
+ r1 6.8BA + 2BB + 3.2AA
D019/t1
0 + r
2 or r
3 5.2BA + 2.8BB + 4.01*
Finally if the Llo structure is also considered to be non-stoichiometric then
an aluminium lean 1,10 plane over a non-stoichiometric DO
19 plane will have the
following nearest neighbour bonds:
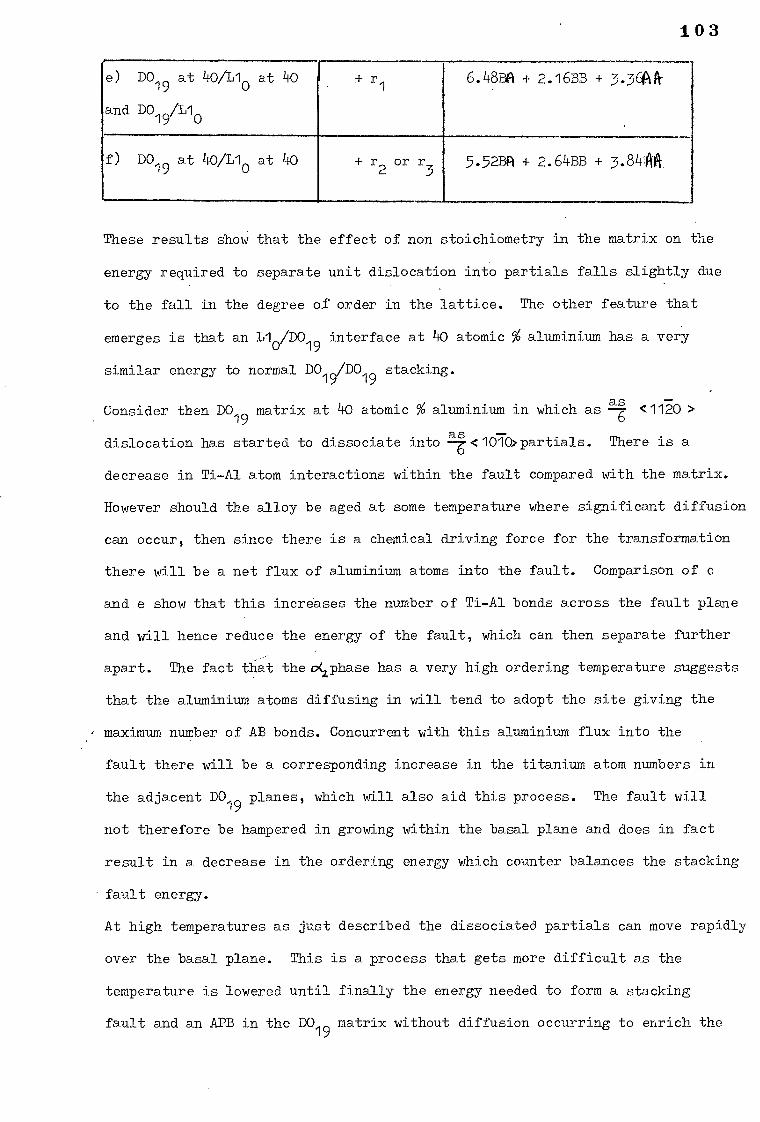
103
e) DO19
at 40/1,10
at 40
and D019
/1/10
+ r1
6.48BA + 2.16BB + 3.36iNk
f) DO19
at 40/1,10 at 40 + or r2 r3 5.52Bil + 2. 64BB + 3.84Aii.
These results show that the effect of non stoichiometry in the matrix on the
energy required to separate unit dislocation into partials falls slightly due
to the fall in the degree of order in the lattice. The other feature that
emerges is that an 1,10/D019 interface at 40 atomic % aluminium has a very
similar energy to normal D01„/D019 stacking.
as ConSider then DO
19 matrix at 40 atomic % aluminium in which as <1120 > 6
dislocation has started to dissociate into 2f<10701>partials. There is a
decrease in Ti-Al atom interactions within the fault compared with the matrix.
However should the alloy be aged at some temperature where significant diffusion
can occur, then since there is a chemical driving force for the transformation
there will be a net flux of aluminium atoms into the fault. Comparison of c
and e show that this increases the number of Ti-Al bonds across the fault plane
and will hence reduce the energy of the fault, which can then separate further
apart. The fact that the o(2phase has a very high ordering temperature suggests
that the aluminium atoms diffusing in will tend to adopt the site giving the
maximum number of AB bonds. Concurrent with this aluminium flux into the
fault there will be a corresponding increase in the titanium atom numbers in
the adjacent DO19
planes, which will also aid this process. The fault will
not therefore be hampered in growing within the basal plane and does in fact
result in a decrease in the ordering energy which counter balances the stacking
fault energy.
At high temperatures as just described the dissociated partials can move rapidly
over the basal plane. This is a process that gets more difficult as the
temperature is lowered until finally the energy needed to form a stacking
fault and an APB in the DO19
matrix without diffusion occurring to enrich the
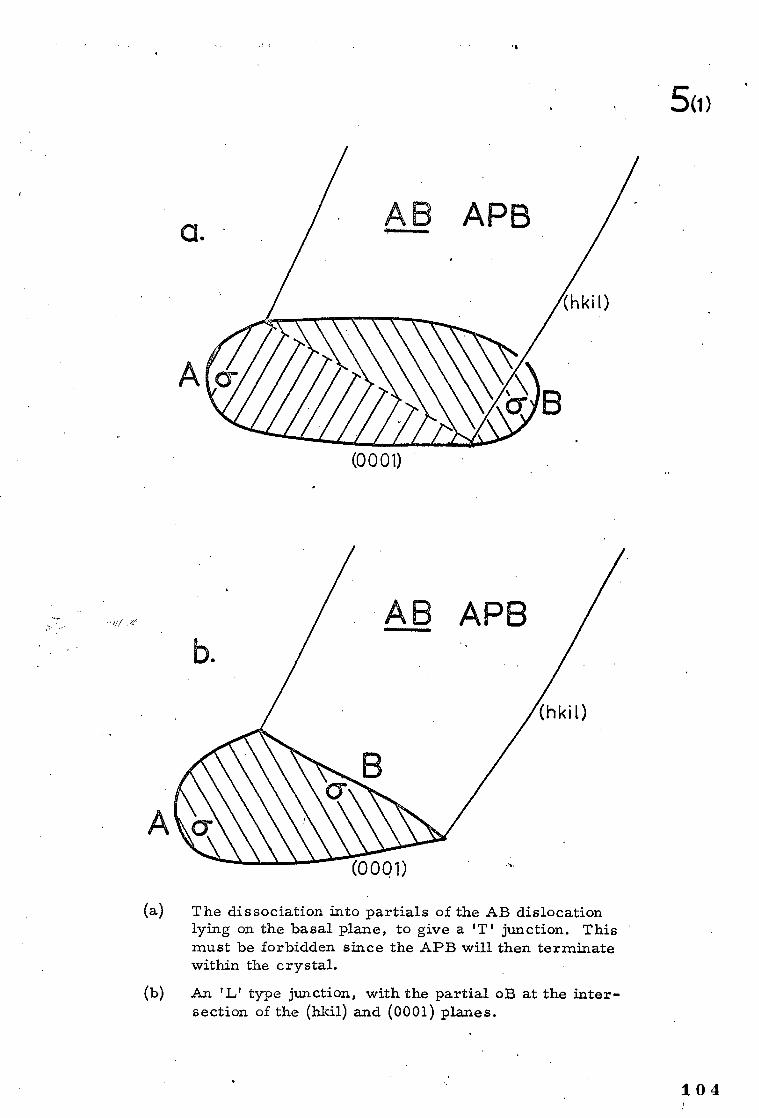
5(1)
1 11
(0001)
(a) The dissociation into partials of the AB dislocation lying on the basal plane, to give a 'T' junction. This must be forbidden since the APB will then terminate within the crystal.
(b) An type junction, with the partial oB at the inter- section of the (hkil) and (0001) planes.
104
105
fault is too high, and the dislocationscan no longer dissociate. Also one
would expect, as is observed, that the quenched samples would show no
faulting since insufficient time for diffusion occurs, whereas the aircooled
samples show some faulting because a little diffusion occurred. This
argument also explains the extreme rapidity at which faults form at temperatures
of about 800°C ( 0.55 Tm) and above.
5.3.3. Dislocation Dissociation in the cc2 Lattice
The heterogeneous nature of the precipitation process has been pointed out
earlier, and nucleation takes place both at individual dislocations in the
grains, when they have a segment lying in the basal plane, and at subgrain
boundaries. Both such sites would be expected to be surrounded by a higher
aluminium concentration than the lattice. This would occur not so much due to
relaxation of the stress field about the dislocations but because of the
chemical interaction described by Suzuki79 and the enrichment of the
nucleation sites is clearly seen in the case of dislocations in the APB
networks, due to the anomalous contrast it produces.
In other hop F fcc transformations the unit a/3 <1120 > dislocations simply
split into partials. However in this case the ordering has an effect on this
as behaviour. For example the dislocations at which 7 <1120>type APB's
terminate will split into partials. This separation must not result in the
APB ending within the crystal. Because of the random orientation of the APB's
it is difficult to see clearly just what occurs. It would seem that the
separation takes place as in figure 5.18 rather than as in figure 5.111
resulting in an "L" junction not a "T" junction. The separation of the
7 <1120> dislocation into partials must lock this junction in position
so that movement is only possible by a diffusional process.
Considering now the separation of a superdislocation, it has been suggested
above that because of the high L10 ordering temperature the aluminium atoms
as they diffuse to the faults sit in the sites that give maximum AB bonding.
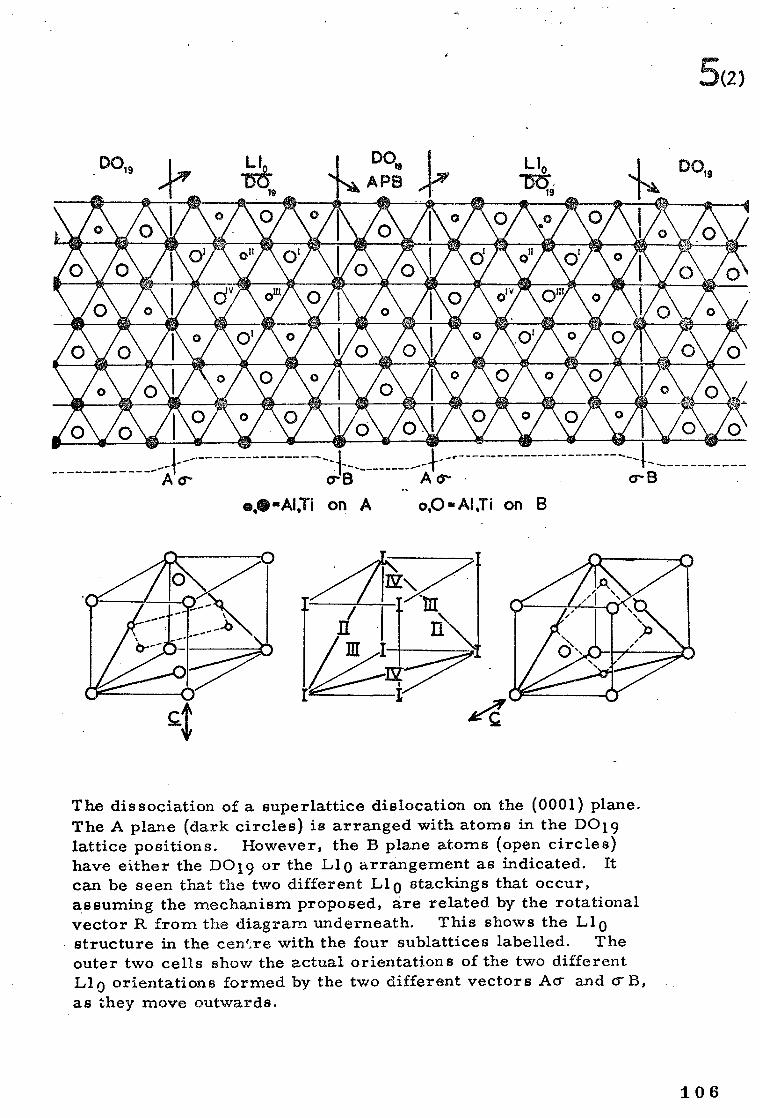
5(2)
DO19 D0,9
A cr- a- B A -AI,Ti on A o,0..A1,Ti on B
The dissociation of a superlattice dislocation on the (0001) plane. The A plane (dark circles) is arranged with atoms in the DO19 lattice positions. However, the B plane atoms (open circles) have either the DO19 or the Llo arrangement as indicated. It can be seen that the two different Llo stackings that occur, assuming the mechanism proposed, are related by the rotational vector R from the diagram underneath. This shows the Llo structure in the cen4,re with the four sublattices labelled. The outer two cells show the actual orientations of the two different Llo orientations formed by the two different vectors Acr and scr B, as they move outwards.
106
1.07 as The two outer <1070> partials of the superdislocation if they move out
from the parent, must have different aluminium atom sites filled to meet this
criterion since they have different shear vectors. The two different
arrangements of aluminium atoms are related to each other by the rotational
APBVectorHdescribed in section 2 i.e. the C axis changes direction by 90°.
The inner two partial dislocations will be left as a dislocation of the type
a/2 (101) at the interface between the two types of stacking. (See Figure 5.2)
5.3.4 Growth of the 6 Platelets Normal to the Basal Plane
It is obvious from the results that separation of the dislocations to give
faults (the nucleation stage) is difficult at low temperatures (600°C) for
the reasons discussed above, but it becomes more rapid as the temperature is
raised above this level. However the propagation of the faults on successive
(0001)04 planes to give plates rather than individual faults (the growth stage) 2
would seem difficult, and not until the temperature is raised further does this
occur. Such growth cannot proceed by a diffusional mechanism8° and indeed has
been shown in several systems to be independent of long range diffusion. Three
basic mechanisms have been proposed to explain the growth of the phase normal to
the basal plane. These are
1) The Pole mechaniSM (81 - 83)
2) Spontaneous nucleation of loops at the interface (73)
3) The ledge mechanism (84)
It should be emphasised that on this point there is only circumstantial
evidence for any mechanism since hot stage microscopy was not possible,
precluding any direct observations of the reaction.
Briefly these three different mechanisms suggest firstly that a partial
dislocation moving through the lattice meets a suitable "pole" dislocation
and that it spirals up and o.ownitto give a plate of fcc material. Such a pole
in this case would be the C(0001>dislocation.The objections to this theory
have been discussed elsewhere85
in some detail and hence will not be dealt with.
The major objection centres around the crossing of the two arms of the partial
at a narrow separation after one revolution. The second mechanism involves
108
the nucleation of a pill box of the newphase at the hcp/fcc interface;
the edges are glissile partials of the correct vector to give the necessary
shear. Finally the ledge mechanism involves the nucleation of partials
at some point such as the edge of a plate or at any other local stress
centre. These sweep over the interface.to advance it one step height,
for each dislocation that moves across.
In this particular case the mechanism occurring must basically explain the
extreme rapidity of the growth to give perfect unfaulted platelets and the
fact that any one fault bundle is characterised by one particular fault
vector. Both these facts strongly suggest that the pole mechanism is the
one which occurs in this case, sincesuchamechanism explains easily the '
reason for there being one fault vector associated with a bundle and the
rapidity of growth. In the other two cases there seems no reas(,n why a
random selection of all three as/6 <1070>dislocation should not be nucleated
unless local stress conditions made one particular shear energetically more
favourable than the other two.
Indeed successive nucleation of the same fault vector leads to an accumulative
shear being built-up in the lattice the back stress from which would tend to
suppress this process.
Again, once the inherent barrier mentioned above is overcome, the pole
' mechanism should operate extremely rapidly until the back stress built up
forces it to stop, or the pole dislocation ends or lies in another direction.
. Pole dislocations have not however been actually observed in previous
electron microscopy studies72
or in the present case. However this may
be the to experimental difficulties. It has been shown that dislocations of
the correct Burger's vector, C<0001>,do occur, and at times it seems the
as/6<1010>partials do have the appearance of lying on a spiral ramp.
Recent work by Kinsman et al77 and Tien et al78 on the precipitation of K
plates in Cu-Si alloys also point to the pole mechanism being the operative
109
transformation mechanism. The former workers found that the K plates grew
in sudden micron size jumps (liin0.4- seconds) indicating that they grow
rapidly over atomically very large distances. In Tien's work, electrical
resistivity changes were used to obtain data on the kinetics of reaction
and hence its activation energy. They showed that for temperatures just
below the transus, the evidence was consistent with the pole mechanism
but at a lower temperature another unknown mechanism also occurred.
Therefore it is thought that the pole mechanism is responsible
for the growth of the yprecipitate, normal to the basal plane but it
may well be that one or both of the others also contributes to the thickening
of the yplates normal to the C plane.
PJA/KJB
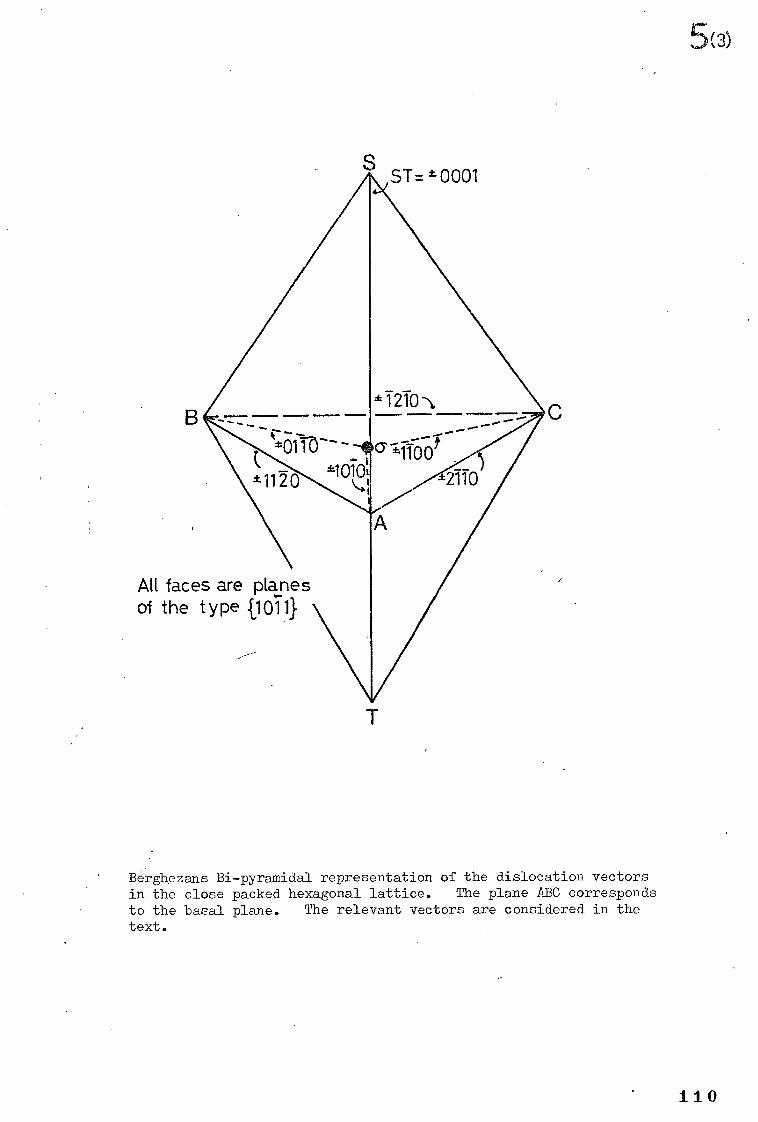
ST=±0001
••••••■••••••••••■••• •.•••••••••■•■■__ tolTo---_ I11-071
tif2o 2110
AR faces are planes of the type .110Ill
Berghezans Bi-pyramidal representation of the dislocation vectors in the close packed hexagonal lattice. The plane ABC corresponds to the basal plane. The relevant vectors are considered in the text.
110
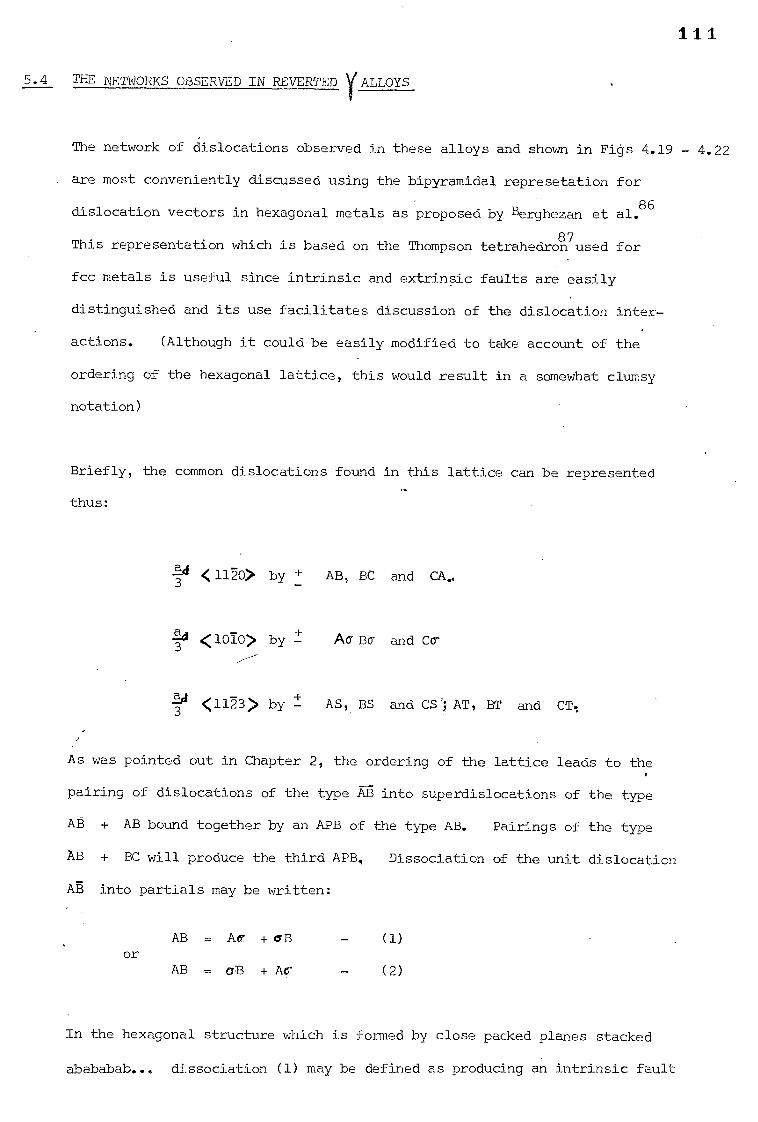
I 1 1
5.4 THE NETWORKS OBSERVED IN REVERTED yALLOYS
The network of dislocations observed in these alloys and shown in Figs 4.19 - 4.22
are most conveniently discussed using the bipyramidal represetation for
dislocation vectors in hexagonal metals as proposed by Berghezan et al.86
8 This representation which is based on the Thompson tetrahedron
7 used for
fcc metals is useful since intrinsic and extrinsic faults are easily
distinguished and its use facilitates discussion of the dislocation inter-
actions. (Although it could be easily modified to take account of the
ordering of the hexagonal lattice, this would result in a somewhat clumsy
notation)
Briefly, the common dislocations found in this lattice can be represented
thus:
24 <1170> by ± 3
<1010> by 2:
-a-ci <11 2:23> by 3
AB, BC and CA..
AaBT and C0
AS, BS and CS'i AT, BT and CT;
As was pointed out in Chapter 2, the ordering of the lattice leads to the
pairing of dislocations of the type AB into superdislocations of the type
AB + AB bound together by an APB of the type AB. Pairings of the type
AB + BC will produce the third APB, Dissociation of the unit dislocation
AE into partials may be written:
AB = Ar + c7 B (1) or
AB = aB + (2)
In the hexagonal structure which is formed by close packed planes stacked
abababab... dissociation (1) may be defined as producing an intrinsic fault
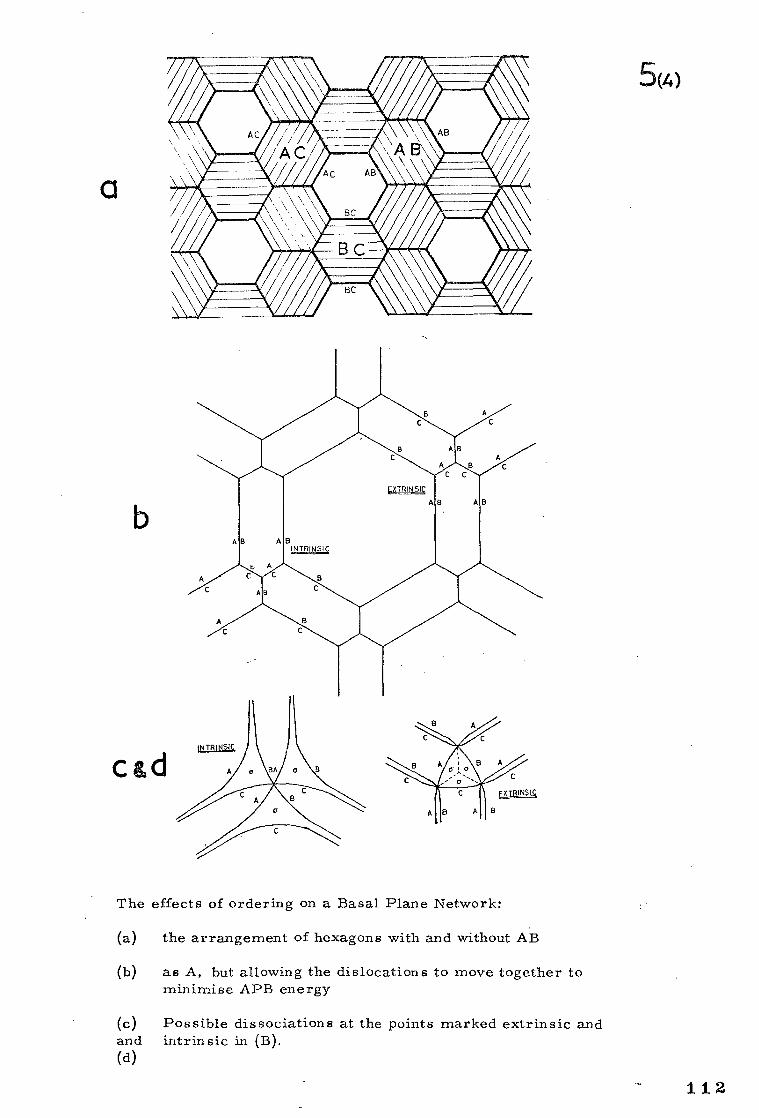
b
c &d
5(4)
The effects of ordering on a Basal Plane Network:
(a) the arrangement of hexagons with and without AB
(b) as A, but allowing the dislocations to move together to minimise APB energy
(c) Possible dissociations at the points marked extrinsic and and intrinsic in (B). (d)
112
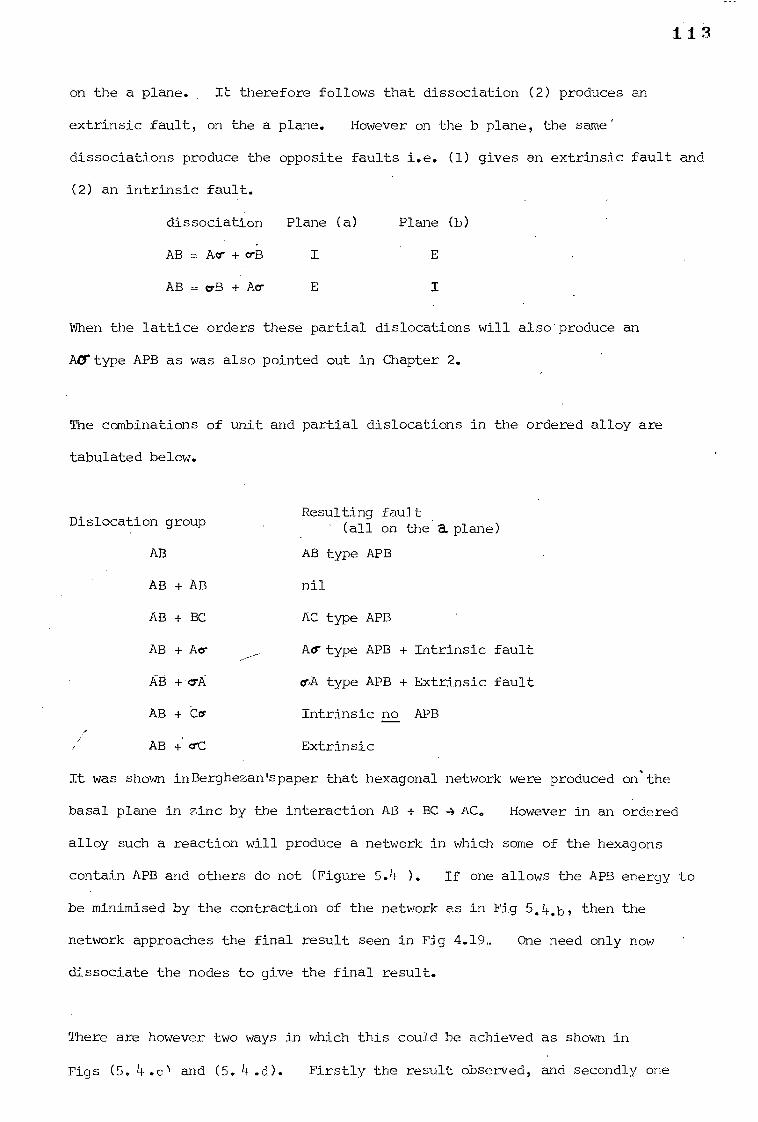
1 1 3
on the a plane. IL therefore follows that dissociation (2) produces an
extrinsic fault, on the a plane. However on the b plane, the same"
dissociations produce the opposite faults i.e. (1) gives an extrinsic fault and
(2) an intrinsic fault.
dissociation Plane (a) Plane (b)
AB = + crB
AB = uB + Au
When the lattice orders these partial dislocations will also- produce an
AO type APB as was also pointed out in Chapter 2.
The combinations of unit and partial dislocations in the ordered alloy are
tabulated below.
Dislocation group
AB
AB + AB nil
AB + BC AC type APB
AB + Au
Acrtype APB + Intrinsic fault
AB -F'crA
orA type APB + Extrinsic fault
AB + Ca
Intrinsic no APB
AB +* orC Extrinsic
It was shown inBerghezanispaper that hexagonal network were produced on'the
basal plane in zinc by the interaction AB + BC 4 AC. However in an ordered
alloy such a reaction will produce a network in which some of the hexagons
contain APB and others do not (Figure 5.4 ). If one allows the APB energy to
be minimised by the contraction of the network as in Fig 5.4.13, then the
network approaches the final result seen in Fig 4.19. One need only now
dissociate the nodes to give the final result.
Resulting fault ' (all on the a plane)
AB type APB
There are however two ways in which this could be achieved as shown in
Figs (5. k .0 and (5. h.d). Firstly the result observed, and secondly one
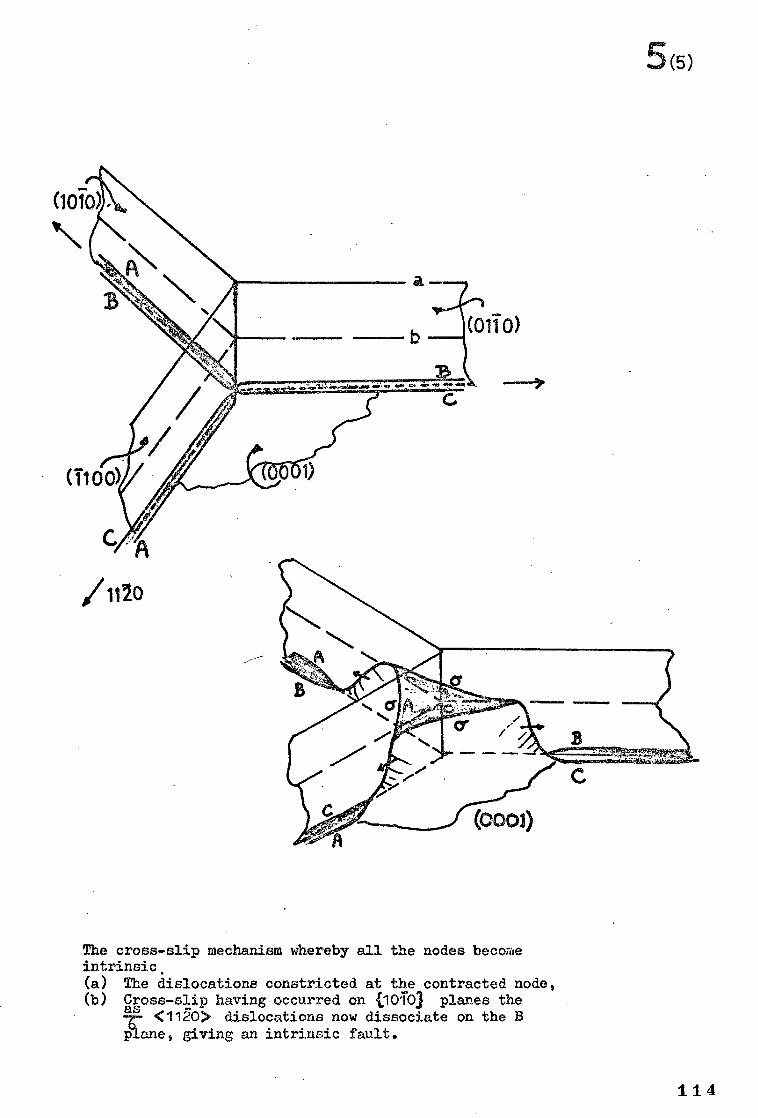
5(5)
The cross-slip mechanism whereby all the nodes become intrinsic. (a) The dislocations constricted at the contracted node, (b) Cross-slip having occurred on ilOTO. planes the as <112o> dislocations now dissociate on the B
game, giving an intrinsic fault.
114
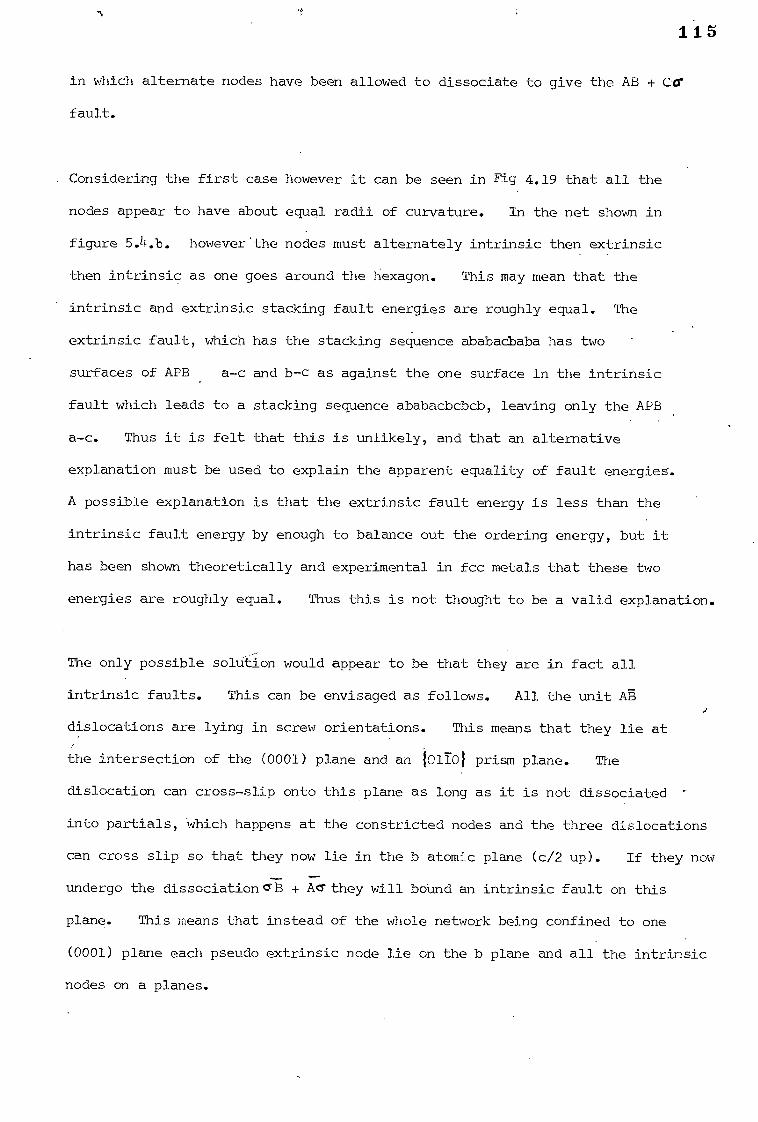
115
in which alternate nodes have been allowed to dissociate to give the AB +
fault.
Considering the first case however it can be seen in Fig 4.19 that all the
nodes appear to have about equal radii of curvature. In the net shown in
figure 5.4.b. however'the nodes must alternately intrinsic then extrinsic
then intrinsic as one goes around the hexagon. This may mean that the
intrinsic and extrinsic stacking fault energies are roughly equal. The
extrinsic fault, which has the stacking sequence ababacbaba has two
surfaces of APB a-c and b-c as against the one surface in the intrinsic
fault which leads to a stacking sequence ababacbcbcb, leaving only the APB
a-c. Thus it is felt that this is unlikely, and that an alternative
explanation must be used to explain the apparent equality of fault energies.
A possible explanation is that the extrinsic fault energy is less than the
intrinsic fault energy by enough to balance out the ordering energy, but it
has been shown theoretically and experimental in fcc metals that these two
energies are roughly equal. Thus this is not thought to be a valid explanation.
The only possible solution would appear to be that they are in fact all
intrinsic faults. This can be envisaged as follows. All the unit AB
dislocations are lying in screw orientations. This means that they lie at
the intersection of the (0001) plane and an 101101 prism plane. The
dislocation can cross-slip onto this plane as long as it is not dissociated -
into partials, which happens at the constricted nodes and the three dislocations
can cross slip so that they now lie in the b atomic plane (c/2 up). If they now
undergo the dissociation 553 + ACT they will bound an intrinsic fault on this
plane. This means that instead of the whole network being confined to one
(0001) plane each pseudo extrinsic node lie on the b plane and all the intrinsic
nodes on a planes.
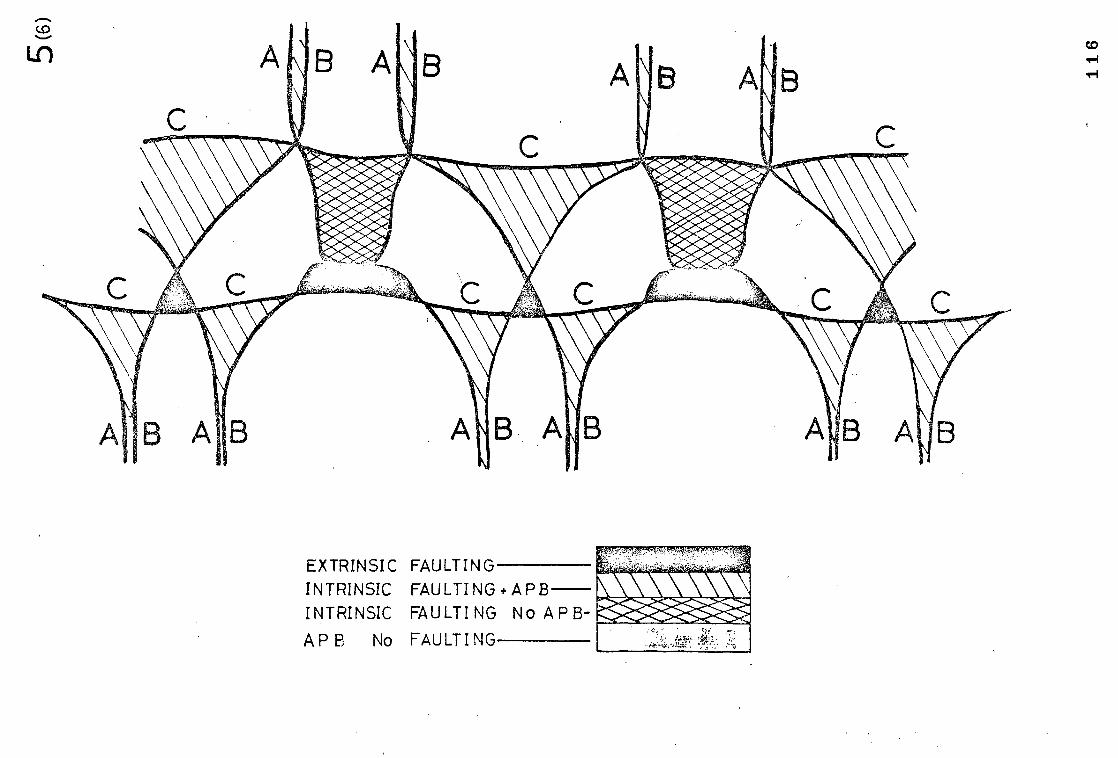
EXTRINSIC INTRINSIC INTRINSIC
APP No
FAULTING FAULTING + A PB FAULTING No AP B-
FAULTI NG
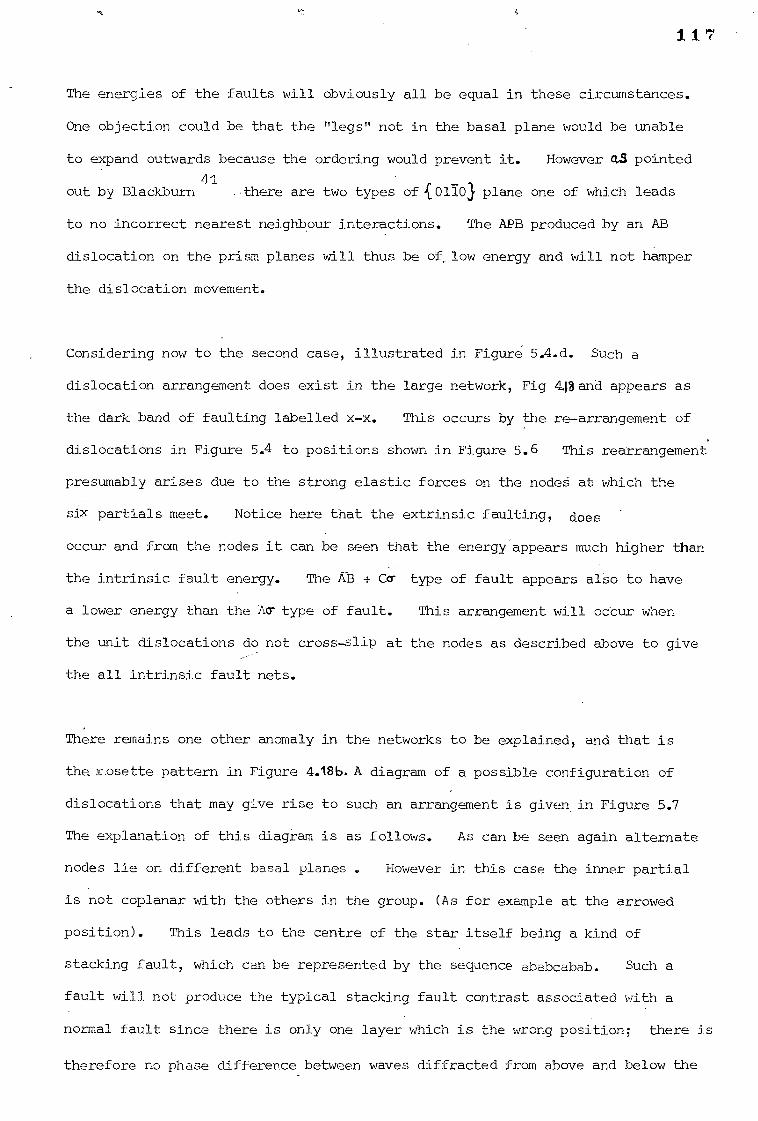
1 1 7
The energies of the faults will obviously all be equal in these circumstances.
One objection could be that the "legs" not in the basal plane would be unable
to expand outwards because the ordering would prevent it. However MS pointed
41 out by Blackburn there are two types of {OlT.03 plane one of which leads
to no incorrect nearest neighbour interactions. The APB produced by an AB
dislocation on the prism planes will thus be of, low energy and Will not hamper
the dislocation movement.
Considering now to the second case, illustrated in Figure. 5.4.d. Such a
dislocation arrangement does exist in the large network, Fig 48 and appears as
the dark band of faulting labelled x-x. This occurs by the re-arrangement of
dislocations in Figure 5.4 to positions shown in Figure 5.6 This rearrangement
presumably arises due to the strong elastic forces on the nodeS at which the
six partials meet. Notice here that the extrinsic faulting, does
occur and from the nodes it can be seen that the energy appears much higher than
the intrinsic fault energy. The AB + Ccr type of fault appears also to have
a lower energy than the AT type of fault. This arrangement will occur when
the unit dislocations do not cross-slip at the nodes as described above to give
the all intrinsic fault nets.
There remains one other anomaly in the networks to be explained, and that is
the rosette pattern in Figure 4.18b. A diagram of a possible configuration of
dislocations that may give rise to such an arrangement is given in Figure 5.7
The explanation of this diagram is as follows. As can be seen again alternate
nodes lie on different basal planes . However in this case the inner partial
is not coplanar with the others in the group. (As for example at the arrowed
position). This leads to the centre of the star itself being a kind of
stacking fault, which can be represented by the sequence ababcabab. Such a
fault will not produce the typical stacking fault contrast associated with a
normal fault since there is only one layer which is the wrong position; there is
therefore no phase difference between waves diffracted from above and below the
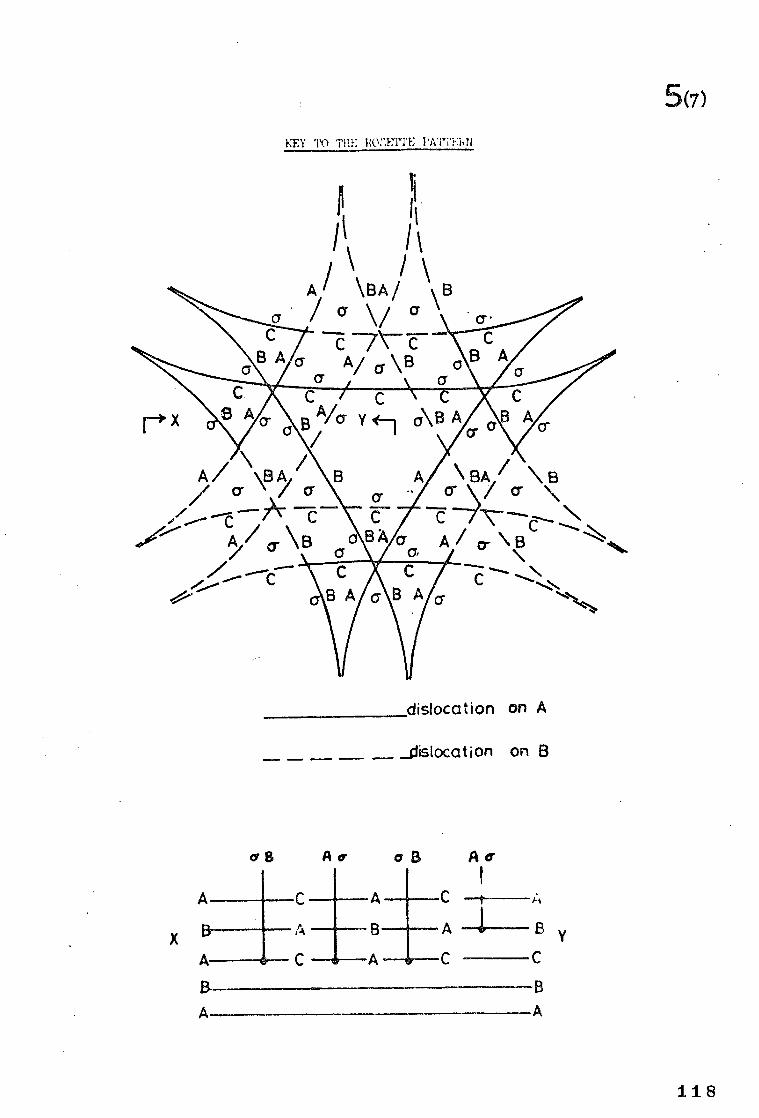
KEY -̀ 0 THE RO:1•;711..;
II
11
A' \BA/ \ B / a \/ a
A/ -7\--E-
a B
A / \B A/ /a
C A / \B / a
\ BA/ \B cr
A / cc \ B
/
aa,
B A
s A er
X B
C C
B A
A e
C
A l
5(7)
dislocation on A
__dislocation on B
118
1 1 9
the fault plane. One can deduce its presenCe from the bowing in of the
dislocations at the centre to annihalate this fault, because this single
layer fault has two violations of the stacking sequence and consequently a
. high energy. The reason why the dislocations have behaved differently
here. is not at all obvious but faults such as this have been observed in
graphite.
5.4.1 MEASUREMENT OF STACKING FAULT ENERGY
The values of the stacking fault energies calculated in chapter four were 57
obtained using the equation due to Friedel, which has been extensively used
for measurement of stacking fault energies from extended nodes. However
there are basically three sources of error in such a determination other
than measurement errors. These are:
(i) The non-coincidence of the dislocation line and its
image
(ii) The neglect of the elastic interactions of the partials
at the node
(iii) The accuracy of the formula used for the line tension of
a curved dislocation
The first of these errors is likely to be very small in this case since the
radii of the nodes is relatively large compared with the possible image
displacement. The other two sources of error have been considered in detail 89
by Brown. He has developed equations which take into account these possible
errors and concludes that for edge nodes the value of the fault energy
calculated using Friedel's equation, is approximately correct since errors
(ii) and (iii) are opposite and cancel. This is not the case however for
screw nodes (which occur in the present networks) and multiplication by a
factor of about 2.5 is necessary in order to give a more accurate value.
In this case then the energy of the ACrAPB + SF is von 20 ergs/cm2. It
should be emphasised however that these calculations are sensitively
120
dependent both on U (which in this case has been put equal to the value for
pure titanium) and also on the value of the cut off radius chosen (in this
case equal to b). Thus the absolute accuracy of the value 29 ergs/cm2
is probably accurate to no more than + - 5 ergs/cm2. Nevertheless, the
stacking fault energy which occurs in these alloys at the c ,-0,1,* 4-Y transus is obviously very low.
The stacking fault energy obtained here is comparable to the values obtained
90 in, for example, Co-Ni alloys near the fcc 7 hcp transformation temperature .
In the present case the ordering of the, lattice will be expected to have an
effect on this value.
The simplest method of estimating the energy of a given fault is to assume
that the energy due to the error in-stacking and the energy contribution due
to the disruption of the order in the lattice are simply additive.
TOTAL )S
SF + APB
92 However it has been shown by several workers 91,
that this is not necessarily
true. For example in Ni-Mn, the fault energy is not markedly affected by the
degree of order in the lattice, whereas in Cu3Au, the fault energy actually
falls as the degree of order increases. An explanation for this effect has
been attempted in terms of the interaction between the fault and electrons
near the BrillOaM zone boundaries in the crystal but such theories are
unproven and speculative; it is obvious however that equation above is an
oversimplification of the actual fault energy.
121
CHAPTER SIX
SUGGESTIONS FOR FURTHER WORK
There are certain parts of the work reported here which may be
profitably continued. These may be divided into the following sections,
in roughly ascending order of importance:-
6.1 The Martensitic Transformation
6.2 The Peritectoid Reaction (m+y)#
6.3 Reversion of the Dislocation Networks
6.4 Growth of they Phase
6.1 The basic 13->o:transformation in these alloys has been shown to be
similar if not identical to the transformation in pure titanium.
However, the existence of a possible massive transformation has been
proposed to explain the existence of large block grains which have a
'different internal substructure to the more familiar massive Martensite.
This transformation could be examined in greater depth to ascertain the
effects of both cooling rate and annealing temperature on the morphology
of the room temperature« phase.
(Note: Subsequent to the completion of this work it has been shown that
little if any surface tilting is produced by the block product, which
may be considered as further evidence for the diffusional nature of the
transformation).
6.2 The present proposed peritectoid reaction (=x+y)-)-«2 seems on the
available evidence the most logical solution to the phase equilibria
existing at this point. It was pointed out that there may be a
possibility of a eutectoid reaction at this point could not be
conclusively on the evidence available. This seems a point of no more
than academic interest.
122
6.3 The networks produced by the reversion of the y phase, when reaged
at a temperature below the y transus have been found to rearrange
themselves. No detailed analysis was obtained, but it is felt that the
rearrangement would be of some interest and would be of value in
elucidating the initial precipitation mechanism of the y phase.
6.4 Finally a more exhaustive study could be made of the hcp Ofct
transformation, which the present study has shown to be of some
complexity. The features of the reaction which could be studied in
more depth are itemised and discussed below.
(I) Observation of Surface Tilts
In all the other systems quoted in the discussion in which an foot- hcp
transformation occurs, a notable feature of the transformation is a
rumpling of a previously flat surface due to the shear nature of the
change. In this specific case attempts to confirm this characteristic
have been inconclusive due to oxidation or thermal etching of the
prepared surface-.--
From the observation of surface shears is derived the proof by Kotval
and Honeycombe of both the existence of the same shear over large
atomic distances and also the growth of large plates having a total
shear of almost zero, being made up of smaller bundles having the same
vector per bundle but so arranged as to give a very small total
deformation. It has been shown that the initial small bundles of faults
are in this case characterised by the same vector and secondly that
bundles of y plates having different vectors are observed. The surface
tilt information might have a bearing on the interpretation of the
growth mechanism of the plates, normal to the basal plane.
123
(2) Growth Kinetics
It would be valuable to have more information on the growth kinetics
and nucleation rate of the y phase. The most obvious methods that may
be applied here are electrical resistivity, dilatometry, optical
microscopy and x-ray diffraction.
In the former two cases a continuous change with time must occur in the
restivity or length of specimens upon ageing and this data used to
follow the progress of the precipitation reaction. These methods would
have to be backed by optical and electron metallography since they
effectively integrate the behaviour of many y plates. Were the plates
to grow in bursts followed by periods of inactivity as in the copper-
silicon case quoted in Chapter 5, this would not necessarily be obvious
using these techniques.
X-ray diffraction could be used to follow the changes if any, in the
lattice parameters of the y phase in order to estimate the aluminium
content of the y at various stages, and also the disparity in lattice
parameters in the initial stages.
In all cases, those techniques which involve observations of the reaction
at the ageing temperature rather than by ageing and quenching are going
to be complicated by the reactivity of the alloys, and will need to be
done under a protective atmosphere of inert gas.
(3) Hot Stage Electron Microscopy
All aspects of this work could be studied using hot stage microscopy,
using a cell with a protective atmosphere. The method has been used with
considerable success by Hren and Thomas in aluminium-silver alloys. This
would be particularly useful when used with the higher penetrating power
of the million volt microscope now available. Caution would have to be
124
exercised in extrapolating this data to bulk material behaviour but
this could be correlated with simultaneous work on the bulk material.
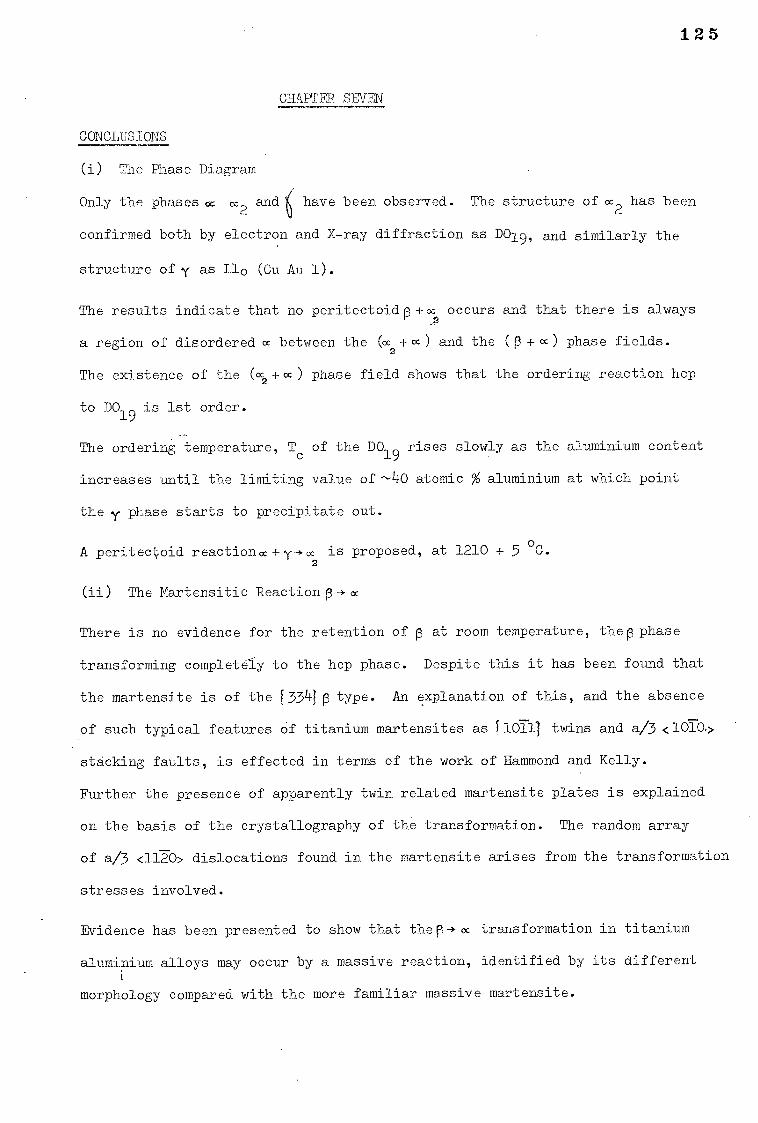
125
CHAPTER SEVEN
CONCLUSIONS
(i) The Phase Diagram
Only the phases oz 6C2
and have been observed. The structure of m2 has been
confirmed both by electron and X-ray diffraction as DO19, and similarly the
structure of y as Llo (Cu Au I).
The results indicate that no peritectoidp +cc occurs and that there is always
a region of disordered m between the (m +cc) and the ((3 + cc ) phase fields.
The existence of the (cc2 +cc ) phase field shows that the ordering reaction hcp
to DO19
is 1st order.
The ordering temperature, Tc of the DO19
rises slowly as the aluminium content
increases until the limiting value of --40 atomic % aluminium at which point
the y phase starts to precipitate out.
A peritectoid reaction cc y -*cc is proposed, at 1210 + 5 °C.
(ii) The Martensitic Reaction p-->
There is no evidence for the retention of p at room temperature, they phase
transforming completely to the hcp phase. Despite this it has been found that
the martensite is of the 3341p type. An explanation of this, and the absence
of such typical features of titanium martensites as 165:.11 twins and a/3 <1C70.>
stacking faults, is effected in terms of the work of Hammond and Kelly.
Further the presence of apparently twin related martensite plates is explained
on the basis of the crystallography of the transformation. The random array
of a/3 <1120> dislocations found in the martensite arises from the transformation
stresses involved.
Evidence has been presented to show that thep->m transformation in titanium
aluminium alloys may occur by a massive reaction, identified by its different
morphology compared with the more familiar massive martensite.
126
(iii) Precipitation of y
They phase has been shown to precipitate out by a shear mechanism siilar
to that found in Co-Ni or Cu-Si alloys, having the orientation relationship
(0001)//1111 and < 1170>//<110>.
This occurs by the dissociation of a/3<1170> dislocations into a/3 <1010>
partials which is thought to be diffusion controlled to a certain extent.
At low temperatures extremely dense arrays of such faults are observed, but
as the temperature of the reaction is increased, this gives way to thin but
perfecty plates to thickery plates.
In the nucleation stage individual faults within thin bundles of faults have
been shown to have the same shear vector, and this together with the extreme
rapidity of the growth of y has been taken as an indication that a pole
mechanism of plate thickening is operative.
(iv) Dislocation reactions
Unique observations have been made on networks of dislocations in the DO19
superlattice. As a consequence a full discussion has been given of the
possible fault configurations which may arise with different dislocation
configurations. A simple cross-slip mechanism is proposed whereby the nets
have only intrinsic faulting at the nodes, and certain irregularities
observed are explained.
PJA/
127
ACKNOWLEDGEMENTS
I wish to thank my Supervisor, Dr P R Swann for his patience, guidance
and interest during the course of this work. The many interesting
discussions and comments, both serious and otherwise, of my colleagues
in the Electron Microscopy Group (particularly Prandip Mukhopadhyay,
Harvey Flower and Dick Adams) have also been much appreciated.
Of the technical staff I would like to thank Bill Bishop for processing
the photographic plates, Tony Lloyd for advice and assistance, and
Miss Pam Martins for preparing the photographs in Chapter 4 of this
thesis.
I am indebted to the Science Research Council for their financial support
and Professor J G Ball for the provision of laboratory facilities.
Finally I would like to express my gratitude to my wife for her
encouragement and kindness at all times.
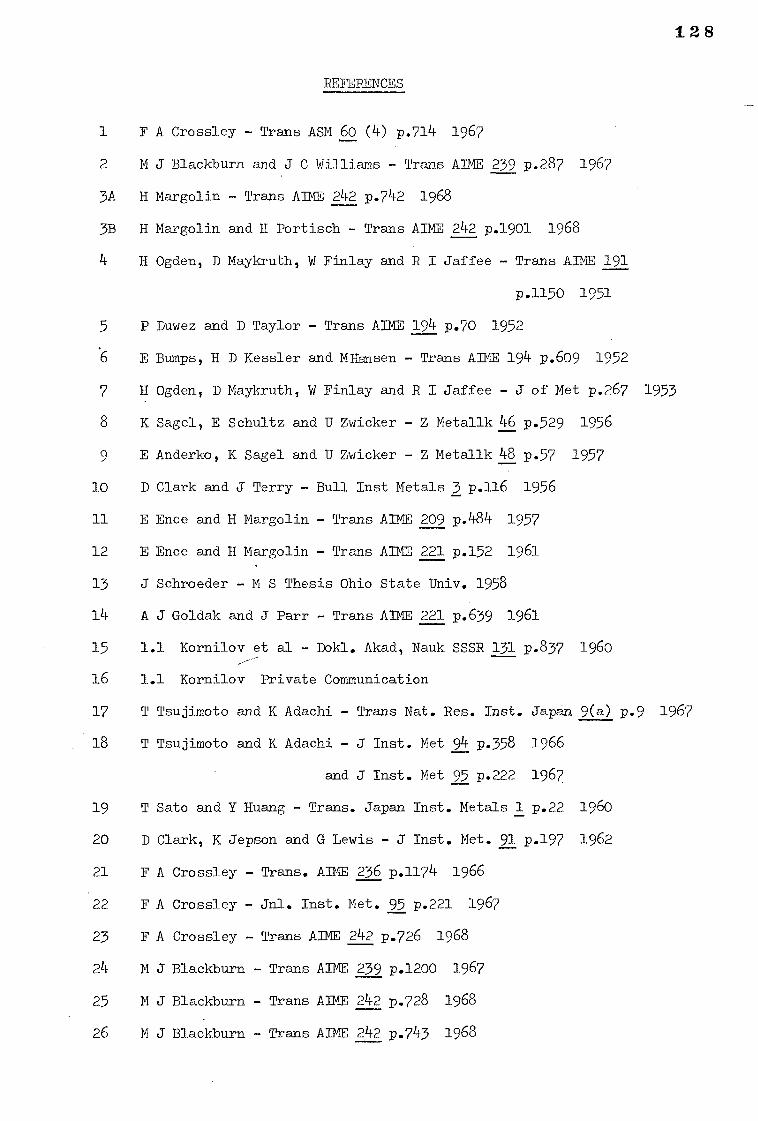
128
REtihRENCES
1 F A Crossley - Trans ASM 60 (4) p.714 1967
2 M J Blackburn and J C Williams - Trans AIME 239 p.287 1967
3A H Margolin - Trans AIME 242 p.742 1968
3B H Margolin and H Portisch - Trans AIME 242 p.1901 1968
4 H Ogden, D Maykruth, W Finlay and R I Jaffee - Trans AIME 191
p.1150 1951
5 P Duwez and D Taylor - Trans AIME 194 p.70 1952
6 E Bumps, H D Kessler and MHansen - Trans AIME 194 p.609 1952
7 H Ogden, D Maykruth, W Finlay and R I Jaffee - J of Met p.267 1953
8 K Sagel, E Schultz and U Zwicker Z Metallk 46 p.529 1956
9 E Anderko, K Sagel and U Zwicker - Z Metallk 48 p.57 1957
10 D Clark and J Terry - Bull Inst Metals 3 p.116 1956
11 E Ence and H Margolin - Trans AIME 209 p.484 1957
12 E Ence and H Margolin - Trans AIME 221 p.152 1961
13 J Schroeder - M S Thesis Ohio State Univ. 1958
14 A J Goldak and J Parr - Trans AIME 221 p.639 1961
15 1.1 Kornilov et al - Dokl. Akad, Nauk SSSR 131 p.837 1960
16 1.1 Kornilov Private Communication
17 T Tsujimoto and K Adachi - Trans Nat. Res. Inst. Japan 9(a) p.9 1967
18 T Tsujimoto and K Adachi - J Inst. Met 94 p.358 1966
and J Inst. Met 95 p.222 1967
19 T Sato and Y Huang - Trans. Japan Inst. Metals 1 p.22 1960
20 D Clark, K Jepson and G Lewis - J Inst. Met. 91 p.197 1962
21 F A Crossley - Trans. AIME 236 p.1174 1966
22 F A Crossley - Jnl. Inst. Met. 95 p.221 1967
23 F A Crossley - Trans AIME 242 p.726 1968
24 M J Blackburn - Trans AIME 239 p.1200 1967
25 M J Blackburn - Trans AIME 242 p.728 1968
26 M J Blackburn - Trans AIME 242 p.743 1968
1.29
27 M J Blackburn - "Science, Technology and Applications of Ti"
Pergammon 1970 p.633
28 T Tsujimoto and K Adachi J Inst. Met. 95 p.146 1967
29 M K McQuillan and A D McQuillan - "Titanium" Butterworths 1956
30 E Collinge and J C Ho - Science Technology & Applications of
Titanium Pergammon 1970 p.331
31 P C Gehlen - "Science, Technology & Applications of Titanium"
Pergammon 1970 p.349
32 P G Baggerly - Siemens Sci. Rev. XXXV 1968 p.62
33 G Lutjering and S Weissman - Acta Met 18 785 1970
34 P G Partridge - Met. Rev. 118, Metals & Materials - p.169 1967
35 M Marcinkowski - "Electron Microscopy and Strength of Crystals"
Ed: G Thomas & J Washburn, Interscience 1963
36 D Hull - "Introduction to Dislocations" Pergammon Press, 1964
37 J P Hirth and J Loethe - "Theory of Dislocations" McGraw-Hill 1968
38 S Amelinckx - Sol. State Phys. Supplement 6 Academic Press 1964
39 L K Ives and A W Ruff Jnr. - Met. Sci. Jnl: 4(ii) p.201 1970
40 E J Rapperport, C Hartley and E Levine - As reported in Prog. in
Mat. Sci. 13(i) p.29 1966
41 M J Blackburn - Trans AIME 239 p.660 1967
42 P Hirsch, A Howie, R Nicholson, D Pashley and M Whelan - "Electron
Microscopy of Thin Crystals" Butterworths London. 1965
43 W G Burgers - Physica 1 p.561 1934
44 C S Barret, A J Williams and R W Cahn - Acta. Met. 2 p.117 1954'
45 J S Bowles and J K Mackensie - Acta Met. 5 p.137 1957
46 Y C Lui and H Margolin - Trans AIME 197 p.667 1953
47 S Weinig and E S Machlin - Trans AIME 200 p.1280 1954
48 P Gaunt and J Christian - Acta Met. 7 p.534 1959
49 C Hammond and P M Kelly - Acta Met. 17 p.869 1969
50 P Duwez - Trans ASM Quart. 45 p.934 1953
130
51 D Clark, A R Brown, J A Gray and G Lewis -"Science, Technology and
Application of Titanium" Pergammon p.677 1970
52 M J Blackburn - Trans ASM Quart 59 p.876 1966
53 Z Nishiyama et all - Trans Jap Inst Met 8 p.127 1967
54 J C Williams and M J Blackburn - Trans ASM Quart 60 p.373 1967
55 H M Flower, D R West and P R Swann - To be published
56 H Ali, R Adams and P R Swann - To be published in Jnl Sci. Inst.
57 J Friedel "Les Dislocations" Gautier-Villiars Paris 1953 p.22
58 W Read - "Dislocations in Crystals" McGraw-Hill London 1953 p.131
59 P R Swann - Phil. Mag. 14 461 1966
60 A Gemperle - Phys. Stat. Sol. 19 333 1967
61 A Gemperle and J Kocik - Phys. Stat. Sol. 30 541 1968
62 N Stoloff and S Davies - Trans AIME 230 390 1964
63 M Hansen - "Constitution of Binary Alloys" McGraw-Hill London 1958
64 R P Elliot - "1st Supplement - Constitution of Binary Alloys" McGraw-Hill London 1965
65 T Muto and Y Takagi - Sol. Stat. Phys. 1 193 1955
66 M K and A D McQuillan "Titanium" Butterworths Press London 1958
67 H W King - "Physical Metallurgy" Ed. R W Cahn, North Holland, Amsterdam 1965
68 J C Williams, R Taggart and D H Polonis - Met. Trans 1 2265 1970
69 H M Flower - Unpublished work
70 T B Massalski - "Phase Transformations"1. Chapman and Hall (for ASM) London 1970
71 H M Flower and P R Swann - "2nd International Conference on Titanium" to be published by Metalurgical Society of AIME
72A E Votova - Acta Met. 8 901 1960
72B E Votova - J.Inst. Met. 90 129 1961-62
73 H Bibring, F Sebilleau and C Buckle - J. Inst. Met. 87 71 1958
74 E de Lamotte and C Alstetter - Trans AIME 245 651 1969
75 P S Kotval and R W K Honeycombe - Acta Met. 16 596 1968
131
76 J A Hren and G Thomas - Trans AIME 227 308 1963
77 K Kinsman et al - Met. Trans 2 1041 1971
78 J K Tien et al - Met Trans 2 1193 1971
79 H Suzuki and C S Barrett - Acta Met. 6 156 1958
80 C S Smith - Trans ASM 45 533 1953
81 Z S Basinski and J W Christian - Phil. Mag. /1/i 791 1953
82 A Seeger - Z fur Metallk 44 247 1953
83 A Seeger - Z fur Metallk 47 653 1956
84 H I Aaronson - "Decomposition of Austenite by Diffusional Processes" John Wiley, New York 1962 p.387
85 J W Christian and P R Swann - "Alloying Behaviour and Effects in Solid Solutions" Ed. T B Massalski, Gordon and Breach, New York 1965 p.105
86 A Berghezan et al - Acta Met. 9 464 1961
87 N Thompson - Proc. ,Roy. Soc. Series A 66 481 1959
88 S.Amelinckx and P Delavignette Jnl. Nucl. Mat. 5(1) 17 1962
89 L M Brown - Phil. Mag. 10 441 1964
90 A Howie and P R Swann - Phil. Mag. 6 1215 1961
91 J C Slater - Phys. Rev. 84(2) 179 1951
92 D E Mikkola and J B Cohen - Jnl. Appl. Phys. 33(3) 892 1961