Embed Size (px)
Citation preview
Physica C 432 (2005) 116–124
www.elsevier.com/locate/physc
Electronic structure of Li2Pd3B and Li2Pt3B
Sharat Chandra *, S. Mathi Jaya, M.C. Valsakumar
Materials Science Division, Indira Gandhi Centre for Atomic Research, Kalpakkam 603102, Tamil Nadu, India
Received 21 February 2005; accepted 25 July 2005Available online 16 September 2005
Abstract
Li2Pd3B is known to be superconducting, while the isotypical Li2Pt3B compound is not. Electronic structures ofLi2Pd3B and Li2Pt3B have been calculated in order to obtain an insight into this surprising difference, through an anal-ysis of the differences in the band structures. The electronic structures of these systems were obtained using the FullPotential Linear Augmented Plane Wave plus local orbitals (FP-LAPW + lo) method and it was found that four bandscross the Fermi level (EF). Out of these four bands, only two bands contribute significantly to the density of states at theEF. One of these bands is a hole band and the other an electron band. Thus at least a two-band model is required forstudying the electronic properties of the Pd and Pt compounds.� 2005 Elsevier B.V. All rights reserved.
PACS: 74.25.Jb; 71.20.�b; 74.70.Dd
1. Introduction
The discovery of superconductivity in MgB2 [1]and subsequently in MgCNi3 [2] and Li2Pd3B [3,4]has evoked substantial experimental and theoreti-cal studies on various properties of these com-pounds. The studies on MgB2 have revealed thatthe electron–phonon coupling strength in thiscompound is rather strong and it is believed thatthis compound is a phonon-mediated supercon-
0921-4534/$ - see front matter � 2005 Elsevier B.V. All rights reservdoi:10.1016/j.physc.2005.07.018
* Corresponding author. Tel.: +91 4114 280347; fax: +914114 280081.
E-mail address: [email protected] (S. Chandra).
ductor. However the large superconducting transi-tion temperature (TC) of this compound remainsas a puzzle. The studies on MgCNi3 revealed thatit is a two-band superconductor [5] and the pres-ence of the van Hove singularity near the Fermienergy in the density of states is believed to havea strong role in the promotion of superconductiv-ity in this system [5,6]. The superconductivity inLi2Pd3B (TC � 8 K) is proposed to be due to thePd-d electrons [7] and it is expected that the d-elec-trons exhibit strong Coulombic correlation effectsthat are likely to be dominant in the electronicproperties of this system. The isotypical comp-ound Li2Pt3B, on the other hand, is found to be
ed.
S. Chandra et al. / Physica C 432 (2005) 116–124 117
nonsuperconducting down to 4 K. This surprisingdifference in the properties of these materials haslead us to undertake calculation of the electronicstructures of these systems which can provideinformation concerning the width and characterof the bands that cross the Fermi level, the densityof states at the EF and its contribution from differ-ent orbitals. We have evaluated the electronicstructure in order to quantify the differences inits electronic structure of Li2Pd3B and Li2Pt3Band analyzed the possible causes of the absenceof superconductivity in Li2Pt3B. We describe ourresults in the following sections along with a briefdescription of the details of calculations.
2. Details of calculation
The crystal structure of the Li2Pd3B has beenplotted using the VENUS package [8]. Detailedelectronic structure of Li2Pd3B and Li2Pt3B com-pounds were calculated using the Full PotentialLinear Augmented Plane Waves plus local orbitals(FP-LAPW+lo) code WIEN2k [9] using the Gen-eralized Gradient Approximation (GGA) of theexchange correlation functional due to Perdew,Burke and Ernzerhof (PBE96) [10]. The self-con-sistent field (SCF) cycles were performed using
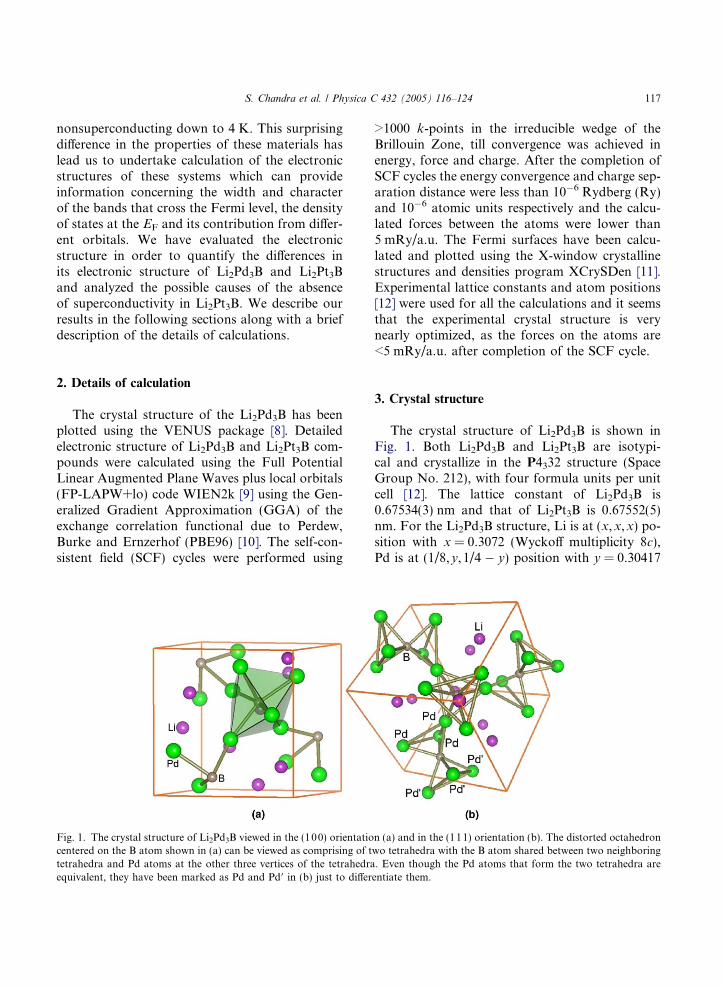
Fig. 1. The crystal structure of Li2Pd3B viewed in the (100) orientatiocentered on the B atom shown in (a) can be viewed as comprising of ttetrahedra and Pd atoms at the other three vertices of the tetrahedraequivalent, they have been marked as Pd and Pd 0 in (b) just to differ
>1000 k-points in the irreducible wedge of theBrillouin Zone, till convergence was achieved inenergy, force and charge. After the completion ofSCF cycles the energy convergence and charge sep-aration distance were less than 10�6 Rydberg (Ry)and 10�6 atomic units respectively and the calcu-lated forces between the atoms were lower than5 mRy/a.u. The Fermi surfaces have been calcu-lated and plotted using the X-window crystallinestructures and densities program XCrySDen [11].Experimental lattice constants and atom positions[12] were used for all the calculations and it seemsthat the experimental crystal structure is verynearly optimized, as the forces on the atoms are<5 mRy/a.u. after completion of the SCF cycle.
3. Crystal structure
The crystal structure of Li2Pd3B is shown inFig. 1. Both Li2Pd3B and Li2Pt3B are isotypi-cal and crystallize in the P4332 structure (SpaceGroup No. 212), with four formula units per unitcell [12]. The lattice constant of Li2Pd3B is0.67534(3) nm and that of Li2Pt3B is 0.67552(5)nm. For the Li2Pd3B structure, Li is at (x,x,x) po-sition with x = 0.3072 (Wyckoff multiplicity 8c),Pd is at (1/8,y, 1/4 � y) position with y = 0.30417
n (a) and in the (111) orientation (b). The distorted octahedronwo tetrahedra with the B atom shared between two neighboring. Even though the Pd atoms that form the two tetrahedra areentiate them.
118 S. Chandra et al. / Physica C 432 (2005) 116–124
(Wyckoff multiplicity 12d) and B is at special posi-tion (7/8,3/8,1/8), (Wyckoff multiplicity 4b). Thecorresponding fractional atom coordinates in theisotypical Li2Pt3B structure are for Li, x = 0.2930and for Pt, y = 0.3079. Fig. 1(a) represents thePd–B coordination as an distorted octahedron.This coordination octahedron has a volume of11.988 · 10�3 nm3. Baur [13] and Robinson et al.[14], have defined three distortion indices for anypolyhedron with a central atom. These are: the dis-tortion index, D ¼ 1
n
Pni¼1
jli�lavjlav
, the quadratic elon-gation, hki ¼ 1
n
Pni¼1
lil0and the bond angle variance,
r2 ¼ 1m�1
Pmi¼1ðui � /0Þ
2, for the distorted polyhe-dron. The coordination number of the centralatom is n (=6 for B). li is the distance from theith coordinating atom to the central atom, i.e.,the ith bond length, lav the average bond length,l0 the bond length in a regular polyhedron of samevolume. m is given by the number of bond angles,or, (3/2) · (number of faces in polyhedron). /i isthe ith bond angle and /0 the ideal bond anglefor the regular polyhedron (90� for an regularoctahedron). As all the bond lengths between thecentral B atom and the Pd atoms at vertices are0.21315 nm, D = 0, and hki and r2 can be calcu-lated to be 1.0508 and 169.168 degree2 respectivelyfor the structure shown in Fig. 1(a). Thus it is veryapparent that the extent of distortion in the poly-hedron is not so much in the bond distances asin the bond angles. This leads us to view the struc-ture in a different way. The alternate view of theLi2Pd3B structure is shown in Fig. 1(b). This is justthe unit cell shown in Fig. 1(a) viewed in the (111)orientation. Immediately it is apparent that thedistorted octahedron breaks up into two tetrahe-dra of equal volume of 2.188 · 10�3 nm3 that areformed by the Pd and B atoms and are rotatedwith respect to each other by 35.68�. Note that ifthe angle of rotation was 60�, then a regular octa-hedron would have been obtained. The central Batom is shared between two tetrahedra which aredenoted as Pd and Pd 0 for our convenience. TheB–Pd or B–Pd 0 bond distance is 0.2131 nm, thatbetween Pd–Pd or Pd 0-Pd 0 is 0.2788 nm while thePd–Pd 0 distance is 0.2964 nm. The angles betweenthe base Pd atoms are 60�, while the correspondingangles between the B atom at the vertex and the Pdatoms in the base (Pd–B–Pd) are equal to 81.692�.
This analysis of the structure leads us to a newerinterpretation of the bonding in these materials.As the Pd–Pd 0 distance is 17% larger than thePd–Pd distance, only the Pd–Pd distance is compa-rable to the nearest neighbor bond distance inmetallic palladium (0.275 nm). As there is strongcovalent bonding between the B and Pd atoms, itis expected that only the Pd–B and Pd–Pd bondsand not the Pd–Pd 0 bonds should play a significantrole in determining the electronic properties ofthese materials. This points to the existence of�bulk� superconductivity in this system as opposedto a �layered� one. As the Li–Li distance is0.2557 nm, which is much less than that in Li me-tal (0.304 nm), there is a complete transfer of elec-trons to the Pd–B sublattice. Hence, Li atomsserve only to stabilize the structure after they havedonated the electrons.
The above discussion also holds true for theLi2Pt3B compound, as the variations in the inter-atomic distances and bond angles are similar tothe Li2Pd3B compound. The Pt6B octahedral vol-ume is 12.088 · 10�3 nm3 and D, hki and r2 canbe calculated to be zero, 1.0543 and 184.218 de-gree2 respectively. The B–Pt, Pt–Pt and Pt–Pt 0
bond distances are 0.2141 nm, 0.2756 nm and0.3026 nm respectively. The corresponding tetra-hedral volume is 2.246 · 10�3 nm3. The angle ofrotation between the two tetrahedra is 36.79� andthe Pt–B–Pt angle is 80.444�.
4. Results and discussion
4.1. Li2Pd3B
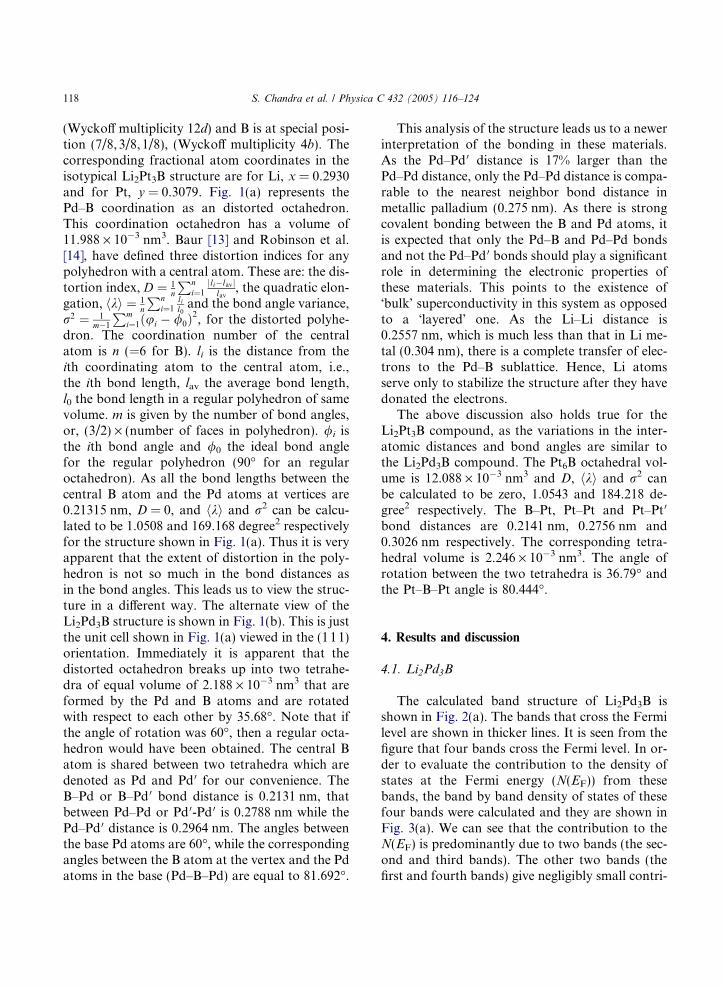
The calculated band structure of Li2Pd3B isshown in Fig. 2(a). The bands that cross the Fermilevel are shown in thicker lines. It is seen from thefigure that four bands cross the Fermi level. In or-der to evaluate the contribution to the density ofstates at the Fermi energy (N(EF)) from thesebands, the band by band density of states of thesefour bands were calculated and they are shown inFig. 3(a). We can see that the contribution to theN(EF) is predominantly due to two bands (the sec-ond and third bands). The other two bands (thefirst and fourth bands) give negligibly small contri-
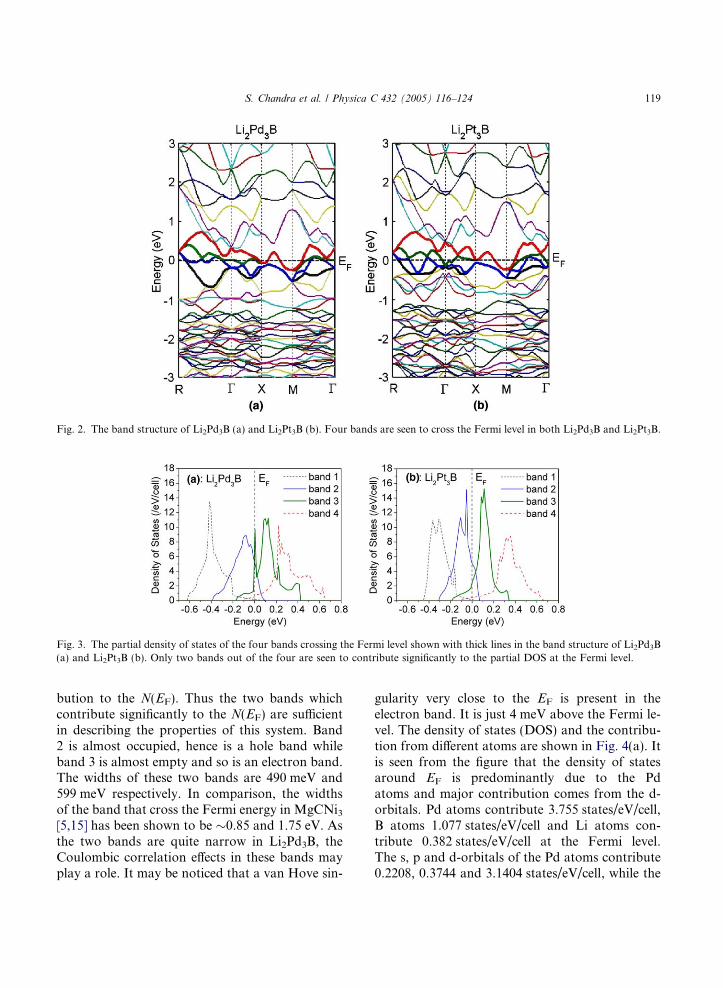
Fig. 2. The band structure of Li2Pd3B (a) and Li2Pt3B (b). Four bands are seen to cross the Fermi level in both Li2Pd3B and Li2Pt3B.
Fig. 3. The partial density of states of the four bands crossing the Fermi level shown with thick lines in the band structure of Li2Pd3B(a) and Li2Pt3B (b). Only two bands out of the four are seen to contribute significantly to the partial DOS at the Fermi level.
S. Chandra et al. / Physica C 432 (2005) 116–124 119
bution to the N(EF). Thus the two bands whichcontribute significantly to the N(EF) are sufficientin describing the properties of this system. Band2 is almost occupied, hence is a hole band whileband 3 is almost empty and so is an electron band.The widths of these two bands are 490 meV and599 meV respectively. In comparison, the widthsof the band that cross the Fermi energy in MgCNi3[5,15] has been shown to be �0.85 and 1.75 eV. Asthe two bands are quite narrow in Li2Pd3B, theCoulombic correlation effects in these bands mayplay a role. It may be noticed that a van Hove sin-
gularity very close to the EF is present in theelectron band. It is just 4 meV above the Fermi le-vel. The density of states (DOS) and the contribu-tion from different atoms are shown in Fig. 4(a). Itis seen from the figure that the density of statesaround EF is predominantly due to the Pdatoms and major contribution comes from the d-orbitals. Pd atoms contribute 3.755 states/eV/cell,B atoms 1.077 states/eV/cell and Li atoms con-tribute 0.382 states/eV/cell at the Fermi level.The s, p and d-orbitals of the Pd atoms contribute0.2208, 0.3744 and 3.1404 states/eV/cell, while the
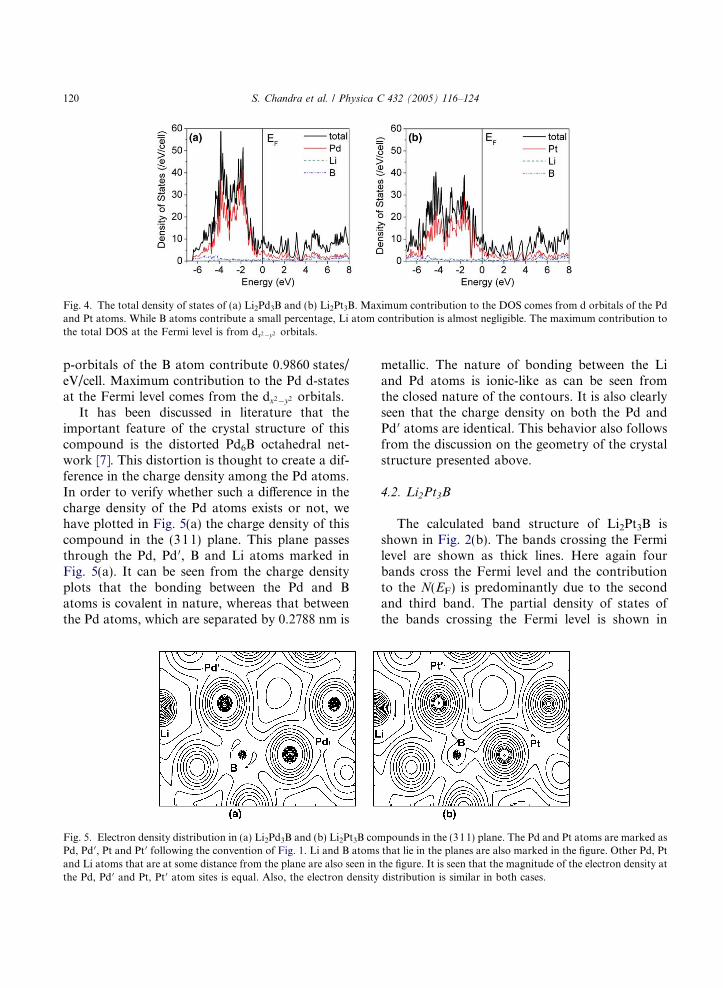
Fig. 4. The total density of states of (a) Li2Pd3B and (b) Li2Pt3B. Maximum contribution to the DOS comes from d orbitals of the Pdand Pt atoms. While B atoms contribute a small percentage, Li atom contribution is almost negligible. The maximum contribution tothe total DOS at the Fermi level is from dx2�y2 orbitals.
120 S. Chandra et al. / Physica C 432 (2005) 116–124
p-orbitals of the B atom contribute 0.9860 states/eV/cell. Maximum contribution to the Pd d-statesat the Fermi level comes from the dx2�y2 orbitals.
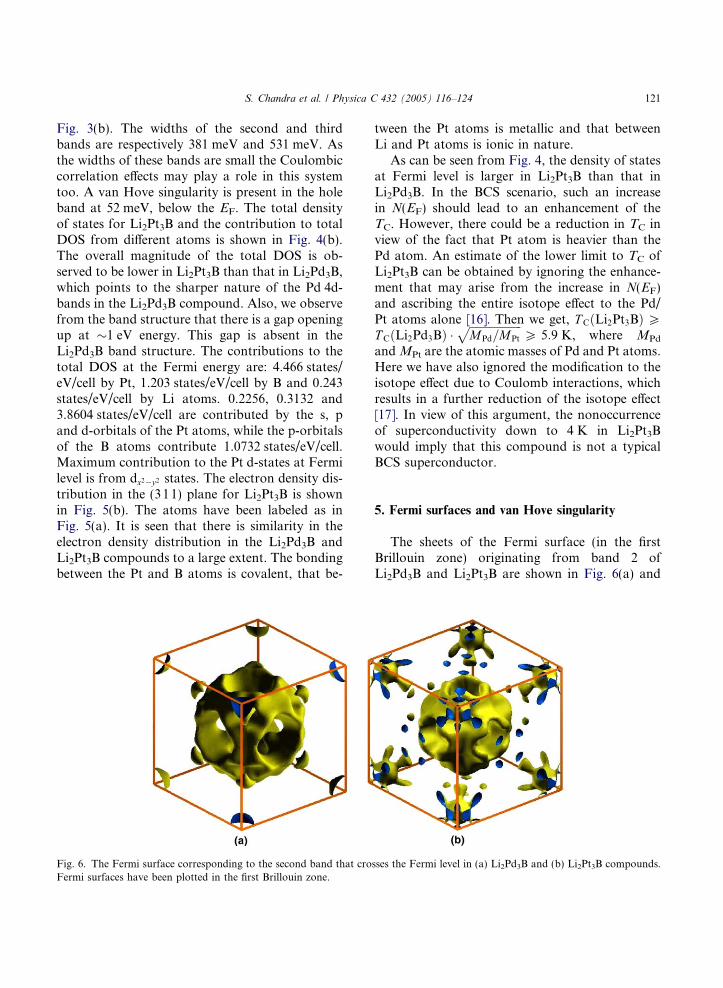
It has been discussed in literature that theimportant feature of the crystal structure of thiscompound is the distorted Pd6B octahedral net-work [7]. This distortion is thought to create a dif-ference in the charge density among the Pd atoms.In order to verify whether such a difference in thecharge density of the Pd atoms exists or not, wehave plotted in Fig. 5(a) the charge density of thiscompound in the (311) plane. This plane passesthrough the Pd, Pd 0, B and Li atoms marked inFig. 5(a). It can be seen from the charge densityplots that the bonding between the Pd and Batoms is covalent in nature, whereas that betweenthe Pd atoms, which are separated by 0.2788 nm is
Fig. 5. Electron density distribution in (a) Li2Pd3B and (b) Li2Pt3B comPd, Pd 0, Pt and Pt0 following the convention of Fig. 1. Li and B atomsand Li atoms that are at some distance from the plane are also seen inthe Pd, Pd 0 and Pt, Pt 0 atom sites is equal. Also, the electron density
metallic. The nature of bonding between the Liand Pd atoms is ionic-like as can be seen fromthe closed nature of the contours. It is also clearlyseen that the charge density on both the Pd andPd 0 atoms are identical. This behavior also followsfrom the discussion on the geometry of the crystalstructure presented above.
4.2. Li2Pt3B
The calculated band structure of Li2Pt3B isshown in Fig. 2(b). The bands crossing the Fermilevel are shown as thick lines. Here again fourbands cross the Fermi level and the contributionto the N(EF) is predominantly due to the secondand third band. The partial density of states ofthe bands crossing the Fermi level is shown in
pounds in the (311) plane. The Pd and Pt atoms are marked asthat lie in the planes are also marked in the figure. Other Pd, Ptthe figure. It is seen that the magnitude of the electron density atdistribution is similar in both cases.
S. Chandra et al. / Physica C 432 (2005) 116–124 121
Fig. 3(b). The widths of the second and thirdbands are respectively 381 meV and 531 meV. Asthe widths of these bands are small the Coulombiccorrelation effects may play a role in this systemtoo. A van Hove singularity is present in the holeband at 52 meV, below the EF. The total densityof states for Li2Pt3B and the contribution to totalDOS from different atoms is shown in Fig. 4(b).The overall magnitude of the total DOS is ob-served to be lower in Li2Pt3B than that in Li2Pd3B,which points to the sharper nature of the Pd 4d-bands in the Li2Pd3B compound. Also, we observefrom the band structure that there is a gap openingup at �1 eV energy. This gap is absent in theLi2Pd3B band structure. The contributions to thetotal DOS at the Fermi energy are: 4.466 states/eV/cell by Pt, 1.203 states/eV/cell by B and 0.243states/eV/cell by Li atoms. 0.2256, 0.3132 and3.8604 states/eV/cell are contributed by the s, pand d-orbitals of the Pt atoms, while the p-orbitalsof the B atoms contribute 1.0732 states/eV/cell.Maximum contribution to the Pt d-states at Fermilevel is from dx2�y2 states. The electron density dis-tribution in the (311) plane for Li2Pt3B is shownin Fig. 5(b). The atoms have been labeled as inFig. 5(a). It is seen that there is similarity in theelectron density distribution in the Li2Pd3B andLi2Pt3B compounds to a large extent. The bondingbetween the Pt and B atoms is covalent, that be-
Fig. 6. The Fermi surface corresponding to the second band that croFermi surfaces have been plotted in the first Brillouin zone.
tween the Pt atoms is metallic and that betweenLi and Pt atoms is ionic in nature.
As can be seen from Fig. 4, the density of statesat Fermi level is larger in Li2Pt3B than that inLi2Pd3B. In the BCS scenario, such an increasein N(EF) should lead to an enhancement of theTC. However, there could be a reduction in TC inview of the fact that Pt atom is heavier than thePd atom. An estimate of the lower limit to TC ofLi2Pt3B can be obtained by ignoring the enhance-ment that may arise from the increase in N(EF)and ascribing the entire isotope effect to the Pd/Pt atoms alone [16]. Then we get, T CðLi2Pt3BÞ PT CðLi2Pd3BÞ �
ffiffiffiffiffiffiffiffiffiffiffiffiffiffiffiffiffiffiffiMPd=MPt
pP 5:9 K, where MPd
andMPt are the atomic masses of Pd and Pt atoms.Here we have also ignored the modification to theisotope effect due to Coulomb interactions, whichresults in a further reduction of the isotope effect[17]. In view of this argument, the nonoccurrenceof superconductivity down to 4 K in Li2Pt3Bwould imply that this compound is not a typicalBCS superconductor.
5. Fermi surfaces and van Hove singularity
The sheets of the Fermi surface (in the firstBrillouin zone) originating from band 2 ofLi2Pd3B and Li2Pt3B are shown in Fig. 6(a) and
sses the Fermi level in (a) Li2Pd3B and (b) Li2Pt3B compounds.
122 S. Chandra et al. / Physica C 432 (2005) 116–124
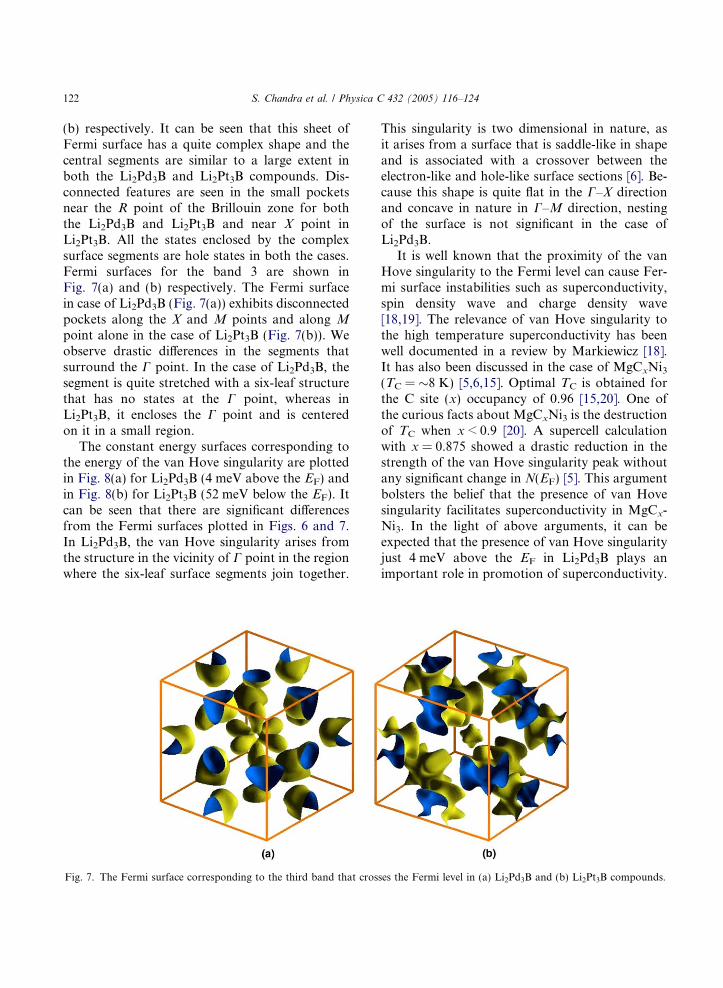
(b) respectively. It can be seen that this sheet ofFermi surface has a quite complex shape and thecentral segments are similar to a large extent inboth the Li2Pd3B and Li2Pt3B compounds. Dis-connected features are seen in the small pocketsnear the R point of the Brillouin zone for boththe Li2Pd3B and Li2Pt3B and near X point inLi2Pt3B. All the states enclosed by the complexsurface segments are hole states in both the cases.Fermi surfaces for the band 3 are shown inFig. 7(a) and (b) respectively. The Fermi surfacein case of Li2Pd3B (Fig. 7(a)) exhibits disconnectedpockets along the X and M points and along Mpoint alone in the case of Li2Pt3B (Fig. 7(b)). Weobserve drastic differences in the segments thatsurround the C point. In the case of Li2Pd3B, thesegment is quite stretched with a six-leaf structurethat has no states at the C point, whereas inLi2Pt3B, it encloses the C point and is centeredon it in a small region.
The constant energy surfaces corresponding tothe energy of the van Hove singularity are plottedin Fig. 8(a) for Li2Pd3B (4 meV above the EF) andin Fig. 8(b) for Li2Pt3B (52 meV below the EF). Itcan be seen that there are significant differencesfrom the Fermi surfaces plotted in Figs. 6 and 7.In Li2Pd3B, the van Hove singularity arises fromthe structure in the vicinity of C point in the regionwhere the six-leaf surface segments join together.
Fig. 7. The Fermi surface corresponding to the third band that cros
This singularity is two dimensional in nature, asit arises from a surface that is saddle-like in shapeand is associated with a crossover between theelectron-like and hole-like surface sections [6]. Be-cause this shape is quite flat in the C–X directionand concave in nature in C–M direction, nestingof the surface is not significant in the case ofLi2Pd3B.
It is well known that the proximity of the vanHove singularity to the Fermi level can cause Fer-mi surface instabilities such as superconductivity,spin density wave and charge density wave[18,19]. The relevance of van Hove singularity tothe high temperature superconductivity has beenwell documented in a review by Markiewicz [18].It has also been discussed in the case of MgCxNi3(TC = �8 K) [5,6,15]. Optimal TC is obtained forthe C site (x) occupancy of 0.96 [15,20]. One ofthe curious facts about MgCxNi3 is the destructionof TC when x < 0.9 [20]. A supercell calculationwith x = 0.875 showed a drastic reduction in thestrength of the van Hove singularity peak withoutany significant change in N(EF) [5]. This argumentbolsters the belief that the presence of van Hovesingularity facilitates superconductivity in MgCx-Ni3. In the light of above arguments, it can beexpected that the presence of van Hove singularityjust 4 meV above the EF in Li2Pd3B plays animportant role in promotion of superconductivity.
ses the Fermi level in (a) Li2Pd3B and (b) Li2Pt3B compounds.
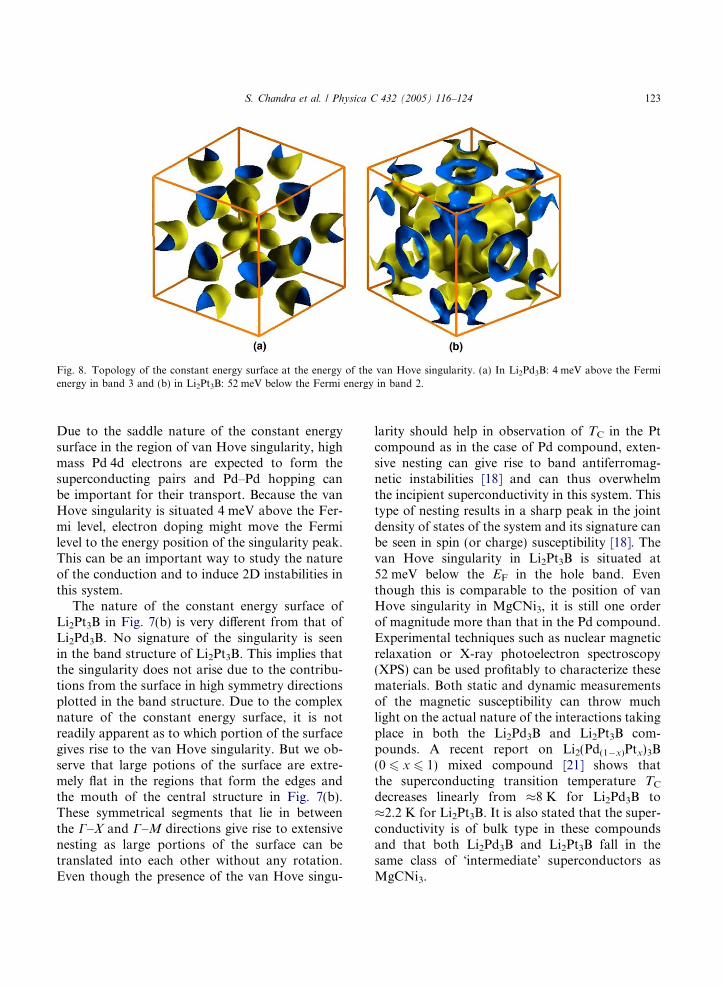
Fig. 8. Topology of the constant energy surface at the energy of the van Hove singularity. (a) In Li2Pd3B: 4 meV above the Fermienergy in band 3 and (b) in Li2Pt3B: 52 meV below the Fermi energy in band 2.
S. Chandra et al. / Physica C 432 (2005) 116–124 123
Due to the saddle nature of the constant energysurface in the region of van Hove singularity, highmass Pd 4d electrons are expected to form thesuperconducting pairs and Pd–Pd hopping canbe important for their transport. Because the vanHove singularity is situated 4 meV above the Fer-mi level, electron doping might move the Fermilevel to the energy position of the singularity peak.This can be an important way to study the natureof the conduction and to induce 2D instabilities inthis system.
The nature of the constant energy surface ofLi2Pt3B in Fig. 7(b) is very different from that ofLi2Pd3B. No signature of the singularity is seenin the band structure of Li2Pt3B. This implies thatthe singularity does not arise due to the contribu-tions from the surface in high symmetry directionsplotted in the band structure. Due to the complexnature of the constant energy surface, it is notreadily apparent as to which portion of the surfacegives rise to the van Hove singularity. But we ob-serve that large potions of the surface are extre-mely flat in the regions that form the edges andthe mouth of the central structure in Fig. 7(b).These symmetrical segments that lie in betweenthe C–X and C–M directions give rise to extensivenesting as large portions of the surface can betranslated into each other without any rotation.Even though the presence of the van Hove singu-
larity should help in observation of TC in the Ptcompound as in the case of Pd compound, exten-sive nesting can give rise to band antiferromag-netic instabilities [18] and can thus overwhelmthe incipient superconductivity in this system. Thistype of nesting results in a sharp peak in the jointdensity of states of the system and its signature canbe seen in spin (or charge) susceptibility [18]. Thevan Hove singularity in Li2Pt3B is situated at52 meV below the EF in the hole band. Eventhough this is comparable to the position of vanHove singularity in MgCNi3, it is still one orderof magnitude more than that in the Pd compound.Experimental techniques such as nuclear magneticrelaxation or X-ray photoelectron spectroscopy(XPS) can be used profitably to characterize thesematerials. Both static and dynamic measurementsof the magnetic susceptibility can throw muchlight on the actual nature of the interactions takingplace in both the Li2Pd3B and Li2Pt3B com-pounds. A recent report on Li2(Pd(1�x)Ptx)3B(0 6 x 6 1) mixed compound [21] shows thatthe superconducting transition temperature TC
decreases linearly from �8 K for Li2Pd3B to�2.2 K for Li2Pt3B. It is also stated that the super-conductivity is of bulk type in these compoundsand that both Li2Pd3B and Li2Pt3B fall in thesame class of �intermediate� superconductors asMgCNi3.
124 S. Chandra et al. / Physica C 432 (2005) 116–124
It should also be mentioned here that the corelevel and valence band photoemission spectra hasbeen studied by XPS recently [22]. The authorshave found that, while the satellite features ofPd 3p and 3d core levels are small as comparedto those observed in Pd and PdO, the valence statespectra can be described adequately by the totalDOS calculated by the band structure method.These results indicate that the electron correlationeffects do not play a major role in Li2Pd3B com-pound. In addition, the valency of the Pd atomin Li2Pd3B is between 0 and 2, which is in effectiveproximity to the 4d9 configuration [22].
6. Conclusions
The electronic structure of isotypical com-pounds Li2Pd3B and Li2Pt3B have been calculatedusing the FP-LAPW+lo method. A new interpre-tation of the structure of the two compounds hasbeen given. It is shown that the distorted Pd6Boctahedron can be decomposed into two regulartetrahedra rendering all the Pd atoms equivalent.This is also borne out by the calculated electrondensity distribution where all the Pd atoms areshown to have the same electron density. Eventhough four bands cross the Fermi level in boththe cases, only two bands contribute significantlyto the density of states at the EF. Hence two-bandmodel is sufficient to account for the properties ofthese compounds. The Fermi surfaces of thesetwo bands are quite complex. van Hove singular-ity peaks are observed to be present near the EF
in the density of states of the two compounds,4 meV above the EF in Li2Pd3B and 52 meVbelow the EF in Li2Pt3B. The proximity of thevan Hove singularity to the Fermi level and thenature of the Fermi surface are quite importantin determining the behavior of the material. Eventhough van Hove singularity is present in boththe cases, the nature of the interactions takingplace in both the compounds is quite different,as there is extensive nesting of the constant energysurface in the case of Li2Pt3B. This has a bearingon the observation of superconductivity in thesecompounds.
References
[1] J. Nagamatsu, N. Nakagawa, T. Muranaka, Y. Zenitani, J.Akimitsu, Nature 410 (2001) 63;C. Buzea, T. Yamashita, Supercond. Sci. Technol. 14(2001) R115, and the references therein.
[2] T. He, Q. Huang, A.P. Ramirez, Y. Wang, K.A. Regan, N.Rogado, M.A. Hayward, M.K. Haas, J.S. Slusky, K.Inumaru, H.W. Zandbergen, N.P. Ong, R.J. Kava, Nature411 (2001) 54.
[3] K. Togano, P. Badica, Y. Nakamori, S. Orimo, H. Takeya,K. Hirata, Phys. Rev. Lett. 93 (2004) 247004.
[4] P. Bidica, T. Kondo, T. Kudo, Y. Nakamori, S. Orimo, K.Togano, Appl. Phys. Lett. 85 (2004) 4433.
[5] T. Geetha Kumary, J. Janaki, A. Mani, S. Mathi Jaya, V.S.Sastry, Y. Hariharan, T.S. Radhakrishnan, M.C. Valsaku-mar, Phys. Rev. B 66 (2002) 064510.
[6] H. Rosner, R. Weht, M.D. Johannes, W.E. Pickett, E.Tosatti, Phys. Rev. Lett. 88 (2002) 027001.
[7] M. Sardar, D. Sa, Physica C 411 (2004) 120.[8] F. Izumi, R.A. Dilanian, Recent Research Developments
in Physics, vol. 3, part II, Transworld Research Network,Trivandrum, 2002, p. 699.
[9] P. Blaha, K. Schwarz, G.K.H. Madsen, D. Kvasnicka, J.Luitz, WIEN2k, An augmented plane wave + local orbitalsprogram for calculating crystal properties (KarlheinzSchwarz, Techn. Universitat Wien, Austria), 2001. ISBN3-9501031-1-2.
[10] J.P. Perdew, S. Burke, M. Ernzerhof, Phys. Rev. Lett. 77(1996) 3865.
[11] A. Kokalj, J. Mol. Graph. Model. 17 (1999) 176, Codeavailable from: <http://www.xcrysden.org/>.
[12] U. Eibenstein, W. Jung, J. Solid State Chem. 133 (1997) 21.[13] W.H. Baur, Acta Cryst. B 30 (1974) 1195.[14] K. Robinson, G.V. Gibbs, P.H. Ribbe, Science 172 (1971)
567.[15] D.J. Singh, I. Mazin, Phys. Rev. B 64 (2001) 140507(R);
S.B. Dugdale, T. Jarlborg, Phys. Rev. B 64 (2001) 100508.[16] C. Kittel, Introduction to Solid State Physics, seventh ed.,
John Wiley & Sons, Singapore, 1996, p. 346.[17] P. Morel, P.W. Anderson, Phys. Rev. 125 (1962) 1263.[18] R.S. Markiewicz, J. Phys. Chem. Solids 58 (1997) 1179,
and the references therein.[19] T.M. Rice, G.K. Scott, Phys. Rev. Lett. 35 (1975) 120;
D.M. Newns, P.C. Pattnaik, C.C. Tsuei, Phys. Rev. B 43(1991) 3075;J.E. Hirsch, D.J. Scalapino, Phys. Rev. Lett. 56 (1986)2732.
[20] Z.A. Ren, G.C. Che, S.L. Jia, H. Chen, Y.M. Ni, G.D. Liu,Z.X. Zhao, Physica C 371 (2001) 1;T.G. Amos, Q. Huang, J.W. Lynn, T. He, R.J. Cava, SolidState Commun. 121 (2002) 73.
[21] P. Badica, T. Kondo, K. Togano, J. Phys. Soc. Japan 74(2005) 1014.
[22] T. Yokoya, T. Muro, I. Hase, H. Takeya, K. Hirata, K.Togano, Phys. Rev. B 71 (2005) 092507.