Embed Size (px)
Citation preview

Electronic Supplementary Material I: Glossary
Table 1. Rate constants for GIT and spleen
Rate constant(Unit)
Formula Process GIT Spleen Splanchnic
Vascular space
kVAS−circul .Organ (hr-1) QOrgan−LOrgan
V VASOrgan
Transfer from vascular compartment to plasma
538.9 299.4 419.2
(1−σVAS)∗k LY VAS− ISFOrgan
(hr-1)(1−σVAS)∗LOrgan
V VASOrgan
Transfer from vascular to interstitial compartment via lymphatic flow
0.054 0.03 0.042
kVAS−ELOrgan (hr-1) CLUptake
Organ
V VASOrgan
Elimination from vascular compartment
1.87E-05 5.43E-06 1.21E-05
kVAS−VASOrgan (hr-1) CLUptake
Organ
V ENDOrgan ∗k 1
Input from vascular compartment to itself. Reflect endosomal contribution to vascular compartment
1.73E-05 5.30E-06 1.13E-05
kVAS−ISFOrgan (hr-1) (1−FR)∗CLUptake
Organ
V ENDOrgan ∗k1
Transfer from vascular to interstitial compartment
4.92E-06 1.51E-06 3.22E-06
k ISF−VASOrgan (hr-1) FR∗CLUptake
Organ
V ENDOrgan ∗k2
Transfer from interstitial to vascular compartment
2.06E-06 1.89E-06 1.98E-06
Interstitial space(1−σVAS)∗k LY VAS− ISF
Organ (hr-1)
(1−σVAS)∗LOrgan
V VASOrgan
Transfer from vascular to interstitial compartment via lymphatic flow
0.054 0.03 0.042
(1−σ LY)∗kLY ISF−lnOrgan (hr-
1)(1−σ LY)∗LOrgan
V ISFOrgan
Transfer from interstitial compartment to lymph node via lymphatic flow
0.14 0.24 0.192
k ISF−ELOrgan (hr-1) CLUptake
Organ
V ISFOrgan
Elimination from interstitial compartment
3.1E-06 2.7E-06 2.91E-06
kVAS−ISFOrgan (hr-1) (1−FR)∗CLUptake
Organ
V ENDOrgan ∗k1
Transfer from vascular to interstitial compartment
4.92E-06 1.51E-06 3.22E-06
k ISF−ISFOrgan (hr-1) CLUptake
Organ
V ENDOrgan ∗k 2
Input from interstitial compartment to itself. Reflect endosomal contribution to interstitial compartment
2.88E-06 2.65E-06 2.76E-06
k ISF−VASOrgan (hr-1) FR∗CLUptake
Organ
V ENDOrgan ∗k2
Transfer from interstitial to vascular compartment
2.06E-06 1.89E-06 1.98E-06

** The difference in rate constants governing transfer of species in GIT and spleen is less than 5 folds (Table 1). Transfer rates for the lumped compartment k XXX−XXX
Splanchnic are calculated as the average of those for GIT and spleen.
Table 2. Rate constants for heart, kidney, skin, and muscle
Rate constant(Unit)
Formula Heart Kidney skin Muscle Visceral
Vascular space
kVAS−circul .Organ (hr-1) QOrgan−LOrgan
V VASOrgan
2395.2 1596.8 362.3 319.4 1168.4
(1−σVAS)∗k LY VAS− ISFOrgan
(hr-1)(1−σVAS)∗LOrgan
V VASOrgan
0.24 0.16 0.036 0.032 0.12
kVAS−ELOrgan (hr-1) CLUptake
Organ
V VASOrgan
1.03E-05 5.39E-06 7.98E-06 2.87E-05 1.31E-05
kVAS−VASOrgan (hr-1) CLUptake
Organ
V ENDOrgan ∗k 1
1.01E-05 5.33E-06 7.88E-06 2.71E-05 1.26E-05
kVAS−ISFOrgan (hr-1) (1−FR)∗CLUptake
Organ
V ENDOrgan ∗k1
2.87E-06 1.52E-06 2.25E-06 7.71E-06 3.59E-06
k ISF−VASOrgan (hr-1) FR∗CLUptake
Organ
V ENDOrgan ∗k2
2.66E-06 1.13E-06 1.13E-06 2.81E-06 1.93E-06
Interstitial space(1−σVAS)∗k LY VAS− ISF
Organ (hr-1)
(1−σVAS)∗LOrgan
V VASOrgan
0.24 0.16 0.036 0.032 0.12
(1−σ LY)∗kLY ISF−lnOrgan (hr-
1)(1−σ LY)∗LOrgan
V ISFOrgan
1.41 0.76 0.12 0.074 0.59
k ISF−ELOrgan (hr-1) CLUptake
Organ
V ISFOrgan
3.8E-06 1.6E-06 1.6E-06 4.17E-06 2.79E-06
kVAS−ISFOrgan (hr-1) (1−FR)∗CLUptake
Organ
V ENDOrgan ∗k1
2.87E-06 1.52E-06 2.25E-06 7.71E-06 3.59E-06
k ISF−ISFOrgan (hr-1) CLUptake
Organ
V ENDOrgan ∗k 2
3.71E-06 1.58E-06 1.58E-06 3.93E-06 2.70E-06
k ISF−VASOrgan (hr-1) FR∗CLUptake
Organ
V ENDOrgan ∗k2
2.66E-06 1.13E-06 1.13E-06 2.81E-06 1.93E-06
** The difference in rate constants governing transfer of species in heart, kidney, skin, and muscle is less than 8 folds (Table 1). An exception is the transfer rate from the interstitial compartment to the LN which is 12 and 19 folds higher for heart than skin and muscle. For simplicity, these rates are considered close and rate for the lumped compartment k XXX−XXX
Visceral are calculated as the median of those for heart, kidney, skin, and muscle.
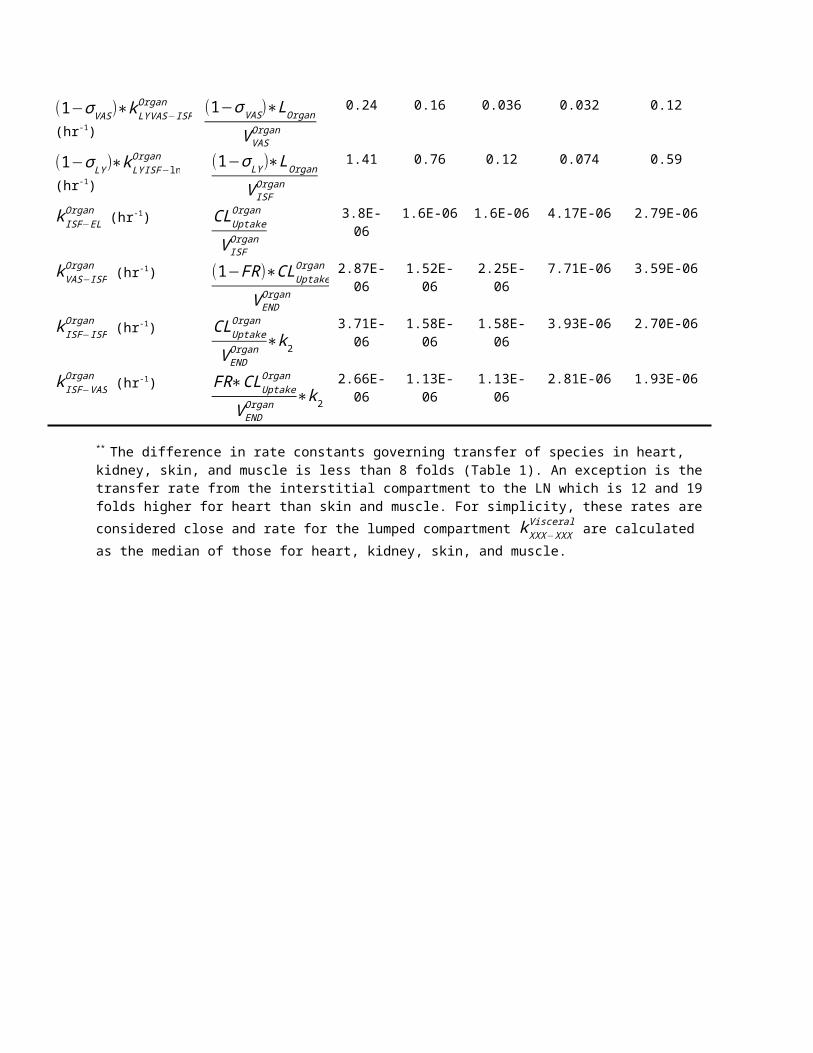
Table 3. Rate constants for splanchnic and visceral
Rate constant(Unit)
Formula Splanchnic Visceral Peripheral
Vascular space
kVAS−circul .Organ (hr-1) QOrgan−LOrgan
V VASOrgan
419.2 1168.4 793.8
(1−σVAS)∗k LY VAS− ISFOrgan
(hr-1)(1−σVAS)∗LOrgan
V VASOrgan
0.042 0.12 0.08
kVAS−ELOrgan (hr-1) CLUptake
Organ
V VASOrgan
1.21E-05 1.31E-05 1.26E-05
kVAS−VASOrgan (hr-1) CLUptake
Organ
V ENDOrgan ∗k 1
1.13E-05 1.26E-05 1.19E-05
kVAS−ISFOrgan (hr-1) (1−FR)∗CLUptake
Organ
V ENDOrgan ∗k1
3.22E-06 3.59E-06 3.40E-06
k ISF−VASOrgan (hr-1) FR∗CLUptake
Organ
V ENDOrgan ∗k2
1.98E-06 1.93E-06 1.95E-06
Interstitial space(1−σVAS)∗k LY VAS− ISF
Organ (hr-1)
(1−σVAS)∗LOrgan
V VASOrgan
0.042 0.12 0.08
(1−σ LY)∗kLY ISF−lnOrgan (hr-
1)(1−σ LY)∗LOrgan
V ISFOrgan
0.192 0.59 0.39
k ISF−ELOrgan (hr-1) CLUptake
Organ
V ISFOrgan
2.91E-06 2.79E-06 2.85E-06
kVAS−ISFOrgan (hr-1) (1−FR)∗CLUptake
Organ
V ENDOrgan ∗k1
3.22E-06 3.59E-06 3.40E-06
k ISF−ISFOrgan (hr-1) CLUptake
Organ
V ENDOrgan ∗k 2
2.76E-06 2.70E-06 2.73E-06
k ISF−VASOrgan (hr-1) FR∗CLUptake
Organ
V ENDOrgan ∗k2
1.98E-06 1.93E-06 1.95E-06
** The difference in rate constants governing transfer of species in splanchnic and visceral compartments is less than 3 folds (Table 1). Transfer rates are considered close and rate for the lumped compartment k XXX−XXX
Peripheral are calculated as the average of those for splanchnic and visceral compartments.

Table 4. Rate constants for central, peripheral and lymph node compartments
Rate constant(Unit)
Formula Process Value
Vascular space
k ELCentral (hr-1) k VAS−EL
Peripheral
(1+kVAS−circul .
Peripheral
QPeripheral
V Plasma
)
Elimination rate from the central compartment
6.1E-06
(1−σVAS)∗k LY−ISFCentral (hr-
1)(1−σVAS)∗kLY VAS− ISF
Perip h eral
(1+kVAS−circul .
Periph eral
QPeriph eral
V Plasma
)
Transfer rate from the central to interstitial (i.e. peripheral) compartment via lymphatic flow
0.018
kCentralCentral (hr-1) k VAS−VAS
Peripheral
(1+kVAS−circul .
Peripheral
QPeripheral
V Plasma
)
First order input from central compartment to itself which reflects the impact of recycled drug from endosomal compartment
5.8E-06
kCe ntral− ISFCentral (hr-1) kVAS− ISF
Peripheral
(1+kVAS−circul .
Perip h eral
QPeriph eral
V Plasma
)
First order input from central to interstitial (i.e. peripheral) compartment
1.6E-06
k ISF−CentralPeriph eral (hr-1) k ISF−VAS
Peripheral Transfer from interstitial (i.e. peripheral) to central compartments
1.95E-06
(1−σ LY)∗kLY ISF−lnPerip h eral
(hr-1)(1−σ LY)∗LPeripheral
V ISFPeripheral
Transfer from interstitial (i.e. peripheral) compartment to lymph node via lymphatic flow
0.39
k ISF−ISFPeriph eral (hr-1) CLUptake
Peripheral
V ENDPeripheral ∗k2
Input from Peripheral compartment to itself. Reflect endosomal contribution to interstitial compartment
2.73E-06
k ISF−CentralPeriph eral (hr-1) FR∗CLUptake
Perip heral
V ENDPeripheral ∗k2
Transfer from Peripheral to Central compartment
1.95E-06
1Tauln
(hr-1)Transfer from lymph node to Central compartment
0.11

Electronic Supplementary Material II: Supplementary Figures
Supplementary Figure 1. Impact of F1 and F2 reflecting the non-FcRn dependent tissue uptake on mAb plasma PK. The figure shows some deviations upon removing the 2 coefficients. These deviations may be explained by mAb-specific processes such as surface charge and target binding.

Supplementary Figure 2. Simulation using full model showing amounts of free and bound mAb in different endosomal subcompartments. Muscle is used as an example. Free mAb is 4 to 8 log-folds lower thanKDEND and thus are considered negligible compared toKDEND.

Supplementary Figure 3. Simulations from the full PBPK Model. A, amounts of mAb in plasma and lymph node. Lymph compartment shows high contribution to the mass of mAb in the body. Amounts in vascular and interstitial compartments of heart shown as an example of tissue PK. B, concentrations of mAb in plasma showing biexponential profile. Vascular compartment rapidly equilibrates with plasma.

Supplementary Figure 4. Simulations from the full PBPK Model showing amounts in endosomal compartments of representative organs.


Supplementary Figure 5. Simulations from the full PBPK Model showing steady-state concentrations (achieved by
continuous IV infusion)
Supplementary Figure 6. Diagnostic plots for assessment of models fit to the data: (a) observations vs. population prediction, (b) observations vs. individual prediction (c) conditional weighted residuals vs. predicted concentration, and (d) conditional weighted residuals vs. time

Supplementary Figure 7. Simulations from the simple physiological model, A, and the two compartmental model, B. Concentration in peripheral compartment in two compartment model is over predicted by assuming equilibrium with central compartment.