Embed Size (px)
Citation preview
Electrophoresis 2013, 34, 725–735 725
Issam Charhrouchni1Antoine Pallandre2
Isabelle Le Potier2
Claude Deslouis3
Anne-Marie Haghiri-Gosnet1
1Laboratoire de Photonique etNanostructures, LPN,CNRS-UPR20, Marcoussis,France
2Univ. Paris-Sud, Faculte dePharmacie, Institut GalienParis-Sud, CNRS,Chatenay-Malabry, France
3Laboratoire Interfaces etSystemes Electrochimiques,LISE, CNRS-UPR15, Paris,France
Received October 4, 2012Revised November 22, 2012Accepted December 4, 2012
Research Article
Computational study of velocity profileobtained in microfluidic channel bearing afluidic transistor: Toward highly resolvedelectrophoretic separation
The present work is a computational study of velocity profiles in microfluidic channelsbearing field flow effect transistors (FFET). In particular, this work investigates perturba-tions and distortions of the sample band during electrophoretic transport in a rectangularseparation channel. The EOF heterogeneity and its induced pressure render the predictionsof the analytical performances rather complex. In this context, we propose a systematicnumerical inquiry that focuses on the distribution of the velocities for several geometriesand EOF modulations. We compare the calculated parabolic velocity profiles to the bareglass microchips. Here, the reported parabolic velocity profiles are coherent with recentexperimental results that have been published elsewhere. From the presented equations,in such active hybrid microfluidic chip that integrates a FFET gate layer, separation canbe optimized by playing on the gate coverage ratio. The flow fields obtained from an-alytical models allow further investigations about the efficiency and resolution duringelectrophoresis. The resulting induced pressure gradient and the associated band broad-ening underline the need to optimize the resolution in the detriment of the efficiency insuch active microfluidic chips.
Keywords:
Electrophoretic separation / Fluidic transistor / Resolution / Velocity profile / Zetapotential DOI 10.1002/elps.201200537
1 Introduction
Microfluidic devices successfully perform electrically drivenseparations and thus remain the most promising miniatur-ized benchtop platforms for biological analysis [1, 2]. Elec-trophoresis is particularly attractive because the thin peaksoffer a better resolution compared to conventional chromato-graphic systems [3, 4]. However, the analytical performancesof such miniaturized systems are quite complex to predict be-cause of the use of complex microchannel designs [5], novelcoatings [6–11] and the introduction of active componentssuch as flow field effect transistor (FFET) [12].
The concept of FFET is based on the real-time modula-tion of the inner surface potential by applying a gate voltageon a fluidic transistor. Such FFET allows a fast and effectivecontrol of the EOF independently from the electrophoreticfield that is applied along the separation channel. Two types
Correspondence: Dr. Anne-Marie Haghiri-Gosnet, Laboratoire dePhotonique et Nanostructures, LPN, CNRS UPR 20, route deNozay, 91460 Marcoussis, FranceE-mail: [email protected]: +33-1-69-63-60-06
Abbreviations: EDL, electric double layer; FFET, flow field ef-fect transistor; NTP, number of theoretical plates; PI, polariz-able interface; �, Zeta potential
of FFET devices have been proposed: (i) first “metal-isolator-electrolyte” in which the surface charge variation is obtainedat the liquid–solid interface by applying a high voltage to a gatecoated metal [12–17], (ii) the second “polarizable interface-electrolyte” configuration that has an electronic conductivelayer of large window potential with respect to the solvent indirect contact with the electrolyte allowing a modulation ofZeta potential (�) at lower voltage [18]. FFET has been usedin electrophoresis microchip to adjust the mobility in realtime [19, 20]. This trend implies a need to develop numer-ical model to predict both efficiency and resolution of theelectrophoretic separations since the fluid transport deflectsfrom what occurs in bare silica capillary.
In the case of spatially varying �, the lubrification the-ory [21, 22] gives an analytical solution to flow equation forlongitudinal � variation in a microfluidic channel of rectan-gular cross-section. A consequence of this axial variation inthe channel properties is the appearance of an induced pres-sure gradient that leads to increase Taylor dispersion, andthus limits the resolution of electrophoretic separation byband broadening. Patankar et al. have found that the lubri-fication theory is adapted to most microfluidic chip geome-tries, i.e. a long length of microchannel in comparison tothe small dimensions of the width and the height [23]. The
Colour Online: See the article online to view Figs. 1–8 in colour.
C© 2013 WILEY-VCH Verlag GmbH & Co. KGaA, Weinheim www.electrophoresis-journal.com
726 I. Charhrouchni et al. Electrophoresis 2013, 34, 725–735
most important equations that govern the fluid mechanicsof EOF during electrophoretic transport can be found in awell-detailed review written by Ghosal [22]. He also under-lined the risk of heterogeneous � distribution against bandbroadening phenomena since the induced pressure gives riseto a “Poiseuille-like” flow with a parabolic shape.
Several groups have studied inhomogeneous � distribu-tion for electrophoresis. The coating of the capillary is a well-known strategy to modulate EOF and to decrease nonspecificadsorption. In 1991, Town and Regnier have investigatedthe derivatization of capillaries by nonionic surfactant to re-duce the protein adsorption in a large range of pH from 4to 11 [24]. They showed that the EOF modulation improvedthe selectivity without damaging the flow rate. Garguiloet al. more recently have adsorbed an EOF–suppressing poly-mer onto various fractions of an open capillary. They applieda uniform electric field and observed by caged-fluorescencetechnique the resulting flow [25]. The parabolic flow profilesof the fluorescent dyes observed were in good agreementwith their numerical predictions. Later, Taylor dispersionwas numerically calculated in this case of altered EOF bypartially coated capillaries [26]. From this numerical model, adecrease of plate number was also observed providing thus anefficient pathway to predict the analytical performance of elec-trophoresis in capillaries/microchannels with heterogeneousEOF [26]. The combination of microchips with capillaries hasseveral advantages to perform detection with conventionalinstrument such as optical detectors and mass spectrometry.However, the junction between a rectangular microchanneland circular capillary made of different material also inducesheterogeneous �. Chen et al. recently demonstrated by 3Dsimulations that � distribution rather than the geometricalvariation will influence the analytical performances of thiskind of hybrid microchip [27]. Turns in the microfluidic chipdesign are also responsible of band broadening and decreaseof efficiencies during electrophoretic separations [28]. Fuet al. have also numerically and experimentally worked aboutintentionally altered � by integrating field effect transistor inmicrofluidic chips [19]. They succeeded to reduce the sampleband broadening and to improve the resolution of the separa-tion in a U-shaped chip by finely tuning the EOF [19]. Finally,the group of Van den Berg evidences the ability of flow re-versal by the application of a positive zeta potential value onthe gate of the microdevice [29]. They also used the lubri-cation theory to predict by analytical calculations the role ofthe induced pressure gradient due to nonuniformity in zetapotential. A perfect agreement between theory and resolved�-PIV imaging of EOF was demonstrated by this group [29].
Here, we propose theoretical calculations to predict howthe fluid velocity profile will vary through the gate and weassume that these simulations will be useful to improve thedesign of the whole separation FFET microfluidic chips. Sys-tematic numerical simulations have been carried out to findthe geometrical layout of electrophoretic microchip bearingfluidic transistor. The nonuniform axial �-potential distribu-tion that is deliberately created by tuning the EOF render theanalytical predictions rather complex. We numerically calcu-
late how the fluid velocity profile is changed under localized �
spatial variation in a FFET separation device. The � potentialdistribution in such active microfluidic chip may lead to un-expected sample band broadening, separation efficiency, andresolution. These effects are of particular importance to eval-uate the performance of the next generation of miniaturizedelectrophoretic chips. The rectangular microchannel geome-try was chosen because it corresponds to the main geometryfound in actual microfluidic chips. However, the calculationsin the present article will not study the phenomena in thecorners of the rectangular section. The lubrication theory caneasily been implemented in such geometry if some dimen-sional constraints are respected [22,23]. The combined influ-ence of the ratio of the length of the gate active layer Lm thatimposes the EOF to the length of the bare glass L is studiedby calculating the resulting parabolic velocity fields. We alsoinvestigate the influence of an increase of the electroosmoticmodulation by the fluidic transistor to show other velocityprofiles. After studying and discussing those computationalresults, we are able to propose geometrical and optimizedEOF modulation configuration that will improve analyticalresolution of the electrophoretic separation with nonuniformwall surface charge distribution.
2 Materials and methods
2.1 The analytical theory based on the lubrication
approximation
The electrokinetic transport of charged solutes in microflu-idics channels can be described by Nernst–Planck equation[27]:
∂Ci
∂t+ ∇.(−Di∇Ci − Zi umi F Ci∇� + Ci ui ) = 0 (1)
where Ci is the concentration of species i, t is time coordinate,Di is the diffusion coefficient of species i, Zi is the charge ofspecies i in motion in a microchannel, F is the Faraday’sconstant, � is the applied externally electric potential, ui isthe velocity of transport species and umi the ion mobility ofspecies i that can be given by umi = Di/RT where R is theuniversal gas constant and T the temperature fixed at 298 K.
The velocity of species in Eq. (1) needs to be solved bycombining the Navier–Stokes equations employed to describeEOF with a body force acting on the ions under the applicationof the electrical field.
The simplified Navier–Stokes equations are:⎧⎨⎩ �
∂u
∂t+ ∇.�(∇u + (∇u)T ) = f
∇.u = 0, (2)
(3)
where � is the density of fluid, � is the dynamic viscosity offluid and f is the fluid’s body force.
In a microfluidic chip, since the EDL thickness(1–10 nm) is much smaller than the characteristic lengthscale (10–100 �m) of the channel cross-section, the electrical
C© 2013 WILEY-VCH Verlag GmbH & Co. KGaA, Weinheim www.electrophoresis-journal.com

Electrophoresis 2013, 34, 725–735 CE and CEC 727
driving forces are localized in the thin sheath at the solid–fluidinterface. In the limit of infinitely thin EDL, the slip EOF ve-locity inside a microfluidic channel with dimension largerthan several microns can thus be expressed by the so-calledHelmholtz–Smoluchowski [30] formula:
u = −��
�E (4)
where � is the fluid permittivity, � the wall Zeta potential and� the fluid viscosity.
The lubrication theory has been applied by Ghosal[21,23] to solve analytically the EOF problem in a rectangularcross-section channel in the case of spatially varying the wallzeta-potential �. Certain geometrical constraints have to becomplied with:
(i) in the axial (x) direction of the channel, the characteristiclength scale Lm over which the Zeta potential � is variedhas to be very much larger than the width and the heightof the microchannel.
(ii) the fluctuations of � are small compared to its character-istic value [31].
Under such geometrical constraints and with a variableslip velocity dependent of the modulation of �, the flow veloc-ity can then be expressed by [23]:
u(x, y, z) = −Upp
�
dp
dx+ �0��
�E (5)
This flow velocity u(x, y, z) is thus composed of twoterms, the pure induced pressure velocity that has a parabolicshape and the EOF component for which a plug-like profileis expected in microfluidic channel.
Upp gives the shape of the pure pressure-driven compo-nent of the flow while plays the role of an effective electricpotential. Upp and are known functions of position. Theanalytical expression of Upp(y, z) can be found in [23] and thepotential can be computed as a superposition of the fourwall potentials:
= (AB) + (BC) + (CD) + (DA) (6)
where (BC) is the potential one could obtain if the side BCwas held at a fixed � = �(BC) value and all of the other sideswere held at � = 0. The other potentials (BC), (CD), and (DA)
can be obtained similarly by symmetry.In our study, the pressure difference between the inlet
and outlet is assumed to be zero. The induced pressure gra-dient is thus expressed by:
dp
dx= �
UPP
[�
�E − u
](7)
with
(x) = − �(AB)(x) + �(CD)(x)
2+ b
c[�(AB)(x)
+ �(CD)(x) − �(BC)(x) − �(DA)(x)]S3(b, c) (8)
u = �⟨⟩
�E (9)
where⟨⟩
is the average value in the axial direction andS3(b, c) is a function of position defined in [21].
Based on this analytical approach, we have studied how anonuniform axial �-potential distribution affects the velocityprofile in each part of a rectangular microchannel, i.e. re-spectively, in the gate and in the bar glass areas. The hybridchip exhibits the geometry that is presented in the Fig. 1. Thenonuniform �-potential distribution along the long x axis ofthe chip channel can be deliberately created by integratingtwo layers as polarizable gates of the FFET. To follow thegeometrical constrains of the lubrication theory the dimen-sions of the hybrid FFET have been fixed to the experimentaldimensions of our chips with respectively a height of the mi-crochannel of 16 �m, a width of 100 �m and a total channellength of 1 cm. The glass zeta potential value �glass = �0 =–43 mV, measured in our pure glass chip with a phosphatebuffer at pH = 8 and 40 mM ionic strength [32], was in-troduced as the reference value for the pure glass section ofthe microchip. Along the gate section (0 < L < Lm) the zetapotential �gate was modulated in the range 0.5�0–1.5�0. Theanalytical solution of the lubrication theory was implementedand computed with Matlab 7.10 (commercial software) witha fixed grid size of z/2b = y/2b = x/2b = 0.001. Wedefine the normalized velocity as the ratio between the EOFvelocity given by Eq. (5) and the slip EOF velocity at glass zetapotential value �glass = �0 given by Eq. (4).
2.2 Numerical calculations
In parallel to the lubrication analytical theory the incompress-ible steady-state Navier–Stokes Eqs. (2) and (3) were solvedusing the Helmholtz–Smoluchowski infinitively thin EDLslip boundary conditions. The equations were discretizedusing a finite volume method that uses a uniform mesh-ing grid based on rectangular elements. The equations weresolved in sequence using the finite element method sim-ulation software COMSOL 4.2a (commercial software) fora 2D rectangular microchannel corresponding to the (z, x)plane of the chip described in the Fig. 1. The boundaryand initial conditions of this physical model are listed inTables 1 and 2.
This 2D model was first used to predict the EOF velocityprofiles in both the gate controlled area and the pure glasssection in order to compare analytical and simulated results.Such 2D model is also of importance to simulate the evolutionof the analyte concentration as function of time allowing de-termination of both separation selectivity and efficiency. Weend the paper by presenting simulations of complete elec-tropherograms of two analytes. The best values for the gatecoverage ratio Lratio = Lm/L and the zeta modulation ratio�ratio = �gate/�0 to obtain high resolved separations in the hy-brid FFET microchip are then presented.
C© 2013 WILEY-VCH Verlag GmbH & Co. KGaA, Weinheim www.electrophoresis-journal.com

728 I. Charhrouchni et al. Electrophoresis 2013, 34, 725–735
Figure 1. Schematic diagram of the hybrid chip thatintegrates two polarizable gates covering a lengthLm at the entrance of the 1 cm long glass microchan-nel. The gate zeta potential that is modulated in therange 0.5�0–1.5�0 on the two BC and AD walls canbe analytically determined from the lubrication the-ory: �gate = �(BC) = �(AD) [21].
Table 1. Boundary and initial conditions in numerical simulation
Boundary conditions
Navier–Stokes equation Nernst–Planck equation
Inlet P = Patm C 1 = C 2 = C 0
Outlet P = Patm, �∇.�(∇u + ∇u)T�.n = 0 C 1(t ), C 2(t )Wall u = − �0�r �
� E −n[∇.(−D ∇C i − Z i umi FCi ∇� + C i u)]Initial conditions u = 0 (t = 0) C 0 = 1 m M
�
� �
Table 2. Constants used in the simulation
� 1000 kgm−3 Density of the buffer solution� 1 × 10⁻³ N
m−2s−2 Viscosity of the buffer solution� 200 V Applied voltage in the model� 7.0832 × 10⁻¹⁰ F m−1 Fluid permittivity�0 −43 mV Zeta potential glass reference valueD 1 5.4 × 10⁻¹⁰m2s−1 Diffusion coefficient of analyte 1
(fluorescein) [39]D 2 6.6 × 10⁻¹⁰m2s−1 Diffusion coefficient of analyte 2
(Bodipy) [39]P 1 × 10⁵ P a Pressure
3 Results and discussion
3.1 Influence of gate potential �gate modulation
in the hybrid FFET
To understand the role of the zeta potential modulation �ratio
= �gate/�0 on the flow velocity profile in each microchip area,the flow velocity profile was calculated as a function of z alongthe direction of the sample transport at the vertical centerline(y = 0). The main limitation of this study is coming fromthe fact that we do not take in account the dispersion comingfrom velocity distribution at the corners of the rectangularsection. As previously explained in Eq. (5), the flow velocity isthe superposition of two terms, the induced pressure velocity
with a Poiseuille profile, and the EOF component with a plugflow-like profile. The purpose of this analysis is to calculatethe final profile and its evolution with �ratio.
The zeta potential in the gate-controlled area is here mod-ulated on the two BC and AD walls (Fig. 1) based on the an-alytical expression �gate = �(BC) = �(AD) [23], whereas the twolaterals walls are maintained at the reference glass potential�(AB) = �(CD) = �0. The velocity profile was calculated for dif-ferent values of �ratio in the range 0.5–1.5 and for differentgate surface coverage Lratio = Lm/L as shown in the Fig. 2.
It appears from Fig. 2 that the flow profile changes itsdirection when passing from the gate area to the glass sec-tion independently of �ratio and Lratio values: for example, at�ratio = 0.5 and Lratio = 0.1 (red profiles in Fig. 2A) a largespeed enhancement is observed in the streamwise directionin the gate area whereas the velocity decreases in the op-posite direction in the glass section. Moreover, the larger isthe velocity enhancement under the gate, the smaller is thedecrease of velocity in the glass section. It is important topoint out that the distorted flow profile is a linear superpo-sition of a pure EOF and of a Poiseuille flow induced fromthe nonhomogeneity of surface charge distribution in suchhybrid chip. This second Poiseuille term that originates fromthe induced pressure term of Eq. (5) impacts largely the finaldirection of the velocity. Similar reversals of the flow pro-file have been experimentally recorded by optical methods:(i) first by cage fluorescence in coupled dissimilar capillaries
C© 2013 WILEY-VCH Verlag GmbH & Co. KGaA, Weinheim www.electrophoresis-journal.com

Electrophoresis 2013, 34, 725–735 CE and CEC 729
Figure 2. Normalized flow ve-locity profiles theoreticallypredicted by the lubricationanalytical method in the gatecontrolled area (left) and glassarea (right) as function of thegate surface coverage Lratio =Lm/L in two cases: (A) for aless negatively charged gate at�ratio = 0.5 with �gate = 0.5�0
= −21.5 mV and (B) for amore negatively charged gateat �ratio = 1.5 with �gate = 1.5�0
= −64.5 mV. Note that curvesare dimensionless since thevelocity and z were normalizedrespectively to the glass veloc-ity unorm = u/uglass(�0) and to theheight of the channel 2c.
exhibiting a step change in � potential along the axial direction[25] and (ii) secondly by microparticle image velocity (�-PIV)that was bearing a metal-isolator-electrolyte gate [29].
As observed in Fig. 2, a less negatively charged gate thanthe glass at �ratio = 0.5 with �gate = 0.5�0 = −21.5 mV will pro-mote an enhancement of the velocity below the gate, whereasa more negatively charged gate at �ratio = 1.5 with �gate = 1.5�0
= −64.5 mV will produce a reduction in velocity and thusreverse the profile. The intensity of the velocity decrease (orenhancement) is largely function of the value of the gate sur-face coverage ratio Lratio = Lm/L. A very small coverage Lratio
= 0.1 (Lm = 0.1 cm) will promote large changes in velocityin the gate area (red curves) for all �ratio values. At high cov-erage Lratio = 0.9, large changes in velocity are observed inthe glass area. Note that a microchannel that has been fullycovered by the gate polarizable layer (Lratio = 1) exhibits avertical plug-like profile (dark lines in the graphs of Fig. 2in the controlled area) since the induced pressure term inEq. (5) is zero. This should favor no band broadening dur-ing electrophoresis and thus promotes very high efficiencyas it will be discussed in the last section of this paper (seeSection 3.3).
The results based on this analytical theory have beencompared with the numerical simulations from COMSOL.Figure 3 shows some typical normalized flow velocity profilesin the gate controlled area. A good agreement is observed.This result is important since the numerical simulations areperformed based on a 2D model along the plane (x, z) aty = 0 that neglects all effects along y-axis originating from thelateral walls of the chip. This is justified by the high aspect
Figure 3. Comparison between the lubrication analytical theoryand the numerical simulation method: typical normalized flow ve-locity profiles in the gate controlled area at �ratio = 0.5 as functionof Lratio obtained numerically (continuous lines) are compared toanalytical profiles (points).
ratio of the microchannel that is fabricated with clean-roomfacilities [18].
The analytical theory allows the determination of the flowvelocity profile only in each area, i.e. the controlled area and
C© 2013 WILEY-VCH Verlag GmbH & Co. KGaA, Weinheim www.electrophoresis-journal.com
730 I. Charhrouchni et al. Electrophoresis 2013, 34, 725–735
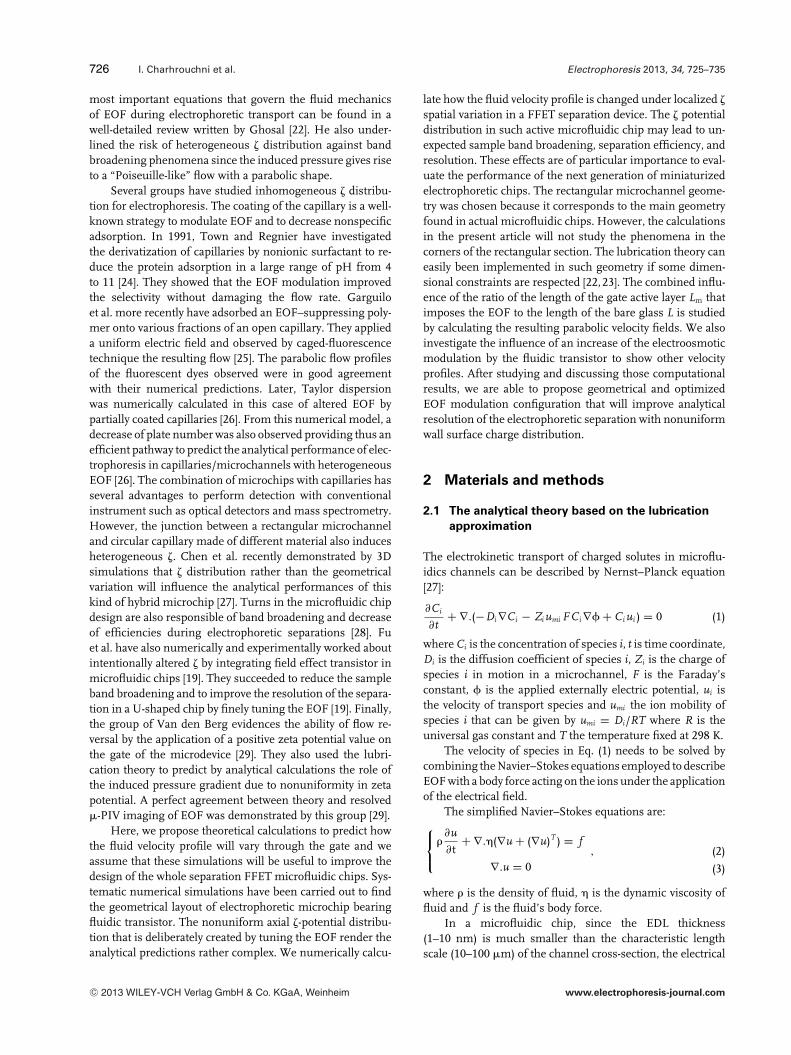
Figure 4. Numerical simulations results solved by COMSOL: (A) the velocity distribution in the plane (x, z) at y = 0 and (B) the evolutionas function of �ratio of the normalized velocity at z = 0.
the glass region. On the contrary, the transition between thesetwo regions can be simulated based on the 2D COMSOLmodel. Figure 4 illustrates how sharp the change in velocitycan be in this transition region. The zoom in the Fig. 4 al-lows to precisely measure the thickness of the transition x∼20 �m that is of the same order of the thickness 2c of themicrochannel. This sharpness of the transition region for ve-locity will impact largely the shape of the resolution curve (seeSection 3.3) since it affects the whole electrophoresis processalong the channel. This will be discussed later in Section 3.3.
3.2 Influence of the gate surface coverage Lratio =Lm/L
In this section, we focus on the gate area effect during theelectrophoresis process. We want to understand the effect ofthe gate surface coverage ratio defined as Lratio = Lm/L on theflow velocity profile in our hybrid chip. In the controlled area,a voltage is applied to the gate layer to modulate � from theinitial reference value �0. Different Lratio values (Lratio = 0.1,
0.5, 0.9) have been simulated. Resulting velocity profiles atthe vertical centerline (y = 0) as a function of z are plottedin the Fig. 5. The left part and the right part of this figurecorrespond, respectively, to the gate area (Lm) and the glassarea (L-Lm).
As shown in Fig. 5, for a fixed value of �ratio in the gatecontrolled area, the maximum normalized velocity decreasesconsiderably as Lratio increases. This is not surprising, since athigh gate surface coverage Lratio, the effective electric potential is the most dominant term in Eq. (5), the induced pressureterm being largely reduced. The opposite effect is observed inthe noncontrolled glass area, for which the induced pressureterm of Eq. (5) dominates. Moreover, in Eq. (5) the sign ofthe induced pressure component does not depend on Lratio.Therefore, the resulting profile of the mixed flow (pure EOFand Poiseuille flow) for �ratio > 1 (continuous lines in Fig. 5)is a strictly a concave function of z in the controlled area. Onthe contrary, it is a strictly convex function of z in the glassarea. Our results are very similar and consistent with othersimulations performed in [33,34]. We do not explore the caseof negative �ratio values that corresponds to positively charged
C© 2013 WILEY-VCH Verlag GmbH & Co. KGaA, Weinheim www.electrophoresis-journal.com

Electrophoresis 2013, 34, 725–735 CE and CEC 731
Figure 5. Flow velocity pro-files at the vertical centerline(y = 0) as a function of z forLratio = 0.1, 0.5, 0.9.
gate layer. Changing the sign of � in the two areas generatescomplex flow recirculation as calculated by Lee [34] that canbe used for mixing in lab-on-a-chip devices.
We will now address the separation efficiency that wewant to improve within this hybrid FFET chip by optimizingthe two variable parameters Lratio and �ratio defining hybridchip.
3.3 Separation efficiency of the hybrid chip
The purpose of this section is to evaluate the enhancement ofseparation during the electrophoresis process due to the zetapotential modulation. Two different approaches have beendeveloped: (i) based on the lubrication theory, we propose aanalytical expression for both the plate number and the reso-lution that can be expressed as function of the two parameters�ratio and Lratio; (ii) 2D simulations of complete electrophero-
grams for two analytes have been performed by fixing twopertinent coefficients of diffusion D1 and D2 (see Table 2).The role of the two key parameters �ratio and Lratio is then evi-denced allowing a perfect optimization of the geometry of theFFET device.
Let first describe our new analytical approach for bothplate number and resolution in the context of the lubrica-tion theory. The aim of the following model is to propose anoptimized microchannel geometry and EOF modulation toincrease the global resolution of the separation. Here, we fo-cus our discussion on the best pathway to choose the variable�ratio and Lratio. The boundary conditions, the initial condi-tions, and the constants used in this model are given in theTables 1 and 2.
A consequence of this axial variation of the channel prop-erties inside our hybrid chip is the appearance of an inducedpressure gradient early presented in Sections 3.1 and 3.2 asfunction of �ratio and Lratio. The general average velocity of an
C© 2013 WILEY-VCH Verlag GmbH & Co. KGaA, Weinheim www.electrophoresis-journal.com

732 I. Charhrouchni et al. Electrophoresis 2013, 34, 725–735
analyte in the presence of the induced pressure is given bythe following equation [27, 35] as:
ui={gate,glass}=uep,i+ueof ,i+up,i= (�ep,i+�eof ,i )E+up,i (10)
where uep,i is the mean electrophoretic velocity of the analytei, ueof ,i is the electroosmotic velocity and up,i is the averagevelocity in the presence of the induced pressure [27]. Thisequation corresponds to Eq. (5) in which uep,i electrophoreticvelocity has been simply added. Both uep,i and ueof ,i veloci-ties can also be expressed as function of their correspondingmobilities �ep,i and �eof ,i.
In our analytical approach, it is very interesting to ex-press the velocity up and the migration time t(x) of the ana-lyte as function of the two key parameters �ratio and Lratio. Forthese calculations, the zeta potential �gate has been appliedon the four walls of the chip in the region where the innersurface of the microchannel integrates the gate layer of thefluidic transistor. The average zeta potential is � = ∑
Li �i/Lwhere L and Li are respectively the total length of the con-sidered microchannel and the length of the ith region and�i the zeta potential in the ith region. According to Wu [27],the average velocity due to induced pressure can be writtenas:
up,i={gate,glass} = �
�(�i − �)E (11)
�ratio and Lratio can be then introduced in this Eq. (11) forvelocity:
up(L ratio, �ratio) =
⎧⎪⎨⎪⎩
�0�r
�(�gate − �)E = �0�r
��glass(�ratio + L ratio(1 − �ratio) − 1)E if x ≤ Lm
�0�r
�(�glass − �)E = �0�r
��glass(L ratio(1 − �ratio))E if Lm < x < L
(12)
Similarly, the migration time of one analyte can also beexpressed as function of �ratio and Lratio with two differentequations in the gate region for x ≤ Lm and in the glass areaat Lm < x ≤ L:
t(x) =
⎧⎪⎪⎪⎪⎪⎨⎪⎪⎪⎪⎪⎩
x
ugate= x
(�ep+�eof ,gate)E+up,gateif x ≤ Lm
Lm
ugate+ x − Lm
uglass= L
⎛⎜⎝ L ratio
(�ep+�eof ,gate)E+up,gate+
( x
L− L ratio
)(�ep+�eof ,glass)E+up,glass
⎞⎟⎠ if Lm < x < L
(13)
Since, in our FFET device, the induced pressure termadded to the EOF component favors a classical parabolicshape for the velocity profile, dispersion, and loss of sampledefinition can occur. In this context, based on this analyti-cal theory, the transfer process in our hybrid FFET chip hasbeen analyzed by investigating the roles of L ratio and �ratio
over sample band broadening. According to Taylor and Aristheories [36, 37] and the results reported from [27, 38], thesample variance caused by diffusion and induced-pressure inthe rectangular microchannel is:
�2D(x) = 2Deff t(x) = 2
(1 + d2u2
p
210D2m
)Dmt(x) (14)
Figure 6. Evolution of the NTP number as function of x for dif-ferent hybrid FFET or bare glass microchannels. The red curvecorresponds to a pure glass chip without any polarizable gatelayer. Blue and dark curves correspond to FFET devices that in-tegrate respectively a more negatively polarized gate or a lessnegatively charged gate (dashed curves for a full gate coverageLratio = 1 and dot-dashed curves for Lratio = 0.5 with Lm = 0.5 cm).
where Dm = (D1 + D2)/2 is the mean diffusion coefficient ofour two analytes (fluorescein and bodipy—see Table 2) [39]
and t(x) is the migration time at distance x defined from theEq. (13). Two expressions of �2
Dcan thus be obtained for the
two different area based on the two expressions of t(x).Plate models for electrophoretic separations are used fre-
quently for comparison of separation efficiency. Althoughthere are no physical plates in electrophoresis, the derivativeterm that is defined by NTP(x) = x2/�2(x) [39] and called thenumber of theoretical plates is often used for overall system-to-system comparison. The efficiency is typically said to behigher for systems with high NTP values.
The Eq. (15) below give the NTP number as function oft(x):
C© 2013 WILEY-VCH Verlag GmbH & Co. KGaA, Weinheim www.electrophoresis-journal.com

Electrophoresis 2013, 34, 725–735 CE and CEC 733
NTP(x) =
⎧⎪⎪⎪⎪⎨⎪⎪⎪⎪⎩
NTPgate(x) = x2
2Deff ,gatet(x)if x ≤ Lm
NTPglass(x) = x2
2Deff ,gatet(Lm) + 2Deff ,glass[t(x) − t(Lm)]if Lm < x ≤ L
(15)
In the controlled gate area at x ≤ Lm, NTPgate(x) can bewritten analytically:
NTPgate(x) = (�ep+�eof ,gate)E+up,gate
2Dm
(1 + d2u2
p
210D2m
)
x = V
2Dm
⎡⎢⎢⎢⎢⎣
(�ep+�eof ,gate)+up,gateL
V(1 + d2u2
p
210D2m
)x
⎤⎥⎥⎥⎥⎦
x2
L 2if x ≤ Lm
(16)
while for the glass area at Lm < x ≤ L, NTPglass(x) is:
NTPglass(x)
= x2
2Dm
VL 2
(1 + d2u2
p,gate
210D2m
)1
(�ep+�eof ,gate)+up,gateL
V
L ratio + 2Dm
VL 2
(1 +
d2u2p,glass
210D2m
)1
(�ep+�eof ,glass)+up,glassL
V
( x
L− L ratio
)
if Lm < x ≤ L (17)
The efficiency NTP is a simple expression of the mobility:
NTP(x) =
⎧⎪⎪⎪⎨⎪⎪⎪⎩
NTPgate(x) = V
2Dm�eff ,gate
x2
L 2if x ≤ Lm
NTPglass(x) = V
2Dm�eff ,glass
x2
L 2if Lm < x ≤ L
(18)
where the effective mobility in each area is a function of �ratio
and Lratio :
1
�eff ,gate(L ratio, �ratio, x)=
(1 + d2u2
p
210D2m
)
(�ep+�eof ,gate)+up,gateL
V
x
L
1
�eff ,glass(L ratio, �ratio, x)=
(1 + d2u2
p,gate
210D2m
)
× 1
(�ep+�eof ,gate)+up,gateL
V
L ratio +(
1 +d2u2
p,glass
210D2m
)
× 1
(�ep+�eof ,glass)+up,glassL
V
( x
L− L ratio
)(19)
Based on this theory the NTP number has been calculatedfor different hybrid FFET devices with different values of �ratio
and Lratio. Its evolution along the axial x direction of the chip ispresented in the Fig. 6. The NTP increases for microchannel-bearing transistor that applies a higher EOF than the bare
glass one (�ratio > 1) and it may reach NTP values over 10 000.The variance is important when the band is slowed down for�ratio < 1 whereas the variance decreases when the velocity ishigher in case of �ratio > 1. In order to reach high efficiencies,the best configuration is an EOF modulation by the transistorover the glass EOF value and with L ratio = 1.
However, the efficiency that remains a discussed param-eter in many analytical articles is controversial since someauthors have underlined its incapacity to determine and com-pare whether distinct separations on various systems havebeen carried out over the acceptable level [37, 38]. The re-
solution (RS) represents a more critical parameter for elec-trophoresis and we calculate it to investigate the benefit ofthe EOF modulation by FFET.
Figure 7. Evolution of the resolution as function of x for dif-ferent hybrid FFET devices. Colors are similar than colors ofFig. 6.
C© 2013 WILEY-VCH Verlag GmbH & Co. KGaA, Weinheim www.electrophoresis-journal.com

734 I. Charhrouchni et al. Electrophoresis 2013, 34, 725–735
In addition to the variance, the second important separa-tion criterion is resolution [37, 39] that is defined by:
RS(x)
=
⎧⎪⎪⎪⎨⎪⎪⎪⎩
RSgate(x) = 1
4
√NTPgate(x)
�app
�app,avg−gateif x ≤ Lm
RSgate(x) = 1
4
√NTPglass(x)
�app
�app,avg−gateif Lm < x ≤ L
(20)
where �app is the difference of mobility of our two analytesand �app,avg is the average mobility.
Eq. (21) can also be expressed as function of �ratio andLratio:
RS(x) =
⎧⎪⎪⎪⎨⎪⎪⎪⎩
RSgate(x) =√
V
32Dm
x
L
√�eff ,glass(L ratio, �ratio, x)
�app
�app,avg−gateif x ≤ Lm
RSglass(x) =√
V
32Dm
x
L
√�eff ,glass(L ratio, �ratio, x)
�app
�app,avg−glassif Lm < x ≤ L
(21)
For a pure glass chip (L ratio = 0 and �ratio = 1), this ana-lytical expression of RS(x) becomes:
�eff ,glass(L ratio, �ratio, x) = (�ep+�eof ,glass)L
x=> RSglass(x)
=√
V
32Dm
√l
L
�app√�app,avg−glass
(22)
in agreement with the expression reported in [40,41].Figure 7 shows the evolution of RS as function of x
inside the different FFET devices for which NTP has beenpreviously calculated. The detection is fixed here at x = 0.9 cm.In Fig. 7, we notice that the resolution in hybrid microchipsis optimized for EOF modulation with �ratio< 1. Resolutionreaches RS = 2.1 for the hybrid chip half covered by a less neg-atively charged gate (dark-dashed point curve at L ratio = 0.5and �ratio = 0.5), i.e. a larger value than RS = 1.9 for the pureglass chip (red curve). In addition, the fully covered FFET chipexhibits a larger RS value of 2.3 (L ratio = 1). This is impor-tant since for such pure PI-FFET device, the flow profile is aplug-like one that also favors thin peaks without any broaden-ing. As previously discussed, these configurations with a lessnegatively charged gate compare to pure glass (dark curves inFig. 7) do not produce the highest efficiency for this level ofEOF modulation.
It was then interesting to perform 2D numerical simula-tions with COMSOL in order to get simulated time profilesallowing a precise determination of both resolution and ef-ficiency. From the electropherograms shown in Fig. 8, it isclear that the introduction of EOF modulation by a fluidictransistor compared to a simple glass chip will improve theresolution in the detriment of the efficiency. The main advan-tage from an experimental point of view is coming from theease of integration of the peaks for a further quantification.Moreover, the introduction of optical detection under PI isnot always possible because most of the polarizable interfacesthat we use in our laboratory are optically dark. From these
results, we assume that optical detection should be placed justafter the PI to perform optical detection with high resolution.Finally, we easily understand from Fig. 8 that the PI-FFETcould favors the fabrication of shorter microchannels sinceit performs separations with a better resolution comparedto what could be obtained with a bare glass microchip. Wethink that fluidic transistor will favor the worthwhile researchof these novel miniaturized analytical systems.
4 Concluding remarks
Our numerical simulations demonstrate that the parabolic ve-locity profiles in a rectangular microchannel bearing a FFET
may lead to highly resolved electrophoresis. The induced pres-sure obtained from the EOF modulation locally creates sam-ple band broadening and our computational study underlinesthe need to modulate the zeta potential below the bare glassvalue to optimize the resolution. In addition, the efficiency forour optimal geometrical and charge modulation parameters
Figure 8. Normalized time profiles of the two analytes (fluores-cein in red and Bodipy in dark) that have been simulated by COM-SOL at x = 0.5 cm (detection point). These two electropherogramsevidence the shape and the separation of each analyte band incase of a classical pure glass chip (straight lines) and a fully PIcovered FFET (Lratio = 1) that is positively polarized with a lessnegatively charged gate layer at �ratio = 0.5.
C© 2013 WILEY-VCH Verlag GmbH & Co. KGaA, Weinheim www.electrophoresis-journal.com

Electrophoresis 2013, 34, 725–735 CE and CEC 735
is not the highest compared to other proposed configura-tions including a bare glass microchannel. These differencesof behavior from conventional “plug like” flows suggest thatby playing with the length of transistor and its EOF modu-lation the analytical performances could outperform simpleelectrophoresis microchips.
We are indebted to Sebastien Meance, Myriam Taverna andJean Gamby for discussions. This research was supported by theFrench ANR (Agence Nationale de la Recherche) in the contextof the P2N “DIMIPOLE” project.
The authors have declared no conflict of interest.
5 References
[1] Peng, Y., Pallandre, A., Tran, N. T., Taverna, M., Elec-trophoresis 2008, 29, 157–178.
[2] Tran, N. T., Ayed, I., Pallandre, A., Taverna, M., Elec-trophoresis 2010, 31, 147–173.
[3] Dolnik, V., Liu, S., Jovanovich, S., Electrophoresis 2000,21, 41–54.
[4] Harrison, D. J., Fluri, K., Seiler, K., Fan, Z., Effenhauser,C. S., Manz, A., Science 1993, 261, 895–897.
[5] Lion, N., Rohner, T. C., Dayon, L., Arnaud, I. L., Damoc,E., Youhnovski, N., Wu, Z. Y., Roussel, C., Josserand, J.,Jensen, H., Rossier, J. S., Przybylski, M., Girault, H. H.,Electrophoresis 2003, 24, 3533–3562.
[6] Liu, Y., Fanguy, J. C., Bledsoe, J. M., Henry, C. S., Anal.Chem. 2000, 72, 5939–5944.
[7] Bai, X., Roussel, C., Jensen, H., Girault, H., Electrophore-sis 2004, 25, 931–935.
[8] Ro, K. W., Chang, W. J., Kim, H., Koo, Y. M., Hahn, J. H.,Electrophoresis 2003, 24, 3253–3259.
[9] Xiao, Y., Wang, K., Yu, X. D., Xu, J. J., Chen, H. Y., Talanta2007, 72, 1316–1321.
[10] Boonsong, M. M., Caulum, B. M., Dressen, O., Chaila-pakul, D. M., Cropek, C. S. Henry, Electrophoresis 2008,29, 3128–3134.
[11] Pallandre, A., de Lambert, B., Attia, R., Jonas, A. M.,Viovy, J.-L., Electrophoresis 2006, 27, 584–610.
[12] Schasfoort, R. B. M., Schlautmann, S., Hendrikse, L., vanden Berg, A., Science 1999, 286, 942–945.
[13] Polson, N. A., Hayes, M. A., Anal. Chem. 2000, 72,1088–1092.
[14] Wouden van der, E. J., Hermes, D. C., Gardeniers,J. G. E., Berg van den, A., Lab. Chip. 2006, 6, 1300–1305.
[15] Hermes, D. C., Heuser, T., Wouden van der, E. J., Gar-deniers, J. G. E., Berg van den, A., Microsyst. Technol.2006, 12, 436–440.
[16] van der Wouden, E. J., Heuser, T., Hermes, D. C., Ooster-broek, R. E., Gardeniers, J. G., van den Berg, A., ColloidsSurf. A 2005, 267, 110–116.
[17] Ning, Hu, Ye, Ai, Shizhi, Qian, Sensors Actuators B 2012,161, 1150–1167.
[18] Plecis, A., Tazid, J., Pallandre, A., Marthinon, P., Deslouis,C., Chen, Y., Haghiri-Gosnet, A. M., Lab. Chip. 2010, 10,1245–1253.
[19] Lee, C. Y., Lin, C. H., Fu, L. M., Analyst 2004, 129, 931–937.
[20] Lee, G. B., Fu, L. M., Lin, C. H., Lee, C. Y., Yang, R. J.,Electrophoresis 2004, 25, 1879–1887.
[21] Ghosal, S., J. Fluid Mech. 2002, 459, 103.
[22] Ghosal, S., Electrophoresis 2004, 25, 214–218.
[23] Datta, S., Ghosal, S., Patankar, N. A., Electrophoresis2006, 27, 611–619.
[24] Towns, J. K., Regnier, F. E., Anal. Chem. 1991, 63,1126–1132.
[25] Herr, A. E., Molho, J. I., Santiago, J. G., Mungal, M. G.,Kenny, T. W., Garguilo, M. G., Anal. Chem. 2000, 72,1053–1057.
[26] Ghosal, S., Anal. Chem. 2002, 74, 4198–4203.
[27] Wu, Z. Q., Cao, X. D., Chen, L., Zhang, J. R., Xia,X. H., Fang, Q., Chen, H. Y., Electrophoresis 2010, 31,3665–3674.
[28] Culbertson, C. T., Jacobson, S. C., Ramsey, J. M., Anal.Chem. 1998, 70, 3781–3789.
[29] Pirat, C., Naso, A., van der Wouden, E. J., Gardeniers,J. G. E., Lohse, D., van den Berg, A., Lab. Chip. 2008, 8,945–949.
[30] Hunter, R. J., Zeta Potential in Colloid Science, AcademicPress, New York 1981.
[31] Long, D., Stone, H. A., Adjari, A., J. Coll. Int. Sci. 1999,212, 228–349.
[32] Pallandre, A., le Potier, I., Xiong, B., Taverna, M., Ple-cis, A., Roblin, C., Haghiri-Gosnet, A. M., Proceedings ofMICRO-TAS Conference CMBS, 2010, 384–386.
[33] Brotherton, C. M., Davis, R. H., J. Colloid Interface Sci.2004, 270, 242–246.
[34] Lee, J. S. H., Ren, C. L., Li, D., Anal. Chim. Acta 2005, 530,273–282.
[35] Fong, C. Y., Shaole, W., Da, Y. C., Norman, J. D., Anal.Chem. 1990, 62, 496–503.
[36] Taylor, G., Proc. Roy. Soc. A 1953, 219, 186–203.
[37] Aris, R., Proc. Roy. Soc. A 1956, 235, 67–77.
[38] Datta, S., Ghosal, S., Lab. Chip. 2009, 9, 2537–2550.
[39] Bharadwaj, R., Santiago, J. G., Mohammadi, B., Elec-trophoresis 2002, 23, 2729–2744.
[40] Giddings, J. C., Unified Separation Science, John Wileyand Sons, New York 1991, pp. 97–98.
[41] Stephen Wren (Ed.), Chromatographia, Vol. 54(Issue 1Supplement), Vieweg Verlag 2001, pp. S15–S23.
C© 2013 WILEY-VCH Verlag GmbH & Co. KGaA, Weinheim www.electrophoresis-journal.com


![[Louis Leithold] the Calculus, With Analytic Geome(BookFi.org)](https://img.pdfslide.net/doc/110x75/563dbcb5550346aa9ab0885d/louis-leithold-the-calculus-with-analytic-geomebookfiorg.jpg)


![Numerical Heat Transfer and Fluid FLow [Patankar]](https://img.pdfslide.net/doc/110x75/55cf8fea550346703ba13647/numerical-heat-transfer-and-fluid-flow-patankar-569a3a8a8d259.jpg)