Embed Size (px)
Citation preview
Electrophysiology in Vision
How VEP and ERG Testing Can Impact Your Treatment Decisions
J. James Thimons, OD, FAAO, ABOMedical Director / Glaucoma Institute
Ophthalmic Consultants of [email protected]
Caveat for all Imaging devices
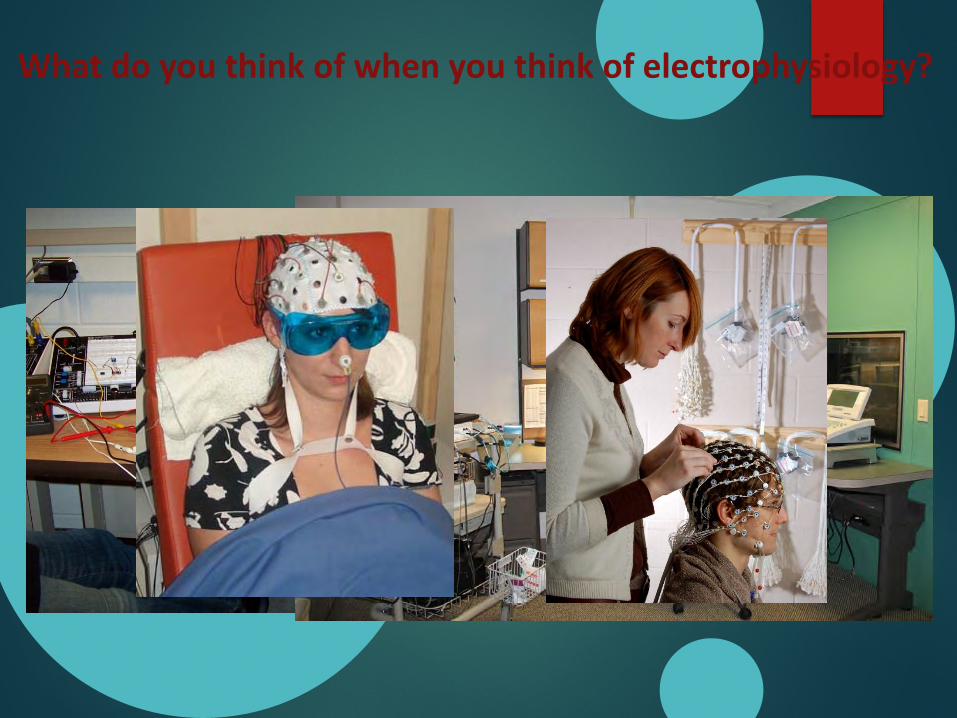
What do you think of when you think of electrophysiology?

How about when you think of EKG?

Electrophysiology in Eye Care
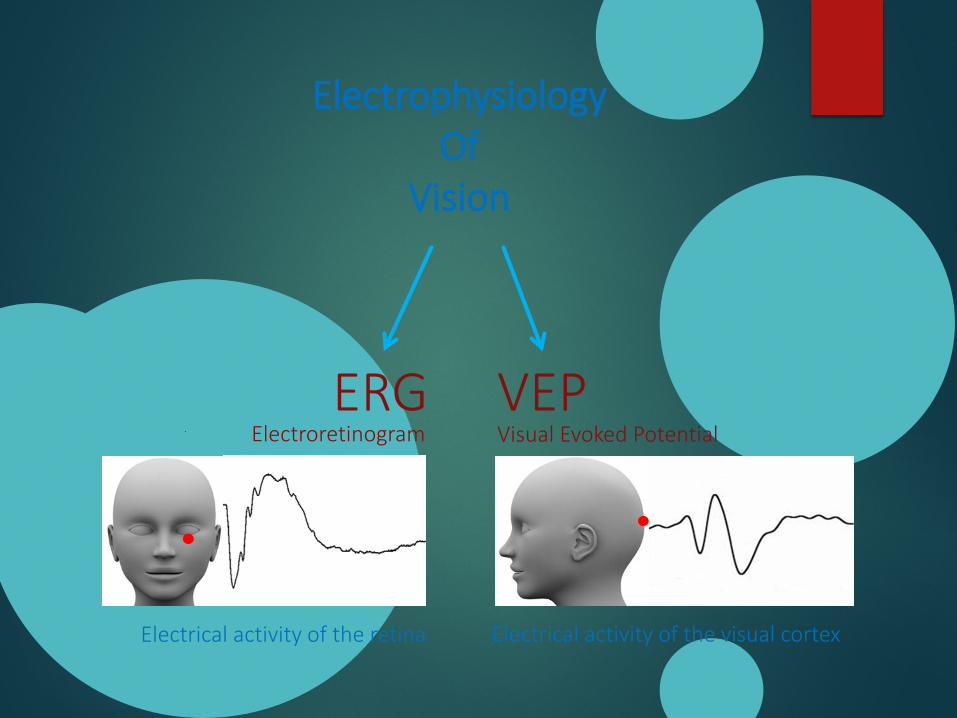
ElectrophysiologyOf
Vision
ERG VEPElectroretinogram Visual Evoked Potential
Electrical activity of the retina Electrical activity of the visual cortex

ElectrophysiologyOf
Vision
ERG VEPElectroretinogram Visual Evoked Potential
Electrical activity of the retina Electrical activity of the visual cortex
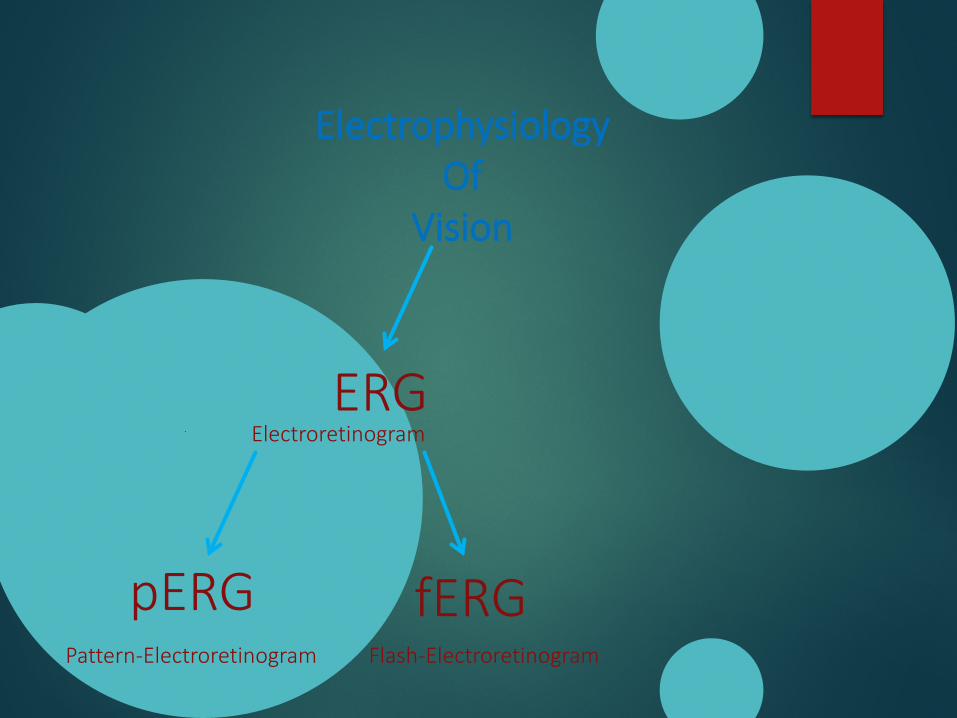
ElectrophysiologyOf
Vision
ERGElectroretinogram
pERG fERGPattern-Electroretinogram Flash-Electroretinogram
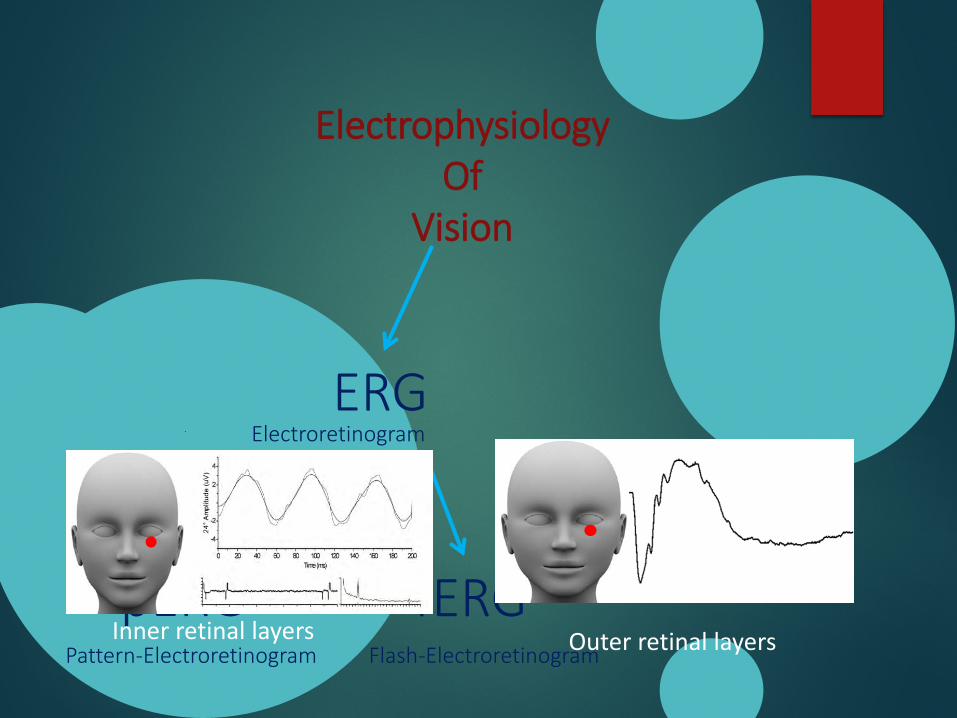
ElectrophysiologyOf
Vision
ERGElectroretinogram
pERGPattern-Electroretinogram
fERGFlash-Electroretinogram
Inner retinal layers Outer retinal layers
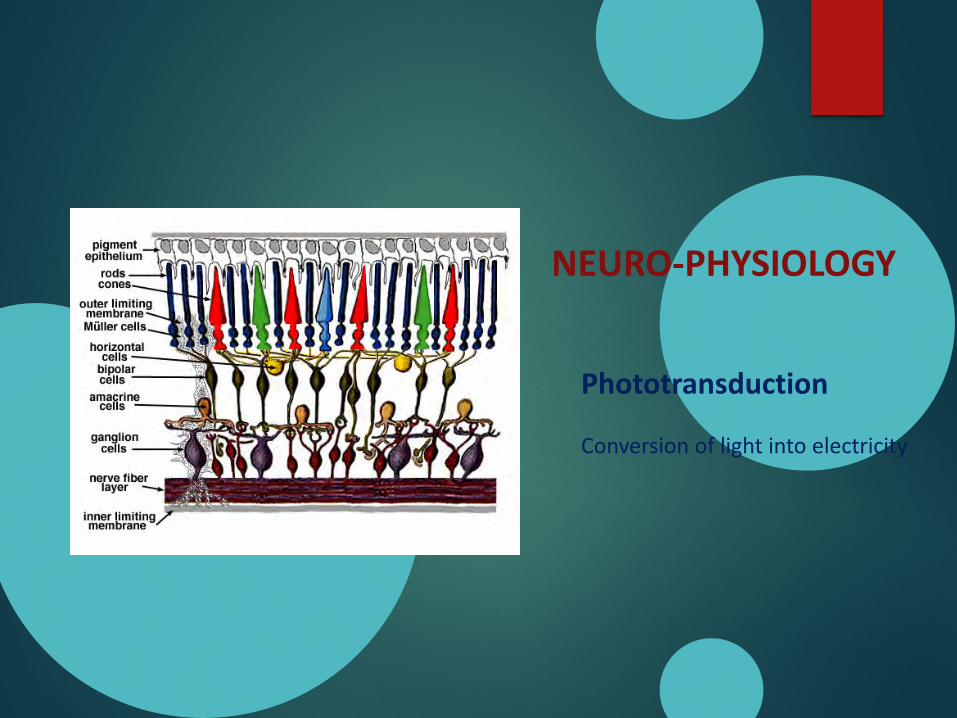
NEURO-PHYSIOLOGY
Phototransduction
Conversion of light into electricity
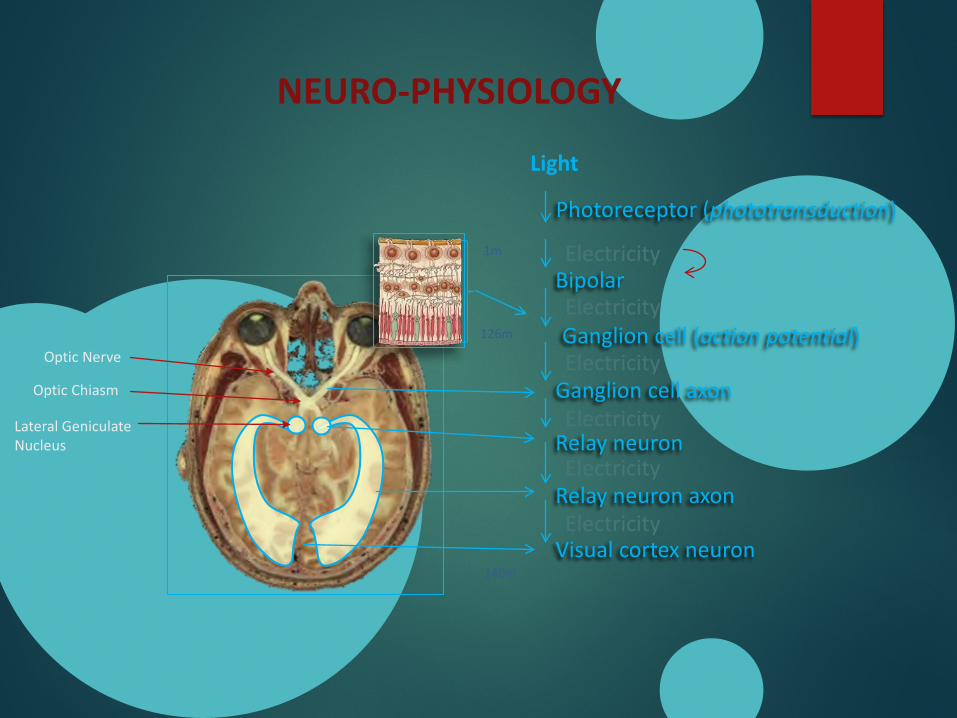
Ganglion cell (action potential)
Photoreceptor (phototransduction)
Ganglion cell axon
Relay neuron
Relay neuron axon
Visual cortex neuron
NEURO-PHYSIOLOGY
126m
1m
140m
Light
Electricity
Electricity
Electricity
Electricity
Electricity
Electricity
Optic Nerve
Optic Chiasm
Lateral Geniculate Nucleus
Bipolar
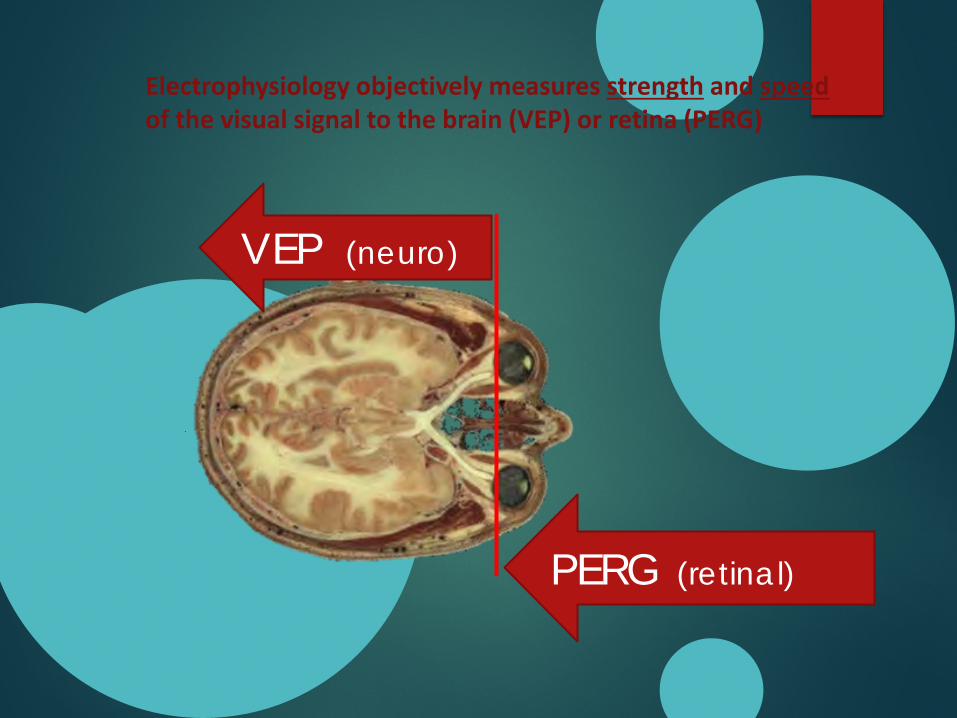
VEP (neuro)
PERG (retinal)
Electrophysiology objectively measures strength and speedof the visual signal to the brain (VEP) or retina (PERG)

ISCEV
International Society for Clinical Electrophysiology of Vision
Clinical Applications in Eye Care
Inherited retinal dystrophies Vascular diseases including diabetes Opaque media or trauma Retro bulbar neuritis Unexplained visual loss Infant with questionable vision Toxic and nutritional eye disease Glaucoma Suspected intracranial lesion
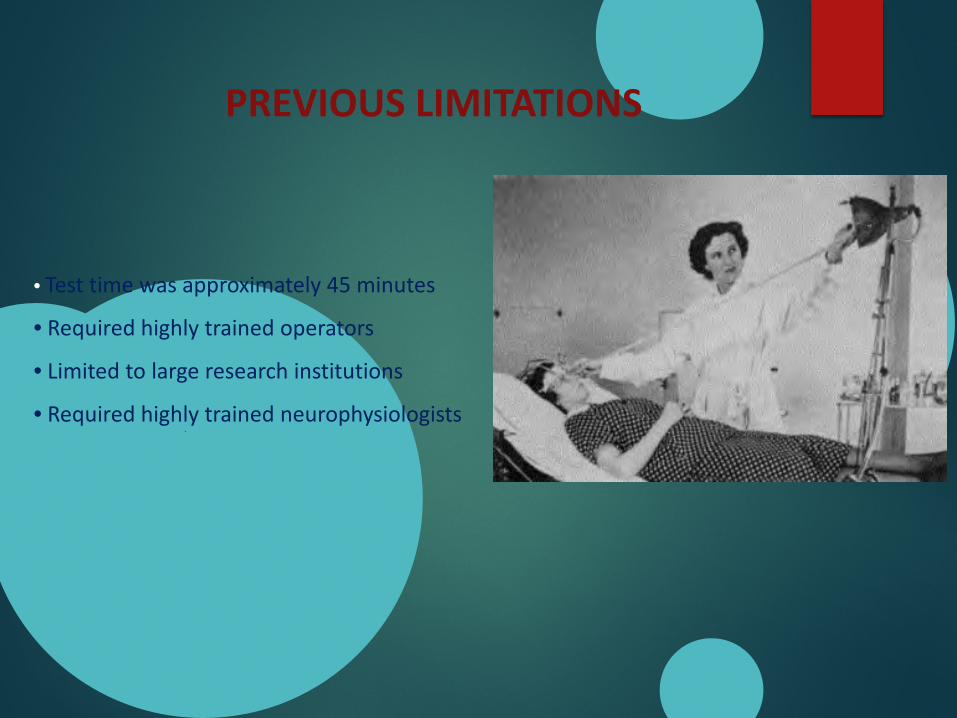
• Test time was approximately 45 minutes
• Required highly trained operators
• Limited to large research institutions
• Required highly trained neurophysiologists
PREVIOUS LIMITATIONS
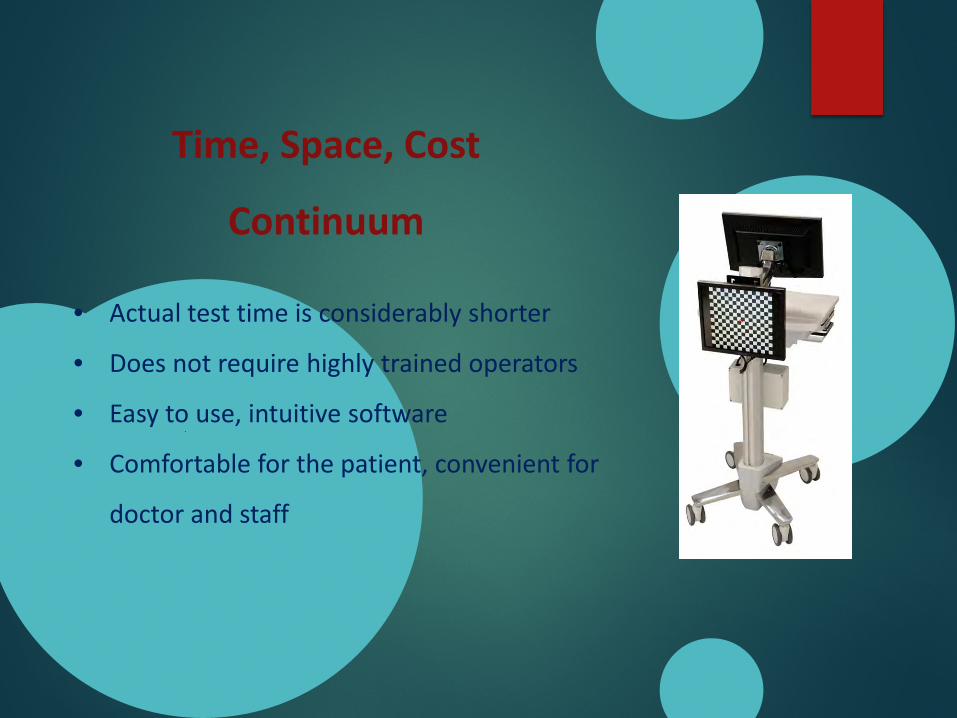
• Actual test time is considerably shorter
• Does not require highly trained operators
• Easy to use, intuitive software
• Comfortable for the patient, convenient for
doctor and staff
Time, Space, Cost
Continuum
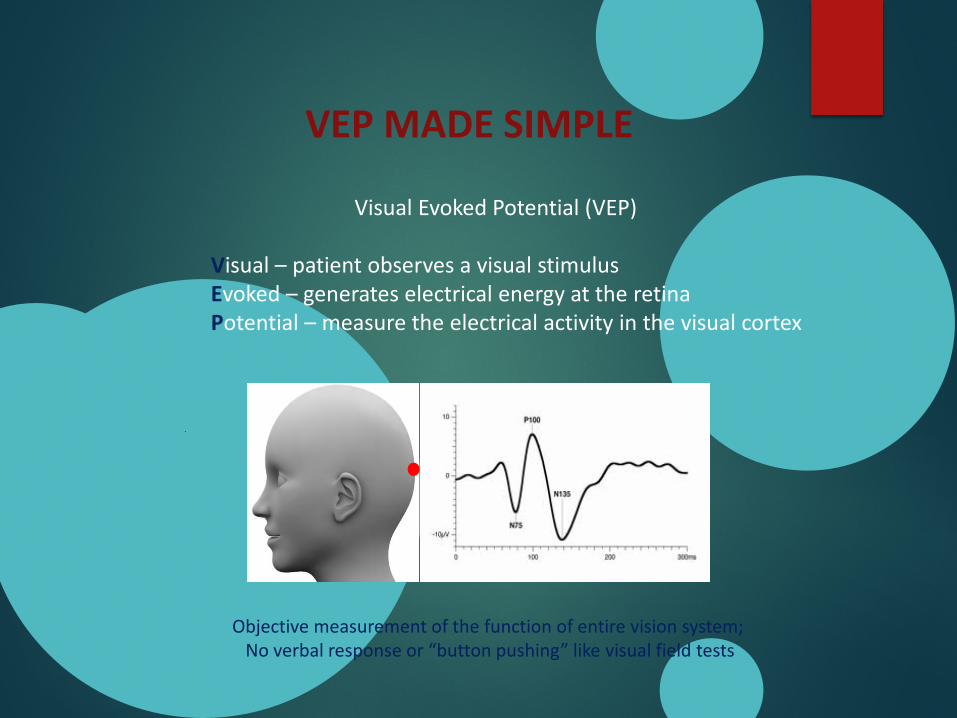
Visual Evoked Potential (VEP)
Visual – patient observes a visual stimulusEvoked – generates electrical energy at the retinaPotential – measure the electrical activity in the visual cortex
VEP MADE SIMPLE
Objective measurement of the function of entire vision system;No verbal response or “button pushing” like visual field tests
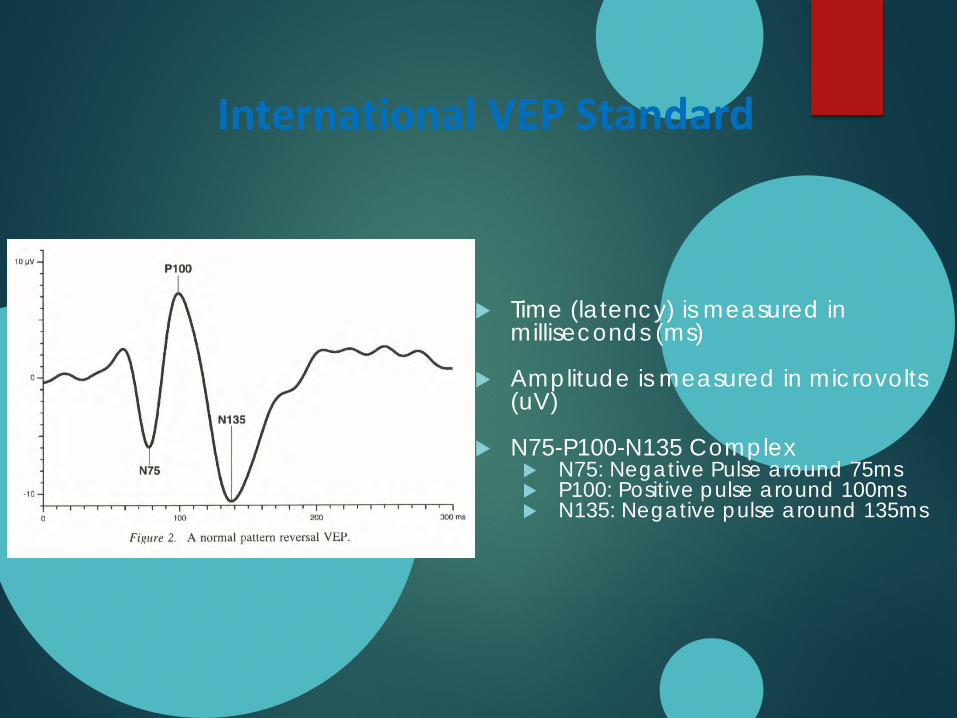
International VEP Standard
Time (latency) is measured in milliseconds (ms)
Amplitude is measured in microvolts (uV)
N75-P100-N135 Complex N75: Negative Pulse around 75ms P100: Positive pulse around 100ms N135: Negative pulse around 135ms
Clinical Applications
Clarify Differential Diagnosis – Is it Systemic, Trauma or Ocular?
When Standard Tests are Unattainable or Unreliable –Visual Field Can’t be Performed or Results are Unreliable
Other Tests are Inconsistent or Borderline – Patient Symptom and/or Test Results are Equivocal
Monitor Subclinical Ophthalmic Disease – Functional Changes
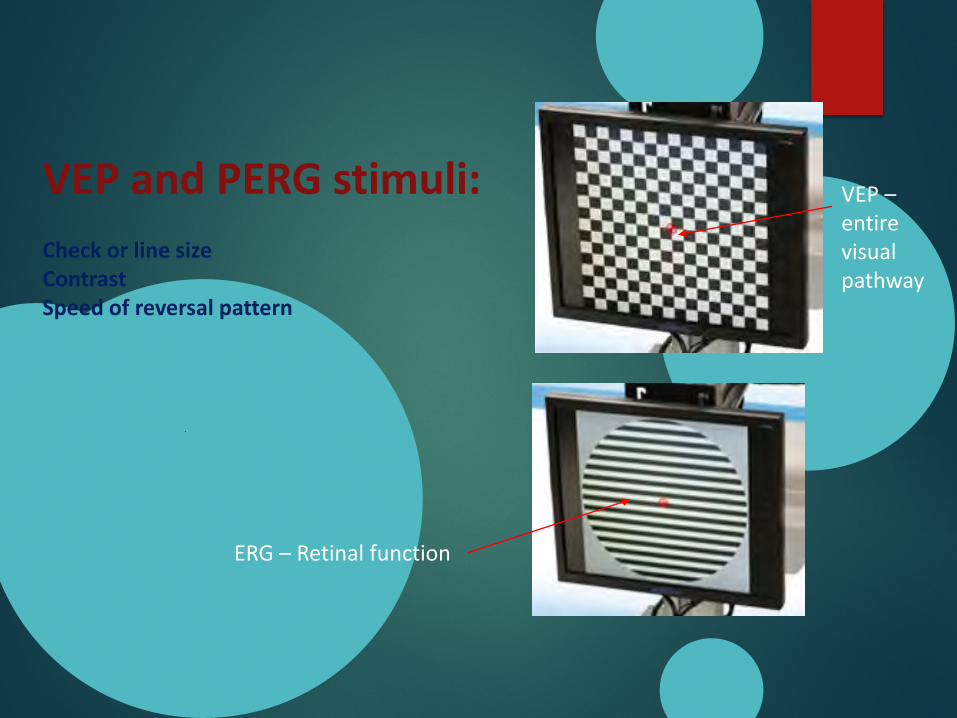
VEP and PERG stimuli:Check or line size Contrast Speed of reversal pattern
VEP –entire visual pathway
ERG – Retinal function
Why VEP?
Many optic nerve diseases are asymptomatic because central vision is not affected until late in the disease1
Diagnosis and management of optic nerve disorders are often based on structural or subjective visual field tests2
1 Glaucoma. American Optometric Association. www.aoa.org2 Prata, Tiago MD, G. De Moraes MD, J. Liebmann MD, R. Ritch, C. Tello MD. (2009). Diagnostic Ability of Fast Transient Visual Evoked Potential
for Glaucoma Assessment [Poster & Abstract] American Academy of Ophthalmology. 128
VEP is an objective, functional test that can help discriminate between healthy and glaucomatous eyes2
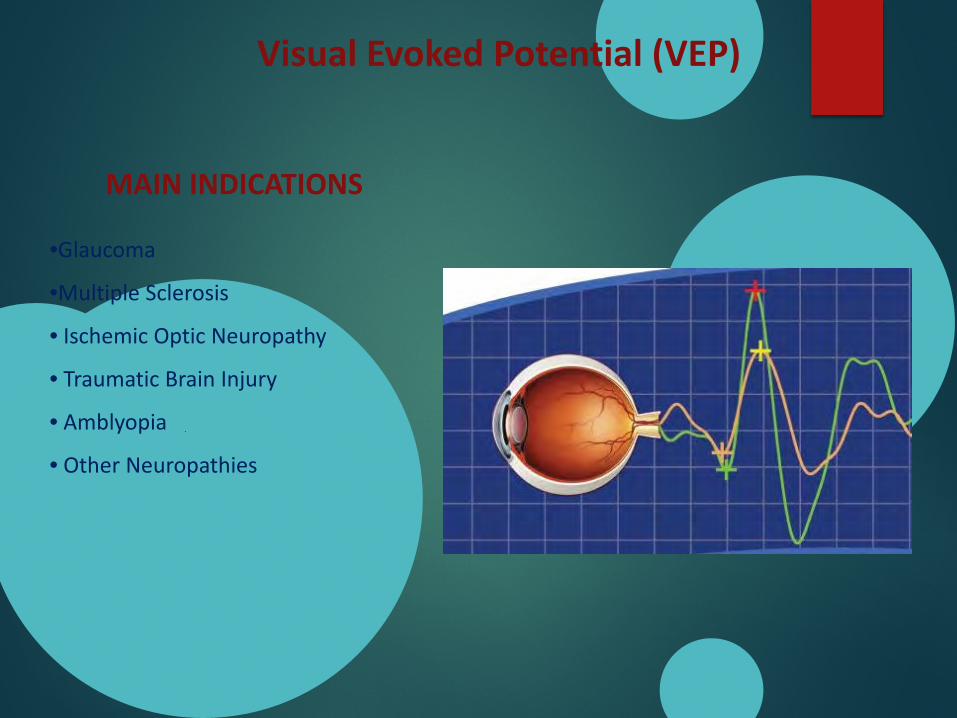
•Glaucoma
•Multiple Sclerosis
• Ischemic Optic Neuropathy
• Traumatic Brain Injury
• Amblyopia
• Other Neuropathies
MAIN INDICATIONS
Visual Evoked Potential (VEP)
VEP –
“Visual evoked potentials (VEPs) can provide important diagnostic information regarding the functional integrity of the visual system.”
ISCEV standard for clinical visual evoked potentials (2009 update)
ISCEV Standards

Where Does Glaucoma Begin?
Researchers at UCSD, Vanderbilt University, and the University of Toronto claim glaucoma begins in the LGN and is later seen as progression measured by visual field and structural changes measured by OCT, GDX, HRT, etc.

Glaucoma & the Brain Led by Robert N. Weinreb, M.D., a team of scientists at
UCSD's Glaucoma Center recently reported that glaucoma is not a disease restricted only to the eye. Their study, "Loss of LGN Neurons in Glaucoma," appeared in the March 2000 issue of Archives of Ophthalmology.
Though commonly misunderstood as a disease of "increased eye pressure" the hallmark of glaucoma is the optic nerve fiber loss, regardless of the pressure.
Ninety percent of the optic nerve fibers from the eye terminate in the lateral geniculate nucleus. The visual cortex detects the electrical signals, processes them, and provides us with our sense of sight.
Dr. Weinreb's group, including lead author Yeni Yucel, M.D., Ph.D. (a neuropathologist and UCSD Postdoctoral Glaucoma Fellow at the time, presently the Director of Ophthalmic Pathology at the University of Toronto ), found in a primate model that there was extensive loss of nerve cells in the lateral geniculate nucleus with progressive glaucoma, a process known as transneuronal degeneration. According to Dr. Weinreb, by studying changes in the brainstem we may better understand what causes vision loss in glaucoma. This information could be critical in helping researchers determine how to prevent vision loss in patients with known glaucoma or at risk for delaying it.
VEP and Glaucoma:Well Defined Science
The Visual Evoked Potential in Glaucoma and Ocular Hypertension: Effects of Check Size, Field Size, and Stimulation Rate
Invest Ophthalmol Vis Sci 24:175-183, 1983
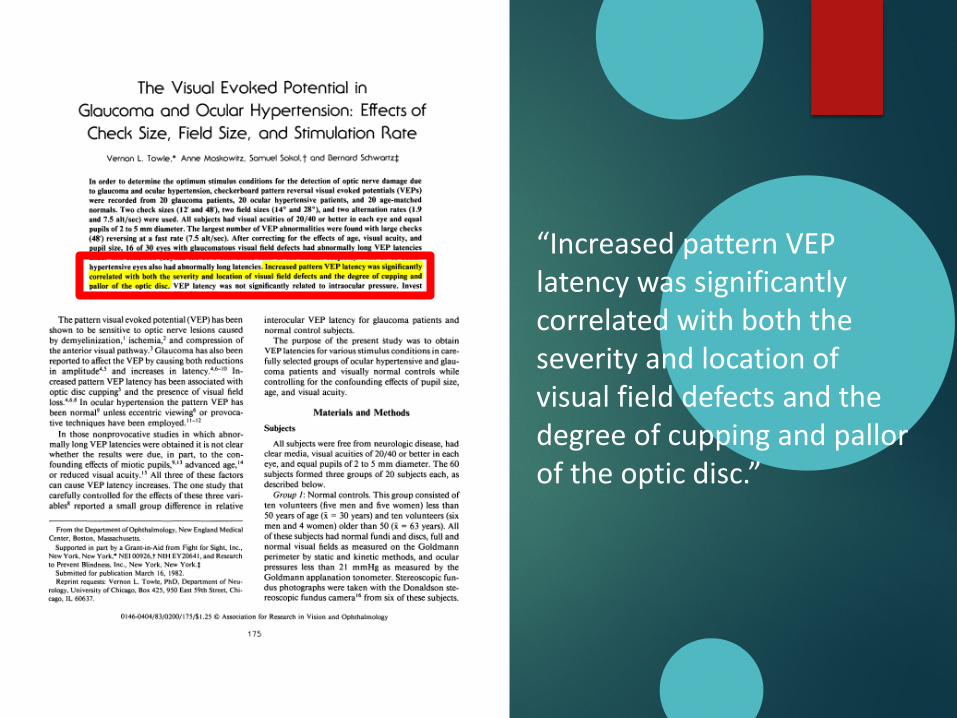
“Increased pattern VEP latency was significantly correlated with both the severity and location of visual field defects and the degree of cupping and pallor of the optic disc.”
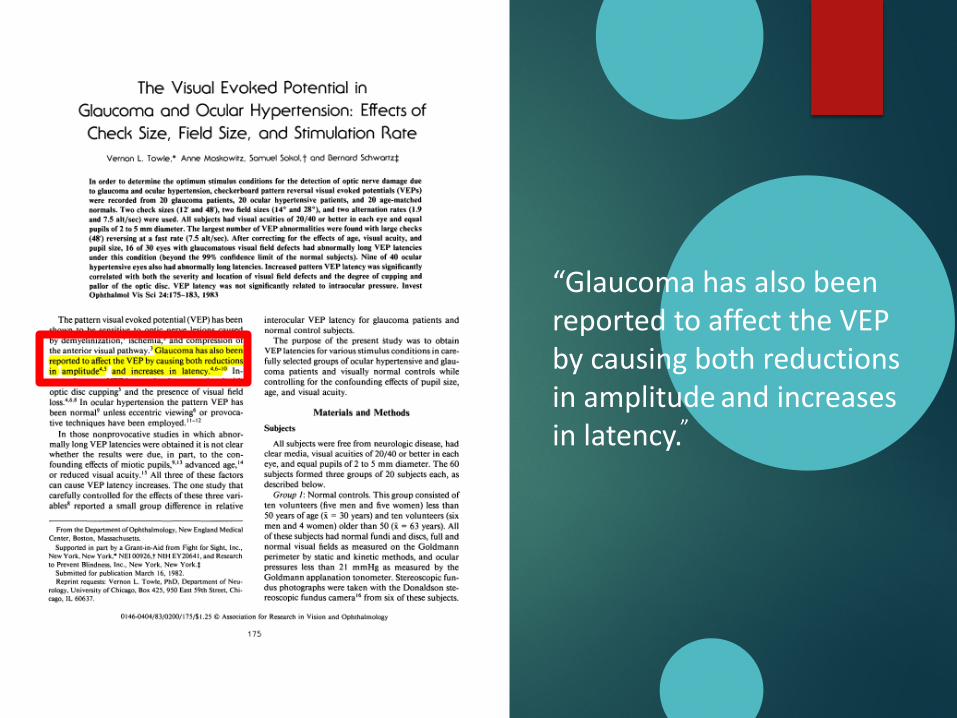
“Glaucoma has also been reported to affect the VEP by causing both reductions in amplitude and increases in latency.”
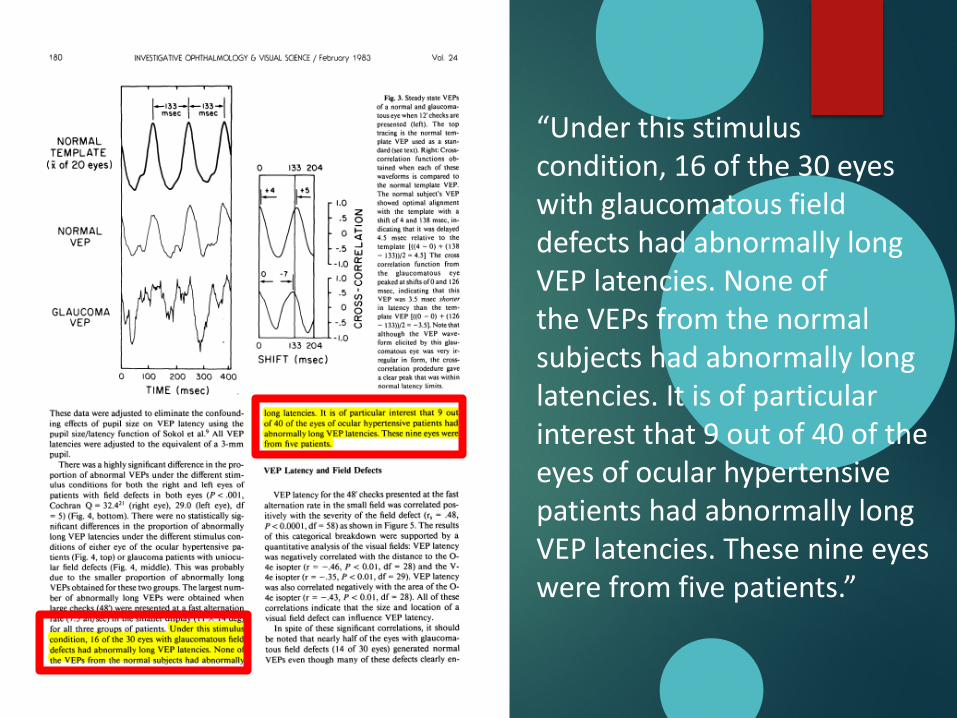
“Under this stimulus condition, 16 of the 30 eyes with glaucomatous field defects had abnormally long VEP latencies. None ofthe VEPs from the normal subjects had abnormally long latencies. It is of particular interest that 9 out of 40 of the eyes of ocular hypertensive patients had abnormally long VEP latencies. These nine eyes were from five patients.”
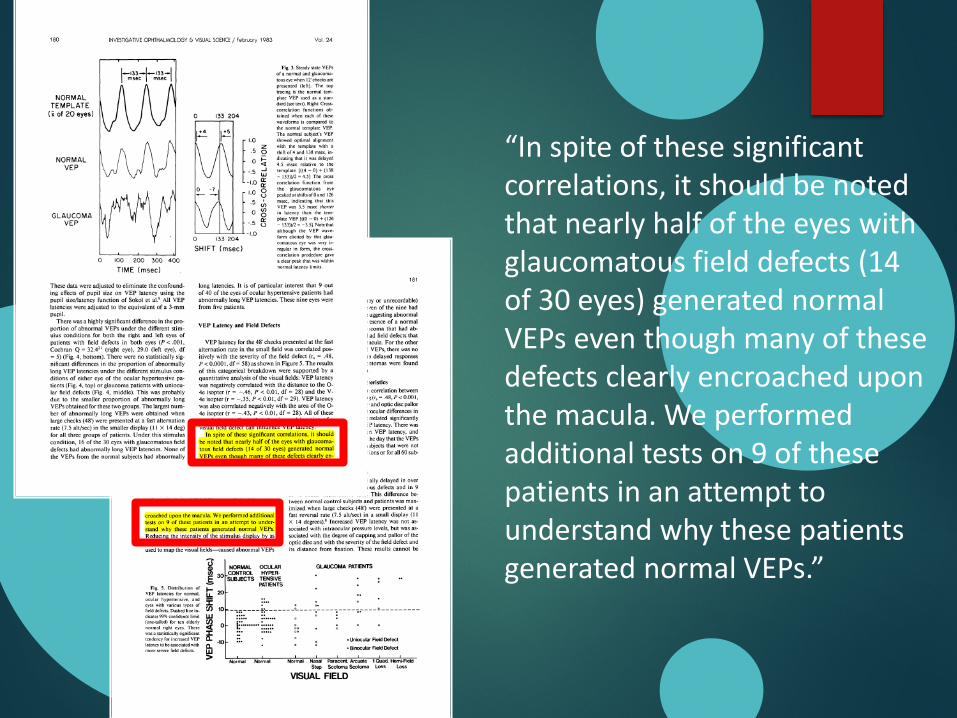
“In spite of these significant correlations, it should be noted that nearly half of the eyes with glaucomatous field defects (14 of 30 eyes) generated normal VEPs even though many of these defects clearly encroached upon the macula. We performed additional tests on 9 of these patients in an attempt to understand why these patients generated normal VEPs.”
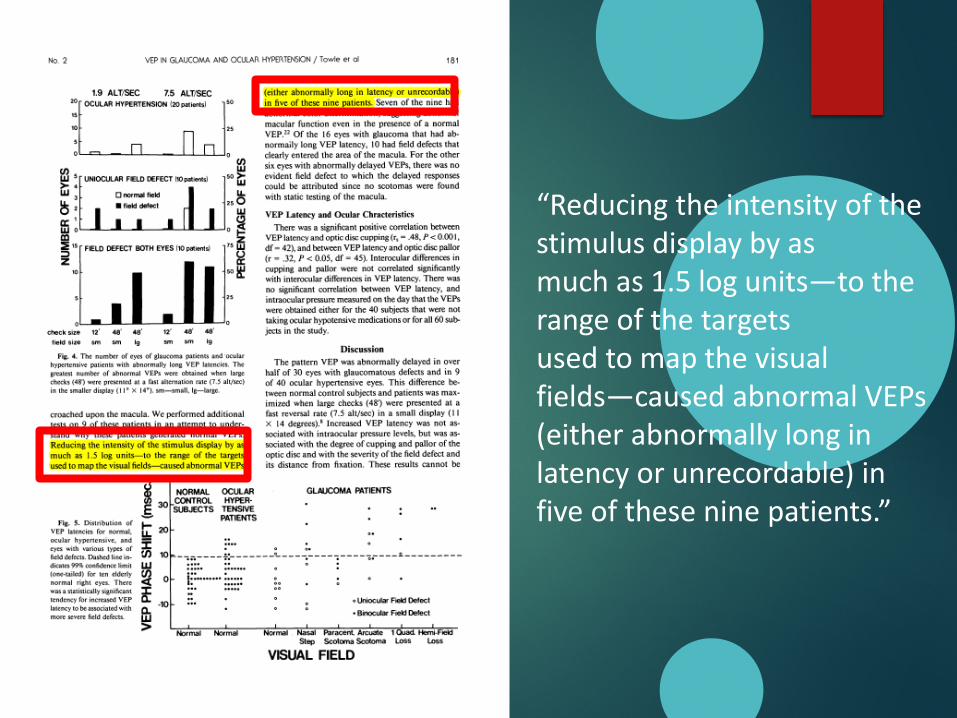
“Reducing the intensity of the stimulus display by asmuch as 1.5 log units—to the range of the targetsused to map the visual fields—caused abnormal VEPs (either abnormally long in latency or unrecordable) in five of these nine patients.”
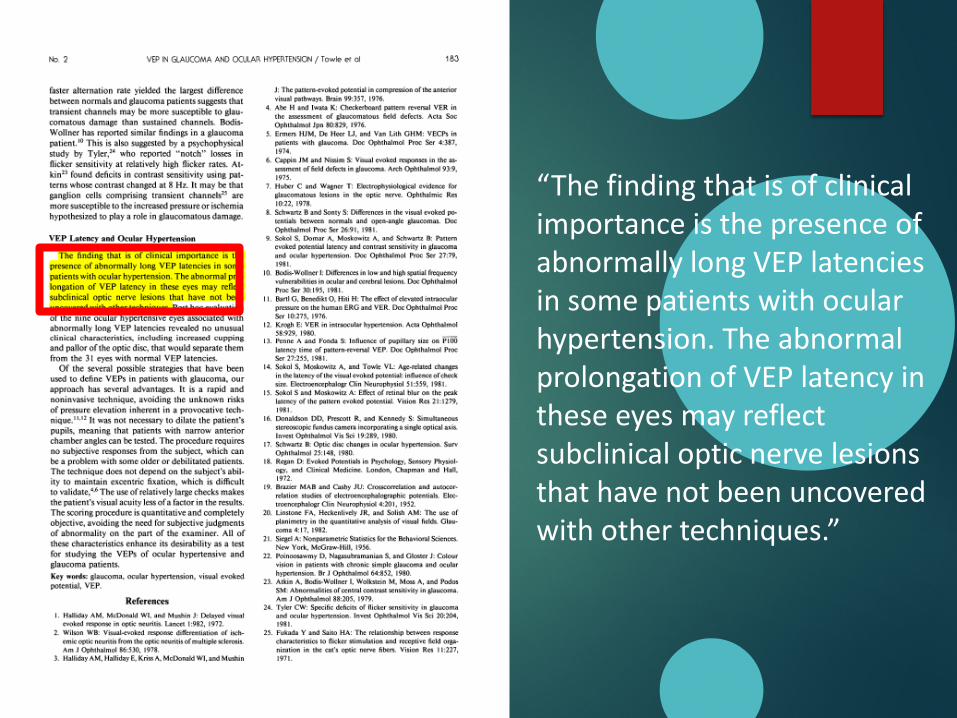
“The finding that is of clinical importance is the presence of abnormally long VEP latencies in some patients with ocular hypertension. The abnormal prolongation of VEP latency in these eyes may reflect subclinical optic nerve lesions that have not been uncovered with other techniques.”
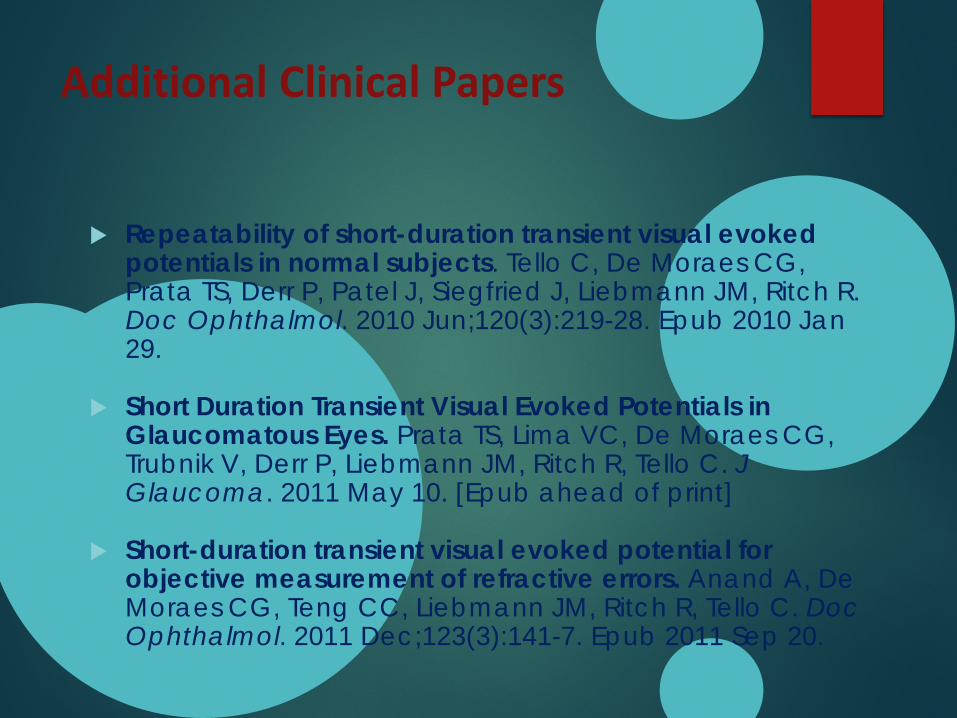
Additional Clinical Papers
Repeatability of short-duration transient visual evoked potentials in normal subjects. Tello C, De Moraes CG, Prata TS, Derr P, Patel J, Siegfried J, Liebmann JM, Ritch R. Doc Ophthalmol. 2010 Jun;120(3):219-28. Epub 2010 Jan 29.
Short Duration Transient Visual Evoked Potentials in Glaucomatous Eyes. Prata TS, Lima VC, De Moraes CG, Trubnik V, Derr P, Liebmann JM, Ritch R, Tello C. J Glaucoma. 2011 May 10. [Epub ahead of print]
Short-duration transient visual evoked potential for objective measurement of refractive errors. Anand A, De Moraes CG, Teng CC, Liebmann JM, Ritch R, Tello C. Doc Ophthalmol. 2011 Dec;123(3):141-7. Epub 2011 Sep 20.
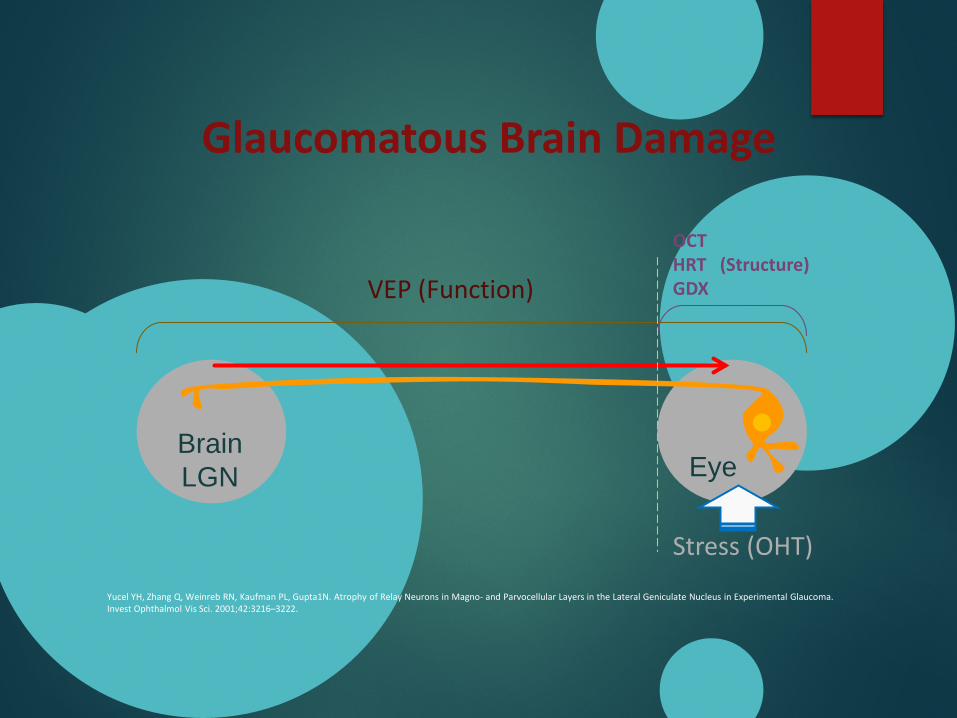
VEP (Function)
EyeBrainLGN
Stress (OHT)
OCTHRT (Structure)GDX
Yucel YH, Zhang Q, Weinreb RN, Kaufman PL, Gupta1N. Atrophy of Relay Neurons in Magno- and Parvocellular Layers in the Lateral Geniculate Nucleus in Experimental Glaucoma. Invest Ophthalmol Vis Sci. 2001;42:3216–3222.
Glaucomatous Brain Damage
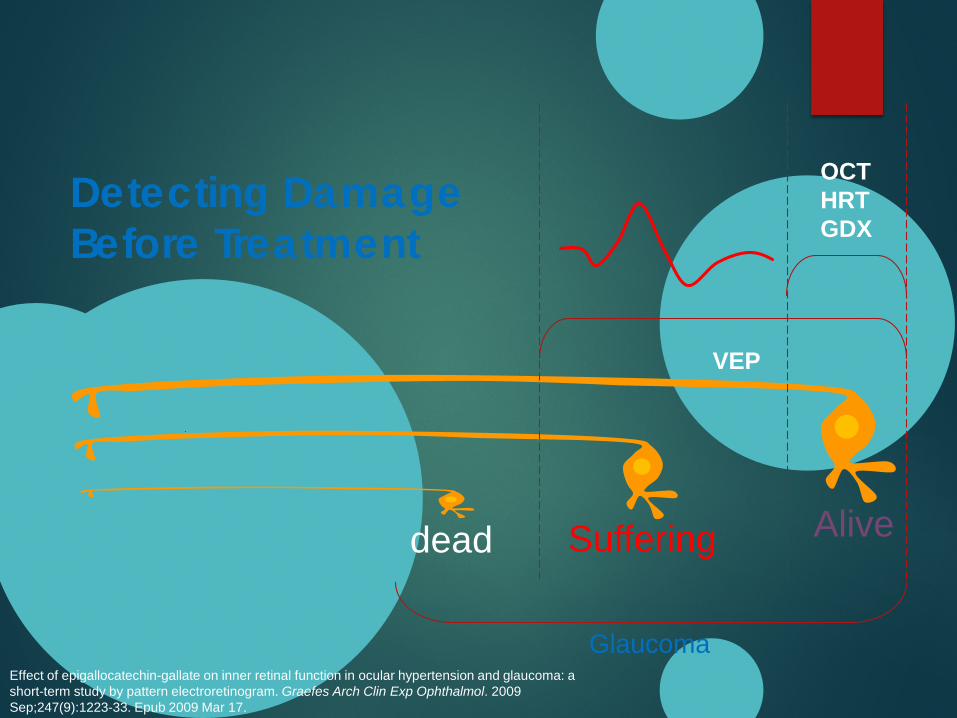
dead Suffering Alive
Glaucoma
VEP
OCTHRTGDX
Detecting Damage Before Treatment
Effect of epigallocatechin-gallate on inner retinal function in ocular hypertension and glaucoma: a short-term study by pattern electroretinogram. Graefes Arch Clin Exp Ophthalmol. 2009 Sep;247(9):1223-33. Epub 2009 Mar 17.
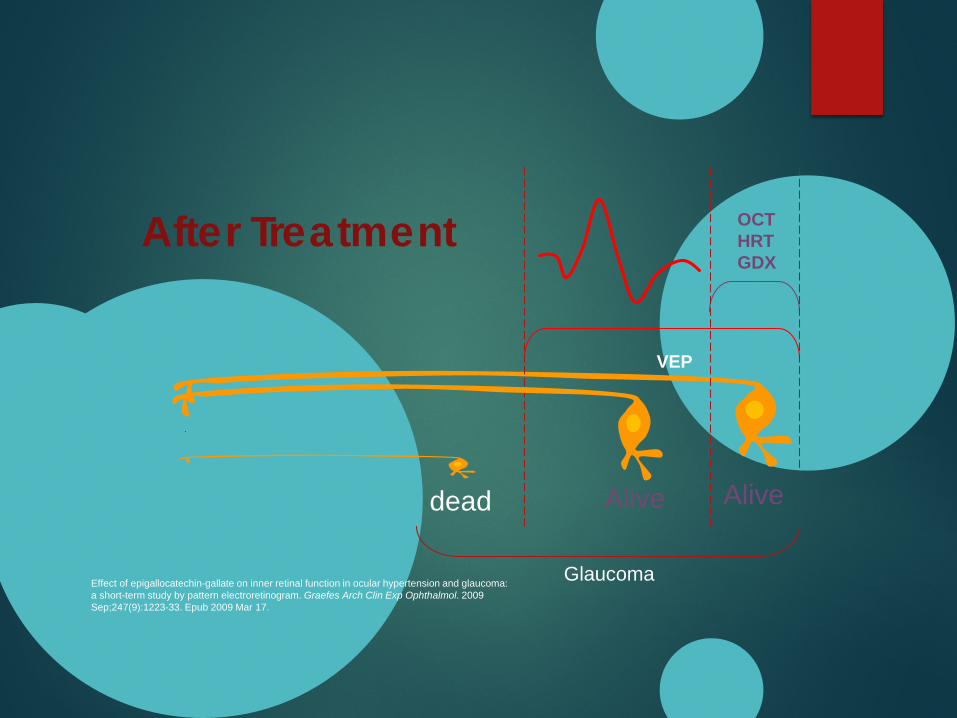
Alive
Glaucoma
VEP
OCTHRTGDX
Alivedead
After Treatment
Effect of epigallocatechin-gallate on inner retinal function in ocular hypertension and glaucoma: a short-term study by pattern electroretinogram. Graefes Arch Clin Exp Ophthalmol. 2009 Sep;247(9):1223-33. Epub 2009 Mar 17.
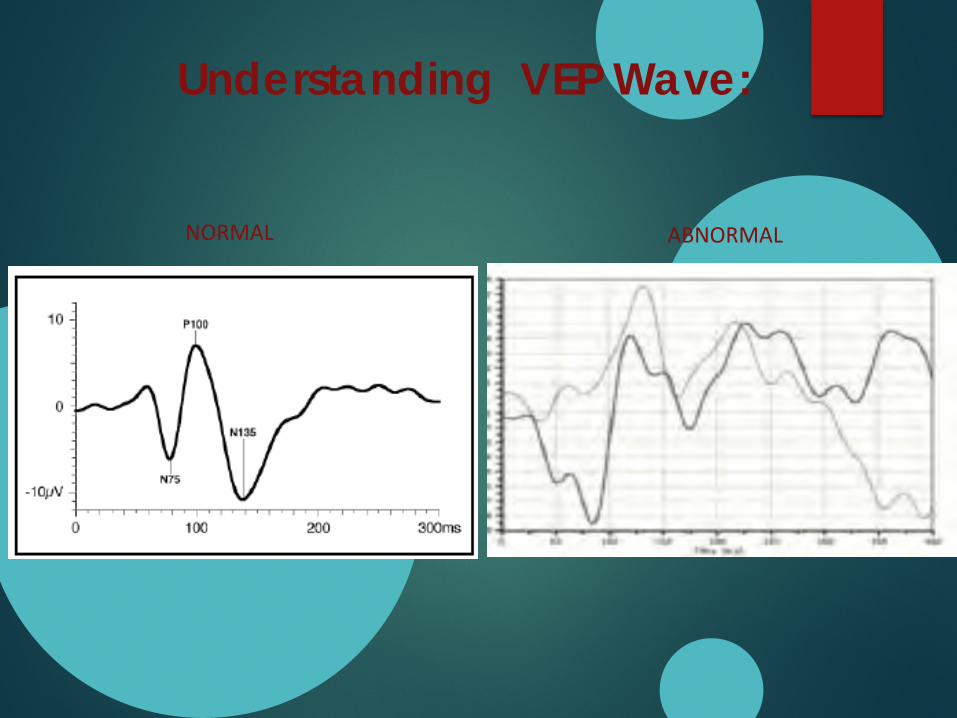
Understanding VEP Wave:
NORMAL ABNORMAL
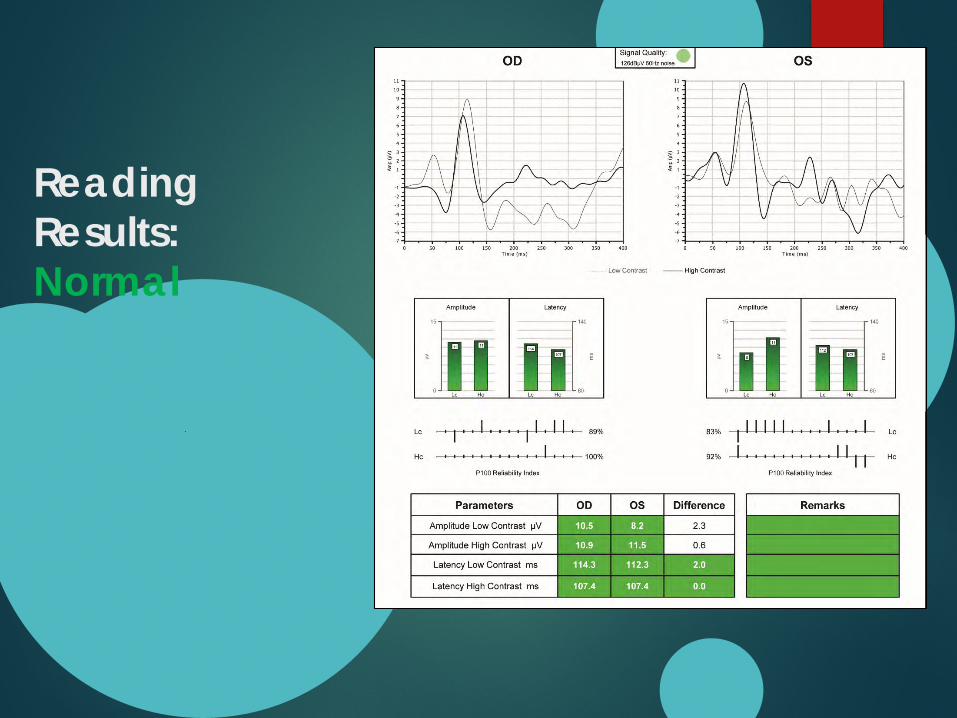
Reading Results:Normal
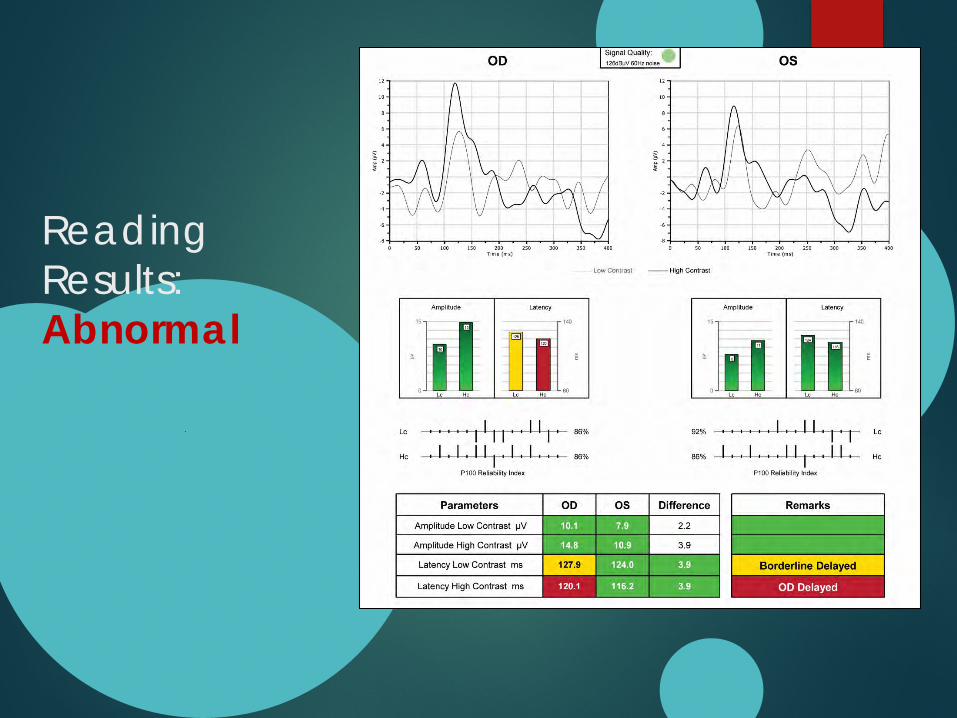
Reading Results:Abnormal
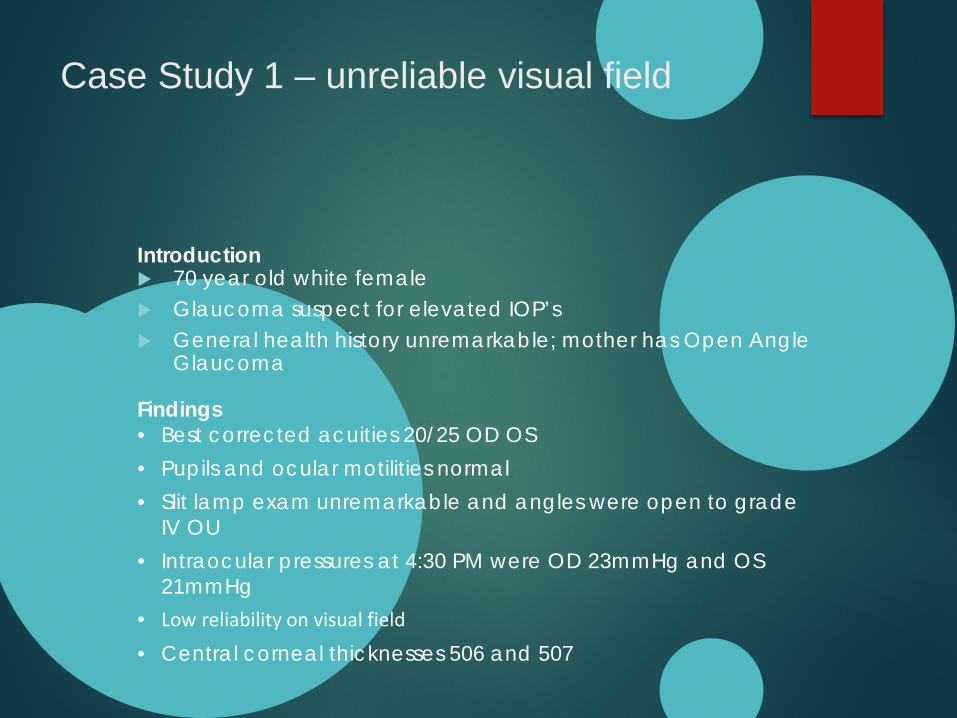
Case Study 1 – unreliable visual field
Introduction 70 year old white female Glaucoma suspect for elevated IOP’s General health history unremarkable; mother has Open Angle
Glaucoma
Findings• Best corrected acuities 20/25 OD OS• Pupils and ocular motilities normal• Slit lamp exam unremarkable and angles were open to grade
IV OU• Intraocular pressures at 4:30 PM were OD 23mmHg and OS
21mmHg• Low reliability on visual field
• Central corneal thicknesses 506 and 507
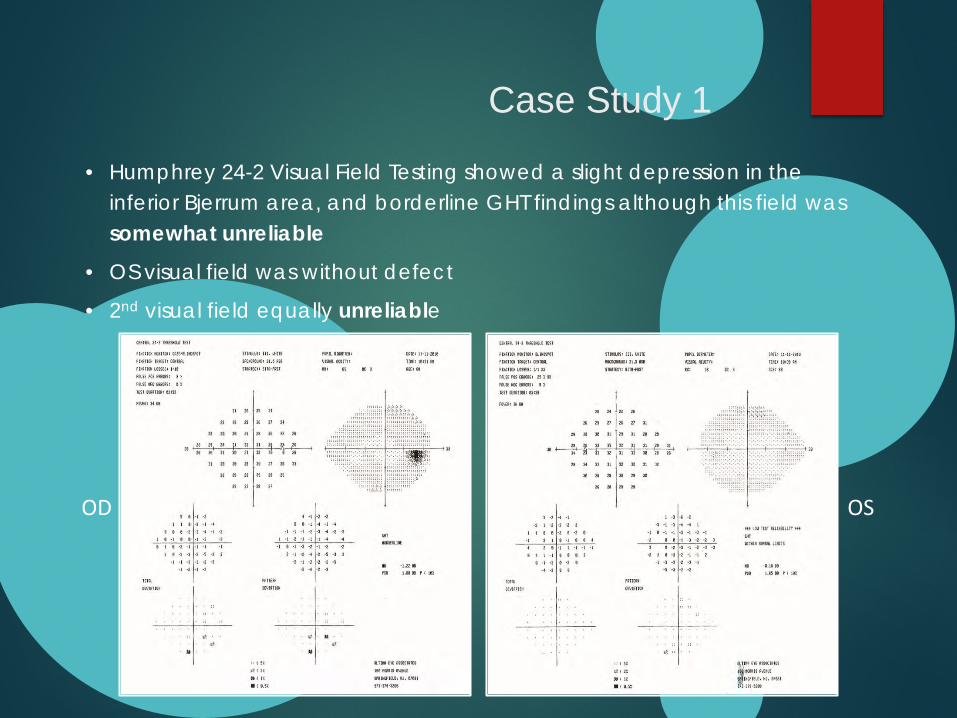
Case Study 1
• Humphrey 24-2 Visual Field Testing showed a slight depression in the inferior Bjerrum area, and borderline GHT findings although this field was somewhat unreliable
• OS visual field was without defect
• 2nd visual field equally unreliable
OD OS
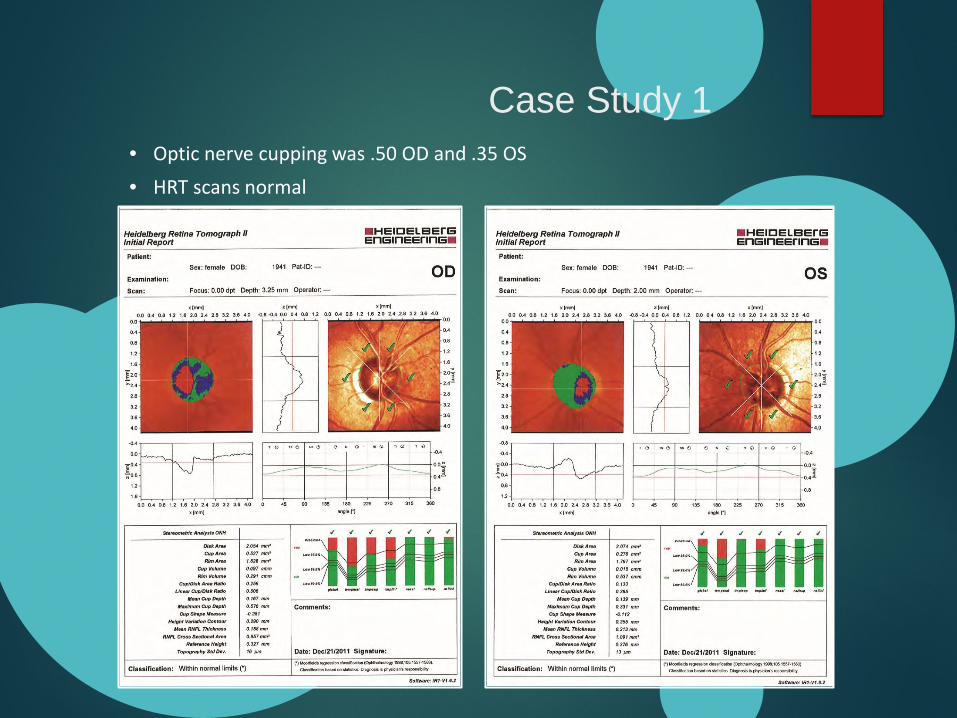
Case Study 1 • Optic nerve cupping was .50 OD and .35 OS• HRT scans normal
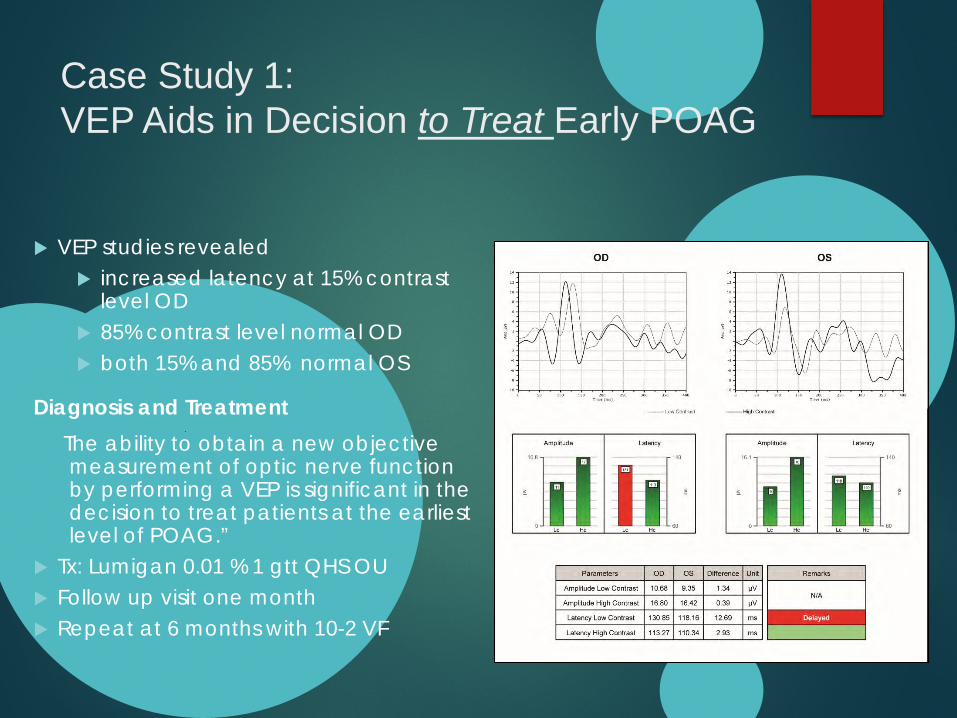
Case Study 1: VEP Aids in Decision to Treat Early POAG
VEP studies revealed increased latency at 15% contrast
level OD 85% contrast level normal OD both 15% and 85% normal OS
Diagnosis and TreatmentThe ability to obtain a new objective measurement of optic nerve function by performing a VEP is significant in the decision to treat patients at the earliest level of POAG.”
Tx: Lumigan 0.01 % 1 gtt QHS OU Follow up visit one month Repeat at 6 months with 10-2 VF
Case Study 2 – borderline for treatment
Introduction 45 year old white male General health, eye health and family health histories unremarkable Routine eye exam without significant complaints
Findings• Best corrected visual acuities with a
small compound myopic correction of 20/20 OD OS
• Pupils, color vision, motilities, and muscle balance normal
• Intraocular pressures at 3:30 pm were 15mmHg in each eye
• Asymmetric cupping on Fundoscopic exam as determined with a 78 D lens of .65 OD and .40 OS
• Intraocular pressures at 10:30 in the morning were 15mmHg OU
• Central corneal thickness was 550 OD and 550 OS
• Gonioscopic view of the angles was open to the ciliary body OU with a 30 degree approach angle and grade II pigmentation
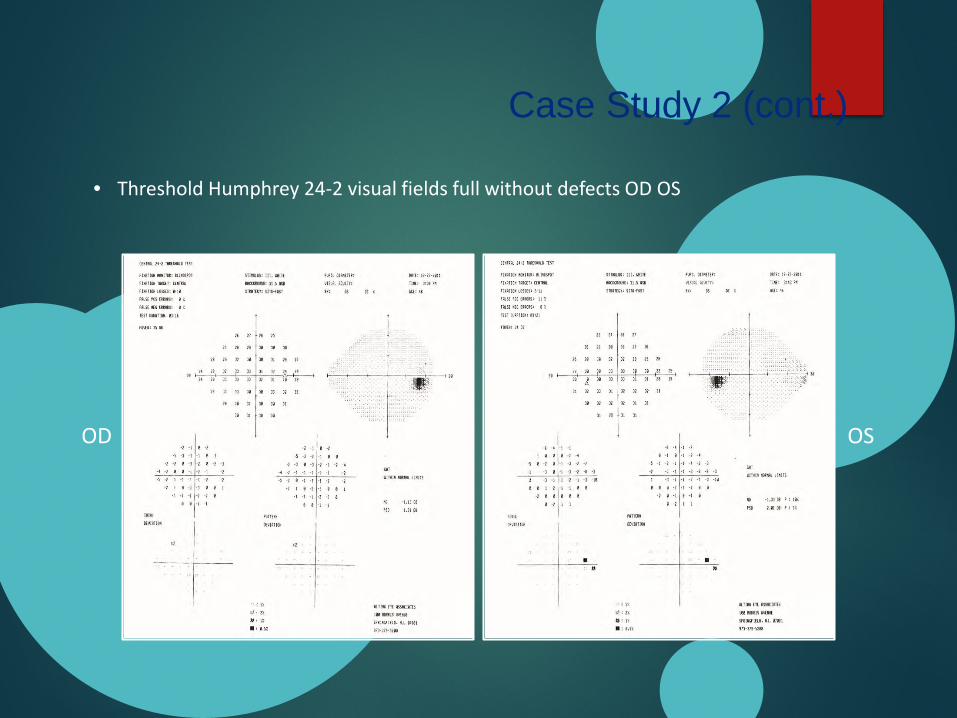
Case Study 2 (cont.)
• Threshold Humphrey 24-2 visual fields full without defects OD OS
OD OS
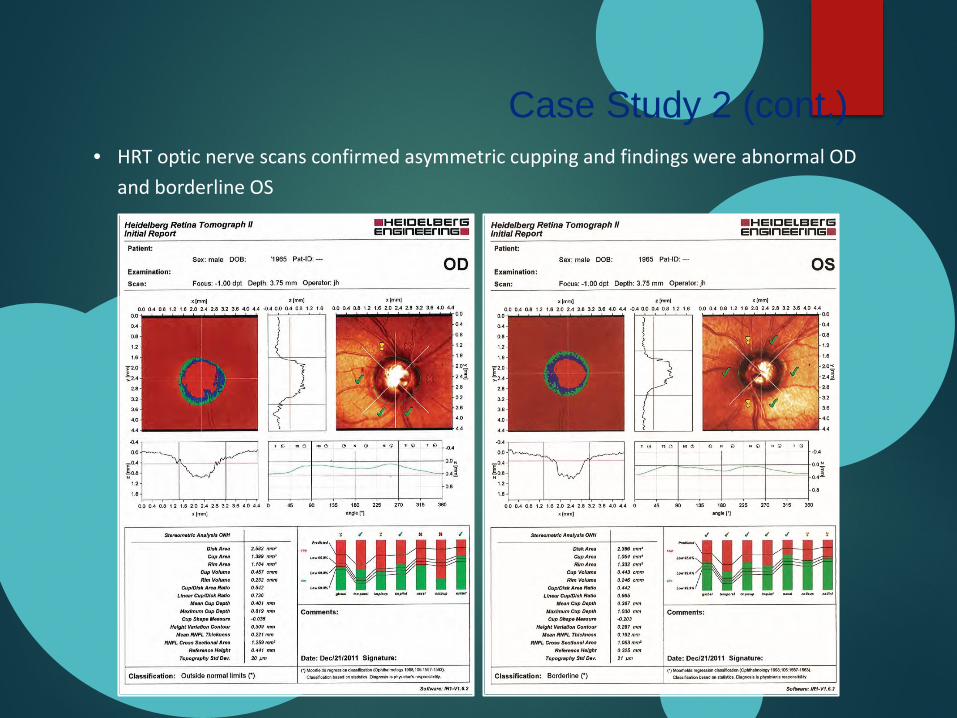
• HRT optic nerve scans confirmed asymmetric cupping and findings were abnormal OD and borderline OS
Case Study 2 (cont.)
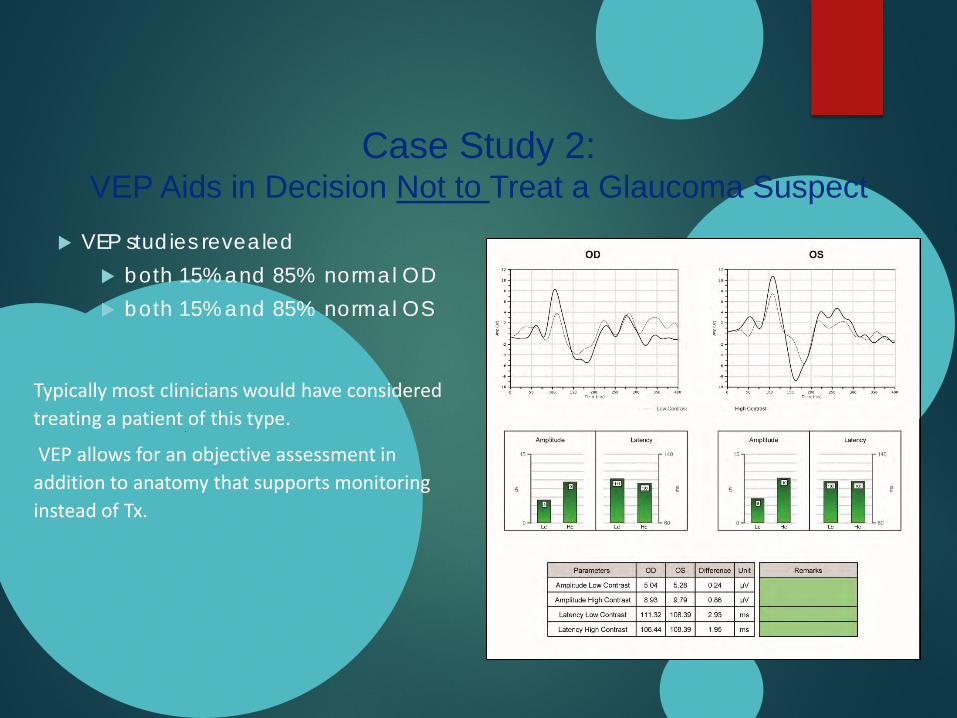
VEP studies revealed both 15% and 85% normal OD both 15% and 85% normal OS
Typically most clinicians would have considered treating a patient of this type.
VEP allows for an objective assessment in addition to anatomy that supports monitoring instead of Tx.
Case Study 2: VEP Aids in Decision Not to Treat a Glaucoma Suspect
Case Study 3
Introduction 56-year-old black female O.D. is -5.75 – 0.50 x 015 with 20/20- acuity O.S. is -5.75 – 0.25 x 180 with 20/20- acuity Mild cortical cataracts No apparent retinal pathology No significant medical or ocular history Patient states her vision in decreasing and she “just can’t
see right”
Case Study 3
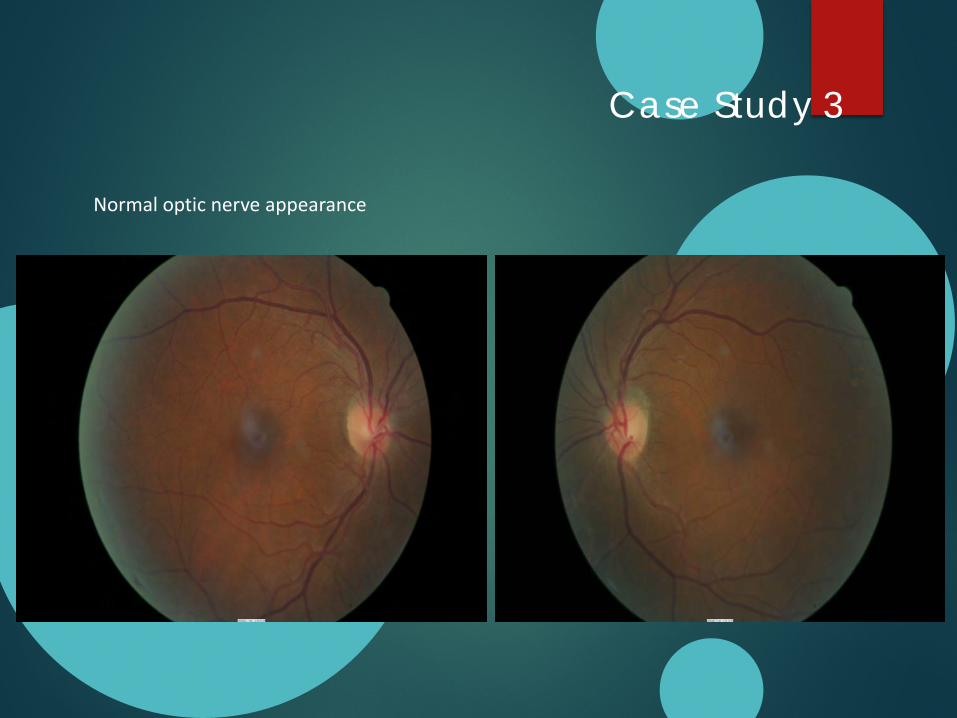
Normal optic nerve appearance
Case Study 3
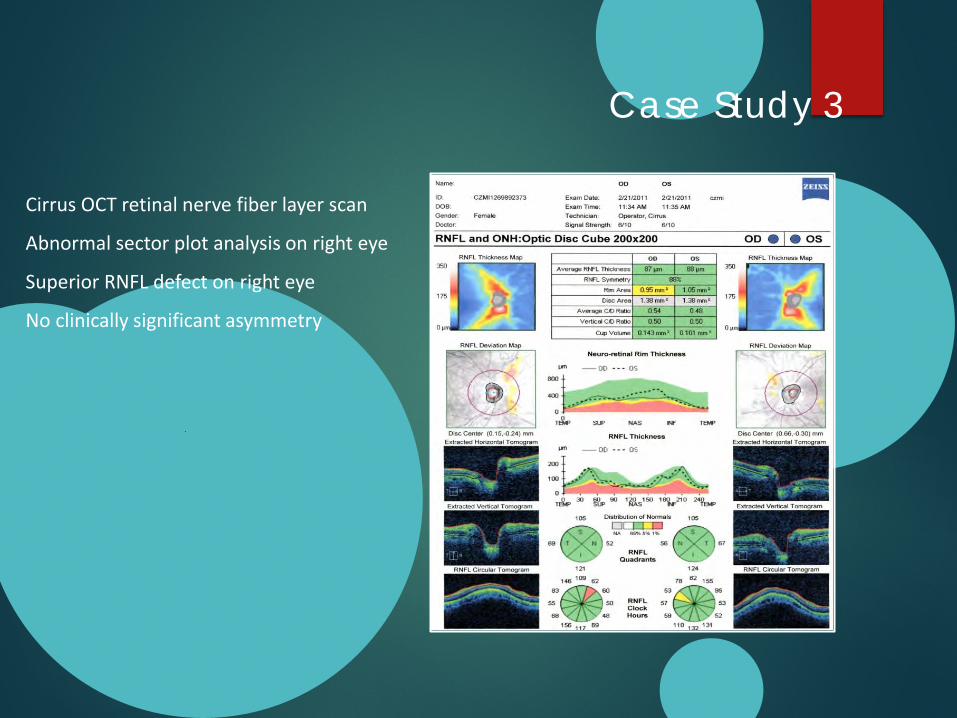
Cirrus OCT retinal nerve fiber layer scan
Abnormal sector plot analysis on right eye
Superior RNFL defect on right eye
No clinically significant asymmetry
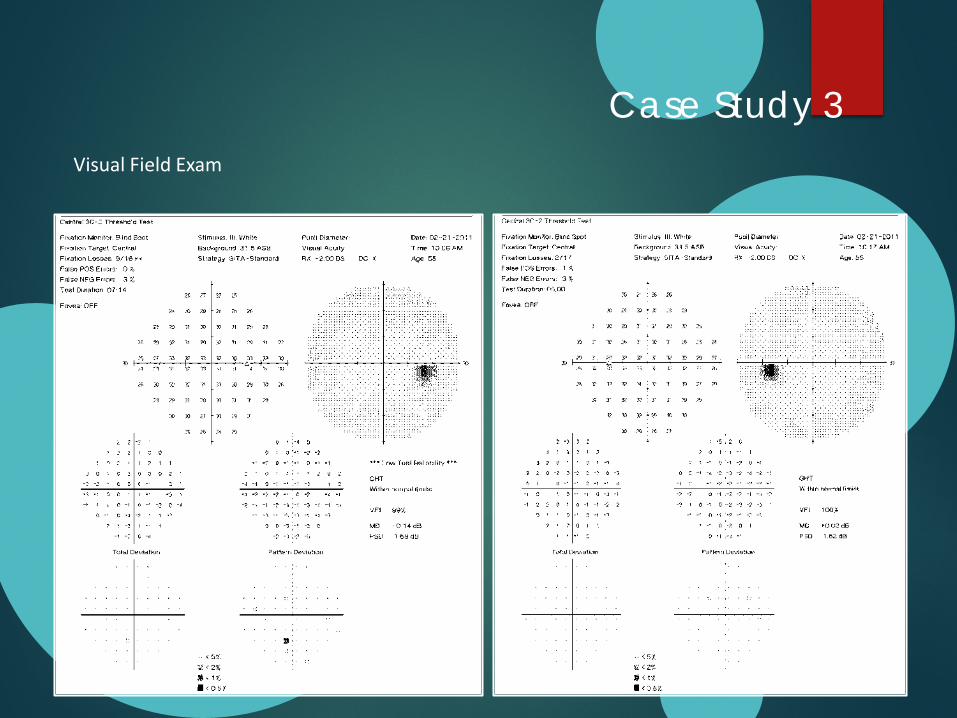
Case Study 3 Visual Field Exam
Case Study 3
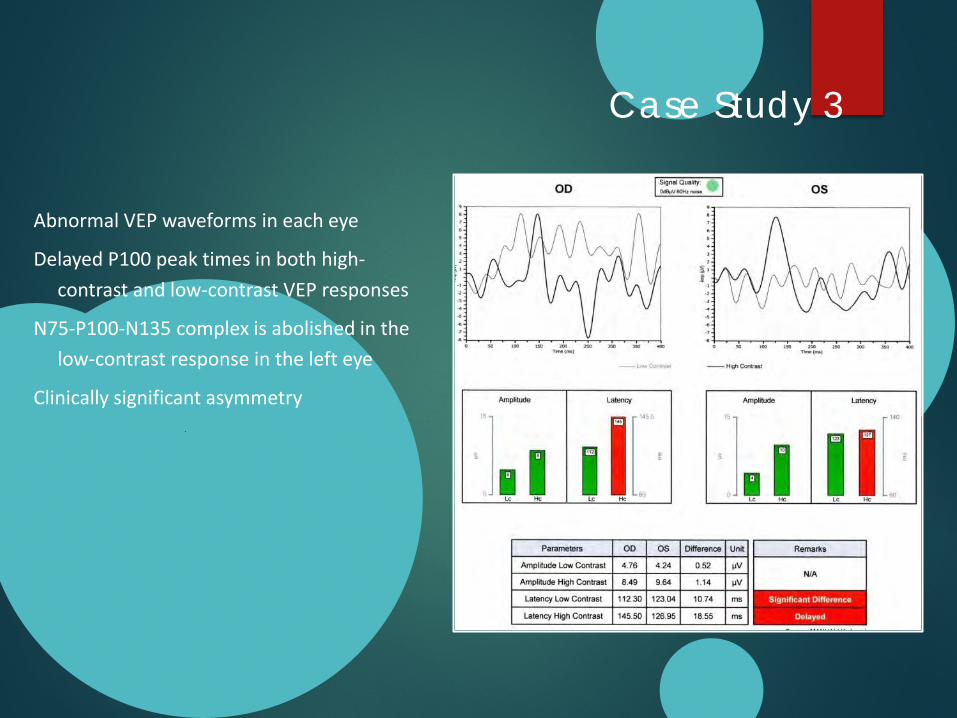
Abnormal VEP waveforms in each eye
Delayed P100 peak times in both high-contrast and low-contrast VEP responses
N75-P100-N135 complex is abolished in the low-contrast response in the left eye
Clinically significant asymmetry
Case Study 3
Diagnosis and TreatmentPatient was referred out for an MRIMRI results found a cavernous hemangioma
Medical Decision Making:In patients with subjective visual disturbances VEP can be a valued adjunct to traditional imagingNormal VEP test results may suggest a conservative approach such as monitoring (i.e., temporary
cessation of the diagnostic program).Abnormal VEP test results suggests a continuation of the diagnostic program with one or more of the
following treatment options:Confirm all abnormal findings within 1-2 weeks
Brain, optic nerve, orbital imaging and angiography
Referral as appropriate
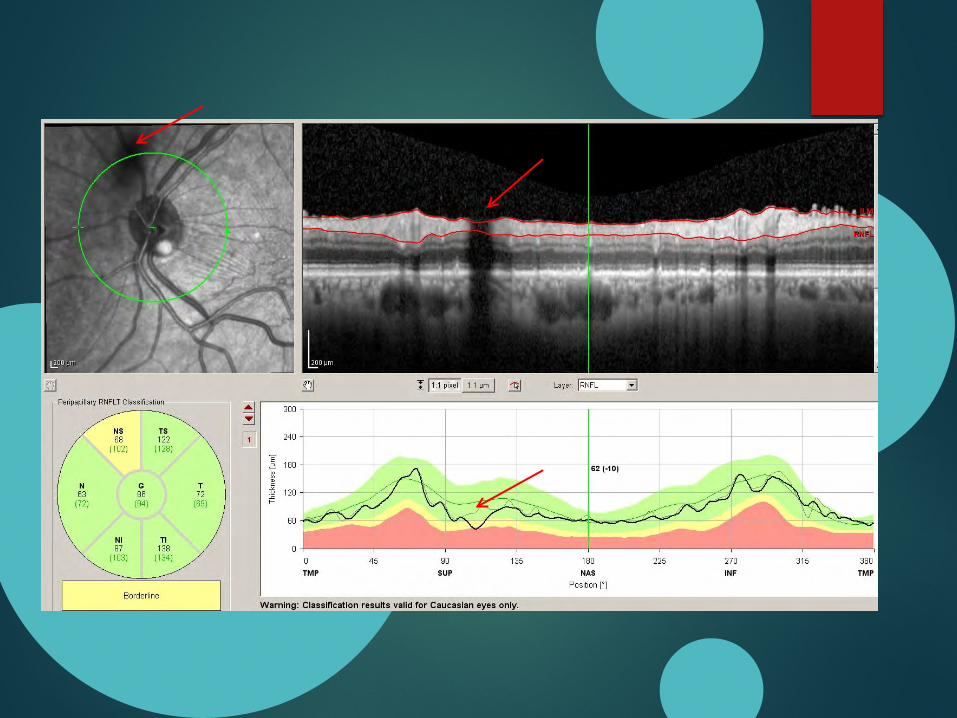
Misinterpretation artifacts Localized losses of RNFL or macular thickness classified as
normal due to averaging of thickness values by quadrant, sector or hemisphere
Misinterpretation of shadow artifacts
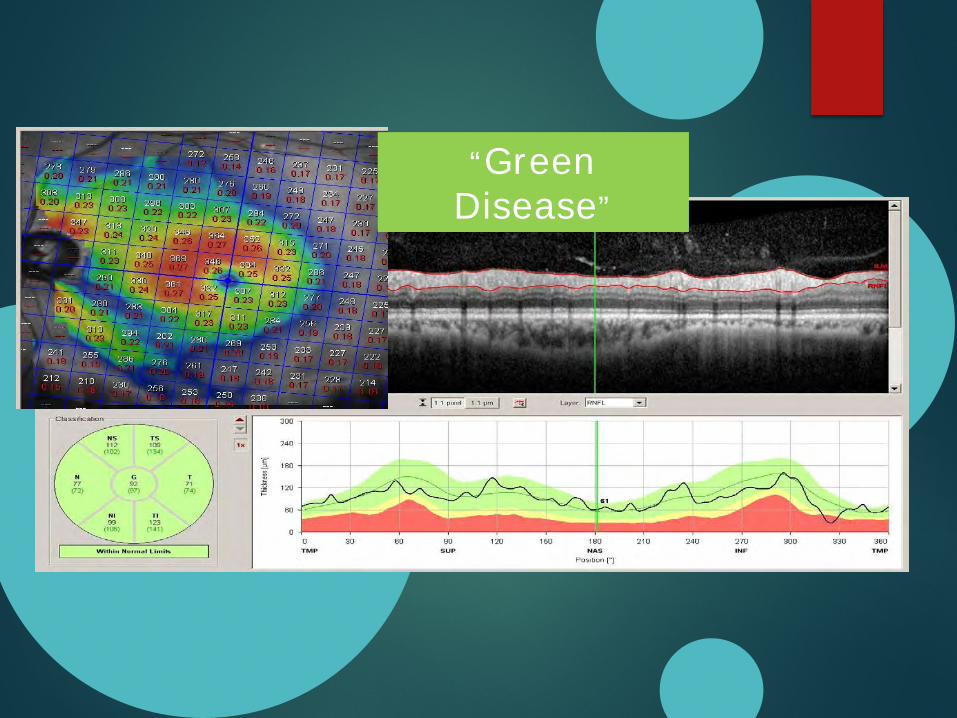
“Green Disease”

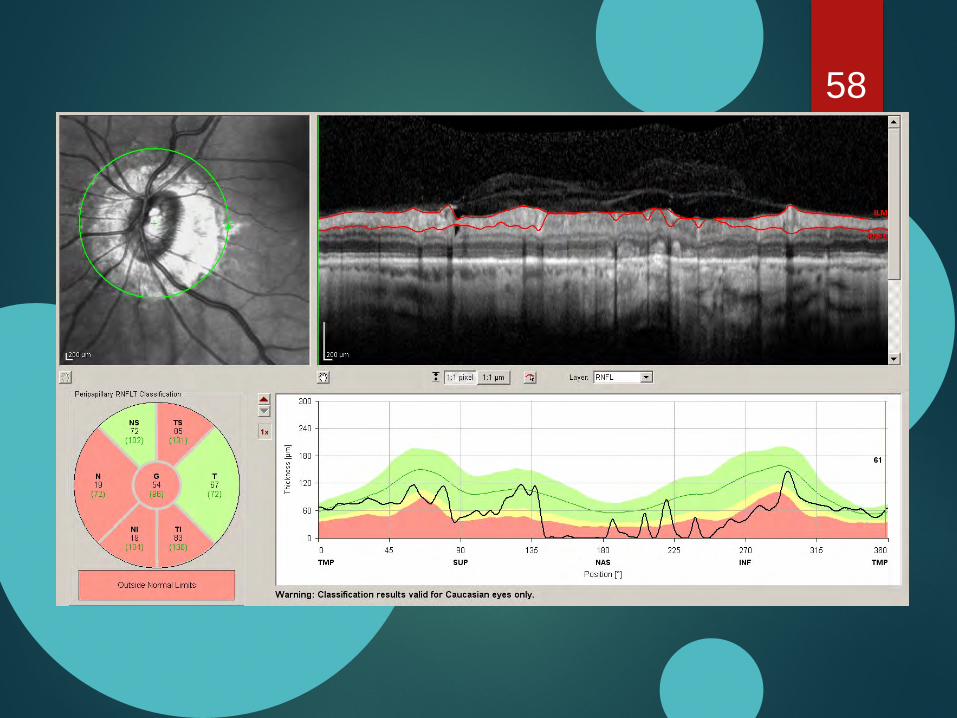
Myopia = “Red Disease”
There is a higher percentage of abnormal diagnostic classification since the RNFL normative databases typically do not include moderate and high myopes.
Myopic eyes are also associated with many other artifacts such as difficulty in acquiring a good image due to excessively long axial length or myopic retinal schisis affecting peripapillary RNFL thickness
58
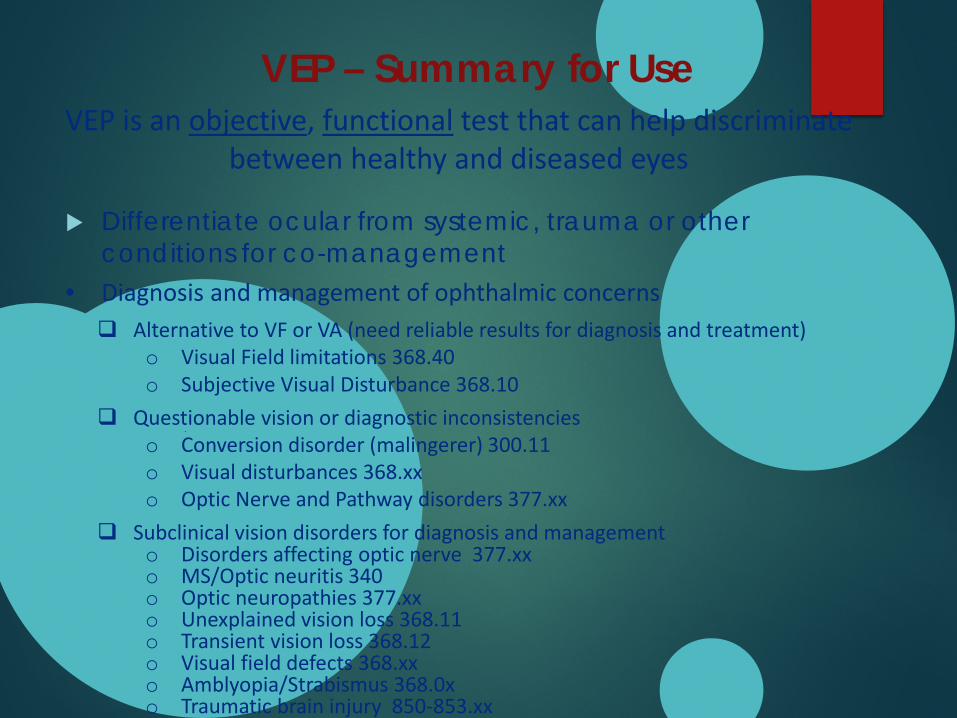
VEP – Summary for Use
Differentiate ocular from systemic, trauma or other conditions for co-management
VEP is an objective, functional test that can help discriminate between healthy and diseased eyes
• Diagnosis and management of ophthalmic concerns Alternative to VF or VA (need reliable results for diagnosis and treatment)
o Visual Field limitations 368.40o Subjective Visual Disturbance 368.10
Questionable vision or diagnostic inconsistencieso Conversion disorder (malingerer) 300.11o Visual disturbances 368.xxo Optic Nerve and Pathway disorders 377.xx
Subclinical vision disorders for diagnosis and managemento Disorders affecting optic nerve 377.xxo MS/Optic neuritis 340o Optic neuropathies 377.xxo Unexplained vision loss 368.11o Transient vision loss 368.12o Visual field defects 368.xxo Amblyopia/Strabismus 368.0xo Traumatic brain injury 850-853.xx
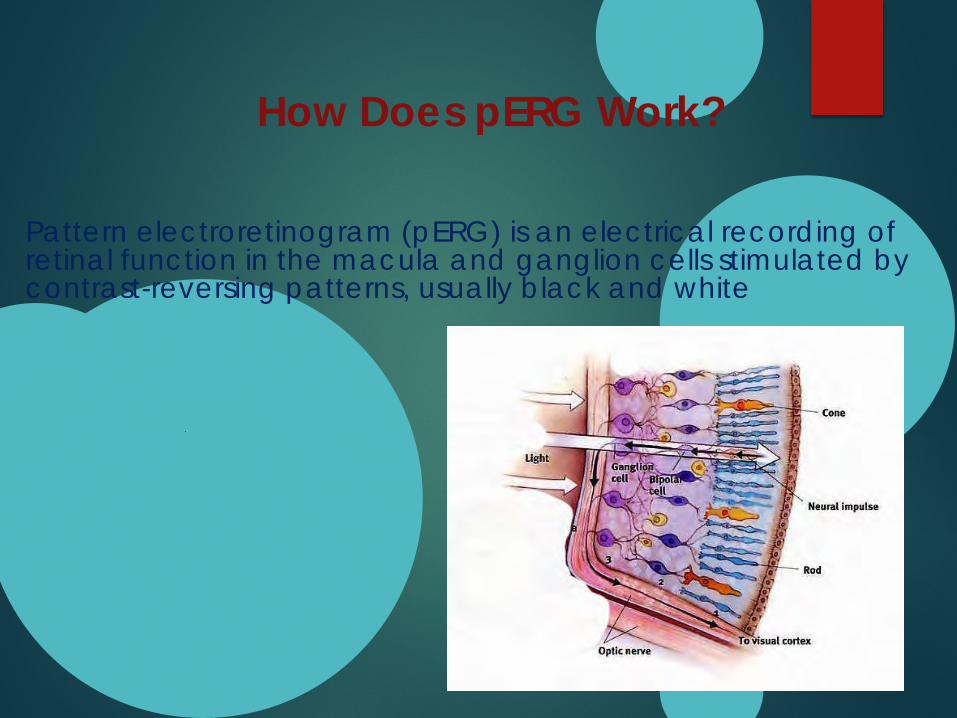
How Does pERG Work?
Pattern electroretinogram (pERG) is an electrical recording of retinal function in the macula and ganglion cells stimulated by contrast-reversing patterns, usually black and white
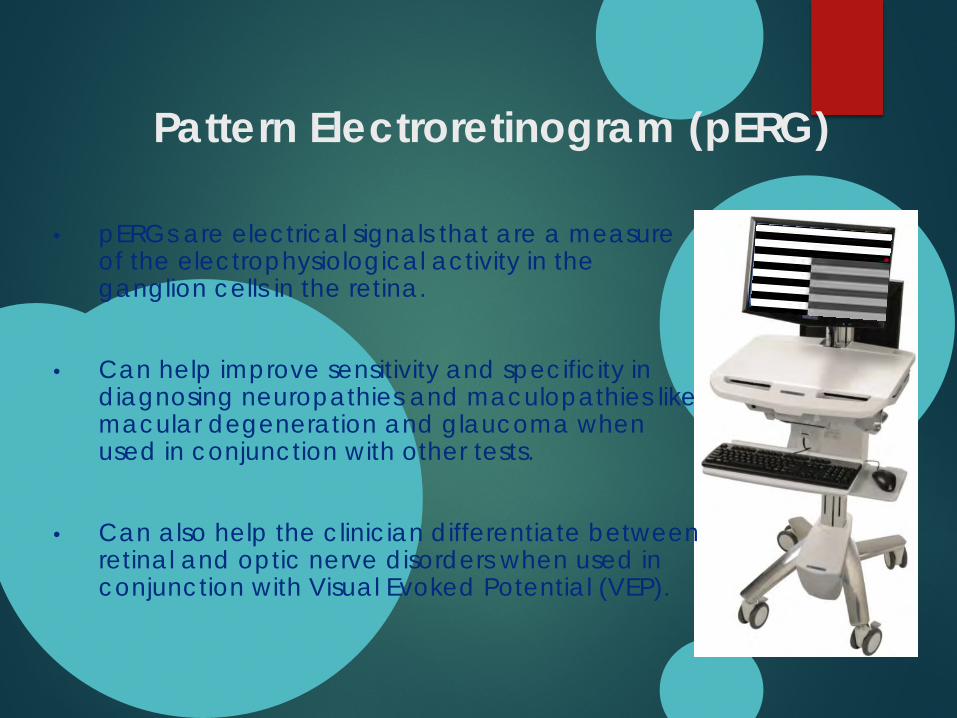
Pattern Electroretinogram (pERG)
• pERGs are electrical signals that are a measure of the electrophysiological activity in the ganglion cells in the retina.
• Can help improve sensitivity and specificity in diagnosing neuropathies and maculopathies like macular degeneration and glaucoma when used in conjunction with other tests.
• Can also help the clinician differentiate between retinal and optic nerve disorders when used in conjunction with Visual Evoked Potential (VEP).
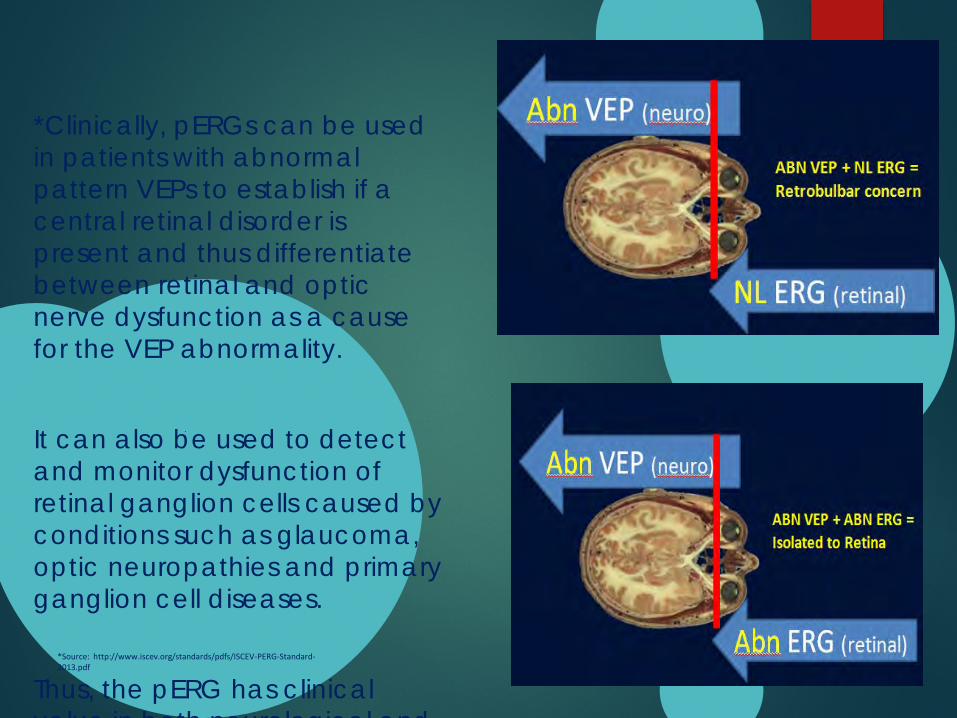
*Clinically, pERGs can be used in patients with abnormal pattern VEPs to establish if a central retinal disorder is present and thus differentiate between retinal and optic nerve dysfunction as a cause for the VEP abnormality.
It can also be used to detect and monitor dysfunction of retinal ganglion cells caused by conditions such as glaucoma, optic neuropathies and primary ganglion cell diseases.
Thus, the pERG has clinical value in both neurological and
*Source: http://www.iscev.org/standards/pdfs/ISCEV-PERG-Standard-2013.pdf
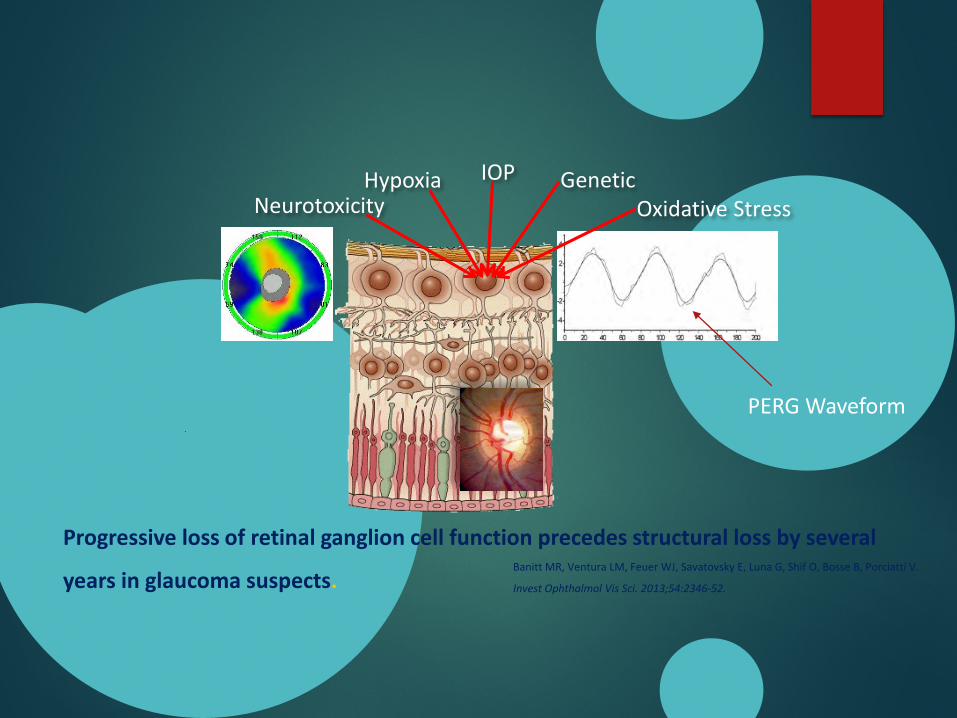
Banitt MR, Ventura LM, Feuer WJ, Savatovsky E, Luna G, Shif O, Bosse B, Porciatti V.
Invest Ophthalmol Vis Sci. 2013;54:2346-52.
IOP GeneticOxidative StressNeurotoxicity
Hypoxia
PERG Waveform
Progressive loss of retinal ganglion cell function precedes structural loss by several
years in glaucoma suspects.
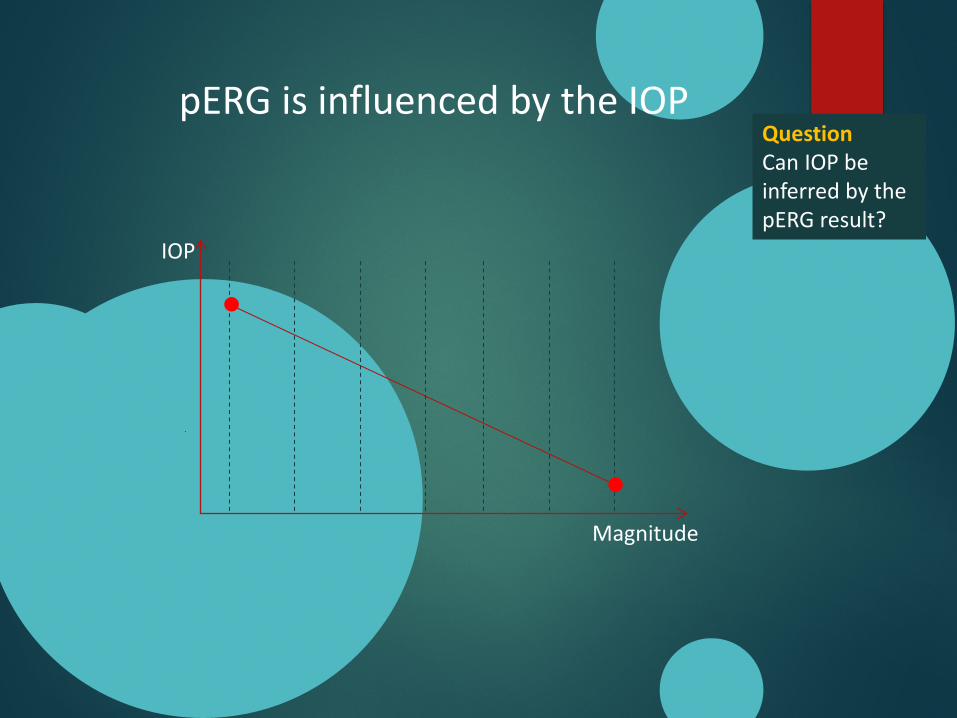
pERG is influenced by the IOP
IOP
Magnitude
QuestionCan IOP be inferred by the pERG result?
ERG Clinical Applications
• Differentiate retinal and optic nerve disorders
• Inconsistent or borderline test results (Patient symptoms or test results are equivocal)
Diagnose and manage treatment efficacy of subclinical ophthalmic disorders:glaucomaage-related macular degeneration (AMD) diabetic edema, diabetic retinopathyToxicity/plaquenil
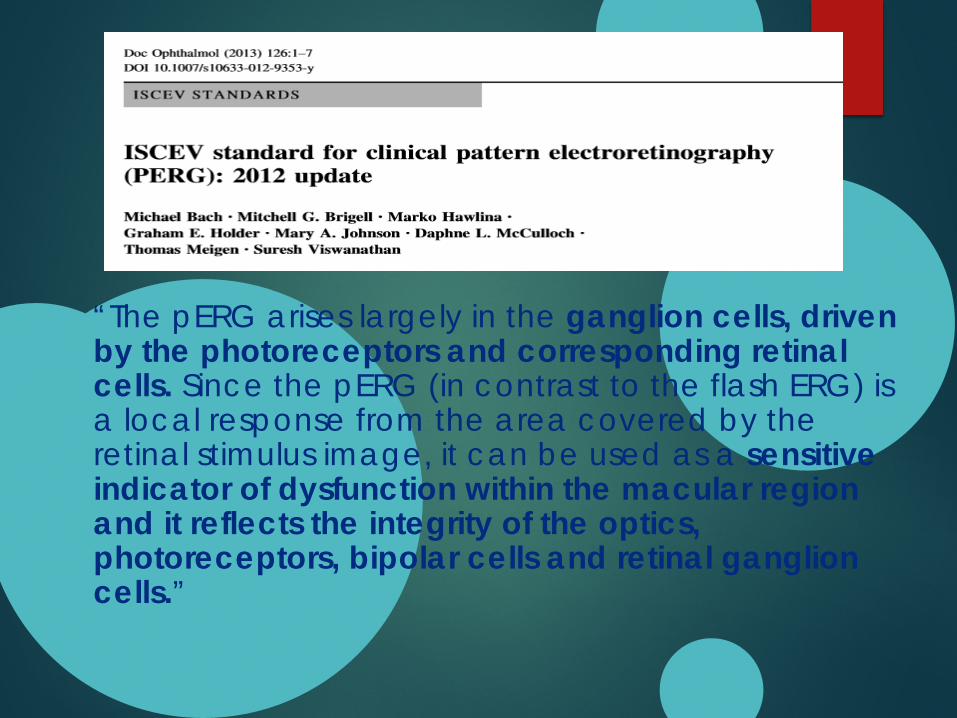
“The pERG arises largely in the ganglion cells, driven by the photoreceptors and corresponding retinal cells. Since the pERG (in contrast to the flash ERG) is a local response from the area covered by the retinal stimulus image, it can be used as a sensitive indicator of dysfunction within the macular region and it reflects the integrity of the optics, photoreceptors, bipolar cells and retinal ganglion cells.”
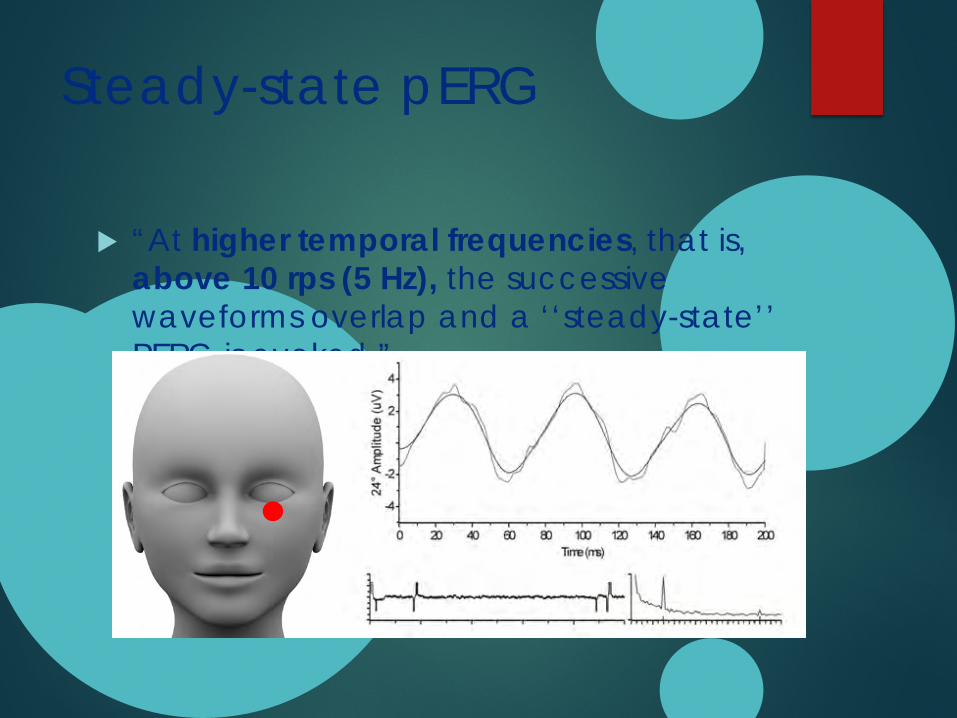
Steady-state pERG
“At higher temporal frequencies, that is, above 10 rps (5 Hz), the successive waveforms overlap and a ‘‘steady-state’’ PERG is evoked.”
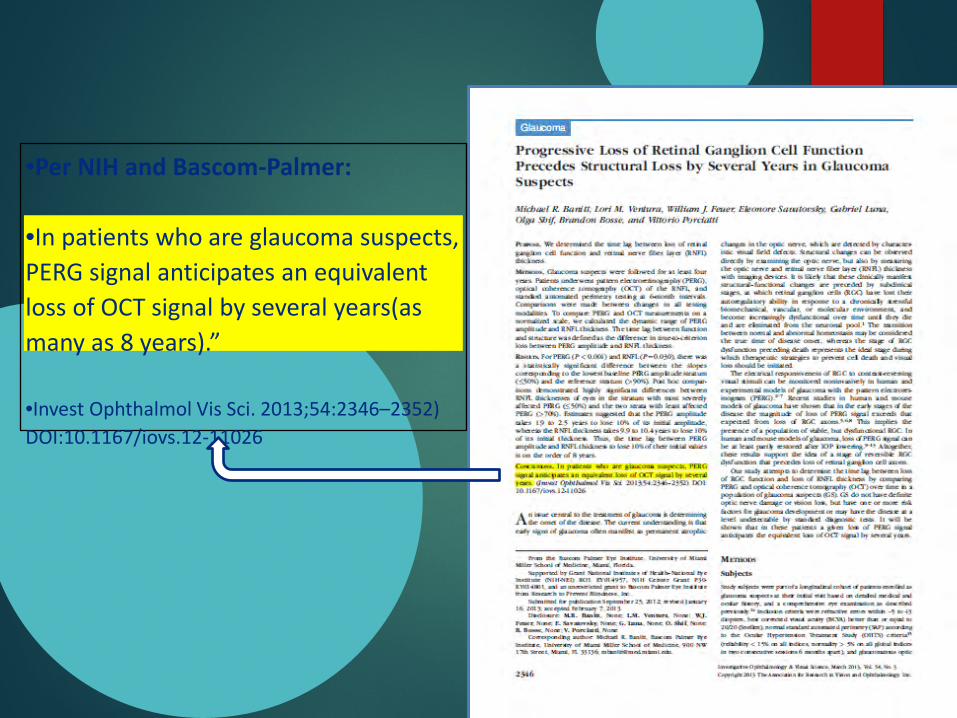
•Per NIH and Bascom-Palmer:
•In patients who are glaucoma suspects, PERG signal anticipates an equivalent loss of OCT signal by several years(as many as 8 years).”
•Invest Ophthalmol Vis Sci. 2013;54:2346–2352) DOI:10.1167/iovs.12-11026
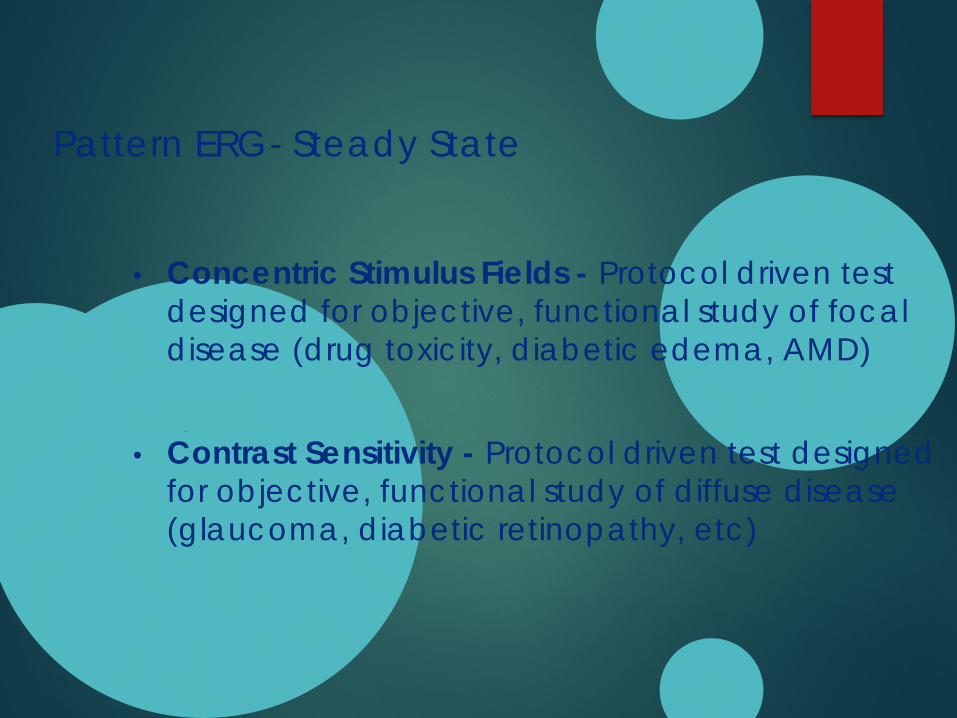
Pattern ERG- Steady State
• Concentric Stimulus Fields - Protocol driven test designed for objective, functional study of focal disease (drug toxicity, diabetic edema, AMD)
• Contrast Sensitivity - Protocol driven test designed for objective, functional study of diffuse disease (glaucoma, diabetic retinopathy, etc)
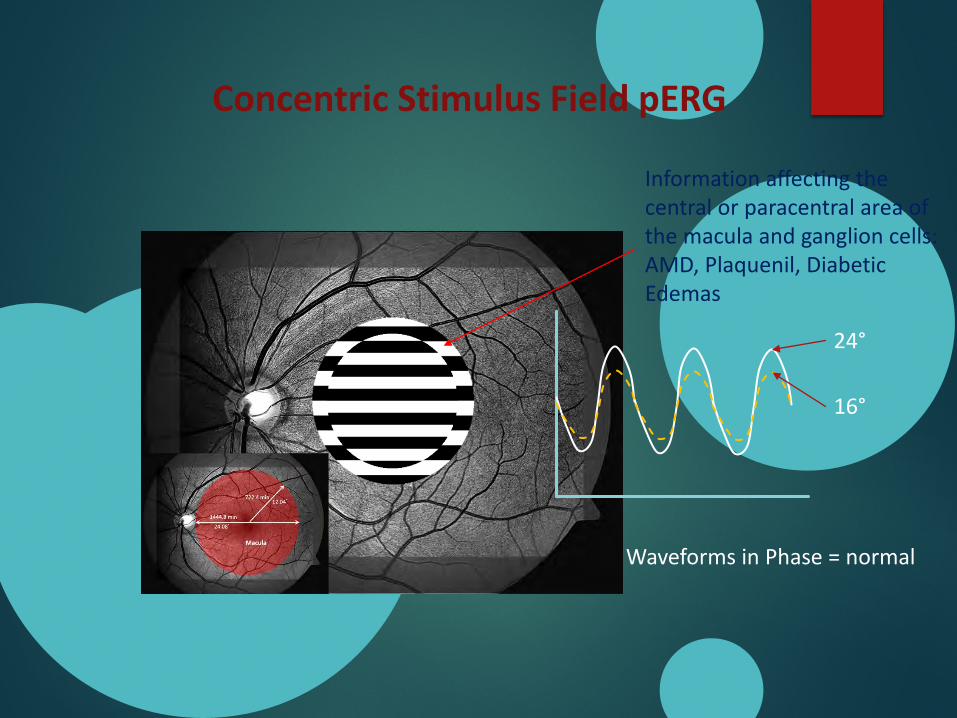
Concentric Stimulus Field pERG
24°
16°
Waveforms in Phase = normal
Information affecting the central or paracentral area of the macula and ganglion cells: AMD, Plaquenil, Diabetic Edemas
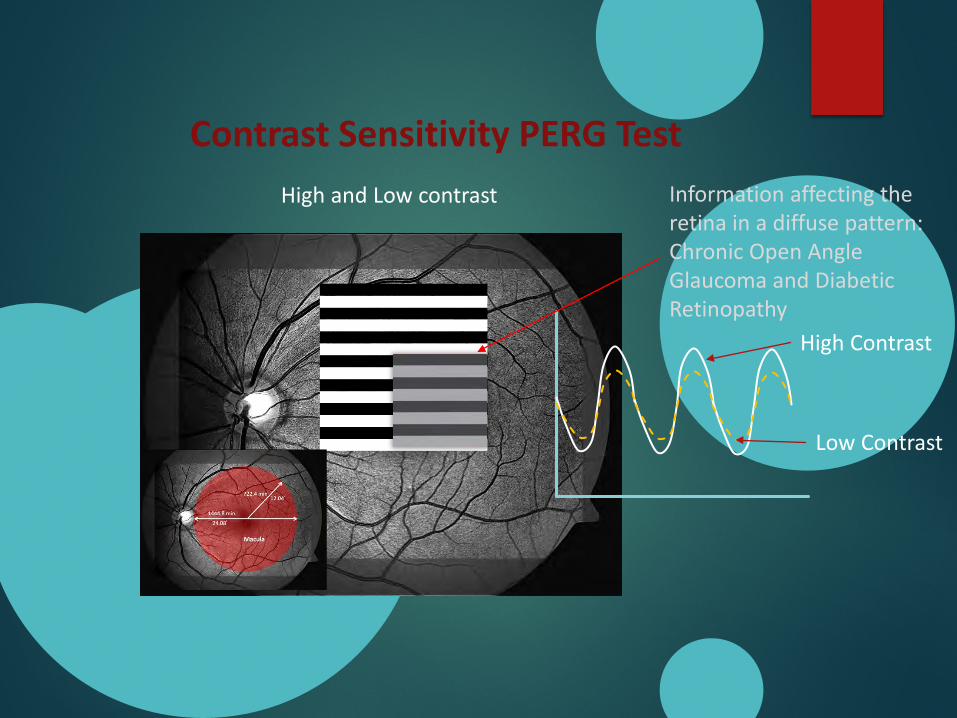
High and Low contrast
Contrast Sensitivity PERG Test
High Contrast
Low Contrast
Information affecting the retina in a diffuse pattern:Chronic Open Angle Glaucoma and Diabetic Retinopathy
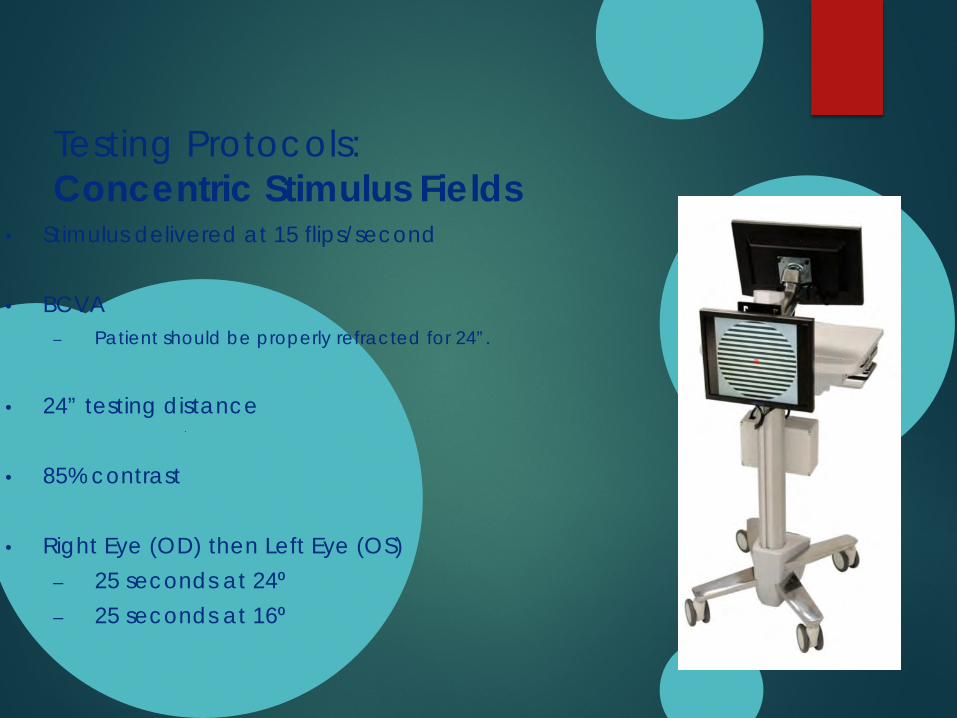
Testing Protocols: Concentric Stimulus Fields
• Stimulus delivered at 15 flips/second
• BCVA – Patient should be properly refracted for 24”.
• 24” testing distance
• 85% contrast
• Right Eye (OD) then Left Eye (OS)– 25 seconds at 24⁰– 25 seconds at 16⁰
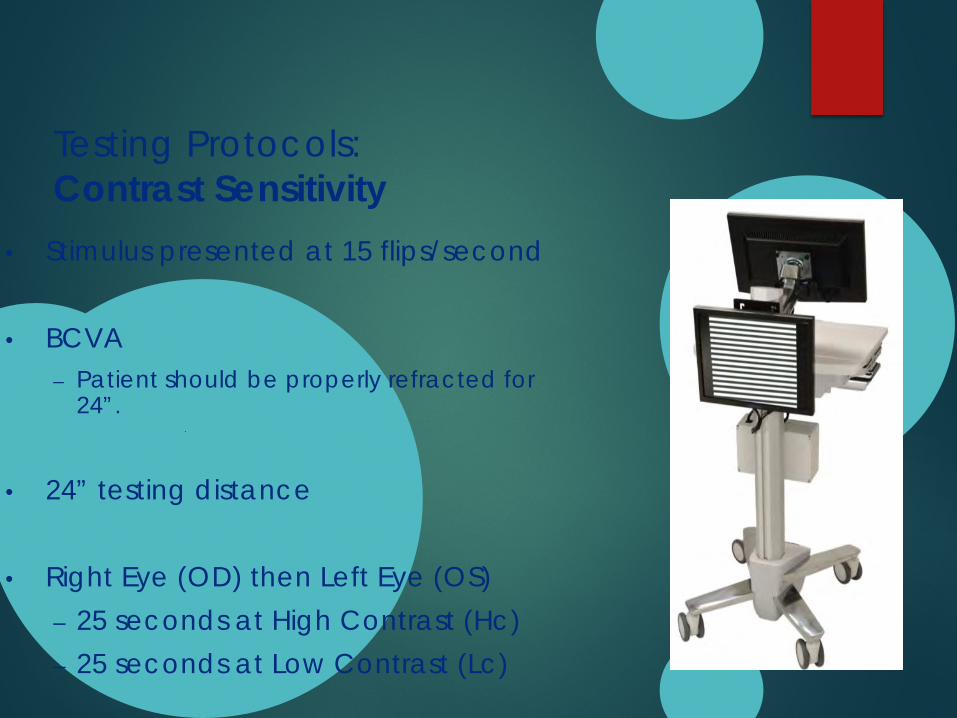
Testing Protocols: Contrast Sensitivity
• Stimulus presented at 15 flips/second
• BCVA – Patient should be properly refracted for
24”.
• 24” testing distance
• Right Eye (OD) then Left Eye (OS)– 25 seconds at High Contrast (Hc)– 25 seconds at Low Contrast (Lc)
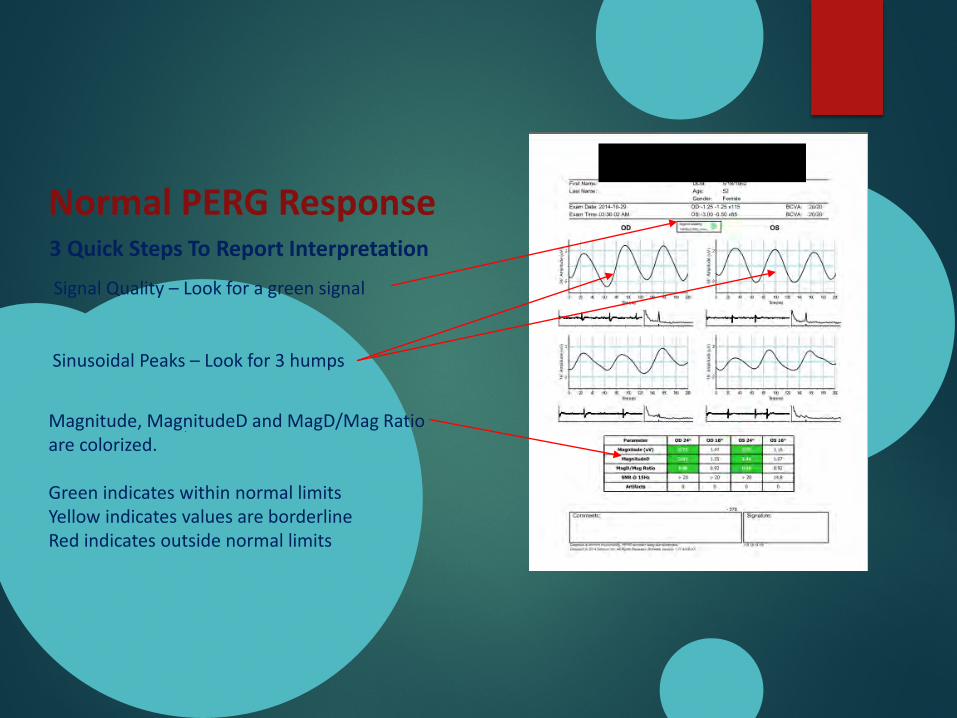
Normal PERG Response
Magnitude, MagnitudeD and MagD/Mag Ratio are colorized.
Green indicates within normal limits Yellow indicates values are borderlineRed indicates outside normal limits
3 Quick Steps To Report Interpretation
Signal Quality – Look for a green signal
Sinusoidal Peaks – Look for 3 humps
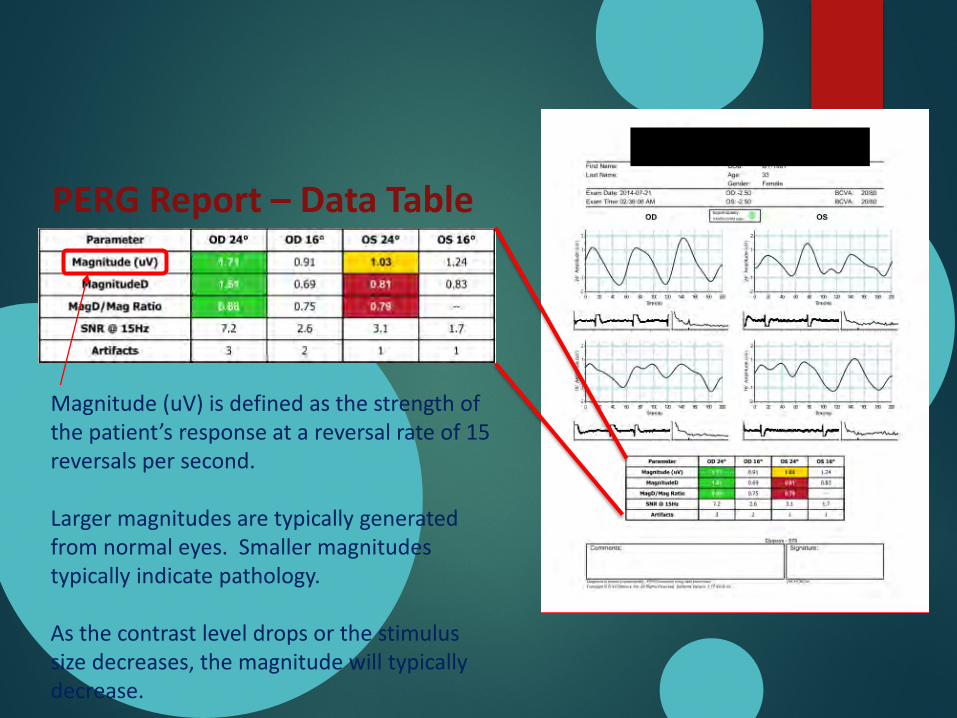
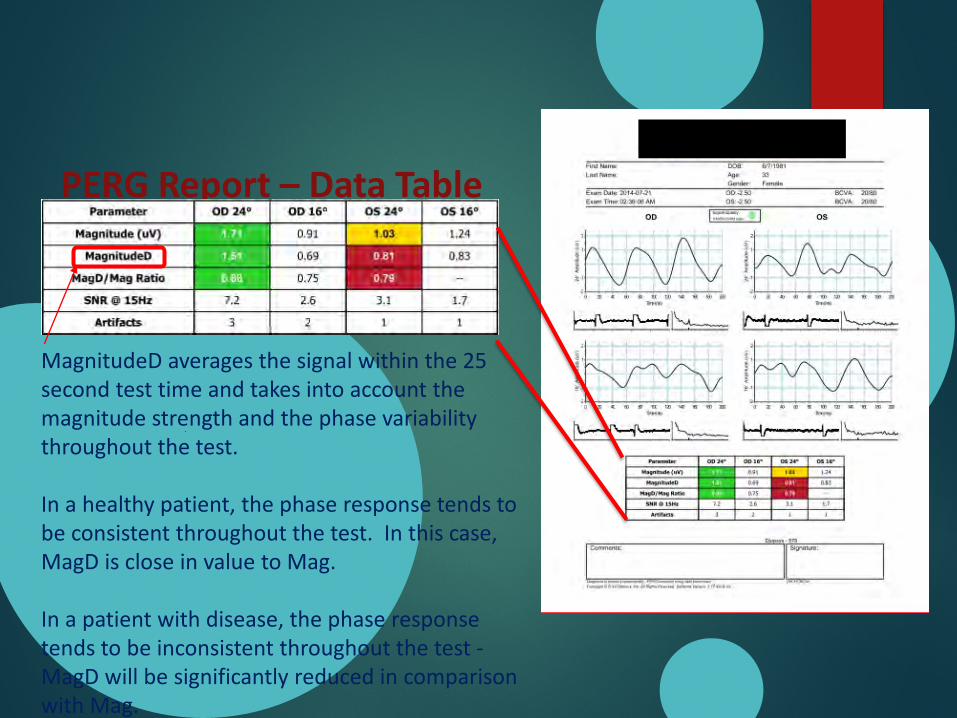
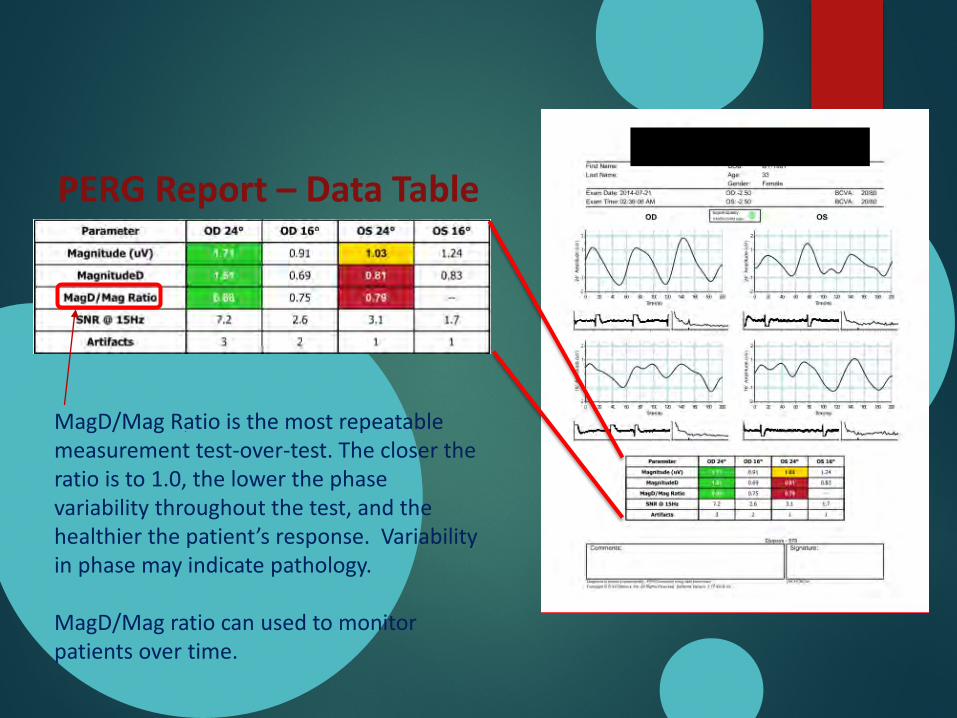
PERG Report – Data Table
Magnitude (uV) is defined as the strength of the patient’s response at a reversal rate of 15 reversals per second.
Larger magnitudes are typically generated from normal eyes. Smaller magnitudes typically indicate pathology.
As the contrast level drops or the stimulus size decreases, the magnitude will typically decrease.
PERG Report – Data Table
MagnitudeD averages the signal within the 25 second test time and takes into account the magnitude strength and the phase variability throughout the test.
In a healthy patient, the phase response tends to be consistent throughout the test. In this case, MagD is close in value to Mag.
In a patient with disease, the phase response tends to be inconsistent throughout the test -MagD will be significantly reduced in comparison with Mag.
PERG Report – Data Table
MagD/Mag Ratio is the most repeatable measurement test-over-test. The closer the ratio is to 1.0, the lower the phase variability throughout the test, and the healthier the patient’s response. Variability in phase may indicate pathology.
MagD/Mag ratio can used to monitor patients over time.
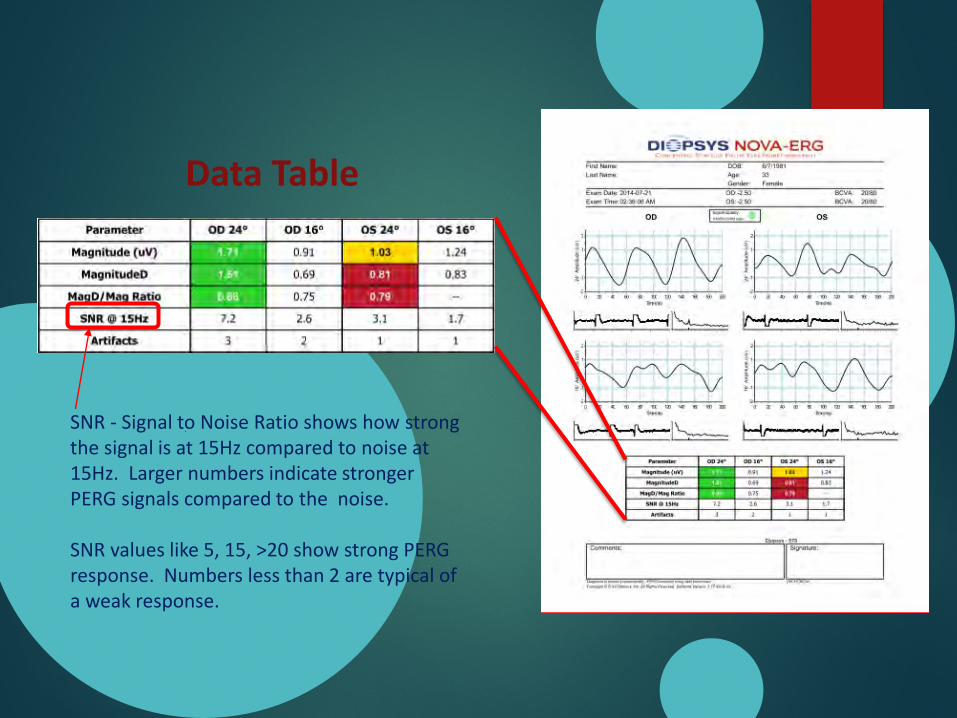
Data Table
SNR - Signal to Noise Ratio shows how strong the signal is at 15Hz compared to noise at 15Hz. Larger numbers indicate stronger PERG signals compared to the noise.
SNR values like 5, 15, >20 show strong PERG response. Numbers less than 2 are typical of a weak response.
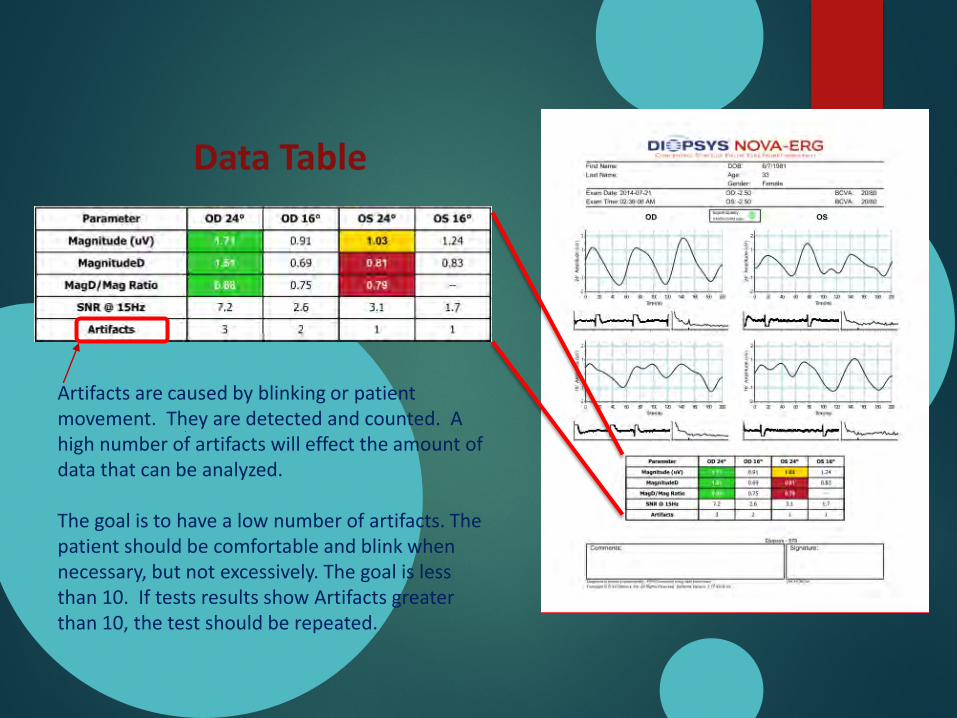
Data Table
Artifacts are caused by blinking or patient movement. They are detected and counted. A high number of artifacts will effect the amount of data that can be analyzed.
The goal is to have a low number of artifacts. The patient should be comfortable and blink when necessary, but not excessively. The goal is less than 10. If tests results show Artifacts greater than 10, the test should be repeated.
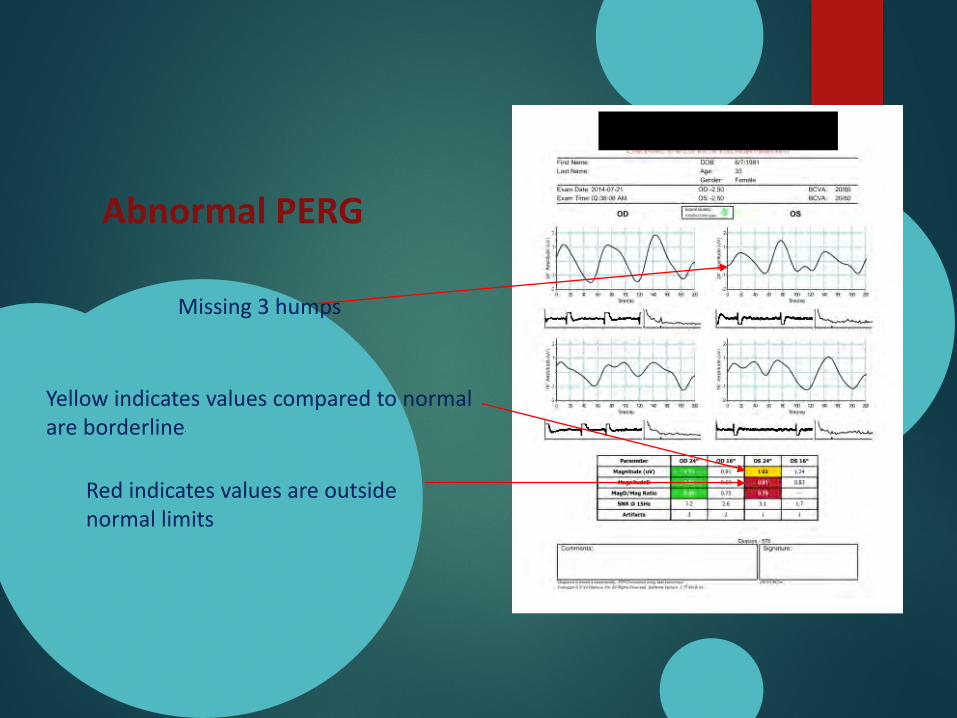
Abnormal PERG
Missing 3 humps
Yellow indicates values compared to normal are borderline
Red indicates values are outside normal limits
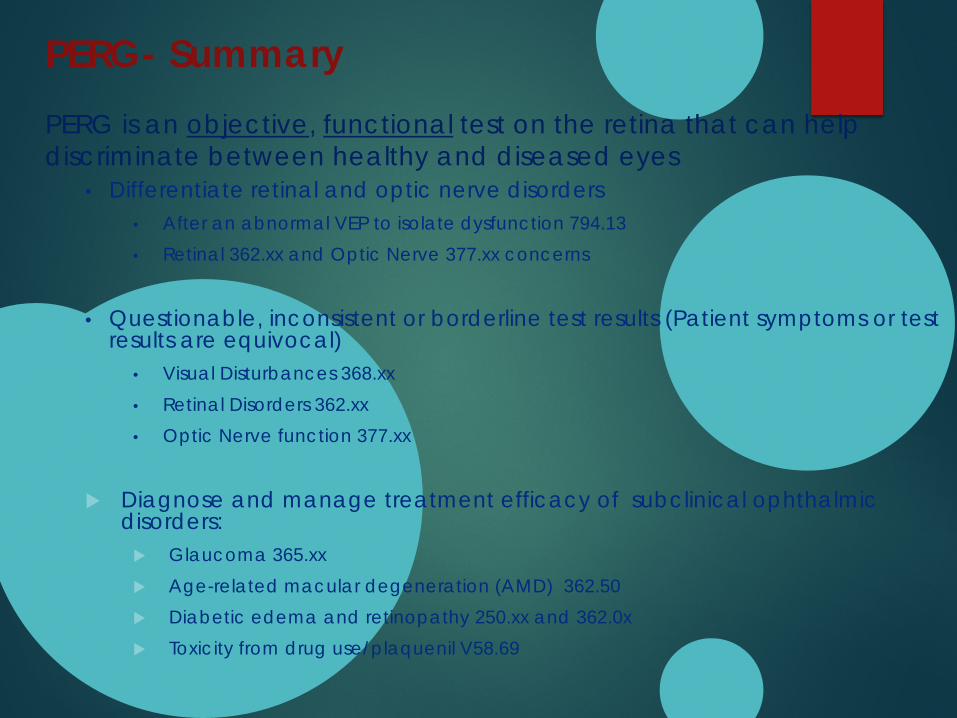
PERG- SummaryPERG is an objective, functional test on the retina that can help discriminate between healthy and diseased eyes
• Differentiate retinal and optic nerve disorders • After an abnormal VEP to isolate dysfunction 794.13• Retinal 362.xx and Optic Nerve 377.xx concerns
• Questionable, inconsistent or borderline test results (Patient symptoms or test results are equivocal)
• Visual Disturbances 368.xx• Retinal Disorders 362.xx• Optic Nerve function 377.xx
Diagnose and manage treatment efficacy of subclinical ophthalmic disorders: Glaucoma 365.xx Age-related macular degeneration (AMD) 362.50 Diabetic edema and retinopathy 250.xx and 362.0x Toxicity from drug use/plaquenil V58.69

The Case of the Missing Exam

The Case of the Missing Exam
WC a 33 year old Caucasian male was seen for a second opinion consultation regarding a diagnosis of advanced glaucoma in one eye.
History was negative for medical treatment in fact until the initial eye exam the patient had never seen a doctor since early high school.
Patient was asymptomatic other than distance blur which precipitated the original eye exam
Denies trauma, Fam Hx, medications Currently on TZ 1/0
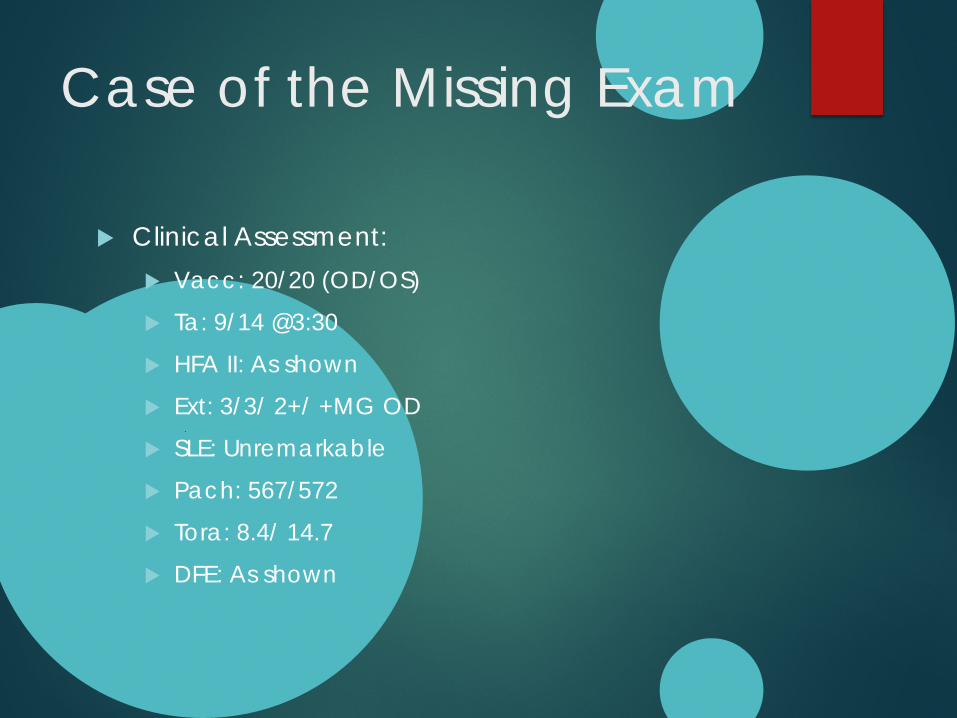
Case of the Missing Exam
Clinical Assessment: Vacc: 20/20 (OD/OS)
Ta: 9/14 @3:30
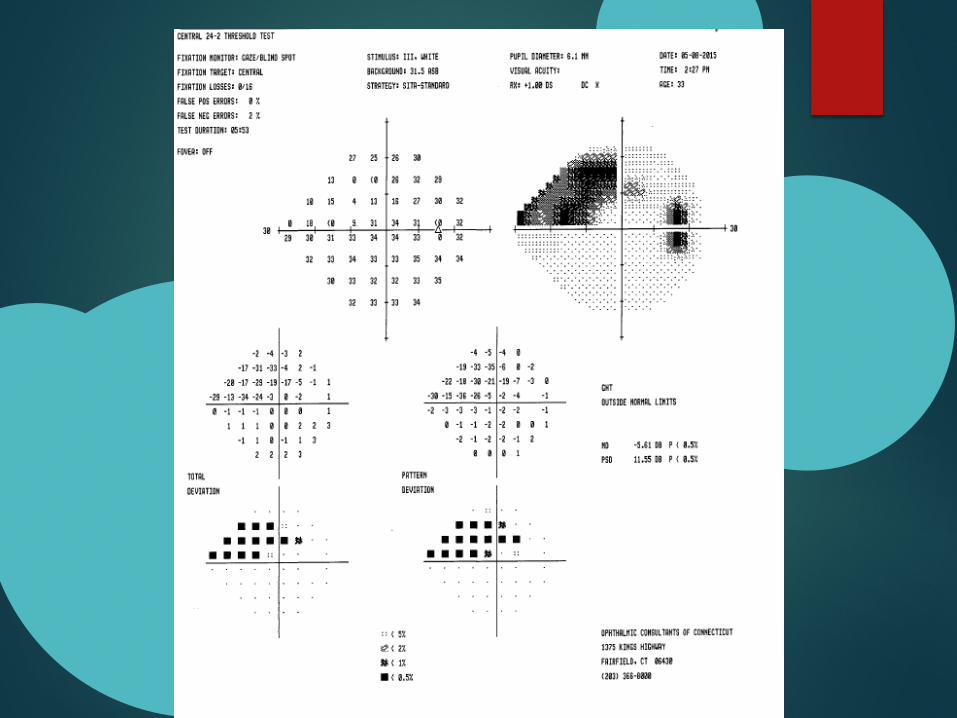
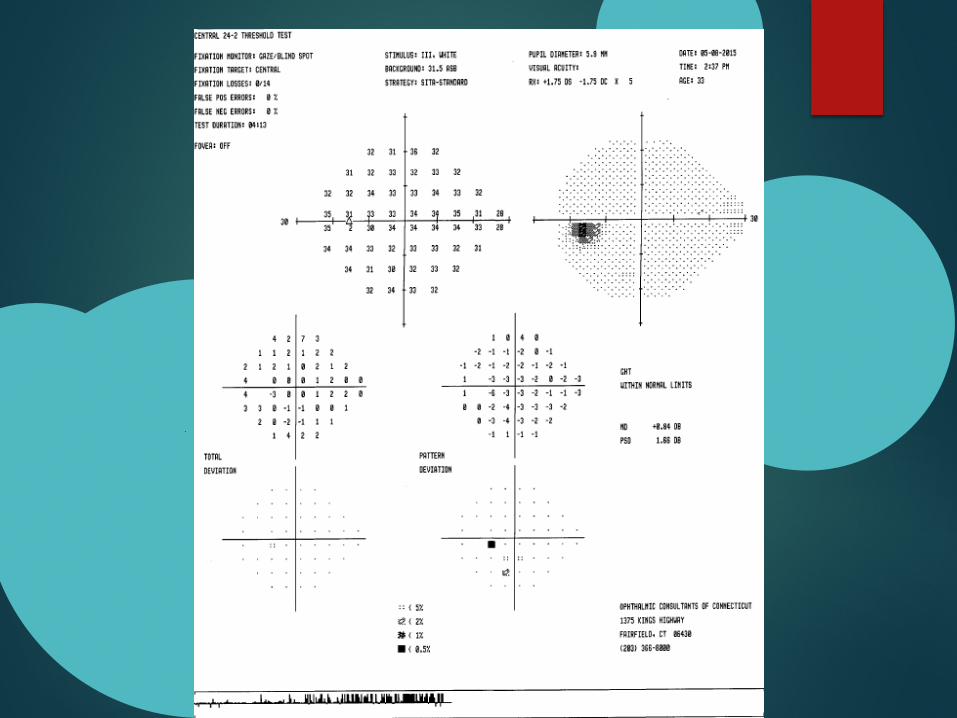
HFA II: As shown
Ext: 3/3/ 2+/ +MG OD
SLE: Unremarkable
Pach: 567/572
Tora: 8.4/ 14.7
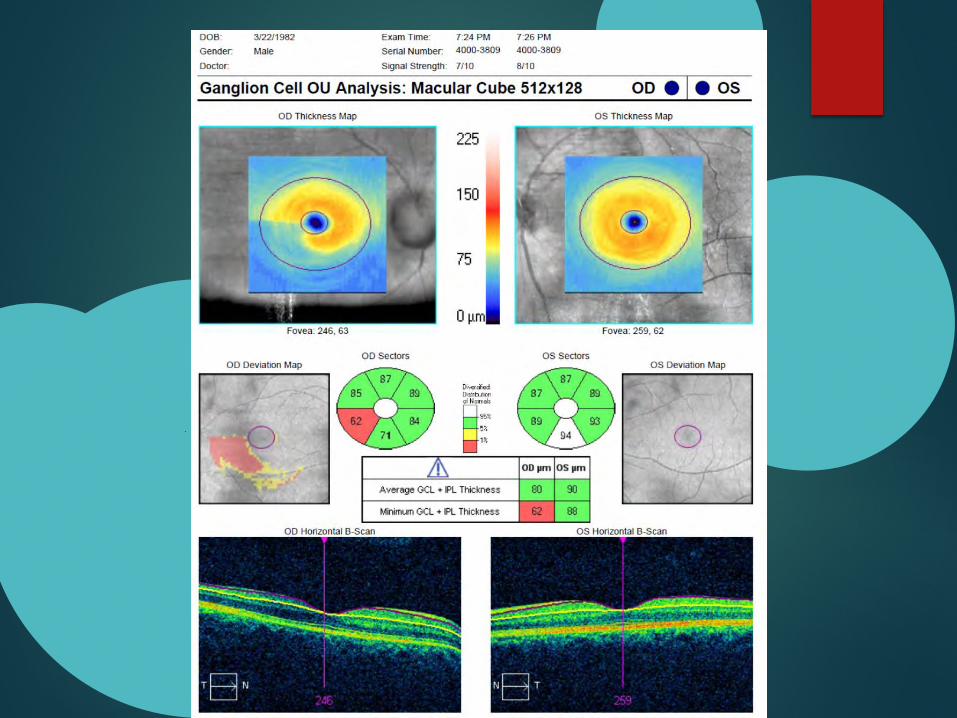
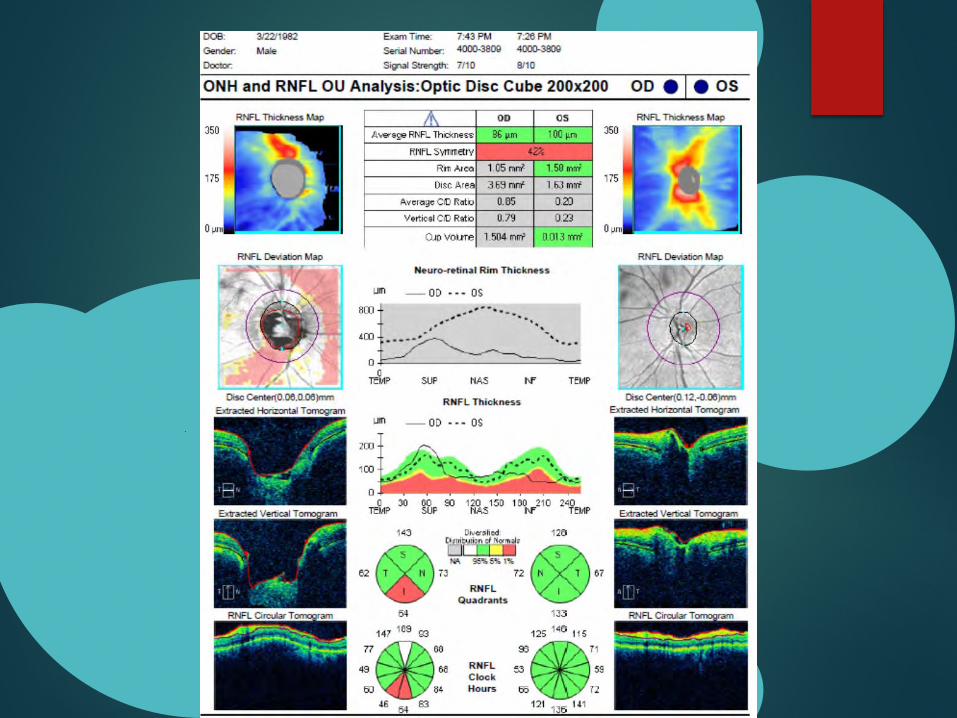
DFE: As shown
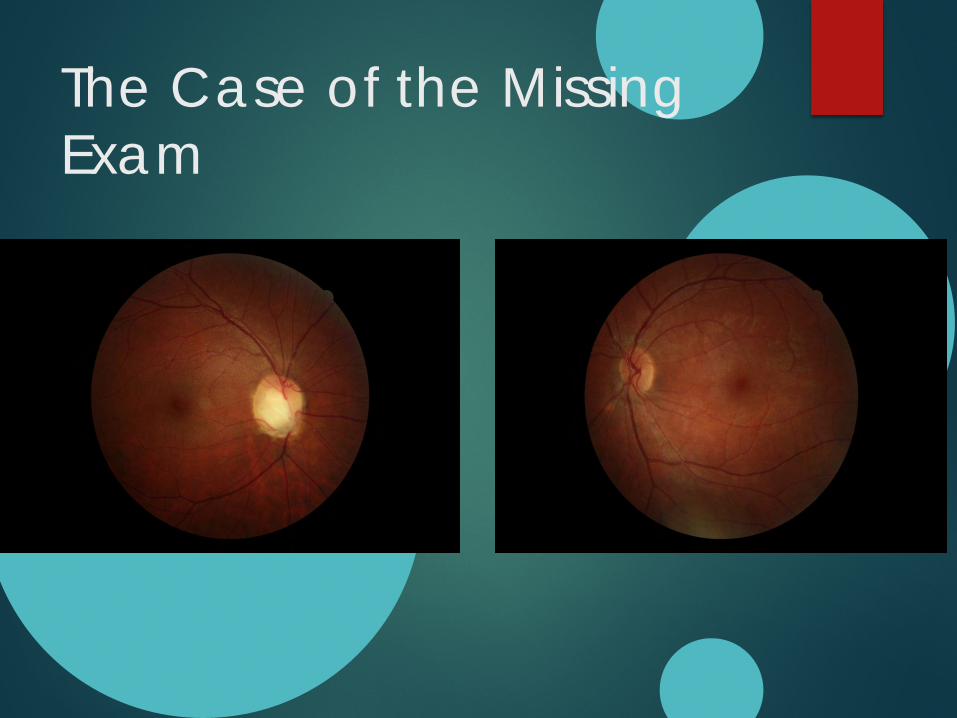
The Case of the Missing Exam
The Case of the Missing Exam
Clinical decision? What do you recommend?
Same drug?
Change drug?
No Tx!
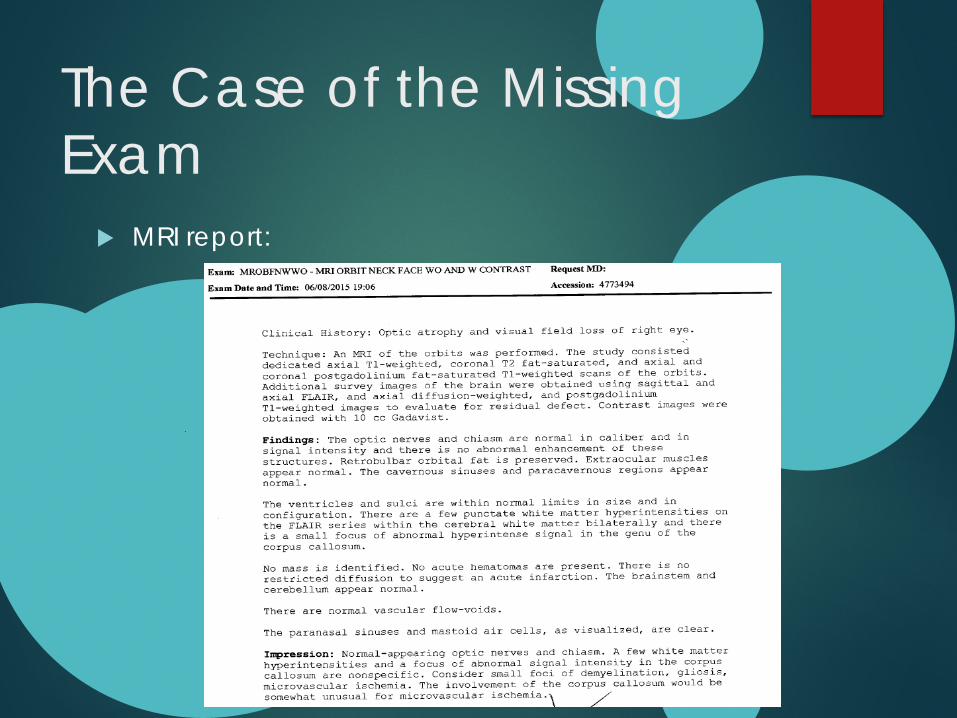
The Case of the Missing Exam
MRI report:
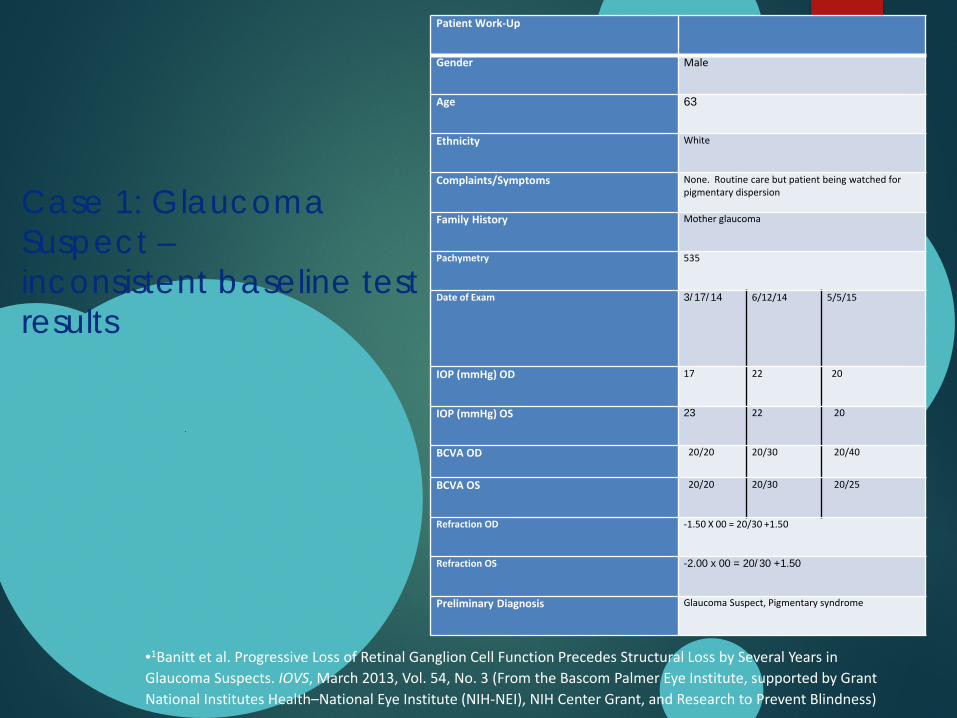
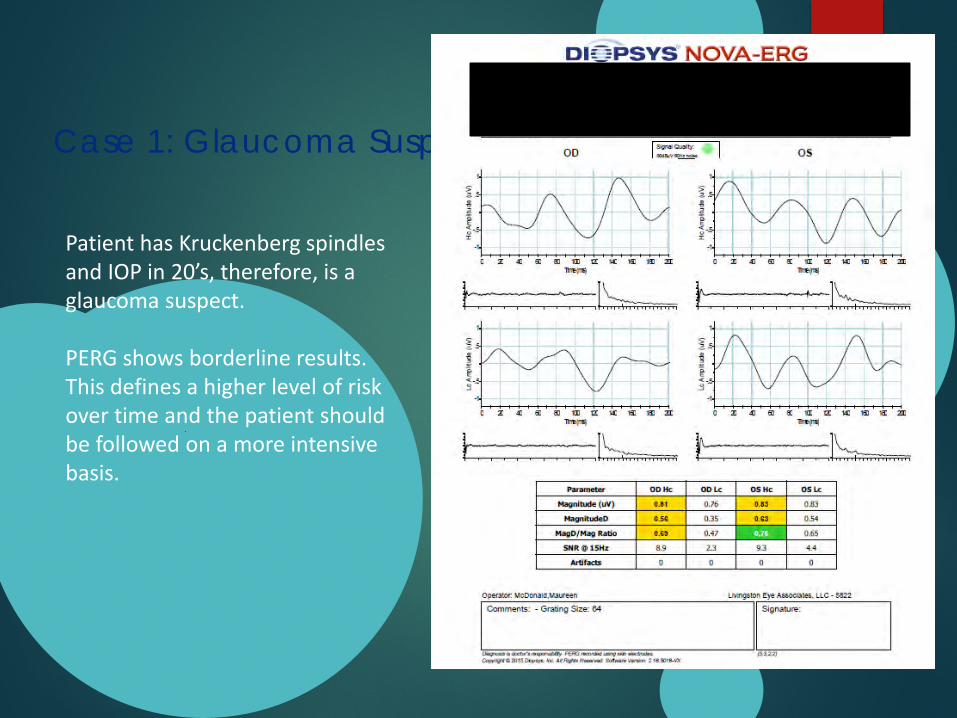
Case 1: Glaucoma Suspect –inconsistent baseline test results
•1Banitt et al. Progressive Loss of Retinal Ganglion Cell Function Precedes Structural Loss by Several Years in Glaucoma Suspects. IOVS, March 2013, Vol. 54, No. 3 (From the Bascom Palmer Eye Institute, supported by Grant National Institutes Health–National Eye Institute (NIH-NEI), NIH Center Grant, and Research to Prevent Blindness)
Patient Work-Up
Gender Male
Age 63
Ethnicity White
Complaints/Symptoms None. Routine care but patient being watched for pigmentary dispersion
Family History Mother glaucoma
Pachymetry 535
Date of Exam 3/17/14 6/12/14 5/5/15
IOP (mmHg) OD 17 22 20
IOP (mmHg) OS 23 22 20
BCVA OD 20/20 20/30 20/40
BCVA OS 20/20 20/30 20/25
Refraction OD -1.50 X 00 = 20/30 +1.50
Refraction OS -2.00 x 00 = 20/30 +1.50
Preliminary Diagnosis Glaucoma Suspect, Pigmentary syndrome
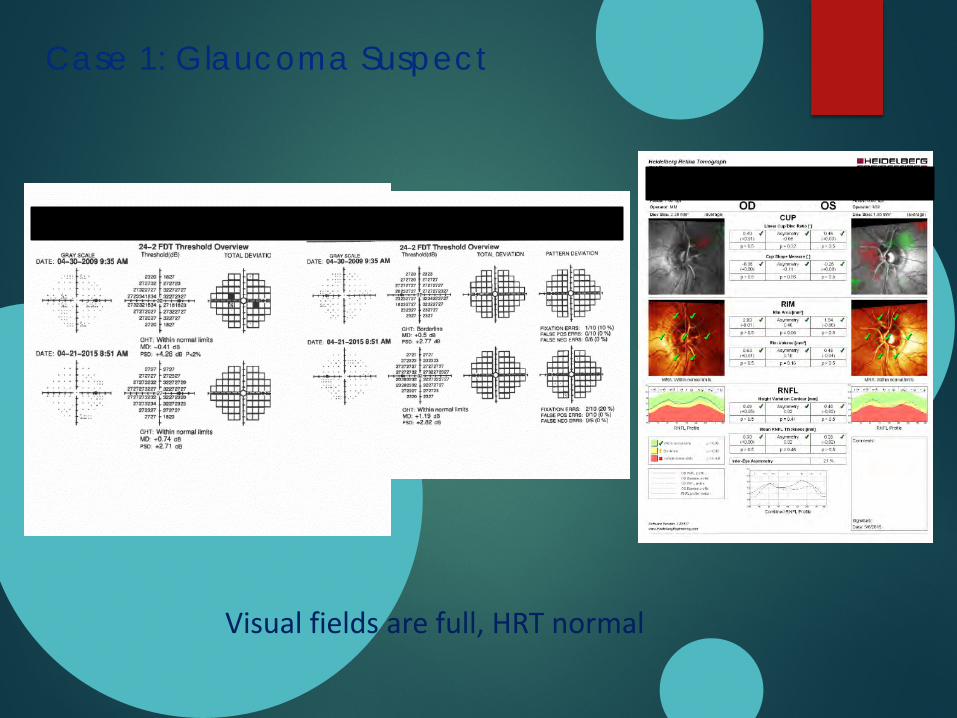
Case 1: Glaucoma Suspect
Visual fields are full, HRT normal
Case 1: Glaucoma Suspect
Patient has Kruckenberg spindles and IOP in 20’s, therefore, is a glaucoma suspect.
PERG shows borderline results. This defines a higher level of risk over time and the patient should be followed on a more intensive basis.
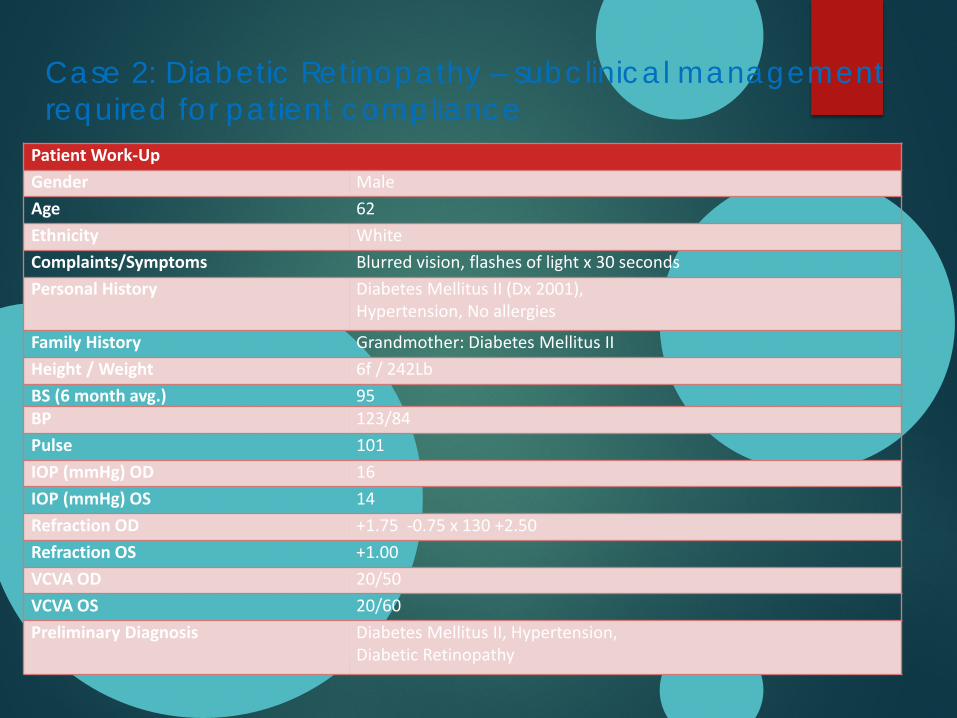
Case 2: Diabetic Retinopathy – subclinical management required for patient compliance
Patient Work-UpGender MaleAge 62Ethnicity WhiteComplaints/Symptoms Blurred vision, flashes of light x 30 secondsPersonal History Diabetes Mellitus II (Dx 2001),
Hypertension, No allergies
Family History Grandmother: Diabetes Mellitus IIHeight / Weight 6f / 242LbBS (6 month avg.) 95BP 123/84Pulse 101IOP (mmHg) OD 16IOP (mmHg) OS 14Refraction OD +1.75 -0.75 x 130 +2.50Refraction OS +1.00VCVA OD 20/50VCVA OS 20/60Preliminary Diagnosis Diabetes Mellitus II, Hypertension,
Diabetic Retinopathy
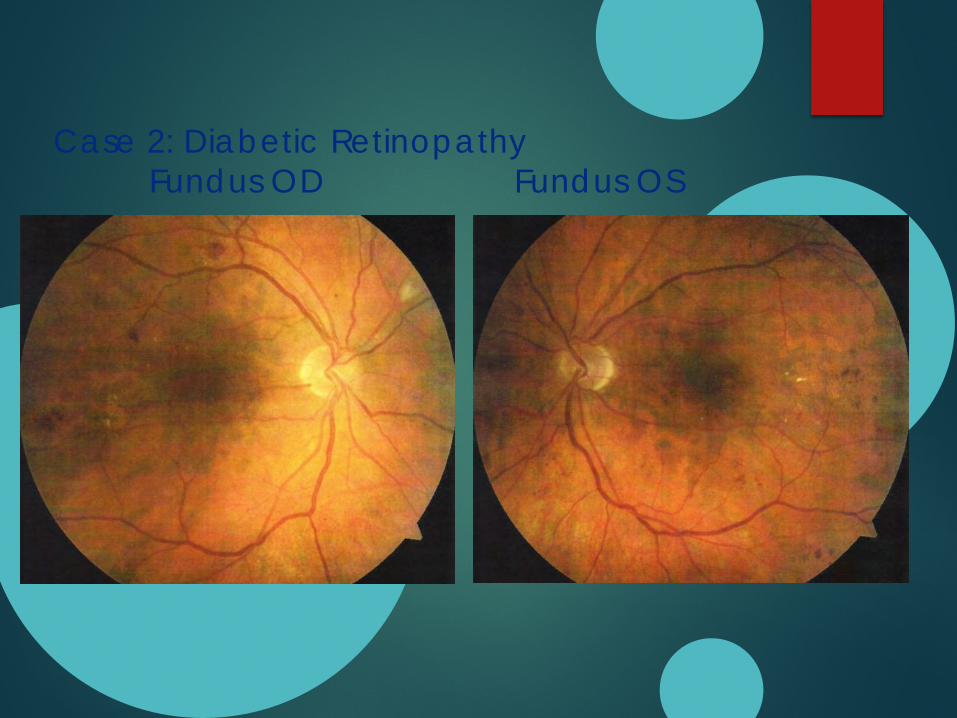
Case 2: Diabetic RetinopathyFundus OD Fundus OS
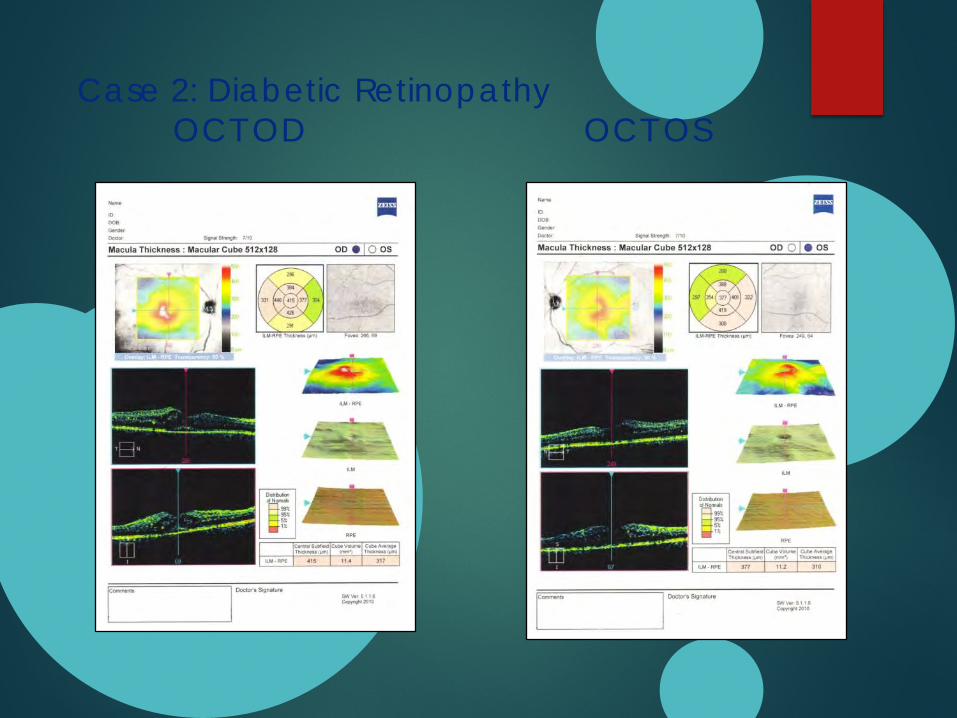
Case 2: Diabetic RetinopathyOCT OD OCT OS
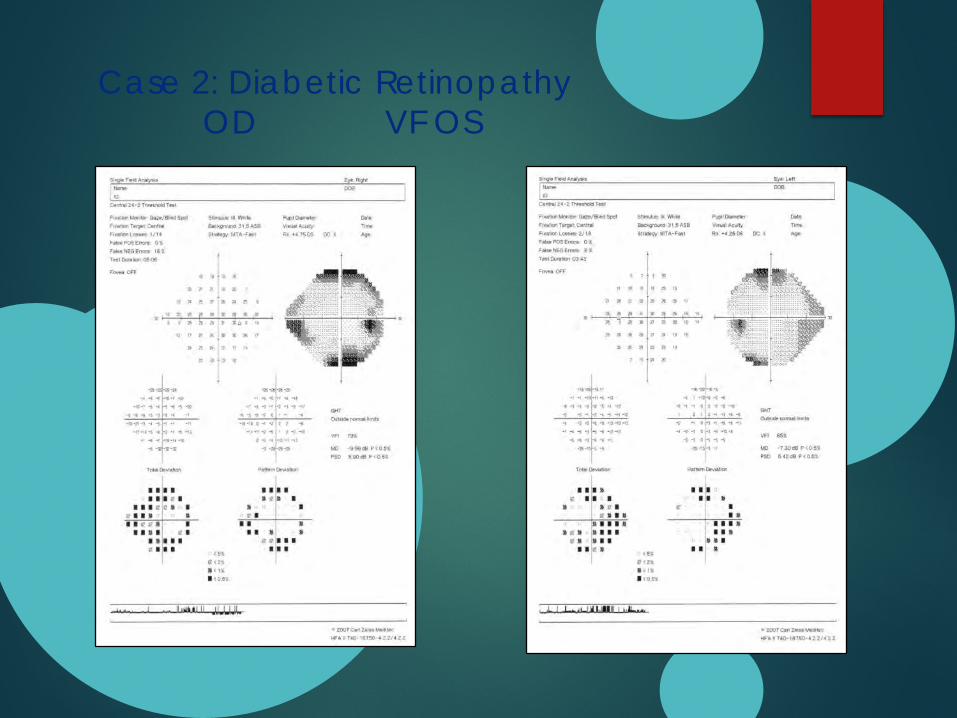
Case 2: Diabetic RetinopathyOD VF OS
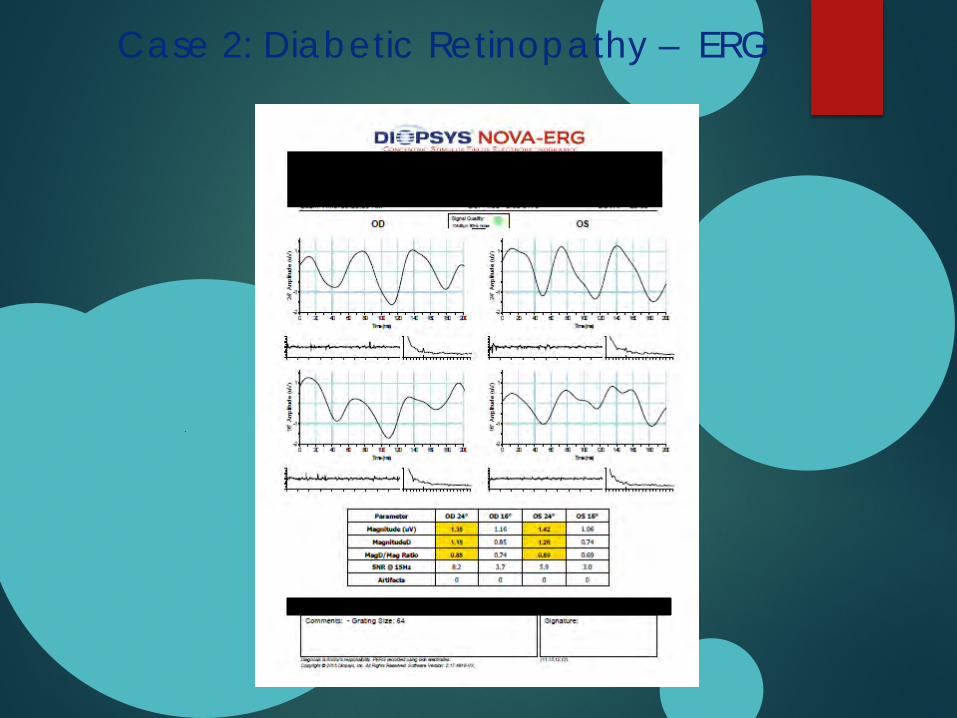
Case 2: Diabetic Retinopathy – ERG
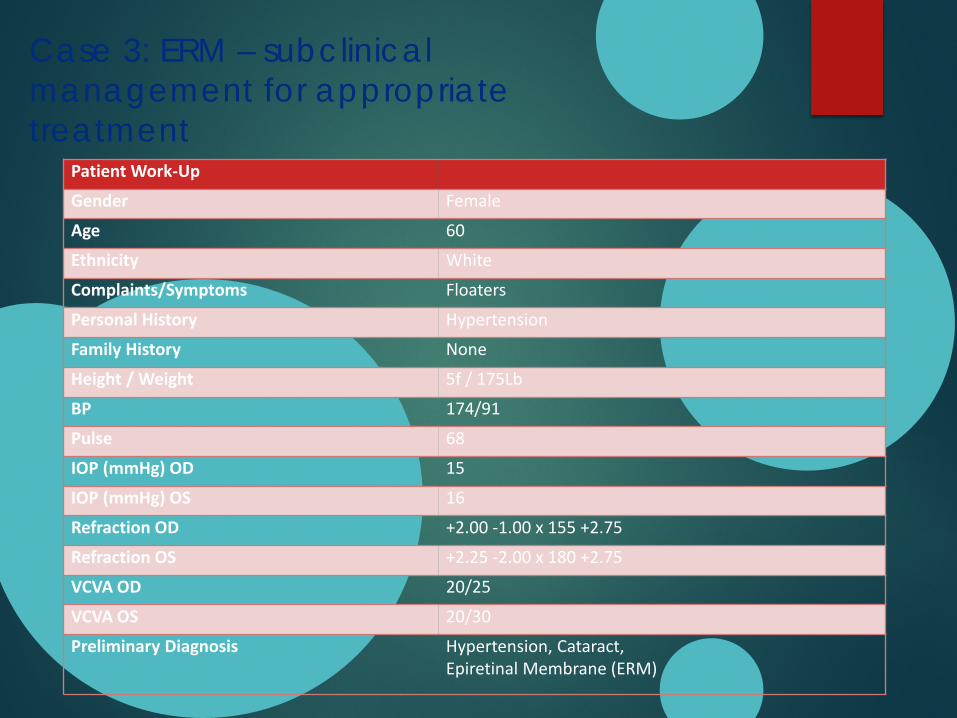
Case 3: ERM – subclinical management for appropriate treatment
Patient Work-Up
Gender Female
Age 60
Ethnicity White
Complaints/Symptoms Floaters
Personal History Hypertension
Family History None
Height / Weight 5f / 175Lb
BP 174/91
Pulse 68
IOP (mmHg) OD 15
IOP (mmHg) OS 16
Refraction OD +2.00 -1.00 x 155 +2.75
Refraction OS +2.25 -2.00 x 180 +2.75
VCVA OD 20/25
VCVA OS 20/30
Preliminary Diagnosis Hypertension, Cataract, Epiretinal Membrane (ERM)
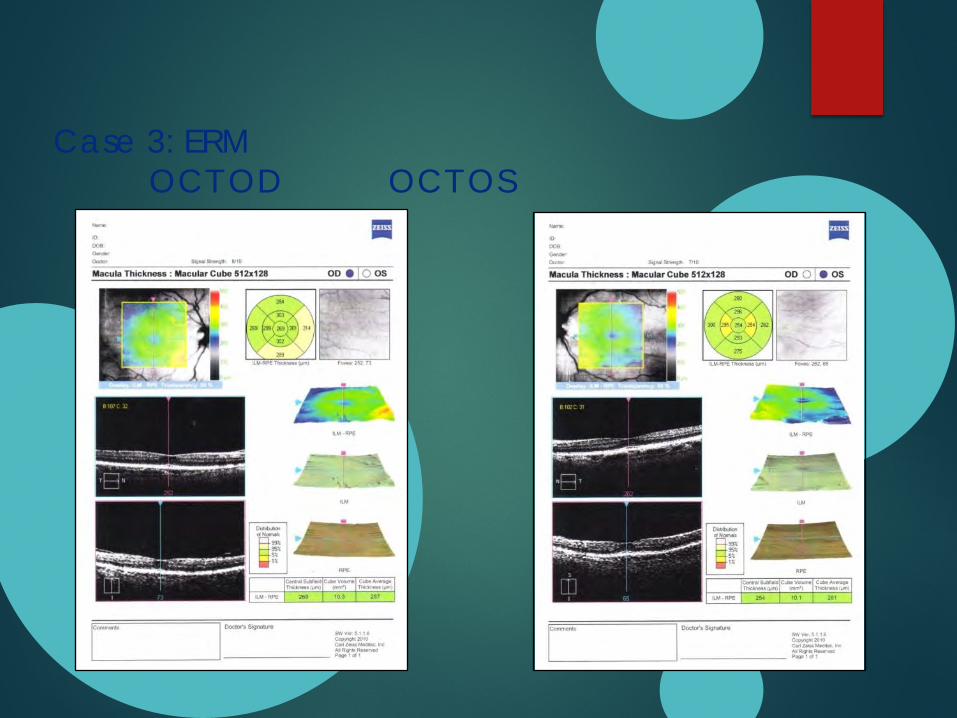
Case 3: ERM OCT OD OCT OS
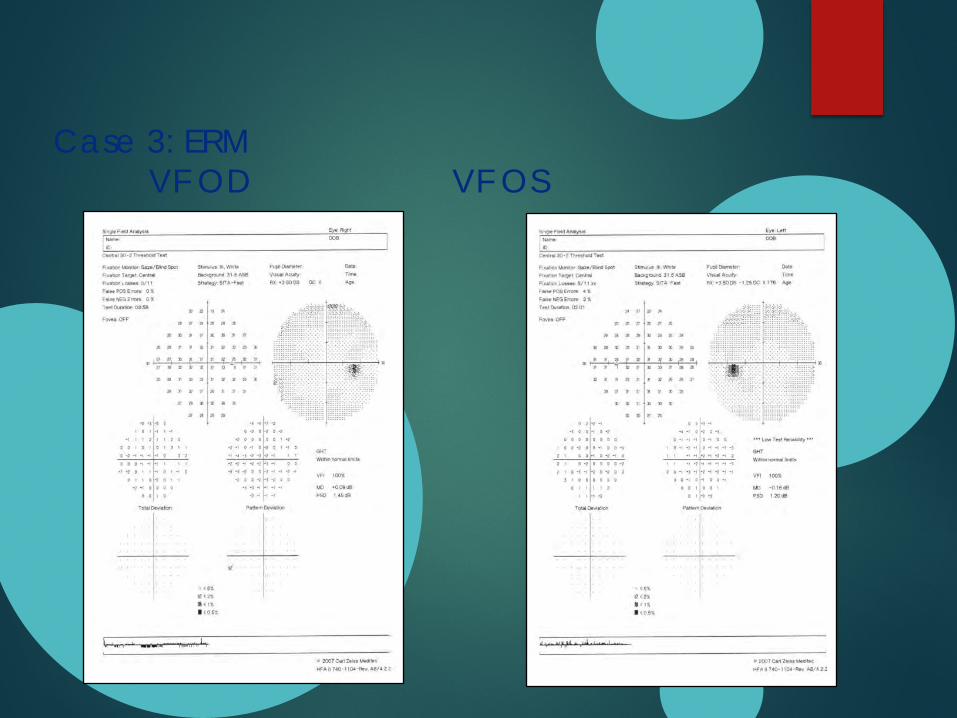
Case 3: ERMVF OD VF OS
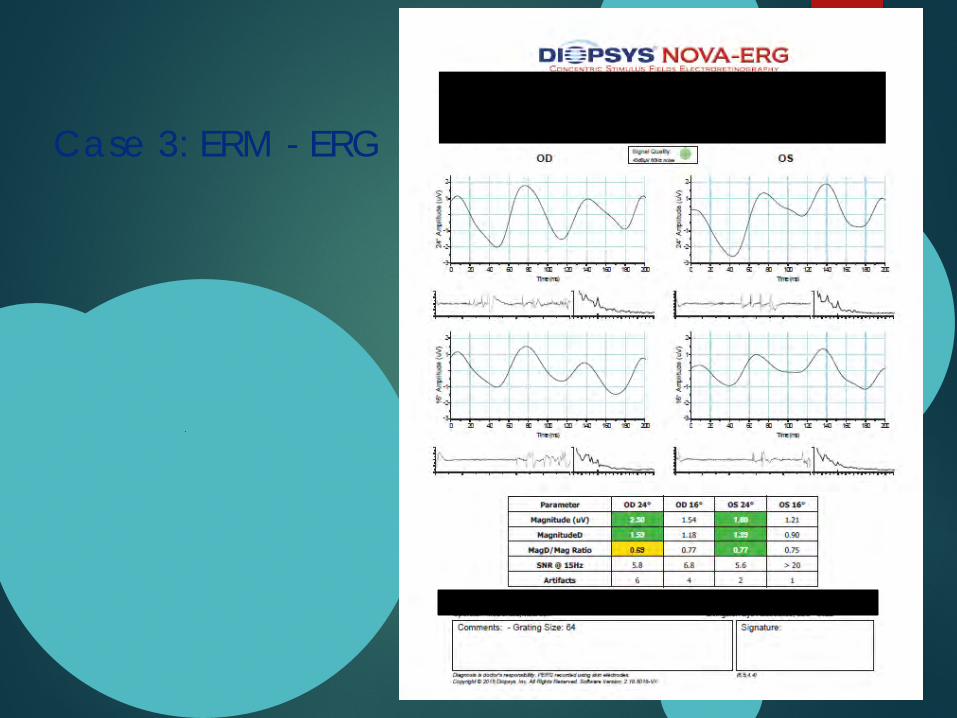
Case 3: ERM - ERG
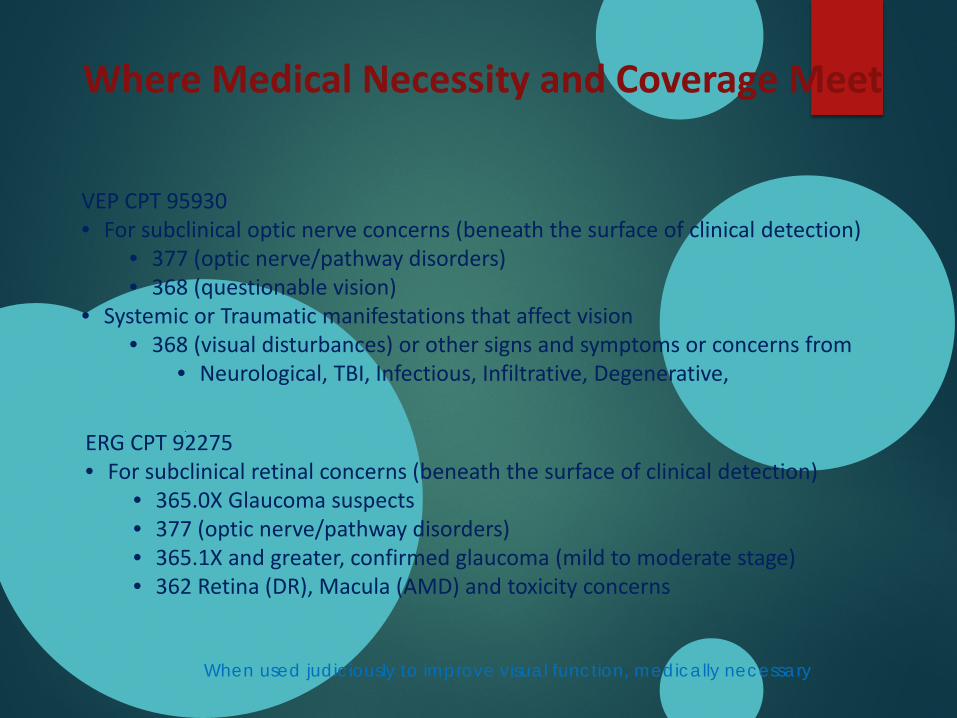
When used judiciously to improve visual function, medically necessary
Where Medical Necessity and Coverage Meet
VEP CPT 95930 • For subclinical optic nerve concerns (beneath the surface of clinical detection)
• 377 (optic nerve/pathway disorders) • 368 (questionable vision)
• Systemic or Traumatic manifestations that affect vision• 368 (visual disturbances) or other signs and symptoms or concerns from
• Neurological, TBI, Infectious, Infiltrative, Degenerative,
ERG CPT 92275 • For subclinical retinal concerns (beneath the surface of clinical detection)
• 365.0X Glaucoma suspects • 377 (optic nerve/pathway disorders) • 365.1X and greater, confirmed glaucoma (mild to moderate stage)• 362 Retina (DR), Macula (AMD) and toxicity concerns
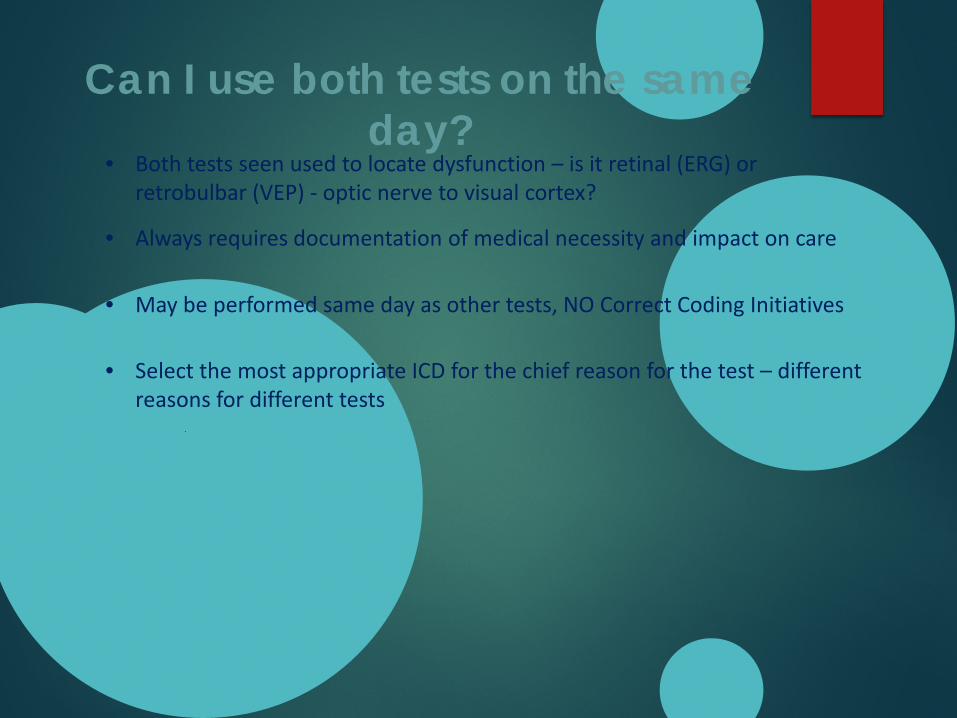
Can I use both tests on the same day?
• May be performed same day as other tests, NO Correct Coding Initiatives
• Select the most appropriate ICD for the chief reason for the test – different reasons for different tests
• Always requires documentation of medical necessity and impact on care
• Both tests seen used to locate dysfunction – is it retinal (ERG) or retrobulbar (VEP) - optic nerve to visual cortex?
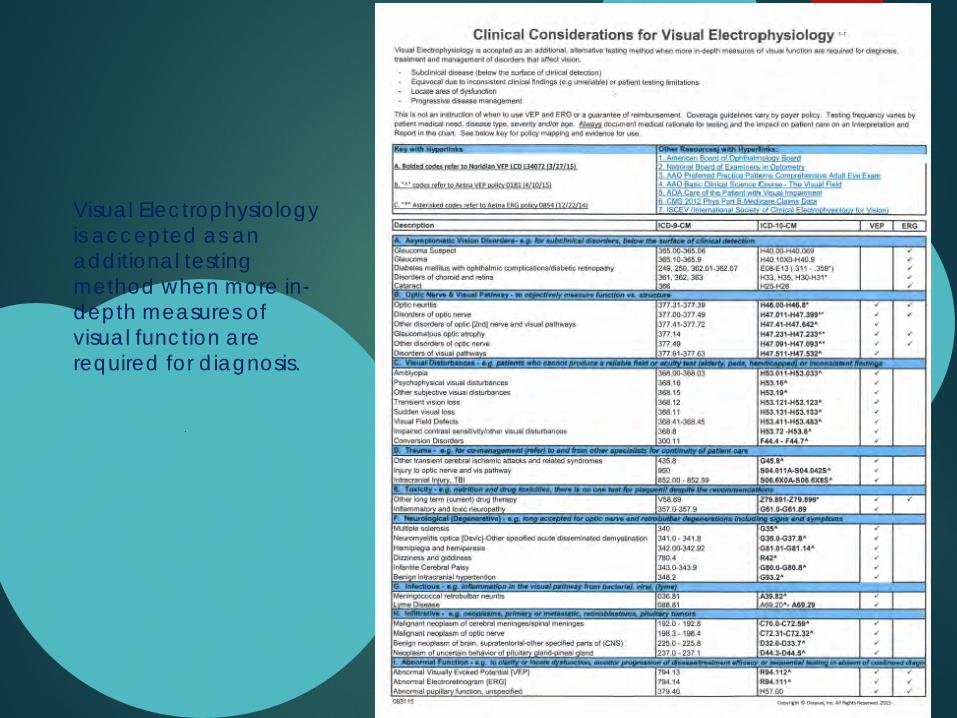
Visual Electrophysiology is accepted as an additional testing method when more in-depth measures of visual function are required for diagnosis.
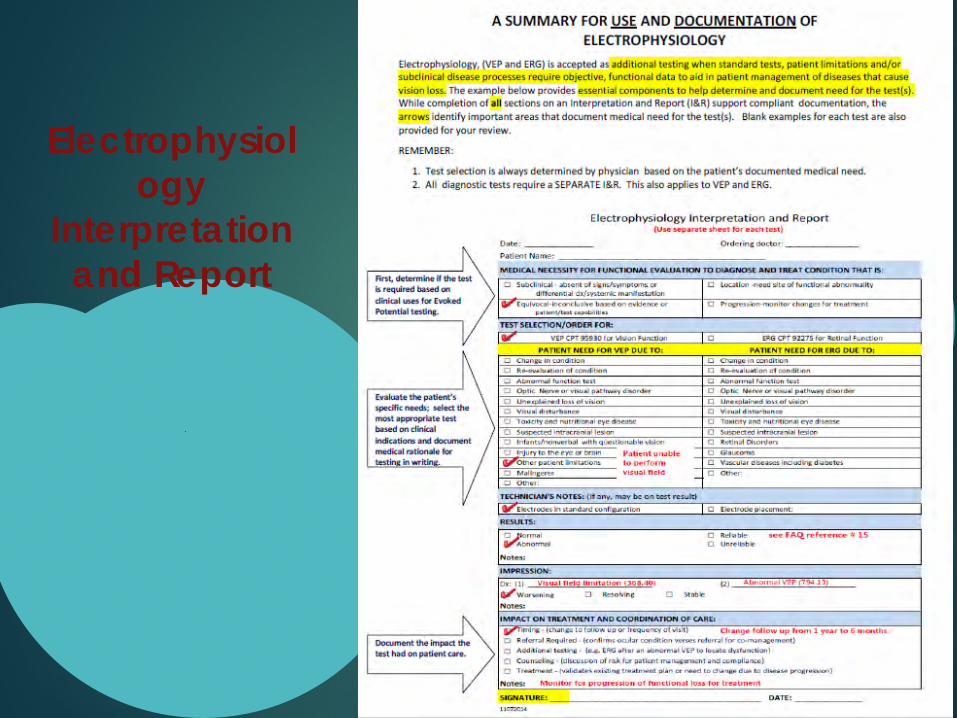
Electrophysiology
Interpretation and Report