Embed Size (px)
Citation preview
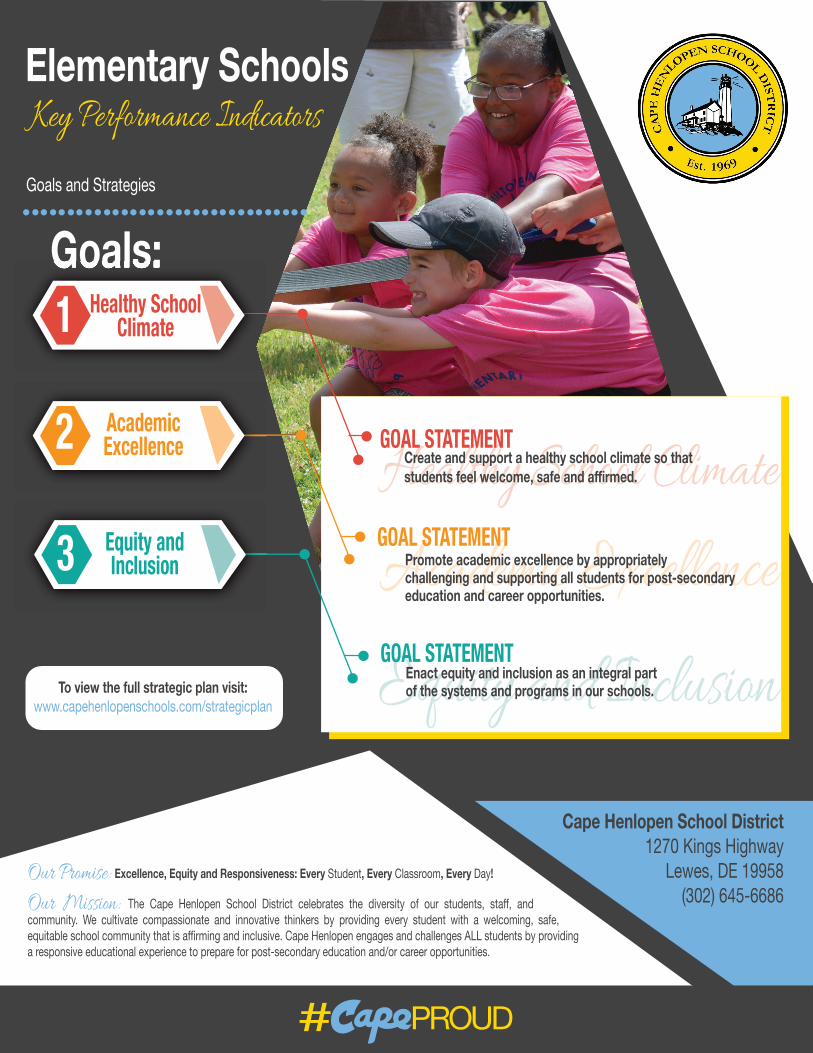
Elementary SchoolsKey Performance Indicators
Goals and Strategies
Goals:Goals:1
2
3
Cape Henlopen School District1270 Kings Highway
Lewes, DE 19958(302) 645-6686
To view the full strategic plan visit:www.capehenlopenschools.com/strategicplan
Our Promise: Excellence, Equity and Responsiveness: Every Student, Every Classroom, Every Day!
Our Mission: The Cape Henlopen School District celebrates the diversity of our students, staff, and community. We cultivate compassionate and innovative thinkers by providing every student with a welcoming, safe, equitable school community that is affirming and inclusive. Cape Henlopen engages and challenges ALL students by providing a responsive educational experience to prepare for post-secondary education and/or career opportunities.
# PROUD
Healthy SchoolClimate
AcademicExcellence
Equity andInclusion
Healthy School ClimateHealthy School ClimateAcademic ExcellenceAcademic ExcellenceEquity and Inclusion
GOAL STATEMENT
GOAL STATEMENT
GOAL STATEMENT
Create and support a healthy school climate so that students feel welcome, safe and affirmed.
Promote academic excellence by appropriately challenging and supporting all students for post-secondary education and career opportunities.
Enact equity and inclusion as an integral partof the systems and programs in our schools.
Elementary SchoolsKey Performance IndicatorsElementary SchoolsKey Performance Indicators
•••••••••••••••••••••••••••••••••••••••••••••••••••••••••••••••••••••••••••••••••••••••••••••••••••••••••••••
1 HEALTHY SCHOOL CLIMATE
Strategic Objectives:
1A. Ensure school safety.
Indicator: Percentage of students, staff, and parents who feel they/their child’s school is safe.
Baseline: Students: 95.5% | Teachers: 95.8%| Parents 97.6%
Monitoring Tool: PBS Climate Survey
1B. Build mutually respectful relationships in order to increase engagement and to decrease the need for
conflict resolution through restorative practices.
Indicator: The rate of restorative resolutions to conflict or incidents
Baseline: 48%
Monitoring Tool: Discipline and Disproportionality Analysis
1C. Create trauma responsive schools and classrooms.
Indicator: Percentage of students reporting sufficient social emotional support at school.
Baseline: 96.9%
Monitoring Tool: PBS Climate Survey
1D. Implement programs that support making healthy choices.
Indicator: Percentage of parents, students, and staff indicating that the district/schools support healthy choices.
Baseline: New health curriculum - Health Smart, healthy food policy, fruits and veggies program two days a week.
Monitoring Tool: PBS Climate Survey
2 ACADEMIC EXCELLENCE
Strategic Objectives:
2A. Monitor and support implementation of standards-based curriculum, instruction and assessment
with fidelity/integrity.
Indicator: Percentage of students demonstrating proficiency in ELA & Math (by group).
ELA Baseline: 3rd Grade: 62.6% | 4th Grade: 67.6% | 5th Grade: 68.2%
Math Baseline: 3rd Grade: 68% | 4th Grade: 63.8% | 5th Grade: 58.8%
Monitoring Tool: SBAC
2B. Use data and evidence to: 1) provide feedback to students about their learning, 2) guide decision-making
and planning for effective, responsive instruction, and 3) monitor progress toward achievement of goals.
Indicator: Percentage of students not meeting grade level standards who are receiving additional supports
through MTSS
Baseline: Anecdotal and meeting minutes available within individual schools.
Monitoring Tool: Schoolpace, Forefront, I-Tracker Intervention Data
2C. Engage secondary school students fully in their journey toward post-secondary education and/or career opportunities
Indicator: Graduation Rate, CTE Completer Rate
Indicators, Baseline, and Monitoring
: Percentage of students, staff, and parents who feel they/their child’s school is safe.

Elementary SchoolsElementary Schools
3 EQUITY AND INCLUSION
Strategic Objectives:
3A. Ensure access and equity for all demographic subgroups (ELL, students with special needs, ethnicity, SES,
and gender) in order to eliminate gaps.
Indicator: Percentage of students falling below proficiency standards at grade level who are receiving interventions
and supports within an MTSS framework (by student group).
Baseline: Anecdotal and meeting minutes available within individual schools
Monitoring Tool: SchoolPace, Forefront, I-Tracker Intervention Data, College Board Data, ACCESS Scores
Indicator: Percentage of students with at least one behavioral incident (by student group)
Baseline: All: ..46% | ELL: .02% | SPED: .01% | Male: 14% | Female: 1.89% | Non-White: 4.1%
Monitoring Tool: Discipline and Disproportion Analysis
Indicator: Percentage of students with restorative resolutions to a conflict or incident (by student group)
Baseline: All: 14.8% | ELL: 7.37% | SPED: 6.47% | Male: 5.7% | Female: 4.74% | Non-White: 6.7%
Monitoring Tool: Discipline and Disproportion Analysis
Indicator: In-school suspension rate (by student group)
Baseline: All: .29% | ELL: 0% | SPED: 1.3% | Male: .56% | Female: 0% | Non-White: .3%
Monitoring Tool: Discipline and Disproportion Analysis
Indicator: Out-of-school suspension rate (by student group)
Baseline: All: .24% | ELL: 0% | SPED: 1% | Male: .59% | Female: 0% | Non-White: 0%
Monitoring Tool: Discipline and Disproportion Analysis
3B. Ensure that all students have access and are included in their grade level standards in a setting that is
appropriate for their needs.
Indicator: Rate of special education and EL students in general education
Baseline: Students With Disabilities: 91.8% | EL: 99.96%
Monitoring Tool: Master Schedule
3C. Build an inclusive school climate that develops understanding and appreciation of diversity.
Indicator: Percentage of students, staff and parents who report that their schools understand and appreciate
diversityBaseline: Students: 88.83% | Teachers: 94.36% | Parents: 94.77%
Monitoring Tool: PBS Climate Survey
Excellence, Equity & Responsiveness: Every Student, Every Classroom, Every Day!
Key Performance IndicatorsIndicators, Baseline, and Monitoring