Embed Size (px)
Citation preview
Contents lists available at ScienceDirect
Developmental Cognitive Neuroscience
journal homepage: www.elsevier.com/locate/dcn
Elevated physiological arousal is associated with larger but more variableneural responses to small acoustic change in children during a passiveauditory attention task
S.V. Wass⁎, K. Daubney, J. Golan, F. Logan, E. Kushnerenko⁎
University of East London, Water Lane, London, E15 4LZ, UK
A R T I C L E I N F O
Keywords:Auditory attentionIntra-individual variabilityPhysiological stress
A B S T R A C T
Little is known of how autonomic arousal relates to neural responsiveness during auditory attention. We pre-sented N=21 5-7-year-old children with an oddball auditory mismatch paradigm, whilst concurrently mea-suring heart rate fluctuations. Children with higher mean autonomic arousal, as indexed by higher heart rate(HR) and decreased high-frequency (0.15-0.8 Hz) variability in HR, showed smaller amplitude N250 responses tofrequently presented (70%), 500 Hz standard tones. Follow-up analyses showed that the modal evoked responsewas in fact similar, but accompanied by more large and small amplitude responses and greater variability in peaklatency in the high HR group, causing lower averaged responses. Similar patterns were also observed whenexamining heart rate fluctuations within a testing session, in an analysis that controlled for between-participantdifferences in mean HR. In addition, we observed larger P150/P3a amplitudes in response to small acousticcontrasts (750 Hz tones) in the high HR group. Responses to large acoustic contrasts (bursts of white noise),however, evoked strong early P3a phase in all children and did not differ by high/low HR. Our findings suggestthat elevated physiological arousal may be associated with high variability in auditory ERP responses in youngchildren, along with increased responsiveness to small acoustic changes.
1. Introduction
The Autonomic Nervous System (ANS) is the neural substrate of thebody’s stress response (Cacioppo et al., 2000). It has two main com-ponents: the Sympathetic Nervous System (SNS), involved in quickresponse mobilising (‘fight or flight’) (Cacioppo et al., 2000), and theParasympathetic Nervous System, involved in slow-acting, response-dampening (‘rest or digest’) responses (Ulrich-Lai and Herman, 2009).Although the two interact largely in opposition, their function is non-additive (Janig and Habler, 2000; Lacey, 1967). One widely used per-ipheral index of ANS function is heart rate, which receives contribu-tions from both the SNS and PNS, with faster HR indexing greater SNSand less PNS activity (McCabe, 2000). In addition, ‘high-frequency’activity in the respiration range (e.g. 0.15-0.8 Hz) is thought to indexPNS activity (Bush et al., 2011). Although some researchers have dif-ferentiated ‘high-frequency’ from ‘low-frequency’ activity (< 0.15 Hz),treating the latter as an index of SNS activity (Berntson et al., 1997),more recent research has criticised this differentiation (Reyes del Pasoet al., 2013; Billman, 2013).
Research has shown that fluctuations in both long- (Richards, 1985)
and short-term (de Barbaro et al., 2016a; Wass et al., 2016) physiolo-gical arousal associate with fluctuations in visual attention (Arnsten,2009; Liston et al., 2009; Wass, 2018). Behaviourally, increased auto-nomic arousal (increased SNS and decreased PNS) associates with de-creased voluntary attention control and increased responsivity tosalient targets, whereas lower arousal is associated with increased vo-luntary (endogenous) attention control (Arnsten, 2009; Liston et al.,2009; Broadbent, 1971; Alexander et al., 2007). These findings havebeen observed from animal research (Usher et al., 1999) and recordingsof ANS function in adults (Holzman and Bridgett, 2017; Thayer et al.,2009), children and infants (Richards, 2010; Richards et al., 2011;Bacher and Robertson, 2001), including experimental manipulations ofstress (Liston et al., 2009).
Non-human primate research in this area has focused on the LocusCoeruleus (LC), a brainstem area implicated in ANS control (Usheret al., 1999; Sara and Bouret, 2012). At times of elevated physiologicalstress, tonic firing rates in the LC are increased (McCall et al., 2015).With higher tonic firing rates, phasic (stimulus-evoked) responses be-come more inconsistent (Usher et al., 1999; Aston-Jones and Cohen,2005). Neural gain, the degree to which neural signals are amplified or
https://doi.org/10.1016/j.dcn.2018.12.010Received 1 March 2018; Received in revised form 3 December 2018; Accepted 19 December 2018
⁎ Corresponding authors.E-mail addresses: [email protected] (S.V. Wass), [email protected] (E. Kushnerenko).
Developmental Cognitive Neuroscience xxx (xxxx) xxx–xxx
1878-9293/ © 2018 The Authors. Published by Elsevier Ltd. This is an open access article under the CC BY-NC-ND license (http://creativecommons.org/licenses/BY-NC-ND/4.0/).
Please cite this article as: Wass, S.V., Developmental Cognitive Neuroscience, https://doi.org/10.1016/j.dcn.2018.12.010
suppressed contingent on relevance, is lower during elevated arousal(Aston-Jones and Cohen, 2005). Atypical neural gain (Hauser et al.,2016) and hyper-tonic arousal (Sonuga-Barke et al., 2010; Imeraj et al.,2012) have both been hypothesised to be core deficits in ADHD. Phasic,stimulus-evoked activity in the LC has been associated with evokedbrain components such as the P3 (Murphy et al., 2011; Nieuwenhuiset al., 2005). However, no previous research, to our knowledge, hasexamined the relationship between arousal and variability in neuralevoked responses, in human participants (Wass, 2018).
Most previous research into physiological arousal and attention hasstudied attention in the visual domain. Relatively few studies haveexamined the relationship between physiological arousal and auditoryattention - despite that auditory attention is considered a key gatewayskill during language acquisition, for example (Choudhury andBenasich, 2011; Bishop, 2007). Understanding relationships betweenphysiological arousal and auditory attention may, for example, behelpful for recognising differences in auditory processing that havebeen noted as a function of socio-economic status (SES) (Stevens et al.,2015, 2009), and which have been implicated in understanding in-dividual differences in language learning capacity (Bishop, 2007;Tonnquist-Uhlen, 1996; Montgomery and Windsor, 2007). In-vestigating this was the aim of the present paper.
We used a version of an auditory oddball paradigm in which fre-quently presented 500 Hz tones were interspersed with two rare var-iants: 750 Hz tones and broadband white noise (Kushnerenko et al.,2002a, 2007). Typically, in response to frequently presented standards,two main components can be observed in children under the age of 10years: the P150 (P2), positive component, peaking at about100–200ms, and the N250 (N2), negative component peaking at about250–350ms or even later if merged with the subsequent N450 at fasterpresentation rates (Čeponien et al., 1998). The functional significanceof these obligatory components in children remains to be clarified.
In adults, the source of the P2 has been located by magnetoence-phalography (MEG) to the superior temporal gyri (Hariº et al., 1987). Inaddition, some results indicate that the P2 at least partially reflectsauditory driven output of the reticular activating system and conse-quently associated with the maintenance of behavioural arousal (Knightet al., 1980; Rif et al., 1991; Robinson, 1999). The P2 modulation inresponse to infrequent deviant in oddball paradigms was observed onlyin young children but not in adults ({Ruhnau, 2013 #3165, Ruhnauet al., 2010). The N2 elicited by frequent repetitive stimuli (‘basic’ N2;Näätänen and Picton, 1986) was reported mainly in children and oftendenominated N250 according to its latency (Čeponiené et al., 2001;Čeponien et al., 2002; Ceponien et al., 1998; Korpilahti and Lang,1994). In children, the N2 amplitude was found larger in response tocomplex rather than simple tones (Čeponiené et al., 2001). It is assumedto originate bilaterally in the auditory cortex of the superior temporallobes with frontal predominance (Čeponien et al., 2002; Gomot et al.,2000). There are several studies reporting smaller N250 amplitudes inchildren born prematurely (Fellman et al., 2004; Gomot et al., 2007), ininfants with craniofacial anomalies associated with a risk for a devel-opmental delay (Ceponien et al., 1998; Balan et al., 2002), and inlanguage-impaired (Tonnquist-Uhlen, 1996), and dysphasic children(Korpilahti and Lang, 1994).
In addition the rare, or ‘oddball’ stimuli allowed us to investigateauditory change detection to both small- and large-spectral changes(Kushnerenko et al., 2013a). The response to larger spectral changes(noises or so called ‘novel’ sounds) is usually very consistent acrosssubjects, representing early negativity (N1/Mismatch Negativity/MMN), followed by a large positivity (P3a) and a late negativity (LN)commencing at about 400ms (Wetzel and Schröger, 2014). The P3a isonly elicited when auditory change is large enough to trigger in-voluntary (bottom-up, saliency-driven) attention mechanisms and issometimes linked to a behavioural distraction from the task and im-pairment in performance (Wetzel and Schröger, 2014).
The brain response to smaller acoustic changes (deviants) in
children, called the Mismatch response (MMR), can be characterized byeither negative (nMMR or Mismatch negativity, MMN (Näätänen et al.,1978) or positive (pMMR) components, usually seen as an increases inN250 or P150 amplitudes in response to deviants compared to stan-dards. Coexistence of positive and negative MMRs in children and in-fants presented a riddle for more than a decade for developmental re-searchers. Recently, however, there has been development inunderstanding these two components, presumably indexing differentfunctional characteristics (Kushnerenko et al., 2002a, 2007). It has beenproposed that the mismatch response associated with high attentionaldemands in the sound discrimination exhibits a positive polarity(pMMR) and is considered a less mature MMR response. The mismatchresponse associated with low attentional demands (more automatic)exhibits a negative polarity (i.e., MMN) and is considered the moremature MMR (Garcia-Sierra et al., 2016).
Both MMN and pMMR co-exist in the same age group (4–6 year oldpre-schoolers) with larger and easier deviants eliciting adult-likeMMNs, whereas smaller deviants elicit P-MMRs (Lee et al., 2012).Therefore, auditory change detection can occur with high or low at-tentional demands that are mediated by language experience (Garcia-Sierra et al., 2016; Rivera‐Gaxiola et al., 2005; Friedrich et al., 2009),discriminability of the stimuli (Lee et al., 2012; Cheng et al., 2015) andmaturational factors (Kushnerenko et al., 2002a; Morr et al., 2002;Maurer et al., 2003). There has been also been a discussion of whetherpMMR can represent an early phase of the P3a component elicited inresponse to attention-getting stimuli (Kushnerenko et al., 2002a, 2007).However, this still requires further investigation.
Our research participants were 5-7-year-old children. We predictedthat heightened levels of arousal would be associated with increaseddistractibility, potentially triggering attention mechanisms to a largerextent, in response to small acoustic changes. Therefore we predictedthat a more P3a-like response, manifesting as a higher amplitude P150component, would be observed in children with higher physiologicalarousal. Based on previous research (Aston-Jones and Cohen, 2005) wealso predicted that increased physiological arousal would result in morevariable trial-to-trial brain responses to the same stimulus.
2. Method
Participants: 39 participants were originally tested for the study.Their mean (std) age on the day of testing was 73.6 (sd 12.2) months.Although detailed demographic data were not collected it should benoted that the recruitment area for this study, Stratford in East London,is a demographically mixed area of London. The nature of our studymeant that data from a number of participants were unavailable dueeither to technical problems with one of the recording streams, to in-sufficiently good quality data recording from one of the measures, or totechnical problems sending event codes between the two streams.Technical problems with the ECG recording systems led to the loss ofdata N=8 participants. Further technical problems led to problemswith sending event codes between with ECG and EEG recordingequipment (N= 7). Insufficiently good quality EEG data led to the lossof data from 8 participants. In total, ECG data were available for N=30participants; EEG data were available for N=34 participants; bothECG and EEG data were available from N=21. The age of participantswho contributed both usable ECG and EEG data was 71.9 (sd 11.9)months on the day of testing.
Equipment: EEG was recorded using a high-density 128-channelHydroCel Geodesic Sensor Net (HGSN) produced by EGI (EGI, Eugene,OR). The size of the HGSN was chosen based on the child’s head cir-cumference. The EEG signal was referenced to the vertex, recorded at a500 Hz sampling rate with band-pass filters set from 0.1 to 100 Hz usinga Kaiser Finite Impulse Response filter. Prior to recording the im-pedance of each electrode was manually checked to ensure that theywere below 100 kΩm.
ECG was recorded using a BioPac (Santa Barbara, CA) system
S.V. Wass et al. Developmental Cognitive Neuroscience xxx (xxxx) xxx–xxx
2
recording at 1000 Hz. Disposable Ag–Cl electrodes were used, placed ina modified lead II position. Stimuli were presented using E-Prime. Inorder to ensure accurate time-synchronisation between the EEG andECG recording systems, simultaneous event codes were sent con-currently from E-Prime via TTL pulses to the EEG and ECG recordingsystems during stimulus presentation.
Procedure: The experiment consisted of 4 blocks of 100 trials. Eachblock consisted of: 70 ‘standard’ 500 Hz tones; 15 ‘deviant’ 750 Hztones; 15 ‘noise’ (white-noise segments). The harmonic tones of 500 and750 Hz fundamental frequency were constructed from the three lowestpartials, with the second and third partials having a lower intensitythan the first one by 3 and 6 dB, respectively. The harmonic tones wereused instead of sinusoids for two reasons. Firstly, because it has beenshown previously that complex tones result in larger N250 amplitudesin children then sinusoids (Čeponiené et al., 2001). Secondly, we aimedto use the same paradigm that was used in a number of longitudinal andcross-sectional studies in infants and children in order to increase ourunderstanding of the observed previously effects (Kushnerenko et al.,2007). The duration of the sounds was 100ms, including 5-ms rise and5-ms fall times. The interstimulus (offset-to-onset) interval was 700ms.The order in which the trials were presented was pseudo-randomised inorder to ensure that two deviant and noise trials were always separatedby at least two standard trials. In between blocks, 60-second videoswere presented of actors reciting nursery rhymes to the camera, inorder to allow participants to rest and to minimise the cumulative effectof fatigue over consecutive blocks. The total paradigm, including pre-paration, recording, breaks and EEG cap removal, lasted approximatelyone hour per participant. The proposal was approved, prior to thecommencement of the study, by the University Research Ethics Com-mittee at the University of East London.
Data analysis: The vertex-referenced EEG was algebraically re-computed to an average reference. The signal was off-line low-passfiltered at 30 Hz using a Kaiser Finite Impulse Response filter and seg-mented into epochs starting 100ms before and ending 600ms after thestimulus onset. Channels contaminated by eye or motion artifacts wererejected manually, and trials with more than 20% bad channels wereexcluded. The average (std) [min-max] proportion of channels excludedper trial was 0.09 (0.12) [0.01-0.45] for standard trials; 0.09 (0.10)[0.01-0.37] for deviant trials; 0.06 (0.09) [0.001-0.32] for noise trials.The mean (range) (std) number of trials included was 248 (210–270)(19) for standard; 50 (42–56) (4) to deviant; 54 (48–60) (4) for noise.This number of accepted trials has proven to be sufficient for this typeof paradigm (Kushnerenko et al., 2013a; Guiraud et al., 2011; Dehaene-Lambertz and Dehaene, 1994; Friederici et al., 2007; Kushnerenkoet al., 2013b, 2008).
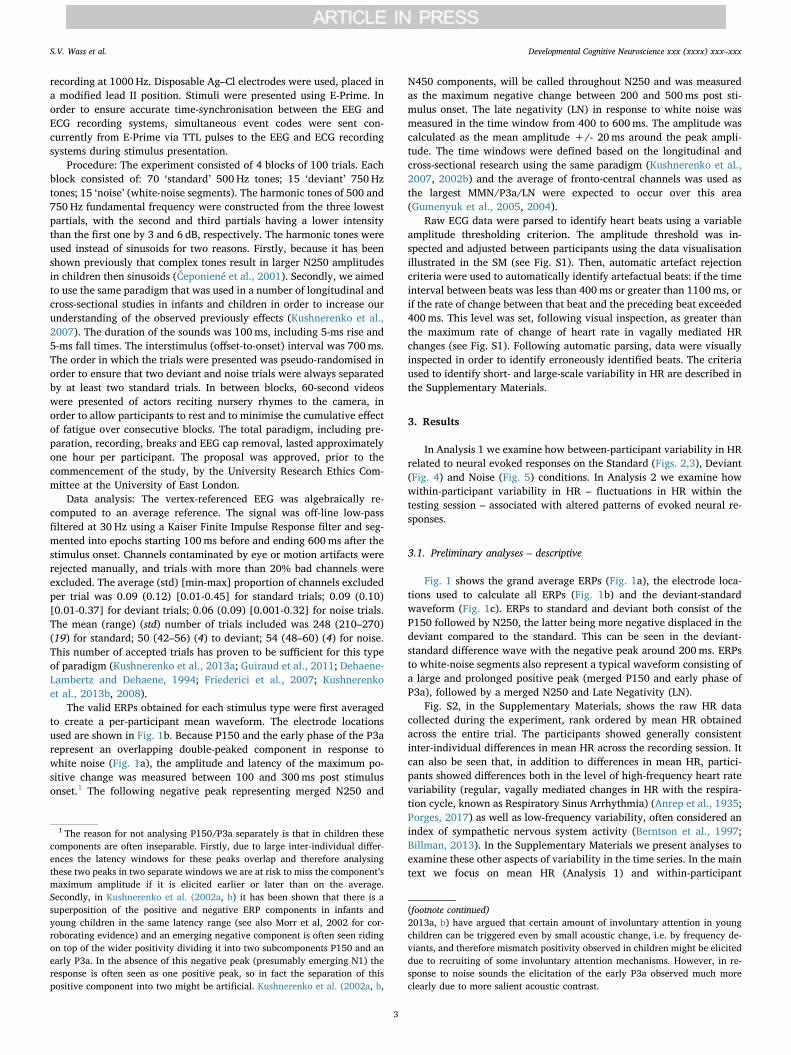
The valid ERPs obtained for each stimulus type were first averagedto create a per-participant mean waveform. The electrode locationsused are shown in Fig. 1b. Because P150 and the early phase of the P3arepresent an overlapping double-peaked component in response towhite noise (Fig. 1a), the amplitude and latency of the maximum po-sitive change was measured between 100 and 300ms post stimulusonset.1 The following negative peak representing merged N250 and
N450 components, will be called throughout N250 and was measuredas the maximum negative change between 200 and 500ms post sti-mulus onset. The late negativity (LN) in response to white noise wasmeasured in the time window from 400 to 600ms. The amplitude wascalculated as the mean amplitude +/- 20ms around the peak ampli-tude. The time windows were defined based on the longitudinal andcross-sectional research using the same paradigm (Kushnerenko et al.,2007, 2002b) and the average of fronto-central channels was used asthe largest MMN/P3a/LN were expected to occur over this area(Gumenyuk et al., 2005, 2004).
Raw ECG data were parsed to identify heart beats using a variableamplitude thresholding criterion. The amplitude threshold was in-spected and adjusted between participants using the data visualisationillustrated in the SM (see Fig. S1). Then, automatic artefact rejectioncriteria were used to automatically identify artefactual beats: if the timeinterval between beats was less than 400ms or greater than 1100ms, orif the rate of change between that beat and the preceding beat exceeded400ms. This level was set, following visual inspection, as greater thanthe maximum rate of change of heart rate in vagally mediated HRchanges (see Fig. S1). Following automatic parsing, data were visuallyinspected in order to identify erroneously identified beats. The criteriaused to identify short- and large-scale variability in HR are described inthe Supplementary Materials.
3. Results
In Analysis 1 we examine how between-participant variability in HRrelated to neural evoked responses on the Standard (Figs. 2,3), Deviant(Fig. 4) and Noise (Fig. 5) conditions. In Analysis 2 we examine howwithin-participant variability in HR – fluctuations in HR within thetesting session – associated with altered patterns of evoked neural re-sponses.
3.1. Preliminary analyses – descriptive
Fig. 1 shows the grand average ERPs (Fig. 1a), the electrode loca-tions used to calculate all ERPs (Fig. 1b) and the deviant-standardwaveform (Fig. 1c). ERPs to standard and deviant both consist of theP150 followed by N250, the latter being more negative displaced in thedeviant compared to the standard. This can be seen in the deviant-standard difference wave with the negative peak around 200ms. ERPsto white-noise segments also represent a typical waveform consisting ofa large and prolonged positive peak (merged P150 and early phase ofP3a), followed by a merged N250 and Late Negativity (LN).
Fig. S2, in the Supplementary Materials, shows the raw HR datacollected during the experiment, rank ordered by mean HR obtainedacross the entire trial. The participants showed generally consistentinter-individual differences in mean HR across the recording session. Itcan also be seen that, in addition to differences in mean HR, partici-pants showed differences both in the level of high-frequency heart ratevariability (regular, vagally mediated changes in HR with the respira-tion cycle, known as Respiratory Sinus Arrhythmia) (Anrep et al., 1935;Porges, 2017) as well as low-frequency variability, often considered anindex of sympathetic nervous system activity (Berntson et al., 1997;Billman, 2013). In the Supplementary Materials we present analyses toexamine these other aspects of variability in the time series. In the maintext we focus on mean HR (Analysis 1) and within-participant
1 The reason for not analysing P150/P3a separately is that in children thesecomponents are often inseparable. Firstly, due to large inter-individual differ-ences the latency windows for these peaks overlap and therefore analysingthese two peaks in two separate windows we are at risk to miss the component’smaximum amplitude if it is elicited earlier or later than on the average.Secondly, in Kushnerenko et al. (2002a, b) it has been shown that there is asuperposition of the positive and negative ERP components in infants andyoung children in the same latency range (see also Morr et al, 2002 for cor-roborating evidence) and an emerging negative component is often seen ridingon top of the wider positivity dividing it into two subcomponents P150 and anearly P3a. In the absence of this negative peak (presumably emerging N1) theresponse is often seen as one positive peak, so in fact the separation of thispositive component into two might be artificial. Kushnerenko et al. (2002a, b,
(footnote continued)2013a, b) have argued that certain amount of involuntary attention in youngchildren can be triggered even by small acoustic change, i.e. by frequency de-viants, and therefore mismatch positivity observed in children might be eliciteddue to recruiting of some involuntary attention mechanisms. However, in re-sponse to noise sounds the elicitation of the early P3a observed much moreclearly due to more salient acoustic contrast.
S.V. Wass et al. Developmental Cognitive Neuroscience xxx (xxxx) xxx–xxx
3
variability in HR (Analysis 2).
3.2. Analysis 1 – between-participant variability in HR
In Analysis 1 we examine how between-participant variability in HRrelated to participant responses on the Standard (Figs. 2,3), Deviant(Fig. 4) and Noise (Fig. 5) conditions.
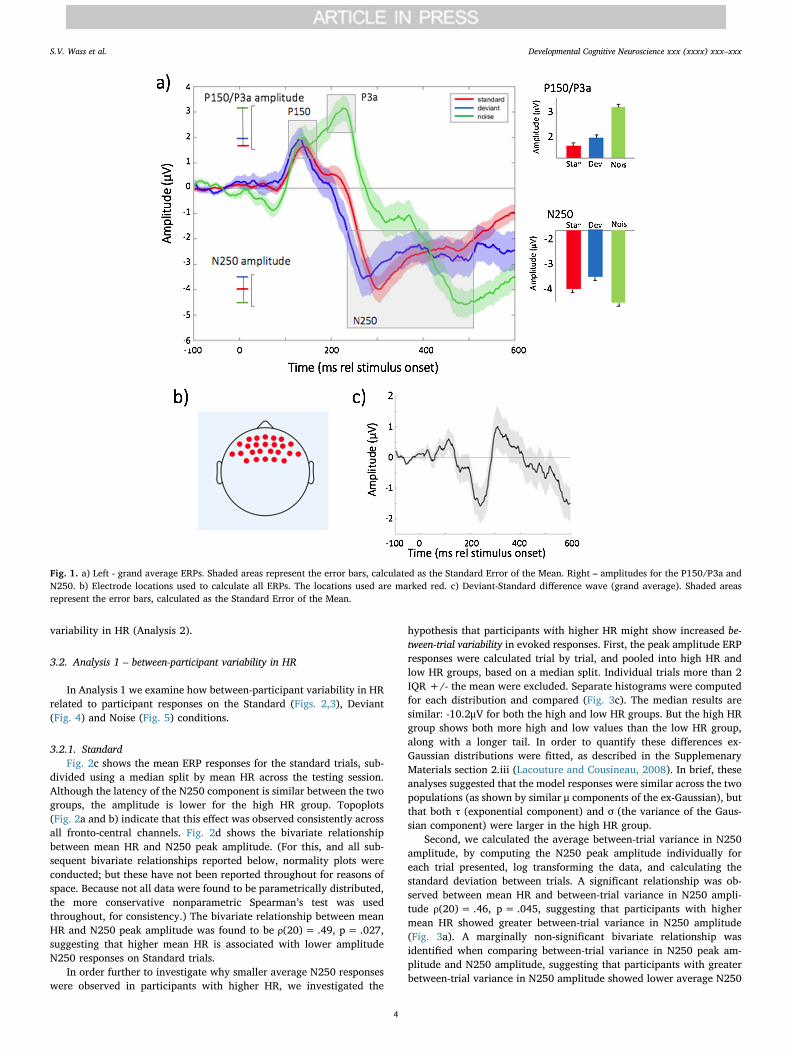
3.2.1. StandardFig. 2c shows the mean ERP responses for the standard trials, sub-
divided using a median split by mean HR across the testing session.Although the latency of the N250 component is similar between the twogroups, the amplitude is lower for the high HR group. Topoplots(Fig. 2a and b) indicate that this effect was observed consistently acrossall fronto-central channels. Fig. 2d shows the bivariate relationshipbetween mean HR and N250 peak amplitude. (For this, and all sub-sequent bivariate relationships reported below, normality plots wereconducted; but these have not been reported throughout for reasons ofspace. Because not all data were found to be parametrically distributed,the more conservative nonparametric Spearman’s test was usedthroughout, for consistency.) The bivariate relationship between meanHR and N250 peak amplitude was found to be ρ(20)= .49, p= .027,suggesting that higher mean HR is associated with lower amplitudeN250 responses on Standard trials.
In order further to investigate why smaller average N250 responseswere observed in participants with higher HR, we investigated the
hypothesis that participants with higher HR might show increased be-tween-trial variability in evoked responses. First, the peak amplitude ERPresponses were calculated trial by trial, and pooled into high HR andlow HR groups, based on a median split. Individual trials more than 2IQR +/- the mean were excluded. Separate histograms were computedfor each distribution and compared (Fig. 3c). The median results aresimilar: -10.2μV for both the high and low HR groups. But the high HRgroup shows both more high and low values than the low HR group,along with a longer tail. In order to quantify these differences ex-Gaussian distributions were fitted, as described in the SupplemenaryMaterials section 2.iii (Lacouture and Cousineau, 2008). In brief, theseanalyses suggested that the model responses were similar across the twopopulations (as shown by similar μ components of the ex-Gaussian), butthat both τ (exponential component) and σ (the variance of the Gaus-sian component) were larger in the high HR group.
Second, we calculated the average between-trial variance in N250amplitude, by computing the N250 peak amplitude individually foreach trial presented, log transforming the data, and calculating thestandard deviation between trials. A significant relationship was ob-served between mean HR and between-trial variance in N250 ampli-tude ρ(20)= .46, p= .045, suggesting that participants with highermean HR showed greater between-trial variance in N250 amplitude(Fig. 3a). A marginally non-significant bivariate relationship wasidentified when comparing between-trial variance in N250 peak am-plitude and N250 amplitude, suggesting that participants with greaterbetween-trial variance in N250 amplitude showed lower average N250
Fig. 1. a) Left - grand average ERPs. Shaded areas represent the error bars, calculated as the Standard Error of the Mean. Right – amplitudes for the P150/P3a andN250. b) Electrode locations used to calculate all ERPs. The locations used are marked red. c) Deviant-Standard difference wave (grand average). Shaded areasrepresent the error bars, calculated as the Standard Error of the Mean.
S.V. Wass et al. Developmental Cognitive Neuroscience xxx (xxxx) xxx–xxx
4
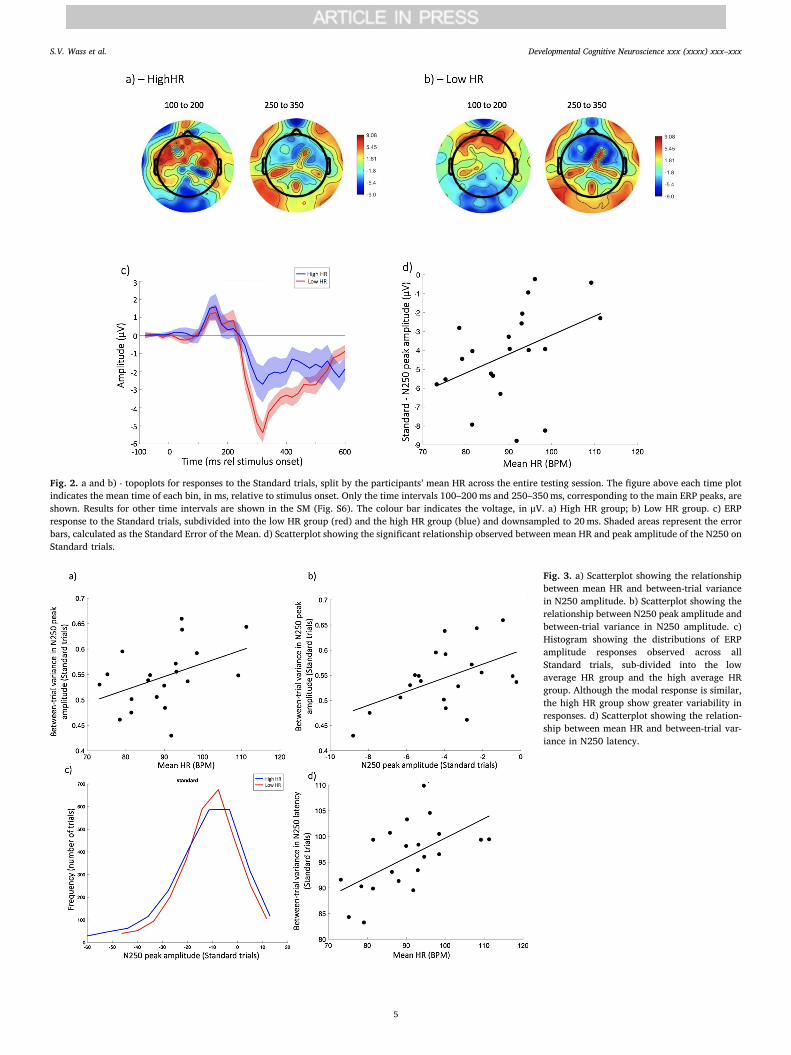
Fig. 2. a and b) - topoplots for responses to the Standard trials, split by the participants’ mean HR across the entire testing session. The figure above each time plotindicates the mean time of each bin, in ms, relative to stimulus onset. Only the time intervals 100–200ms and 250–350ms, corresponding to the main ERP peaks, areshown. Results for other time intervals are shown in the SM (Fig. S6). The colour bar indicates the voltage, in μV. a) High HR group; b) Low HR group. c) ERPresponse to the Standard trials, subdivided into the low HR group (red) and the high HR group (blue) and downsampled to 20ms. Shaded areas represent the errorbars, calculated as the Standard Error of the Mean. d) Scatterplot showing the significant relationship observed between mean HR and peak amplitude of the N250 onStandard trials.
Fig. 3. a) Scatterplot showing the relationshipbetween mean HR and between-trial variancein N250 amplitude. b) Scatterplot showing therelationship between N250 peak amplitude andbetween-trial variance in N250 amplitude. c)Histogram showing the distributions of ERPamplitude responses observed across allStandard trials, sub-divided into the lowaverage HR group and the high average HRgroup. Although the modal response is similar,the high HR group show greater variability inresponses. d) Scatterplot showing the relation-ship between mean HR and between-trial var-iance in N250 latency.
S.V. Wass et al. Developmental Cognitive Neuroscience xxx (xxxx) xxx–xxx
5
peak amplitude responses ρ(20)= .42, p= .067 (Fig. 3b). Identicalrelationships were observed between mean HR and the latency of thepeak amplitude: participants with higher mean HR showed increasedvariability in the latency of the peak N250 response ρ(20)= .60,p= .005 (Fig. 3d) and participants with increased variability in thelatency of the peak N250 response showed smaller average amplitudeN250 responses ρ(20)= .62, p= .003.
Overall, these results suggest that the modal responses are similaracross the two populations, but that response variability was larger inthe high HR group. Thus, despite the fact that large amplitude
responses were marginally more common in the high HR group(Fig. 3c), the greater between-trial variability both in the peak ampli-tude and the latency of the peak amplitude in the high HR group(Fig. 3a and d) leads to lower average response amplitudes.
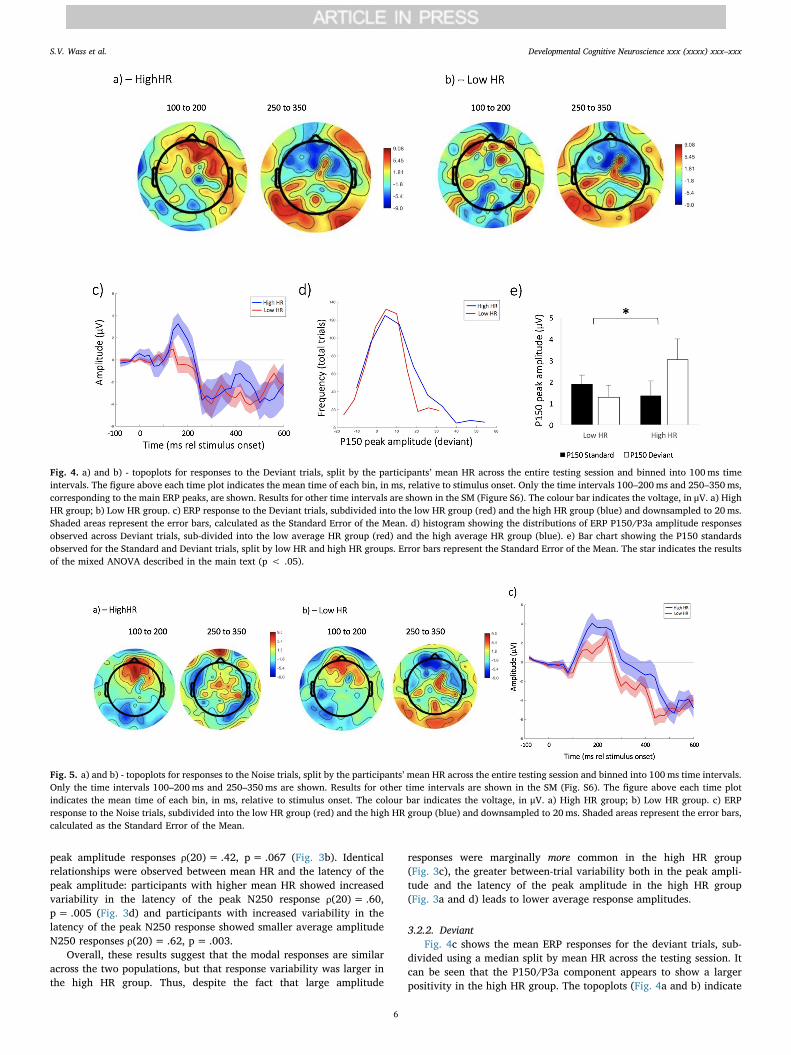
3.2.2. DeviantFig. 4c shows the mean ERP responses for the deviant trials, sub-
divided using a median split by mean HR across the testing session. Itcan be seen that the P150/P3a component appears to show a largerpositivity in the high HR group. The topoplots (Fig. 4a and b) indicate
Fig. 4. a) and b) - topoplots for responses to the Deviant trials, split by the participants’ mean HR across the entire testing session and binned into 100ms timeintervals. The figure above each time plot indicates the mean time of each bin, in ms, relative to stimulus onset. Only the time intervals 100–200ms and 250–350ms,corresponding to the main ERP peaks, are shown. Results for other time intervals are shown in the SM (Figure S6). The colour bar indicates the voltage, in μV. a) HighHR group; b) Low HR group. c) ERP response to the Deviant trials, subdivided into the low HR group (red) and the high HR group (blue) and downsampled to 20ms.Shaded areas represent the error bars, calculated as the Standard Error of the Mean. d) histogram showing the distributions of ERP P150/P3a amplitude responsesobserved across Deviant trials, sub-divided into the low average HR group (red) and the high average HR group (blue). e) Bar chart showing the P150 standardsobserved for the Standard and Deviant trials, split by low HR and high HR groups. Error bars represent the Standard Error of the Mean. The star indicates the resultsof the mixed ANOVA described in the main text (p < .05).
Fig. 5. a) and b) - topoplots for responses to the Noise trials, split by the participants’mean HR across the entire testing session and binned into 100ms time intervals.Only the time intervals 100–200ms and 250–350ms are shown. Results for other time intervals are shown in the SM (Fig. S6). The figure above each time plotindicates the mean time of each bin, in ms, relative to stimulus onset. The colour bar indicates the voltage, in μV. a) High HR group; b) Low HR group. c) ERPresponse to the Noise trials, subdivided into the low HR group (red) and the high HR group (blue) and downsampled to 20ms. Shaded areas represent the error bars,calculated as the Standard Error of the Mean.
S.V. Wass et al. Developmental Cognitive Neuroscience xxx (xxxx) xxx–xxx
6
that this effect was observed consistently across fronto-central chan-nels. In order to assess whether a larger P150/P3a was observed to thedeviant relative to the standard trials, the P150/P3a peak amplitudewas directly compared between the standard and deviant conditions,and subdivided by participant mean HR (Fig. 4e). A mixed ANOVA withP150/P3a amplitude as the DV, condition (Standard vs Deviant) aswithin-participants factor and HR group (Low vs High) as between-participants factor indicated a significant interaction between conditionand group F(1,19)= 9.9, p= .025, partial η2= .24. Post-hoc analysesusing paired-sample t-tests indicated that the P150/P3a was higher todeviant than standard trials in the high HR group t(9)= 2.30, p= .047,Cohen’s d=0.79 but not the low HR group t(10)= 1.01, p= .34,Cohen’s d=0.28.
In order further to investigate why larger average P150/P3a re-sponses were observed in participants with higher HR, we again in-vestigated between-trial variability in evoked responses. Peak ampli-tude ERP responses were calculated trial by trial, and pooled into highHR and low HR groups, based on a median split. Individual trials morethan 2 IQR +/- the mean were excluded. Separate histograms werecomputed for each distribution and compared (Fig. 4d). Ex-Gaussiandistributions were fitted (see Supplementary Materials section 2.iii)(Lacouture and Cousineau, 2008). These results suggest that, whereasthe modal responses were again similar between the two groups (shownby the similar μ components), the increased mean P150/P3a amplitudesobserved in the high HR group were associated with a sub-group oftrials with a high response amplitude, manifesting as an increased τ(exponential component).
3.2.3. NoiseFig. 5c shows the mean ERP responses for the Noise trials, sub-
divided using a median split by mean HR across the testing session.Fig. 5a and b show topoplots split by mean HR. An identical series ofanalyses were conducted to those reported for the Standard and Deviantcondition, including a mixed ANOVA with condition (Standard vs De-viant) as within-participants factor and HR group (Low vs High) asbetween-participants factor were conducted, but no significant groupdifferences were observed. In addition neither the latency (ρ(20)= .17,p= .47) or the amplitude (ρ(20)= .21, p= .36) of the Late Negativitycomponent showed a significant relationship to mean HR.
3.2.4. Relationship between HR variability and ERP responsesIn the Supplementary Materials we examine how low- and high-
frequency variability in our ECG data relate to the ERP responses ob-served. Robust individual differences in both low- (< 0.15 Hz) andhigh- (0.15-0.8 Hz) frequency variability could be obtained, as in-dicated by strong correlations between time and frequency domainestimates (Fig. S7). As expected (Cacioppo et al., 2000), high-frequencyvariability, which is thought to index vagal/parasympathetic influence,showed strong associations with mean HR (ρ=-0.76) (Fig. S7d) (lowerHR associated with increased high-frequency variability). Virtuallyidentical patterns of association with the ERP responses were observedfor high-frequency variability as were observed for mean HR: increasedhigh-frequency variability was associated with larger N250 Standardresponses and reduced P150/P3a Deviant responses (Figs. S8, S9). Inaddition, increased low-frequency variability was also associated withsmaller amplitude N250 Standard responses (Figure S8b), although norelationship was observed between low-frequency variability andP150/P3a Deviant responses (Fig. S8e).
3.3. Analysis 2 – within-participant changes in HR
Our main analyses presented above look at between-participantdifferences based on mean HR recorded across the entire testing ses-sion. In addition, we also looked at whether similar patterns could beidentified when we examined within-participant variability – i.e. fluc-tuations in HR within a particular individual, within a testing session.
Results for this analysis are given in the Supplementary Materialssection 2.iv (Fig. S10). In brief, highly comparable patterns of resultswere observed. Trials where HR was high showed smaller amplitudeN250 Standard responses – albeit with a smaller effect size than thebetween-participant analyses. For P150/P3a Deviant responses, a di-rectionally similar result (larger amplitude associated with higher HR)was observed but the effect was not significant. Of note, because theseanalyses examine within-participant variability (comparing high andlow HR trials within a testing session, separately for each participant),these findings are entirely independent of the results in the Analysis 1,which examine between-participant differences.
4. Discussion
We used an ERP paradigm to measure passive auditory attention in5-7-year-old children whilst concurrently measuring between- andwithin-participant variability in heart rate (HR). Our results had twomain features of interest: first, children with higher physiologicalarousal showed smaller amplitude N250 responses to Standard tones,which follow-up analyses suggested was due to increased within-par-ticipant variability in neural responsiveness in the high-arousal group.Second, children with higher physiological arousal showed larger am-plitude P150/P3a responses to Deviant tones. Responses to noiseshowed a response with much larger early P3a phase across all children,with no significant differences related to heart rate. We shall discuss ourtwo main findings in turn.
First, Fig. 2 illustrates the significant negative relationship observedbetween mean HR and N250 response amplitudes to 500 Hz tones.High-frequency variability in HR, thought to index Respiratory SinusArrhythmia (Parasympathetic Nervous System control) was associatednegatively with mean HR (Fig. S7d) and showed the same pattern: morehigh-frequency variability associated with larger N250 amplitude (Fig.S8). We also examined within-participant variability in HR in a separateanalysis that controlled for differences in mean HR. Consistent with theresults of Analysis 1, we found that, within each testing session, trialswith higher HR showed reduced N250 responses to standard tones (Fig.S10), albeit with a smaller effect size than noted in the between-par-ticipant analyses.
Between participants, elevated HR was associated with increasedtrial-to-trial variability for both response amplitudes (Fig. 3b) and re-sponse latencies (Fig. 3d). Previous research has reported that whensingle-trial ERPs are averaged, the amplitude of a peak in the averageERPs is inversely related to the trial-to-trial variability in latency of thatpeak (Thomas et al., 1989), consistent with the relationship we ob-served in our data (Fig. 3c). Our results were consistent with this. Thus,despite that the response histogram showed more high-amplitudeevoked responses in the high HR group (Fig. 3c), the averaged evokedresponses in the high HR group were lower (Ouyang et al., 2016).
One possible artifactual explanation of our findings is that thechildren with higher HR moved more during testing, which may havecontributed to the increased variability in our results (Georgieva et al.,2017). However, this appears unlikely because our participants wereseated during recording, and any trials containing gross movementartefact were excluded by our artefact rejection techniques. Further, itis unclear how movement artefact would contribute to the presenceboth of larger, and smaller N250 responses, as well as to both smalleraverage ERPs in one condition and larger ERP responses in another.
Previous studies have noted high levels of variability in ERP studieswith infants and children (Bishop, 2007; Kushnerenko et al., 2002a,2007). However, the present results are, to our knowledge, the firstdemonstration that increased variability in neural evoked responsesassociates with elevated physiological arousal. Consistent with this,previous research with non-human primates has identified systematicrelationships between an individual’s level of pre-stimulus physiolo-gical arousal and the consistency of the phasic responsiveness that theyshow to relevant stimuli (Usher et al., 1999). Other research has
S.V. Wass et al. Developmental Cognitive Neuroscience xxx (xxxx) xxx–xxx
7
suggested that at times when pre-stimulus arousal is higher, neuralgain, the degree to which neural signals are amplified or suppressedcontingent on relevance, is reduced (Aston-Jones and Cohen, 2005;Hauser et al., 2016; Aston-Jones et al., 2007). Our results may beconsistent with this – albeit that ERPs represent the summed activity ofpopulations of neurons (Harris et al., 2014), whereas most previousresearch has measured responses from single-cell recordings (Usheret al., 1999).
The present results may also, potentially, be consistent with beha-vioural research focusing on conditions such as ADHD that has identi-fied links between arousal and response time variability (Johnson et al.,2007; Kofler et al., 2013; Hicks et al., 1989; Wainstein et al., 2017). Forexample, Wainstein and colleagues recorded pupil size, which isthought to index physiological arousal (Loewenfeld, 1993) in childrenwith ADHD and found that, at times when pupil size was higher, re-sponse time variability on a visuospatial working memory task wasincreased. Bluschke and colleagues have also identified increased intra-participant variability in neural responses during a conflict monitoringin patients with ADHD (Bluschke et al., 2017).
The second novel aspect of our findings was the elevated P150/P3aresponse that we observed in the high-arousal group in response to rare,15% 750 Hz deviant tones. This larger mean response was observeddespite the fact that the trial-to-trial variability in the high HR groupwas higher (Fig. 4d); and, as discussed above, greater trial-to-trialvariability is typically associated with a lower averaged response. Theenhanced P150 (P2) in response to deviants has repeatedly been re-ported in the literature (Näätänen et al., 1978; Maurer et al., 2003;Seery et al., 2014) and was referred to as positive mismatch response(pMMR). Several hypotheses about its nature and functional sig-nificance have been discussed (Wetzel and Schröger, 2014; Ruhnauet al., 2013). One hypothesis interpreted positive MMR as an invertedMMN (Maurer et al., 2003), however the mechanism of such inversionis not clear. Another proposal suggests that the positive MMR reflects anearly P3a, a mechanism governing or initiating an attention shift to thedistracting stimuli in environment (Kushnerenko et al., 2002b;Čeponienė et al., 2004). One more proposed explanation was based onthe close temporal proximity (or overlap) of the positive MMR and theP2, and suggested that the positive mismatch response reflects a mod-ulation of the P2 component (Ruhnau et al., 2010).
Finally, there is an interpretation offered independently by two re-search teams (Kushnerenko et al., 2002a; Morr et al., 2002;Kushnerenko et al., 2002b), which does not rule out the above dis-cussed ones. Since scalp-recorded ERPs represents contributions fromdifferent concurrent generators with different relative strengths ormaturation rates, the observed ERP waveform represents a sum of theoverlapping superimposed positive and negative deflections, with onepotentially obscuring another depending on the relative strength of thegenerator (Kushnerenko et al., 2002a, b). Morr and colleagues illu-strated how polarity of the resulting mismatch response would dependon relative strengths of positive and negative generators depending ondeviance size and children age (Morr et al., 2002).
Interpreting our results, we hypothesize that here we also haveinter-relation between negative (N250/MMN) and positive generators(P150/P3a). For example, in response to ‘noise’ (Fig. 1a), which isthought to trigger the involuntary attention shift due to the saliency ofthe stimulus (Wetzel and Schröger, 2014), one can see that the P150 isalmost merged with the following P3a. We can hypothesize that in trialswith high HR, the overall brain excitability was higher and thereforemore prone to involuntary attention. Thus, even small acoustic con-trasts (frequency deviant) could potentially elicit a P3a-like response,which due to a larger amplitude could obscure the N250/MMN gen-erator response and contribute to the scalp-recorded amplitude of theP150. The increased positivity in high HR group could be reflectinghigher attentional demands as discussed in several recent studies(Garcia-Sierra et al., 2016; Rivera‐Gaxiola et al., 2005) and less auto-matic auditory change detection (which should have resulted in
negative MMN) in high arousal state.Although novel, our findings are consistent with previous research
into the relationship between physiological arousal and change detec-tion. Whereas the detection of sought-for stimuli (targets on a stimulusdetection task) is generally thought to show an inverted-U-shaped re-lationship with physiological arousal, with optimal performance ob-served at intermediate levels (Aston-Jones and Cohen, 2005; Yerkes andDodson, 1908; McGinley et al., 2015), it is known that during hyper-arousal, neural systems involved in exogenous, salience-driven or-ienting become more active. This leads to a shift from ‘top-down’, morefrontally mediated control at lower levels of physiological arousal to‘bottom-up’ control by low-level aspects of the sensory stimulus athigher levels of arousal (Arnsten, 2009; Liston et al., 2009). Consistentwith this, greater neural responsiveness to small acoustic changes hasbeen shown in adults with PTSD (Morgan and Grillon, 1999), andheightened physiological arousal has also been discussed in relation toauditory hypersensitivity in Autism Spectrum Disorders (Jones et al.,2009); although see (Rogers and Ozonoff, 2005).
Overall, our findings demonstrate the complex relationships be-tween physiological arousal and cognitive performance (Arnsten, 2009;de Barbaro et al., 2016b). Sensitivity to small acoustic changes mayconfer advantages in certain learning situations – reduced sensitivity tochange has been identified, for example, as a risk factor for conditionssuch as dyslexia (Baldeweg et al., 1999) and SLI (Rinker et al., 2007).However, inconsistent stimulus responses have, independently, beenimplicated in a diverse range of conditions, such as ADHD and ASD(Geurts et al., 2008). Further investigating the relationship betweenphysiological arousal and auditory attention, and its potential long-term impact on learning in cognitive domains such as language, shouldbe a goal for future research.
Acknowledgements
This research was supported by the University of East LondonSummer Internship Scheme and by ESRC Future Research LeadersFellowship Nr ES/N017560/1 to SW. We are grateful for the support ofall participating families.
Appendix A. Supplementary data
Supplementary material related to this article can be found, in theonline version, at doi:https://doi.org/10.1016/j.dcn.2018.12.010.
References
Alexander, J.K., et al., 2007. Beta-adrenergic modulation of cognitive flexibility duringstress. J. Cogn. Neurosci. 19 (3), 468–478.
Anrep, G.V., Pascual, W., Rossler, R., 1935. Respiratory variations of the heart rate. I. Thereflex mechanism of the respiratory arrhythmia. R. Soc. Lond. Proc. Series B 119,191–217.
Arnsten, A.F., 2009. Stress signalling pathways that impair prefrontal cortex structure andfunction. Nat. Rev. Neurosci. 10 (6), 410–422.
Aston-Jones, G., Cohen, J.D., 2005. An integrative theory of locus coeruleus-nor-epinephrine function: adaptive gain and optimal performance. Annu. Rev. Neurosci.28, 403–450.
Aston-Jones, G., et al., 2007. The locus coeruleus and regulation of behavioral flexibilityand attention: clinical implications. In: Ordway, G.A., Schwartz, M.A., Frazer, A.(Eds.), Brain Norepinephrine: Neurobiology and Therapeutics. Cambridge UniversityPress, Cambridge, UK.
Bacher, L.F., Robertson, S.S., 2001. Stability of coupled fluctuations in movement andvisual attention in infants. Dev. Psychobiol. 39 (2), 99–106.
Balan, P., et al., 2002. Auditory ERPs reveal brain dysfunction in infants with plagioce-phaly. J. Craniofac. Surg. 13 (4), 520–525.
Baldeweg, T., et al., 1999. Impaired auditory frequency discrimination in dyslexia de-tected with mismatch evoked potentials. Ann. Neurol. 45 (4), 495–503.
Berntson, G.G., et al., 1997. Heart rate variability: origins, methods, and interpretivecaveats. Psychophysiology 34 (6), 623–648.
Billman, G.E., 2013. The LF/HF ratio does not accurately measure cardiac sympatho-vagal balance. Front. Physiol. 4.
Bishop, D., 2007. Using mismatch negativity to study central auditory processing in de-velopmental language and literacy impairments: where are we, and where should webe going? Psychol. Bull. 133 (4), 651.
S.V. Wass et al. Developmental Cognitive Neuroscience xxx (xxxx) xxx–xxx
8
Bluschke, A., et al., 2017. Neuronal intra-individual variability masks response selectiondifferences between ADHD subtypes—a need to change perspectives. Front. Hum.Neurosci. 11, 329.
Broadbent, D., 1971. Decision and Stress. Academic, London.Bush, N.R., et al., 2011. Differentiating challenge reactivity from psychomotor activity in
studies of children’s psychophysiology: considerations for theory and measurement.J. Exp. Child Psychol. 110 (1), 62–79.
Cacioppo, J.T., Tassinary, L.G., Berntson, G.G., 2000. Handbook of Psychophysiology,2nd ed. Cambridge University Press, Cambridge, UK.
Čeponien, R., Cheour, M., Näätänen, R., 1998. Interstimulus interval and auditory event-related potentials in children: evidence for multiple generators. Electroencephalogr.Clin. Neurophysiol. Potentials Sect. 108 (4), 345–354.
Ceponien, R., Cheour, M., Näätänen, R., 1998. Interstimulus interval and auditory event-related potentials in children: evidence for multiple generators. Electroencephalogr.Clin. Neurophysiol. Potentials Sect. 108 (4), 345–354.
Čeponien, R., Rinne, T., Näätänen, R., 2002. Maturation of cortical sound processing asindexed by event-related potentials. Clin. Neurophysiol. 113 (6), 870–882.
Čeponiené, R., et al., 2001. Children's auditory event-related potentials index soundcomplexity and “speechness”. Int. J. Neurosci. 109 (3-4), 245–260.
Čeponienė, R., et al., 2004. Event‐related potentials associated with sound discriminationversus novelty detection in children. Psychophysiology 41 (1), 130–141.
Cheng, Y.-Y., et al., 2015. Feature-specific transition from positive mismatch response tomismatch negativity in early infancy: mismatch responses to vowels and initialconsonants. Int. J. Psychophysiol. 96 (2), 84–94.
Choudhury, N., Benasich, A.A., 2011. Maturation of auditory evoked potentials from 6 to48 months: prediction to 3 and 4 year language and cognitive abilities. Clin.Neurophysiol. 122 (2), 320–338.
de Barbaro, K., Clackson, K., Wass, S.V., 2016a. Infant attention is dynamically modulatedwith changing arousal levels. Child Dev. 88 (2), 629–639.
de Barbaro, K., Clackson, K., Wass, S.V., 2016b. Stress reactivity may enhance basiclearning processes in infants. Dev. Psychobiol. 1, 1–15.
Dehaene-Lambertz, G., Dehaene, S., 1994. Speed and cerebral correlates of syllable dis-crimination in infants. Nature 370 (6487), 292.
Fellman, V., et al., 2004. Atypical auditory event-related potentials in preterm infantsduring the first year of life: a possible sign of cognitive dysfunction? Pediatr. Res. 56(2), 291–297.
Friederici, A.D., Friedrich, M., Christophe, A., 2007. Brain responses in 4-month-old in-fants are already language specific. Curr. Biol. 17 (14), 1208–1211.
Friedrich, M., Herold, B., Friederici, A.D., 2009. ERP correlates of processing native andnon-native language word stress in infants with different language outcomes. Cortex45 (5), 662–676.
Garcia-Sierra, A., Ramírez-Esparza, N., Kuhl, P.K., 2016. Relationships between quantityof language input and brain responses in bilingual and monolingual infants. Int. J.Psychophysiol. 110, 1–17.
Georgieva, S., et al., 2017. Topographical and spectral signatures of infant and adultmovement artifacts in naturalistic EEG. bioRxiv 206029.
Geurts, H.M., et al., 2008. Intra-individual variability in ADHD, autism spectrum dis-orders and Tourette’s syndrome. Neuropsychologia 46 (13), 3030–3041.
Gomot, M., et al., 2000. Maturation of frontal and temporal components of mismatchnegativity (MMN) in children. Neuroreport 11 (14), 3109–3112.
Gomot, M., et al., 2007. Left temporal impairment of auditory information processing inprematurely born 9-year-old children: an electrophysiological study. Int. J.Psychophysiol. 64 (2), 123–129.
Guiraud, J.A., et al., 2011. Differential habituation to repeated sounds in infants at highrisk for autism. Neuroreport 22 (16), 845–849.
Gumenyuk, V., et al., 2004. Effects of auditory distraction on electrophysiological brainactivity and performance in children aged 8–13 years. Psychophysiology 41 (1),30–36.
Gumenyuk, V., et al., 2005. Electrophysiological evidence of enhanced distractibility inADHD children. Neurosci. Lett. 374 (3), 212–217.
Hariº, R., et al., 1987. Neuromagnetic responses of the human auditory cortex to on-andoffsets of noise bursts. Audiology 26, 31–43.
Harris, K.C., Vaden, K.I., Dubno, J.R., 2014. Auditory-evoked cortical activity: con-tribution of brain noise, phase locking, and spectral power. J. Basic Clin. Physiol.Pharmacol. 25 (3), 277–284.
Hauser, T.U., et al., 2016. Computational psychiatry of ADHD: neural gain impairmentsacross Marrian levels of analysis. Trends Neurosci. 39 (2), 63–73.
Hicks, R.E., Mayo, J.P., Clayton, C.J., 1989. Differential psychopharmacology of me-thylphenidate and the neuropsychology of childhood hyperactivity. Int. J. Neurosci.45 (1-2), 7–32.
Holzman, J.B., Bridgett, D.J., 2017. Heart rate variability indices as bio-markers of top-down self-regulatory mechanisms: a meta-analytic review. Neurosci. Biobehav. Rev.
Imeraj, L., et al., 2012. Altered circadian profiles in attention-deficit/hyperactivity dis-order: an integrative review and theoretical framework for future studies. Neurosci.Biobehav. Rev. 36 (8), 1897–1919.
Janig, W., Habler, H., 2000. Specificity in the organization of the autonomic nervoussystem: a basis for precise neural regulation of homeostatic and protective bodyfunctions. Prog. Brain Res. 122, 351–368.
Johnson, K.A., et al., 2007. Response variability in attention deficit hyperactivity dis-order: evidence for neuropsychological heterogeneity. Neuropsychologia 45 (4),630–638.
Jones, C.R., et al., 2009. Auditory discrimination and auditory sensory behaviours inautism spectrum disorders. Neuropsychologia 47 (13), 2850–2858.
Knight, R.T., et al., 1980. The effects of frontal and temporal-parietal lesions on the au-ditory evoked potential in man. Electroencephalogr. Clin. Neurophysiol. 50 (1-2),112–124.
Kofler, M.J., et al., 2013. Reaction time variability in ADHD: a meta-analytic review of319 studies. Clin. Psychol. Rev. 33 (6), 795–811.
Korpilahti, P., Lang, H., 1994. Auditory ERP components and mismatch negativity indysphasic children. Electroencephalogr. Clin. Neurophysiol. 91 (4), 256–264.
Kushnerenko, E., et al., 2002a. Maturation of the auditory change detection response ininfants: a longitudinal ERP study. Neuroreport 13 (15), 1843–1848.
Kushnerenko, E., et al., 2002b. Maturation of the auditory event-related potentials duringthe first year of life. Neuroreport 13 (1), 47–51.
Kushnerenko, E., et al., 2007. Processing acoustic change and novelty in newborn infants.Eur. J. Neurosci. 26 (1), 265–274.
Kushnerenko, E., et al., 2008. Electrophysiological evidence of illusory audiovisual speechpercept in human infants. Proc. Natl. Acad. Sci. 105 (32), 11442–11445.
Kushnerenko, E., Van den Bergh, B., Winkler, I., 2013a. Separating acoustic deviancefrom novelty during the first year of life: a review of event-related potential evidence.Front. Psychol. 4.
Kushnerenko, E., et al., 2013b. Brain responses to audiovisual speech mismatch in infantsare associated with individual differences in looking behaviour. Eur. J. Neurosci. 38(9), 3363–3369.
Lacey, J.I., 1967. Somatic response patterning and stress: some revisions of activationtheory. In: Appley, M.H., Trumbull, R. (Eds.), Psychological Stress. Appleton-Century-Crofts, New York 1967.
Lacouture, Y., Cousineau, D., 2008. How to use MATLAB to fit the ex-Gaussian and otherprobability functions to a distribution of response times. Tutor. Quant. MethodsPsychol. 4 (1), 35–45.
Lee, C.-Y., et al., 2012. Mismatch responses to lexical tone, initial consonant, and vowel inMandarin-speaking preschoolers. Neuropsychologia 50 (14), 3228–3239.
Liston, C., McEwen, B.S., Casey, B.J., 2009. Psychosocial stress reversibly disrupts pre-frontal processing and attentional control. Proc. Natl. Acad. Sci. U.S.A. 106 (3),912–917.
Loewenfeld, I.E., 1993. The Pupil: Anatomy, Physiology, and Clinical Applications Vol. 1Iowa State University Press, Detroit, Ames.
Maurer, U., et al., 2003. Development of the automatic mismatch response: from frontalpositivity in kindergarten children to the mismatch negativity. Clin. Neurophysiol.114 (5), 808–817.
McCabe, P.M., 2000. Schneiderman, and Field. Stress, Coping, and CardiovascularDisease. Lawrence Erlbaum Associates, Inc.
McCall, J.G., et al., 2015. CRH engagement of the locus coeruleus noradrenergic systemmediates stress-induced anxiety. Neuron 87 (3), 605–620.
McGinley, M.J., David, S.V., McCormick, D.A., 2015. Cortical membrane potential sig-nature of optimal states for sensory signal detection. Neuron 87 (1), 179–192.
Montgomery, J.W., Windsor, J., 2007. Examining the language performances of childrenwith and without specific language impairment: contributions of phonological short-term memory and speed of processing. J. Speech Lang. Hear. Res. 50 (3), 778–797.
Morgan, C.A., Grillon, C., 1999. Abnormal mismatch negativity in women with sexualassault-related posttraumatic stress disorder. Biol. Psychiatry 45 (7), 827–832.
Morr, M.L., et al., 2002. Maturation of mismatch negativity in typically developing infantsand preschool children. Ear Hear. 23 (2), 118–136.
Murphy, P.R., et al., 2011. Pupillometry and P3 index the locus coeruleus-noradrenergicarousal function in humans. Psychophysiology 48 (11), 1531–1542.
Näätänen, R., Picton, T., 1986. N2 and automatic versus controlled processes.Electroencephalogr. Clin. Neurophysiol. Suppl. 38, 169–186.
Näätänen, R., Gaillard, A.W., Mäntysalo, S., 1978. Early selective-attention effect onevoked potential reinterpreted. Acta Psychol. (Amst) 42 (4), 313–329.
Nieuwenhuis, S., Aston-Jones, G., Cohen, J.D., 2005. Decision making, the P3, and thelocus coeruleus–norepinephrine system. Psychol. Bull. 131 (4), 510.
Ouyang, G., Sommer, W., Zhou, C., 2016. Reconstructing ERP amplitude effects aftercompensating for trial-to-trial latency jitter: a solution based on a novel application ofresidue iteration decomposition. Int. J. Psychophysiol. 109, 9–20.
Porges, S.W., 2017. Respiratory sinus arrhythmia: physiological basis. Quant. MethodsClin. Implications 101–115.
Reyes del Paso, G.A., et al., 2013. The utility of low frequency heart rate variability as anindex of sympathetic cardiac tone: a review with emphasis on a reanalysis of previousstudies. Psychophysiology 50 (5), 477–487.
Richards, J.E., 1985. Respiratory Sinus Arrhythmia predicts heart rate and visual re-sponses during visual attention in 14 and 20 week old infants. Psychophysiology 22(1), 101–109.
Richards, J.E., 2010. The development of attention to simple and complex visual stimuliin infants: behavioral and psychophysiological measures. Dev. Rev. 30 (2), 203–219.
Richards, J.E., et al., 2011. Infant attention, arousal and the brain. In: Oakes, L.M. (Ed.),Infant Perception and Cognition. Oxford University Press, Oxford, UK.
Rif, J., et al., 1991. Auditory attention affects two different areas in the human supra-temporal cortex. Electroencephalogr. Clin. Neurophysiol. 79 (6), 464–472.
Rinker, T., et al., 2007. Abnormal frequency discrimination in children with SLI as in-dexed by mismatch negativity (MMN). Neurosci. Lett. 413 (2), 99–104.
Rivera‐Gaxiola, M., Silva‐Pereyra, J., Kuhl, P.K., 2005. Brain potentials to native andnon‐native speech contrasts in 7‐and 11‐month‐old American infants. Dev. Sci. 8 (2),162–172.
Robinson, D.L., 1999. The technical, neurological and psychological significance of ‘al-pha’,‘delta’and ‘theta’waves confounded in EEG evoked potentials: a study of peaklatencies. Clin. Neurophysiol. 110 (8), 1427–1434.
Rogers, S.J., Ozonoff, S., 2005. Annotation: what do we know about sensory dysfunctionin autism? A critical review of the empirical evidence. J. Child Psychol. Psychiatry 46(12), 1255–1268.
Ruhnau, P., et al., 2010. The modulation of auditory novelty processing by workingmemory load in school age children and adults: a combined behavioral and event-related potential study. BMC Neurosci. 11 (1), 126.
S.V. Wass et al. Developmental Cognitive Neuroscience xxx (xxxx) xxx–xxx
9
Ruhnau, P., et al., 2013. Processing of complex distracting sounds in school-aged childrenand adults: evidence from EEG and MEG data. Front. Psychol. 4, 717.
Sara, S.J., Bouret, S., 2012. Orienting and reorienting: the locus coeruleus mediatescognition through arousal. Neuron 76 (1), 130–141.
Seery, A., Tager-Flusberg, H., Nelson, C.A., 2014. Event-related potentials to repeatedspeech in 9-month-old infants at risk for autism spectrum disorder. J. Neurodev.Disord. 6 (1), 43.
Sonuga-Barke, E.J., et al., 2010. Context-dependent dynamic processes in attention def-icit/hyperactivity disorder: differentiating common and unique effects of state reg-ulation deficits and delay aversion. Neuropsychol. Rev. 20 (1), 86–102.
Stevens, C., Lauinger, B., Neville, H., 2009. Differences in the neural mechanisms of se-lective attention in children from different socioeconomic backgrounds: an event-related brain potential study. Dev. Sci. 12 (4), 634–646.
Stevens, C., et al., 2015. Atypical auditory refractory periods in children from lower socio-economic status backgrounds: ERP evidence for a role of selective attention. Int. J.Psychophysiol. 95 (2), 156–166.
Thayer, J.F., et al., 2009. Heart rate variability, prefrontal neural function, and cognitiveperformance: the neurovisceral integration perspective on self-regulation, adapta-tion, and health. Ann. Behav. Med. 37 (2), 141–153.
Thomas, D.G., Neer, C.M., Price, J.M., 1989. Analyses of single-trial N1 amplitude and
latency variability and their influence on the average evoked potential.Electroencephalogr. Clin. Neurophysiol. Potentials Sect. 74 (3), 228–235.
Tonnquist-Uhlen, I., 1996. Topography of auditory evoked long-latency potentials inchildren with severe language impairment: the P2 and N2 components. Ear Hear. 17(4), 314–326.
Ulrich-Lai, Y.M., Herman, J.P., 2009. Neural regulation of endocrine and autonomic stressresponses. Nat. Rev. Neurosci. 10 (6), 397–409.
Usher, M., et al., 1999. The role of locus coeruleus in the regulation of cognitive per-formance. Science 283 (5401), 549–554.
Wainstein, G., et al., 2017. Pupil size tracks attentional performance in attention-deficit/hyperactivity disorder. Sci. Rep. 7 (1), 8228.
Wass, S.V., 2018. How orchids concentrate? The relationship between physiological stressreactivity and cognitive performance during infancy and early childhood. Neurosci.Biobehav. Rev. 90, 34–49.
Wass, S.V., Clackson, K., de Barbaro, K., 2016. Temporal dynamics of arousal and at-tention in infants. Dev. Psychobiol. 64, 1–17.
Wetzel, N., Schröger, E., 2014. On the development of auditory distraction: a review.Psych J. 3 (1), 72–91.
Yerkes, R.M., Dodson, J.D., 1908. The relation of strength of stimulus to rapidity of habitformation. J. Comp. Neurol. Psychol. 18, 459–482.
S.V. Wass et al. Developmental Cognitive Neuroscience xxx (xxxx) xxx–xxx
10