Embed Size (px)
Citation preview

uOttawa.cauOttawa.ca
ELG3125 Signal and System Analysis
Introduction to MATLab (Fall, 2017)
Presented by: Mohammad Khaki
School of Information Technology and Engineering
uOttawa.ca
Outline
1. MATLab Introduction
2. Desktop and Interfaces
3. Basics
4. Help
uOttawa.ca
MATLab Overview
MATLab (MATrix LABoratory) is a high-performance language for technical computing. Typical uses include:
• Math and computation,
• Algorithm development
• Data acquisition,
• Modeling, simulation, and prototyping
• Data analysis, exploration, and visualization
• Scientific and engineering graphics
• Application development, including graphical user interface building
3
uOttawa.ca
MATLab Overview
• A high-level matrix/array language with control flow statements,
• functions,
• data structures,
• input/output, and object-oriented programming features.
uOttawa.ca
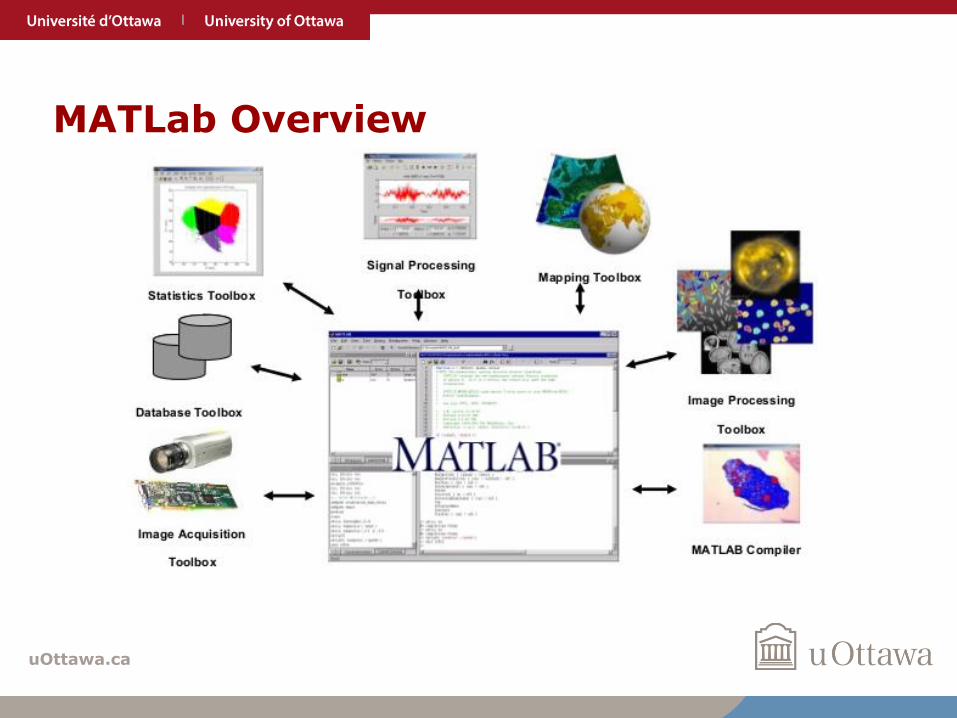
MATLab Overview
uOttawa.ca
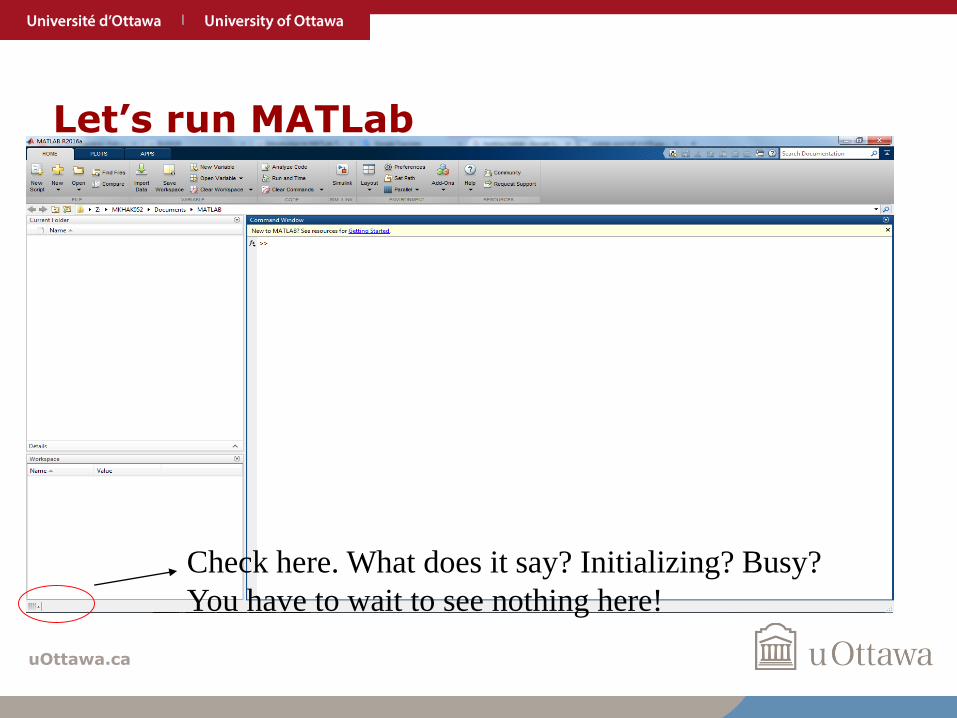
Let’s run MATLab
Check here. What does it say? Initializing? Busy?
You have to wait to see nothing here!
uOttawa.ca
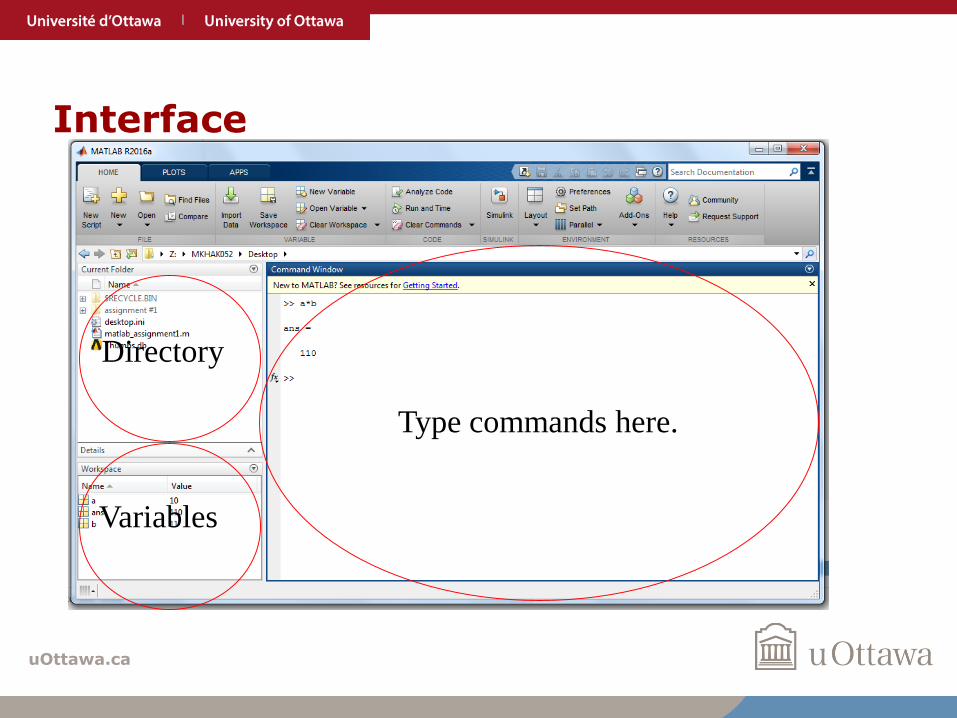
Interface
Type commands here.
Directory
Variables
uOttawa.ca
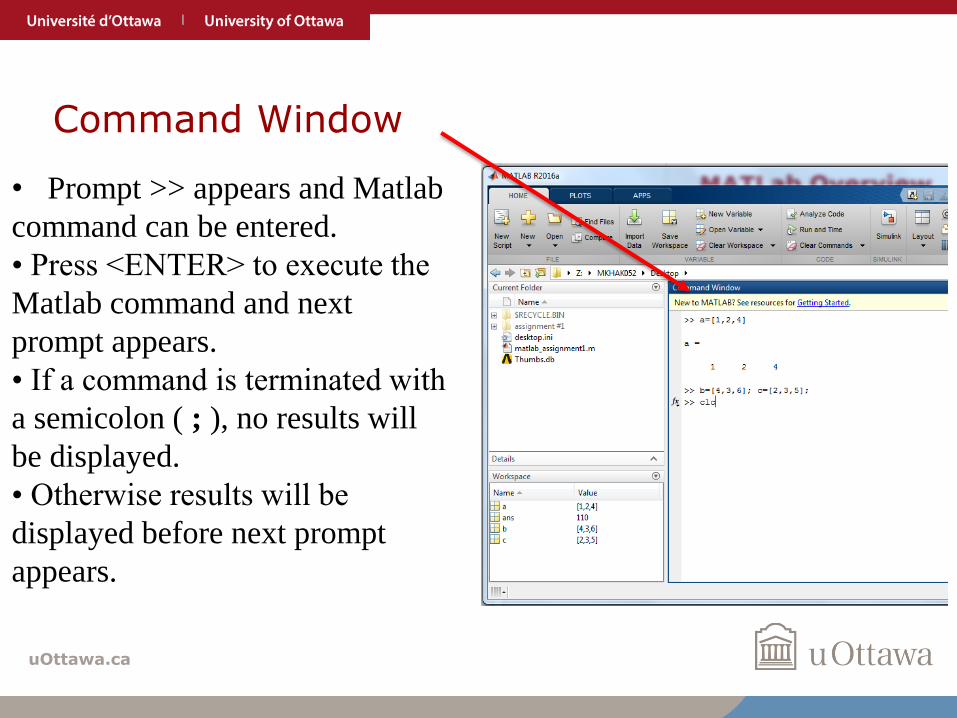
Command Window
• Prompt >> appears and Matlab
command can be entered.
• Press <ENTER> to execute the
Matlab command and next
prompt appears.
• If a command is terminated with
a semicolon ( ; ), no results will
be displayed.
• Otherwise results will be
displayed before next prompt
appears.
uOttawa.ca
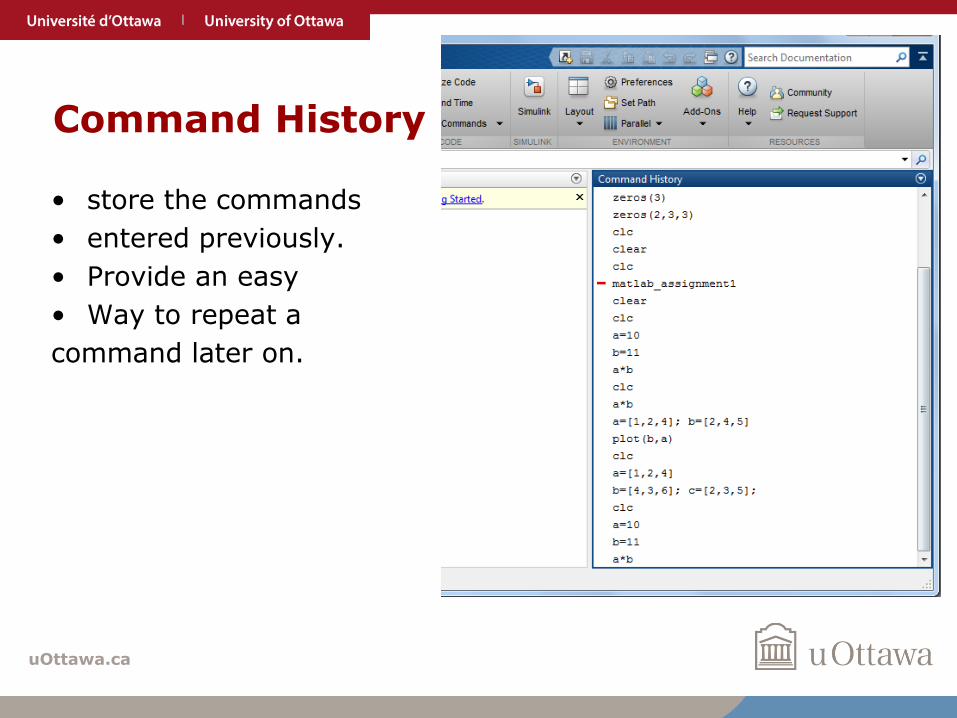
Command History
• store the commands
• entered previously.
• Provide an easy
• Way to repeat a
command later on.
uOttawa.ca
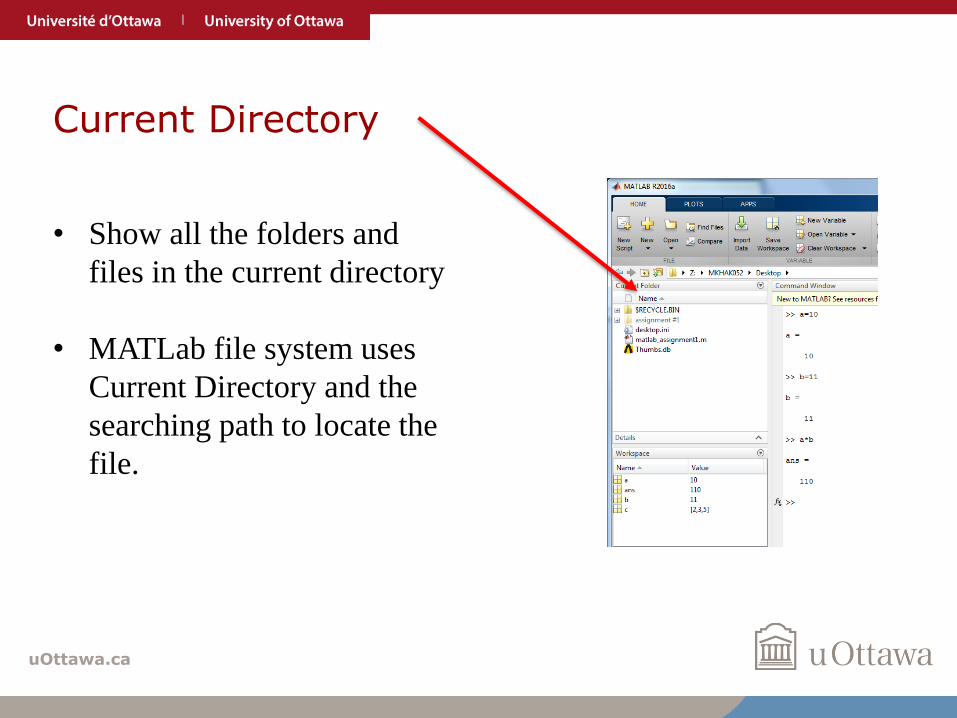
Current Directory
• Show all the folders and
files in the current directory
• MATLab file system uses
Current Directory and the
searching path to locate the
file.
uOttawa.ca
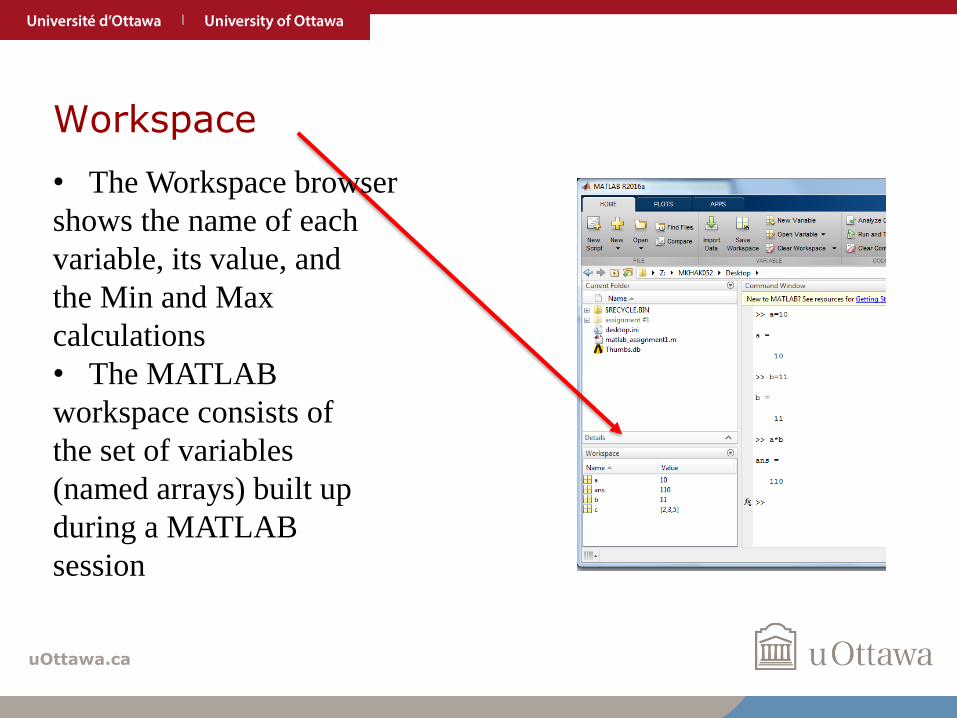
Workspace
• The Workspace browser
shows the name of each
variable, its value, and
the Min and Max
calculations
• The MATLAB
workspace consists of
the set of variables
(named arrays) built up
during a MATLAB
session
uOttawa.ca
MATLab Symbols
• >> Command prompt
• … Continue statement in next line
• , Separate statements and data, e.g.,
• A = [5.92, 8.13, 3.53]
• % Start comment which ends at the end of line, e.g.,% The purpose of this routine is to compute
• ; Suppress output or used as row separator in a matrix
• : Specify a range and generates a sequence of numbers that you can use in creating or indexing into arrays. For example, N = 6:17.
uOttawa.ca
MATLab Variables
Variable name:
• CASE SENSITIVE. e.g., x and X are two different variables
• up to 63 characters (as of MATLAB 6.5 and newer)
• must start with a letter and can be followed by letters, digits, or underscores. e.g.,x3_2, but 2_x3 is not correct.
uOttawa.ca
MATLab Variables
• Variables are stored in MATLab in the form of matriceswhich are generally of size MxN.
• Elements of matrix can be real or complex numbers.
• A scalar is a 1x1 matrix.
• A row vector is a 1xN matrix.
• A column vector is a Mx1 matrix.
uOttawa.ca
MATLab Variables
Special variables (Can’t be defined as they’re already defined):
• ans Default variable name for results
• pi Value of π
• inf Infinity
• NaN Not a number e.g. 0/0
• i and j i = j = square root of -1
• realmin The smallest usable positive real number
• realmax The largest usable positive real number
uOttawa.ca
Examples
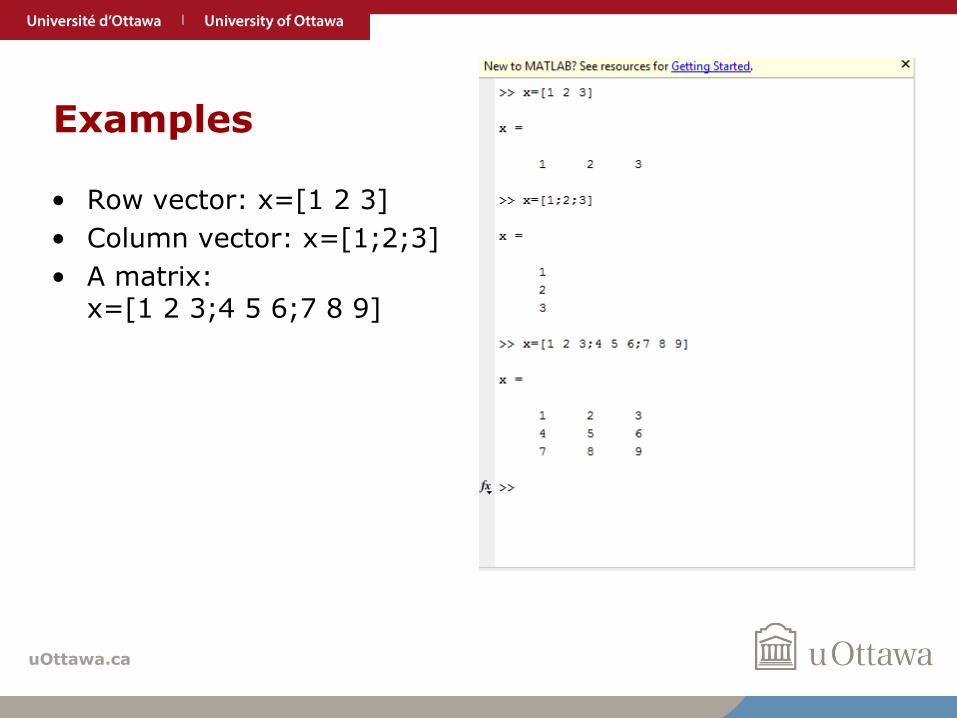
• Row vector: x=[1 2 3]
• Column vector: x=[1;2;3]
• A matrix: x=[1 2 3;4 5 6;7 8 9]
uOttawa.ca
Examples
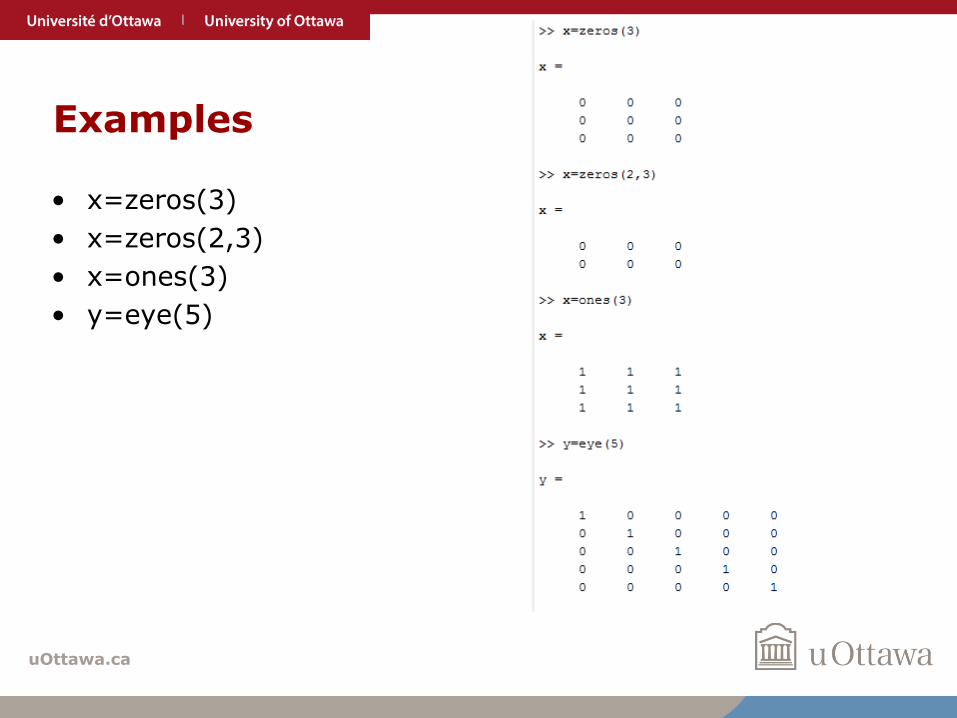
• x=zeros(3)
• x=zeros(2,3)
• x=ones(3)
• y=eye(5)
uOttawa.ca
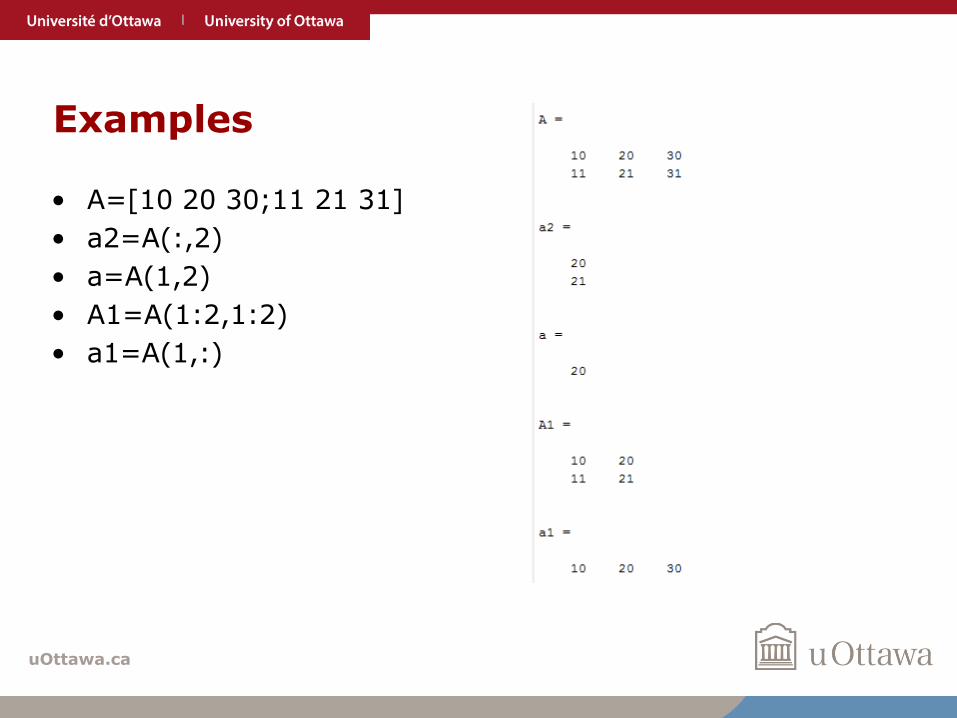
Examples
• A=[10 20 30;11 21 31]
• a2=A(:,2)
• a=A(1,2)
• A1=A(1:2,1:2)
• a1=A(1,:)
uOttawa.ca
Arithmetic Operator
• + Addition
• - Subtraction
• * Multiplication
• / Right division
• ^ Power
• ’ Conjugate transpose
uOttawa.ca
Relational operators
• == equal
• ~= not equal
• < less than
• <= less than or equal
• > greater than
• >= greater than or equal
uOttawa.ca
Basic Math Functions
• abs(x) absolute value
• exp(x) exponential
• sin(x),cos(x) sine, cosine
• log(x),log10(x) natural logarithm, common logarithm
• sqrt(x) square root
• sign(x) signum
• round(x),fix(x) round towards nearest integer, round towards zero
• floor(x),ceil(x) round towards negative infinity, round towards plus infinity
• size(x),length(x) size of array, length of vector
uOttawa.ca
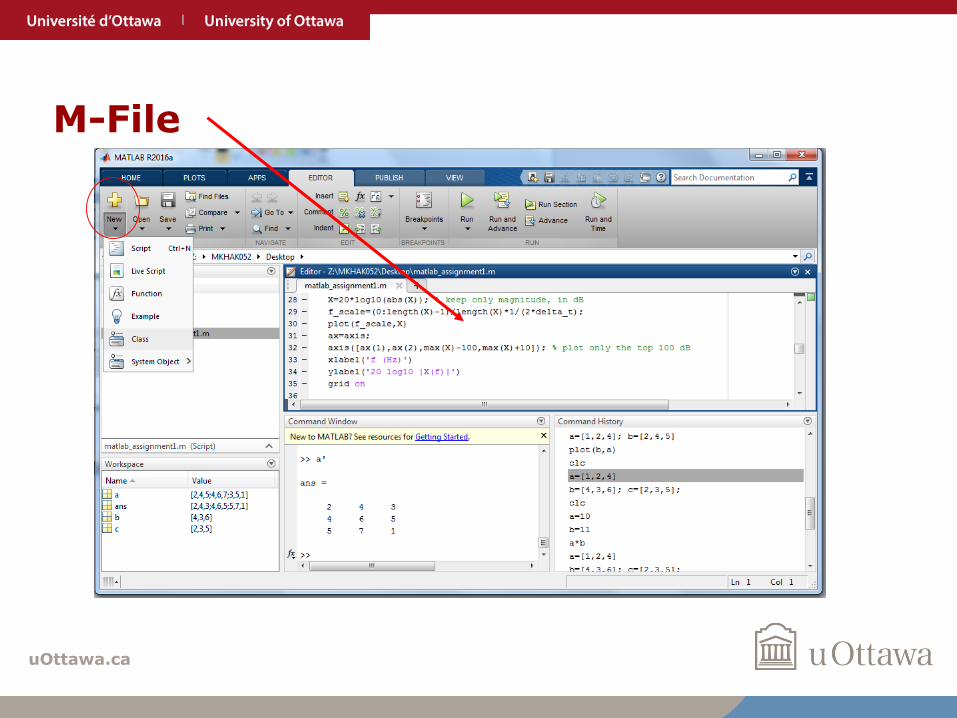
M-File
uOttawa.ca
Two types of M-Files
M-files are used to execute a series of commands:
• Script: Running with No Input Arguments;
• Function: Running with Input Arguments;
uOttawa.ca
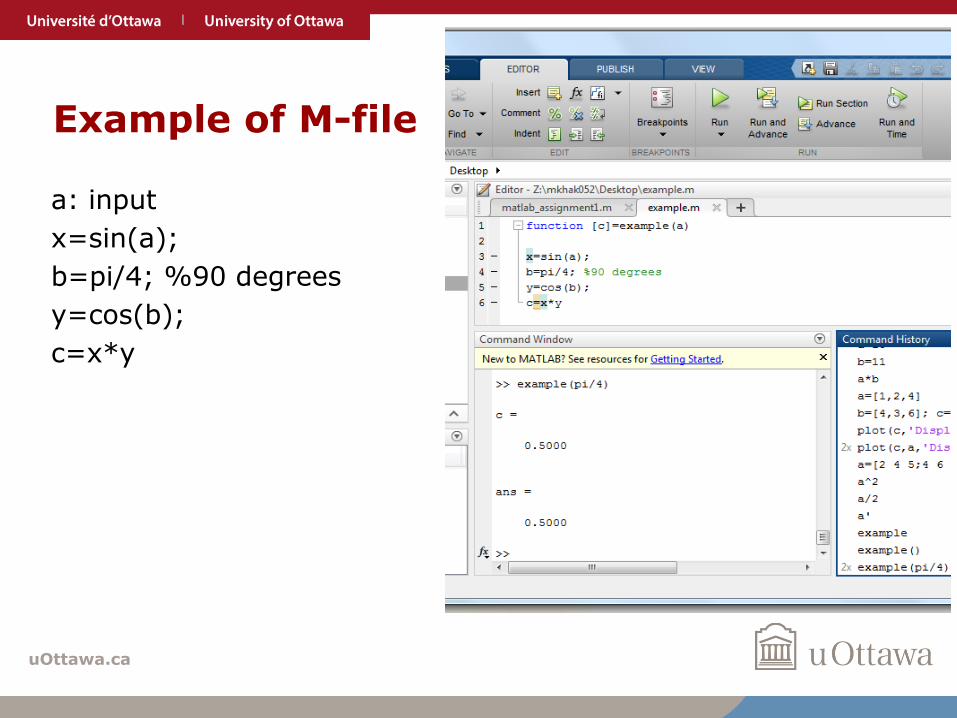
Example of M-file
a: input
x=sin(a);
b=pi/4; %90 degrees
y=cos(b);
c=x*y
uOttawa.ca
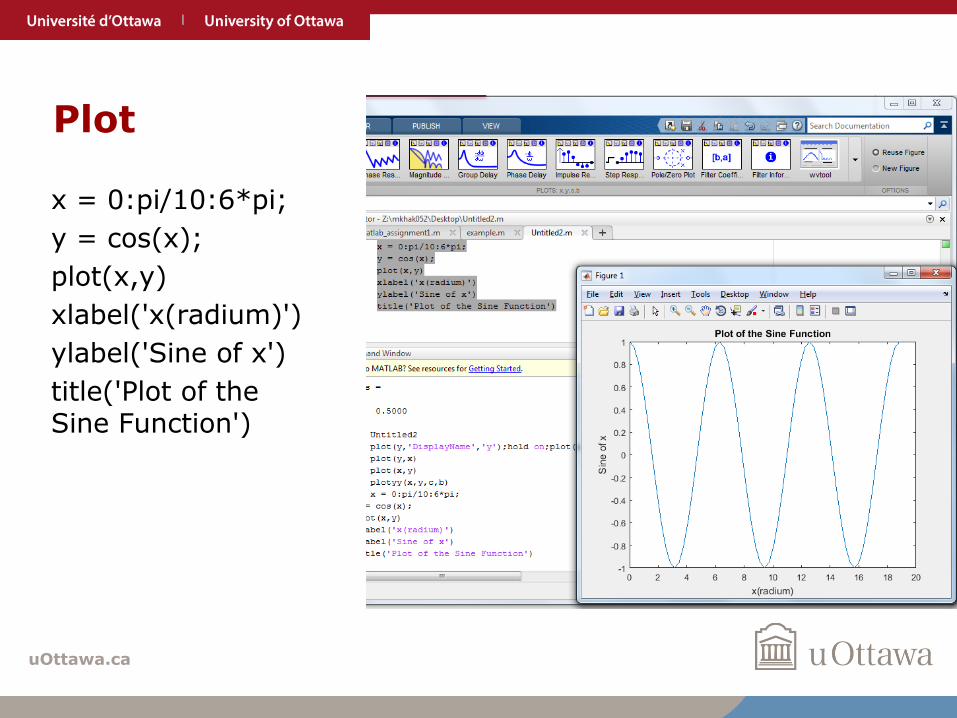
Plot
x = 0:pi/10:6*pi;
y = cos(x);
plot(x,y)
xlabel('x(radium)')
ylabel('Sine of x')
title('Plot of the Sine Function')
uOttawa.ca
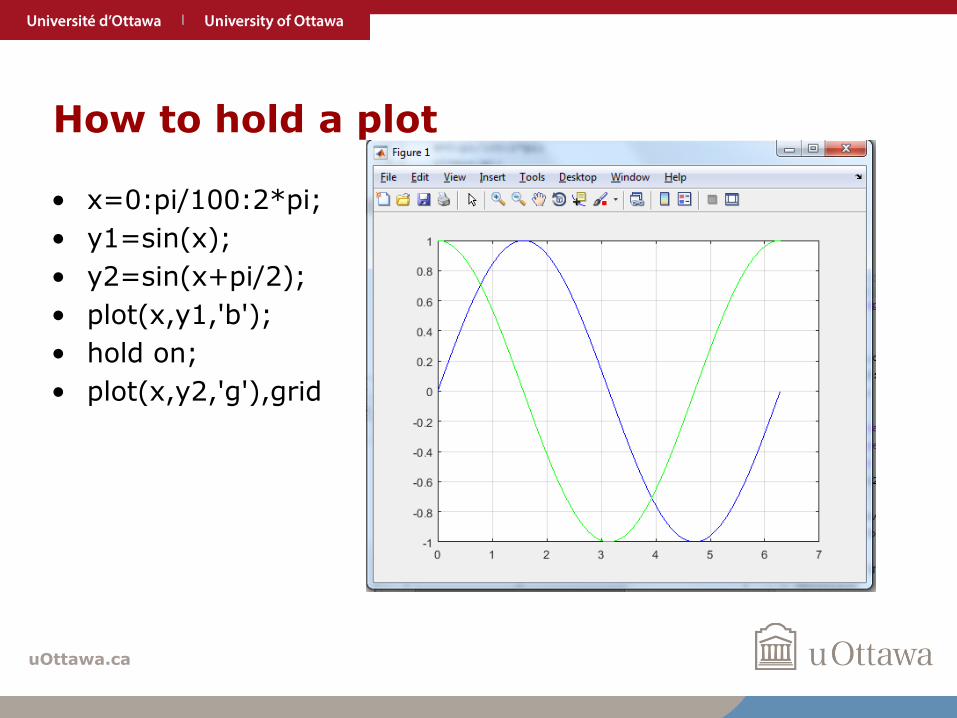
How to hold a plot
• x=0:pi/100:2*pi;
• y1=sin(x);
• y2=sin(x+pi/2);
• plot(x,y1,'b');
• hold on;
• plot(x,y2,'g'),grid
uOttawa.ca
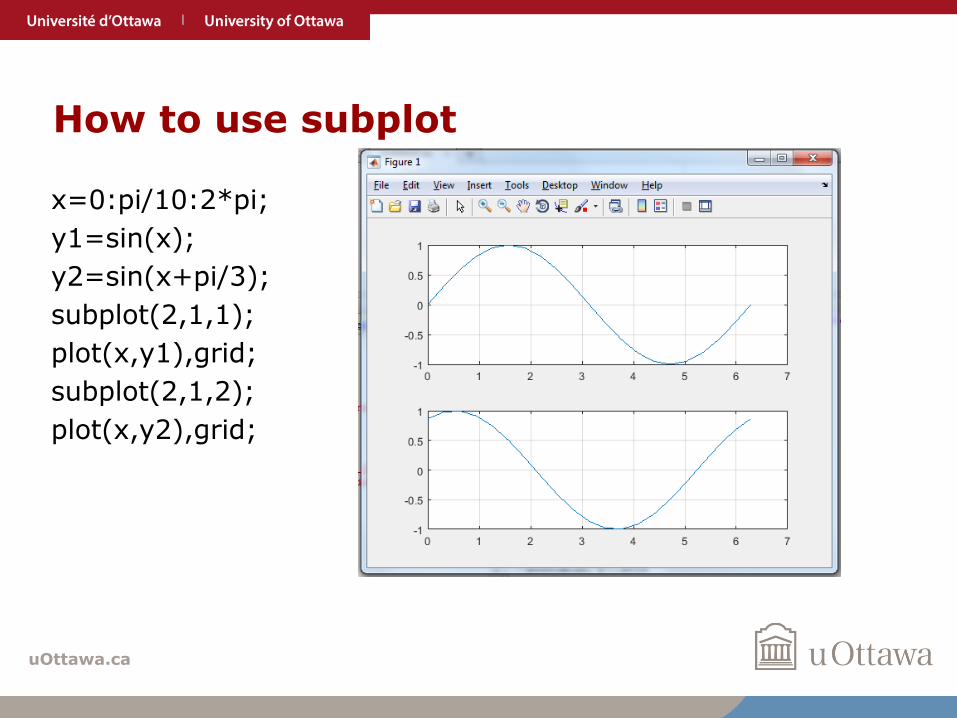
How to use subplot
x=0:pi/10:2*pi;
y1=sin(x);
y2=sin(x+pi/3);
subplot(2,1,1);
plot(x,y1),grid;
subplot(2,1,2);
plot(x,y2),grid;
uOttawa.ca
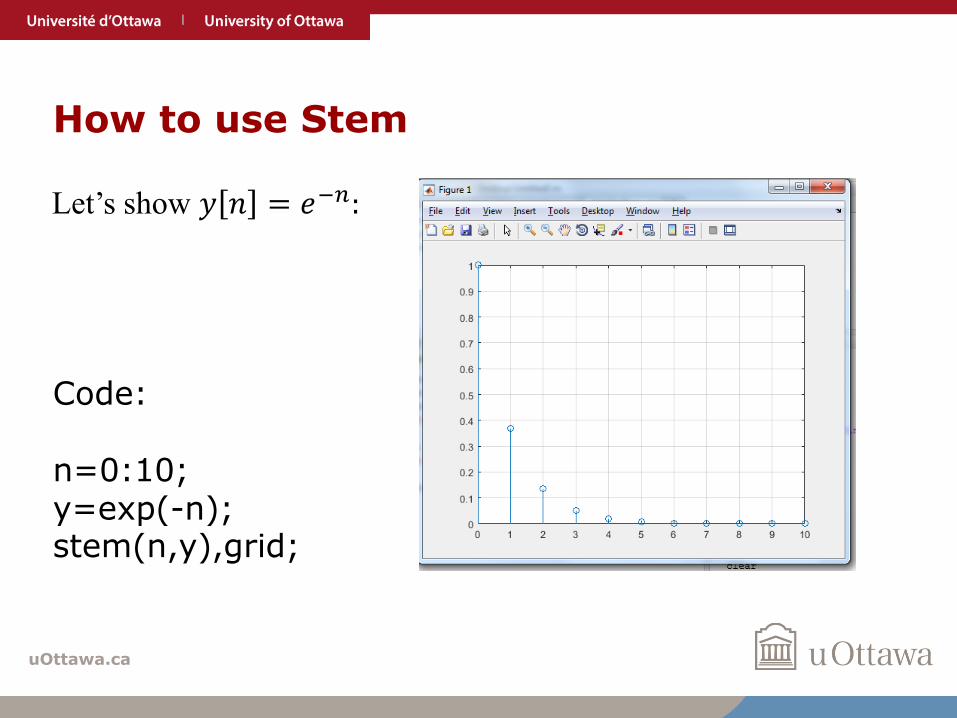
How to use Stem
Code:
n=0:10;y=exp(-n);stem(n,y),grid;
Let’s show 𝑦 𝑛 = 𝑒−𝑛:
uOttawa.ca
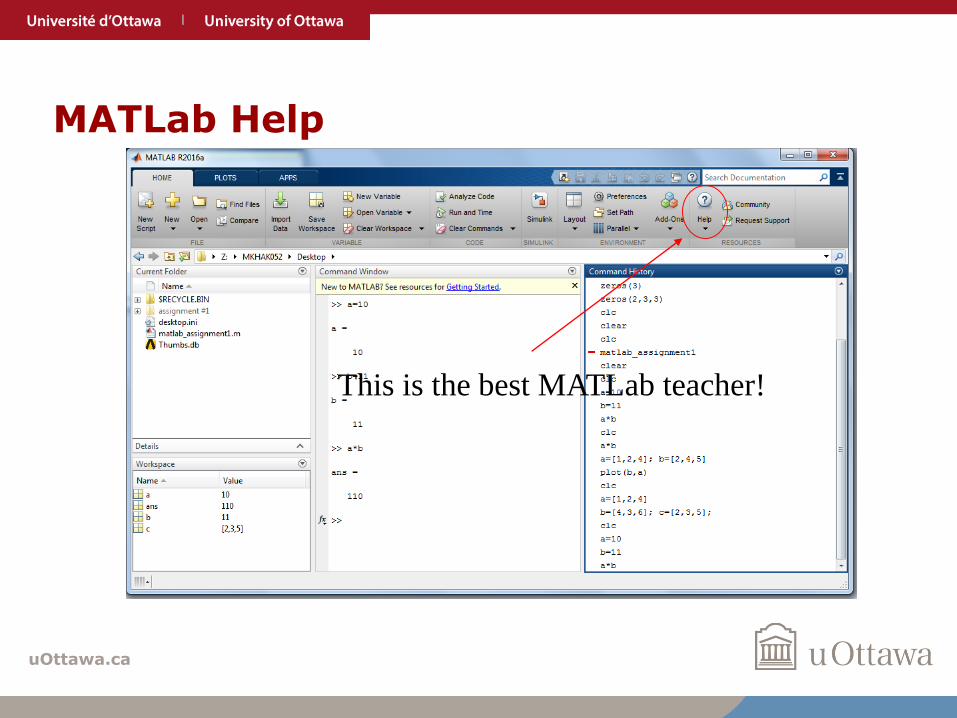
MATLab Help
This is the best MATLab teacher!
uOttawa.ca
Exercise
• Set up matrix A of 5x4,matrix B of 4x2; do multiplication C=A*B with dot and without dot behind.
• Set up two matrices of 3x4, do multiplication, addition, subtraction with element-by-element operation.
• Plot y=sin(x)+cos(x+pi/3) specify the range of x with colon. The plot needs x label, y label, title, red color, grid.

uOttawa.ca
Thank you!