Embed Size (px)
Citation preview
DELIBERATE DISENGAGEMENT: HOW EDUCATIONDECREASES POLITICAL PARTICIPATION IN
ELECTORAL AUTHORITARIAN REGIMES ⇤
KEVIN CROKE †
GUY GROSSMAN ‡
HORACIO A. LARREGUY §
JOHN MARSHALL ¶
JANUARY 2015
A large literature examining advanced and consolidating democracies suggests that ed-ucation increases political participation. However, in electoral authoritarian regimes,educated voters may instead deliberately disengage. If education increases criticalcapacities, political awareness, and support for democracy, educated citizens maybelieve that participation is futile or legitimates autocrats. We test this argumentin Zimbabwe—a paradigmatic electoral authoritarian regime—by exploiting cross-cohort variation in access to education following a major educational reform. We findthat education decreases political participation, substantially reducing the likelihoodthat better-educated citizens vote, contact local councilors, or attend community meet-ings. Consistent with deliberate disengagement, education’s negative effect on par-ticipation dissipated following 2008’s more competitive election, which (temporarily)initiated unprecedented power sharing. Supporting the mechanisms underpinning thedisengagement hypothesis, educated citizens experience better economic outcomes,are more interested in politics, and are more supportive of democracy, but are alsomore likely to criticize the government and support opposition parties.
⇤This article benefited from helpful conversations with, and suggestions from, Karen Grepin, Patrick O’Halloran,Marc Meredith, and participants at the Boston Working Group in African Political Economy.
†Department of Global Health and Population, Harvard School of Public Health, Boston, MA([email protected]).
‡Department of Political Science, University of Pennsylvania, Philadelphia, PA ([email protected]).§Department of Government, Harvard University, Cambridge, MA ([email protected]).¶Department of Government, Harvard University, Cambridge, MA ([email protected]).
1
Introduction
The question of what motivates political participation is central to political science. Participation
is essential for holding governments to account, and for influencing incumbents to implement the
policies that citizens demand. A vast literature asserts that education is a major driver of political
participation, as well as many other forms of non-contentious civic action (Almond and Verba,
1963). La Due Lake and Huckfeldt (1998, 567) argue that the positive relationship between educa-
tion and political participation is “one of the most reliable results in empirical social science.” In a
similar vein, Hillygus (2005, 25) states that the idea that education is a primary driver of increased
political participation is “largely uncontested,” while Putnam (1995, 68) posits that education “is
the best individual level predictor of participation.”
There are, however, several problems with these law-like assertions. First, isolating the effect
of education—as distinct from innate ability (Spence, 1973), socioeconomic status (Jennings and
Niemi, 1968), or family background (Nie, Junn and Stehlik-Barry, 1996)—on political participa-
tion is a formidable challenge. Debates between “education as cause” versus “education as proxy”
remain far from settled (Berinsky and Lenz, 2011; Kam and Palmer, 2008). Second, with few
exceptions, the existing empirical literature investigating the causal link between education and
political participation has generally focused on a small set of rich advanced democracies (Sond-
heimer and Green, 2010). This is problematic, because existing accounts of the positive effect of
education on participation implicitly assume that countries have an institutional environment and
a civic culture that might be absent in many developing countries.
Third, analyses in developing countries have primarily focused on aggregate correlations be-
tween education and the likelihood that autocratic regimes transition to democracy.1 Here too,1See Acemoglu et al. (2005), Barro (1999), and Murtin and Wacziarg (2014). See Glaeser,
Ponzetto and Shleifer (2007) for the role of education in consolidating democracy. A small lit-erature has instead examined education’s effect on violent forms of protest (Campante and Chor,2012a; Samii and West, 2014).
2
scholars, especially those associated with modernization theory, have long assumed that educa-
tion is a critical driver of political participation. For example, Deutsch (1961) and Lerner (1958)
stipulated that more-educated citizens are key to generating pressure for greater citizen inclusion,
and Lipset (1959) has argued that more-educated citizens engage in the political actions necessary
to sustain representative governments. Indeed, Huntington (1991) has explicitly claimed that ed-
ucation contributed to the “Third Wave of Democratization” in the 1970s and 1980s. Given that
the nature of dictatorial regimes has dramatically changed over the past two decades (Schedler,
2013), and considering the dearth of individual-level analyses in the study of the democratization-
education nexus, the nature of the relationship between education and non-violent political partic-
ipation in present-day electoral authoritarian settings remains poorly understood.
We address this gap in the literature by examining the causal relationship between education
and non-contentious political participation under electoral authoritarianism. Electoral authoritar-
ian regimes are a hybrid: while they permit some popular participation and elite contestation by
holding periodic elections, they fall a long way short of genuine democracy. In such regimes,
elections—while not purely pro forma—are far from fair, the government is almost assured of
remaining in power, and many other forms of political action are closely monitored (and often
limited by) the regime (Levitsky and Way, 2010). What political role do more-educated citizens
play in such contexts? We argue that the positive relationship between education and political
participation does not fenecessarily apply in electoral authoritarian settings. We further argue that
in electoral authoritarian regimes, education can be associated with decreased political participa-
tion, even when education—as modernization theorists have long assumed—increases interest in
politics, support for democratic institutions, and the resources needed to meaningfully engage in
political action.
Political participation in democratic settings can be understood as the embodiment of the liberal
notion of free will (Rousseau, 1997). The act of voting, in particular, has been viewed as a manifes-
tation of the democratic ideals of political equality and individual agency (Lijphart, 1997). Yet in
3
many non-democratic settings, quintessential political actions such as voting cannot necessarily be
viewed as the exercise of free will. Indeed, various forms of participation in electoral authoritarian
settings are designed to mobilize citizens to demonstrate allegiance to the regime rather than to
aggregate societal preferences or enable citizen voice (Hermet, 1978). Elections in many electoral
authoritarian regimes are not designed to allow citizens to freely elect their leaders, but rather to
provide incumbents with a facade of legitimacy, appease the international community, and demon-
strate the omnipresence of the regime (Levitsky and Way, 2002). Under such conditions, political
participation loses both its normative and instrumental appeals for many.
When participation does not provide genuine input into the political process, or when it merely
serves to buttress the regime, refraining from political participation can serve as a powerful form of
dissent (Hermet, 1978; Karklins, 1986) or reflect the recognition that costly political action is futile
(Posner and Simon, 2002). This study’s key insight is that more-educated citizens are more likely
to exercise such deliberate political disengagement. First, education imbues citizens with cognitive
abilities that facilitate more critical thinking, which may result in lower levels of support for the in-
cumbent regime and thus less interest in legitimizing it with their participation.2 Second, education
may similarly lead to value change, with more-educated individuals placing a higher premium on
democratic values such as self-expression and individual voice than on social conformity (Inglehart
and Welzel, 2005). Third, if education also increases knowledge and understanding of politics, ed-
ucated voters may be more aware that political participation is unlikely to affect political outcomes.
Fourth, educated individuals may feel a higher level of disillusionment with autocratic politics and
economic mismanagement, given their greater economic potential (Campante and Chor, 2012b).
We test our disengagement argument using the case of Zimbabwe, a paradigmatic electoral
authoritarian regime ruled by President Mugabe and a civilian-military junta (Levitsky and Way,
2010). While elections have been held regularly since 1980, the incumbent regime has used a2E.g. educated citizens may be able to critically evaluate regime propaganda, or may have the
interest or financial means to access more critical foreign media.
4
combination of intimidation, violence, manipulation of legal rules, and vote rigging to ensure that
the opposition could not take power.3 Thus, as in many electoral authoritarian regimes, elections
in Zimbabwe provide some restricted opportunities for public opinion to be registered, without
offering voters a genuine ability to determine the ultimate distribution of power. The 2008 election
became more competitive, ultimately producing a power-sharing executive between Mugabe and
opposition leader Morgan Tsvangirai, and thus presents a valuable opportunity to compare the
effects of education during more and less politically competitive contexts.
Furthermore, Zimbabwe is an excellent case study because we are able to leverage a major
policy reform to identify the causal relationship between education and participation. Immediately
after majority rule was achieved in 1980, Zimbabwe implemented a far-reaching education reform
that greatly increased access to education. The reform, which removed or significantly reduced
progression requirements, as well as geographic and financial constraints, substantially increased
access to secondary education for black students and induced some students to remedially attend
primary school. We exploit this natural experiment to analyze the effects of education by compar-
ing cohorts that were just young enough to enjoy greater access to secondary education to those
that were just too old. To allow for non-compliance across cohorts, we also estimate instrumental
variable (IV) regressions.
Our primary result is that, in Zimbabwe, education reduces levels of political participation.
Contrary to the conventional wisdom, a higher level of education reduces not only voting, but
also other forms of non-contentious participation such as contacting one’s local councilor and at-
tending community meetings. Consistent with our argument that non-participation appears to be
an informed choice by relatively cognizant and politically aware citizens, we find that education
still significantly increases economic well-being, interest in politics, and support for democracy.
Furthermore, consistent with the idea that education facilitates critical thinking, we also find that3Members of the ruling party, the Zimbabwe African National Union–Patriotic Front (ZANU-
PF), “believe that ZANU-PF has a right to rule in perpetuity and thus will never recognize anopposition victory at the polls” (Bratton and Masunungure, 2008, 43).
5
increased education decreases support for the ruling party, reduces perceptions of government per-
formance, and increases support for the main opposition party. Finally, consistent with the idea that
educated citizens will re-engage with politics when the political sphere allows for more meaning-
ful contestation, we show that the large negative relationship between education and participation
weakens significantly after the 2008 election. Together, we interpret these findings as evidence
that educated citizens consciously choose to withdraw from the political sphere under electoral
authoritarianism.
To increase confidence in our interpretation of these results, we examine two plausible alterna-
tive explanations for our findings. First, we rule out the possibility that more-educated constituents
are less integrated into patronage or vote buying mobilization networks, which could also lead to
lower turnout. Second, we show that there is no evidence in our data that educated constituents are
more likely to face violent repression intended to suppress participation.
This article’s main contribution is to the vast literature on the relationship between education
and political participation. Notwithstanding the centrality of education in political theories of
democratic citizenship, much is still unknown about the nature of the relationship between educa-
tional attainment and political attitudes and behavior. If education reduces political participation in
electoral authoritarian regimes, this provides an additional qualification to the literature that com-
monly assumes a law-like positive relationship.4 We show that education increases the ability of
citizens to participate in politics, and leads to greater interest in politics. However, our findings
also suggest that whether citizens decide to use these facilities or “deliberately withdraw” from
the political arena is likely to depend on systemic attributes—specifically, whether the regime is
sufficiently democratic and receptive to bottom-up input.
The article also contributes to the literature on political participation in developing countries,
especially that which focuses on attitudes rather than resources as the key determinant of participa-4See Berinsky and Lenz (2011, 328-360) for a comprehensive review of recent challenges to
the traditional view that education has an uniform positive effect in the American context.
6
tion. For example, Cox (2003) and Norris (2002) find a positive association between institutional
trust and voter turnout, and Kasara and Suryanarayan (2014) show that voter turnout for higher-
resource constituents depends on both the state’s taxation capacity and the congruence of voters’
political preferences with those of the poor. Our results also challenge a body of work that argues
that education serves as a tool of indoctrination and social control that instills obedience to au-
thority (Lott, 1999). Our findings suggest instead that education supports critical thinking, which
can lead citizens in political settings such as Zimbabwe’s to oppose authority that is perceived as
illegitimate.
Finally, our results demonstrate that the impact of education might be conditional on a coun-
try’s level of political contestation, which speaks to a growing cross-country literature that seeks
to isolate the impact of education on democracy (Acemoglu et al., 2005; Glaeser, Ponzetto and
Shleifer, 2007; Woodberry, 2012). By discussing why those deemed by modernization theorists
as ‘agents of change’ withdraw from politics, this paper also suggests one reason why—contrary
to the expectation of the democratic transition literature—many countries that took initial steps
towards liberalization got “stuck” in electoral authoritarian equilibria (Carothers, 2002). As such,
our findings also contribute to our understanding of regime stability and change theories.
Related Literature
The relationship between education and political participation in advanced democracies is the sub-
ject of a vast literature. Whereas early work suffered from insufficient attention to causal iden-
tification, a number of recent studies have credibly identified a positive effect of education on
political participation in the developed world.5 The study of the effect of education in developing5Causal evidence for a positive relationship in developed countries includes Dee (2004), Hen-
derson and Chatfield (2011), Persson (2011), and Sondheimer and Green (2010). Nevertheless,Berinsky and Lenz (2011), Kam and Palmer (2008), and Tenn (2007) provide evidence that not alltypes of schooling intervention increase political participation.
7
countries is less developed, and still suffers, for the most part, from insufficient attention to causal-
ity.6 Furthermore, none of the recent studies that attempt to identify a causal relationship between
education and participation in a developing country have examined this question in the context of
a repressive electoral authoritarian regime.
Friedman et al. (2011) use a field experiment in Western Kenya to study the effect of an in-
crease in education induced by a secondary school girls scholarship program. They find that
secondary education made young women from disadvantaged ethnic groups in rural areas more
politically informed, less deferential to political authority, and more likely to reject gender-biased
violence. They do not find, however, that secondary education increases support for democracy,
community participation, political efficacy, or voting. Despite its innovative design, the study only
measures outcomes 4-5 years after initial enrollment and examines an unrepresentative population.
Given the comprehensiveness of Zimbabwe’s education reform, we are able to identify mass pub-
lic education’s long-term effects for a wide range of compliers (from a representative sample) that
small-scale field experiments cannot reach.
Our findings speak most directly to two recent working papers that examine the long-term po-
litical effects of education. Wantchekon, Novta and Klasnja (2013) use the placement of the first
missionary schools in Benin as a plausible source of exogenous variation in access to education.
They find that both the first generation of formally educated Beninois and their descendants are
more likely to join and campaign for political parties. Wantchekon, Novta and Klasnja (2013) do
not, however, report results regarding voting behavior and political attitudes, perhaps since their
main focus is education’s effect on well-being. Larreguy and Marshall (2014) exploit Nigeria’s
1976 education reform to show that increased educational attainment causes more political par-
ticipation in the form of voting, contacting local officials, attending community meetings, and
devoting attention to and learning about political events.
While the above papers arguably identify the impact of education on political participation, they6See Kuenzi (2006), Kuenzi and Lambright (2005), and MacLean (2011).
8
● ● ● ● ● ● ●
● ● ● ● ● ● ●
● ● ●
● ● ● ● ●
● ● ●
● ● ●
● ● ● ● ● ● ● ● ● ● ● ● ● ●
● ●
● ● ● ● ● ● ● ●
● ● ● ●
−8
−7
−6
−5
−4
−3
−2
−1
0
1
2
3
4
5
6
7
8
1999 2001 2003 2005 2007 2009 2011
Polity2
countryname●
●
●
●
BeninKenyaNigeriaZimbabwe
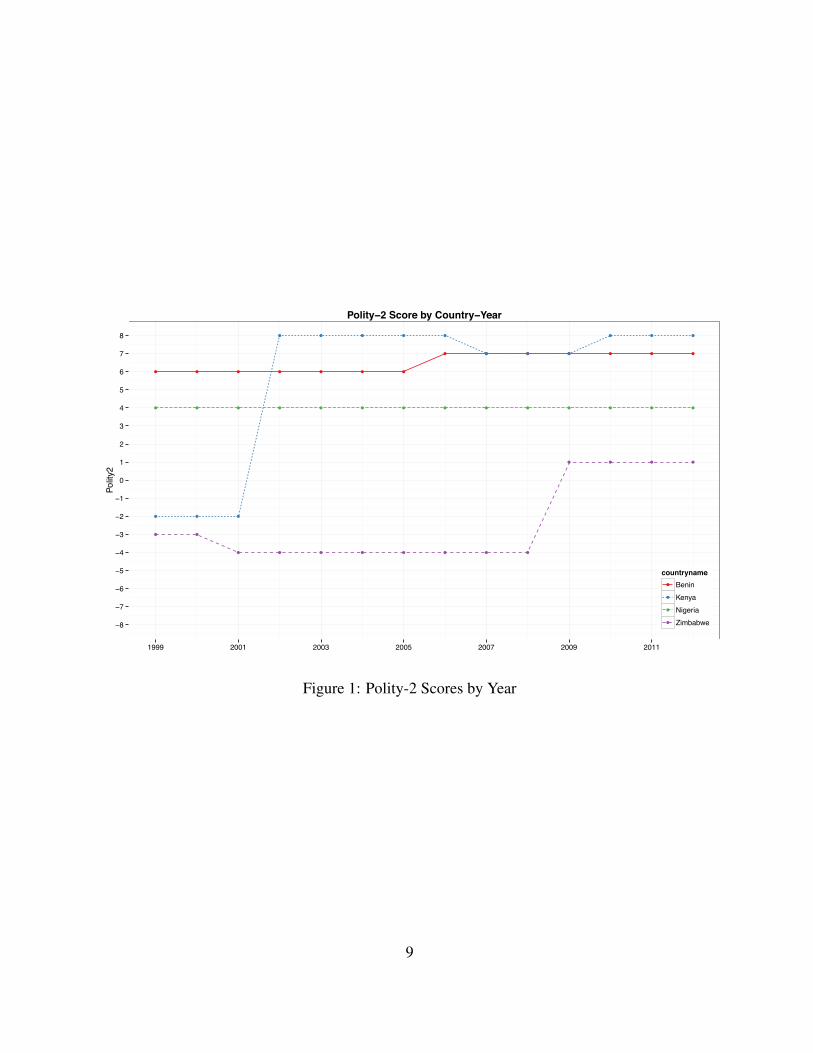
Polity−2 Score by Country−Year
Figure 1: Polity-2 Scores by Year
9
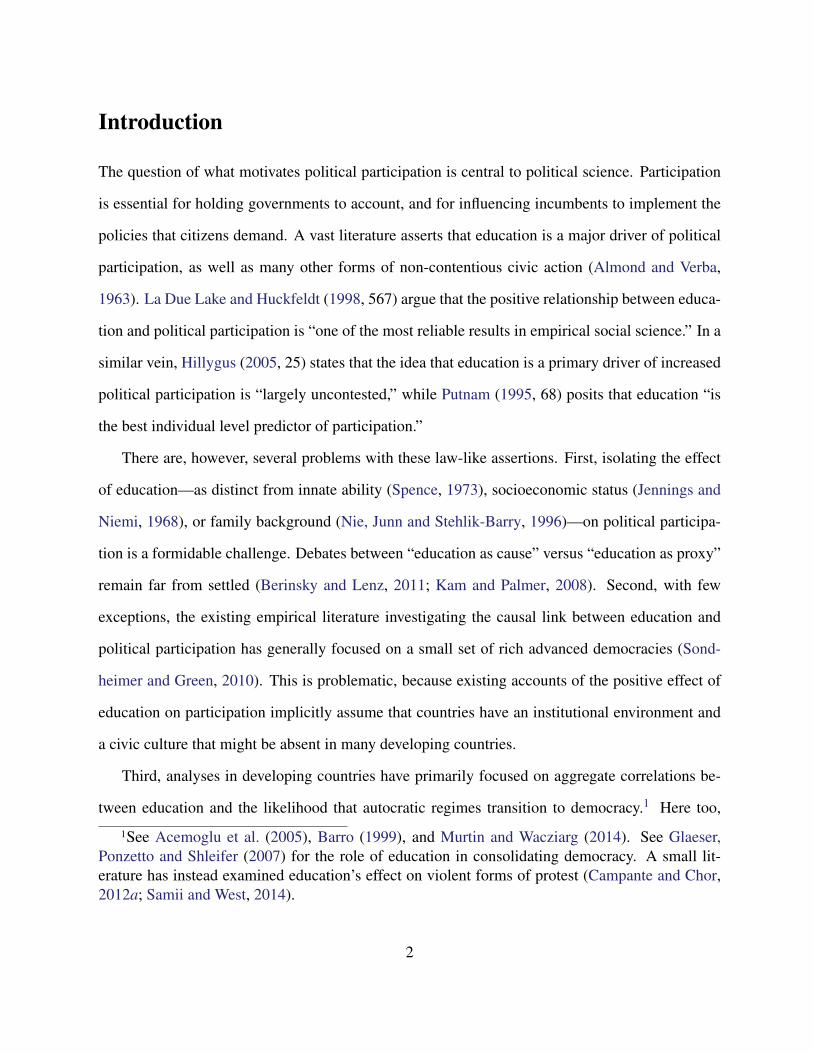
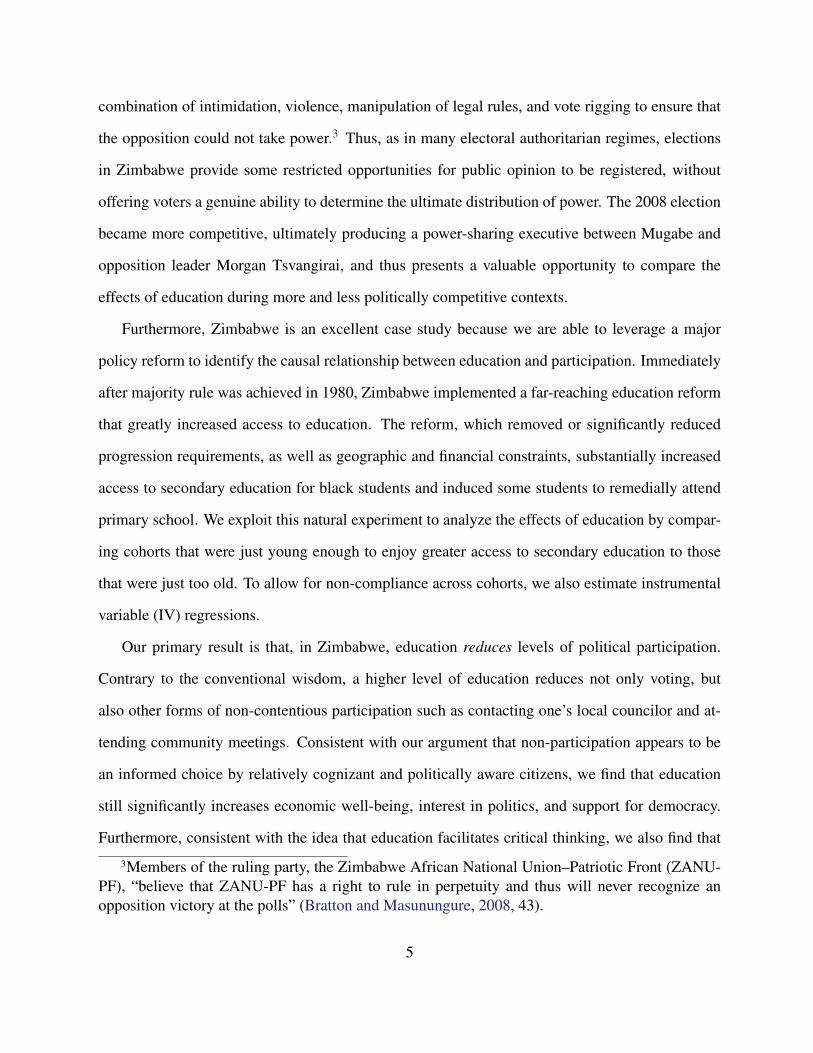
all examine this relationship in contexts of genuine political contestation. While Benin, Kenya,
and Nigeria cannot be classified as consolidated democracies, they have experienced competitive
elections and turnovers of executive power since adopting far-reaching liberalization reforms.7
Zimbabwe, by contrast, has had no alternation in executive power since majority rule was achieved
in 1980, and election rigging has been widespread since 2002. These differences are reflected, for
example, in Zimbabwe’s Polity-2 score, which is significantly lower than those of Kenya, Benin,
and Nigeria during the period covered by the Afrobarometer (see Figure 1). Nevertheless, the level
of contestation in Zimbabwe is not constant: the increase in the Polity score following the 2008
election reflects an important period of power sharing in which genuine change appeared possible.
Politics and Secondary Education in Zimbabwe
Zimbabwe (then known as Rhodesia) was a British colony for much of the 20th century, with
a small white settler elite, a large black African majority, and an apartheid-like set of institutions
that ensured white dominance of political and economic life. In 1965, as the wave of independence
swept through the African continent, the white settler-led government declared independence from
Britain in order to prolong its domination of the country. Armed resistance to white rule began
in the mid-1960s and intensified after 1972, finally resulting in free elections and black majority
rule in 1980. Robert Mugabe, Zimbabwe’s first post-independence head of state, still serves as
president.
In contrast to dire predictions from the outgoing white-dominated regime, economic growth in
the first years of majority rule was relatively strong, enabling Mugabe’s new Zimbabwe African
National Union (ZANU) government to dramatically expand access to health, education, and pub-
lic services to the previously disenfranchised black population. However, political conflict between7Benin and Kenya have had electoral transitions between the former ruling party and opposition
parties. In Nigeria, presidential power has alternated between northerners and southerners withinthe ruling party since the return to democracy in 1999.
10
the two main independence movements quickly emerged; ZANU began a campaign of bloody re-
pression against its rival, the Zimbabwe African People’s Union (ZAPU), in 1983 (Bourne, 2011;
Bratton, 2014). A truce brokered in 1987 merged the two parties into “ZANU-PF,” and the con-
stitution was changed from a parliamentary to a presidential system with a strong executive office,
held by Mugabe. These changes facilitated ZANU-PF political domination throughout the 1990s:
Mugabe won 78% and 93% of the vote in the 1990 and 1996 presidential elections, respectively,
while ZANU-PF won 117 out of 120 seats in the 1995 parliamentary election (Levitsky and Way,
2010).
Opposition to Mugabe’s increasingly autocratic rule began to crystallize only in the late 1990s,
when labor, religious, and civil society groups mobilized around the goal of introducing a new con-
stitution with term limits. These groups eventually formed Zimbabwe’s main opposition party, the
Movement for Democratic Change (MDC). Mugabe responded by proposing a new constitution,
which was defeated in a referendum in 2000. Later that year, the MDC won an unprecedented 58
out of 120 seats in parliament.8
Rather than heralding a democratizing turn, these surprising results drove Mugabe to secure
his position by increasing both political repression and the use of state resources to buy politi-
cal support. In 2001, for example, he dispossessed white farmers via land invasions and handed
their farms over to ZANU-PF allies. In the 2002 presidential elections, Mugabe defeated Morgan
Tsvangirai—the MDC presidential candidate—with 56% of the vote amid violence and widespread
vote suppression, especially in MDC areas (LeBas, 2006). Immediately after the 2005 parliamen-
tary elections, in which ZANU-PF won 65% of the parliamentary constituencies against an inter-
nally divided MDC (Bratton, 2014), Mugabe launched Operation Murambatsvina (“Drive Out the
Rubbish”), which displaced over 700,000 people from informal urban settlements (which were of-
ten MDC strongholds). Amid agricultural collapse and macroeconomic instability, hyperinflation8At the time, Zimbabwe’s parliament had 150 seats, 30 of which were directly appointed by
Mugabe. Thus ZANU-PF still had a large working majority despite the close election result.
11
emerged and reached 1,281% in 2006 and 231,000,000% in 2008 (Bratton, 2014, 84).
The opposition was more unified in the lead-up to the 2008 elections. Benefiting from (ini-
tially) lower levels of election-related violence than in 2002 (Levitsky and Way, 2010), the MDC
won an outright parliamentary majority in the 2008 election, as well as the majority of munici-
pal councils. Tsvangirai outpolled Mugabe in the first round of the presidential election, but the
electoral commission stated that he did not achieve the 50% threshold required for victory (the
official total was 48% for Tsvangirai vs. 43% for Mugabe). Prior to the second round, ZANU-PF
and the military launched a brutal campaign of intimidation and beatings against MDC supporters
and candidates, and Tsvangirai withdrew from the race. Mugabe won the resulting sham election
by a landslide, but international pressure forced a government of national unity, with Mugabe as
president and Tsvangirai as prime minister (LeBas, 2014).
The national unity government and the end of hyperinflation allowed the economy to rebound
somewhat after 2009, and political violence declined. Nevertheless, although the MDC chose the
National Assembly speaker and controlled several ministries, ZANU-PF retained control of key
coercive institutions such as the police and military. Moreover, the MDC was politically weak-
ened by growing internal divisions and the loss of moral authority implied by sharing power with
ZANU-PF. This facilitated the return of ZANU-PF dominance (LeBas, 2014). The 2013 elections,
reported to have been less violent than previous elections, ended the power-sharing agreement as
Mugabe comfortably beat Tsvangirai and won 70% of parliamentary seats.
The Education Reform of 1980
Prior to independence, access to education for the black community was deliberately restricted.
While schooling was compulsory and free for whites (until age 15), black Zimbabweans—who
were not required to attend school—had to pay high school fees. In addition, black Zimbab-
weans were required to pass a series of increasingly difficult exams in order to continue past pri-
mary school, while continuation to the first cycle of secondary school was automatic for whites.
12
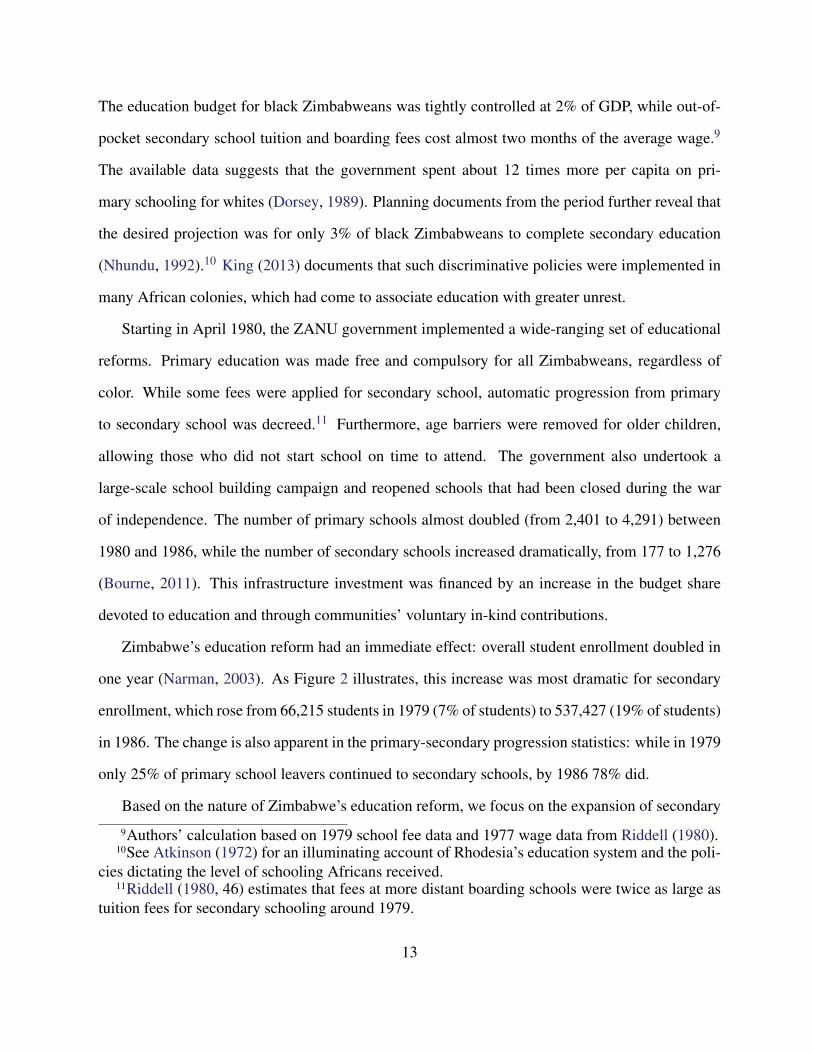
The education budget for black Zimbabweans was tightly controlled at 2% of GDP, while out-of-
pocket secondary school tuition and boarding fees cost almost two months of the average wage.9
The available data suggests that the government spent about 12 times more per capita on pri-
mary schooling for whites (Dorsey, 1989). Planning documents from the period further reveal that
the desired projection was for only 3% of black Zimbabweans to complete secondary education
(Nhundu, 1992).10 King (2013) documents that such discriminative policies were implemented in
many African colonies, which had come to associate education with greater unrest.
Starting in April 1980, the ZANU government implemented a wide-ranging set of educational
reforms. Primary education was made free and compulsory for all Zimbabweans, regardless of
color. While some fees were applied for secondary school, automatic progression from primary
to secondary school was decreed.11 Furthermore, age barriers were removed for older children,
allowing those who did not start school on time to attend. The government also undertook a
large-scale school building campaign and reopened schools that had been closed during the war
of independence. The number of primary schools almost doubled (from 2,401 to 4,291) between
1980 and 1986, while the number of secondary schools increased dramatically, from 177 to 1,276
(Bourne, 2011). This infrastructure investment was financed by an increase in the budget share
devoted to education and through communities’ voluntary in-kind contributions.
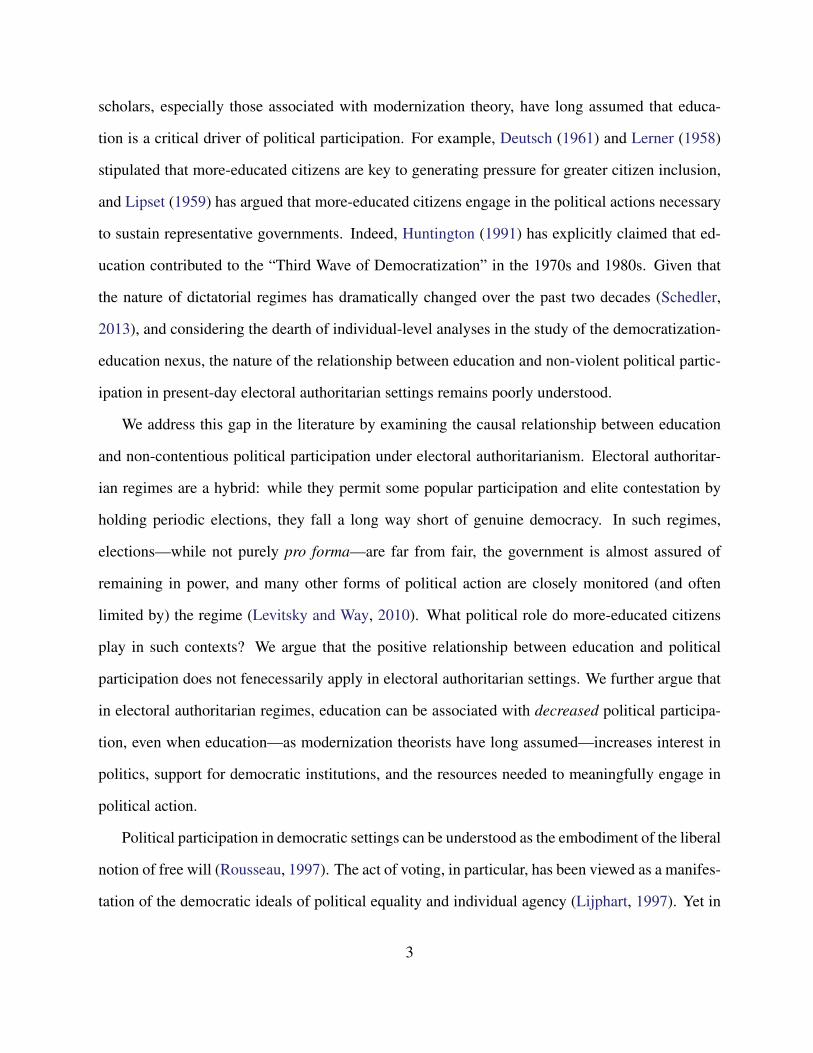
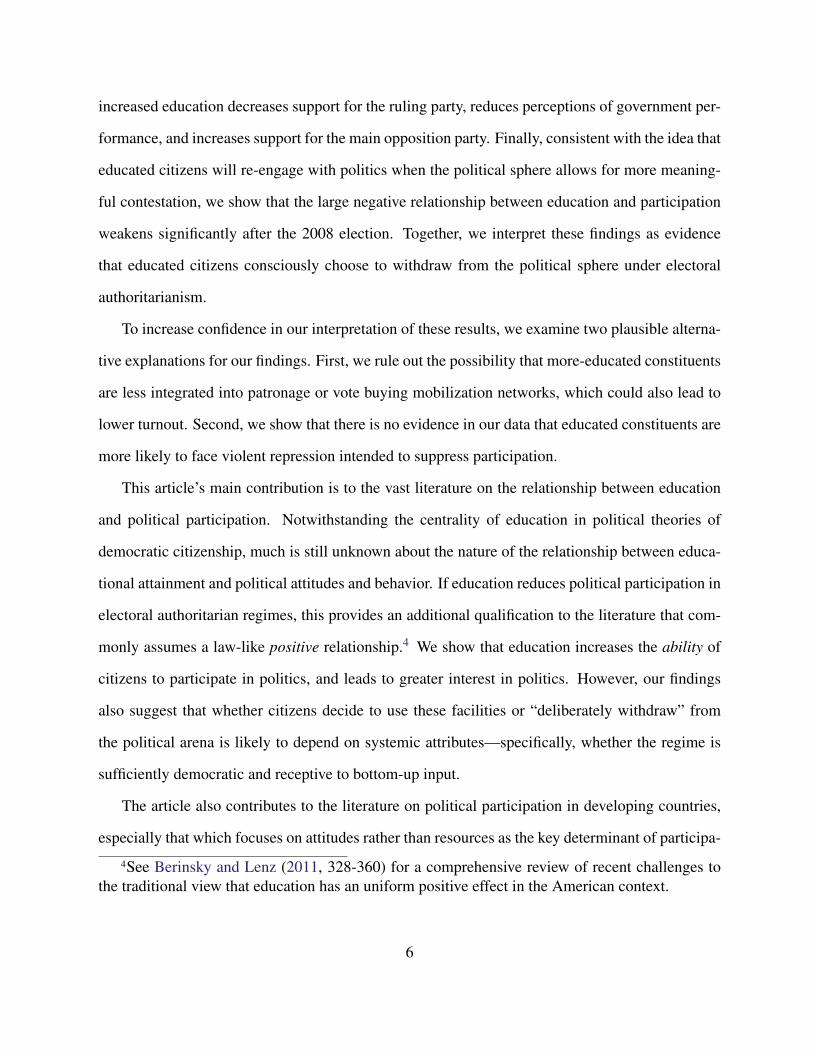
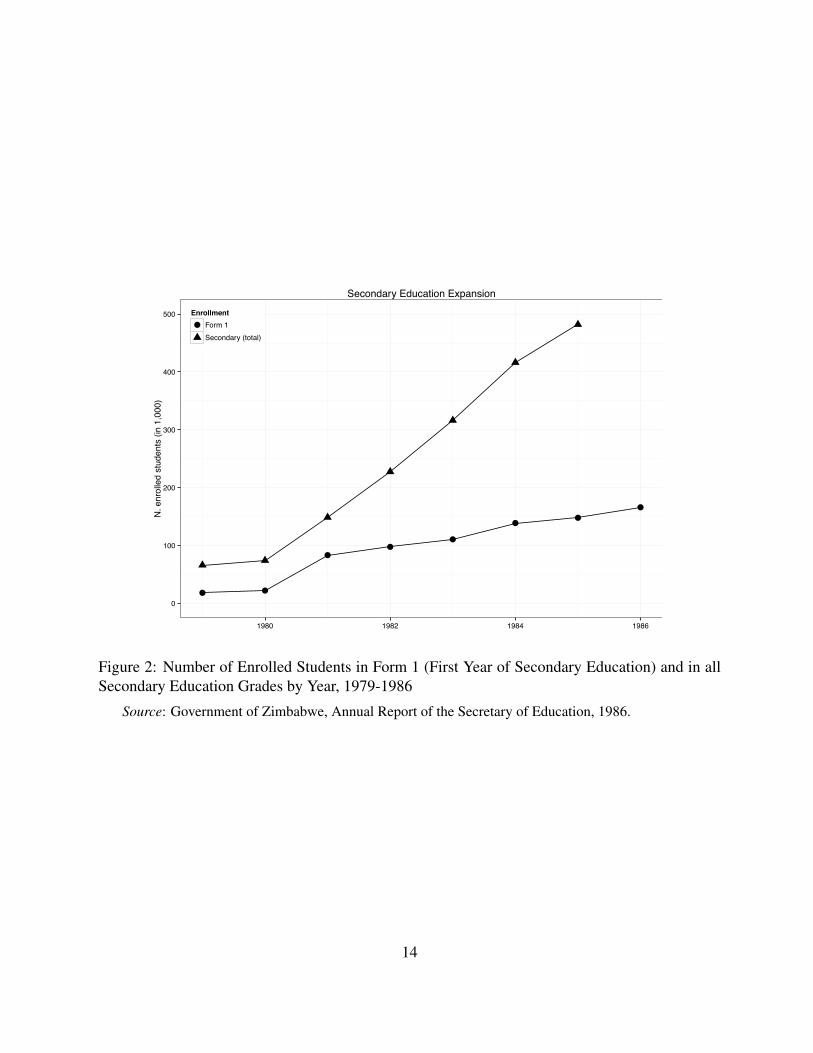
Zimbabwe’s education reform had an immediate effect: overall student enrollment doubled in
one year (Narman, 2003). As Figure 2 illustrates, this increase was most dramatic for secondary
enrollment, which rose from 66,215 students in 1979 (7% of students) to 537,427 (19% of students)
in 1986. The change is also apparent in the primary-secondary progression statistics: while in 1979
only 25% of primary school leavers continued to secondary schools, by 1986 78% did.
Based on the nature of Zimbabwe’s education reform, we focus on the expansion of secondary9Authors’ calculation based on 1979 school fee data and 1977 wage data from Riddell (1980).
10See Atkinson (1972) for an illuminating account of Rhodesia’s education system and the poli-cies dictating the level of schooling Africans received.
11Riddell (1980, 46) estimates that fees at more distant boarding schools were twice as large astuition fees for secondary schooling around 1979.
13
● ●
●●
●
●●
●
0
100
200
300
400
500
1980 1982 1984 1986
N. e
nrol
led
stud
ents
(in
1,00
0)
Enrollment● Form 1
Secondary (total)
Secondary Education Expansion
Figure 2: Number of Enrolled Students in Form 1 (First Year of Secondary Education) and in allSecondary Education Grades by Year, 1979-1986
Source: Government of Zimbabwe, Annual Report of the Secretary of Education, 1986.
14
education.12 Although primary school fees were formally banned, the reform did not significantly
affect primary educational attainment. This is likely because 80% of black Zimbabweans were
already enrolled in primary school even under white rule, and because some primary schools con-
tinued charging informal fees (Nhundu, 1992). Had the 1980 reforms significantly affected pri-
mary enrollment, we would observe a sharp discontinuity in education for the cohorts of primary
school starting age in 1980, i.e., those born from 1972-74. However, we find no evidence of a dis-
continuity around those birth years (see Figure 5 below).13 The reform’s small effect on primary
school completion principally reflects the remedial education of individuals whose education was
interrupted by the war (Narman, 2003).14
Analysts of Zimbabwe’s education reforms note that, given the rapid expansion, qualified
teachers could not be hired quickly enough, instructional quality often suffered, and school con-
struction lagged behind enrollment, leading to overcrowded classrooms.15 While some slippage in
quality was perhaps inevitable given the speed of the reform, it remained high enough to deliver
substantial material benefits to the reform’s beneficiaries, as we demonstrate below. Notwith-
standing these challenges, Zimbabwe was widely recognized as a leader in expanding access to
education in Africa during the 1980s (Dorsey, 1989).12Aguero and Bharadwaj (2014) and Grepin and Bharadwaj (2014) similarly restrict their focus
to secondary school access.13Similarly, there is no discontinuous change in education levels for primary-school aged cohorts
for the 1972-74 cohorts in the Demographic and Health Surveys data. See, for example, Grepinand Bharadwaj (2014).
14This was facilitated by a program allowing teenagers to return to complete primary school onan abbreviated three-year schedule (Chung, 2006, 228).
15A construction lag could potentially violate our identification assumption if, for example, thelag was correlated with unobserved features of areas that are also correlated with support for theregime. Aguero and Ramachandran (2014), who use a similar identification strategy for healthoutcomes, show that while some districts indeed opened schools sooner than others, by 1983 alldisparities were eliminated. Comparing the educational attainment of those born in districts inwhich secondary schools opened “earlier” to those born in districts that opened schools “later”shows no difference. Furthermore, Chung’s (2006, 272) first-hand account suggests that Ministryof Education technocrats resisted pressure from politicians to build schools based on political con-siderations.
15

In sum, Zimbabwe has undergone two dramatic social and political processes in the past 30
years. First, its expansive education reform reached its peak in the early 1990s. Second, its po-
litical transformation has been characterized by an increasingly repressive political order. These
transformations provide a unique setting in which to examine the role of education in electoral au-
thoritarian regimes that allow some restricted political contestation, but that are also characterized
by social and economic vulnerability, opposition intimidation, and political violence.
Research Design
In this section we discuss the data sources, identification strategy, and estimation approaches that
we use to identify the long-term causal effects of Zimbabwe’s education reforms on individual
political participation.
Data
To examine the effects of education on political participation in Zimbabwe, we combine all avail-
able rounds of the Afrobarometer surveys conducted in 1999, 2004, 2005, 2009, 2010, and 2012.16
Since the Afrobarometer questions change across survey rounds, different rounds may be used
to test different outcome measures (see Online Appendix). We focus exclusively on black respon-
dents, who comprise the overwhelming majority of Zimbabwe’s population and were the education
reform’s target group.17
16The Afrobarometer initiative—a collaborative enterprise of Michigan State University, SouthAfrica’s Institute for Democracy, and the Ghanaian Centre for Democratic Development—conducts nationally representative surveys on the political attitudes of citizens in selected Africancountries.
17There were insufficient white voters to conduct a difference-in-differences analysis utilizingthe fact that the education reform was specifically targeted at Zimbabwe’s black population. How-ever, Aguero and Ramachandran (2014) report that, using 2002 census data, there is no jump ineducation for white Zimbabweans at the 1980 threshold.
16
Education is our key (endogenous) explanatory variable, which is measured using the follow-
ing seven-point ordinal scale: no schooling, incomplete primary, complete primary, incomplete
secondary, complete secondary, incomplete college, complete college. A one-category increase in
the education measure is equivalent to about 2-4 years of education, given the discrete nature of
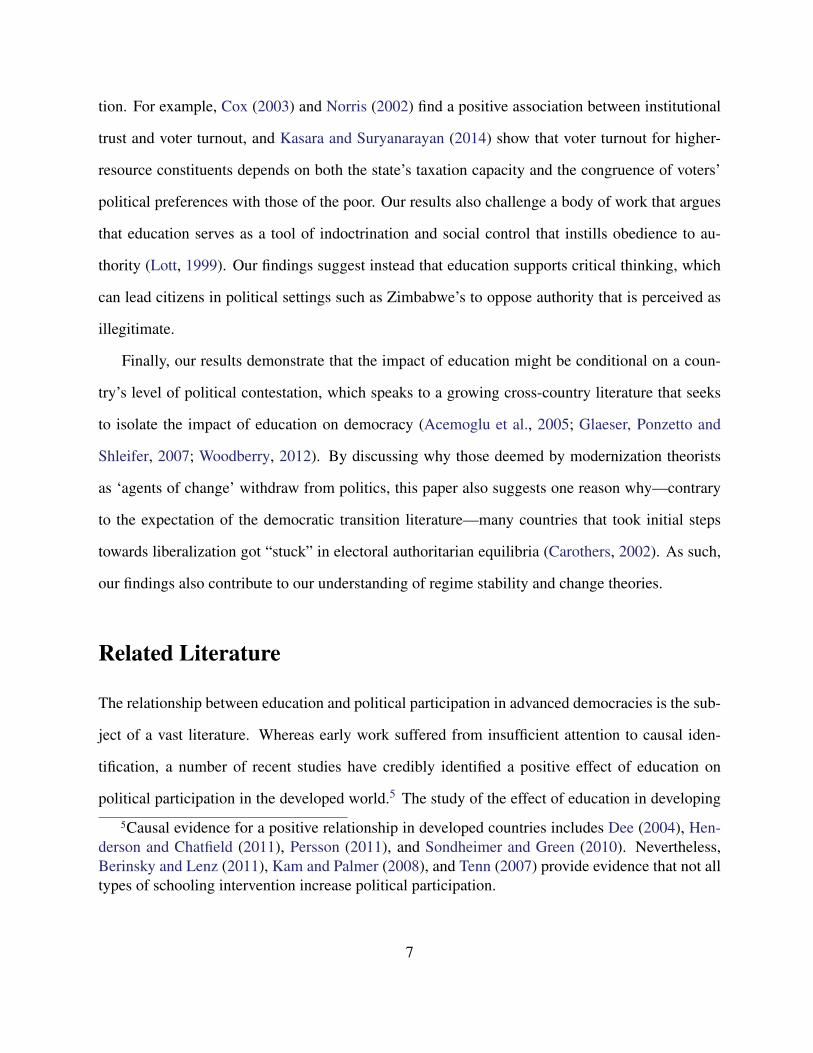
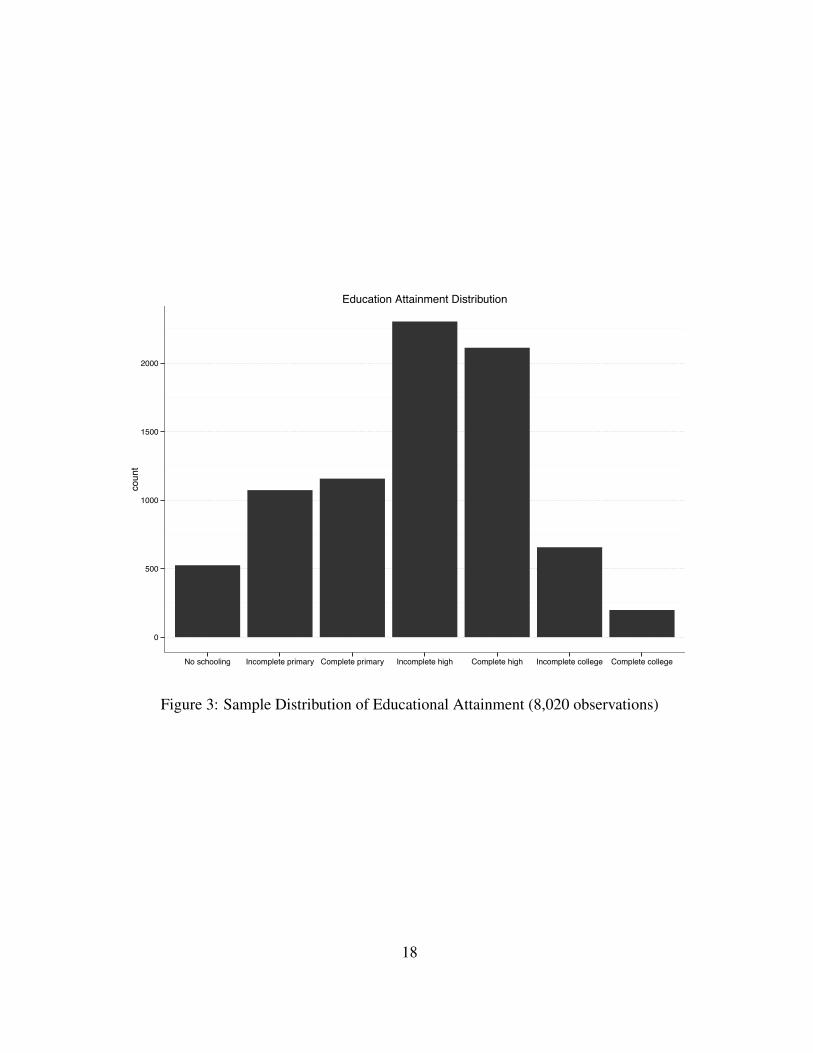
the variable. Figure 3 shows the distribution of this measure in our data, indicating that the modal
level of schooling is incomplete or complete high school.
Political participation, our principle dependent variable, is operationalized using four binary
indicators. Voted indicates whether the respondent reported voting in the most recent legislative
or presidential election. We also examine indicators for directly contacting one’s local govern-
ment councilor (Contacted local councilor), attending a community meeting (Attended community
meeting), or joining other community members in raising an issue (Raised issue at meeting) within
the past 12 months. Respectively, 73%, 41%, 68%, and 67% of respondents engaged in such ac-
tivities.18 We then combine these four variables, which are positively correlated with a Cronbach’s
alpha of 0.58, into a summary index (Participation scale).19 Although we also present the results
for each component separately, we place greatest weight on our scale measure because it averages
over the noise contained in the binary indicators.18We focus on non-contentious and undemanding forms of participation that relatively low-level
education might reasonably affect. Contacting one’s member of parliament (MP) and attendinga demonstration represent additional forms of participation. Consistent with their comparativelyhigher costs, both are rare in our sample: only 19% contacted their MP or attended a demonstration.Consistent with the unlikelihood that median levels of education would induce changes in suchbehavior, unreported results find that education has no effect on either activity. We also examinedlocal association membership, and found substantively similar effects to our main results below;since this variable is only available in a small number of surveys, these estimates are less precise.
19All summary indices are constructed using the alpha command in Stata, which does notuse casewise deletion and therefore maximizes the available information from the constituent vari-ables: a score is created for every observation for which there is a response to at least one item.The summative score is then divided by the number of items from which the sum is calculated.
17
0
500
1000
1500
2000
No schooling Incomplete primary Complete primary Incomplete high Complete high Incomplete college Complete college
coun
t
Education Attainment Distribution
Figure 3: Sample Distribution of Educational Attainment (8,020 observations)
18
Variation in Access to Secondary Schooling
In order to identify the causal effect of educational attainment, we exploit the cross-cohort variation
in access to secondary schooling arising from Zimbabwe’s 1980 education reform. Specifically,
we compare black citizens from cohorts that were affected by the reform to black citizens from
cohorts that were too old to benefit from the educational expansion.
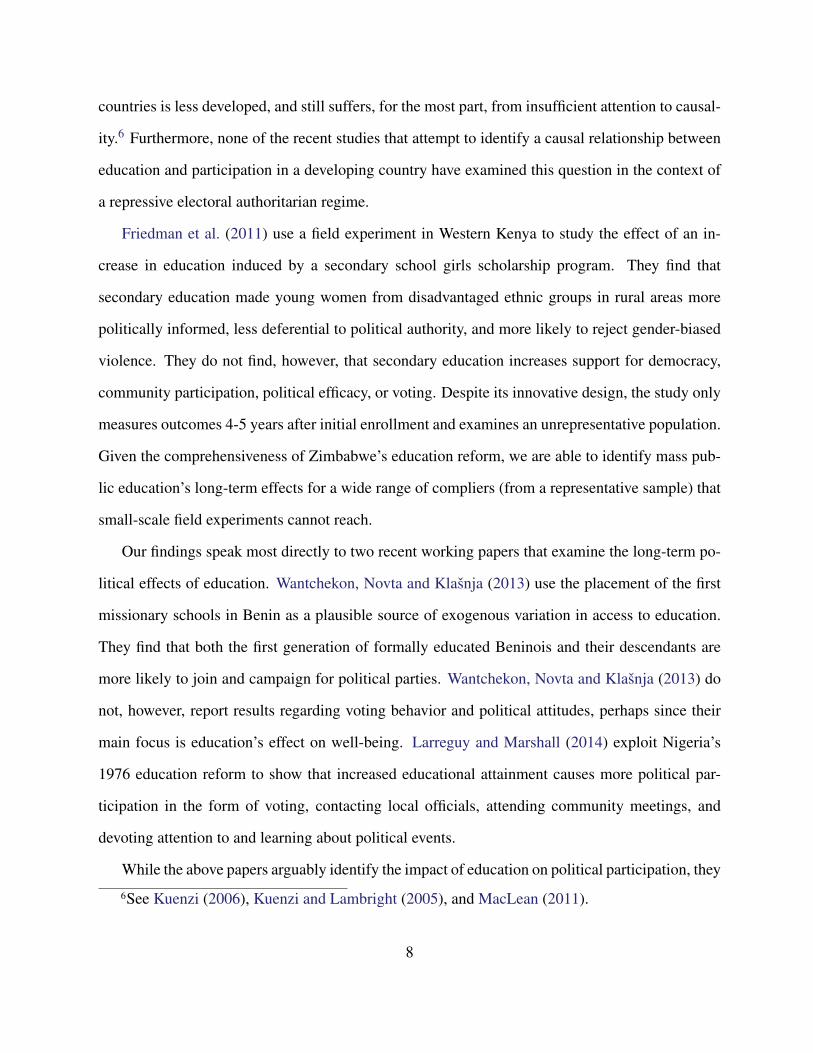
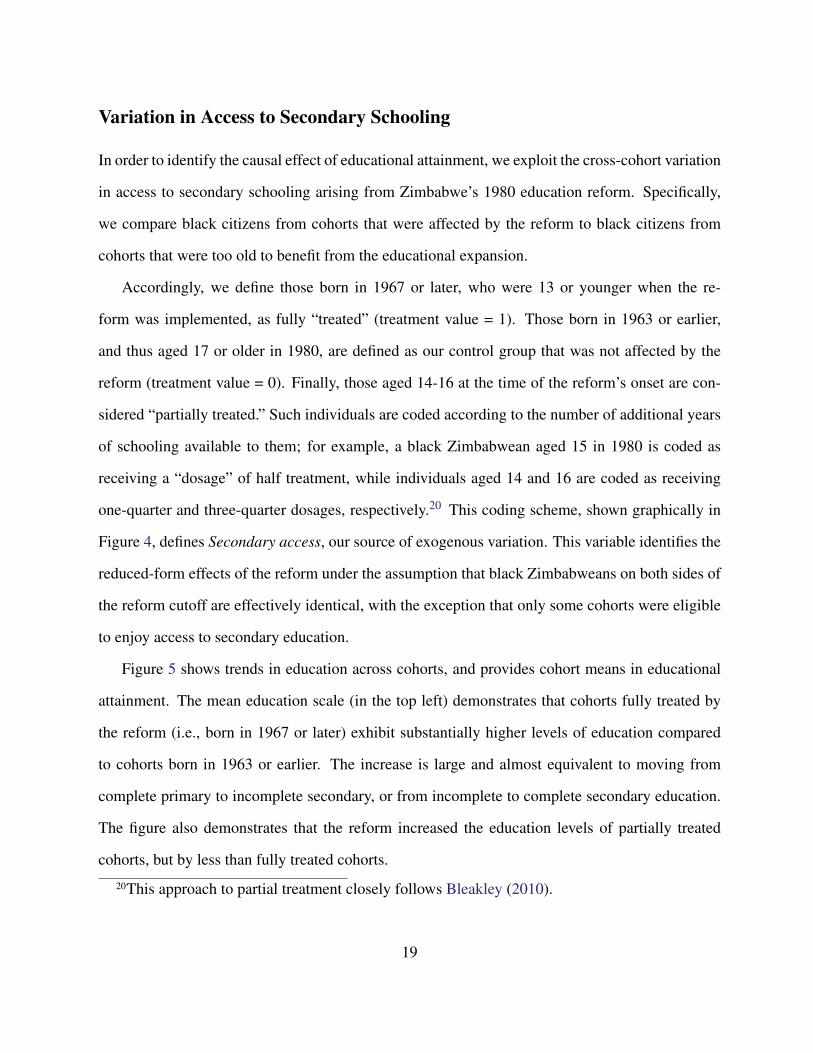
Accordingly, we define those born in 1967 or later, who were 13 or younger when the re-
form was implemented, as fully “treated” (treatment value = 1). Those born in 1963 or earlier,
and thus aged 17 or older in 1980, are defined as our control group that was not affected by the
reform (treatment value = 0). Finally, those aged 14-16 at the time of the reform’s onset are con-
sidered “partially treated.” Such individuals are coded according to the number of additional years
of schooling available to them; for example, a black Zimbabwean aged 15 in 1980 is coded as
receiving a “dosage” of half treatment, while individuals aged 14 and 16 are coded as receiving
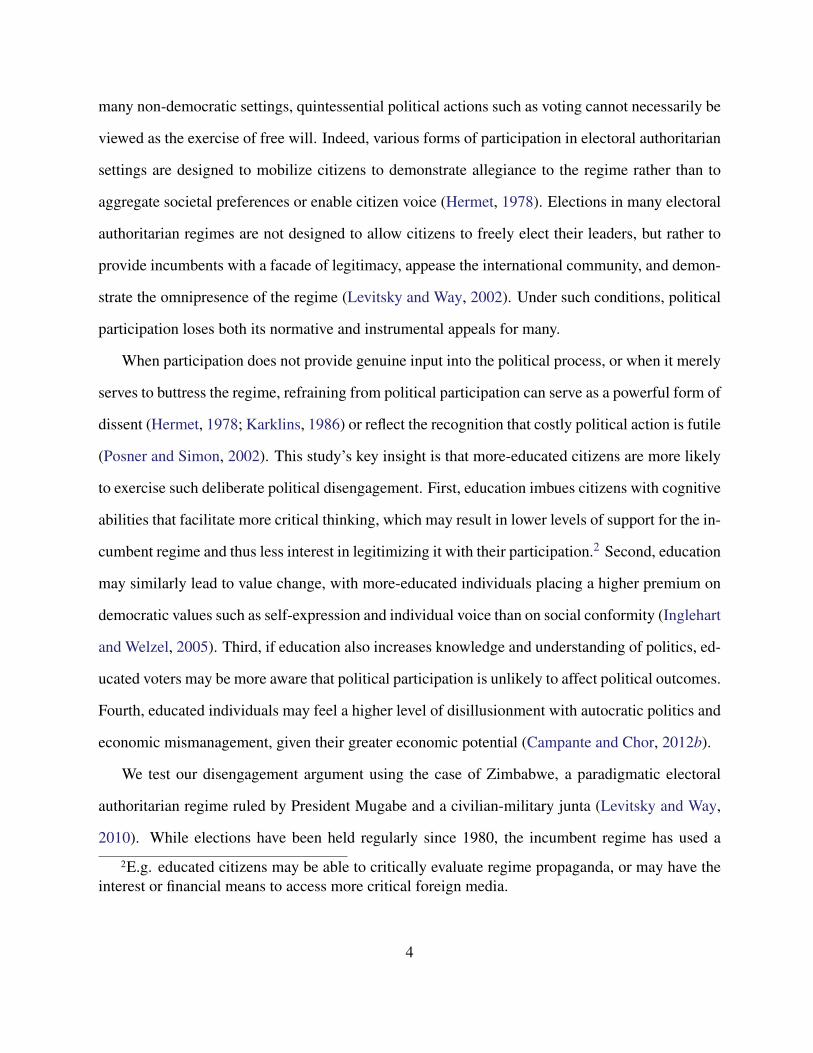
one-quarter and three-quarter dosages, respectively.20 This coding scheme, shown graphically in
Figure 4, defines Secondary access, our source of exogenous variation. This variable identifies the
reduced-form effects of the reform under the assumption that black Zimbabweans on both sides of
the reform cutoff are effectively identical, with the exception that only some cohorts were eligible
to enjoy access to secondary education.
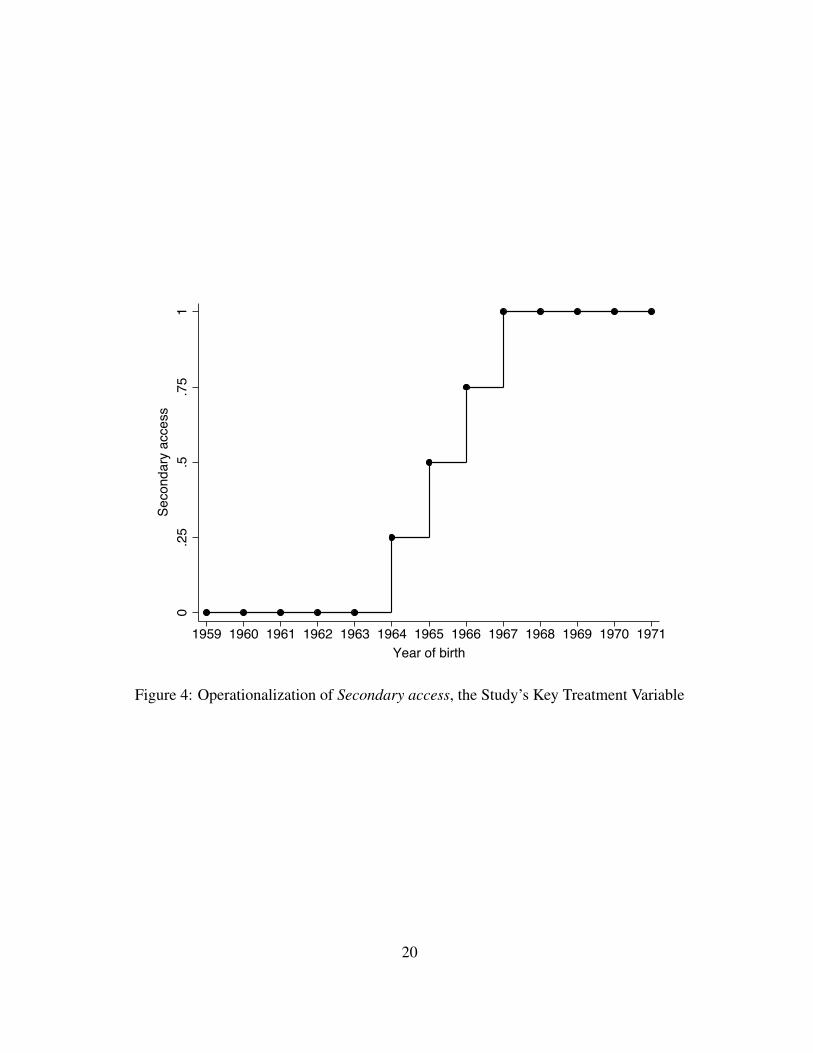
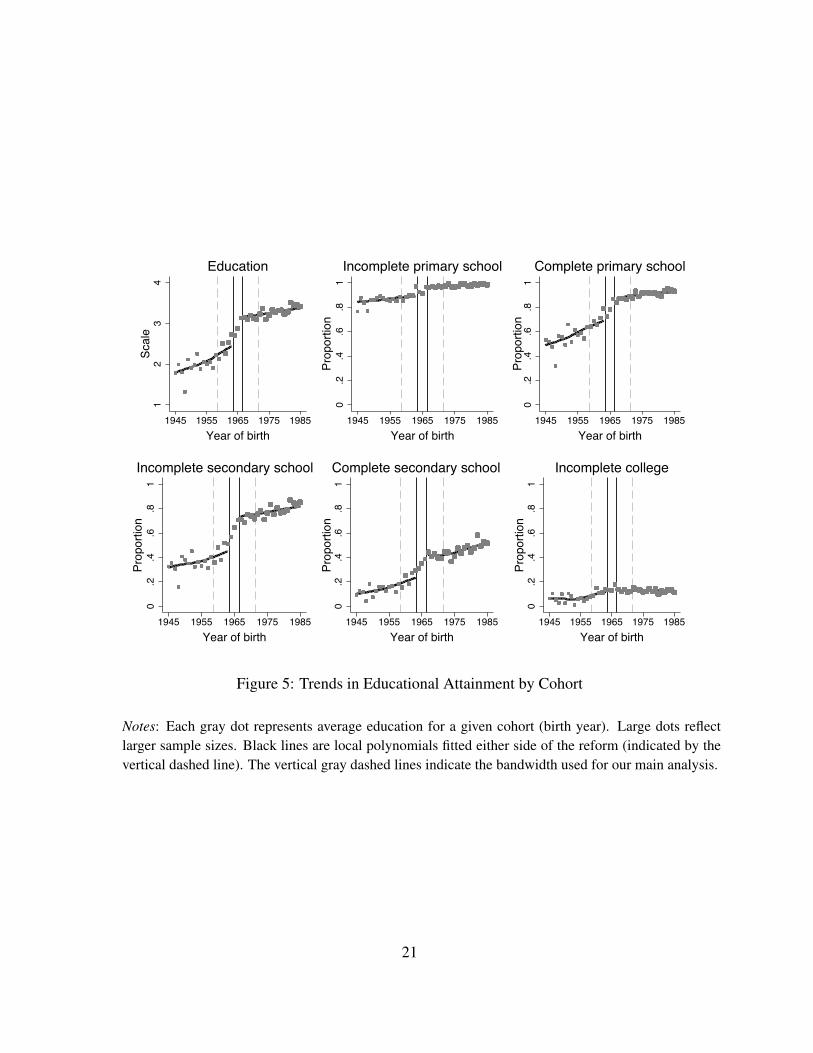
Figure 5 shows trends in education across cohorts, and provides cohort means in educational
attainment. The mean education scale (in the top left) demonstrates that cohorts fully treated by
the reform (i.e., born in 1967 or later) exhibit substantially higher levels of education compared
to cohorts born in 1963 or earlier. The increase is large and almost equivalent to moving from
complete primary to incomplete secondary, or from incomplete to complete secondary education.
The figure also demonstrates that the reform increased the education levels of partially treated
cohorts, but by less than fully treated cohorts.20This approach to partial treatment closely follows Bleakley (2010).
19
0.2
5.5
.75
1Se
cond
ary
acce
ss
1959 1960 1961 1962 1963 1964 1965 1966 1967 1968 1969 1970 1971Year of birth
Figure 4: Operationalization of Secondary access, the Study’s Key Treatment Variable
20
12
34
Scal
e
1945 1955 1965 1975 1985Year of birth
Education
0.2
.4.6
.81
Prop
ortio
n
1945 1955 1965 1975 1985Year of birth
Incomplete primary school
0.2
.4.6
.81
Prop
ortio
n
1945 1955 1965 1975 1985Year of birth
Complete primary school
0.2
.4.6
.81
Prop
ortio
n
1945 1955 1965 1975 1985Year of birth
Incomplete secondary school
0.2
.4.6
.81
Prop
ortio
n
1945 1955 1965 1975 1985Year of birth
Complete secondary school
0.2
.4.6
.81
Prop
ortio
n
1945 1955 1965 1975 1985Year of birth
Incomplete college
Figure 5: Trends in Educational Attainment by Cohort
Notes: Each gray dot represents average education for a given cohort (birth year). Large dots reflectlarger sample sizes. Black lines are local polynomials fitted either side of the reform (indicated by thevertical dashed line). The vertical gray dashed lines indicate the bandwidth used for our main analysis.
21
The fact that independence has undoubtedly brought about many other social, economic, and
political reforms could potentially threaten causal identification. Since socialization processes
operate differently at different stages of life (Alwin and Krosnick, 1991; Sears and Valentino,
1997), substantially older and younger constituents could vary in their response to political and
cultural shocks, thereby violating our identification assumption. To maximize the comparability of
treated and untreated respondents, our main analysis focuses on a “bandwidth” of five cohorts on
either side of the reform cutoff years of birth (1963 and 1967). This allows us to better control for
common shocks that may have affected younger and older cohorts differently.
We now assess the plausibility of our main identification assumption, that the untreated cohorts
(in our sample of cohorts around the eligibility cutoffs) only differ from the treated cohorts with
respect to their eligibility for secondary schooling. Although there is a slight long-run uptick in
schooling for cohorts born too early to be affected by the reform, Figure 5 indicates that trends in
education are relatively flat once we focus on the five cohorts on both sides of the reform’s cutoff
point (inside the gray dashed lines). Below, we also document relatively flat trends in our political
outcomes for cohorts on either side of the reform, which is consistent with the similarity of these
cohorts along dimensions other than educational access. In our robustness checks, we demonstrate
that trends are not driving our results by varying the size of the bandwidth, using placebo reforms,
and including flexible cohort trends either side of the discontinuity (see also Aguero and Bharadwaj
2014, 490).
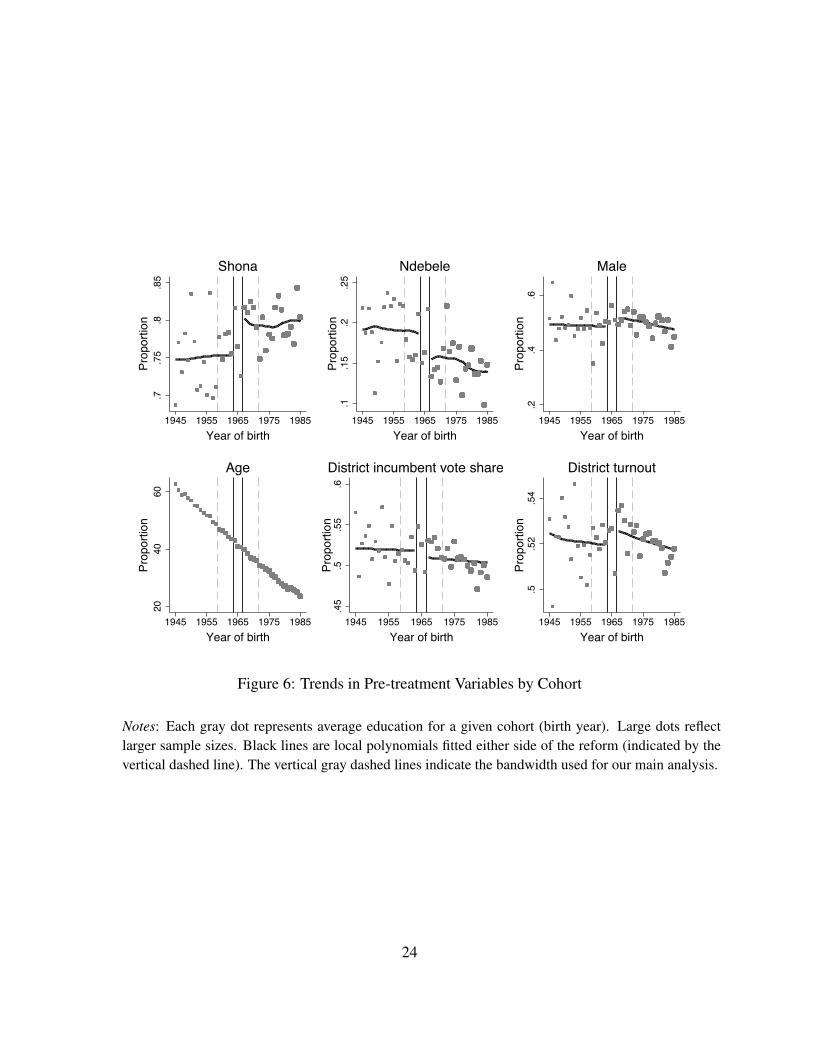
Furthermore, Figure 6 plots pre-treatment characteristics and district-level variables, compar-
ing cohorts on both sides of the reform.21 The results suggest that our sample is balanced across
treatment groups with respect to gender, age at the date of the survey, and district-level political
aggregates. There is, however, a slight imbalance with respect to tribe: the first two plots point to a
small difference in the proportions of Shona and Ndebele tribe members, Zimbabwe’s two largest21The frequency of surveyed individuals is not affected by the treatment, suggesting that there
is no differential migration across cohorts. Furthermore, the proportion of educated respondents inour surveys does not change after hyperinflation began in the mid-2000s.
22
tribes. We show below that our findings are robust to the inclusion of pre-treatment covariates,
while the effects of access to education do not vary across tribes.
Estimation Strategies
Building on our identifying assumption that access to secondary schooling is exogenous across
cohorts just affected or just unaffected by the reform, we utilize two main approaches to identify
the long-run political effects of secondary education. Our first approach includes partially treated
respondents. A key advantage of this approach is that leveraging differences in treatment intensity
allows us to test whether common shocks associated with independence differentially affected co-
horts with different levels of access to education. We first estimate the reduced-form effects of in-
creasing the availability of secondary education—which is equivalent to an “intent-to-treat” (ITT)
analysis—by estimating the following regression equation using ordinary least squares (OLS):
Yicdt = gSecondary accessc +ht + eicdt , (1)
where Yicdt is an outcome measure, and Secondary accessc—our key treatment variable—allows
the effect of the education reform to vary across partially treated adolescents. We include survey
fixed effects, ht , to account for time-varying shocks that impact respondents differently across
survey rounds, and cluster standard errors by district.22
Access to public education, however, does not necessarily entail enrollment. Rather, the map-
ping from educational access—an opportunity that equally affects all cohort members—to an indi-
vidual’s educational outcome is probabilistic. This is because not all primary students continue to
secondary school, and because some older individuals returned to school after the war. To identify
the effects of actual education, we use access to secondary schooling to instrument for education.22Our results are robust to “double clustering” by both district and cohort (Cameron, Gelbach
and Miller, 2011).
23
.7.7
5.8
.85
Prop
ortio
n
1945 1955 1965 1975 1985Year of birth
Shona
.1.1
5.2
.25
Prop
ortio
n
1945 1955 1965 1975 1985Year of birth
Ndebele
.2.4
.6Pr
opor
tion
1945 1955 1965 1975 1985Year of birth
Male
2040
60Pr
opor
tion
1945 1955 1965 1975 1985Year of birth
Age
.45
.5.5
5.6
Prop
ortio
n
1945 1955 1965 1975 1985Year of birth
District incumbent vote share
.5.5
2.5
4Pr
opor
tion
1945 1955 1965 1975 1985Year of birth
District turnout
Figure 6: Trends in Pre-treatment Variables by Cohort
Notes: Each gray dot represents average education for a given cohort (birth year). Large dots reflectlarger sample sizes. Black lines are local polynomials fitted either side of the reform (indicated by thevertical dashed line). The vertical gray dashed lines indicate the bandwidth used for our main analysis.
24
Our IV analysis identifies the effect of education on Zimbabweans who received additional edu-
cation because of the 1980 reform, but who would not have done so otherwise (Angrist, Imbens
and Rubin, 1996). In the first stage, we estimate the effect of access to secondary education on a
respondent’s educational attainment:
Educationicdt = dSecondary accessc +ht + xicdt . (2)
Taking the predicted values from this first-stage regression, we then estimate the following struc-
tural equation using two-stage least squares (2SLS):
Yicdt = bEducationicdt +ht + Vicdt . (3)
Our coding of education follows that of Marshall (2014), who shows that coding an endogenous
education variable as binary can significantly upwardly bias estimates if greater education at lower
levels—which do not register in the first stage—also affects the outcome.23 Since any additional
education may affect political behavior, we use the seven-point education scale (described above)
as our endogenous independent variable. This allows us to retrieve consistent estimates of the
average effect of an additional unit of education (Marshall, 2014).
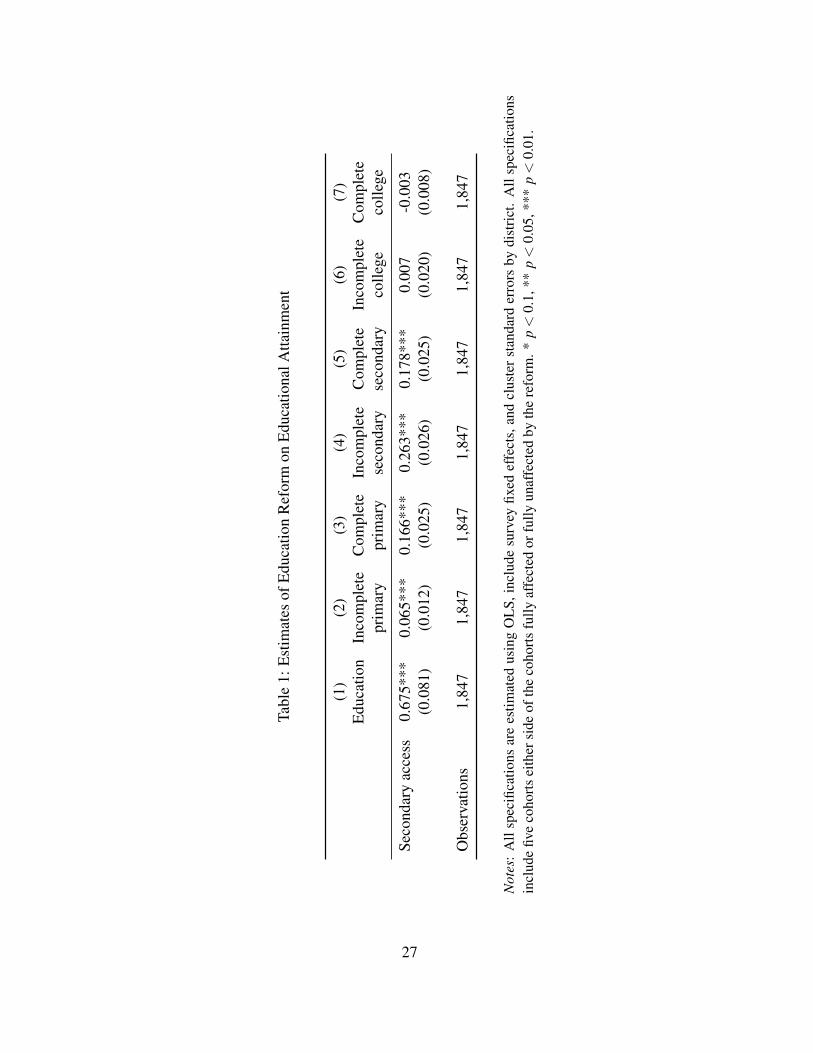
IV estimation requires several additional assumptions. First, the relationship between instru-
ment (secondary access) and the endogenous variable (education) must be strong. Indeed, the
first-stage regression, reported in Table 1, produces a positive and highly statistically significant
coefficient. The F statistic, which tests the relevance of the instrument in the first-stage regression,
is 69, which far exceeds the standard critical value of 10 (Staiger and Stock, 1997). Second, the
exclusion restriction requires that our instrument only affects political outcomes through increased23Intuitively, this bias occurs because the reduced form captures any effect of increased school-
ing, while the first stage only normalizes the reduced-form estimates by the proportion of votersthat was induced to complete high school.
25
education. We discuss this assumption in greater detail below.24
Our second approach drops all partially treated respondents, and thus compares only respon-
dents who were born in 1963 or earlier (i.e., too early to be affected by the reform) to respondents
who were fully treated. This approach allows us to focus on a sharp discontinuity in treatment
assignment. By abstracting from partial treatment, we are able to implement a regression disconti-
nuity (RD) design that relies on the weaker assumption that potential outcomes are smooth across
the discontinuity.25 Consistent results across both approaches should increase confidence in the
study’s findings.
For this second approach, we again estimate Equation (1) to provide non-parametric RD esti-
mates. Since access to schooling does not necessarily induce students to attend secondary school,
we again estimate Equation (3) using 2SLS. This “fuzzy” RD design re-scales our reduced-form
estimates to estimate the effect for black students who only remained in school because of the
reform.
Education and Political Participation in Zimbabwe
This section presents our main finding: that education reduces political participation in Zim-
babwe’s electoral authoritarian regime. For each measure of participation, we provide both graphi-
cal evidence and regression estimates in tabular form. Each regression table provides our reduced-
form and IV estimates using both main approaches to identification. We then demonstrate the
robustness of our findings.24There is no reason to suspect that monotonicity is violated. Even if there were some defiers,
the predominance of compliers—as indicated by the large first stage—is unlikely to substantiallychange our estimates (de Chaisemartin, 2014).
25By removing partially treated cohorts, we slightly abuse the RD design, because the runningvariable is truncated. Our RD requires that cohorts born in 1963 are comparable to cohorts born in1967.
26
Tabl
e1:
Estim
ates
ofEd
ucat
ion
Ref
orm
onEd
ucat
iona
lAtta
inm
ent
(1)
(2)
(3)
(4)
(5)
(6)
(7)
Educ
atio
nIn
com
plet
eC
ompl
ete
Inco
mpl
ete
Com
plet
eIn
com
plet
eC
ompl
ete
prim
ary
prim
ary
seco
ndar
yse
cond
ary
colle
geco
llege
Seco
ndar
yac
cess
0.67
5***
0.06
5***
0.16
6***
0.26
3***
0.17
8***
0.00
7-0
.003
(0.0
81)
(0.0
12)
(0.0
25)
(0.0
26)
(0.0
25)
(0.0
20)
(0.0
08)
Obs
erva
tions
1,84
71,
847
1,84
71,
847
1,84
71,
847
1,84
7
Not
es:
All
spec
ifica
tions
are
estim
ated
usin
gO
LS,i
nclu
desu
rvey
fixed
effe
cts,
and
clus
ters
tand
ard
erro
rsby
dist
rict.
All
spec
ifica
tions
incl
ude
five
coho
rtsei
ther
side
ofth
eco
horts
fully
affe
cted
orfu
llyun
affe
cted
byth
ere
form
.*p<
0.1,
**p<
0.05
,***
p<
0.01
.
27
Main Estimates
Contrary to the positive effects of education in advanced democracies (Sondheimer and Green,
2010) and democratic developing country contexts (Larreguy and Marshall, 2014), we find that
in Zimbabwe, education substantially and significantly reduces levels of political participation.
Column (1) in Table 2 reports a large reduction in political participation, as measured by our
participation scale, across all estimation strategies. Relative to its sample mean of 0.64, Panel
A shows that full exposure to secondary education reduces participation by around 10% (or one-
fifth of a standard deviation). Panel C shows that this estimate is barely affected by excluding
partially treated respondents. The IV estimates in Panels B and D reveal a similar story: using both
the partially treated and RD approaches, a one-unit increase in education reduces participation
by around 15% relative to its sample mean. Finally, we report the simple correlation between
education and political participation in Panel E in the sample containing all cohorts, which also
shows a negative correlation.26
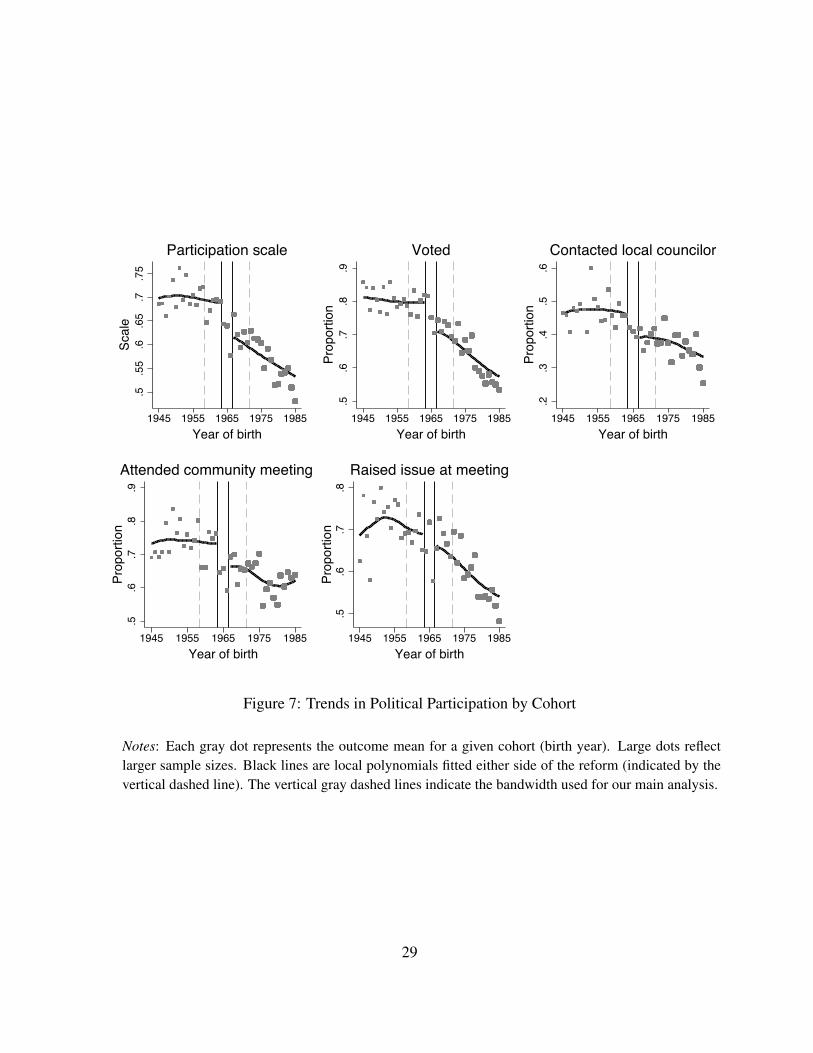
Importantly, as Table 2 and Figure 7 clearly indicate, the negative effects of education on our
participation index are not simply due to an exceptionally large impact on one of the constituent
variables. Instead, we find that a one-unit increase in access to secondary schooling and a one-unit
increase in the education scale both cause a significant reduction in a set of non-contentious forms
of political participation. In particular, our point estimates suggest that being exposed to the full
treatment reduces voting by 8 percentage points, contacting one’s local councilor by 6 percentage
points, attending community meetings by 6 percentage points, and raising issues with others at
a meeting by about 3 percentage points. Similarly, a one-unit increase in educational attainment
reduces voting by 11 percentage points, contacting a local councilor by 9 percentage points, at-
tending a community meeting by 9 percentage points, and raising an issue by 3 percentage points.
Across all our specifications, only the decrease in raising an issue is not consistently significant.26Using indicators for each level of education reveals that each level of education further de-
creases participation until the effect plateaus at the college level.
28
.5.5
5.6
.65
.7.7
5Sc
ale
1945 1955 1965 1975 1985Year of birth
Participation scale
.5.6
.7.8
.9Pr
opor
tion
1945 1955 1965 1975 1985Year of birth
Voted
.2.3
.4.5
.6Pr
opor
tion
1945 1955 1965 1975 1985Year of birth
Contacted local councilor
.5.6
.7.8
.9Pr
opor
tion
1945 1955 1965 1975 1985Year of birth
Attended community meeting
.5.6
.7.8
Prop
ortio
n
1945 1955 1965 1975 1985Year of birth
Raised issue at meeting
Figure 7: Trends in Political Participation by Cohort
Notes: Each gray dot represents the outcome mean for a given cohort (birth year). Large dots reflectlarger sample sizes. Black lines are local polynomials fitted either side of the reform (indicated by thevertical dashed line). The vertical gray dashed lines indicate the bandwidth used for our main analysis.
29
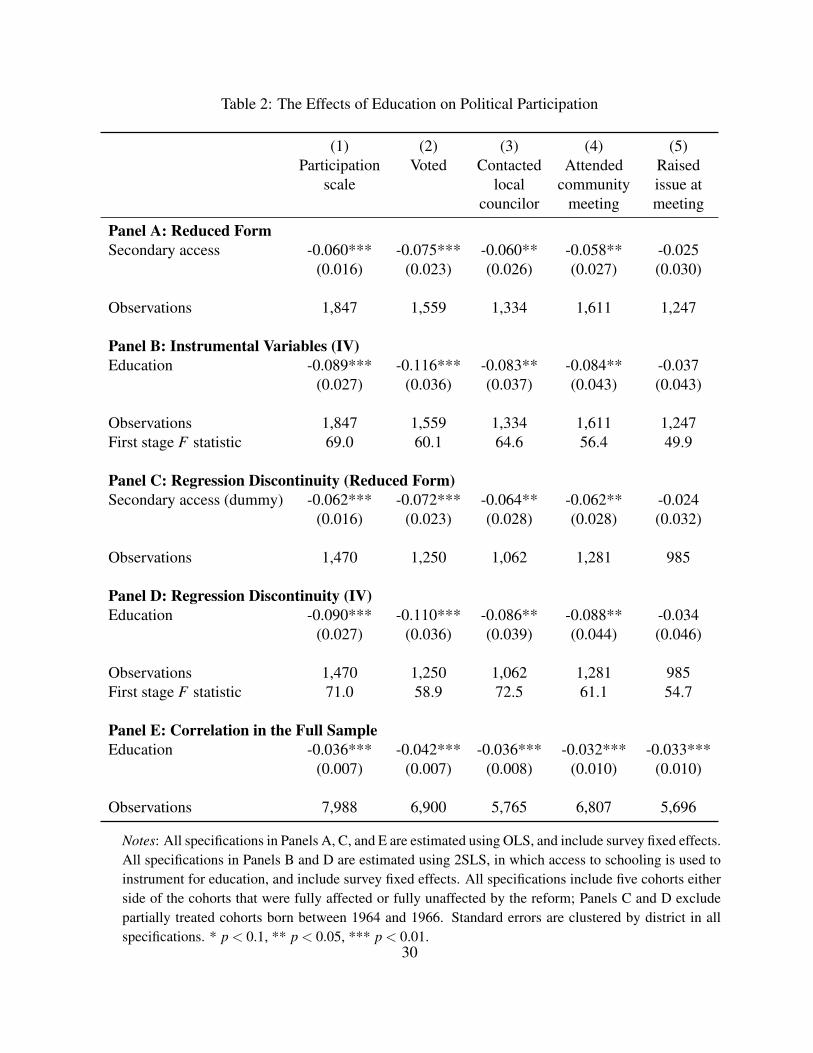
Table 2: The Effects of Education on Political Participation
(1) (2) (3) (4) (5)Participation Voted Contacted Attended Raised
scale local community issue atcouncilor meeting meeting
Panel A: Reduced FormSecondary access -0.060*** -0.075*** -0.060** -0.058** -0.025
(0.016) (0.023) (0.026) (0.027) (0.030)
Observations 1,847 1,559 1,334 1,611 1,247
Panel B: Instrumental Variables (IV)Education -0.089*** -0.116*** -0.083** -0.084** -0.037
(0.027) (0.036) (0.037) (0.043) (0.043)
Observations 1,847 1,559 1,334 1,611 1,247First stage F statistic 69.0 60.1 64.6 56.4 49.9
Panel C: Regression Discontinuity (Reduced Form)Secondary access (dummy) -0.062*** -0.072*** -0.064** -0.062** -0.024
(0.016) (0.023) (0.028) (0.028) (0.032)
Observations 1,470 1,250 1,062 1,281 985
Panel D: Regression Discontinuity (IV)Education -0.090*** -0.110*** -0.086** -0.088** -0.034
(0.027) (0.036) (0.039) (0.044) (0.046)
Observations 1,470 1,250 1,062 1,281 985First stage F statistic 71.0 58.9 72.5 61.1 54.7
Panel E: Correlation in the Full SampleEducation -0.036*** -0.042*** -0.036*** -0.032*** -0.033***
(0.007) (0.007) (0.008) (0.010) (0.010)
Observations 7,988 6,900 5,765 6,807 5,696
Notes: All specifications in Panels A, C, and E are estimated using OLS, and include survey fixed effects.All specifications in Panels B and D are estimated using 2SLS, in which access to schooling is used toinstrument for education, and include survey fixed effects. All specifications include five cohorts eitherside of the cohorts that were fully affected or fully unaffected by the reform; Panels C and D excludepartially treated cohorts born between 1964 and 1966. Standard errors are clustered by district in allspecifications. * p < 0.1, ** p < 0.05, *** p < 0.01.
30
Robustness Checks
Given that these findings challenge the conventional wisdom that education increases participation,
it is essential to demonstrate their robustness. In Table 3 we present a series of checks testing our
identifying assumptions. We first test the robustness of our results to different bandwidths. Panels
A and B show that the reduced-form estimates are similar when we include either three or ten
cohorts on either side of the reform eligibility threshold. Second, we show that our results are
not driven by cohort trends. In Panel C, we examine a placebo reform in which we estimate the
reduced-form effects of a (hypothetical) reform in 1970 and compare cohorts five years on either
side of this arbitrary cutoff. If trends were driving our results, we would expect to also find a
reduction in political participation around the placebo reform. However, we find a significant
reduction in participation for only one variable, raising an issue. We repeat this exercise and find
no effects for placebo reforms in any year between 1960 and 1972.27 Furthermore, Panel D shows
that when we include 20 cohorts and cubic polynomial birth-year trends on either side of the reform
cutoff, the reduced form RD estimates are robust.28 Together, these tests support our identifying
assumptions by showing that our results are not an artifact of specification choices or cohort trends.
As noted above, the most plausible confounding explanations relate to political differences be-
tween the cohorts immediately around the reform eligibility cutoff. First, one potential concern
is a “first election” effect, such that respondents on different sides of the education reform be-
have differently because they first voted in different elections (Meredith, 2009; Mullainathan and
Washington, 2009). To show that this cannot explain our results, in Panel E we restrict atten-
tion to respondents born between 1963 and 1966—who were first eligible to vote (at age 18) in
the 1985 election—and find that the intensity of secondary access continues to significantly de-27The most recent placebo is 1972, which allows us to include five cohorts after the placebo
reform including partially treated cohorts.28The inclusion of trends on either side of the discontinuity cannot be precisely estimated with-
out extending the bandwidth. However, across all bandwidths, the point estimates have rathersimilar magnitudes.
31
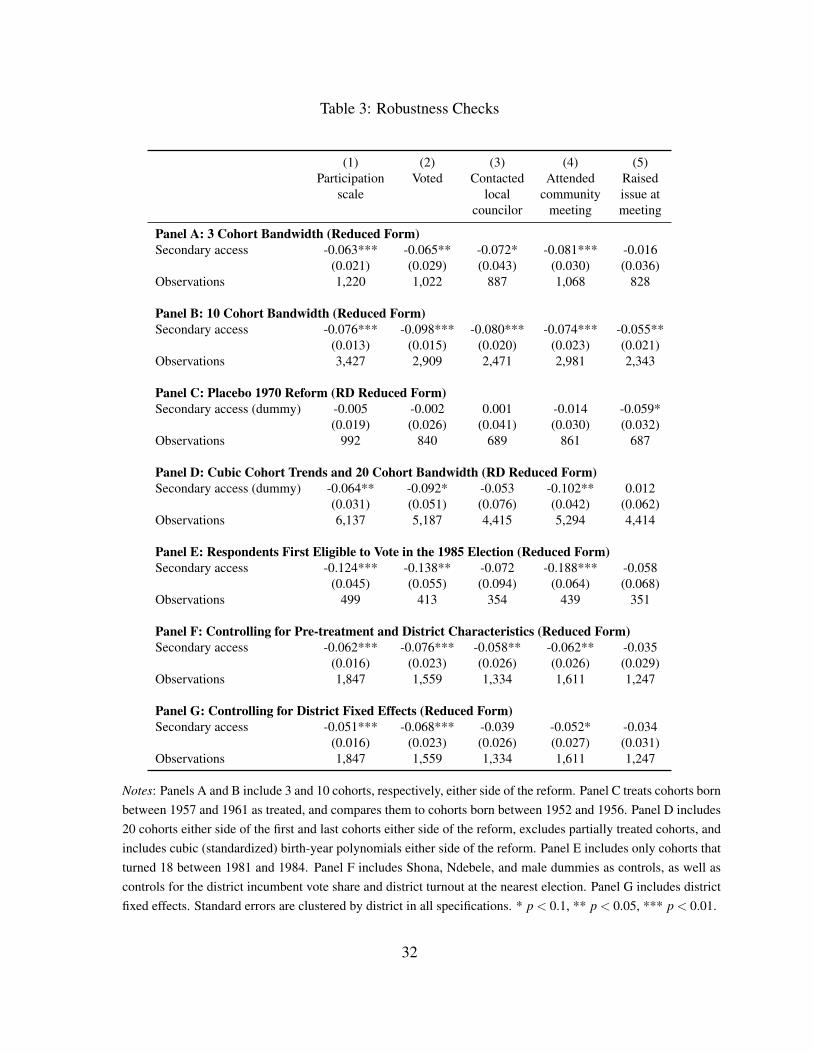
Table 3: Robustness Checks
(1) (2) (3) (4) (5)Participation Voted Contacted Attended Raised
scale local community issue atcouncilor meeting meeting
Panel A: 3 Cohort Bandwidth (Reduced Form)Secondary access -0.063*** -0.065** -0.072* -0.081*** -0.016
(0.021) (0.029) (0.043) (0.030) (0.036)Observations 1,220 1,022 887 1,068 828
Panel B: 10 Cohort Bandwidth (Reduced Form)Secondary access -0.076*** -0.098*** -0.080*** -0.074*** -0.055**
(0.013) (0.015) (0.020) (0.023) (0.021)Observations 3,427 2,909 2,471 2,981 2,343
Panel C: Placebo 1970 Reform (RD Reduced Form)Secondary access (dummy) -0.005 -0.002 0.001 -0.014 -0.059*
(0.019) (0.026) (0.041) (0.030) (0.032)Observations 992 840 689 861 687
Panel D: Cubic Cohort Trends and 20 Cohort Bandwidth (RD Reduced Form)Secondary access (dummy) -0.064** -0.092* -0.053 -0.102** 0.012
(0.031) (0.051) (0.076) (0.042) (0.062)Observations 6,137 5,187 4,415 5,294 4,414
Panel E: Respondents First Eligible to Vote in the 1985 Election (Reduced Form)Secondary access -0.124*** -0.138** -0.072 -0.188*** -0.058
(0.045) (0.055) (0.094) (0.064) (0.068)Observations 499 413 354 439 351
Panel F: Controlling for Pre-treatment and District Characteristics (Reduced Form)Secondary access -0.062*** -0.076*** -0.058** -0.062** -0.035
(0.016) (0.023) (0.026) (0.026) (0.029)Observations 1,847 1,559 1,334 1,611 1,247
Panel G: Controlling for District Fixed Effects (Reduced Form)Secondary access -0.051*** -0.068*** -0.039 -0.052* -0.034
(0.016) (0.023) (0.026) (0.027) (0.031)Observations 1,847 1,559 1,334 1,611 1,247
Notes: Panels A and B include 3 and 10 cohorts, respectively, either side of the reform. Panel C treats cohorts bornbetween 1957 and 1961 as treated, and compares them to cohorts born between 1952 and 1956. Panel D includes20 cohorts either side of the first and last cohorts either side of the reform, excludes partially treated cohorts, andincludes cubic (standardized) birth-year polynomials either side of the reform. Panel E includes only cohorts thatturned 18 between 1981 and 1984. Panel F includes Shona, Ndebele, and male dummies as controls, as well ascontrols for the district incumbent vote share and district turnout at the nearest election. Panel G includes districtfixed effects. Standard errors are clustered by district in all specifications. * p < 0.1, ** p < 0.05, *** p < 0.01.
32
crease political participation. Second, a subtler “coming of age” hypothesis is that older students
may have been more cognizant of the independence movement, and their more intense support
for Mugabe’s regime could be manifested in greater participation that has persisted until today.
We thus test whether pro-nationalist sentiments are stronger among our older (untreated) cohorts.
Contrary to this alternative explanation, the Online Appendix shows that expression of national
identity is instead positively (and insignificantly) associated with secondary access. Furthermore,
persistent differences in support for Mugabe’s regime across cohorts cannot convincingly explain
the differential change in the participation of younger (better-educated) cohorts following the more
competitive 2008 election (see below).
Although our design minimizes differences in citizen characteristics around the reform, we also
show that our results are robust to the inclusion of other potentially confounding omitted variables.
Panel E, which includes the pre-treatment variables described in Figure 6, yields similar results.
In particular, these results suggest that participation is not being driven by compositional changes
in the proportion of Shona and Ndebele respondents. Panel F demonstrates the robustness of our
results to the inclusion of district fixed effects, although contacting a local councilor slightly falls
outside statistical significance. Finally, although including age fixed effects decreases the precision
of our estimates by removing considerable cross-cohort variation, we show in the Online Appendix
that, if anything, the magnitudes of our negative point estimates increase.
While our reduced-form (ITT) estimates do not require the exclusion restriction to hold, the
IV estimates do. There are, however, good reasons to believe that the secondary education reform
only affects participation through its effect on educational attainment. First, because education
is highly proximate to the reform itself, most downstream behavioral responses—such as fertil-
ity, marriage, and vocation—are a function of a respondent’s education. Second, the fact that the
decrease in participation levels for partially treated respondents is lower than for fully treated re-
spondents but higher than for untreated respondents increases our confidence that participation is
responding to changes in actual schooling. If political responses to being affected by the reform
33
itself were driving the results via some other channel, then it is hard to see why it would have
differentially affected those receiving different instrument dosages. Third, a typical concern with
such reforms is the possibility of cross-cohort spillovers. However, if cohorts on either side of the
reform cutoff interact with one another, spillovers are likely to reduce the effects of schooling as
behavior becomes more homogeneous. Nevertheless, we examine the sensitivity of our results to
arbitrary violations of the exclusion restriction by calculating the extent of the violation required
to nullify our finding. Using Conley, Hansen and Rossi (2012)’s most conservative (union of con-
fidence intervals) sensitivity test, 37% of the reduced-form effect must operate through channels
other than education for the 95% confidence interval of our 2SLS estimate of education’s effect on
the participation scale to include zero.
Deliberate Disengagement: Testable Implications
Why are more-educated Zimbabweans less likely to be politically active? This section tests the
observable implications of our argument that in electoral authoritarian regimes, better-educated
citizens—who recognize that their participation will have little effect on policy and distributive
outcomes, yet will grant the regime a semblance of legitimacy—may deliberately disengage from
political participation. Since this theory is difficult to test directly—we do not have access to the
thought processes of our respondents when they are deciding whether (and how) to participate—
we examine empirically the observable implications of the deliberate disengagement interpretation
of our main finding that education reduces political participation in Zimbabwe’s electoral authori-
tarian regime.
We propose four testable implications of our deliberate disengagement argument: first, whether
the relationship between education and participation varies as the nature of elections in Zimbabwe
has changed over time; second, whether access to secondary education indeed increases the eco-
nomic welfare of the cohorts that benefited from it; third, whether education has a positive effect on
34
attitudes that are closely associated with greater political participation in advanced democracies,
such as political interest and support for democratic institutions; and finally, whether education also
creates a more critical citizenry; i.e., whether it has a negative effect on the level of support for
the incumbent authoritarian regime. Finally, we rule out alternative mechanisms that could explain
why education decreases participation in Zimbabwe, such as whether educated voters demonstrate
greater fear of political violence or whether they are less likely to be targets of electoral mobiliza-
tion efforts.
For each test we present regression results in tabular form for both a summary index (when
Cronbach’s alpha exceeds 0.4) and for the index’s constituent variables. Graphical results are
provided in the Online Appendix.
Participation during Competitive and Non-competitive Elections
We begin testing our deliberate disengagement argument by comparing survey rounds before and
after 2008, which was the first election since 1980 to substantively affect the distribution of exec-
utive power. Zimbabwean elections during the study period (2000, 2002, 2005, and 2008) varied
significantly in character. Notably, the 2008 elections were the first in which the opposition ob-
tained a share of power at the national level. The MDC (together with its splinter group, MDC-M)
gained a majority in the House of Assembly, a majority of municipal councils, and some level
of executive power through the internationally brokered national unity government. Thus, if edu-
cated voters are more likely to disengage when they feel that participation is futile or only serves
to legitimate the government, we should also expect them to re-engage when elections are able
to meaningfully influence political outcomes. To explicitly test this expectation, we compare the
effects of education on political participation for respondents who were surveyed before and after
2009 (the first survey since the 2008 election).29
29Comparing the characteristics of survey respondents before and after 2009, we find no signif-icant differences in gender, tribe (Shona or Ndebele), district incumbent vote share, or educationlevel. The lack of such differences also indicates that any out-migration during Zimbabwe’s eco-
35
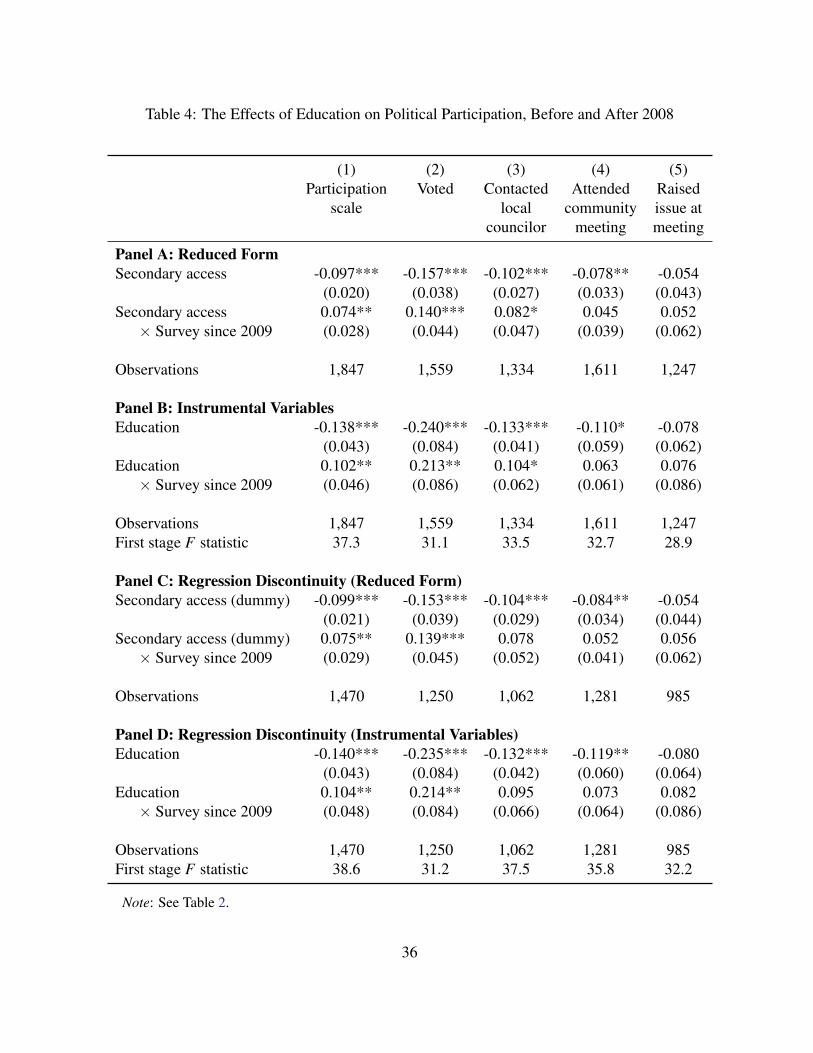
Table 4: The Effects of Education on Political Participation, Before and After 2008
(1) (2) (3) (4) (5)Participation Voted Contacted Attended Raised
scale local community issue atcouncilor meeting meeting
Panel A: Reduced FormSecondary access -0.097*** -0.157*** -0.102*** -0.078** -0.054
(0.020) (0.038) (0.027) (0.033) (0.043)Secondary access 0.074** 0.140*** 0.082* 0.045 0.052
⇥ Survey since 2009 (0.028) (0.044) (0.047) (0.039) (0.062)
Observations 1,847 1,559 1,334 1,611 1,247
Panel B: Instrumental VariablesEducation -0.138*** -0.240*** -0.133*** -0.110* -0.078
(0.043) (0.084) (0.041) (0.059) (0.062)Education 0.102** 0.213** 0.104* 0.063 0.076
⇥ Survey since 2009 (0.046) (0.086) (0.062) (0.061) (0.086)
Observations 1,847 1,559 1,334 1,611 1,247First stage F statistic 37.3 31.1 33.5 32.7 28.9
Panel C: Regression Discontinuity (Reduced Form)Secondary access (dummy) -0.099*** -0.153*** -0.104*** -0.084** -0.054
(0.021) (0.039) (0.029) (0.034) (0.044)Secondary access (dummy) 0.075** 0.139*** 0.078 0.052 0.056
⇥ Survey since 2009 (0.029) (0.045) (0.052) (0.041) (0.062)
Observations 1,470 1,250 1,062 1,281 985
Panel D: Regression Discontinuity (Instrumental Variables)Education -0.140*** -0.235*** -0.132*** -0.119** -0.080
(0.043) (0.084) (0.042) (0.060) (0.064)Education 0.104** 0.214** 0.095 0.073 0.082
⇥ Survey since 2009 (0.048) (0.084) (0.066) (0.064) (0.086)
Observations 1,470 1,250 1,062 1,281 985First stage F statistic 38.6 31.2 37.5 35.8 32.2
Note: See Table 2.
36
The results, reported in Table 4, suggest that education had different effects before and after
2008. Consistent with our theoretical argument, the effect of education is negative and very large
during the uncompetitive period before 2008. As demonstrated by the positive interaction term for
post-2009 survey responses, the effect of education was essentially zero when elections affected the
distribution of executive power. In no case is access to education secondary statistically significant
for respondents surveyed since 2009, while the difference in coefficients is statistically significant
for voting and contacting a local councilor.
These results are also important because they cannot be easily reconciled with the alternative
explanation that events which took place around independence affected age cohorts in different
ways (discussed above).
Education Increases Economic Outcomes
We continue by showing that education has a positive effect on economic outcomes. Documenting
this relationship serves as a marker that, despite concerns that the rapidly executed reform diluted
the quality of schooling, the education received by post-1980 cohorts had significant welfare-
enhancing implications. It also serves as a proxy for the social skills and cognitive abilities that are
hypothesized to link education to political participation (Hillygus, 2005). According to Rosenstone
and Hansen (1993), among others, well-educated people are more likely to be politically active
because schooling provides the “skills people need to understand the abstract subject of politics, to
follow the political campaign, and to research and evaluate the issues and candidates.”
Closely related is the idea that increased cognitive ability leads to increased socioeconomic
status (SES). Increased SES can lead to greater political participation either because some forms
of participation are costly, or because higher economic status leads to greater involvement in social
networks, which are entry points into such participation (Verba, Schlozman and Brady, 1995). We
nomic crisis did not systematically differ by type of survey respondent. This suggests that suchvariables are not driving any differential response across these periods.
37
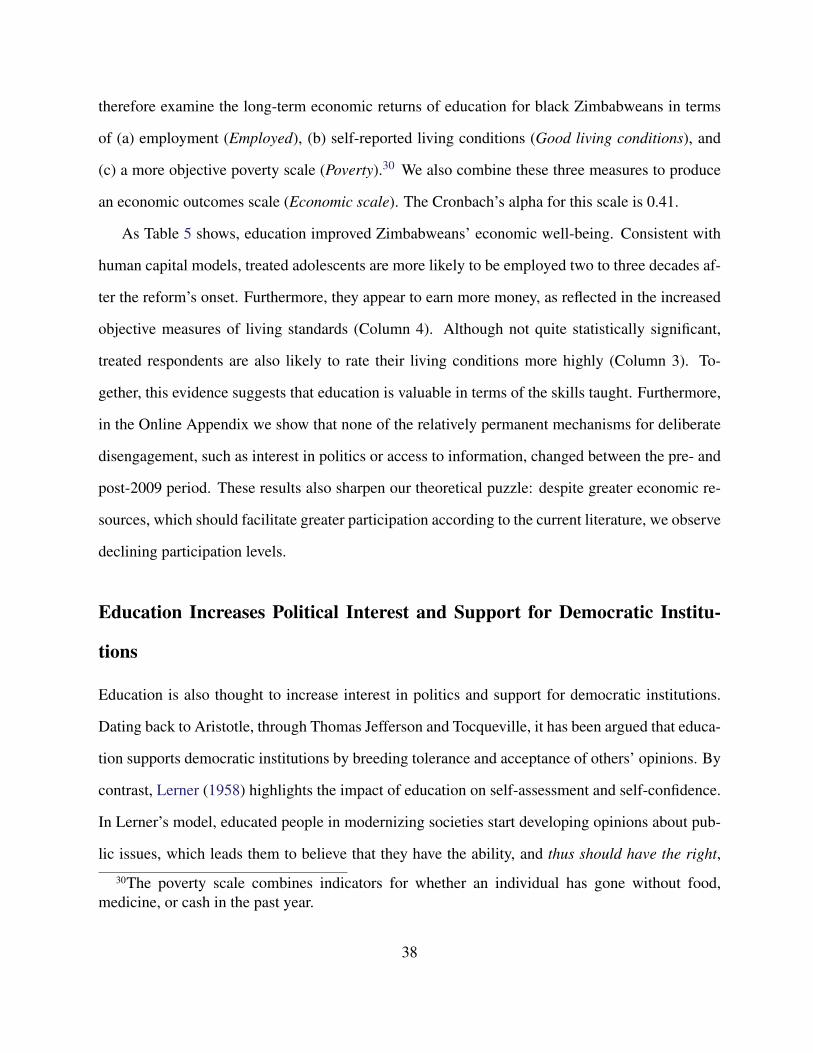
therefore examine the long-term economic returns of education for black Zimbabweans in terms
of (a) employment (Employed), (b) self-reported living conditions (Good living conditions), and
(c) a more objective poverty scale (Poverty).30 We also combine these three measures to produce
an economic outcomes scale (Economic scale). The Cronbach’s alpha for this scale is 0.41.
As Table 5 shows, education improved Zimbabweans’ economic well-being. Consistent with
human capital models, treated adolescents are more likely to be employed two to three decades af-
ter the reform’s onset. Furthermore, they appear to earn more money, as reflected in the increased
objective measures of living standards (Column 4). Although not quite statistically significant,
treated respondents are also likely to rate their living conditions more highly (Column 3). To-
gether, this evidence suggests that education is valuable in terms of the skills taught. Furthermore,
in the Online Appendix we show that none of the relatively permanent mechanisms for deliberate
disengagement, such as interest in politics or access to information, changed between the pre- and
post-2009 period. These results also sharpen our theoretical puzzle: despite greater economic re-
sources, which should facilitate greater participation according to the current literature, we observe
declining participation levels.
Education Increases Political Interest and Support for Democratic Institu-
tions
Education is also thought to increase interest in politics and support for democratic institutions.
Dating back to Aristotle, through Thomas Jefferson and Tocqueville, it has been argued that educa-
tion supports democratic institutions by breeding tolerance and acceptance of others’ opinions. By
contrast, Lerner (1958) highlights the impact of education on self-assessment and self-confidence.
In Lerner’s model, educated people in modernizing societies start developing opinions about pub-
lic issues, which leads them to believe that they have the ability, and thus should have the right,30The poverty scale combines indicators for whether an individual has gone without food,
medicine, or cash in the past year.
38
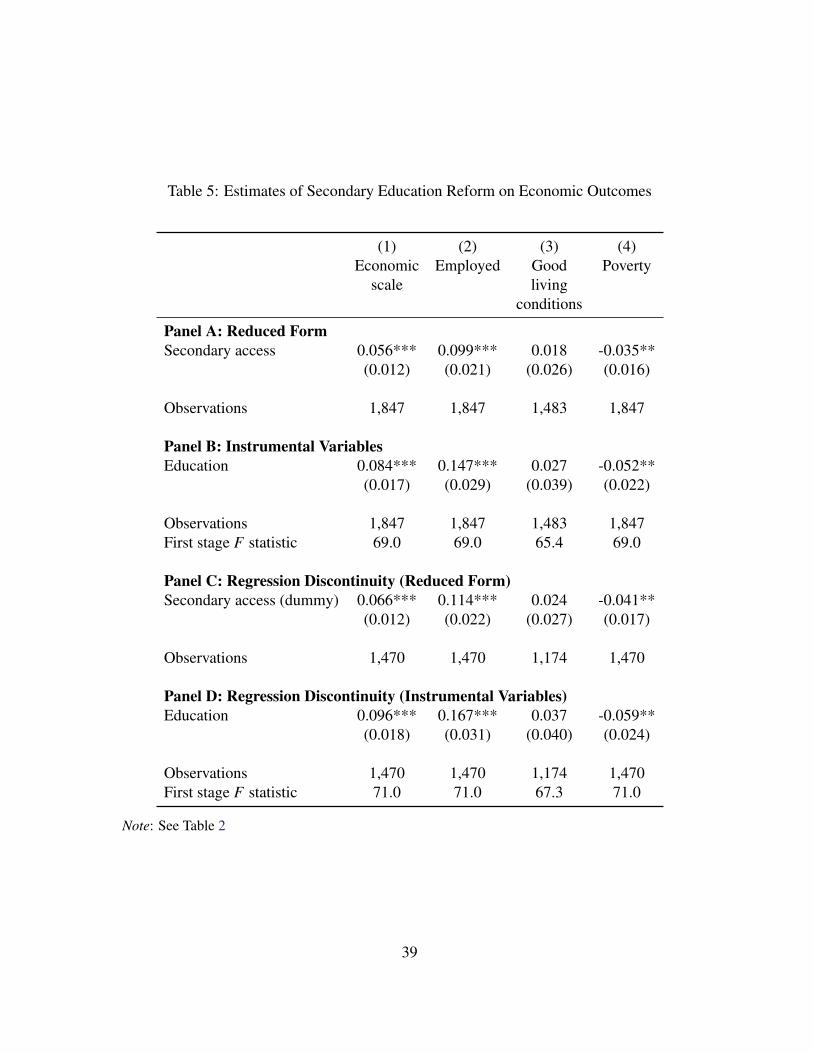
Table 5: Estimates of Secondary Education Reform on Economic Outcomes
(1) (2) (3) (4)Economic Employed Good Poverty
scale livingconditions
Panel A: Reduced FormSecondary access 0.056*** 0.099*** 0.018 -0.035**
(0.012) (0.021) (0.026) (0.016)
Observations 1,847 1,847 1,483 1,847
Panel B: Instrumental VariablesEducation 0.084*** 0.147*** 0.027 -0.052**
(0.017) (0.029) (0.039) (0.022)
Observations 1,847 1,847 1,483 1,847First stage F statistic 69.0 69.0 65.4 69.0
Panel C: Regression Discontinuity (Reduced Form)Secondary access (dummy) 0.066*** 0.114*** 0.024 -0.041**
(0.012) (0.022) (0.027) (0.017)
Observations 1,470 1,470 1,174 1,470
Panel D: Regression Discontinuity (Instrumental Variables)Education 0.096*** 0.167*** 0.037 -0.059**
(0.018) (0.031) (0.040) (0.024)
Observations 1,470 1,470 1,174 1,470First stage F statistic 71.0 71.0 67.3 71.0
Note: See Table 2
39
to provide input on matters of importance that affect their welfare. This psychological change,
argues Lerner (1958), translates into growing support for inclusive political institutions. Interest in
politics is also important for citizen behavior, as informed citizens can more accurately assess gov-
ernment performance and the likelihood that participation can affect political change. We therefore
test whether education both increases interest in politics and support for democratic institutions.
Importantly, a null finding would be at odds with our “deliberate disengagement” argument.
Political interest is operationalized using three distinct measures. First, News scale combines
indicators for whether respondents are exposed to news from the radio, television, or newspapers
at least once a week. The scale has a Cronbach’s alpha of 0.74. Second, Politics not complicated is
an indicator variable for the 33% of respondents that agrees or strongly agrees that understanding
politics is not complicated. Third, Discuss politics is an indicator for the 73% of respondents that
report that they occasionally or frequently discuss politics with friends or family. In each case,
higher values suggest greater political interest.
We measure support for democracy in two ways. First, we examine the relationship between
education and Support democracy, an indicator for the 72% of respondents claiming to support
or strongly support democracy. Importantly, this question is not asking respondents whether they
approve of democracy as practiced in Zimbabwe. Second, to better capture specific support for
the liberal institutions associated with democracy, we group the following nine indicators into a
scale: do you agree that parties are needed, do you reject one-party government, do you reject
one-man government, are you against government banning civil society organizations, are you
against government closing news stations, are you against presidential discretion, are you in favor
of parliament making the laws, do you agree that the president should obey the laws, and do
you support term limits. All the variables that make up this Support liberal institutions index are
positively correlated with a Cronbach’s alpha of 0.83. Finally, we combine these two variables to
produce a Pro-democracy scale (alpha of 0.41). As with political interest, larger values indicate
greater support for democratic institutions.
40
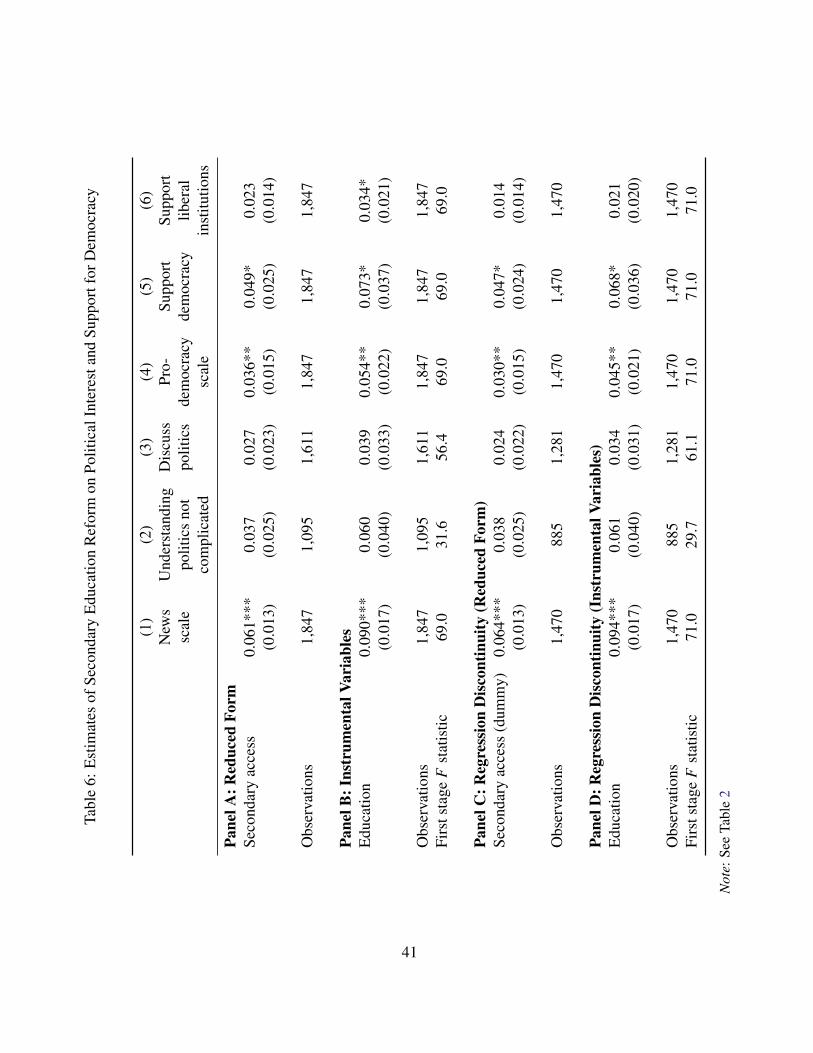
Tabl
e6:
Estim
ates
ofSe
cond
ary
Educ
atio
nR
efor
mon
Polit
ical
Inte
rest
and
Supp
ortf
orD
emoc
racy
(1)
(2)
(3)
(4)
(5)
(6)
New
sU
nder
stan
ding
Dis
cuss
Pro-
Supp
ort
Supp
ort
scal
epo
litic
sno
tpo
litic
sde
moc
racy
dem
ocra
cylib
eral
com
plic
ated
scal
ein
stitu
tions
Pane
lA:R
educ
edFo
rmSe
cond
ary
acce
ss0.
061*
**0.
037
0.02
70.
036*
*0.
049*
0.02
3(0
.013
)(0
.025
)(0
.023
)(0
.015
)(0
.025
)(0
.014
)
Obs
erva
tions
1,84
71,
095
1,61
11,
847
1,84
71,
847
Pane
lB:I
nstr
umen
talV
aria
bles
Educ
atio
n0.
090*
**0.
060
0.03
90.
054*
*0.
073*
0.03
4*(0
.017
)(0
.040
)(0
.033
)(0
.022
)(0
.037
)(0
.021
)
Obs
erva
tions
1,84
71,
095
1,61
11,
847
1,84
71,
847
Firs
tsta
geF
stat
istic
69.0
31.6
56.4
69.0
69.0
69.0
Pane
lC:R
egre
ssio
nD
isco
ntin
uity
(Red
uced
Form
)Se
cond
ary
acce
ss(d
umm
y)0.
064*
**0.
038
0.02
40.
030*
*0.
047*
0.01
4(0
.013
)(0
.025
)(0
.022
)(0
.015
)(0
.024
)(0
.014
)
Obs
erva
tions
1,47
088
51,
281
1,47
01,
470
1,47
0
Pane
lD:R
egre
ssio
nD
isco
ntin
uity
(Ins
trum
enta
lVar
iabl
es)
Educ
atio
n0.
094*
**0.
061
0.03
40.
045*
*0.
068*
0.02
1(0
.017
)(0
.040
)(0
.031
)(0
.021
)(0
.036
)(0
.020
)
Obs
erva
tions
1,47
088
51,
281
1,47
01,
470
1,47
0Fi
rsts
tage
Fst
atis
tic71
.029
.761
.171
.071
.071
.0
Not
e:Se
eTa
ble
2
41
Consistent with a large number of studies from Western democracies, Table 6 shows that educa-
tion in Zimbabwe has a positive effect on political interest and support for democratic institutions.
For political interest, a one-unit increase in education raises the likelihood that an individual reg-
ularly obtains political news by around 9 percentage points, or 25% relative to the sample mean
(Column 1). Similarly, we find a positive, if weaker, effect of education on the belief that politics is
not complicated (Column 2) and the frequency with which individuals discuss politics (Column 3).
Our estimates thus demonstrate that reduced participation is not simply accounted for by a reduced
interest in politics. In fact, educated Zimbabweans are more interested in politics, at the same time
that they are less likely to participate.
Similarly belying an explanation rooted in a limited demand for democracy, we find that ed-
ucation increases support for democracy in the abstract (Column 4). Similarly, we find that an
additional unit of education significantly increases the likelihood that an individual professes sup-
port for democracy by 7 percentage points (Column 5). The positive effect on support for liberal
institutions suggests that voters possess a genuine understanding of the institutional building blocks
required to support liberal democracy, although these estimates are typically not quite statistically
significant (Column 6). In sum, our results suggest that, consistent with our deliberate disengage-
ment argument, support for democracy increases with education.
Education Increases Criticism of the Incumbent Regime
If education reduces participation in non-contentious political action due to deliberate disengage-
ment, it follows that education should be associated with reduced support for the incumbent auto-
cratic regime. Qualitative assessments are consistent with this theoretical expectation. For exam-
ple, Chung (2006, 310) states that “the democratization of education also led to growing criticism
of the government, as education enabled the newly educated young to voice their opinions elo-
quently and openly.”
To explicitly test this proposition, we assess support for the government using four different
42
measures. Our first and second measures, Close to ZANU-PF and Close to MDC, indicate whether
respondents claim to feel close or very close to the ruling party and the main opposition party;
24% and 23% of respondents reported being close or very close to ZANU-PF and the MDC,
respectively. Third, we create a variable named Incumbent trust and performance, which is a
summative rating scale combining three indicators for trusting the president, the ruling party, and
its MPs, and three indicators for whether the respondent believes that the president, MPs, and
the local government are performing well in office (alpha of 0.85). Fourth, Perceived government
corruption is a summative rating scale (alpha of 0.75) that combines four indicator variables asking
whether the respondent believes the president, MPs, local councilors, and government officials are
corrupt. Finally, we combine these four variables to produce the View of government scale (alpha
of 0.58).
The results, shown in Table 7, support our theoretical argument: across all specifications in
Column (1), access to secondary education has a negative effect on the support for the government
scale. Furthermore, Columns (2) and (3) show a significant decrease in support for ZANU-PF
as well as a significant increase in support for the MDC. Trust in government also broadly de-
creases with education (Column 4). Finally, and consistent with the idea that political interest
might decrease support for the regime, perceptions of corruption significantly increase with edu-
cation. These findings suggest that more-educated citizens are more critical of Mugabe’s regime
and cognizant of its problems.
Alternative Explanations
Finally, we eliminate alternative explanations of our argument of deliberate disengagement. First
we test whether uneducated voters are disproportionately the targets of turnout mobilization drives,
because vote-buying efforts either target the poor or the regime’s core supporters (Stokes et al.,
2013). Less-educated voters seem a priori to be more likely to be included in such patronage
networks. We therefore create the variable Received gift that indicates whether respondents report
43
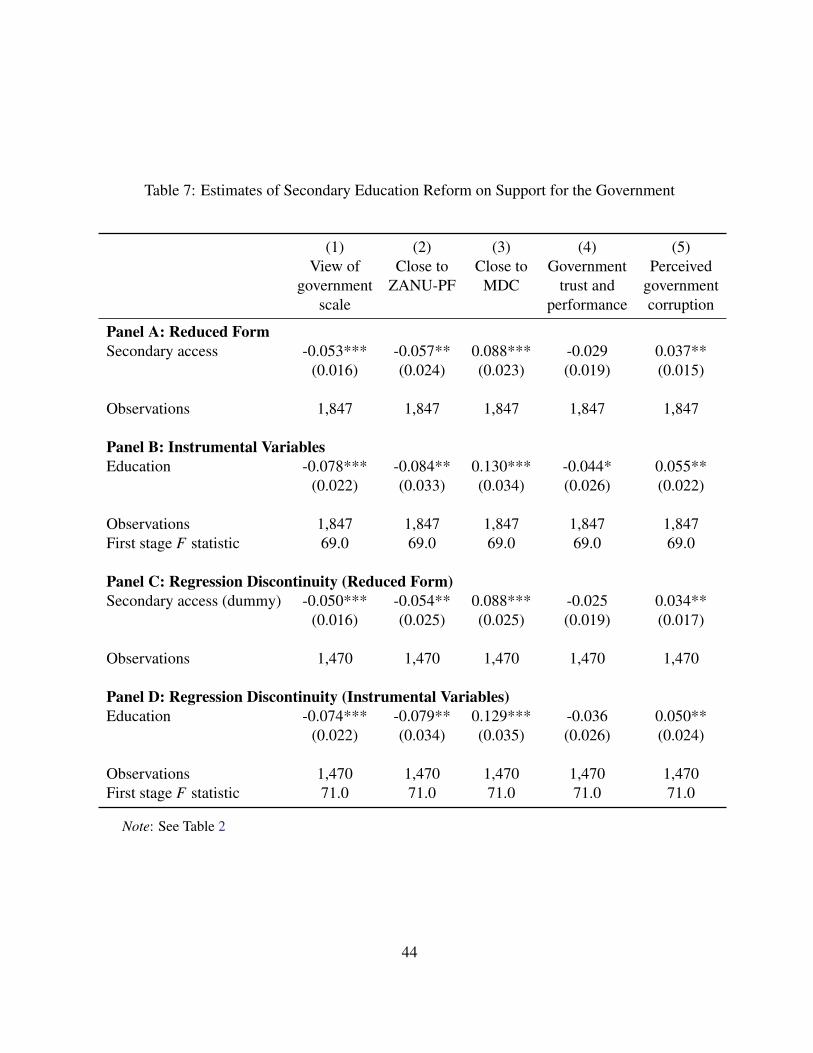
Table 7: Estimates of Secondary Education Reform on Support for the Government
(1) (2) (3) (4) (5)View of Close to Close to Government Perceived
government ZANU-PF MDC trust and governmentscale performance corruption
Panel A: Reduced FormSecondary access -0.053*** -0.057** 0.088*** -0.029 0.037**
(0.016) (0.024) (0.023) (0.019) (0.015)
Observations 1,847 1,847 1,847 1,847 1,847
Panel B: Instrumental VariablesEducation -0.078*** -0.084** 0.130*** -0.044* 0.055**
(0.022) (0.033) (0.034) (0.026) (0.022)
Observations 1,847 1,847 1,847 1,847 1,847First stage F statistic 69.0 69.0 69.0 69.0 69.0
Panel C: Regression Discontinuity (Reduced Form)Secondary access (dummy) -0.050*** -0.054** 0.088*** -0.025 0.034**
(0.016) (0.025) (0.025) (0.019) (0.017)
Observations 1,470 1,470 1,470 1,470 1,470
Panel D: Regression Discontinuity (Instrumental Variables)Education -0.074*** -0.079** 0.129*** -0.036 0.050**
(0.022) (0.034) (0.035) (0.026) (0.024)
Observations 1,470 1,470 1,470 1,470 1,470First stage F statistic 71.0 71.0 71.0 71.0 71.0
Note: See Table 2
44
receiving a gift from a political party before the most recent elections.31 We also create an indica-
tor, Freedom to choose vote, which proxies for pre-commitment to a party in exchange for some
benefit.
A second potential alternative explanation is that lower levels of political participation simply
reflect the greater repression of educated citizens, for example, in order to suppress the opposition
vote share. Similarly, educated citizens may pre-emptively disengage to avoid facing violence by
signaling that they are not troublemakers. This channel seems plausible, given that in both the 2002
and 2008 elections the regime targeted significant violent repression at suspected MDC supporters.
We thus create an indicator variable, Fear repression, which captures whether respondents fear that
they will be repressed. Similarly, we create Vote monitored, which captures respondents’ belief that
the authorities can know how they vote.
We do not find support for these alternative explanations. Columns (1) and (2) of Table 8 show
that greater education does not decrease the likelihood that voters receive a gift during election
campaigns or perceive their vote to be unfree. If anything, more-educated voters are slightly more
likely to receive a gift, although the difference is insignificant around the discontinuity. Further-
more, if mobilization were driving our results, we might expect the negative effect of education to
be largest in locations dominated by ZANU-PF or where turnout is high. However, Columns (3)
and (4) report no significant negative coefficient on the interaction of access to secondary school
for either the district-level ZANU-PF vote share or the turnout rate at the most recent election.
We conclude that being more-educated does not significantly reduce the likelihood that a voter is
mobilized.
Turning to the repression hypothesis, Columns (1) and (3) in Table 9 show that education does
not affect a respondent’s fear that they will be repressed or their belief that voting is monitored.
Although the point estimates are positive, neither is close to being statistically significant. Given
that Mugabe has historically regarded the Ndebele as the opposition, if education induces greater31This question has recently been used to proxy vote buying (Kramon, 2014).
45
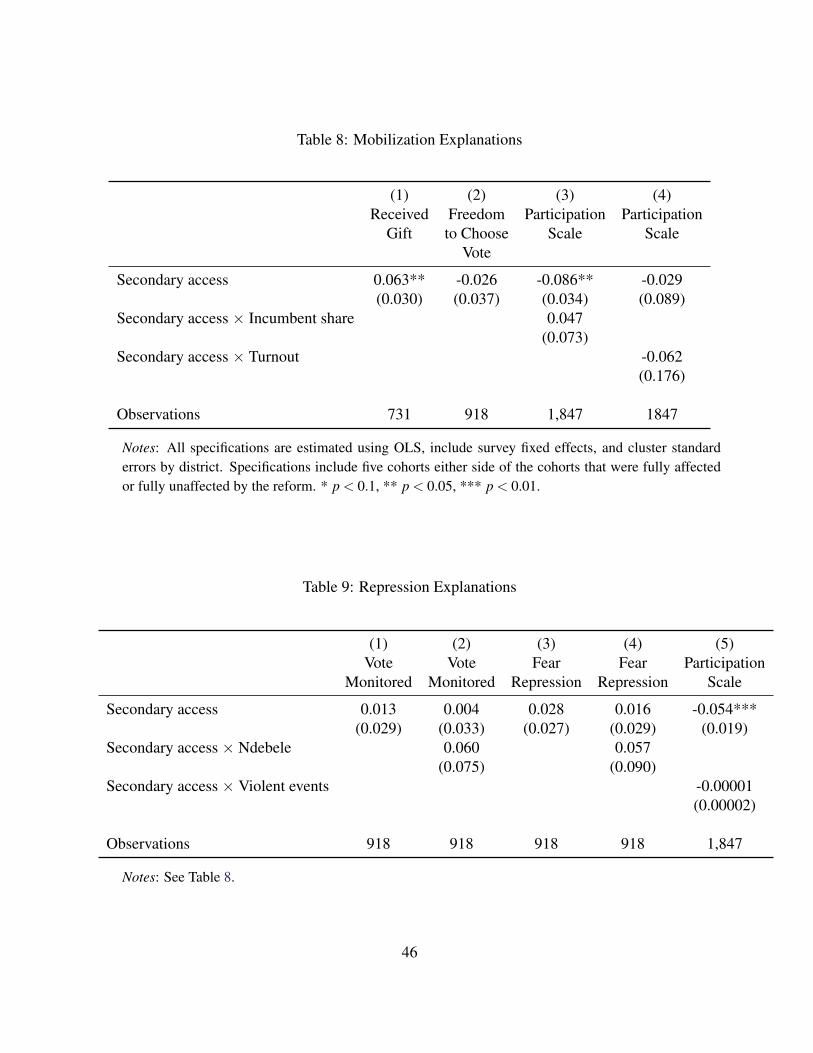
Table 8: Mobilization Explanations
(1) (2) (3) (4)Received Freedom Participation Participation
Gift to Choose Scale ScaleVote
Secondary access 0.063** -0.026 -0.086** -0.029(0.030) (0.037) (0.034) (0.089)
Secondary access ⇥ Incumbent share 0.047(0.073)
Secondary access ⇥ Turnout -0.062(0.176)
Observations 731 918 1,847 1847
Notes: All specifications are estimated using OLS, include survey fixed effects, and cluster standarderrors by district. Specifications include five cohorts either side of the cohorts that were fully affectedor fully unaffected by the reform. * p < 0.1, ** p < 0.05, *** p < 0.01.
Table 9: Repression Explanations
(1) (2) (3) (4) (5)Vote Vote Fear Fear Participation
Monitored Monitored Repression Repression Scale
Secondary access 0.013 0.004 0.028 0.016 -0.054***(0.029) (0.033) (0.027) (0.029) (0.019)
Secondary access ⇥ Ndebele 0.060 0.057(0.075) (0.090)
Secondary access ⇥ Violent events -0.00001(0.00002)
Observations 918 918 918 918 1,847
Notes: See Table 8.
46
fear then we should expect this to be greatest among the Ndebele. Again, the data does not support
this possibility (Columns 2 and 4). Finally, we show that in districts with a large number of
instances of violence against civilians by ZANU-PF—Violent events, as measured by the Armed
Conflict Location and Event Data Project—educated voters are no less likely to participate in
politics (Column 5).
Conclusion
Reflecting on the large positive correlation between education and political participation, Phillip
Converse famously wrote that “education is everywhere the universal solvent, and the relationship
is always in the same direction” (Converse, 1972, 324). In this article we seek to qualify “Con-
verse’s law” by testing whether the positive relationship between education and participation holds
in electoral authoritarian settings. Specifically, we develop and test a theory of “deliberate disen-
gagement,” according to which the more-educated citizenry may decide to disengage from politics
when initial political liberalization efforts prove to be futile. Non-participation, we further argue,
may serve as a non-violent form of protest designed to deprive the autocratic regime of enjoying a
semblance of legitimacy. We then demonstrate this argument using the case of Zimbabwe, which
in the past three decades has been controlled by a paradigmatic electoral authoritarian regime.
In short, our results strongly suggest that “Converse’s law” should indeed be qualified. Ex-
ploiting Zimbabwe’s major education reforms in 1980 as a natural experiment, we find that, in
Zimbabwe, education reduces various forms of non-contentious political action. This finding is
robust to various estimation approaches, to the inclusion and exclusion of “partially treated” re-
spondents, to the inclusion of a battery of pre-treatment control variables, to various placebo tests,
and to varying the length of the bandwidth around the cohort-eligibility cutoff point. This is, to
the best of our knowledge, the first article to argue—and causally demonstrate—that the positive
relationship between education and political participation is conditional on regime type. As such, it
47
makes an important contribution to our understanding of the determinants of political participation
in the developing world.
We also provide considerable evidence to support our claim that more-educated voters exhibit
lower levels of political participation due to deliberate disengagement rather than another possible
channel. Consistent with our theoretical argument, we find that education causally leads to greater
support for democracy, weaker support for the incumbent autocrat, greater interest in politics, and
higher living standards. We further find that these results are unlikely to be driven by alternative
explanations such as political repression, though we acknowledge that this may be an effective
strategy for depressing support among opposition supporters. Demonstrating that more-educated
citizens are likely to withdraw from the political sphere is important, because it may shed new light
on some of the reasons why many initially liberalizing countries have gotten “stuck” in hybrid
equilibria (Carothers, 2002). As such, our findings also contribute to theories of autocratic regime
stability.
Naturally, the findings reported in this study raise concerns regarding external validity. First,
to provide a suggestive step in this direction, we pool the Afrobarometer surveys for all available
countries and test whether the relationship between education and voting depends on regime type.
Encouragingly, we find a significant negative correlation for closed anocracies (Burkina Faso, Tan-
zania, Uganda, and Zimbabwe, where Polity scores are between -4 and 0), and weak insignificant
correlations for open anocracies (where Polity scores are between 1 and 5). While these corre-
lations suggest that our findings might apply beyond Zimbabwe, more work is needed to further
qualify the conditions under which educated citizens choose to withdraw from the political sphere.
Second, this study investigates the negative effects of education on non-violent forms of participa-
tion. A fruitful avenue of future research would be to explore the conditions under which education
leads individuals to instead support political violence, as Friedman et al. (2011) find in Western
Kenya, or to personally adopt violent means of opposing an autocrat, as seems to be the case in
Burundi (Samii and West, 2014).
48
References
Acemoglu, Daron, Simon Johnson, James A. Robinson and Pierre Yared. 2005. “From Education
to Democracy?” American Economic Review 95(2):44–49.
Aguero, Jorge M. and Maithili Ramachandran. 2014. “The Intergenerational Effects of Increasing
Parental Schooling: Evidence from Zimbabwe.” Working paper.
Aguero, Jorge M. and Prashant Bharadwaj. 2014. “Do the More Educated Know More about
Health? Evidence from Schooling and HIV Knowledge in Zimbabwe.” Economic Development
and Cultural Change 62(3):489–517.
Almond, Gabriel A. and Sidney Verba. 1963. The Civic Culture: Political Attitudes and Democracy
in Five Nations. Princeton, NJ: Princeton University Press.
Alwin, Duane F. and Jon A. Krosnick. 1991. “Aging, Cohorts, and the Stability of Sociopolitical
Orientations Over the Life Span.” American Journal of Sociology 97(1):169–195.
Angrist, Joshua D., Guido W. Imbens and Donald B. Rubin. 1996. “Identification of Causal Effects
Using Instrumental Variables.” Journal of the American Statistical Association 91(June):444–
455.
Atkinson, Norman Joseph. 1972. Teaching Rhodesians: a history of educational policy in Rhode-
sia. Longman.
Barro, Robert J. 1999. “Determinants of Democracy.” Journal of Political Economy 107(S6):158–
183.
Berinsky, Adam J. and Gabriel S. Lenz. 2011. “Education and Political Participation: Exploring
the Causal Link.” Political Behavior 33(3):357–373.
49
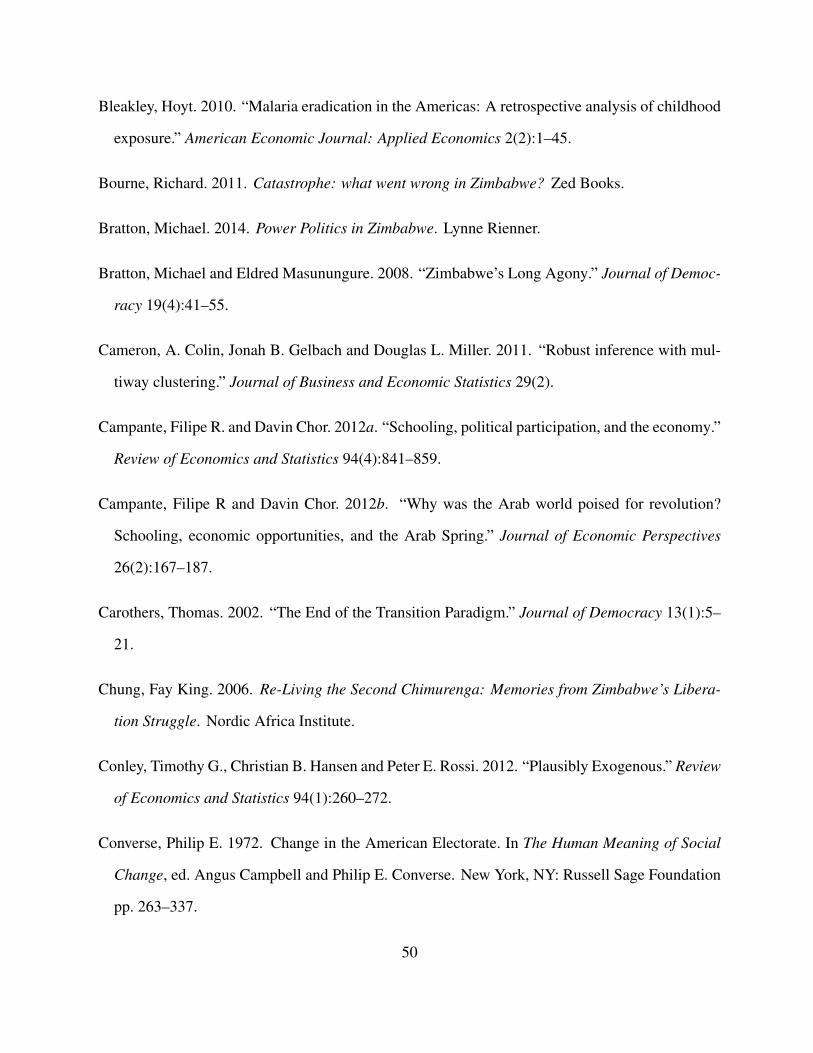
Bleakley, Hoyt. 2010. “Malaria eradication in the Americas: A retrospective analysis of childhood
exposure.” American Economic Journal: Applied Economics 2(2):1–45.
Bourne, Richard. 2011. Catastrophe: what went wrong in Zimbabwe? Zed Books.
Bratton, Michael. 2014. Power Politics in Zimbabwe. Lynne Rienner.
Bratton, Michael and Eldred Masunungure. 2008. “Zimbabwe’s Long Agony.” Journal of Democ-
racy 19(4):41–55.
Cameron, A. Colin, Jonah B. Gelbach and Douglas L. Miller. 2011. “Robust inference with mul-
tiway clustering.” Journal of Business and Economic Statistics 29(2).
Campante, Filipe R. and Davin Chor. 2012a. “Schooling, political participation, and the economy.”
Review of Economics and Statistics 94(4):841–859.
Campante, Filipe R and Davin Chor. 2012b. “Why was the Arab world poised for revolution?
Schooling, economic opportunities, and the Arab Spring.” Journal of Economic Perspectives
26(2):167–187.
Carothers, Thomas. 2002. “The End of the Transition Paradigm.” Journal of Democracy 13(1):5–
21.
Chung, Fay King. 2006. Re-Living the Second Chimurenga: Memories from Zimbabwe’s Libera-
tion Struggle. Nordic Africa Institute.
Conley, Timothy G., Christian B. Hansen and Peter E. Rossi. 2012. “Plausibly Exogenous.” Review
of Economics and Statistics 94(1):260–272.
Converse, Philip E. 1972. Change in the American Electorate. In The Human Meaning of Social
Change, ed. Angus Campbell and Philip E. Converse. New York, NY: Russell Sage Foundation
pp. 263–337.
50
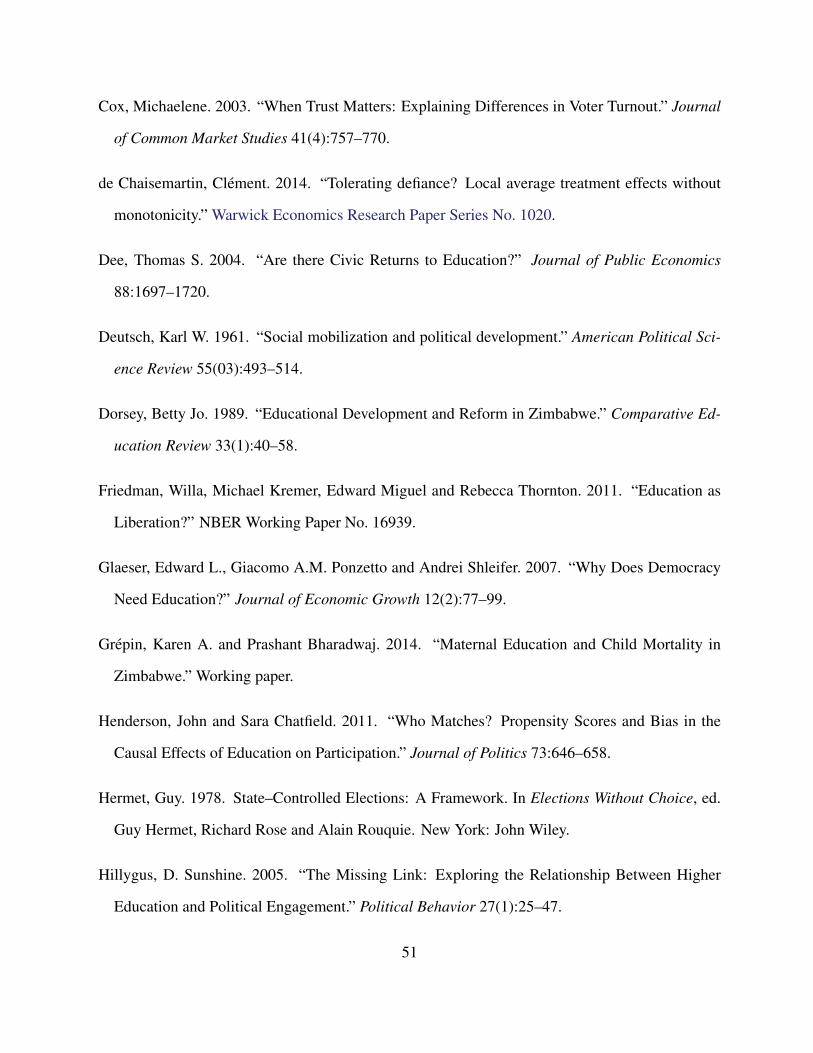
Cox, Michaelene. 2003. “When Trust Matters: Explaining Differences in Voter Turnout.” Journal
of Common Market Studies 41(4):757–770.
de Chaisemartin, Clement. 2014. “Tolerating defiance? Local average treatment effects without
monotonicity.” Warwick Economics Research Paper Series No. 1020.
Dee, Thomas S. 2004. “Are there Civic Returns to Education?” Journal of Public Economics
88:1697–1720.
Deutsch, Karl W. 1961. “Social mobilization and political development.” American Political Sci-
ence Review 55(03):493–514.
Dorsey, Betty Jo. 1989. “Educational Development and Reform in Zimbabwe.” Comparative Ed-
ucation Review 33(1):40–58.
Friedman, Willa, Michael Kremer, Edward Miguel and Rebecca Thornton. 2011. “Education as
Liberation?” NBER Working Paper No. 16939.
Glaeser, Edward L., Giacomo A.M. Ponzetto and Andrei Shleifer. 2007. “Why Does Democracy
Need Education?” Journal of Economic Growth 12(2):77–99.
Grepin, Karen A. and Prashant Bharadwaj. 2014. “Maternal Education and Child Mortality in
Zimbabwe.” Working paper.
Henderson, John and Sara Chatfield. 2011. “Who Matches? Propensity Scores and Bias in the
Causal Effects of Education on Participation.” Journal of Politics 73:646–658.
Hermet, Guy. 1978. State–Controlled Elections: A Framework. In Elections Without Choice, ed.
Guy Hermet, Richard Rose and Alain Rouquie. New York: John Wiley.
Hillygus, D. Sunshine. 2005. “The Missing Link: Exploring the Relationship Between Higher
Education and Political Engagement.” Political Behavior 27(1):25–47.
51
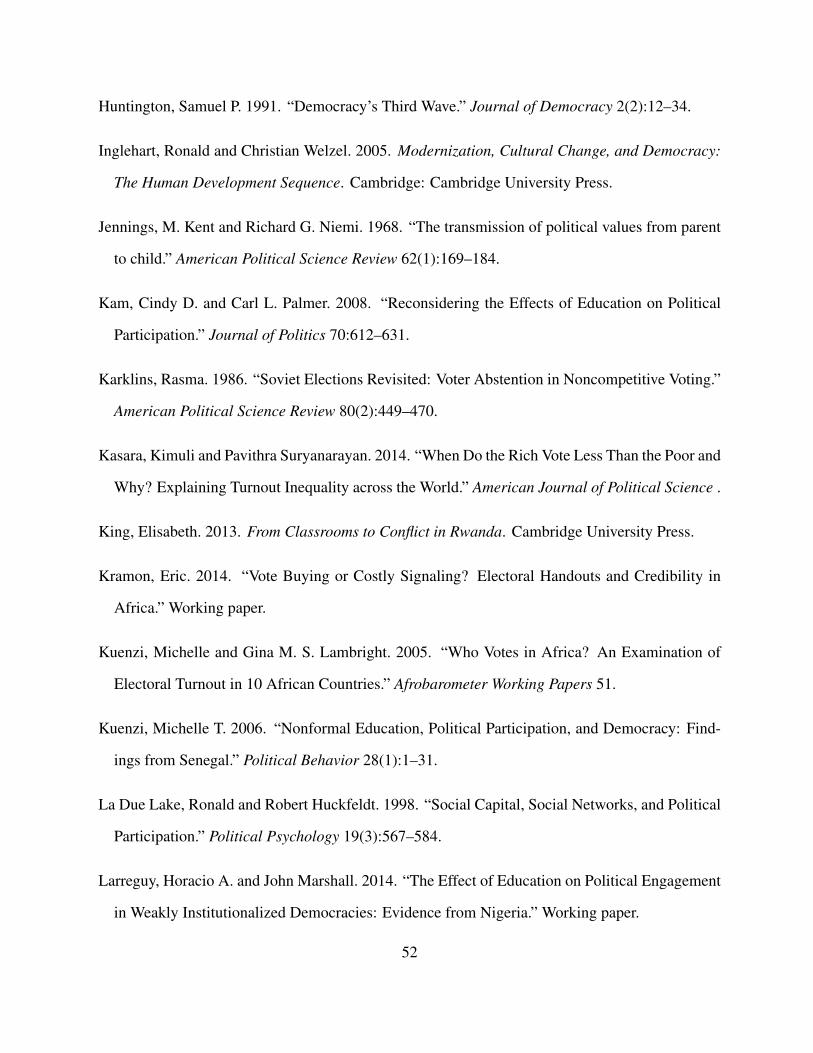
Huntington, Samuel P. 1991. “Democracy’s Third Wave.” Journal of Democracy 2(2):12–34.
Inglehart, Ronald and Christian Welzel. 2005. Modernization, Cultural Change, and Democracy:
The Human Development Sequence. Cambridge: Cambridge University Press.
Jennings, M. Kent and Richard G. Niemi. 1968. “The transmission of political values from parent
to child.” American Political Science Review 62(1):169–184.
Kam, Cindy D. and Carl L. Palmer. 2008. “Reconsidering the Effects of Education on Political
Participation.” Journal of Politics 70:612–631.
Karklins, Rasma. 1986. “Soviet Elections Revisited: Voter Abstention in Noncompetitive Voting.”
American Political Science Review 80(2):449–470.
Kasara, Kimuli and Pavithra Suryanarayan. 2014. “When Do the Rich Vote Less Than the Poor and
Why? Explaining Turnout Inequality across the World.” American Journal of Political Science .
King, Elisabeth. 2013. From Classrooms to Conflict in Rwanda. Cambridge University Press.
Kramon, Eric. 2014. “Vote Buying or Costly Signaling? Electoral Handouts and Credibility in
Africa.” Working paper.
Kuenzi, Michelle and Gina M. S. Lambright. 2005. “Who Votes in Africa? An Examination of
Electoral Turnout in 10 African Countries.” Afrobarometer Working Papers 51.
Kuenzi, Michelle T. 2006. “Nonformal Education, Political Participation, and Democracy: Find-
ings from Senegal.” Political Behavior 28(1):1–31.
La Due Lake, Ronald and Robert Huckfeldt. 1998. “Social Capital, Social Networks, and Political
Participation.” Political Psychology 19(3):567–584.
Larreguy, Horacio A. and John Marshall. 2014. “The Effect of Education on Political Engagement
in Weakly Institutionalized Democracies: Evidence from Nigeria.” Working paper.
52
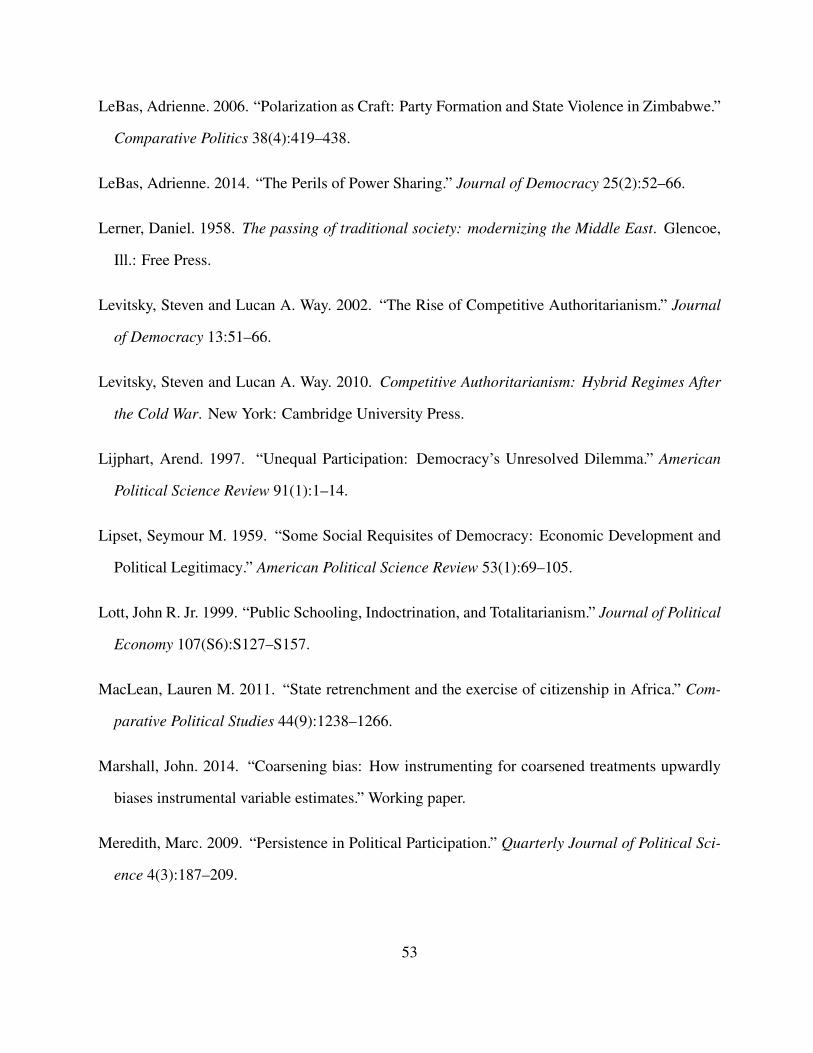
LeBas, Adrienne. 2006. “Polarization as Craft: Party Formation and State Violence in Zimbabwe.”
Comparative Politics 38(4):419–438.
LeBas, Adrienne. 2014. “The Perils of Power Sharing.” Journal of Democracy 25(2):52–66.
Lerner, Daniel. 1958. The passing of traditional society: modernizing the Middle East. Glencoe,
Ill.: Free Press.
Levitsky, Steven and Lucan A. Way. 2002. “The Rise of Competitive Authoritarianism.” Journal
of Democracy 13:51–66.
Levitsky, Steven and Lucan A. Way. 2010. Competitive Authoritarianism: Hybrid Regimes After
the Cold War. New York: Cambridge University Press.
Lijphart, Arend. 1997. “Unequal Participation: Democracy’s Unresolved Dilemma.” American
Political Science Review 91(1):1–14.
Lipset, Seymour M. 1959. “Some Social Requisites of Democracy: Economic Development and
Political Legitimacy.” American Political Science Review 53(1):69–105.
Lott, John R. Jr. 1999. “Public Schooling, Indoctrination, and Totalitarianism.” Journal of Political
Economy 107(S6):S127–S157.
MacLean, Lauren M. 2011. “State retrenchment and the exercise of citizenship in Africa.” Com-
parative Political Studies 44(9):1238–1266.
Marshall, John. 2014. “Coarsening bias: How instrumenting for coarsened treatments upwardly
biases instrumental variable estimates.” Working paper.
Meredith, Marc. 2009. “Persistence in Political Participation.” Quarterly Journal of Political Sci-
ence 4(3):187–209.
53

Mullainathan, Sendhil and Ebonya Washington. 2009. “Sticking with Your Vote: Cognitive Disso-
nance and Political Attitudes.” American Economic Journal: Applied Economics 1(1):86–111.
Murtin, Fabrice and Romain Wacziarg. 2014. “The democratic transition.” Journal of Economic
Growth 19(2):141–181.
Narman, Anders. 2003. Education in Zimbabwe: A Matter of Success? In Twenty Years of In-
dependence in Zimbabwe: From Liberation to Authoritarianism, ed. Staffan Darnolf and Liisa
Laakso. London, UK: Palgrave Macmillan.
Nhundu, Tichatonga J. 1992. “A Decade of Educational Expansion in Zimbabwe: Causes, Conse-
quences, and Policy Contradictions.” Journal of Negro Education 61(1):78–98.
Nie, Norman H., Jane Junn and Kenneth Stehlik-Barry. 1996. Education and Democratic Citizen-
ship in America. University of Chicago Press.
Norris, Pippa. 2002. Democratic Phoenix: Reinventing Political Activism. Cambridge: Cambridge
University Press.
Persson, Mikael. 2011. “An Empirical Test of the Relative Education Model in Sweden.” Political
Behavior 33(3):455 – 478.
Posner, Daniel N. and David J. Simon. 2002. “Economic Conditions and Incumbent Support in
Africa’s New Democracies Evidence from Zambia.” Comparative Political Studies 35(3):313–
336.
Putnam, Robert D. 1995. “Bowling Alone: America’s Declining Social Capital.” Journal of
Democracy 6(1):65–78.
Riddell, Roger. 1980. From Rhodesia to Zimbabwe: Alternatives to Poverty. Catholic Institute for
International Relations.
54
Rosenstone, Steven and John M. Hansen. 1993. Mobilization, Participation and Democracy in
America. New York: MacMillan Publishing.
Rousseau, Jean-Jacques. 1997. Rousseau: “The Social Contract” and Other Later Political Writ-
ings. Cambridge: Cambridge University Press.
Samii, Cyrus and Emily West. 2014. “Glass Ceiling Revolt? Theory and Evidence from Burundi.”
Working paper.
Schedler, Andreas. 2013. The Politics of Uncertainty: Sustaining and Subverting Electoral Au-
thoritarianism. Oxford: Oxford University Press.
Sears, David O and Nicholas A Valentino. 1997. “Politics matters: Political events as catalysts for
preadult socialization.” American Political Science Review 91(1):45–65.
Sondheimer, Rachel M. and Donald P. Green. 2010. “Using Experiments to Estimate the Effects
of Education on Voter Turnout.” American Journal of Political Science 41(1):178–189.
Spence, Michael. 1973. “Job market signaling.” Quarterly Journal of Economics 87(3):355–374.
Staiger, Douglas and James H. Stock. 1997. “Instrumental Variables Regression with Weak Instru-
ments.” Econometrica 65(3):557–586.
Stokes, Susan C., Thad Dunning, Marcelo Nazareno and Valeria Brusco. 2013. Brokers, Voters,
and Clientelism: The Puzzle of Distributive Politics. Cambridge: Cambridge University Press.
Tenn, Steven. 2007. “The Effect of Education on Voter Turnout.” Political Analysis 15(4):446–464.
Verba, Sidney, Kay Lehman Schlozman and Henry E. Brady. 1995. Voice and Equality: Civic
Voluntarism in American Politics. Cambridge, MA: Harvard University Press.
Wantchekon, Leonard, Natalija Novta and Marko Klasnja. 2013. “Education and Human Capital
Externalities: Evidence from Colonial Benin.” Working Paper.
55
Woodberry, Robert D. 2012. “The Missionary Roots of Liberal Democracy.” American Political
Science Review 106(2):244–274.
56