Embed Size (px)
Citation preview

Elisabeth C. Brüggen, Bram Foubert, & Dwayne D. Gremler
Extreme Makeover: Short- and Long-Term Effects of a Remodeled
ServicescapeUsing survey and transaction data from a natural experiment in a fast-food chain, the authors investigate the effectsof store remodeling. They test (1) short- and long-term effects on customers’ cognitions, affect, and behavioralintentions; (2) the moderating impact of spontaneous versus planned and group versus single-customer storevisits; and (3) the differential effects on two store performance measures: average customer spending and storetraffic. The results show that, in line with adaptation-level theory, short-term remodeling effects lose strength in thelong run (i.e., after six months). Furthermore, customers on a spontaneous trip or in a group tend to be moreresponsive to store remodeling than customers on a planned trip or alone. Finally, whereas average spendingincreases in the short run and then returns to the baseline, store traffic initially remains unaffected and even showsa dip in the long run. These findings imply that ignoring the time-variant character of remodeling effects, the natureof customers’ store visits, or the impact on store traffic may lead to inappropriate allocation of marketing resources.
Keywords: servicescape, store remodeling, adaptation-level theory, marketing effectiveness, long-term effects
Elisabeth C. Brüggen is Assistant Professor of Marketing (e-mail: [email protected]), and Bram Foubert is Assistant Professor of Mar-keting (e-mail: [email protected]), Department of Market-ing and Supply Chain Management, School of Business and Economics,Maastricht University. Dwayne D. Gremler is Professor of Marketing,Department of Marketing, College of Business, Bowling Green State Uni-versity (e-mail: [email protected]). The authors thank Christine Moor-man, Els Gijsbrechts, Mary Jo Bitner, Benedict Dellaert, Harald vanHeerde, Jing Lei, Els Breugelmans, Hannes Datta, and Stephan Ludwigfor their helpful comments and Maria, Katharina, Derya, and Maike fortheir help with the data collection. They also are grateful to Marketing Sci-ence Institute for its financial support of the field experiment and acknowl-edge the generous contributions of time and data by the firm that is thesubject of this study. Finally, the authors appreciate the invaluable guid-ance of the four anonymous JM reviewers.
© 2011, American Marketing Association
ISSN: 0022-2429 (print), 1547-7185 (electronic)
Journal of Marketing
Vol. 75 (September 2011), 71–8771
Retailers spend millions of dollars each year to design,build, and furnish their establishments. Cutthroatcompetition prompts them to employ the store envi-
ronment as a source of differential advantage. For example,in 2002, the restaurant chain Red Lobster started changingits traditional “wharf-side” layout to a “coastal home” set-ting (Nation’s Restaurant News 2003). McDonald’s recentlybegan redesigning its 30,000 eateries, in a makeover ofunprecedented scale, to provide the stores with a contempo-rary, welcoming image (Gogoi, Arndt, and Moiduddin2006). In addition, in 2007, Victoria’s Secret announcedthat it would remodel 80% of its stores over a five-yearperiod (Merrick 2008).
Despite the pervasiveness of store remodeling, researchto date does not provide a sufficient understanding of cus-tomer responses to store makeovers. Various empirical stud-ies document the relationship between the physical storeenvironment, or “servicescape” (Bitner 1992), and cus-
tomers’ cognitive, affective, and behavioral reactions.
Research has demonstrated that customer response is influ-
enced by individual servicescape parameters, such as color
or lighting (e.g., Areni and Kim 1994; Crowley 1993), as
well as more abstract store characteristics, including store
design and ambience (e.g., Baker et al. 2002). However,
several key issues that affect the assessment of store remod-
eling effects remain unaddressed. First, extant research is
mainly cross-sectional and examines differences between
alternative servicescapes in a static setting, such that it
remains unclear whether the effects of a store remodeling
vary over time. Second, few studies examine how store-
visit characteristics moderate servicescape effects. As a
result, current research falls short in identifying settings in
which remodeling pays off more. For example, the
(un)planned character of a visit or the presence of compan-
ions may influence how customers attend to a remodeled
servicescape. Third, current literature focuses exclusively
on in-store responses to the servicescape. However, a com-
plete evaluation of the remodeling impact on store perfor-
mance also requires an understanding of whether remodel-
ing brings more people into the store in the first place.
In this study, we assess the effects of store remodeling
on customers’ cognitions, affect, and behavioral intentions,
as well as on store performance. The purpose of our
research is threefold: We (1) contrast the short-term effects
with those found in the long run, (2) address the moderating
role of store visit characteristics by studying spontaneous
versus planned and group versus single-customer visits, and
(3) compare the remodeling effects on two objective store
performance measures, one that represents consumers’ in-
store behavior (average customer spending) and one that
captures consumers’ decisions to visit the store (store traf-
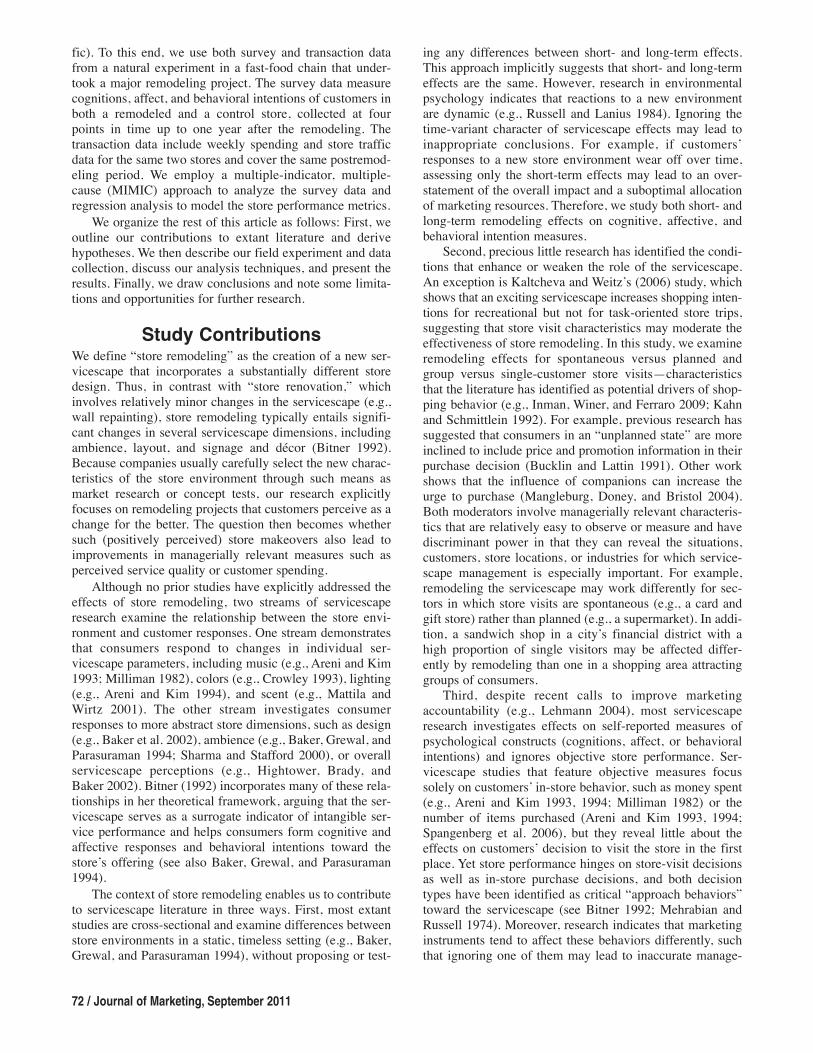
fic). To this end, we use both survey and transaction datafrom a natural experiment in a fast-food chain that under-took a major remodeling project. The survey data measurecognitions, affect, and behavioral intentions of customers inboth a remodeled and a control store, collected at fourpoints in time up to one year after the remodeling. Thetransaction data include weekly spending and store trafficdata for the same two stores and cover the same postremod-eling period. We employ a multiple-indicator, multiple-cause (MIMIC) approach to analyze the survey data andregression analysis to model the store performance metrics.
We organize the rest of this article as follows: First, weoutline our contributions to extant literature and derivehypotheses. We then describe our field experiment and datacollection, discuss our analysis techniques, and present theresults. Finally, we draw conclusions and note some limita-tions and opportunities for further research.
Study ContributionsWe define “store remodeling” as the creation of a new ser-vicescape that incorporates a substantially different storedesign. Thus, in contrast with “store renovation,” whichinvolves relatively minor changes in the servicescape (e.g.,wall repainting), store remodeling typically entails signifi-cant changes in several servicescape dimensions, includingambience, layout, and signage and décor (Bitner 1992).Because companies usually carefully select the new charac-teristics of the store environment through such means asmarket research or concept tests, our research explicitlyfocuses on remodeling projects that customers perceive as achange for the better. The question then becomes whethersuch (positively perceived) store makeovers also lead toimprovements in managerially relevant measures such asperceived service quality or customer spending.
Although no prior studies have explicitly addressed theeffects of store remodeling, two streams of servicescaperesearch examine the relationship between the store envi-ronment and customer responses. One stream demonstratesthat consumers respond to changes in individual ser-vicescape parameters, including music (e.g., Areni and Kim1993; Milliman 1982), colors (e.g., Crowley 1993), lighting(e.g., Areni and Kim 1994), and scent (e.g., Mattila andWirtz 2001). The other stream investigates consumerresponses to more abstract store dimensions, such as design(e.g., Baker et al. 2002), ambience (e.g., Baker, Grewal, andParasuraman 1994; Sharma and Stafford 2000), or overallservicescape perceptions (e.g., Hightower, Brady, andBaker 2002). Bitner (1992) incorporates many of these rela-tionships in her theoretical framework, arguing that the ser-vicescape serves as a surrogate indicator of intangible ser-vice performance and helps consumers form cognitive andaffective responses and behavioral intentions toward thestore’s offering (see also Baker, Grewal, and Parasuraman1994).
The context of store remodeling enables us to contributeto servicescape literature in three ways. First, most extantstudies are cross-sectional and examine differences betweenstore environments in a static, timeless setting (e.g., Baker,Grewal, and Parasuraman 1994), without proposing or test-
72 / Journal of Marketing, September 2011
ing any differences between short- and long-term effects.This approach implicitly suggests that short- and long-termeffects are the same. However, research in environmentalpsychology indicates that reactions to a new environmentare dynamic (e.g., Russell and Lanius 1984). Ignoring thetime-variant character of servicescape effects may lead toinappropriate conclusions. For example, if customers’responses to a new store environment wear off over time,assessing only the short-term effects may lead to an over-statement of the overall impact and a suboptimal allocationof marketing resources. Therefore, we study both short- andlong-term remodeling effects on cognitive, affective, andbehavioral intention measures.
Second, precious little research has identified the condi-tions that enhance or weaken the role of the servicescape.An exception is Kaltcheva and Weitz’s (2006) study, whichshows that an exciting servicescape increases shopping inten-tions for recreational but not for task-oriented store trips,suggesting that store visit characteristics may moderate theeffectiveness of store remodeling. In this study, we examineremodeling effects for spontaneous versus planned andgroup versus single-customer store visits—characteristicsthat the literature has identified as potential drivers of shop-ping behavior (e.g., Inman, Winer, and Ferraro 2009; Kahnand Schmittlein 1992). For example, previous research hassuggested that consumers in an “unplanned state” are moreinclined to include price and promotion information in theirpurchase decision (Bucklin and Lattin 1991). Other workshows that the influence of companions can increase theurge to purchase (Mangleburg, Doney, and Bristol 2004).Both moderators involve managerially relevant characteris-tics that are relatively easy to observe or measure and havediscriminant power in that they can reveal the situations,customers, store locations, or industries for which service -scape management is especially important. For example,remodeling the servicescape may work differently for sec-tors in which store visits are spontaneous (e.g., a card andgift store) rather than planned (e.g., a supermarket). In addi-tion, a sandwich shop in a city’s financial district with ahigh proportion of single visitors may be affected differ-ently by remodeling than one in a shopping area attractinggroups of consumers.
Third, despite recent calls to improve marketingaccountability (e.g., Lehmann 2004), most servicescaperesearch investigates effects on self-reported measures ofpsychological constructs (cognitions, affect, or behavioralintentions) and ignores objective store performance. Ser-vicescape studies that feature objective measures focussolely on customers’ in-store behavior, such as money spent(e.g., Areni and Kim 1993, 1994; Milliman 1982) or thenumber of items purchased (Areni and Kim 1993, 1994;Spangenberg et al. 2006), but they reveal little about theeffects on customers’ decision to visit the store in the firstplace. Yet store performance hinges on store-visit decisionsas well as in-store purchase decisions, and both decisiontypes have been identified as critical “approach behaviors”toward the servicescape (see Bitner 1992; Mehrabian andRussell 1974). Moreover, research indicates that marketinginstruments tend to affect these behaviors differently, suchthat ignoring one of them may lead to inaccurate manage-

rial conclusions (e.g., Van Heerde, Gijsbrechts, and Pauwels2008). In our study context, the essential differencebetween these behaviors is that in-store purchase decisionsoccur upon the consumer’s actual exposure to the storeenvironment, whereas the decision to visit the store natu-rally takes place before arriving in the servicescape. There-fore, in addition to analyzing cognitive, affective, andbehavioral intention measures, we compare the effects ofremodeling on two important store performance metrics:average spending per customer, which captures in-storepurchase behavior, and store traffic, which corresponds toconsumers’ decisions to visit the store. Research in othermarketing domains has used the same metrics to assessobjective store performance (e.g., Van Heerde and Bijmolt2005).
Hypotheses Development
Short- and Long-Term Effects on Cognitions,Affect, and Behavioral Intentions
Short-term effects. Ample conceptual and empiricalwork suggests that the servicescape can serve as “physicalevidence” and provide informational cues that help cus-tomers develop their beliefs, feelings, and behavioral inten-tions toward the store’s offering (e.g., Baker et al. 2002). Anappealing store environment (either in general or on certaindimensions) positively influences cognitive and affectiveresponses, such as attitudes, satisfaction, perceived qualityand value, and store image (Baker, Grewal, and Parasura-man 1994). The servicescape also has a positive impact onbehavioral constructs, such as word-of-mouth communica-tion and loyalty (Hightower, Brady, and Baker 2002).
Although these studies are static, their findings seemespecially relevant shortly after a store remodeling, whenmany customers are confronted with the new servicescapefor the first time (Baker et al. 2002): The informationalvalue of the servicescape is indeed highest when people areunfamiliar with the store environment (e.g., Baker, Grewal,and Parasuraman 1994; Baker et al. 2002). Novel stimuliare more salient (e.g., Berlyne 1970) and thus tend to attractpeople’s attention and influence their thoughts and feelings.According to Bitner’s (1992) framework, positive cognitiveand affective responses to the servicescape in turn generatepositive effects on consumers’ behavioral intentions. There-fore, we expect that cognitions, affect, and behavioral inten-tions improve in the short term after a remodeling.
H1: Store remodeling has a positive short-term effect on (a)cognitions, (b) affect, and (c) behavioral intentions.
Long-term effects. Environmental psychologists warnthat ignoring the dynamic aspects of people’s responses toenvironmental stimuli will result in an incomplete accountof environmental effects (e.g., Russell and Lanius 1984).These researchers refer to adaptation-level theory (Helson1964), which posits that a person perceives stimuli onlyrelative to an adapted standard: Changes in stimuli mayproduce effects, but then the new experiences become inte-grated into the adaptation level and thus become the newframe of reference. Mehrabian (1995) uses the term “habit-
The Effects of a Remodeled Servicescape / 73
uation” to refer to the phenomenon by which the influenceof an environment decreases with repeated exposure. As aresult, short-term reactions to environmental stimuli losestrength in the long run (Russell and Lanius 1984). Forexample, job satisfaction and behavioral outcomes peakshortly after a job change but then return to an equilibrium(termed the “honeymoon-hangover effect”; e.g., Boswell,Boudreau, and Tichy 2005). Gerontologists describe theimpact of an environmental change on older people andpoint out that awareness of the new environment decreasesas familiarity with the new setting increases (e.g., Lawton1990).
In line with adaptation-level theory, we expect that cus-tomers’ short-term reactions to the remodeled servicescapewane in the long run, as they become more familiar with thenew store environment. That is, as time goes by, an increas-ing number of customers are (repeatedly) exposed to thenew design and integrate impressions of the new environ-ment with their adaptation levels. As a result, we expect anyinitial remodeling effects to taper off.
H2: Any short-term impact of store remodeling on (a) cogni-tions, (b) affect, and (c) behavioral intentions losesstrength in the long run.
Moderating Effects of Spontaneous VersusPlanned and Group Versus Single-CustomerVisits
In H1 and H2, we describe the general effects of storeremodeling across time but ignore the nature of the storevisit. Therefore, we also consider how two specific storevisit characteristics may lead to upward or downward shiftsin customer responses.
Spontaneous versus planned visits. Research has shownthat consumers may rely on shopping scripts that consist ofpredetermined sequences of actions to facilitate the shop-ping process (e.g., Bower, Black, and Turner 1979). Weargue that consumers who plan their store visits are morelikely to rehearse and define their shopping behavior,thereby generating or activating shopping scripts (Blockand Morwitz 1999). In contrast, consumers who do not plantheir shopping trips are more likely to rely on externalinformation and let the store environment shape their pur-chase trip. For example, consumers who do not contemplatetheir purchases before entering the store are more respon-sive to in-store promotions (Bucklin and Lattin 1991).Similarly, customers on a spontaneous shopping trip shouldbe more influenced by a remodeled servicescape than cus-tomers who plan their trips in advance. The argumentationholds in both the short and long run.
H3: The effects of store remodeling on (a) cognitions, (b)affect, and (c) behavioral intentions are greater for sponta-neous than for planned trips.
Group versus single-customer visits. In general, researchsupports the notion that the presence of companions duringthe shopping or consumption process reinforces consumers’responses (Tombs and McColl-Kennedy 2003). Consump-tion in a group often involves an experiential process inwhich consumers interact and exchange opinions. These

interactions can increase appraisals of and emotionalresponses to the consumption experience (Holt 1995), ofwhich the servicescape forms an essential part. The pres-ence of companions also may prompt consumers to exhibitmore pronounced behavioral responses, such as in theirconsumption amount (e.g., Clendenen, Herman, and Polivy1994) or time spent in the store (Sommer and Sommer1989). Researchers attribute these enhanced behavioralreactions to increased levels of arousal or conformity tosocial norms (Tombs and McColl-Kennedy 2003). Simi-larly, the presence of companions may strengthen con-sumers’ behavioral response to a remodeled servicescape.In summary, we expect customers in a group to react morefavorably to a remodeling than single customers, in both theshort and long run.
H4: The effects of store remodeling on (a) cognitions, (b)affect, and (c) behavioral intentions are greater for groupthan for single-customer visits.
Effects on Store Performance: Average CustomerSpending Versus Store Traffic
Average customer spending and store traffic correspond totwo specific approach behaviors: purchasing and visitingthe store (Bitner 1992). As such, they should exhibitresponse patterns similar to those we have described previ-ously (see H1 and H2). Nonetheless, these performance met-rics deserve separate attention because customer spendingis likely to be more sensitive to remodeling than is storetraffic. Spending takes place when customers are physicallypresent in the store environment and is therefore prone tothe influence of the remodeled servicescape, at least in theshort run. Previous research has demonstrated that evenminor changes in store atmosphere can increase the amountspent (e.g., Spangenberg et al. 2006). Store traffic also mightbenefit from the remodeling (e.g., through curiosity visits),but for at least two reasons, we expect any such positiveeffect to be modest compared with the impact on spending.
First, the decision to visit a store naturally occurs out-side the servicescape and is therefore less susceptible to theinfluence of the store environment (Bettman 1979). Toinclude the servicescape in their store visit decisions, con-sumers must draw on their mental representations of the storeenvironment (cf. Tversky 1981), which arguably are less pow-erful than a direct exposure. A few studies have shown thatelements of a store’s environment can influence store choice(see Pan and Zinkhan 2006). However, most of the literatureon store choice either ignores the role of the servicescape orfinds it overshadowed by the impact of factors such asassortment or situational variables (e.g., Bell, Ho, and Tang1998; Van Kenhove, De Wulf, and Van Waterschoot 1999).
Second, for some consumers, remodeling may actuallylead to negative store traffic effects. In particular, a storeremodeling may disrupt consumers’ habitual behaviors andlead them to identify and pursue other alternatives (Moeand Yang 2009).1 As a result, during the rebuilding, someconsumers may switch to other stores, a behavior that could
74 / Journal of Marketing, September 2011
persist after the remodeling has been completed, in the shortand even the long run.
Thus, although traffic might respond positively to storeremodeling, we expect any such effects to be lower than thespending effects. Because we measure the effects on spend-ing and traffic as percentage changes, we can explicitlycompare them.
H5: The percentage impact of store remodeling on store trafficis less than its percentage impact on average customerspending.
Data and Research DesignWe employ a natural experiment in European branches of aU.S.-based fast-food chain. In 2006, the chain started amajor store remodeling effort involving substantial changesto the lighting, spatial layout, furnishings, paintings, colorschemes, and several other factors (see Appendix A). Wecombine multiperiod survey data with weekly store perfor-mance data to test our hypotheses. The data come from atreatment store that was remodeled and a control storewhose servicescape remained unaltered. We use apretest/posttest control group design, as Shadish, Cook, andCampbell (2002) suggest, to control for preremodeling dif-ferences in the dependent measures between the treatmentand control stores and accommodate changes across timenot due to the remodeling.
In view of our hypotheses tests and context, we defineshort-term effects as those that take place within the firsthalf-year after the store remodeling and long-term effects asthose that set in thereafter. Sloot, Fok, and Verhoef (2006)use the same definition for their research on assortmentreductions in the detergent category, which features similarpurchase cycles.2
Store Selection
To avoid confounding effects, we match the treatment andcontrol stores carefully on several criteria. First, both storesare situated along major traffic arteries in commercial stripswith big-box retailers. Second, households within a ten-minute driving distance are similarly distributed acrossExperian’s global lifestyle and sociodemographic segments,and the cities in which the restaurants are located have simi-lar population sizes and unemployment rates. Third, compe-tition from other fast-food chains in the vicinity is similarfor both restaurants: Within a 15-mile radius, there is nocompetition from other major fast-food chains. Fourth, bothstores use the same price setting and have the same productoffering. Fifth, the two stores are managed in a similar way:They both (1) operate under the same (strict) standard oper-ating procedures, (2) receive similar scores from mysteryshopper visits and company inspectors, and (3) have com-parable management turnovers. Sixth, to account for othercharacteristics that we could not observe directly, we chose
1We thank an anonymous reviewer for pointing out this possibility.
2The average resident in the studied market visits this fast-foodchain almost 11 times per year. ACNielsen data indicate that thedetergent category has similar purchase frequencies (approxi-mately nine times per year). The definition of short-term and long-term may differ in other settings.
stores with comparable sales fluctuations during the prere-modeling period. Even after deseasonalization, the correlationcoefficient of the stores’ weekly sales still amounted to .82.
Remodeling took about three weeks (during which thestore remained open) and did not entail confoundingchanges in other marketing mix elements or affect seatingcapacity. Post hoc checks also indicate that after the remod-eling, the socioeconomic and business environments of bothstores remained similar. For example, in both cities competi-tion remained stable, and unemployment followed the sameslightly decreasing pattern during our observation period.
Survey Data
We use survey data to test the cross-time effects on cogni-tions, affect, and behavioral intentions (H1 and H2), as wellas the moderating impacts of spontaneous versus plannedand group versus single-customer visits (H3 and H4).Specifically, we conducted surveys with 2997 customerrespondents at four points in time: 2 months before theremodeling (Wave 1: 599 respondents in the treatment storeand 93 in the control store), right after the remodeling(Wave 2: 782 and 100 respondents, respectively), 5 monthsafter the remodeling (Wave 3: 677 and 103 respondents,respectively), and 12 months after the remodeling (Wave 4:421 and 222 respondents, respectively).3 In line with ourdefinition of short term and long term, Waves 2 and 3 rep-resent the short-term effects, and Wave 4 captures the long-term effects. Each data collection period lasted a week toensure that we covered different days of the week and dif-ferent times of the day. Within a given time window,respondents were selected through convenience sampling.All interviewers received the same instructions regardingwhen to hand out questionnaires, how to address potentialquestions, and when to collect completed questionnaires.Customers filled out the questionnaires after they had eatenin the restaurant and experienced the environment. Everyrespondent received a voucher for a free menu item as atoken of appreciation. Nonresponse rates were similar inboth stores, with an average of 24.3% in the treatment storeand 26.5% in the control store.
We selected the measures included in our questionnaireon the basis of a review of current servicescape research.Though nonexhaustive, our nine constructs cover cognitive,affective, and behavioral aspects that have direct manage-rial relevance. To measure these constructs, we adaptedexisting multiple-item scales (see Appendix B). Weincluded (1) three cognitive constructs: perceived value(Cronin et al. 1997), perceived service quality (Hightower,Brady, and Baker 2002), and store image (Graeff 1996); (2)three affective constructs: overall satisfaction (Bitner andHubbert 1994), encounter satisfaction (Bitner and Hubbert1994), and attitude (Day and Stafford 1997; Muehling,
The Effects of a Remodeled Servicescape / 75
Laczniak, and Stoltman 1991); and (3) three behavioralintentions: loyalty (McMullan 2005; Zeithaml, Berry, andParasuraman 1996), desire to stay (Hightower, Brady, andBaker 2002; Wakefield and Blodgett 1996), and word-of-mouth communication (McGregor 2006; Reichheld 2003;Zeithaml, Berry, and Parasuraman 1996). We do not includepurchase or store-visit intentions because these responsesare captured by our store performance data (see the follow-ing subsection). With the exception of the store image andattitude items, for which we use five-point semantic differ-ential scales, items are measured on five-point Likert scales.Two bilingual natives translated the original instrumentsinto the local language and back into English indepen-dently. We adjusted the translated items to resolve the fewconflicts between the original and back-translated versions.
To investigate the moderating role of the type of storevisit, we included two questions to determine whether therespondent’s store visit was planned or spontaneous andwhether he or she came alone or with a group. Followingother servicescape research (e.g., Areni and Kim 1993), wealso added categorical control variables for gender and age(younger than 29, 30–39, 40–49, 50–59, and older than 60years).
We evaluate the psychometric quality of our scales witha confirmatory factor analysis (CFA) of the pooled surveydata, using maximum likelihood estimation (see AppendixB). We drop one item of the original store image scale andallow for nonzero error correlations within the loyalty andword-of-mouth scales; because the chain-related items fromthose scales have common variance that they do not sharewith the store-related items (or vice versa), we freely esti-mate the error correlations of the two chain-related loyaltyitems, the two chain-related word-of-mouth items, and thetwo store-related word-of-mouth items. The chi-square sta-tistic for the final CFA model is significant, but the compar-ative fit index (CFI), Tucker–Lewis index (TLI), normed fitindex (NFI), and root mean square error of approximation(RMSEA) all suggest good model fit (c2(213) = 1747.54, p <.01; CFI = .98; TLI = .97; NFI = .97; and RMSEA = .055;e.g., Browne and Cudeck 1993). Furthermore, the coeffi-cient alpha values and Spearman-Brown corrected correla-tions reveal acceptable scale reliabilities. Finally, we estab-lish discriminant validity on the basis of a significantdecrease in model fit when we set any of the construct cor-relations to 1 (Anderson and Gerbing 1988).
Store Performance Data
We supplement our survey data with customer spending andstore traffic information for both the treatment and controlstores. Specifically, we study the weekly average transac-tion amount and the weekly number of transactions. Thisinformation enables us to shed further light on the remodel-ing effects over time (H1 and H2) and compare the effectson customers’ decision to spend and their decision to visitthe store (H5). The data cover a time period from approxi-mately 8 months before to 13 months after the remodeling,or 92 weeks in total. Although a single transaction mayinvolve meals sold to different consumers (e.g., families),we consider the number of transactions an indicator of store
3The samples are smaller in the control store, at the company’srequest. Hancock, Lawrence, and Nevitt (2000) show that unbal-anced samples do not increase the Type I error rate if the sampleshave the same measurement model. A comparison of constrainedand unconstrained multigroup confirmatory factor analyses indi-cates that this is the case for our data. Details are available onrequest.

traffic and the average transaction amount a measure of
average customer spending.
Manipulation Check of Servicescape Perceptions
A premise of our research is that the remodeling involves a
change for the better. In other words, a servicescape can be
modified in many ways, but we assume the remodeling
company carefully selected servicescape characteristics that
optimize the appeal of the store environment. To test
whether servicescape perceptions truly increase after the
remodeling, our survey also featured a 13-item battery to
measure respondents’ perceptions of the store environment
(see Appendix C). These items match previous servicescape
literature (Bitner 1992; Hightower, Brady, and Baker 2002)
and pertain to Bitner’s (1992) ambient, layout/functionality,
and signs/symbols/artifacts dimensions, as well as Baker,
Grewal, and Parasuraman’s (1994) ambient and design
dimensions.
For this manipulation check, we employ a two-way
multivariate analysis of covariance (MANCOVA), in which
store (treatment/control) and wave (1/2/3/4) serve as the
factors and gender, age, and the two store visit characteris-
tics (spontaneous/planned and group/single customer) rep-
resent the covariates.4 The overall interaction effect
between store and wave is highly significant (Wilks’ L =.895, F(39, 8031.6) = 7.830, p < .001, partial 2 = .04),
which implies that respondents’ perceptions of the treat-
ment store follow a significantly different pattern over time
compared with the control store perceptions. The individual
interaction coefficients (Appendix C) indicate that, with the
exception of in-store lighting, all items show significant (p <
.05) improvements in the remodeled store, in both the short
(Waves 2 or 3) and long (Wave 4) run.5 Thus, the remodeling
undertaken improves customer perceptions of the service -
scape overall.
Analyses
Analysis Survey Data
We use a MIMIC approach to analyze the survey data. Such
models are common in situations in which a set of back-
76 / Journal of Marketing, September 2011
ground variables (causes) affect one or more latent con-structs, as measured by a set of outcome variables (indica-tors) (Jöreskog and Goldberger 1975). In our MIMICmodel, the indicators are items that measure the cognitiveand affective responses and behavioral intentions. Thecauses are the same for all nine dependent constructs andinvolve (interactions among) the following variables:
STORE1 = 1 for observations made in the treatmentstore and 0 otherwise;
WAVE2, WAVE3, and WAVE4 = 1 for observationsmade during the second, third, and fourth wave, respec-tively, and 0 otherwise;
SPONT = 1 for spontaneous visits and 0 otherwise;
GROUP = 1 for group visits and 0 otherwise;
GENDER = 1 for female and 0 for male respondents;and
AGE2, AGE3, AGE4, and AGE5 = 1 if the respondentbelongs to the second (30–39 years), third (40–49years), fourth (50–59 years), or fifth (60 years andolder) age bracket and 0 if otherwise.
In addition to the main effects of these variables, weinclude specific interaction effects to model the phenome-non of interest. First, the interactions STORE1 ¥ WAVEwmeasure the remodeling effects in wave w (w = 2, 3, 4) rela-tive to the first (i.e., preremodeling) wave. These interac-tions capture the extent to which the differences betweenthe response measures of the treatment and control storesbefore the remodeling change in the postremodeling waves.Second, the interactions STORE1 ¥ WAVEw ¥ SPONT andSTORE1 ¥ WAVEw ¥ GROUP represent the incrementalremodeling effects in wave w (w = 2, 3, 4) when we con-sider a spontaneous versus planned visit or group versussingle-customer visit, respectively. In these interactions, wemean-center SPONT and GROUP to ensure the coefficientsof the STORE ¥ WAVE interaction terms can be interpretedas average effects across consumers.6
Analysis of Store Performance Data
We model average customer spending and store traffic asexponential functions of their explanatory variables:
(1) ASit = exp[ai + Xit ¥ d + f(t) + Iit ¥ k(t) + eit], and
(2) STit = exp[bi + Xit ¥ f + g(t) + Iit ¥ m(t) + uit],
where
ASit = average customer spending (in euros) inrestaurant i in week t (i = 1, 2; t = 1, 2, …,92);
STit = store traffic (i.e., number of transactions) inrestaurant i in week t;
4Note that our perceived servicescape scale is formative. With-out reflective measures, the perceived servicescape constructwould remain unidentified in a structural equation modelinganalysis. Therefore, we employ MANCOVA, using the individualitems as separate dependent variables while allowing for corre-lated errors (Thompson and Green 2006). An analysis of covari-ance of the summed item scores leads to the same conclusion—namely, that perceptions increase significantly (p < .05) after theremodeling.
5In the new store design, the light intensity automaticallyadjusts to account for outside weather conditions, which may haveled to inconsistent perceptions and, thus, insignificant differencesbetween the two store designs. Therefore, we ran an online surveyand randomly assigned 104 respondents to view pictures of eitherthe new or the old store design under normal weather conditions.These respondents completed a multi-item perception scale similarto that in our main study. All perceptions, including those regard-ing lighting, were significantly higher (p < .05) for the new thanthe old store design. Details are available on request.
6Our MIMIC analysis bears some resemblance to multivariateanalysis of variance (MANOVA), which can also assess shifts inmultivariate measures. However, in comparison with MANOVA, aMIMIC model accounts for the measurement error of the responseitems and leads to lower Type II errors (cf. Hancock, Lawrence,and Nevitt 2000).
Xit = a row vector of control dummy variablesindicating promotions, public holidays,school vacations, and the constructionperiod for remodeling the store (duringwhich it remained open);
Iit = an indicator equal to 1 if restaurant i is theremodeled restaurant and week t is apostremodeling week, and 0 otherwise;
f(t) and g(t) = functions capturing baseline fluctuations inASit and STit, respectively. The parametersof these functions must be estimated;
k(t) and m(t) = functions capturing the incrementalchanges in ASit and STit, respectively, dueto the remodeling. The parameters of thesefunctions must be estimated;
ai and bi = store-specific intercepts to be estimated;d and f = vectors of response coefficients to be esti-
mated; andeit and uit = normally distributed error terms.
In an exponential model, the estimated parameters haverelative meaning; that is, they should be interpreted as per-centage changes relative to the restaurant’s baseline (Sloot,Fok, and Verhoef 2006). Thus, the functions f(t) and g(t)capture percentage changes over time in ASit and STit,respectively, and are common to both the treatment and thecontrol restaurant; k(t) and m(t) instead are unique to thetreatment store and refer to the incremental percentagechanges in the weeks after the remodeling. The challengewhen modeling the time functions f, g, k, and m consists ofselecting a sufficiently flexible form without overweightingthe deviant observations. To this end, we opted for polyno-mial functions whose degree depends on model fit.7 In ourestimations, sixth-degree polynomials lead to the highestadjusted R-square, so we express the impact of the storeredesign r weeks after the remodeling as follows:
(3) a0 + a1 ¥ r + a2 ¥ r2 + … + a6 ¥ r6,
where a0, a1, a2, …, a6 are the estimated parameters thatdetermine the shape of the polynomial.
Because we can linearize Equations 1 and 2 by takingthe natural logarithm and because the functions f, g, k, andm are linear in the parameters, we can estimate our modelwith generalized least squares. In particular, we employParks’s (1967) method, which corrects for autocorrelation,heteroskedasticity, and contemporaneous correlation amongthe four data series (i.e., average spending and store trafficfor two stores).
Results
Short- and Long-Term Effects on Cognitions,Affect, and Behavioral Intentions
We estimate our MIMIC model with maximum likelihood.Although the chi-square statistic is significant (c2(516) =
The Effects of a Remodeled Servicescape / 77
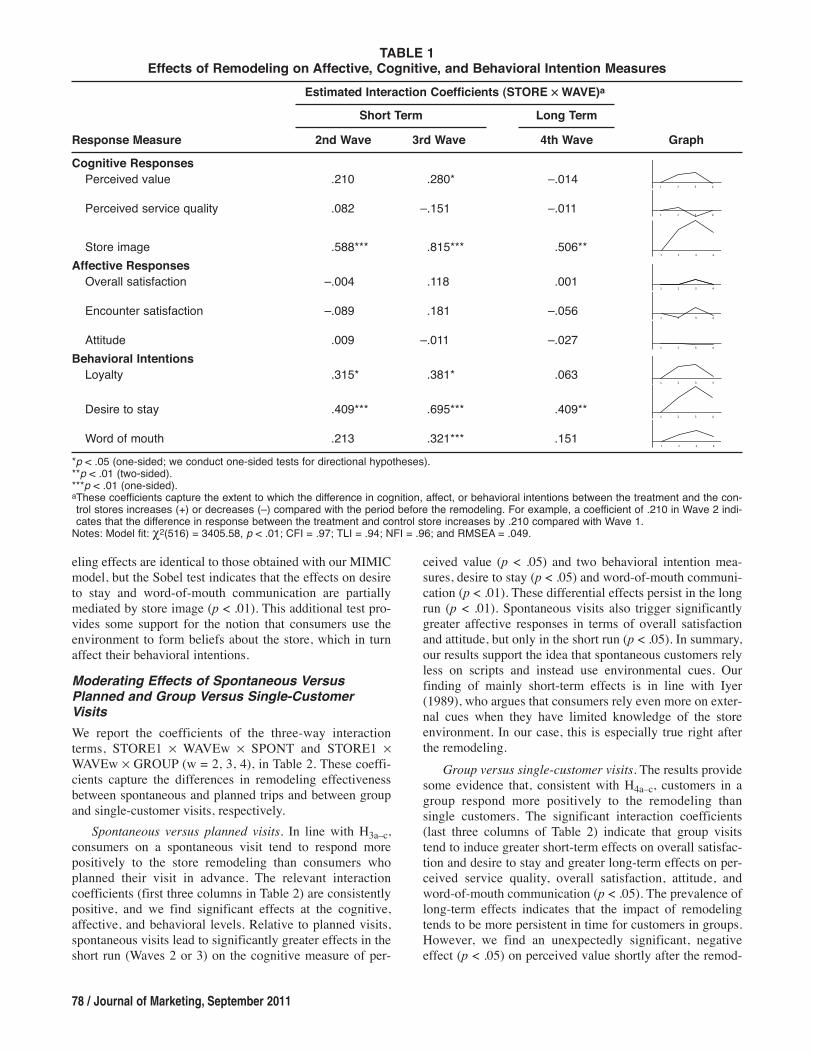
3405.58, p < .01), the CFI (.97), TLI (.94), NFI (.96), andRMSEA (.049) indicate good conformance of the data withthe model (Browne and Cudeck 1993).8 To save space, wereport only the estimated coefficients of the interactionterms, which capture the mechanisms of interest; the resultsfor the main effects and measurement model are availableon request. In Table 1, we present the coefficients of theSTORE1 ¥ WAVE2, STORE1 ¥ WAVE3, and STORE1 ¥WAVE4 interaction terms. These coefficients capture theover-time remodeling effects for the average consumer,because the store visit characteristics are mean-centered.
Short-term effects. All three behavioral intention mea-sures (loyalty, desire to stay, and word-of-mouth communi-cation) and two cognitive measures (perceived value andstore image) have significantly positive effects in the sec-ond and/or third wave (p < .05). These results support H1a
and H1c and reinforce Baker et al.’s (2002) and Bitner’s(1992) claims that consumers use the remodeled ser-vicescape as a cue to form beliefs about the store and theproduct offering and adjust their behavior accordingly.However, we find only partial support for H1a because thecognitive measure of perceived service quality remainsunaffected. Furthermore, H1b is not supported because theinteraction coefficients for the three affective measures(overall satisfaction, encounter satisfaction, and attitude)are nonsignificant. In summary, on average, customers’reactions to the remodeled store environment are cognitiveand behavioral rather than affective. We elaborate on thesefindings in the “Discussion” section.
Long-term effects. As we show in Table 1, we find sup-port for H2a and H2c in that the cognitive and behavioralresponse measures that increase in the short run losestrength in the long run (fourth wave). The affective mea-sures (see H2b), which do not react in the short run, do notshow significant effects in the long run either.
While most measures have no long-term remodelingeffect (p > .10), store image and desire to stay do not com-pletely return to their baseline levels by the end of theobservation period (p < .01). Nonetheless, our results lendcredence to the application of adaptation-level theory to ser-vicescape changes. That is, customers’ initial responsestaper off as the remodeled store becomes the new frame ofreference.
Although our main interest is in the total short- andlong-term remodeling effects on our response measures, wealso ran a model in which, in line with Bitner’s (1992) con-ceptual framework, the cognitive and affective reactions areantecedents of intentions. The short- and long-term remod-
7We also estimate more flexible time functions, namely, cubicspline functions (Sloot, Fok, and Verhoef 2006), but these modelsmerely confirm the patterns we find with our more parsimoniouspolynomial functions.
8To validate the assumption of measurement invariance acrossthe eight subgroups in our sample—an assumption that is intrinsicto a MIMIC analysis—we run a series of multigroup CFAs withincreasingly restrictive between-group equality constraints. Theresults indicate that the assumption of measurement invariance isnot problematic in our data set (Thompson and Green 2006). Fur-thermore, we test for differential item functioning (DIF) by run-ning a model that accommodates direct relationships between allitems and the “grouping” dummy variables. We set these paths tozero and inspect the modification indexes and expected parameterchanges. The data do not exhibit systematic DIF.
eling effects are identical to those obtained with our MIMICmodel, but the Sobel test indicates that the effects on desireto stay and word-of-mouth communication are partiallymediated by store image (p < .01). This additional test pro-vides some support for the notion that consumers use theenvironment to form beliefs about the store, which in turnaffect their behavioral intentions.
Moderating Effects of Spontaneous VersusPlanned and Group Versus Single-CustomerVisits
We report the coefficients of the three-way interactionterms, STORE1 ¥ WAVEw ¥ SPONT and STORE1 ¥WAVEw ¥ GROUP (w = 2, 3, 4), in Table 2. These coeffi-cients capture the differences in remodeling effectivenessbetween spontaneous and planned trips and between groupand single-customer visits, respectively.
Spontaneous versus planned visits. In line with H3a–c,consumers on a spontaneous visit tend to respond morepositively to the store remodeling than consumers whoplanned their visit in advance. The relevant interactioncoefficients (first three columns in Table 2) are consistentlypositive, and we find significant effects at the cognitive,affective, and behavioral levels. Relative to planned visits,spontaneous visits lead to significantly greater effects in theshort run (Waves 2 or 3) on the cognitive measure of per-
78 / Journal of Marketing, September 2011
ceived value (p < .05) and two behavioral intention mea-sures, desire to stay (p < .05) and word-of-mouth communi-cation (p < .01). These differential effects persist in the longrun (p < .01). Spontaneous visits also trigger significantlygreater affective responses in terms of overall satisfactionand attitude, but only in the short run (p < .05). In summary,our results support the idea that spontaneous customers relyless on scripts and instead use environmental cues. Ourfinding of mainly short-term effects is in line with Iyer(1989), who argues that consumers rely even more on exter-nal cues when they have limited knowledge of the storeenvironment. In our case, this is especially true right afterthe remodeling.
Group versus single-customer visits. The results providesome evidence that, consistent with H4a–c, customers in agroup respond more positively to the remodeling thansingle customers. The significant interaction coefficients(last three columns of Table 2) indicate that group visitstend to induce greater short-term effects on overall satisfac-tion and desire to stay and greater long-term effects on per-ceived service quality, overall satisfaction, attitude, andword-of-mouth communication (p < .05). The prevalence oflong-term effects indicates that the impact of remodelingtends to be more persistent in time for customers in groups.However, we find an unexpectedly significant, negativeeffect (p < .05) on perceived value shortly after the remod-
TAbLE 1Effects of Remodeling on Affective, Cognitive, and behavioral Intention Measures
Estimated Interaction Coefficients (STORE ¥ WAVE)a
Short Term Long Term
Response Measure 2nd Wave 3rd Wave 4th Wave Graph
Cognitive Responses
Perceived value .210 .280* –.014
Perceived service quality .082 –.151 –.011
Store image .588*** .815*** .506**
Affective Responses
Overall satisfaction –.004 .118 .001
Encounter satisfaction –.089 .181 –.056
Attitude .009 –.011 –.027
behavioral Intentions
Loyalty .315* .381* .063
Desire to stay .409*** .695*** .409**
Word of mouth .213 .321*** .151
*p < .05 (one-sided; we conduct one-sided tests for directional hypotheses).**p < .01 (two-sided).***p < .01 (one-sided).aThese coefficients capture the extent to which the difference in cognition, affect, or behavioral intentions between the treatment and the con-trol stores increases (+) or decreases (–) compared with the period before the remodeling. For example, a coefficient of .210 in Wave 2 indi-cates that the difference in response between the treatment and control store increases by .210 compared with Wave 1.
Notes: Model fit: c2(516) = 3405.58, p < .01; CFI = .97; TLI = .94; NFI = .96; and RMSEA = .049.
!"#$"%&"'(&)*+"
!"#$"%&"'(,"#&%$"(-+)*%./
0.1#"(%2)3"
4&"#)**(,).%,5)$.%16
7( 8( 9( :(
!"#$"%&"'(&)*+"
!"#$"%&"'(,"#&%$"(-+)*%./
0.1#"(%2)3"
4&"#)**(,).%,5)$.%16
7( 8( 9( :(
!"#$"%&"'(&)*+"
!"#$"%&"'(,"#&%$"(-+)*%./
0.1#"(%2)3"
4&"#)**(,).%,5)$.%167( 8( 9( :(
;6$1+6."#(,).%,5)$.%16
<..%.+'"
=1/)*./
7( 8( 9( :(
;6$1+6."#(,).%,5)$.%16
<..%.+'"
=1/)*./
7( 8( 9( :(
;6$1+6."#(,).%,5)$.%16
<..%.+'"
=1/)*./
7( 8( 9( :(
>",%#"(.1(,.)/
?1#'(15(21+.@
7( 8( 9( :(
>",%#"(.1(,.)/
?1#'(15(21+.@
7( 8( 9( :(
>",%#"(.1(,.)/
?1#'(15(21+.@
7( 8( 9( :(
eling. Compared with single customers, visitors in groups
appear to rely less on the servicescape for their assessments
of the value of the store’s offering, possibly because they
would rather consult their companions (Mangleburg,
Doney, and Bristol 2004).
Effects on Store Performance
In Table 3, we summarize the estimation results for Equa-
tions 1 (average customer spending) and 2 (store traffic). In
the interest of space, we exclude the results for the store
The Effects of a Remodeled Servicescape / 79
intercepts and the baseline functions f(t) and g(t). Although
Table 3 includes the effects of promotions, holidays, vaca-
tions, and the construction period (which all make intuitive
sense), we focus on the remodeling effects. We provide esti-
mated function values of k(t) and m(t) for specific
postremodeling weeks. However, a complete assessment of
the remodeling effects requires plotting the entire functions.
Therefore, in Figure 1, we depict the estimated functions
k(t) and m(t), along with a 95% confidence band for the 55
weeks after the remodeling. As we indicated previously, the
TAbLE 2Moderating Effects of Spontaneous Versus Planned and Group Versus Single-Customer Visits
Estimated Three-Way Interaction Coefficients
(STORE ¥ WAVE ¥ STORE VISIT CHARACTERISTIC)a
Spontaneous (Versus Planned) Group (Versus Single Customer)
Response Measure 2nd Wave 3rd Wave 4th Wave 2nd Wave 3rd Wave 4th Wave
Cognitive ResponsesPerceived value .178 .292* .441** –.442* .111 .542Perceived service quality .032 .191 .213 .041 .185 .568*Store image .070 .042 .061 .042 .072 .072
Affective ResponsesOverall satisfaction .204* .211* .152 .240 .324* .465*Encounter satisfaction .015 .204 .170 .172 –.093 .660Attitude .227* .276* .038 .065 .121 .603*
behavioral IntentionsLoyalty .177 .098 .230 –.196 .112 .675Desire to stay .364* .524*** .627*** –.017 .390* .548Word of mouth .457** .555*** .476** –.187 .240 .697*
*p < .05 (all tests are one-sided because they pertain to directional hypotheses).**p < .01.***p < .001.aThese coefficients capture the extent to which the remodeling effects increase (+) or decrease (–) in the switch from a planned to a sponta-neous trip and from a single-customer to a group visit. For example, the coefficient of .524 in the second column for desire to stay indicatesthat, in Wave 3, the desire to stay score was .524 higher for spontaneous trips than for planned trips.
Notes: Model fit: c2(516) = 3405.58, p < .01; CFI = .97; TLI = .94; NFI = .96; and RMSEA = .049.
TAbLE 3Effects on Average Customer Spending and Store Traffic
Average Customer Spending Store Traffic
Parameter Estimatea (SE) Estimatea (SE)
Remodeling Effects2nd postremodeling week –.002 (.014) –.003 (.031)10th postremodeling week .037** (.010) –.014 (.017)18th postremodeling week .036** (.010) –.032 (.017)26th postremodeling week .002 (.009) –.027 (.016)34th postremodeling week –.007 (.009) –.026 (.016)42nd postremodeling week .007 (.010) –.053* (.017)50th postremodeling week –.000 (.011) –.078** (.020)
Control VariablesConstruction period .002 (.015) –.155** (.024)Promotion .032** (.005) .048** (.009)Public holiday .024** (.006) .020 (.011)School vacation .009 (.009) –.031 (.016)
Adjusted R2 .999
*p < .05 (all tests are two-sided).**p < .001. aBecause the dependent variables are in log form, the parameter estimates can be interpreted as percentage changes in average customerspending or store traffic.

function values of k(t) and m(t) can be interpreted as per-centage changes in average spending and store traffic,respectively. We find that the changes in average customerspending and store traffic are remarkably different.
For average customer spending (Figure 1, Panel A), weobserve a significant short-term increase that disappears inthe long run, in line with the response pattern hypothesizedin H1 and H2. Specifically, average customer spendingincreases significantly (p < .05) between Weeks 7 and 22after the remodeling, by a maximum of 4.4% in Week 14.Indeed, between Weeks 7 and 22, 0 does not fall within theconfidence interval. However, in the long run (starting sixmonths after the remodeling, approximately Week 27),average spending per customer returns to the baseline, andthe observed effects are no longer significant, in line withadaptation-level theory. Overall, the trajectory of spendingeffects is similar to the patterns of our cognitive and behav-ioral intention measures, which suggests that these mea-sures are useful predictors of customers’ actual in-storebehavior.
Store traffic exhibits a substantially different pattern(Figure 1, Panel B). In contrast with average spending, storetraffic does not change significantly in the short run. Unex-pectedly, it even declines in the long run, resulting in a sig-nificant dip in Weeks 37–54. Although store traffic recoversagain toward the end of our observation period, theseresults offer an important warning for companies that planto use remodeling to improve their store patronage. A possi-ble explanation is that the store remodeling triggered persis-tent negative effects as some customers switched to otherstores during the remodeling and continued this behaviorafterward. Alternatively, the remodeling might have elicitedreactance against the new servicescape among consumerswho felt deprived of their freedom to visit their familiarstore (Brehm and Brehm 1981). In the short run, thesenegative effects might have been compensated for by posi-tive curiosity effects in other customer segments, such thatthe negative impact only emerges in the long run.
The results for store traffic are not in line with H1 andH2 but support our expectation that the remodeling effect onstore traffic is lower than that on average spending (H5).One-sided t-tests indicate that from Week 8 to Week 26 andfrom Week 37 to Week 54, the difference between the per-centage impact on store traffic and that on average spendingis significant (p < .05).9
Validation
One crucial finding of our analyses is that short-termremodeling effects wear off over time, in line with adapta-tion-level theory. To validate this result, we (1) analyzerevenue data from 18 stores, (2) conduct a laboratory study,and (3) gather qualitative insights.
Revenue analysis. We analyze weekly revenue datafrom 18 restaurants (including the two stores of our main
80 / Journal of Marketing, September 2011
9Because in each week the difference between spending andstore traffic effects is a linear combination of the estimatedparameters of the polynomials, we can derive the difference’sstandard error from the variance–covariance matrix of thoseparameters und use this standard error in the t-test.
0 5 10 15 20 25 30 35 40 45 50 55
7%
6%
5%
4%
3%
2%
1%
0%
–1%
–2%
–3%
–4%
Postremodeling Weeks
Perc
en
tag
e C
han
ge i
n A
vera
ge
Ch
eck
FIGURE 1Effects of Remodeling on Store Performance
A: Effects of Store Remodeling on Average Customer
Spending
b: Effects of Store Remodeling on Store Traffic
C: Validation: Effects of Store Remodeling on Revenue
(18 stores)
Estimated change95% confidence bounds
0 5 10 15 20 25 30 35 40 45 50 55
6%
4%
2%
0%
–2%
–4%
–6%
–8%
–10%
–12%
Postremodeling Weeks
Perc
en
tag
e C
han
ge i
n N
um
ber
of
Tra
nsacti
on
s
Estimated change95% confidence bounds
0 5 10 15 20 25 30 35 40 45 50 55
6%
5%
4%
3%
2%
1%
0%
–1%
–2%
–3%
Postremodeling Weeks
Perc
en
tag
e C
han
ge i
n S
ale
s
Estimated change95% confidence bounds

study), covering the same 92 weeks as the data in our mainstudy. Of the 18 restaurants, 6 were remodeled. For eachremodeled store, we include 2 control stores to obtain reli-able estimates of the baseline revenue (Shadish, Cook, andCampbell 2002). To select these control stores, we use thesame matching criteria (post hoc) used in our main study.We model revenue as an exponential function, identical tothe functional forms of ASit and STit in Equations 1 and 2.As we did previously, we control for the effects of promo-tions, vacations, holidays, and the remodeling period;include store-specific intercepts; and accommodate thedynamic effects with sixth-degree polynomial time func-tions (which resulted in the highest adjusted R-square). Weinclude six baseline polynomials, one for each treatmentrestaurant and its two control stores, to capture revenuefluctuations not due to the remodeling. Finally, we add apolynomial to assess incremental changes as a result of theremodeling, pooled across the six treatment stores.
To save space, we do not report store intercepts, base-line patterns, or the effects of the control variables. In Fig-ure 1, Panel C, we portray the estimated remodeling effects,along with a 95% confidence band for up to 56 weeks afterthe remodeling.10 Revenue significantly increases by2%–3% (p < .05) during the first 20 weeks but then returnsto its normal level, lending extra support to the relevance ofadaptation-level theory for the context of servicescaperemodeling.
Lab study. To validate the adaptation mechanism moreexplicitly, we conducted a computer-based lab study com-parable to the study by Russell and Lanius (1984), who alsoexamine environmental adaptation-level effects. One hun-dred ninety-seven student respondents watched a two-minute video clip of a visit to the remodeled store that pro-vided a realistic impression of the new store design. Afterwatching the clip, respondents completed a five-pointsingle-item scale that measured their general impression ofthe store environment. In addition, they provided sociode-mographic information and indicated whether they usuallyvisit a restaurant with a new (n = 91) or old (n = 106) storedesign. In an analysis of covariance in which we control forgender (all students belong to the same age category), wefind that respondents rate the remodeled design shown inthe video clip significantly higher (p < .01) when they usu-ally visit a store with the old, as opposed to the new, design.That is, people who are already familiar with the new storeenvironment use a higher standard to evaluate the new envi-ronment because they integrate their prior experience withthe new servicescape into their adaptation level.
Qualitative insights. To further substantiate the adapta-tion-level rationale, we collected spontaneous reactions tothe remodeled servicescape from 91 students who partici-pated in a computer-based lab study. Respondents first saw
The Effects of a Remodeled Servicescape / 81
a slide show of the new store design and then wrote downtheir thoughts and perceptions of the store environment,provided sociodemographic information, and indicatedwhether they usually visit a restaurant from this chain withthe new (n = 43) or old (n = 48) store design. Three inde-pendent coders content-analyzed and classified theresponses. The results indicate 644 pairwise agreements outof a total of 801 possible, resulting in an interjudge agree-ment of .80. The proportional reduction in loss reliabilitymeasure is greater than .97, which leaves us fairly confidentabout our judges’ classification.
Table 4 presents the counts and percentages for responsecategories mentioned by more than 5% of the respondents.While several associations with the remodeled store arementioned by both new-store and old-store visitors (e.g.,“modern/trendy,” “clean,” “child-friendly,” “fast food”), weobserve notable differences. Respondents who usually visita remodeled store mention “standard,” “familiar,” “typical,”“recognizable,” or “normal” much more often than respon-dents who usually visit a nonremodeled store. In addition,new-store visitors typically refer to “design” in general,while old-store visitors emphasize the newness of thedesign and are much more likely to find the new designmodern or trendy. Thus, in general, respondents’ unaidedthoughts support the adaptation-level explanation.
Discussion
Main Findings and Theoretical Implications
In this study, we used a natural experiment in a fast-foodchain to investigate the effects of store remodeling on cus-tomers’ cognitions, affect, and behavioral intentions and onactual store performance. Our findings, which we summa-rize in Table 5, contribute to servicescape literature in atleast three ways. First, whereas prior literature has notaddressed the temporal effects of changes in the ser-
TAbLE 4Respondents’ Unaided Thoughts in Reaction to
the Remodeled Servicescape
Category Count %
Evaluation by Respondents Who Usually Visit Stores with the Old DesignModern/trendy 35 73New interior design 22 46Clean 13 27For children/child-friendly 12 25More of a restaurant and not fast food 10 21Fat/unhealthy food/low quality 8 17Fast food 7 15
Evaluation by Respondents Who Usually Visit Stores with the New DesignModern/trendy 24 56Design 22 51Clean 19 44Standard/familiar/typical/recognizable/normal 13 30Nice environment/nice atmosphere 12 28Fast food 11 26Colors, colorful 10 23For children/child-friendly 9 21
10These results rely on observations for all six remodeledrestaurants. Any estimated effects after the 56th week only pertainto two restaurants for which a longer postremodeling time spanwas available because these restaurants were remodeled earlier inthe observation period. These effects are somewhat more erraticbut not significant.

vicescape, we disentangle the short- and long-term effectsof store remodeling and present adaptation-level theory asan important theoretical concept for studying changes in theservicescape over time. Most of our short-term results providereal-life validation of previous laboratory experiments thatreveal consumers’ positive reactions to an attractive storeenvironment (e.g., Baker, Grewal, and Parasuraman 1994).For example, we observe positive short-term effects on cogni-tive measures, such as store image, and behavioral intentions,such as word-of-mouth communication. However, in linewith adaptation-level theory, the positive short-term effectstend to lose strength in the long run (i.e., after six months)as the remodeled store becomes the new frame of reference.
Second, our research is one of only a few studies thatshed light on the interaction between servicescape effectsand store visit characteristics. Our results indicate that cus-tomers who visit the store spontaneously are typically morereceptive to the influence of the remodeling than are cus-tomers who planned their visit. Furthermore, customerswho visit in groups tend to respond more favorably to theremodeled servicescape than single customers do. Previouswork has found contagion effects between employees andcustomers (e.g., Hennig-Thurau et al. 2006); our findingssuggest that similar mechanisms may exist among cus-tomers in the context of a remodeled servicescape.
Third, servicescape research traditionally has investi-gated consumer responses upon exposure to the store envi-ronment, but this singular reliance on in-store reactions maygenerate an incomplete picture of the likely effects on storeperformance. We observe that customer spending, whichoccurs in the store, exhibits a response pattern similar tothose of most of our survey measures: It increases shortlyafter the remodeling and returns to the baseline in the longrun. In contrast, store traffic is less prone to the influence ofthe servicescape because the decision to visit the store natu-rally occurs outside the store. Store traffic remains unaf-fected by a remodeled servicescape in the short run andeven indicates a negative effect in the long run. Perhaps theremodeling period interrupts habitual behaviors and makes
82 / Journal of Marketing, September 2011
some people identify and switch to other stores. Alterna-tively, remodeling may trigger reactance effects among cer-tain consumers who deliberately stay away. In any case, thisfinding warrants further research.
Finally, beyond these three main contributions, twoadditional findings deserve attention. First, though taperingover time, the remodeling impact on store image and desireto stay remains significant in the long run. Both constructsare likely to benefit directly from the improvements in storeperception, which, as shown in our manipulation test,remain significant across time. Similarly, our qualitativestudy (see Table 4) suggests that even consumers who arealready familiar with the remodeled store (and thereforedescribe the new servicescape as “standard,” “typical,” andso forth) still appreciate the “nice environment” and refer toit as “modern” and “trendy.”
Second, the affective responses of the average customer(overall satisfaction, encounter satisfaction, and attitude)remained unaffected by a store remodeling in both the shortand long run. These findings could indicate that satisfactionand attitude depend more on the entire consumption experi-ence to which other variables (e.g., product characteristics)contribute to a greater extent than the servicescape (Szy-manski and Henard 2001). Another plausible explanationmay be that the new servicescape improved the diningexperience but also raised expectations (see Sharma andStafford 2000). In an expectation–disconfirmation frame-work, satisfaction and attitude would stay at their prere-modeling levels, because expected and experienced perfor-mance increased to the same extent (cf. Bitner 1992). Thus,although customer satisfaction is often used as a proxy forstore performance, it cannot always tell the entire story.
Managerial Implications
General implications for marketing and store man-agers. At least in the short run (i.e., within six months aftera remodeling), managers can use store remodeling toimprove store image and value perceptions. Remodelingalso may induce behavioral responses, such as longer store
TAbLE 5Summary of the Main Findings
Short- versus long-term effects (H1 and H2) •Store remodeling has a short-term impact on cognitive (perceivedvalue, store image) and behavioral measures (loyalty, desire tostay, word-of-mouth), but not on affective measures.
•Short-term remodeling effects lose strength in the long run, in linewith adaptation-level theory.
Moderating effects (H3 and H4) •Spontaneous visits tend to lead to greater remodeling effects thanplanned visits, especially in the short run (e.g., perceived value,overall satisfaction, word-of-mouth communication).
•Customers in a group tend to respond more positively to a storeremodeling than single customers, especially in the long run (e.g.,perceived service quality, overall satisfaction, word-of-mouthcommunication).
Effects on customer spending versus store traffic (H5) •The remodeling effect on store traffic is less than that on averagespending.
•In line with H1 and H2, average spending increases in the short runbut returns to the baseline in the long run.
•Store traffic does not change in the short run and even shows a dipin the long run.

visits, increased spending, greater loyalty, and more word-
of-mouth communication. However, our findings entail sev-
eral caveats for managers considering a remodeling of their
servicescapes. First, we warn against a myopic approach to
store remodeling. If firms fail to realize that customer reac-
tions lose strength in the long run, they may overstate the
total impact of the remodeling. Therefore, companies
should thoroughly investigate possible remodeling effects
over time before rolling out new store designs. However,
techniques that consider only short-term effects appear
popular in practice. For example, Office Depot used secret
laboratory stores to develop and evaluate its Millennium 2
store concept, admitting that “only time will tell how suc-
cessful these efforts will be in the eye of the customer” (Jef-
fries and Eisenberg 2005). The personal computer manufac-
turer Gateway pilot-tested its new store design in mid-2003
and then completed the remodeling of all its stores just
three months later (Goliath 2003). Our findings indicate
that it is more appropriate to assess performance in one or
more pilot stores for a relatively long period. In our focal
industry, fast-food restaurants, an observation period of
approximately one year seems warranted.
Second, our results imply that the impact of remodeling
may vary across industries. Remodeling may lead to greater
effects in retail sectors in which store visits tend to be rather
spontaneous, such as card and gift stores, compared with
sectors in which planned visits prevail, such as supermar-
kets. In addition, remodeling may be more rewarding for
industries in which customers often are part of a group,
such as cafés, but less so for industries in which customers
come alone, such as cybercafés. In a similar vein, our
results indicate that not all stores in a chain will benefit
equally from remodeling. For example, a chain of coffee-
houses rolling out a new store design may give priority to a
Main Street store that attracts small parties of consumers
who spontaneously interrupt their shopping trips for a coffee
break rather than to a store that caters to commuters who
pick up their regular morning coffee on their way to work.
Third, although customers spend more shortly after a
store makeover, store traffic might not increase. Therefore,
companies should apply other marketing tactics to stimulate
consumers to come in and, once exposed to the new ser-
vicescape, spend more money. This finding creates an inter-
esting trade-off: Providing incentives to visit the store, such
as coupons, lures consumers into the store but also causes
them to plan their visit (Kahn and Schmittlein 1992), which
may decrease the impact of the servicescape. In this respect,
mass advertising may be more appropriate because it
increases store awareness without necessarily affecting the
nature of store visits.
Implications for franchisor–franchisee relationships. In
the fast-food and many other service industries, franchise
chains represent the largest share of total sales (Michael
1999). As we show, our results also have implications for
the relationships between franchisor and franchisees.
Specifically, the interests of these two parties in the remod-
eling may not align perfectly, which is consequential for the
allocation of remodeling costs.
The Effects of a Remodeled Servicescape / 83
For the franchisor, who receives royalties on the fran-chisees’ gross revenues, positive remodeling effects on storerevenues generate extra proceeds. We find that store revenuesincrease by up to 3% in the first months after the remodeling.For the treatment store in our main study, which has close-to-average baseline revenues, the percentage effects trans-late into a cumulative revenue increase of approximately€28,000. For a chain of some thousand stores and a typicalroyalty of 10% (Michael 1999), the incremental incomethus would represent a few million euros. Other benefits forthe franchisor cannot be expressed directly in terms of reve-nues. For example, the chain might use store remodeling toboost image in the short and long run. Indeed, we find thatthe initial impact on store image, though it tapers off,remains significant in the long run. Such improvements instore image may help franchisors solidify their position inthe market and generate financial payoffs in the very longrun (for which our analysis does not account). A significantremodeling also could be an important signal to sharehold-ers that underscores the company’s commitment to cus-tomer relevance, which may lead to increased stock prices.
In contrast, franchisees seek to maximize the profits oftheir individual stores and want to recoup any investmentwithin a reasonable amount of time (Gogoi, Arndt, andMoiduddin 2006). To evaluate the gains from remodeling,franchisees consider both incremental store revenues andsavings in maintenance costs (e.g., chair replacement, wallredecoration). For example, in addition to a revenueincrease of €28,000, the treatment store in our main studyrealized annual maintenance savings of about €4,000, at leastin the first few years after the store redesign. If we assume afood cost of 25% (common for this business) and ignore dis-counting, the gross return on a five-year basis would be (1 –.25) ¥ €28,000 + 5 ¥ €4,000 = €41,000. In this way, indi-vidual franchisees can derive their maximum willingness tocontribute to the remodeling effort. Because absoluteremodeling effects depend on the store’s baseline revenues,this willingness to contribute will vary greatly across stores.
Thus, we recommend careful and store-specific alloca-tions of remodeling costs. For the remodeling program westudied, franchisees shouldered the lion’s share of the costs,typically a multiple of the estimated increases in store profits.If the franchisor wants to speed up the rollout of the remod-eled servicescape, it could identify costs that it can shift tothe franchisee while ensuring there is a clear incentive forthe franchisee to implement the new design. Moreover, thefranchisor should make franchisees aware of effects that aremore difficult to quantify, such as the long-term implicationsfor store image. Remodeling also can have a positive impacton employee behavior, leading to greater productivity andlower turnover (see Parish, Berry, and Lam 2008), or it mayserve as an entry deterrent that lowers the expected profitsof a rival firm considering entry into the market.
Limitations and Further Research
Because this work represents a first study of the effects of aremodeled servicescape, ample opportunity remains for fur-ther research. First, field experiments have their own limita-tions, the most important being that it is not possible to con-

trol all factors. Although we carefully selected the storesand tried to avoid extraneous influences, we cannot com-pletely rule out confounding effects of the environment.Furthermore, a field experiment involves only one specificsetting. For the sake of generalizability, studies should exam-ine whether our findings hold for other remodeling projects,and in contexts other than fast-food restaurants. The impact ofstore remodeling may be more persistent in fashion-orientedor upscale stores or in industries in which the servicescapeforms the core of the service offering (e.g., hotels).
Second, although the results of our lab studies and quali-tative analysis support the adaptation-level rationale, theremay be other reasons for the waning remodeling effects. Forexample, the positive remodeling effects may diminish overtime as the new store design loses its initial cleanliness.Further research might validate this and other explanations.
Third, researchers might examine interactions betweenstore remodeling and other variables. Additional workcould investigate whether remodeling effectiveness is mod-erated by other marketing interventions, such as alteredproduct offerings or advertising. It may also be worthwhileto include other store visit characteristics. Research mightexplicitly distinguish between hedonic and task-orientedstore visits (Kaltcheva and Weitz 2006), particularly toinvestigate the extent to which these motivations drive the
84 / Journal of Marketing, September 2011
observed differences for spontaneous versus planned andgroup versus single-customer visits.
Fourth, although we assess remodeling effects at differ-ent levels (cognitive, affective, and behavioral), anothermodel could explicitly distinguish consecutive decisionstages (e.g., awareness, consideration, trial, consumption,and postconsumption evaluation) and measure remodelingeffects on each. Such an analysis could add conceptual andmanagerial insights. For example, if the impact on consid-eration appears greater, marketing efforts should focus onconverting this increased consideration into trial.
Fifth, researchers could decompose store traffic andrevenue effects to clarify the underlying mechanisms. Forstore traffic, it would be helpful to decompose the effects inchanges in visit frequencies and changes in the size of thecustomer base. To this end, researchers could obtain aver-age visit frequencies from customer respondents and com-pare the frequency distributions between stores and acrosstime. Store traffic effects that cannot be attributed tochanges in visit frequencies would be due to an expansionof the customer base. As for revenue, panel data wouldenable researchers to track individual customers over timeand split the effects into revenues generated by new cus-tomers (after remodeling) and those from existing cus-tomers (see Sloot, Fok, and Verhoef 2006).
Servicescape Characteristic before After
Ambience
Lighting Lighting before included sterile, bright, neon lights. The new interior servicescape has a contemporary,warm lighting scheme including dimmed lights andspots to highlight paintings, the entrance to therestrooms, and special constructions like a pillar inthe middle of the restaurant. Better, clearer light isused in the counter area and for the menu displays,and shutters in front of five windows create a cozieratmosphere.
Colorschemes
The walls inside were white, the chairs were abeech color. The tables were grayish blue, the ceiling was white, and the floor was a speckled off-white. The outside walls were white and had threeblue stripes and blue skirting. The roof was red.
The walls are now dark brown and gray, the chairsauburn, gray, off-white, and ocher. The tables arenow yellow and dark brown, the ceiling is gray, andthe floor has a light terracotta color; some parts ofthe floor are highlighted in gray and yellow. The outside walls are now orange, the roof is gray, andthe fence is silver.
Space/Functionality
Layout The old store consisted of one large room and achildren’s corner. Tables were set apart by woodenflower boxes.
In the new design, the store is divided into distinctzones such as the “flexible” zone for everyone or the“grab and go” zone that features tall counters withbar stools for customers who eat alone.
Furnishing The previous furniture included traditional chairsand bench seats.
In the new design, there are a variety of seatingoptions, including higher benches, chairs, bar stools,and cantilever chairs. Instead of wooden chairs andcloth, the new servicescape furniture features leatherseats and stainless steel.
Signs, Symbols, and Artifacts
Paintings The old design featured white walls with wainscotson the lower part. The walls also contained a fewabstract and lighthouse paintings that had no relation to the store or the color schemes.
The new paintings assimilate the same colors as therest of the store (yellow, gray, brown, red). The paint-ings display famous landmarks or landscape shots inan abstract way.
APPENDIX AExamples of Changes in Studied Servicescape
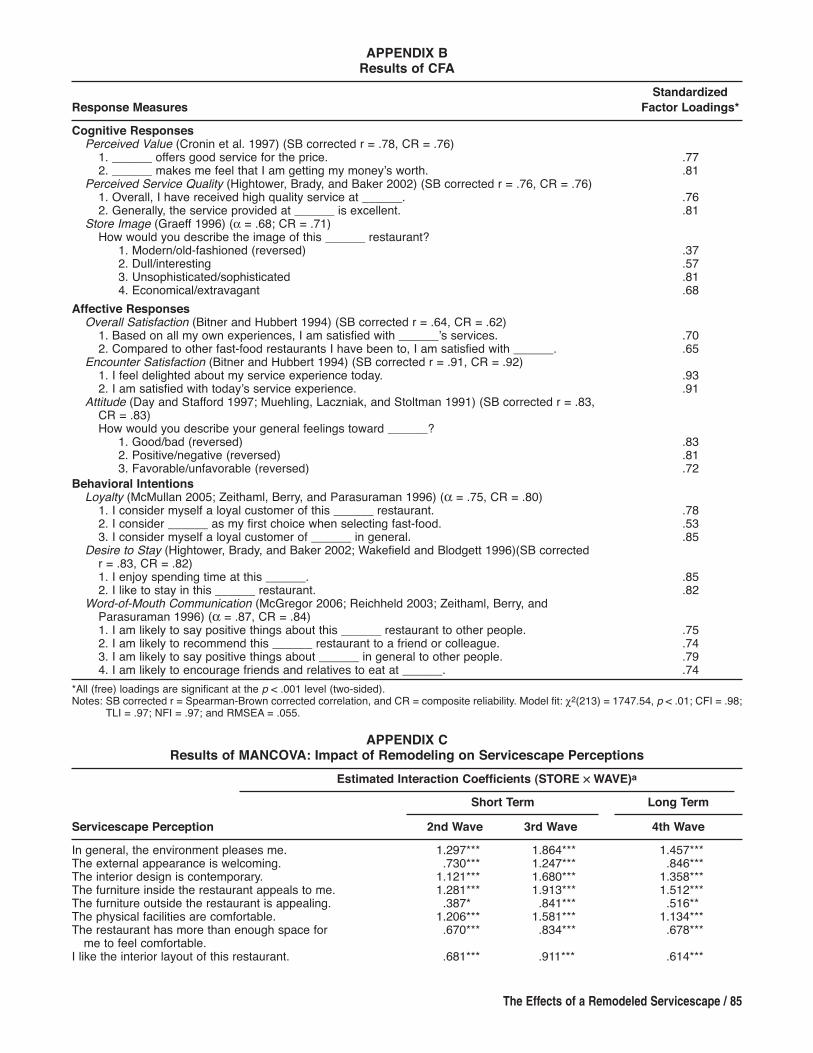
The Effects of a Remodeled Servicescape / 85
APPENDIX bResults of CFA
Standardized
Response Measures Factor Loadings*
Cognitive ResponsesPerceived Value (Cronin et al. 1997) (SB corrected r = .78, CR = .76)
1. ______ offers good service for the price. .772. ______ makes me feel that I am getting my money’s worth. .81
Perceived Service Quality (Hightower, Brady, and Baker 2002) (SB corrected r = .76, CR = .76)1. Overall, I have received high quality service at ______. .762. Generally, the service provided at ______ is excellent. .81
Store Image (Graeff 1996) (a = .68; CR = .71)How would you describe the image of this ______ restaurant?
1. Modern/old-fashioned (reversed) .372. Dull/interesting .573. Unsophisticated/sophisticated .814. Economical/extravagant .68
Affective ResponsesOverall Satisfaction (Bitner and Hubbert 1994) (SB corrected r = .64, CR = .62)
1. Based on all my own experiences, I am satisfied with ______’s services. .702. Compared to other fast-food restaurants I have been to, I am satisfied with ______. .65
Encounter Satisfaction (Bitner and Hubbert 1994) (SB corrected r = .91, CR = .92)1. I feel delighted about my service experience today. .932. I am satisfied with today’s service experience. .91
Attitude (Day and Stafford 1997; Muehling, Laczniak, and Stoltman 1991) (SB corrected r = .83, CR = .83)How would you describe your general feelings toward ______?
1. Good/bad (reversed) .832. Positive/negative (reversed) .813. Favorable/unfavorable (reversed) .72
behavioral IntentionsLoyalty (McMullan 2005; Zeithaml, Berry, and Parasuraman 1996) (a = .75, CR = .80)
1. I consider myself a loyal customer of this ______ restaurant. .782. I consider ______ as my first choice when selecting fast-food. .533. I consider myself a loyal customer of ______ in general. .85
Desire to Stay (Hightower, Brady, and Baker 2002; Wakefield and Blodgett 1996)(SB corrected r = .83, CR = .82)1. I enjoy spending time at this ______. .852. I like to stay in this ______ restaurant. .82
Word-of-Mouth Communication (McGregor 2006; Reichheld 2003; Zeithaml, Berry, and Parasuraman 1996) (a = .87, CR = .84)1. I am likely to say positive things about this ______ restaurant to other people. .752. I am likely to recommend this ______ restaurant to a friend or colleague. .743. I am likely to say positive things about ______ in general to other people. .794. I am likely to encourage friends and relatives to eat at ______. .74
*All (free) loadings are significant at the p < .001 level (two-sided).Notes: SB corrected r = Spearman-Brown corrected correlation, and CR = composite reliability. Model fit: c2(213) = 1747.54, p < .01; CFI = .98;
TLI = .97; NFI = .97; and RMSEA = .055.
APPENDIX CResults of MANCOVA: Impact of Remodeling on Servicescape Perceptions
Estimated Interaction Coefficients (STORE ¥ WAVE)a
Short Term Long Term
Servicescape Perception 2nd Wave 3rd Wave 4th Wave
In general, the environment pleases me. 1.297*** 1.864*** 1.457***The external appearance is welcoming. .730*** 1.247*** .846***The interior design is contemporary. 1.121*** 1.680*** 1.358***The furniture inside the restaurant appeals to me. 1.281*** 1.913*** 1.512***The furniture outside the restaurant is appealing. .387* .841*** .516**The physical facilities are comfortable. 1.206*** 1.581*** 1.134***The restaurant has more than enough space for .670*** .834*** .678***
me to feel comfortable.I like the interior layout of this restaurant. .681*** .911*** .614***

86 / Journal of Marketing, September 2011
Brehm, Sharon S. and Jack Williams Brehm (1981), PsychologicalReactance: A Theory of Freedom and Control. New York: Aca-demic Press.
Browne, Michael W. and Robert Cudeck (1993), “AlternativeWays of Assessing Model Fit,” in Testing Structural EquationModels, Kenneth E. Bollen and J. Scott Long, eds. NewburyPark, CA: Sage Publications, 136–62.
Bucklin, Randolph E. and James M. Lattin (1991), “A Two-StateModel of Purchase Incidence and Brand Choice,” MarketingScience, 10 (1), 24–39.
Clendenen, Vanessa I., C. Peter Herman, and Janet Polivy (1994),“Social Facilitation of Eating Among Friends and Strangers,”Appetite, 23 (1), 1–13.
Cronin, J. Joseph, Jr., Michael K. Brady, Richard R. Brand,Roscoe Hightower Jr., and Donald J. Shemwell (1997), “ACross-Sectional Test of the Effect and Conceptualization ofService Value,” Journal of Services Marketing, 11 (6), 375–91.
Crowley, Ayn E. (1993), “The Two-Dimensional Impact of Coloron Shopping,” Marketing Letters, 4 (1), 59–69.
Day, Ellen and Marla Royne Stafford (1997), “Age-Related Cuesin Retail Services Advertising: Their Effect on Younger Con-sumers,” Journal of Retailing, 73 (2), 211–33.
Gogoi, Pallavi, Michael Arndt, and Abed Moiduddin (2006),“Mickey D’s McMakeover,” BusinessWeek, (May 15), 42–43.
Goliath (2003), “Gateway Reports 2003 Second Quarter Results,”PR Newswire, (accessed April 29, 2010), [available at http://goliath. ecnext.com/coms2/gi_0199-2986384/Gateway-Reports- 2003-Second-Quarter.html].
Graeff, Timothy R. (1996), “Image Congruence Effects on ProductEvaluations: The Role of Self-Monitoring and Public/PrivateConsumption,” Psychology & Marketing, 13 (5), 481–99.
Hancock, Gregory R., Frank R. Lawrence, and Jonathan Nevitt(2000), “Type I Error and Power of Latent Mean Methods andMANOVA in Factorially Invariant and Noninvariant LatentVariable Systems,” Structural Equation Modeling, 7 (4), 534–56.
Helson, Harry (1964), Adaptation Level Theory. New York:Harper & Row.
Hennig-Thurau, Thorsten, Markus Groth, Michael Paul, andDwayne D. Gremler (2006), “Are All Smiles Created Equal?How Emotional Contagion and Emotional Labor Affect Ser-vice Relationships,” Journal of Marketing, 70 (July), 58–73.
Hightower, Roscoe, Michael K. Brady, and Thomas L. Baker(2002), “Investigating the Role of the Physical Environment inHedonic Service Consumption: An Exploratory Study of Sport-ing Events,” Journal of Business Research, 55 (9), 697–707.
REFERENCESAnderson, James C. and David W. Gerbing (1988), “Structural
Equation Modeling in Practice: A Review and RecommendedTwo-Step Approach,” Psychological Bulletin, 103 (3), 411–23.
Areni, Charles S. and David Kim (1993), “The Influence of Back-ground Music on Shopping Behavior: Classical Versus Top-Forty Music in a Wine Store,” Advances in ConsumerResearch, Vol. 20, Leigh McAlister and Michael L. Rothschild,eds. Provo, UT: Association for Consumer Research, 336–40.
——— and ——— (1994), “The Influence of In-Store Lighting onConsumers’ Examination of Merchandise in a Wine Store,”International Journal of Research in Marketing, 11 (2), 117–25.
Baker, Julie, Dhruv Grewal, and A. Parasuraman (1994), “TheInfluence of Store Environment on Quality Inferences andStore Image,” Journal of the Academy of Marketing Science,22 (4), 328–39.
———, A. Parasuraman, Dhruv Grewal, and Glenn B. Voss (2002),“The Influence of Multiple Store Environment Cues on Per-ceived Merchandise Value and Patronage Intentions,” Journalof Marketing, 66 (April), 120–41.
Bell, David R., Teck-Hua Ho, and Christopher S. Tang (1998),“Determining Where to Shop: Fixed and Variable Costs ofShopping,” Journal of Marketing Research, 35 (August),352–69.
Berlyne, Daniel E. (1970), “Novelty, Complexity, and HedonicValue,” Perception & Psychophysics, 8 (5), 279–86.
Bettman, James R. (1979), An Information Processing Theory ofConsumer Choice. Reading, MA: Addison-Wesley.
Bitner, Mary Jo (1992), “Servicescapes: The Impact of PhysicalSurroundings on Customers and Employees,” Journal of Mar-keting, 56 (April), 57–71.
——— and Amy R. Hubbert (1994), “Encounter Satisfaction Ver-sus Overall Satisfaction Versus Quality,” in Service Quality:New Directions in Theory and Practice, Roland T. Rust andRichard L. Oliver, eds. New York: Sage Publications, 72–94.
Block, Lauren G. and Vicki G. Morwitz (1999), “Shopping Listsas an External Memory Aid for Grocery Shopping: Influenceson List Writing and List Fulfillment,” Journal of ConsumerPsychology, 8 (4), 343–75.
Boswell, Wendy R., John W. Boudreau, and Jan Tichy (2005),“The Relationship Between Employee Job Change and JobSatisfaction: The Honeymoon-Hangover Effect,” Journal ofApplied Psychology, 90 (5), 882–92.
Bower, Gordon H., John B. Black, and Terrence J. Turner (1979),“Scripts in Memory for Text,” Cognitive Psychology, 11 (2),177–220.
APPENDIX CContinued
Estimated Interaction Coefficients (STORE ¥ WAVE)a
Short Term Long Term
Servicescape Perception 2nd Wave 3rd Wave 4th Wave
The wall decorations are fashionable. .920*** .947*** .837***The atmosphere is warm. .359* .474** .922***The lighting is comfortable. .119 .223 .195The colors of the exterior are pleasing. .281 .752*** .403*The colors of the interior are pleasing. .858*** 1.177*** .861***
*p < .05 (all tests are two-sided).**p < .01.***p < .001.aThese coefficients capture the extent to which the difference in perceptions between the treatment and control store increases (+) ordecreases (–) compared with the wave before the remodeling. For example, a coefficient of 1.297 in Wave 2 indicates that the difference inperception between the treatment and control store increases by 1.297 compared with Wave 1.
Notes: Wilks’ L = .895, F(39, 8031.6) = 7.830, p < .001, partial 2 = .04.

Holt, Douglas B. (1995), “How Consumers Consume: A Typologyof Consumption Practices,” Journal of Consumer Research, 22(1), 1–16.
Inman, Jeffrey J., Russell S. Winer, and Rosellina Ferraro (2009),“The Interplay Among Category Characteristics, CustomerCharacteristics, and Customer Activities on In-Store DecisionMaking,” Journal of Marketing, 73 (September), 19–29.
Iyer, Easwar S. (1989), “Unplanned Purchasing: Knowledge ofShopping Environment and Time Pressure,” Journal of Retail-ing, 65 (1), 40–57.
Jeffries, Joe and Jay Eisenberg (2005), “M2: A New Concept inRetail,” (accessed April 29, 2010), [available at http://web.archive.org/web/20050216145733/http://mediarelations.office -depot. cc/M2/overview.asp].
Jöreskog, Karl G. and Arthur S. Goldberger (1975), “Estimation ofa Model with Multiple Indicators and Multiple Causes of aSingle Latent Variable,” Journal of the American StatisticalAssociation, 70 (351), 631–39.
Kahn, Barbara E. and David C. Schmittlein (1992), “The Relation-ship Between Purchases Made on Promotion and ShoppingTrip Behavior,” Journal of Retailing, 68 (3), 294–315.
Kaltcheva, Velitchka D. and Barton A. Weitz (2006), “WhenShould a Retailer Create an Exciting Store Environment?”Journal of Marketing, 70 (January), 107–118.
Lawton, M. Powell (1990), “Residential Environment and Self-Directedness Among Older People,” American Psychologist,45 (5), 638–40.
Lehmann, Donald R. (2004), “Metrics for Making Marketing Mat-ter,” Journal of Marketing, 68 (October), 73–75.
Mangleburg, Tamara F., Patricia M. Doney, and Terry Bristol(2004), “Shopping with Friends and Teens’ Susceptibility toPeer Influence,” Journal of Retailing, 80 (2), 101–116.
Mattila, Anna S. and Jochen Wirtz (2001), “Congruency of Scentand Music as a Driver of In-Store Evaluations and Behavior,”Journal of Retailing, 77 (2), 273–89.
McGregor, Jena (2006), “Would You Recommend Us?” Business-Week, (January 30), 94–95.
McMullan, Rosalind (2005), “A Multiple-Item Scale for Measur-ing Customer Loyalty Development,” Journal of Services Mar-keting, 19 (7), 470–81.
Mehrabian, Albert (1995), “Theory and Evidence Bearing on aScale of Trait Arousability,” Current Psychology, 14 (1), 3–28.
——— and James A. Russell (1974), An Approach to Environmen-tal Psychology. Cambridge, MA: Massachusetts Institute ofTechnology.
Merrick, Amy (2008), “Victoria’s Secret: We’re Too Sexy,” TheWall Street Journal, (March 3), (accessed April 1, 2009),[available at http://articles.moneycentral.msn.com/Investing/Extra/ VictoriasSecretBossWereTooSexy.aspx].
Michael, Steven C. (1999), “Do Franchised Chains AdvertiseEnough?” Journal of Retailing, 75 (4), 461–78.
Milliman, Ronald E. (1982), “Using Background Music to Affectthe Behavior of Supermarket Shoppers,” Journal of Marketing,46 (July), 86–91.
Moe, Wendy W. and Sha Yang (2009), “Inertial Disruption: TheImpact of a New Competitive Entrant on Online ConsumerSearch,” Journal of Marketing, 73 (January), 109–121.
Muehling, Darrel D., Russell N. Laczniak, and Jeffrey J. Stoltman(1991), “The Moderating Effects of Ad Message Involvement:A Reassessment,” Journal of Advertising Research, 20 (2),29–38.
Nation’s Restaurant News (2003), “NRN Taps Four as 2003 Suc-cessful Settings Award Winners—News,” Nation’s RestaurantNews, 37 (34), 8.
The Effects of a Remodeled Servicescape / 87
Pan, Yue and George M. Zinkhan (2006), “Determinants of RetailPatronage: A Meta-Analytical Perspective,” Journal of Retail-ing, 82 (3), 229–43.
Parish, Janet Turner, Leonard L. Berry, and Shun Yin Lam (2008),“The Effect of the Servicescape on Service Workers,” Journalof Service Research, 10 (3), 220–38.
Parks, Richard W. (1967), “Efficient Estimation of a System ofRegression Equations when Disturbances Are Both Seriallyand Contemporaneously Correlated,” Journal of the AmericanStatistical Association, 62 (318), 500–509.
Reichheld, Frederick F. (2003), “The One Number You Need toGrow,” Harvard Business Review, 81 (12), 46–54.
Russell, James A. and Ulrich F. Lanius (1984), “Adaptation Leveland the Affective Appraisal of Environments,” Journal of Envi-ronmental Psychology, 4 (2), 119–35.
Shadish, William R., Thomas D. Cook, and Donald T. Campbell(2002), Experimental and Quasi-Experimental Designs, 2d ed.Boston: Houghton Mifflin.
Sharma, Arun and Thomas F. Stafford (2000), “The Effect ofRetail Atmospherics on Customers’ Perceptions of Salespeopleand Customer Persuasion: An Empirical Investigation,” Jour-nal of Business Research, 49 (2), 183–91.
Sloot, Laurens M., Dennis Fok, and Peter C. Verhoef (2006), “TheShort- and Long-Term Impact of an Assortment Reduction onCategory Sales,” Journal of Marketing Research, 43 (Novem-ber), 536–48.
Sommer, Robert and Barbara A. Sommer (1989), “Social Facilita-tion Effects in Coffeehouses,” Environment & Behavior, 21(6), 651–66.
Spangenberg, Eric R., David E. Sprott, Bianca Grohmann, andDaniel L. Tracy (2006), “Gender-Congruent Ambient ScentInfluences on Approach and Avoidance Behaviors in a RetailStore,” Journal of Business Research, 59 (12), 1281–87.
Szymanski, David M. and David H. Henard (2001), “CustomerSatisfaction: A Meta-Analysis of the Empirical Evidence,”Journal of the Academy of Marketing Science, 29 (1), 16–35.
Thompson, Marilyn S. and Samuel B. Green (2006), “EvaluatingBetween-Group Differences in Latent Variable Means,” inStructural Equation Modeling: A Second Course, Gregory R.Hancock and Ralph O. Mueller, eds. Greenwich, CT: Informa-tion Age Publishing, 119–69.
Tombs, Alastair and Janet R. McColl-Kennedy (2003), “Social-Servicescape Conceptual Model,” Marketing Theory, 3 (4),447–75.
Tversky, Barbara (1981), “Distortions in Memory for Maps,” Cog-nitive Psychology, 13 (3), 407–433.
Van Heerde, Harald and Tammo H.A. Bijmolt (2005), “Decom-posing the Promotional Revenue Bump for Loyalty ProgramMembers Versus Nonmembers,” Journal of MarketingResearch, 42 (October), 443–57.
———, Els Gijsbrechts, and Koen Pauwels (2008), “Winners andLosers in a Major Price War,” Journal of Marketing Research,45 (October), 499–518.
Van Kenhove, Patrick, Kristof de Wulf, and Walter van Water-schoot (1999), “The Impact of Task Definition on Store-Attribute Salience and Store Choice,” Journal of Retailing, 75(1), 125–37.
Wakefield, Kirk L. and Jeffrey G. Blodgett (1996), “The Effect ofthe Servicescape on Customer’s Behavioral Intentions inLeisure Service Settings,” Journal of Services Marketing, 10(6), 45–61.
Zeithaml, Valarie A., Leonard L. Berry, and A. Parasuraman(1996), “The Behavioral Consequences of Service Quality,”Journal of Marketing, 60 (May), 31–46.

Copyright of Journal of Marketing is the property of American Marketing Association and its content may not
be copied or emailed to multiple sites or posted to a listserv without the copyright holder's express written
permission. However, users may print, download, or email articles for individual use.