Embed Size (px)
Citation preview
Ellerston Asian Investments (EAI)
Quarterly Update Presentation June 2021
Presentation Title 00.00.0000Ellerston Capital
01
02
03
Ellerston Asia
Outlook for Asia & Key Thematics
Positioning & Performance
3
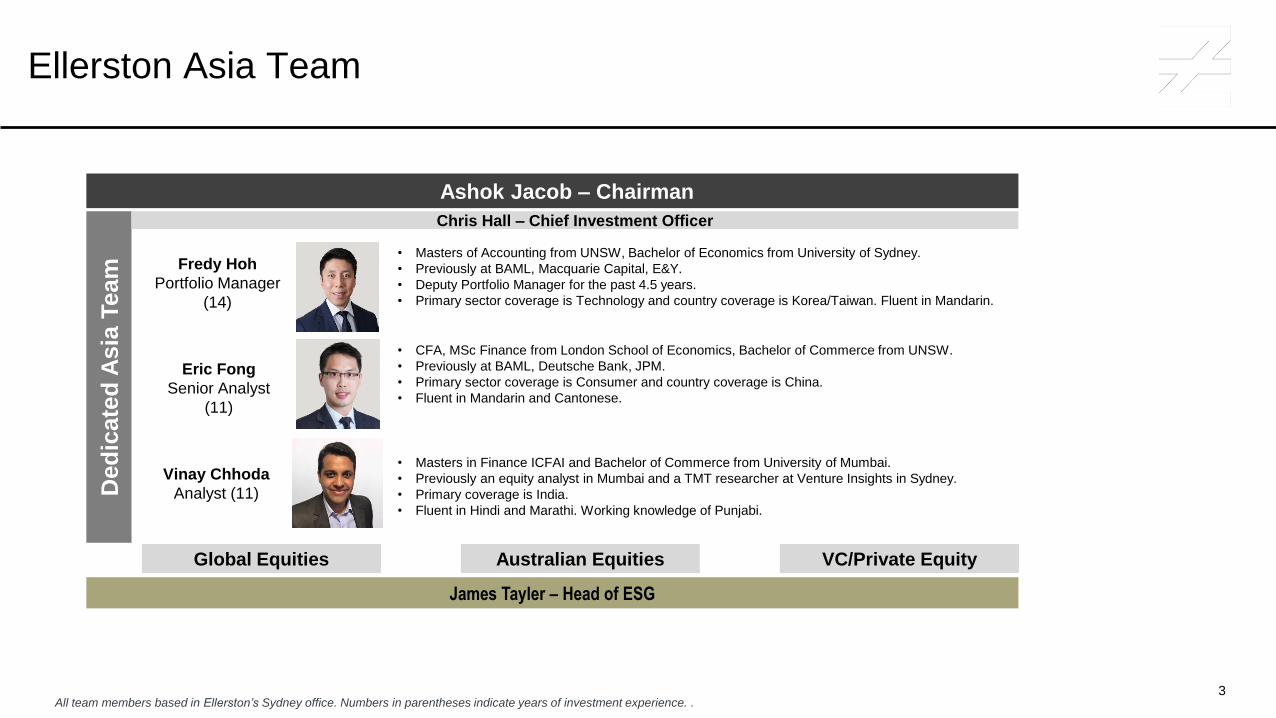
Fredy Hoh
Portfolio Manager
(14)
3
Ellerston Asia Team
• Masters of Accounting from UNSW, Bachelor of Economics from University of Sydney.
• Previously at BAML, Macquarie Capital, E&Y.
• Deputy Portfolio Manager for the past 4.5 years.
• Primary sector coverage is Technology and country coverage is Korea/Taiwan. Fluent in Mandarin.
Eric Fong
Senior Analyst
(11)
• CFA, MSc Finance from London School of Economics, Bachelor of Commerce from UNSW.
• Previously at BAML, Deutsche Bank, JPM.
• Primary sector coverage is Consumer and country coverage is China.
• Fluent in Mandarin and Cantonese.
Vinay Chhoda
Analyst (11)
• Masters in Finance ICFAI and Bachelor of Commerce from University of Mumbai.
• Previously an equity analyst in Mumbai and a TMT researcher at Venture Insights in Sydney.
• Primary coverage is India.
• Fluent in Hindi and Marathi. Working knowledge of Punjabi.
All team members based in Ellerston’s Sydney office. Numbers in parentheses indicate years of investment experience. .
Ded
icate
d A
sia
Team
Ashok Jacob – Chairman
Chris Hall – Chief Investment Officer
Global Equities Australian Equities VC/Private Equity
James Tayler – Head of ESG
4
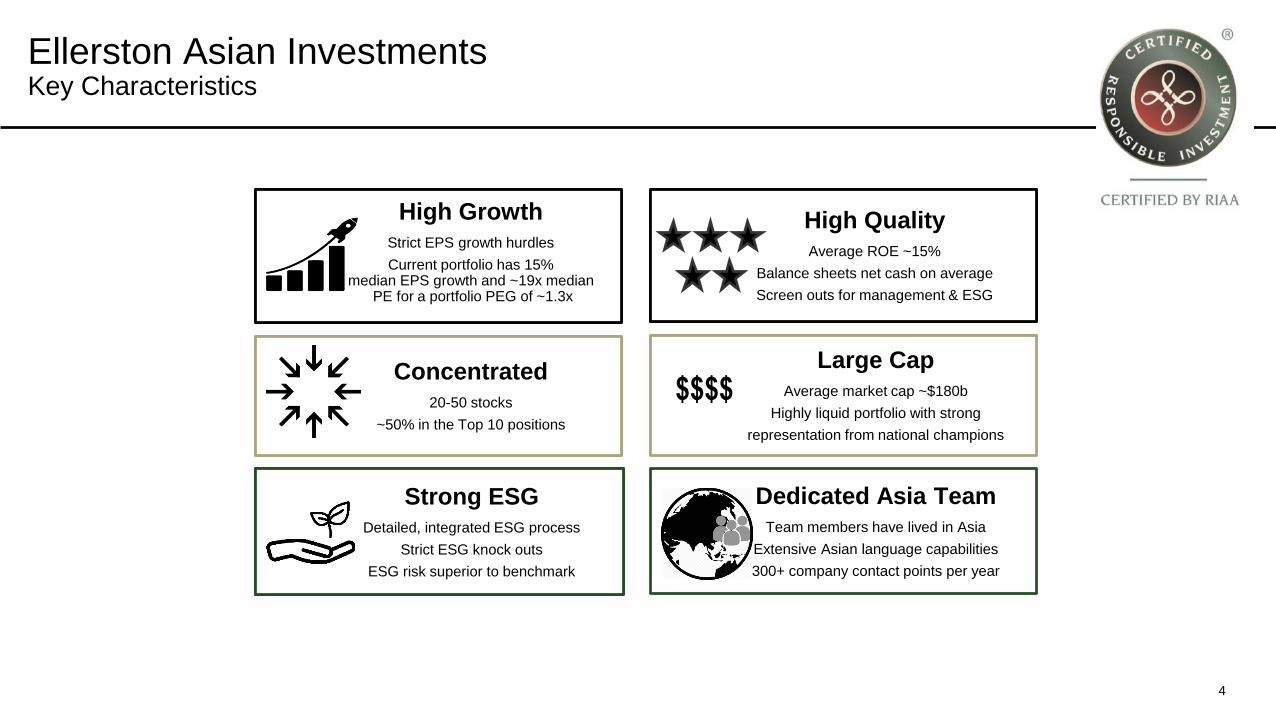
Ellerston Asian InvestmentsKey Characteristics
Dedicated Asia TeamTeam members have lived in Asia
Extensive Asian language capabilities
300+ company contact points per year
Strong ESGDetailed, integrated ESG process
Strict ESG knock outs
ESG risk superior to benchmark
Large CapAverage market cap ~$180b
Highly liquid portfolio with strong
representation from national champions
High QualityAverage ROE ~15%
Balance sheets net cash on average
Screen outs for management & ESG
Concentrated20-50 stocks
~50% in the Top 10 positions
High GrowthStrict EPS growth hurdles
Current portfolio has 15% median EPS growth and ~19x median
PE for a portfolio PEG of ~1.3x
$$$$

Presentation Title 00.00.0000Ellerston Capital
01
02
03
Ellerston Asia
Outlook for Asia & Key Thematics
Positioning & Performance
6
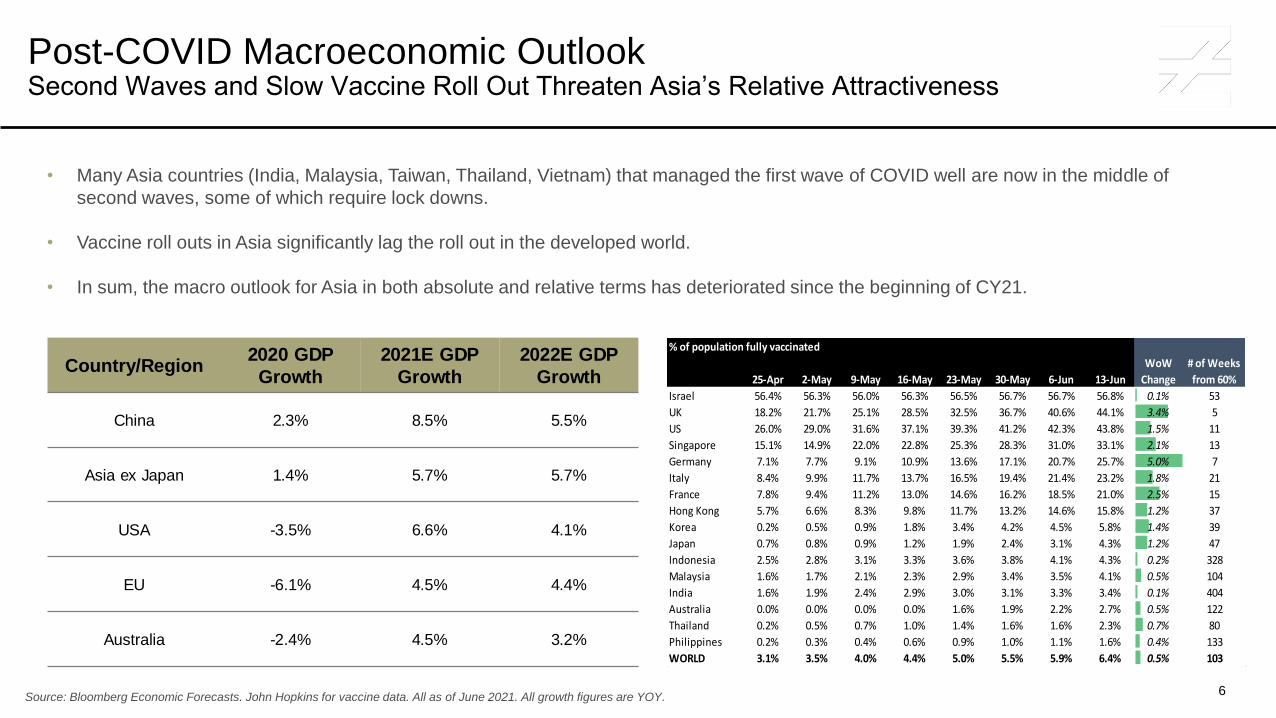
Post-COVID Macroeconomic OutlookSecond Waves and Slow Vaccine Roll Out Threaten Asia’s Relative Attractiveness
• Many Asia countries (India, Malaysia, Taiwan, Thailand, Vietnam) that managed the first wave of COVID well are now in the middle of
second waves, some of which require lock downs.
• Vaccine roll outs in Asia significantly lag the roll out in the developed world.
• In sum, the macro outlook for Asia in both absolute and relative terms has deteriorated since the beginning of CY21.
Source: Bloomberg Economic Forecasts. John Hopkins for vaccine data. All as of June 2021. All growth figures are YOY.
Country/Region2020 GDP
Growth
2021E GDP
Growth
2022E GDP
Growth
China 2.3% 8.5% 5.5%
Asia ex Japan 1.4% 5.7% 5.7%
USA -3.5% 6.6% 4.1%
EU -6.1% 4.5% 4.4%
Australia -2.4% 4.5% 3.2%
% of population fully vaccinated
25-Apr 2-May 9-May 16-May 23-May 30-May 6-Jun 13-Jun
WoW
Change
# of Weeks
from 60%
Israel 56.4% 56.3% 56.0% 56.3% 56.5% 56.7% 56.7% 56.8% 0.1% 53
UK 18.2% 21.7% 25.1% 28.5% 32.5% 36.7% 40.6% 44.1% 3.4% 5
US 26.0% 29.0% 31.6% 37.1% 39.3% 41.2% 42.3% 43.8% 1.5% 11
Singapore 15.1% 14.9% 22.0% 22.8% 25.3% 28.3% 31.0% 33.1% 2.1% 13
Germany 7.1% 7.7% 9.1% 10.9% 13.6% 17.1% 20.7% 25.7% 5.0% 7
Italy 8.4% 9.9% 11.7% 13.7% 16.5% 19.4% 21.4% 23.2% 1.8% 21
France 7.8% 9.4% 11.2% 13.0% 14.6% 16.2% 18.5% 21.0% 2.5% 15
Hong Kong 5.7% 6.6% 8.3% 9.8% 11.7% 13.2% 14.6% 15.8% 1.2% 37
Korea 0.2% 0.5% 0.9% 1.8% 3.4% 4.2% 4.5% 5.8% 1.4% 39
Japan 0.7% 0.8% 0.9% 1.2% 1.9% 2.4% 3.1% 4.3% 1.2% 47
Indonesia 2.5% 2.8% 3.1% 3.3% 3.6% 3.8% 4.1% 4.3% 0.2% 328
Malaysia 1.6% 1.7% 2.1% 2.3% 2.9% 3.4% 3.5% 4.1% 0.5% 104
India 1.6% 1.9% 2.4% 2.9% 3.0% 3.1% 3.3% 3.4% 0.1% 404
Australia 0.0% 0.0% 0.0% 0.0% 1.6% 1.9% 2.2% 2.7% 0.5% 122
Thailand 0.2% 0.5% 0.7% 1.0% 1.4% 1.6% 1.6% 2.3% 0.7% 80
Philippines 0.2% 0.3% 0.4% 0.6% 0.9% 1.0% 1.1% 1.6% 0.4% 133
WORLD 3.1% 3.5% 4.0% 4.4% 5.0% 5.5% 5.9% 6.4% 0.5% 103
7
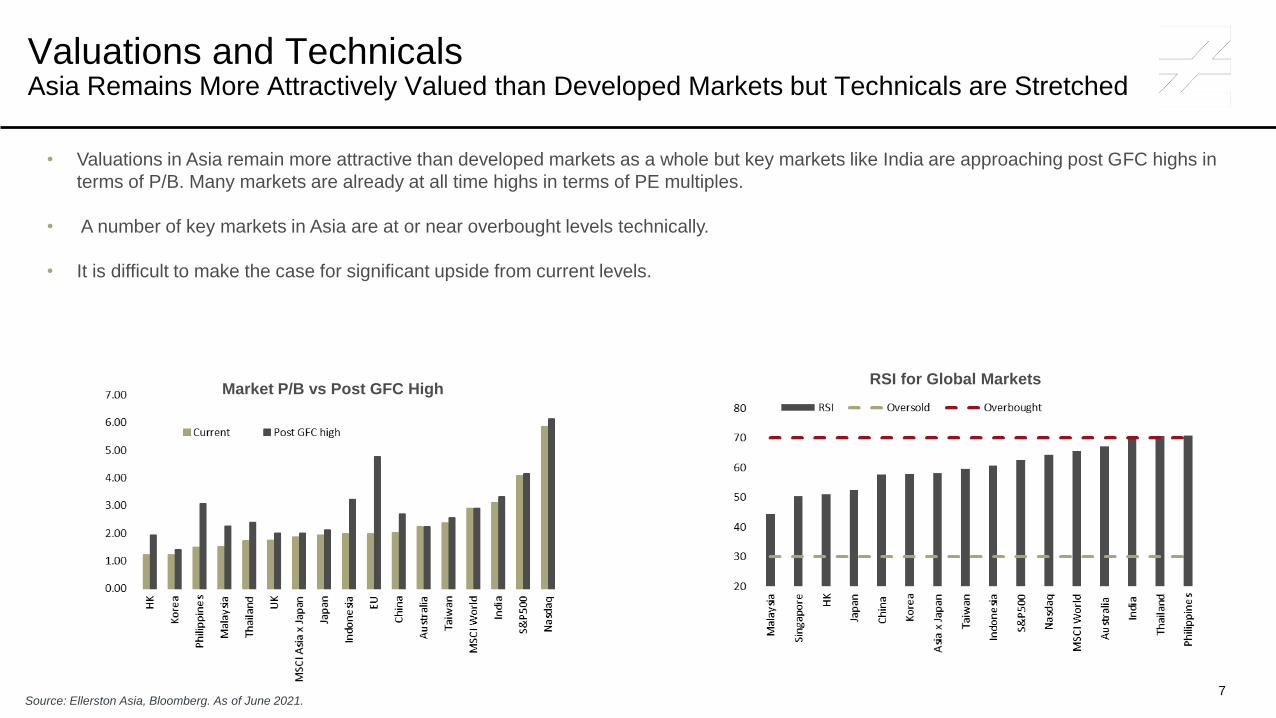
Valuations and TechnicalsAsia Remains More Attractively Valued than Developed Markets but Technicals are Stretched
• Valuations in Asia remain more attractive than developed markets as a whole but key markets like India are approaching post GFC highs in
terms of P/B. Many markets are already at all time highs in terms of PE multiples.
• A number of key markets in Asia are at or near overbought levels technically.
• It is difficult to make the case for significant upside from current levels.
Source: Ellerston Asia, Bloomberg. As of June 2021.
RSI for Global MarketsMarket P/B vs Post GFC High
8
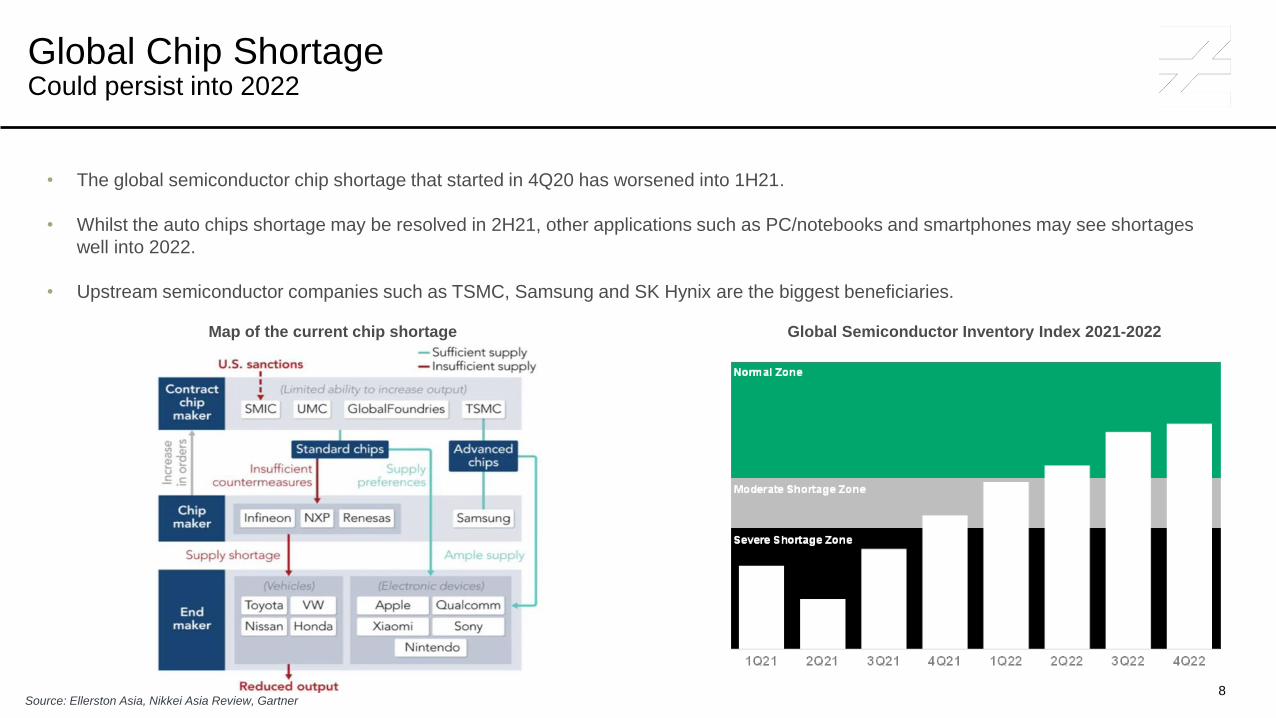
Global Chip ShortageCould persist into 2022
• The global semiconductor chip shortage that started in 4Q20 has worsened into 1H21.
• Whilst the auto chips shortage may be resolved in 2H21, other applications such as PC/notebooks and smartphones may see shortages
well into 2022.
• Upstream semiconductor companies such as TSMC, Samsung and SK Hynix are the biggest beneficiaries.
Source: Ellerston Asia, Nikkei Asia Review, Gartner
Global Semiconductor Inventory Index 2021-2022Map of the current chip shortage
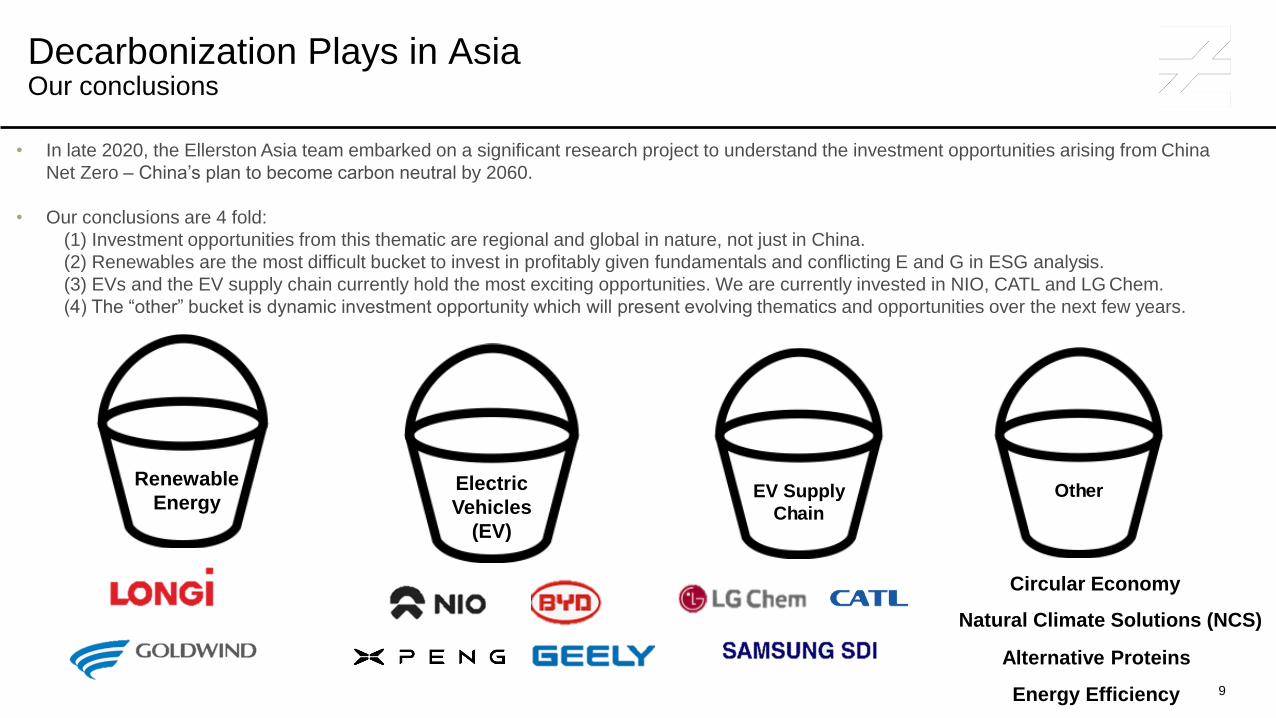
Decarbonization Plays in AsiaOur conclusions
Renewable
EnergyElectric
Vehicles
(EV)
EV Supply
Chain
• In late 2020, the Ellerston Asia team embarked on a significant research project to understand the investment opportunities arising from China
Net Zero – China’s plan to become carbon neutral by 2060.
• Our conclusions are 4 fold:
(1) Investment opportunities from this thematic are regional and global in nature, not just in China.
(2) Renewables are the most difficult bucket to invest in profitably given fundamentals and conflicting E and G in ESG analysis.
(3) EVs and the EV supply chain currently hold the most exciting opportunities. We are currently invested in NIO, CATL and LG Chem.
(4) The “other” bucket is dynamic investment opportunity which will present evolving thematics and opportunities over the next few years.
Other
Circular Economy
Alternative Proteins
Energy Efficiency
Natural Climate Solutions (NCS)
9
10
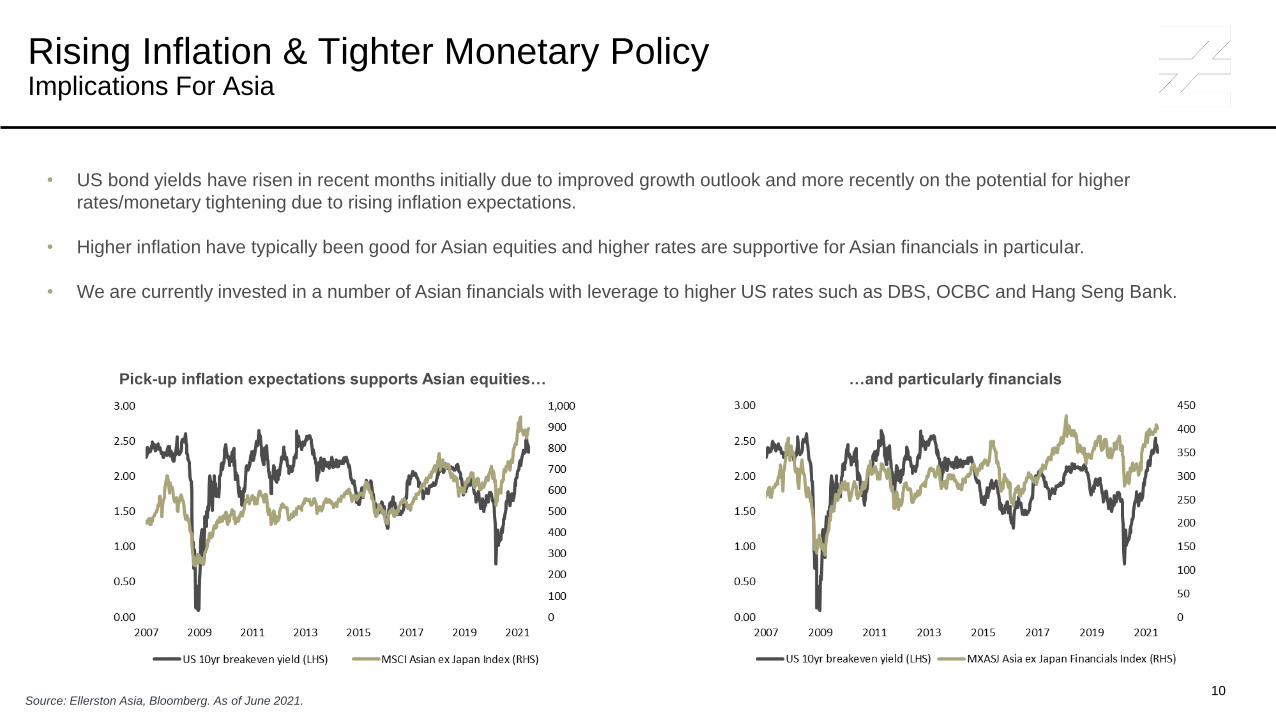
Rising Inflation & Tighter Monetary Policy Implications For Asia
• US bond yields have risen in recent months initially due to improved growth outlook and more recently on the potential for higher
rates/monetary tightening due to rising inflation expectations.
• Higher inflation have typically been good for Asian equities and higher rates are supportive for Asian financials in particular.
• We are currently invested in a number of Asian financials with leverage to higher US rates such as DBS, OCBC and Hang Seng Bank.
Source: Ellerston Asia, Bloomberg. As of June 2021.
…and particularly financialsPick-up inflation expectations supports Asian equities…
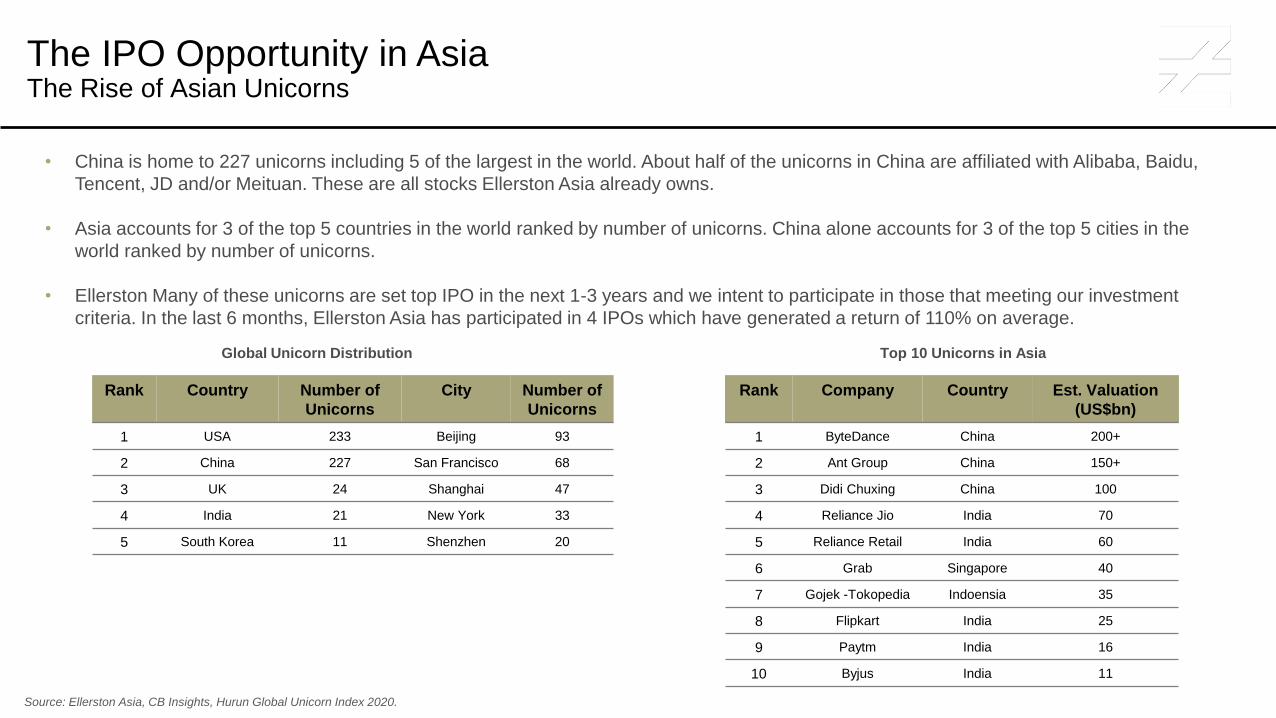
• China is home to 227 unicorns including 5 of the largest in the world. About half of the unicorns in China are affiliated with Alibaba, Baidu,
Tencent, JD and/or Meituan. These are all stocks Ellerston Asia already owns.
• Asia accounts for 3 of the top 5 countries in the world ranked by number of unicorns. China alone accounts for 3 of the top 5 cities in the
world ranked by number of unicorns.
• Ellerston Many of these unicorns are set top IPO in the next 1-3 years and we intent to participate in those that meeting our investment
criteria. In the last 6 months, Ellerston Asia has participated in 4 IPOs which have generated a return of 110% on average.
The IPO Opportunity in Asia The Rise of Asian Unicorns
Source: Ellerston Asia, CB Insights, Hurun Global Unicorn Index 2020.
Global Unicorn Distribution Top 10 Unicorns in Asia
Rank Company Country Est. Valuation
(US$bn)
1 ByteDance China 200+
2 Ant Group China 150+
3 Didi Chuxing China 100
4 Reliance Jio India 70
5 Reliance Retail India 60
6 Grab Singapore 40
7 Gojek -Tokopedia Indoensia 35
8 Flipkart India 25
9 Paytm India 16
10 Byjus India 11
Rank Country Number of
Unicorns
City Number of
Unicorns
1 USA 233 Beijing 93
2 China 227 San Francisco 68
3 UK 24 Shanghai 47
4 India 21 New York 33
5 South Korea 11 Shenzhen 20

Presentation Title 00.00.0000Ellerston Capital
01
02
03
Ellerston Asia
Outlook for Asia & Key Thematics
Positioning & Performance
13
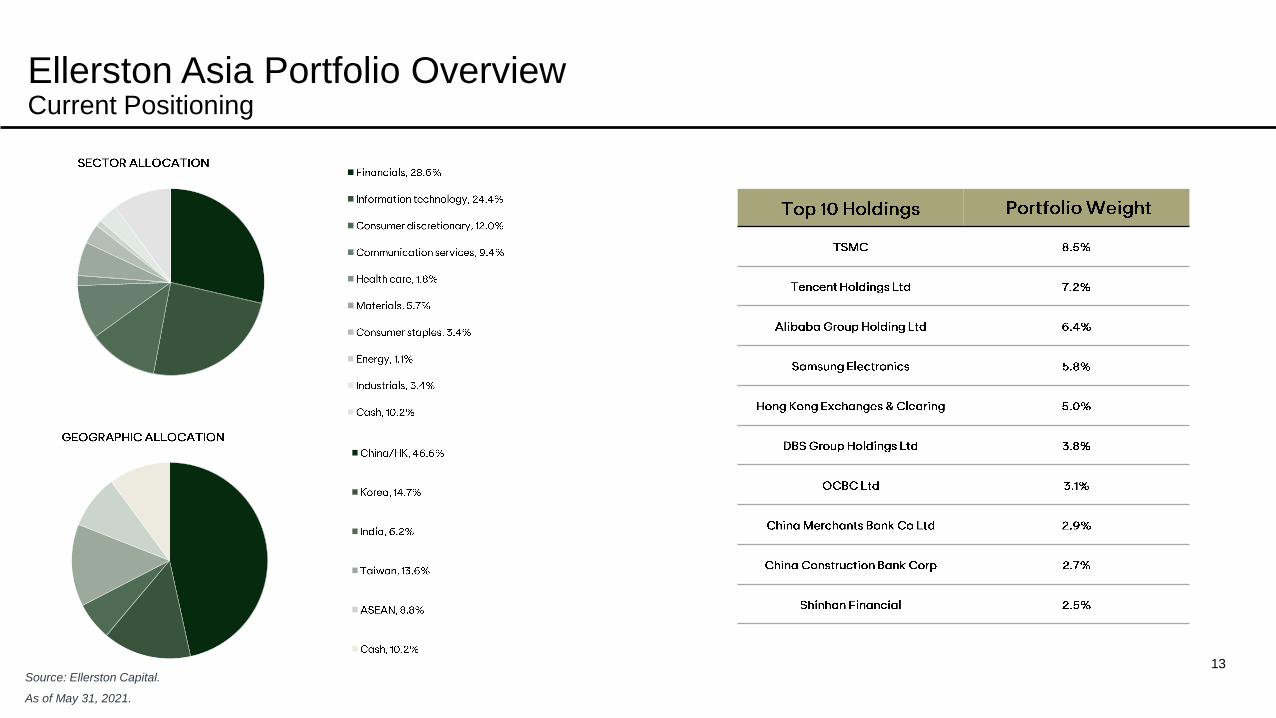
Ellerston Asia Portfolio Overview Current Positioning
Source: Ellerston Capital.
As of May 31, 2021.
14
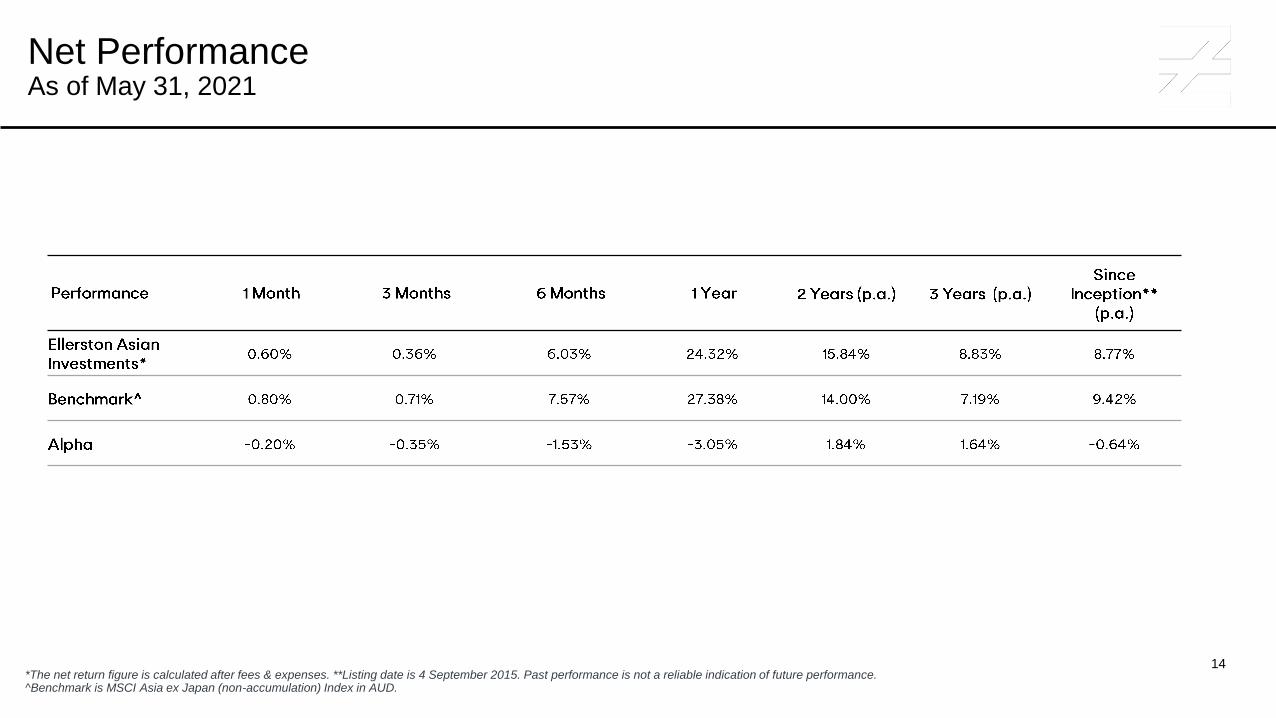
Net PerformanceAs of May 31, 2021
*The net return figure is calculated after fees & expenses. **Listing date is 4 September 2015. Past performance is not a reliable indication of future performance. ^Benchmark is MSCI Asia ex Japan (non-accumulation) Index in AUD.
15
Dividend Policy and Profit ReserveAs of May 31, 2021
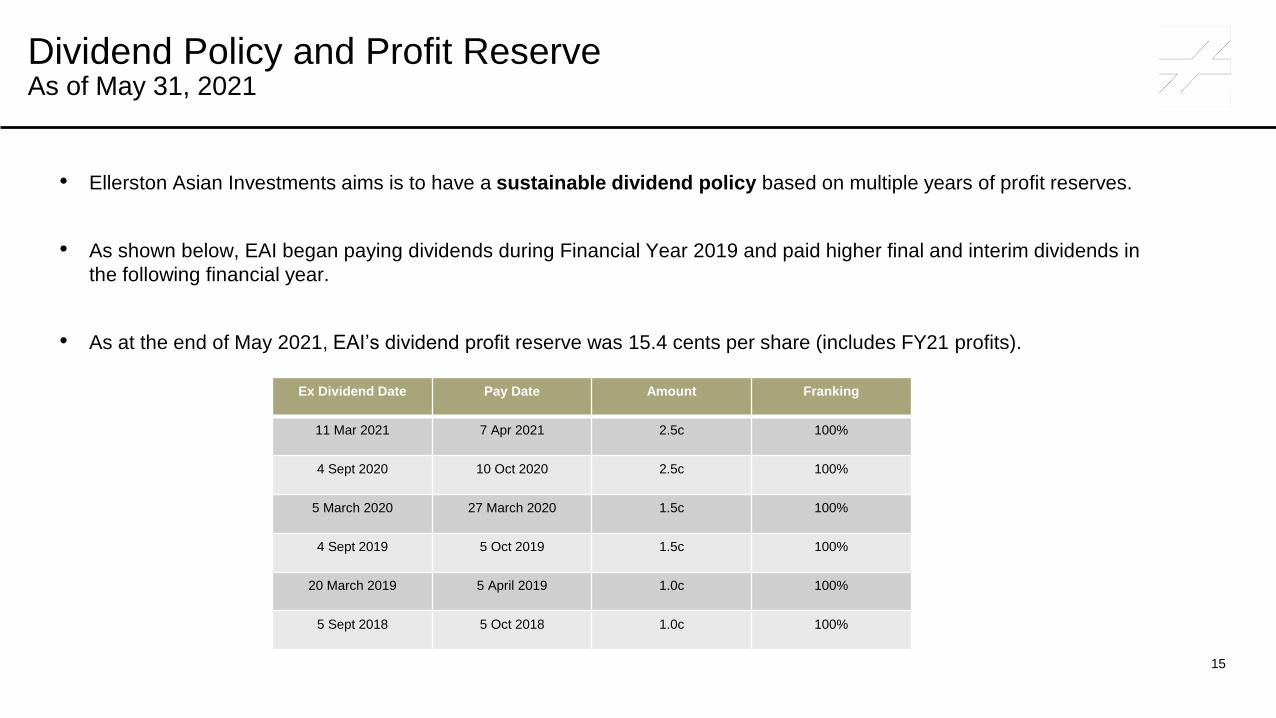
• Ellerston Asian Investments aims is to have a sustainable dividend policy based on multiple years of profit reserves.
• As shown below, EAI began paying dividends during Financial Year 2019 and paid higher final and interim dividends in
the following financial year.
• As at the end of May 2021, EAI’s dividend profit reserve was 15.4 cents per share (includes FY21 profits).
Ex Dividend Date Pay Date Amount Franking
11 Mar 2021 7 Apr 2021 2.5c 100%
4 Sept 2020 10 Oct 2020 2.5c 100%
5 March 2020 27 March 2020 1.5c 100%
4 Sept 2019 5 Oct 2019 1.5c 100%
20 March 2019 5 April 2019 1.0c 100%
5 Sept 2018 5 Oct 2018 1.0c 100%

Presentation Title 00.00.0000Ellerston Capital
Sydney Melbourne