Embed Size (px)
Citation preview
Ellex Medical Lasers Limited (ASX:ELX)
First Half FY2019 Investor Presentation
2 2 F E B R U A R Y 2 0 1 9
A D E L A I D E , A U S T R A L I A
Disclaimer
This presentation has been prepared by Ellex Medical (Ellex, ELX: ASX; OTCQX: ELXMY, ELXMF). While the information in
this presentation has been prepared in good faith and with reasonable care, no representation or warranty, express or implied,
is made as to the accuracy, adequacy or reliability of any statement, estimates, opinions or other information contained in the
presentation. This presentation may contain forward looking statement. These forward-looking statement have been made
based upon Ellex’s expectations and beliefs concerning future developments and their potential effect on Ellex (and it’s
controlled entities) and are subject to risks and uncertainty which are, in many instances, beyond Ellex’s control. No assurance
is given that future developments will be in accordance with Ellex’s expectations. Actual results could differ materially from
those expected by Ellex. This presentation does not constitute an offer to sell or a solicitation of an offer to purchase any
security or financial product or service. Any such offer or solicitation shall be made only pursuant to a Product Disclosure
Statement, Information Memorandum, Prospectus or other offer document relating to a financial product or service. Past
performance is not necessarily indicative of future results and no person guarantees the performance of any financial product
or service or the amount or timing of any return from it. There can be no assurance that the financial product or service will
achieve any targeted return, that asset allocations will be met or that the financial product or service will be able to implement
its investment strategy and investment approach or achieve its investment objective. The information contained in this
presentation is not intended to be relied upon as advice to investors or potential investors, who should consider seeking
independent professional advice depending upon their specific investment objectives, financial situation or particular needs.
F I R S T H A L F F Y 1 9 I N V E S T O R P R E S E N T A T I O N2
F I R S T H A L F F Y 1 9 I N V E S T O R P R E S E N T A T I O N3
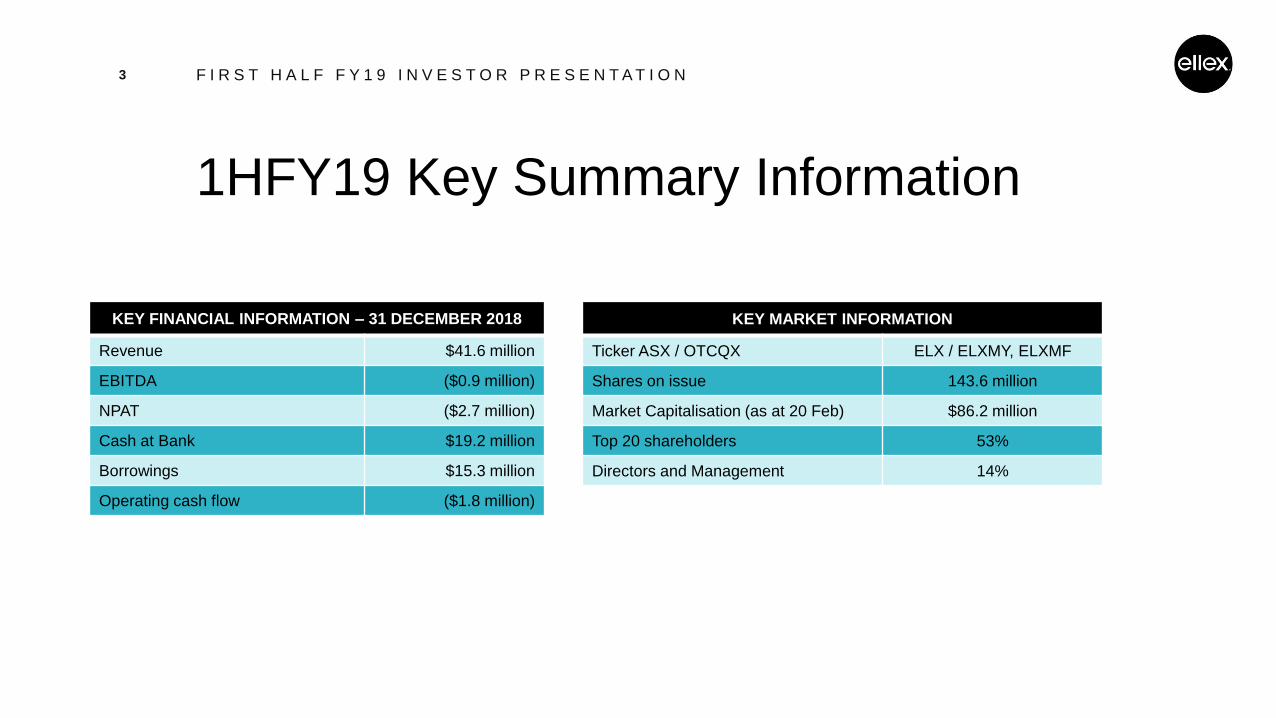
KEY FINANCIAL INFORMATION – 31 DECEMBER 2018
Revenue $41.6 million
EBITDA ($0.9 million)
NPAT ($2.7 million)
Cash at Bank $19.2 million
Borrowings $15.3 million
Operating cash flow ($1.8 million)
1HFY19 Key Summary Information
KEY MARKET INFORMATION
Ticker ASX / OTCQX ELX / ELXMY, ELXMF
Shares on issue 143.6 million
Market Capitalisation (as at 20 Feb) $86.2 million
Top 20 shareholders 53%
Directors and Management 14%

Our Business
• Comprehensive range of ophthalmic lasers, evolving consumable device business and diagnostic equipment, targeting:
• Glaucoma
• Diabetic eye disease
• Secondary cataracts
• Age-related macular degeneration (AMD)
• Vitreous opacities
• Installed base of over 35,000 Ellex ophthalmic laser and ultrasound systems globally
• To date more than 100,000 Ellex iTrack™ consumable devices sold to treat glaucoma
• A direct sales network in the major markets of USA, Japan, France, Germany and Australia
• Additionally, 50 distributors in over 100 countries
• Major growth opportunities the Company is investing financial resources into:
• Glaucoma – shift to minimally invasive glaucoma surgery (MIGS) devices vs surgery; shift to laser-based intervention as first-line therapy
• AMD – Ellex has the only clinically validated laser shown to significantly decrease the rate of progression in intermediate AMD patients
F I R S T H A L F F Y 1 9 I N V E S T O R P R E S E N T A T I O N4

Our Strategies
F I R S T H A L F F Y 1 9 I N V E S T O R P R E S E N T A T I O N5
1. Ellex Laser & Ultrasound: we will continue to provide a strong base for our business
using our well-known industry heritage and dominant market position through a
combination of technological innovation, new product releases, marketing and cost
management to drive growth in both sales and earnings.
2. Ellex iTrack™: we will leverage the Ellex Laser & Ultrasound base to exploit the unique,
comprehensive and rejuvenative method of action of the Ellex iTrack™ surgical system
to deliver rapid sales growth and ultimately earnings in the very fast-growing MIGS
market.
3. Ellex 2RT® for iAMD: using the trusted Ellex ophthalmic laser brand, we will aim to
make Ellex 2RT® nanopulse laser therapy the standard of care for the +25 million
people worldwide with intermediate AMD (iAMD).
In the long term, these strategies will provide our shareholders with material returns.

1HFY19 Group Financial Summary
• Sales revenue of $41.6 million, up 9% on the prior
corresponding period (pcp) and up 3% on a constant currency
(cc)1 basis
• Four year CAGR of 8%, ahead of typical overall industry growth rates
• Operating expenditures were up 21% (up 14% in cc terms) to
$27 million versus pcp reflecting continued investment into high
growth glaucoma and iAMD segments to drive future growth
• Gross margin (ex-labour) was up 678 bps to 62.4% versus pcp
• EBITDA loss of $0.85 million, improved 12% versus pcp
• Operating cash flow of -$1.8 million reflected an increase in
working cap associated with higher inventory build on sales
expectations, particularly for Ellex iTrack in 2019
F I R S T H A L F F Y 1 9 I N V E S T O R P R E S E N T A T I O N6
1 Constant Currency (cc) derived by converting 1HFY19 at 1HFY18 average A$ exchange rates for USD, EUR, YEN
30.7
34.8 34.3
38.1
41.6
-5
0
5
10
15
20
25
0
5
10
15
20
25
30
35
40
45
1H15 1H16 1H17 1H18 1H19
Group Revenue ($m)(LHS) Growth (%)(RHS)
FIVE YEAR SALES REVENUE ($m)
2.7
3.53.2
-1.0-0.85
-2.0
-1.0
0.0
1.0
2.0
3.0
4.0
1H15 1H16 1H17 1H18 1H19
Group EBITDA ($m)
FIVE YEAR EBITDA ($m)

Revenue by Geography
F I R S T H A L F F Y 1 9 I N V E S T O R P R E S E N T A T I O N7
1 Constant Currency (cc) derived by converting 1HFY19 at 1HFY18 average A$ exchange rates for USD, EUR, YEN; 2 EMEA – Europe, the Middle East and Africa; 3 ANZ - Australia and New Zealand; 4 LATAM - Latin America; 5 SLT – Selective Laser Trabeculoplasty
Region1H18 ($m) &
sales mix %
1H19 ($m) &
sales mix %growth pcp cc1 growth pcp
North America 15.7 (41%) 18.2 (44%) 15% 8%
EMEA2 9.9 (26%) 9.1 (22%) (7%) (12%)
Japan 6.0 (16%) 5.6 (13%) (8%) (7%)
Asia (ex-Japan) 2.0 (5%) 3.7 (9%) 90% 78%
ANZ3 3.9 (10%) 4.6 (11%) 17% 17%
LATAM4 0.6 (2%) 0.4 (1%) (40%) (43%)
TOTAL 38.1 (100%) 41.6 (100%) 9% 3%
• North America (USA) continues to be the strongest Ellex market by
absolute growth and by sales mix
• Driven by Ellex iTrack and SLT5 growth in glaucoma markets
• Both high margin products for Ellex and beneficial to margin at the cc level
• EMEA consists of direct markets (France, Germany – Lasers &
Ultrasound only) with the balance via distributors.
• Growth declined, resulting from the takeover of German distributor for EllexiTrack & general decline in purchasing sentiment
• Partially offset by significant contribution from 2RT sales in AMD post LEAD clinical study results and improved SLT laser sales
• Japanese revenues declined marginally by 8% on pcp
• Focus on higher margin product sales
• Improved gross margins despite lower sales
• Asian growth of 90% was solid across the entire product segment
• Continued growth in Chinese market for Ellex iTrack
• Solid regional demand for other Ellex products
• ANZ was up 17% versus the pcp
• Momentum in SLT and initial sales of Ellex 2RT® post LEAD

Revenue by Eye Disease (Capital Equipment)• Glaucoma lasers, notably the world-leading Ellex SLT lasers grew 21% on pcp (up 18% in cc terms) and has now delivered a three year CAGR of
20%. The market remains underpenetrated, and SLT is now a standard of care first-line therapy
• Cataracts and Vitreous Opacity lasers declined 11% over the pcp (13% in cc terms) - focus on higher margin Reflex™ range for floater treatment
• Retina disease lasers grew 5% over the pcp (4% in cc terms), which was pleasing given competition and a shift to drug therapy
• 2RT® recorded a 532% increase in sales over pcp with strong initial sales post LEAD trial data recorded
• Diagnostic ultrasound revenue was down 32% on pcp (down 39% in cc terms), users awaiting product launch
F I R S T H A L F F Y 1 9 I N V E S T O R P R E S E N T A T I O N8
9.710.5
13.9
16.8
0
2
4
6
8
10
12
14
16
18
1H16 1H17 1H18 1H19
Glaucoma Laser
DIAGNOSTIC ULTRASOUND
FOUR YEAR SALES REVENUE ($m)
5.24.0 3.6
2.4
0
2
4
6
8
10
12
14
16
18
1H16 1H17 1H18 1H19
Diagnostic Ultrasound
9.28.3 7.9
7.0
0
2
4
6
8
10
12
14
16
18
1H16 1H17 1H18 1H19
Cataracts & Vitreous Opacities
7.3 7.6 7.4 7.8
0
2
4
6
8
10
12
14
16
18
1H16 1H17 1H18 1H19
Retina Laser
0 0 0.21.25
0
2
4
6
8
10
12
14
16
18
1H16 1H17 1H18 1H19
iAMD - 2RT
GLAUCOMA LASER
FOUR YEAR SALES REVENUE ($m)
CATARACTS & VITREOUS OP.
FOUR YEAR SALES REVENUE ($m)
RETINA LASERS
FOUR YEAR SALES REVENUE ($m)
INTERMEDIATE AMD – 2RT®
FOUR YEAR SALES REVENUE ($m)
3 Year CAGR – (23%)3 Year CAGR – 20% 3 Year CAGR – (9%) 3 Year CAGR – 2% 3 Year CAGR – n/a

Revenue Composition (Capital Equipment & Consumable Devices by Eye Disease)
• Glaucoma therapy sales comprising SLT and Ellex iTrack
were up 18% (15% in cc terms) versus pcp
• Glaucoma therapy revenue three year CAGR of 23%
• SLT – 20%
• Ellex iTrack – 33%
• Significant increase in glaucoma product mix, from 50% in
1H16 to 56% in 1H19, justifying investment and focus in this
high growth market
• Glaucoma device market CAGR to 2023 of 23% (MIGS 34%)*
• SLT market CAGR to 2023 of 1.3%* (Ellex sig. ahead on growth)
• Revenues from other eye disease** devices were down 21%
versus pcp, with declining three year revenue CAGR of 17%
reflecting overall market maturity and Ellex strategy to focus
on higher margin products, with less pricing pressure
F I R S T H A L F F Y 1 9 I N V E S T O R P R E S E N T A T I O N9
12.514.1
19.2
23.2
22.3 20.1
18.9
17.1
0.2
1.25
0
5
10
15
20
25
30
35
40
45
1H16 1H17 1H18 1H19
Glaucoma therapy Devices for other eye disease Intermediate AMD therapy
FOUR YEAR SALES REVENUE ($m)
* Source: MarketScope; ** Other eye disease includes retina disease, cataracts & vitreous opacities and diagnostic ultrasound segments

Operating Expenditure
• Total operating expenditure was up 21% (14% in cc) to $26.9m (65% sales versus 59% in pcp), which is consistent with
Ellex group strategy to provide an enhanced capability to generate solid growth in the glaucoma and iAMD markets, globally
• Employee expenses were up 22% on pcp principally due to headcount expansion across field sales and management
capability, commissions paid on sales growth and FX effects
• Our sales and marketing spend of $3.7m (up 49% on pcp) was a result of increased efforts for Ellex iTrack in the key US
market, SLT and the marketing of 2RT post LEAD, along with currency impacts (highly USD denominated)
F I R S T H A L F F Y 1 9 I N V E S T O R P R E S E N T A T I O N10
* Oher: Includes professional consultants, travel, other
1.5
2.0
2.5
3.7
0.0
1.0
2.0
3.0
4.0
5.0
6.0
0
0.5
1
1.5
2
2.5
3
3.5
4
1H16 1H17 1H18 1H19
Sales, Marketing, Congresses
% sales (RHS)
SALES, MARKETING EXPENSES ($m)
10
11.3
13.7
16.7
0.0
5.0
10.0
15.0
20.0
25.0
30.0
35.0
40.0
45.0
0
2
4
6
8
10
12
14
16
18
1H16 1H17 1H18 1H19
Employee % sales (RHS)
EMPLOYEE EXPENSES ($m)
2.7
2.9
4.3
5.1
0.0
2.0
4.0
6.0
8.0
10.0
12.0
14.0
0
1
2
3
4
5
6
1H16 1H17 1H18 1H19
Other Expenses % sales (RHS)
OTHER EXPENSES* ($m)

F I R S T H A L F F Y 1 9 I N V E S T O R P R E S E N T A T I O N11
Ellex iTrack™ MIGS

F I R S T H A L F F Y 1 9 I N V E S T O R P R E S E N T A T I O N12
1HFY19 Financial Results – Ellex iTrack
iTrack EBITDA ($m)
-2.2
-4.0
-5
-4
-3
-2
-1
0
1HFY18 1HFY19
• Unit volumes increased 14% on pcp and revenues were up 24% (up 16% on a cc basis) to $6.5m
• Pricing remained stable in USD terms, reimbursement remains very strong in key US market
• Higher Average AUD price attributable to FX benefits and mix effects from higher US volumes
• Gross margin (ex-labour) was 82% (up significantly from 73% in pcp), reflecting higher volumes and positive mix effects
• Increase in EBITDA loss reflects increased sales and marketing investment, coupled with negative impact of USD
denominated cost base (cc EBITDA loss was $3.7m)
iTrack AVE. PRICE (A$)
882
941
800
900
1,000
1HFY18 1HFY19
iTrack GLOBAL UNIT VOLUME
6,036
6,868
5,000
6,000
7,000
1HFY18 1HFY19
3 Year CAGR – 33%
iTrack GLOBAL REVENUE ($m)
5.2
6.5
0
1
2
3
4
5
6
7
1HFY18 1HFY19
3 Year CAGR – 28%

F I R S T H A L F F Y 1 9 I N V E S T O R P R E S E N T A T I O N13
Ellex iTrack Units by Region
4 YEAR iTrack OUS (Ex. CHINA)
UNIT VOLUME4 YEAR iTrack USA UNIT VOLUME4 YEAR iTrack GLOBAL UNIT VOLUME
2,931
4,328
6,036
6,868
0
1,000
2,000
3,000
4,000
5,000
6,000
7,000
8,000
1HFY16 1HFY17 1HFY18 1HFY19
Units
1,344
2,0862,322
2,039
0
2,000
4,000
6,000
8,000
1HFY16 1HFY17 1HFY18 1HFY19
Units
1,5871,842
3,014
3,826
0
2,000
4,000
6,000
8,000
1HFY16 1HFY17 1HFY18 1HFY19
Units
0400
7001,003
0
2,000
4,000
6,000
8,000
1HFY16 1HFY17 1HFY18 1HFY19
Units
4 YEAR iTrack CHINA UNIT VOLUME
• US unit sales were up 27% versus the pcp reflecting continued expansion of accounts and users and higher re-order rates
• Approximately 75% of Ellex iTrack procedures are undertaken in the Ambulatory Surgical Setting (ASC), the balance within hospitals
• OUS unit sales were down 12% reflecting a slowdown in ordering from our German distributor, Fritz Ruck into a takeover
bid by Hoya Corporation in October (TYO:7741) and increased competition from MIGS competitors
• Chinese unit sales were up 43% versus the pcp, a strong result as Ellex iTrack continues to be the only MIGS device
approved in the Chinese market

F I R S T H A L F F Y 1 9 I N V E S T O R P R E S E N T A T I O N14
Ellex iTrack Revenue by Region
4 YEAR iTrack OUS REVENUE ($m)4 YEAR iTrack GLOBAL REVENUE ($m)
3.13.6
5.2
6.5
0
2
4
6
8
10
1HFY16 1HFY17 1HFY18 1HFY19
Revenue
1.3 1.3 1.6 1.4
0
2
4
6
8
10
1HFY16 1HFY17 1HFY18 1HFY19
Revenue
1.9 2.0
3.2
4.5
0
2
4
6
8
10
1HFY16 1HFY17 1HFY18 1HFY19
Revenue
0.3 0.40.6
0
2
4
6
8
10
1HFY16 1HFY17 1HFY18 1HFY19
Revenue
4 YEAR iTrack CHINA REVENUE ($m)
• During the period, Ellex iTrack revenues benefited from higher volumes, stable pricing and FX tailwinds
• US revenues were up 39% on the pcp (up 30% in cc terms)
• OUS (Ex. China) revenues were down 10% on the pcp (down 16% in cc terms)
• Chinese revenues were up 27% on the pcp (up 18% in cc terms)
4 YEAR iTrack USA REVENUE ($m)

F I R S T H A L F F Y 1 9 I N V E S T O R P R E S E N T A T I O N15
Detailed Ellex iTrack USA Update• New account set up has been strong, without significant headcount expansion creating greater efficiencies and lower cost
• Increase in new orders of 23% versus pcp, while new order/reorder mix was stable versus the 2HFY18 – reorders expected to
improve in 2HFY19 given 32% increase in 1HFY19 new A/Cs versus pcp
• Significant runway of opportunity remains: 1HFY19 Accounts imply ASC penetration rate of ~13%, user penetration of ~5%
• Planned CAPEX for Stage 3 production expansion to >100,000 units per annum delayed, as internal capacity exceeds 50,000
units, implying <25% utilisation at FY18 unit production volume
iTrack USA REVENUE MIX (US$m)
128144
174
221
265
327
0 4 10 16 18 21
0.0
5.0
10.0
15.0
20.0
25.0
30.0
35.0
40.0
0
50
100
150
200
250
300
350
FY16 1HFY17 FY17 1HFY18 FY18 1HFY19
Accounts Field Sales (n) Account/Person (RHS)
11 1316
30
4744
62
0 0
4
10
16 1821
0.0
0.5
1.0
1.5
2.0
2.5
3.0
3.5
4.0
4.5
0
10
20
30
40
50
60
70
1HFY16 2HFY16 1HFY17 2HFY17 1HFY18 2HFY18 1HFY19
New Accounts Field sales (n) New Acc./Person (RHS)
Ellex iTrack ACCOUNT GROWTH & SALES EFFICIENCY
1.2 1.4 1.41.8 2.0
2.52.90.09
0.10 0.130.21
0.48
0.30
0.37
0
0.5
1
1.5
2
2.5
3
3.5
1HFY16 2HFY16 1HFY17 2HFY17 1HFY18 2HFY18 1HFY19
Reorder New Order
* Field sales includes territory sales representatives and clinical trainers

F I R S T H A L F F Y 1 9 I N V E S T O R P R E S E N T A T I O N16
Lasers & Ultrasound

1HFY19 Financial Results – Lasers & Ultrasound
F I R S T H A L F F Y 1 9 I N V E S T O R P R E S E N T A T I O N17
• Lasers and ultrasound revenue up 4% to $33.9m (up 2% in constant
currency terms), gross margin up 620 bps to 58.9%
• Sales focus on higher margin products, particularly in the US and Japan
• Segment EBITDA surged 53% to $5.9m
• Combination of cost base leverage, product mix effects and favourable FX effects
• Flat OPEX ($1m in OPEX reduction in cc terms)
• Glaucoma SLT laser sales were up 21% to $16.8m (up 18% in cc)
• Concerted marketing effort, growth in combined SLT/vitreous opacity laser (Tango Reflex™)
• Shift away from pharmaceutical (eyedrop) interventions to SLT as a first-line standard of care
• Retina disease lasers were up 5% to $7.8m
• Doctor acceptance of Ellex retina lasers as best in class devices
• Partially offset by shift to pharmaceutical interventions
• Cataract and vitreous opacities lasers down 11% to $7.0m
• Pricing pressures from conventional photodisruptors
• Purchasing decision delays in Europe
• Diagnostic ultrasound down 32% to $2.4m
• Delayed customer orders as awaiting for new product launch
• Two product introductions planned 2HFY19
LASERS & ULTRASOUND REVENUE BY DISEASE ($m) LASERS & ULTRASOUND EBITDA ($m)
3.9
5.9
1.0
2.0
3.0
4.0
5.0
6.0
7.0
Lasers & Ultrasound
1HFY18 1HFY19
3 Year Revenue CAGR of 3%
13.9
7.97.4
3.6
16.8
7.07.8
2.4
0
2
4
6
8
10
12
14
16
18
Glaucoma Laser Cataracts &VitreousOpacities
Retina Disease DiagnosticUltrasound
1H18 1H19

F I R S T H A L F F Y 1 9 I N V E S T O R P R E S E N T A T I O N18
Ellex 2RT® for Intermediate AMD

1H19 Financial Results – 2RT
F I R S T H A L F F Y 1 9 I N V E S T O R P R E S E N T A T I O N19
• 532% increase in revenue to $1.2m
• Gross margin declined 300 bps to 57% versus pcp as
unit sales mix initially skewed to distributor markets
• Segment EBITDA loss decreased $0.2m, despite
significant sales & marketing post LEAD results
• >80% 1H19 sales in 2Q19, post LEAD results
• EU sales driven by iAMD1 indication post LEAD
• First sale recorded in the USA2
• Purchase price & per procedure fee stable
• Procedural fee revenue +100% to $0.2m versus pcp
ELLEX 2RT EBITDA ($m)
-0.4
-0.2
-0.5
-0.4
-0.3
-0.2
-0.1
0.0
1HFY18 1HFY19
ELLEX 2RT REVENUE ($m)
0.2
1.25
0.0
0.5
1.0
1.5
1HFY18 1HFY19
1 intermediate Age-Related Macular Degeneration; 2 2RT has a 510(k) clearance by the FDA for clinically significant macular edema (CSME)

LEAD
2RT Update on Initiatives• Focus on the education and marketing of the LEAD clinical study results (Sept) showing a clinically
meaningful 77% reduction in the progression rate to late AMD in 76% of patients in the study
• Sales and marketing campaign across EURETINA and AAO* with 30,000 clinicians + associates in
attendance – generated a number of future sales prospects
• LEAD was the first ever study to show a significant efficacy effect in an iAMD population
• Currently establishing two important reference sites: Stanford University (Byers Eye Institute) for
CSME and a second site in Germany
• On track to establish US regulatory pathway for 2RT in iAMD with the FDA during CY19
• Commenced pre-submission dialogue with the FDA
• Ellex notes recent FDA acceptance of novel registrable primary endpoints in advanced ‘dry AMD’ unrelated to visual acuity and measured by imaging assessment in 2x Phase 3 pivotal studies (Apellis Pharmaceuticals; NASDAQ:APLS)
F I R S T H A L F F Y 1 9 I N V E S T O R P R E S E N T A T I O N20
*AAO – American Academy of Ophthalmology
^ SOC – Standard of Care
TIMELINE STRATEGY ACHIEVED?
Short Increase EU, AU and NZ footprint Yes (+531% sales post LEAD)
Medium Secure pathway from FDA for registration Pending – 2019
Long FDA clearance & SOC^ therapy in iAMD 2020 & beyond

Outlook
Ellex reaffirms it remains on track to grow group sales and deliver an improved EBITDA
result in FY19 subject to global economic conditions and foreign exchange rates
• While Ellex iTrack and 2RT performed strongly for the 1H, there was an unexpected slow down in
equipment sales in the US and EMEA in the 2QFY19, which saw group revenue growth moderate for the
1H v AGM update on sales through October
• Ellex iTrack will continue its trajectory of growth in FY19, with EBITDA now expected to be similar to FY18
levels
• Ellex Laser & Ultrasound segment FY19 EBITDA growth on FY18, due to continued clinical adoption of
Ellex Tango™ / Ellex Tango Reflex™ in glaucoma disease and diligent cost management
• Momentum in Ellex 2RT sales observed in 1HFY19 expected to continue into FY19, albeit off a low base
F I R S T H A L F F Y 1 9 I N V E S T O R P R E S E N T A T I O N21

Contacts
F I R S T H A L F F Y 1 9 I N V E S T O R P R E S E N T A T I O N22
TOM SPURLING MARIA MAIELI DR. TOM DUTHY JULIA MAGUIRE
CEO CFO & Investor Relations & Media Relations
Company Secretary Corporate Development The Capital Network
M (AUS) : +61 417 818 658 W: +61 8 7074 8200 M: +61 402 493 727 M: +61 419 815 386
E: [email protected] E: [email protected] E: [email protected] [email protected]
For more information visit www.ellex.com
M (USA) : +1 510 504 1267

QUESTIONS/DISCUSSION
F I R S T H A L F F Y 1 9 I N V E S T O R P R E S E N T A T I O N23

Appendices
F I R S T H A L F F Y 1 9 I N V E S T O R P R E S E N T A T I O N24

Average FX Rates
F I R S T H A L F F Y 1 9 I N V E S T O R P R E S E N T A T I O N25
Average FX
1HFY18 1HFY19
AUD:USD 0.78 0.725
AUD:EUR 0.66 0.62
AUD:YEN 87.2 81.4

1HFY19 EBITDA by Segment
F I R S T H A L F F Y 1 9 I N V E S T O R P R E S E N T A T I O N26
(1) In accordance with reporting in previous years this ratio is highlighted as a proxy for gross margin as it does not include cost of production labour which is shown in employee benefits
A$’000’s
CLU iTrack 2RT Corporate Total
Revenue 33,912 6,468 1,250 - 41,630
Other Income - - - 250 250
Changes in inventories of finished goods and work in progress 1,252 125 (19) - 1,358
Raw materials and consumables used (15,189) (1,318) (523) - (17,030)
19,975 5,275 708 250 26,208
Gross margin related %(1) 59% 82% 57%
Employee benefits expense (9,260) (5,713) (156) (1,605) (16,734)
Facilities expense (359) (250) (13) (569) (1,191)
Legal expenses - - - (51) (51)
Advertising, marketing and congress expense (2,181) (1,150) (374) - (3,705)
Product development raw materials and consumables used (687) - (25) - (712)
Realised foreign exchange (loss)/gain 465 (15) 19 - 469
Other expenses (2,025) (2,152) (371) (582) (5,130)
EBITDA 5,928 (4,005) (212) (2,557) (846)

1HFY18 EBITDA by Segment
F I R S T H A L F F Y 1 9 I N V E S T O R P R E S E N T A T I O N27
(1) In accordance with reporting in previous years this ratio is highlighted as a proxy for gross margin as it does not include cost of production labour which is shown in employee benefits
A$’000’s
CLU iTrack 2RT Corporate Total
Revenue 32,685 5,221 197 - 38,103
Other Income - - - 143 143
Changes in inventories of finished goods and work in progress (1,328) 473 (70) - (925)
Raw materials and consumables used (14,103) (1,892) (9) - (16,004)
17,254 3,802 118 143 21,317
Gross margin related %(1) 53% 73% 60%
Employee benefits expense (9,250) (3,411) (55) (963) (13,679)
Facilities expense (380) (152) (6) (548) (1,086)
Legal expenses - - - (84) (84)
Advertising, marketing and congress expense (1,474) (749) (261) - (2,484)
Product development raw materials and consumables used (449) - (3) - (452)
Realised foreign exchange (loss)/gain (227) 7 (1) - (221)
Other expenses (1,597) (1,685) (206) (779) (4,267)
EBITDA 3,877 (2,188) (414) (2,231) (956)

iTrack 1H/2H unit sales
F I R S T H A L F F Y 1 9 I N V E S T O R P R E S E N T A T I O N28
1,368 1,316 1,587 1,835 1,8422,505
3,014 3,378 3,8261,333 1,882 1,344
2,154 2,086
2,057
2,3222,373
2,039
400
765
700850 1,003
0
1000
2000
3000
4000
5000
6000
7000
8000
1HFY15 2HFY15 1HFY16 2HFY16 1HFY17 2HFY17 1HFY18 2HFY18 1HFY19
USA OUS China
1HFY15 2HFY15 1HFY16 2HFY16 1HFY17 2HFY17 1HFY18 2HFY18 1HFY19
TOTAL Units 2,701 3,198 2,931 3,989 4,328 5,327 6,036 6,601 6,868
growth % (pcp) 9% 25% 48% 34% 39% 24% 14%
growth % (HoH) 18% -8% 36% 8% 23% 13% 9% 4%


![Metodos Bayesianos para Procesamiento de Imageneshorebeek/epe/jlm.pdf · Imágenes Sistemas de partículas V 0 (f r, g r) V 1 (f r, f s) r s q f q g q. r s λ [f(r)-f(s)]2 f(q) q](https://img.pdfslide.net/doc/110x75/5ba1c46809d3f2b66a8cef6f/metodos-bayesianos-para-procesamiento-de-imagenes-horebeekepejlmpdf-imagenes.jpg)


![R G O PN O R F K Q O R F G L O G O N O ] T F R O N ^ F R S](https://img.pdfslide.net/doc/110x75/617aae25fb20c8678c4c479e/r-g-o-pn-o-r-f-k-q-o-r-f-g-l-o-g-o-n-o-t-f-r-o-n-f-r-s-.jpg)
