Embed Size (px)
Citation preview
Yao et al. Biotechnol Biofuels (2016) 9:175 DOI 10.1186/s13068-016-0591-1
RESEARCH
Elucidation of the co-metabolism of glycerol and glucose in Escherichia coli by genetic engineering, transcription profiling, and 13C metabolic flux analysisRuilian Yao1, Dewang Xiong1, Hongbo Hu1, Masataka Wakayama2, Wenjuan Yu3, Xuehong Zhang1* and Kazuyuki Shimizu2*
Abstract
Background: Glycerol, a byproduct of biodiesel, has become a readily available and inexpensive carbon source for the production of high-value products. However, the main drawback of glycerol utilization is the low consumption rate and shortage of NADPH formation, which may limit the production of NADPH-requiring products. To overcome these problems, we constructed a carbon catabolite repression-negative ΔptsGglpK* mutant by both blocking a key glucose PTS transporter and enhancing the glycerol conversion. The mutant can recover normal growth by co-utiliza-tion of glycerol and glucose after loss of glucose PTS transporter. To reveal the metabolic potential of the ΔptsGglpK* mutant, this study examined the flux distributions and regulation of the co-metabolism of glycerol and glucose in the mutant.
Results: By labeling experiments using [1,3-13C]glycerol and [1-13C]glucose, 13C metabolic flux analysis was employed to decipher the metabolisms of both the wild-type strain and the ΔptsGglpK* mutant in chemostat cultures. When cells were maintained at a low dilution rate (0.1 h−1), the two strains showed similar fluxome profiles. When the dilution rate was increased, both strains upgraded their pentose phosphate pathway, glycolysis and ana-plerotic reactions, while the ΔptsGglpK* mutant was able to catabolize much more glycerol than glucose (more than tenfold higher). Compared with the wild-type strain, the mutant repressed its flux through the TCA cycle, resulting in higher acetate overflow. The regulation of fluxomes was consistent with transcriptional profiling of several key genes relevant to the TCA cycle and transhydrogenase, namely gltA, icdA, sdhA and pntA. In addition, cofactor fluxes and their pool sizes were determined. The ΔptsGglpK* mutant affected the redox NADPH/NADH state and reduced the ATP level. Redox signaling activated the ArcA regulatory system, which was responsible for TCA cycle repression.
Conclusions: This work employs both 13C-MFA and transcription/metabolite analysis for quantitative investigation of the co-metabolism of glycerol and glucose in the ΔptsGglpK* mutant. The ArcA regulatory system dominates the control of flux redistribution. The ΔptsGglpK* mutant can be used as a platform for microbial cell factories for the pro-duction of biofuels and biochemicals, since most of fuel molecule (e.g., alcohols) synthesis requires excess reducing equivalents.
Keywords: Glycerol, 13C metabolic flux analysis, Carbon catabolite repression, Cofactor, PTS, Transcriptional regulation
© 2016 The Author(s). This article is distributed under the terms of the Creative Commons Attribution 4.0 International License (http://creativecommons.org/licenses/by/4.0/), which permits unrestricted use, distribution, and reproduction in any medium, provided you give appropriate credit to the original author(s) and the source, provide a link to the Creative Commons license, and indicate if changes were made. The Creative Commons Public Domain Dedication waiver (http://creativecommons.org/publicdomain/zero/1.0/) applies to the data made available in this article, unless otherwise stated.
Open Access
Biotechnology for Biofuels
*Correspondence: [email protected]; [email protected] 1 State Key Laboratory of Microbial Metabolism and School of Life Sciences and Biotechnology, Shanghai Jiao Tong University, 800 Dongchuan Road, Shanghai 200240, China2 Institute for Advanced Biosciences, Keio University, 246-2, Mizukami, Kakuganji, Tsuruoka, Yamagata 997-0052, JapanFull list of author information is available at the end of the article

Page 2 of 14Yao et al. Biotechnol Biofuels (2016) 9:175
BackgroundWith increasing production of biodiesel, a large amount of glycerol is produced as an inevitable byproduct [1]. Significant glycerol surplus has led to a drastic decrease in glycerol prices over the past few years, which makes it an ideal feedstock for the production of high-value products [1–3]. The main drawback of glycerol utiliza-tion in Escherichia coli is the relatively low carbon source consumption rate, cell growth, and productivity [4]. The main reason for this is the allosteric inhibition of the rate-limiting GLPK by FBP and EIIAGlc under aerobic conditions [5–8]. FBP and EIIAGlc both act to reduce vmax of GLPK, which displays a dimer–tetramer equilibrium in solution [6]. FBP acts both to promote dimer–tetramer assembly and to inactivate the tetramers [7]. The crystal structure of the EIIAGlc:GLPK complexes has been deter-mined [8]. GLPK with bound glycerol and ADP forms tetramers in which each GLPK subunit interacts with one EIIAGlc molecule, and the association of the two proteins forms a novel intermolecular binding site for Zn (II) [9]. Genetic modification of the glpK gene has resulted in the change in this enzyme that is insensitive to FBP and EIIAGlc, allowing improved the glycerol consumption rate [10, 11]. Another obstacle to glycerol utilization is the shortage of NADPH formation because minimal glyco-lytic flux is reverted from GAP upwards to the oxidative pentose phosphate (PP) pathway. Because NADPH is an important cofactor needed for the production of useful metabolites, co-fermentation of glycerol with glucose has been proposed as an efficient process [4, 12, 13], espe-cially for promoting 1,3-propanediol fermentation for the industrial scale production by DuPont [14]. However, glucose utilization prevents the metabolism of glycerol because of carbon catabolite repression (CCR) [15].
The central players in CCR in E. coli are the transcrip-tional activator Crp, cAMP receptor protein, the signal metabolite cAMP, Cya, and the phosphorylation sys-tem (PTS); these systems are involved in transport and/or phosphotransferase reactions of carbohydrates [15]. The PTS in E. coli consists of two common cytoplasmic proteins, EI, encoded by ptsI, and HPr, encoded by ptsH, as well as carbohydrate-specific EII complexes encoded by crr and ptsG [16]. One metabolic engineering strat-egy to relax CCR is the inactivation of PTS genes [13, 17, 18]. The part PEP not consumed in glucose transport was canalized to shikimate pathway [17], which is a very important route for the synthesis of aromatic amino acids and natural products [19]. Therefore, we constructed a CCR-negative ΔptsGglpK* mutant by both blocking a key glucose transporter gene ptsG and replacing the native glpK with glpK22 from E. coli Lin 43 to enhance the glyc-erol conversion [12]. This mutant can co-consume glyc-erol and glucose with a faster glycerol assimilation rate
than glucose assimilation rate [12]. To reveal the meta-bolic potential of the ΔptsGglpK* mutant, it is necessary to understand its flux distributions and regulation of the co-metabolism of glycerol and glucose in the mutant.
The fluxome is the final functional output of cell metabolism, and is controlled by genetic regulation, enzyme capability, substrate availability, natural allostery, and metabolic network structures [20, 21]. 13C metabolic flux analysis (13C-MFA) can accurately determine the fluxes in a metabolic network, which is the most inform-ative tool in quantifying the cellular carbon and energy metabolism and is useful in identifying rate-controlling enzymes [21–23]. ATP and its products ADP/AMP are key regulatory molecules that control enzyme activities in central metabolisms. The limitation of ATP prevents the host from achieving high carbon yields and metabo-lite production rates. 13C-MFA can profile carbon fluxes through most energy generation/consumption pathways, which is the only tool to quantify this problem [24]. Vari-ous studies have been reported elucidating 13C-MFA using single-labeled substrate, while a limited number of investigations have been reported performing labeling experiments using multiple isotopic tracers [25, 26]. For instance, the tracer mixture, [1,2-13C]glucose and [U-13C]glutamine led to flux estimates of superior quality in both glycolysis and the TCA cycle in mammalian cells [25].
This study investigated the co-metabolism of glyc-erol and glucose in E. coli, and elucidated the metabolic potential of the ΔptsGglpK* mutant as a chassis for bio-synthesis from cheap feedstock. 13C-MFA provided rig-orous comparison of cell fluxomes between the wild-type and the mutant strain using well-controlled chemostat cultures: (1) various growth rates could be realized by changing the dilution rate; and (2) cell metabolism could be maintained in a metabolic steady-state during labeling experiment [27, 28]. To complement the fluxome studies, we also examined the transcriptional levels of key genes and intracellular pyridine nucleotide pools.
ResultsFermentation characteristics of the wild type and the ΔptsGglpK* mutantFigure 1 shows the batch fermentation characteristics of the wild-type E. coli (BW25113) and the ΔptsGglpK* mutant. The wild-type strain consumed glucose and glycerol sequentially owing to CCR (Fig. 1a), while the ΔptsGglpK* mutant co-metabolized both glucose and glycerol with faster glycerol consumption than glucose consumption (Fig. 1b; Additional file 1a). By modulat-ing GLPK and the deletion of ptsG, the specific glycerol consumption rate in the ΔptsGglpK* mutant was 2.7-fold higher than that in the wild-type strain. To under-stand the co-metabolism of glycerol and glucose in the

Page 3 of 14Yao et al. Biotechnol Biofuels (2016) 9:175
ΔptsGglpK* mutant, a detailed analysis was performed in continuous cultures.
Table 1 summarizes the fermentation characteristics of the two strains in the continuous cultures at dilution rates of 0.1 and 0.35 h−1. The two strains showed simi-lar fermentation characteristics at the dilution rate of 0.1 h−1 in terms of the specific glucose consumption rate, the specific glycerol consumption rate, and biomass con-centration without acetate formation. The fermentation characteristics were quite different at the dilution rate of 0.35 h−1. In the wild type, more glucose was catabolized than glycerol. The specific glucose consumption rate was 7.2 times higher than that at the lower dilution rate, while the specific glycerol consumption was decreased
slightly. In the ΔptsGglpK* mutant, more glycerol was catabolized than glucose (more than tenfold higher). The specific glycerol consumption rate was more than sev-enfold higher at the higher dilution rate compared with that at the lower dilution rate, while the specific glucose consumption rate was similar. The biomass concentra-tion was reduced and acetate overflow was significant in both strains at the higher dilution rate. At the dilution rate of 0.35 h−1, the specific glucose consumption rate was decreased by 84.7 %, the specific glycerol consump-tion rate was increased 8.0-fold, and the specific acetate formation rate was increased 1.3-fold in the ΔptsGglpK* mutant compared with the wild type.
Metabolic flux analysisFigure 2 shows the metabolic flux distributions in chem-ostat cultures of the wild-type strain and the ΔptsGglpK* mutant grown on [1,3-13C]glycerol and [1-13C]glucose. In the present study, [1-13C]glucose was used to identify the flux ratio between the PP pathway and glycolysis at the G6P node, while [1,3-13C]glycerol was used to dis-criminate the labeling patterns originating from labeled glucose. The measured mass isotopomer distribution (MDV) of proteinogenic amino acids and the simulated MDV coincided well (Additional file 2), indicating a good fit and high flux precision. The exchange coefficients are listed in Additional file 3. The flux patterns resemble those of glucose-feeding for the upper part of glycolysis and the PP pathway, and those of both glucose and glyc-erol co-feeding for the other parts of central metabolism.
First, we compared flux distributions for the two strains at the dilution rate of 0.1 h−1. The fluxes were the similar, consistent with the fermentation characteristics. Second, we compared the effects of the dilution rate on the flux distributions of the two strains. In the wild type, as the dilution rate was increased, the absolute fluxes through the PP pathway, glycolytic pathway, anaplerotic pathway and the TCA cycle significantly increased, while the flux through the glyoxylate shunt became negligible. However, the relative distribution of the flux through the TCA cycle decreased from 83 to 47 % (normalized by the substrate consumption rate), while the flux into acetate formation
0 2 4 6 8 10 12 14 160
1
2
3
a
Con
cent
ratio
n (g
/L)
Time (h)
b
0 2 4 6 8 10 12 14 160
1
2
3BiomassGlucoseGlycerolAcetate
Con
cent
ratio
n (g
/L)
Time (h)
Fig. 1 Batch fermentation characteristics of E. coli BW25113 (a) and the ΔptsGglpK* mutant (b). Data represent the mean ± SD from three independent cultures
Table 1 Continuous fermentation characteristics of E. coli BW25113 and the ∆ptsGglpK* mutant
Data represent the mean ± SD from three independent cultures
Strain Dilution rate (h−1)
Specific glucose consumption rate (mmol/g/h)
Specific glycerol consumption rate (mmol/g/h)
Specific acetate formation rate (mmol/g/h)
Biomass (g/L)
Wild type 0.1 1.03 ± 0.05 2.01 ± 0.10 0 1.08 ± 0.05
∆ptsGglpK* 0.1 0.96 ± 0.04 1.87 ± 0.09 0 1.15 ± 0.05
Wild type 0.35 7.43 ± 0.37 1.72 ± 0.08 6.97 ± 0.35 0.52 ± 0.02
∆ptsGglpK* 0.35 1.14 ± 0.05 13.90 ± 0.62 9.13 ± 0.43 0.46 ± 0.01

Page 4 of 14Yao et al. Biotechnol Biofuels (2016) 9:175
increased. In the ΔptsGglpK* mutant, the absolute fluxes through the PP pathway, glycolytic pathway, and ana-plerotic pathway were also enhanced, while the absolute flux through the TCA cycle was 17 % lower than that at the dilution rate of 0.1 h−1. The relative flux distribution through the TCA cycle significantly decreased, from 79 to 12 %, while the flux into acetate formation increased. Last, we compared the flux distributions for the two
strains at the dilution rate of 0.35 h−1. Striking differences were seen between the two strains: in the ΔptsGglpK* mutant as compared with the wild-type strain: (1) the flux through phosphoglucose isomerase decreased by 98.1 %; (2) the flux through GLPDH increased 8.1-fold; (3) the flux through the TCA cycle flux decreased by 57.6 %; and (4) the transhydrogenation flux was reversed, from NADPH → NADH to NADH → NADPH.
F6P
FBP
GAP
3PG
PEP
6PG
X5PE4P
S7P
R5P
PYR
AcCoA
Glucose
GAP
DHAP
Acetate
G6P
a E. coli BW25113
1.03
6.31 ± 0.04
0.51 ± 0.03
0.28 ± 0.02
0.51 ± 0.03
0.16 ± 0.01
0.16 ± 0.01
0.78 ± 0.01
3.69 ± 0.012.80 ± 0.01
3.52 ± 0.01
2.34 ± 0.05 0.06 ± 0.05
3.08 ± 0.04
0
2.52 ± 0.01
0.06 ± 0.05
7.43
0.51 ± 0.03
1.06 ± 0.04 1.06 ± 0.04
0.33 ± 0.01
0.33 ± 0.01
6.80 ± 0.01
0.78 ± 0.01 6.80 ± 0.01
8.52 ± 0.0115.47 ± 0.01
14.89 ± 0.01
1.81 ± 0.04 5.32 ± 0.04
12.17 ± 0.02
6.97 ± 0.35
0.65 ± 0.04
4.34 ± 0.02
0.51 ± 0.02
0.22 ± 0.010.55 ± 0.01
0.12 ± 0.010.18 ± 0.01
Gly3P
2.011.72
1.72 ± 0.012.01 ± 0.01
ICIT
AKG
SUCCoASUC
FUM
OAA CIT
MAL GLX
2.52 ± 0.014.34 ± 0.02
2.19 ± 0.054.34 ± 0.02
2.04 ± 0.053.80 ± 0.02
2.04 ± 0.053.80 ± 0.02
2.04 ± 0.053.80 ± 0.02
2.36 ± 0.013.80 ± 0.02
0.33 ± 0.040
2.63 ± 0.053.15 ± 0.05
RU5P
NADHNADPH
1.45 ± 0.06 0.47 ± 0.08
Glycerol
F6P
FBP
GAP
3PG
PEP
6PG
X5PE4P
S7P
R5P
PYR
AcCoA
Glucose
GAP
DHAP
Acetate
G6P
b E. coli ΔptsGglpK*
0.96
0.12 ± 0.03
0.46 ± 0.02
0.25 ± 0.02
0.46 ± 0.02
0.15 ± 0.01
0.15 ± 0.01
0.73 ± 0.02
3.42 ± 0.012.59 ± 0.01
3.25 ± 0.01
2.99 ± 0.04 0.16 ± 0.04
2.67 ± 0.01
0
2.23 ± 0.01
0.03 ± 0.03
1.14
0.48 ± 0.02
0.97 ± 0.03 0.97 ± 0.03
0.30 ± 0.01
0.30 ± 0.01
0.54 ± 0.01
0.73 ± 0.01 0.54 ± 0.01
14.44 ± 0.0115.10 ± 0.01
14.52 ± 0.01
1.65 ± 0.06 12.55 ± 0.06
11.82 ± 0.01
9.13 ± 0.43
0.49 ± 0.06
1.84 ± 0.01
0.45 ± 0.02
0.21 ± 0.010.51 ± 0.01
0.10 ± 0.010.15 ± 0.01
Gly3P
1.8713.90
1.87 ± 0.0113.90 ± 0.01
ICIT
AKG
SUCCoASUC
FUM
OAA CIT
MAL GLX
2.23 ± 0.011.84 ± 0.01
2.04 ± 0.011.84 ± 0.01
1.88 ± 0.051.30 ± 0.01
1.88 ± 0.051.30 ± 0.01
2.07 ± 0.011.30 ± 0.01
2.07 ± 0.011.30 ± 0.01
0.19 ± 0.010
2.24 ± 0.040.81 ± 0.06
RU5P
Glycerol
NADHNADPH
1.17 ± 0.04 -2.06 ± 0.05
Glycolytic pathway PP pathway TCA cycle/glyoxylate shunt Transhydrogenation reaction Anaplerotic pathway
Fig. 2 Metabolic flux distributions of E. coli BW25113 (a) and the ΔptsGglpK* mutant (b). Fluxes shown are absolute values (mmol/g/h) (flux ± SD). Numbers represent the fluxes at dilution rates of 0.1 (top) and 0.35 h−1 (bottom)

Page 5 of 14Yao et al. Biotechnol Biofuels (2016) 9:175
Intracellular pyridine nucleotide and ATP poolsThe cofactors such as NADH, FADH2 and NADPH play important roles in regulating redox relevant reactions. NADH/FADH2 are involved in ATP generation of oxida-tive phosphorylation [29], while the NADPH is essential for anabolism [30]. Table 2 compares the intracellular pyridine nucleotide and ATP pools of the two strains in two chemostat cultures. At the dilution rate of 0.1 h−1, the two strains had the similar intracellular pyridine nucleotide and ATP pools. When the dilution rate was increased, the NADPH and NADP+ levels increased (P < 0.01 for both) without affecting the NADPH/NADP+ ratio in the wild-type strain. In addition, the NADH and NAD+ pools and the NADH/NAD+ ratio increased (P < 0.01 for all) in this strain. In the ΔptsGglpK* mutant, the NADPH level and the NADPH/NADP+ ratio decreased (P < 0.01 for both), while the concentrations of NADH and NAD+ and the NADH/NAD+ ratio increased (P < 0.01 for all) with the increasing dilution rate. The concentrations of ATP increased at the dilution rate of 0.35 h−1 compared with 0.1 h−1 in both strains (P < 0.01 for both). Compared with the wild-type strain at the dilution rate of 0.35 h−1, the NADPH, NADP+, NAD+ and ATP concentrations and the NADPH/NADP+ ratio were lower (P < 0.01 for all), and the NADH level and the NADH/NAD+ ratio were higher (P < 0.1 and P < 0.01) in the ΔptsGglpK* mutant at the same dilution rate. The decreased NADPH/NADP+ and increased NADH/NAD+ ratios indicated the alteration of the cellular redox state in the ΔptsGglpK* mutant.
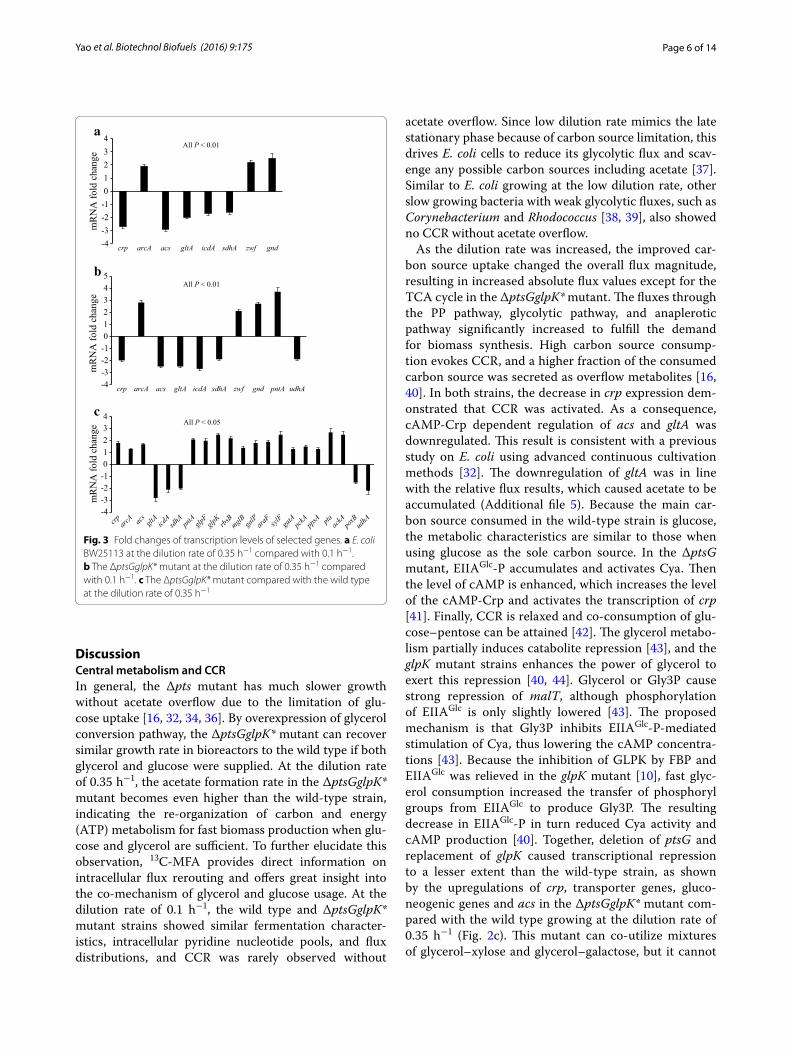
Relative gene transcription levelsFigure 3 shows the gene expression data measured by qRT-PCR. In the wild-type strain, the transcrip-tion level of the global regulator gene crp was down-regulated, while arcA was upregulated, at the dilution rate of 0.35 h−1 as compared with 0.1 h−1. Crp induces expression of its target genes, which include transport-ers and other genes in the TCA cycle, gluconeogenesis and acetate utilization pathway, upon allosteric acti-vation through high cAMP concentrations [31, 32]. ArcA represses many genes involved in the TCA cycle and electron transport [33]. In accordance with the
repression of crp, the transcription level of the acetate utilization pathway gene acs was downregulated (Addi-tional file 4). In accordance with the repression of crp and the activation of arcA, the transcription levels of gltA, icdA and sdhA in the TCA cycle were downregu-lated (Additional file 4). The transcription levels of zwf and gnd in the oxidative PP pathway were upregu-lated. In the ΔptsGglpK* mutant, the changing patterns of these genes were similar to what was observed for the wild-type strain with the increasing dilution rate (Fig. 3b). In addition, pntA showed a higher expression level while udhA showed a lower expression level com-pared with 0.1 h−1, implying that excess NADH may be converted to NADPH through the transhydrogenase reaction. Figure 3c compares gene expression levels in the ΔptsGglpK* mutant with the wild-type strain at the dilution rate of 0.35 h−1. The transcription levels of global regulator genes crp and arcA were upregulated. In accordance with the increase in crp expression, the tran-scription levels of transporter genes glpFK (glycerol), rbsB (ribose), mglB/galP (galactose), araF (arabinose), xylF (xylose), and gatA (galactitol), gluconeogenic genes pckA and ppsA, and acetate utilization pathway gene acs were upregulated (Additional file 4). In the E. coli PTS− strains, glucose was probably transported through GalP and MglBAC systems [34]. The upregulation of glpFK correlates to the increased glycerol consumption rate in the mutant. The overexpression of glpFK was also observed in the strain JM101 grown on glycerol as com-pared to glucose [35]. Compared with the wild type at the dilution rate of 0.35 h−1, the transcription levels of gltA, icdA, sdhA and udhA were downregulated, while the transcription level of pntA was upregulated in the mutant at the same dilution rate. The repression of the TCA cycle was higher in the ΔptsGglpK* mutant than the wild-type strain at the dilution rate of 0.35 h−1, indi-cating that the repression by ArcA was more than the activation by Crp. Compared with the wild type at the dilution rate of 0.35 h−1, the transcription levels of pta and ackA were upregulated, while poxB was downregu-lated in the ΔptsGglpK* mutant at the same dilution rate. This indicates that acetate is mainly synthesized by phos-photransacetylase/acetate kinase pathway in the mutant.
Table 2 Comparison of pyridine nucleotide and ATP pools of E. coli BW25113 and the ΔptsGglpK* mutant
Strain Dilution rate (h−1)
NADPH (nmol/mg)
NADP+ (nmol/mg)
NADPH/NADP+
NADH (nmol/mg)
NAD+ (nmol/mg)
NADH/NAD+ ATP (nmol/mg)
Wild type 0.1 0.59 ± 0.03 0.45 ± 0.02 1.33 ± 0.09 0.43 ± 0.02 1.33 ± 0.06 0.32 ± 0.02 1193 ± 130
∆ptsGglpK* 0.1 0.59 ± 0.02 0.45 ± 0.01 1.33 ± 0.07 0.43 ± 0.02 1.38 ± 0.07 0.31 ± 0.02 953 ± 131
Wild type 0.35 0.77 ± 0.04 0.67 ± 0.03 1.16 ± 0.08 1.39 ± 0.06 2.76 ± 0.13 0.50 ± 0.03 11,784 ± 583
∆ptsGglpK* 0.35 0.35 ± 0.03 0.43 ± 0.02 0.80 ± 0.06 1.52 ± 0.07 2.17 ± 0.10 0.70 ± 0.05 2378 ± 213
Page 6 of 14Yao et al. Biotechnol Biofuels (2016) 9:175
DiscussionCentral metabolism and CCRIn general, the Δpts mutant has much slower growth without acetate overflow due to the limitation of glu-cose uptake [16, 32, 34, 36]. By overexpression of glycerol conversion pathway, the ΔptsGglpK* mutant can recover similar growth rate in bioreactors to the wild type if both glycerol and glucose were supplied. At the dilution rate of 0.35 h−1, the acetate formation rate in the ΔptsGglpK* mutant becomes even higher than the wild-type strain, indicating the re-organization of carbon and energy (ATP) metabolism for fast biomass production when glu-cose and glycerol are sufficient. To further elucidate this observation, 13C-MFA provides direct information on intracellular flux rerouting and offers great insight into the co-mechanism of glycerol and glucose usage. At the dilution rate of 0.1 h−1, the wild type and ΔptsGglpK* mutant strains showed similar fermentation character-istics, intracellular pyridine nucleotide pools, and flux distributions, and CCR was rarely observed without
acetate overflow. Since low dilution rate mimics the late stationary phase because of carbon source limitation, this drives E. coli cells to reduce its glycolytic flux and scav-enge any possible carbon sources including acetate [37]. Similar to E. coli growing at the low dilution rate, other slow growing bacteria with weak glycolytic fluxes, such as Corynebacterium and Rhodococcus [38, 39], also showed no CCR without acetate overflow.
As the dilution rate was increased, the improved car-bon source uptake changed the overall flux magnitude, resulting in increased absolute flux values except for the TCA cycle in the ΔptsGglpK* mutant. The fluxes through the PP pathway, glycolytic pathway, and anaplerotic pathway significantly increased to fulfill the demand for biomass synthesis. High carbon source consump-tion evokes CCR, and a higher fraction of the consumed carbon source was secreted as overflow metabolites [16, 40]. In both strains, the decrease in crp expression dem-onstrated that CCR was activated. As a consequence, cAMP-Crp dependent regulation of acs and gltA was downregulated. This result is consistent with a previous study on E. coli using advanced continuous cultivation methods [32]. The downregulation of gltA was in line with the relative flux results, which caused acetate to be accumulated (Additional file 5). Because the main car-bon source consumed in the wild-type strain is glucose, the metabolic characteristics are similar to those when using glucose as the sole carbon source. In the ΔptsG mutant, EIIAGlc-P accumulates and activates Cya. Then the level of cAMP is enhanced, which increases the level of the cAMP-Crp and activates the transcription of crp [41]. Finally, CCR is relaxed and co-consumption of glu-cose–pentose can be attained [42]. The glycerol metabo-lism partially induces catabolite repression [43], and the glpK mutant strains enhances the power of glycerol to exert this repression [40, 44]. Glycerol or Gly3P cause strong repression of malT, although phosphorylation of EIIAGlc is only slightly lowered [43]. The proposed mechanism is that Gly3P inhibits EIIAGlc-P-mediated stimulation of Cya, thus lowering the cAMP concentra-tions [43]. Because the inhibition of GLPK by FBP and EIIAGlc was relieved in the glpK mutant [10], fast glyc-erol consumption increased the transfer of phosphoryl groups from EIIAGlc to produce Gly3P. The resulting decrease in EIIAGlc-P in turn reduced Cya activity and cAMP production [40]. Together, deletion of ptsG and replacement of glpK caused transcriptional repression to a lesser extent than the wild-type strain, as shown by the upregulations of crp, transporter genes, gluco-neogenic genes and acs in the ΔptsGglpK* mutant com-pared with the wild type growing at the dilution rate of 0.35 h−1 (Fig. 2c). This mutant can co-utilize mixtures of glycerol–xylose and glycerol–galactose, but it cannot
-4-3-2-101234
crp arcA acs gltA icdA sdhA zwf gnd
mR
NA
fold
cha
nge
aAll P < 0.01
-4-3-2-1012345
crp arcA acs gltA icdA sdhA zwf gnd pntA udhA
mR
NA
fold
cha
nge
bAll P < 0.01
-4-3-2-101234
mR
NA
fold
cha
nge
cAll P < 0.05
Fig. 3 Fold changes of transcription levels of selected genes. a E. coli BW25113 at the dilution rate of 0.35 h−1 compared with 0.1 h−1. b The ΔptsGglpK* mutant at the dilution rate of 0.35 h−1 compared with 0.1 h−1. c The ΔptsGglpK* mutant compared with the wild type at the dilution rate of 0.35 h−1
Page 7 of 14Yao et al. Biotechnol Biofuels (2016) 9:175
co-utilize the mixture of glycerol-acetate (Additional file 1).
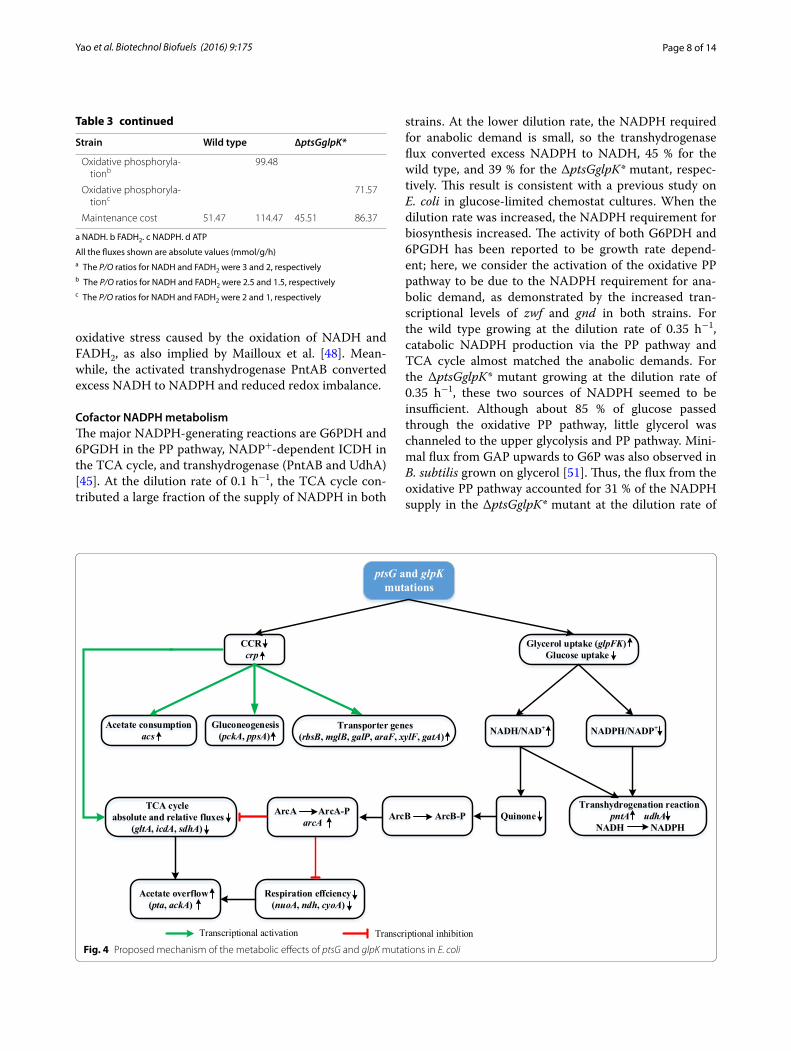
Cofactors NADH and FADH2 metabolismThe cofactors balance can be estimated from the meta-bolic fluxes [45, 46]. Table 3 summarizes the specific rates of the formation and consumption of cofactors derived from the flux data given in Fig. 2. The major pathway enzymes for supplying NADH are GAPDH and PDH in glycolysis, AKGDH and MDH in the TCA cycle, and transhydrogenase (UdhA) [29]. SDH and GLPDH are the main enzymes for the genesis of FADH2 [5, 47]. At the dilution rate of 0.1 h−1, the fluxes from the glycolysis accounted for 51 % of the NADH formation, while those from the TCA cycle accounted for 35 % of the NADH formation in the two strains. When the dilution rate was increased, the glycolytic flux increased, producing a large amount of NADH from the glycolysis in both strains. In the case of the ΔptsGglpK* mutant, FADH2 formation at GLPDH became significant as the glycerol consumption rate increased at the dilution rate of 0.35 h−1 (Table 3). Increased NADH and FADH2, as major donors to the electron transport chain, create a highly oxidative envi-ronment which is detrimental to aerobically growing E. coli cells [48]. NADH allosterically inhibits CS and ICDH [49]. In addition, redox state as a signal activates the ArcA regulatory system. Because the NADH level and the NADH/NAD+ ratio were the highest we observed in the ΔptsGglpK* mutant growing at the dilution rate of 0.35 h−1, the inhibition of the TCA cycle was more severe than in the wild type, as demonstrated by the upregula-tion of arcA and the downregulation of gltA, icdA and sdhA (Fig. 3c). This suggests that ArcA, more than Crp, regulated the expression levels of the TCA cycle genes when glycerol was being consumed as the main carbon source at the higher dilution rate (Fig. 4). In addition, ArcA exerts a negative control on the TCA cycle fluxes in the aerobic batch culture of E. coli, where knockout of ArcA-dependent regulation increased the TCA cycle fluxes by over 60 % [50]. The higher dilution rate mim-ics the cell growth phase in batch culture. Therefore, the relative flux through CS in the TCA cycle decreased in both strains with increasing dilution rate. Furthermore, the absolute flux through the TCA cycle increased in the wild type, but decreased in the ΔptsGglpK* mutant, indi-cating strong repression of the TCA cycle when glycerol was being consumed as the main carbon source at the higher dilution rate. Reduction of the TCA cycle flux lim-ited NADH production: the fluxes from the TCA cycle accounted for 19 and 7 % of the NADH formation in the wild type and ΔptsGglpK* strains at the dilution rate of 0.35 h−1, respectively. Consequently, this reduced the
Table 3 Estimated production and consumption of cofac‑tors and ATP by E. coli BW25113 and the ΔptsGglpK* mutant
Strain Wild type ∆ptsGglpK*
a NADH
Dilution rate (h−1) 0.1 0.35 0.1 0.35
GLPDH 0 0 0 0
Glycolysis 6.77 27.64 6.09 26.90
TCA cycle 4.67 6.95 4.12 1.30
PP pathway 0 0 0 0
Anaplerotic pathway 0.03 0.33 0.02 0.25
Acetate formation 0 0 0 0
Biomass formation 0.33 1.17 0.33 1.17
Transhydrogenation 1.45 0.47 1.17 −2.26
Oxidative phosphorylation −13.25 −36.57 −11.72 −28.18
b FADH2
Dilution rate (h−1) 0.1 0.35 0.1 0.35
GLPDH 2.01 1.72 1.87 13.90
Glycolysis 0 0 0 0
TCA cycle 2.36 3.80 2.07 1.30
PP pathway 0 0 0 0
Anaplerotic pathway 0 0 0 0
Acetate formation 0 0 0 0
Biomass formation 0 0 0 0
Transhydrogenation 0 0 0 0
Oxidative phosphorylation −4.37 −5.52 −3.94 −15.20
c NADPH
Dilution rate (h−1) 0.1 0.35 0.1 0.35
GLPDH 0 0 0 0
Glycolysis 0 0 0 0
TCA cycle 2.19 4.34 2.04 1.84
PP pathway 1.02 2.12 0.92 1.94
Anaplerotic pathway 0.03 0.33 0.02 0.25
Acetate formation 0 0 0 0
Biomass formation −1.80 −6.30 −1.80 −6.30
Transhydrogenation −1.45 −0.47 −1.17 2.26
Oxidative phosphorylation 0 0 0 0
d ATP
Dilution rate (h−1) 0.1 0.35 0.1 0.35
Glucose uptake 0 0 −0.96 −1.14
Glycerol uptake −2.01 −1.72 −1.87 −13.90
GLPDH 0 0 0 0
Glycolysis 5.25 13.99 5.68 27.11
TCA cycle 2.04 3.80 1.88 1.30
PP pathway 0 0 0 0
Anaplerotic pathway 0 0 0 0
Acetate formation 0 6.97 0 9.13
Biomass formation −2.30 −8.05 −2.30 −8.05
Transhydrogenation 0 0 0 0
Oxidative phosphoryla-tiona
48.49 43.08
Page 8 of 14Yao et al. Biotechnol Biofuels (2016) 9:175
oxidative stress caused by the oxidation of NADH and FADH2, as also implied by Mailloux et al. [48]. Mean-while, the activated transhydrogenase PntAB converted excess NADH to NADPH and reduced redox imbalance.
Cofactor NADPH metabolismThe major NADPH-generating reactions are G6PDH and 6PGDH in the PP pathway, NADP+-dependent ICDH in the TCA cycle, and transhydrogenase (PntAB and UdhA) [45]. At the dilution rate of 0.1 h−1, the TCA cycle con-tributed a large fraction of the supply of NADPH in both
strains. At the lower dilution rate, the NADPH required for anabolic demand is small, so the transhydrogenase flux converted excess NADPH to NADH, 45 % for the wild type, and 39 % for the ΔptsGglpK* mutant, respec-tively. This result is consistent with a previous study on E. coli in glucose-limited chemostat cultures. When the dilution rate was increased, the NADPH requirement for biosynthesis increased. The activity of both G6PDH and 6PGDH has been reported to be growth rate depend-ent; here, we consider the activation of the oxidative PP pathway to be due to the NADPH requirement for ana-bolic demand, as demonstrated by the increased tran-scriptional levels of zwf and gnd in both strains. For the wild type growing at the dilution rate of 0.35 h−1, catabolic NADPH production via the PP pathway and TCA cycle almost matched the anabolic demands. For the ΔptsGglpK* mutant growing at the dilution rate of 0.35 h−1, these two sources of NADPH seemed to be insufficient. Although about 85 % of glucose passed through the oxidative PP pathway, little glycerol was channeled to the upper glycolysis and PP pathway. Mini-mal flux from GAP upwards to G6P was also observed in B. subtilis grown on glycerol [51]. Thus, the flux from the oxidative PP pathway accounted for 31 % of the NADPH supply in the ΔptsGglpK* mutant at the dilution rate of
ptsG and glpKmutations
TCA cycleabsolute and relative fluxes
(gltA, icdA, sdhA)
Transhydrogenation reactionpntA udhA
NADH NADPH
CCRcrp
Acetate overflow(pta, ackA)
Acetate consumptionacs
Gluconeogenesis(pckA, ppsA)
Transcriptional activation Transcriptional inhibition
NADH/NAD+ NADPH/NADP+Transporter genes(rbsB, mglB, galP, araF, xylF, gatA)
Glycerol uptake (glpFK)Glucose uptake
QuinoneArcB ArcB-PArcA ArcA-ParcA
Respiration effciency(nuoA, ndh, cyoA)
Fig. 4 Proposed mechanism of the metabolic effects of ptsG and glpK mutations in E. coli
a NADH. b FADH2. c NADPH. d ATP
All the fluxes shown are absolute values (mmol/g/h)a The P/O ratios for NADH and FADH2 were 3 and 2, respectivelyb The P/O ratios for NADH and FADH2 were 2.5 and 1.5, respectivelyc The P/O ratios for NADH and FADH2 were 2 and 1, respectively
Table 3 continued
Strain Wild type ∆ptsGglpK*
Oxidative phosphoryla-tionb
99.48
Oxidative phosphoryla-tionc
71.57
Maintenance cost 51.47 114.47 45.51 86.37
Page 9 of 14Yao et al. Biotechnol Biofuels (2016) 9:175
0.35 h−1. Because of NADH and FADH2 accumulation, the TCA cycle was significantly repressed and accounted for only 29 % of the NADPH supply in the ΔptsGglpK* mutant at the dilution rate of 0.35 h−1. There was about a 36 % gap to be filled to fulfill the demand for NADPH. The transhydrogenation reaction served this purpose, as also noted by Sauer et al. [45]. In line with the flux results, the transcriptional level of pntA was upregulated in the ΔptsGglpK* mutant at the dilution rate of 0.35 h−1 com-pared with the case at 0.1 h−1, as well as to the wild type at the dilution rate of 0.35 h−1. It has also been reported that expression of pntAB was induced when there was a demand for NADPH, and pntAB was required for opti-mal growth on carbon sources whose metabolism does not directly generate NADPH [30].
Energy (ATP) metabolismBased on fluxes, the specific ATP formation and con-sumption rates were estimated in the two strains (Table 3d). E. coli can produce ATP from either oxida-tive phosphorylation or substrate-level phosphoryla-tion such as acetate formation [52]. Since the molar ATP yield from respiration is higher than that from substrate-level phosphorylation, the former is much more efficient than the latter [53]. Since the cells exhibited fully res-piratory growth under carbon source limited state [45], we assumed the maximum P/O ratio to be the moles of ATP formed per oxygen atom: NADH → 3 ATP and FADH2 → 2 ATP at the dilution rate of 0.1 h−1 [54]. Based on this assumption, the ATP formation fluxes via oxidative phosphorylation were about 9 times of that via substrate-level phosphorylation in both strains. As the dilution rate was increased, the respiration efficiency was lowered in both strains (Additional file 6). Holms [55] also showed that excess glucose (or other highly suf-ficient carbon sources) inhibited respiration in E. coli. Thus, we set the P/O ratio to be 2.5 and 1.5 for oxidizing NADH and FADH2 at the dilution rate of 0.35 h−1. Since the expression levels of respiratory chains genes were more repressed in the ΔptsGglpK* mutant as compared to the wild-type strain (Additional file 6), we chose the P/O ratio to be 2 and 1 for oxidizing NADH and FADH2, respectively, in the mutant at the dilution rate of 0.35 h−1. In any case, the exact P/O ratio per se does not affect the main conclusion of the present work. The ATP pro-vided via oxidative phosphorylation in the ΔptsGglpK* mutant was 28 % lower than that in the wild type. In contrast, more ATP was provided by acetate formation in the ΔptsGglpK* mutant, indicating acetate produc-tion became an important source of energy generation through substrate-level phosphorylation. The contribu-tion of ATP from substrate-level phosphorylation was increased from 10 to 14 % in the wild type, while it was
increased from 10 to 16 % in the ΔptsGglpK* mutant with the increasing dilution rate.
Acetate overflow is interpreted as a manifestation of the imbalance of carbon uptake/availability and those for energy production and biosynthesis [52]. Why was ATP less generated in the ΔptsGglpK* mutant, where glycerol consumption was dominant as compared to the wild-type strain, where the glucose consumption was dominant at the dilution rate of 0.35 h−1, resulting in more acetate overflow? Firstly, the lower expression levels of respira-tory chains genes caused lower P/O in the ΔptsGglpK* mutant. This led to the reduction in ATP supply via oxi-dative phosphorylation. Secondly, less NADPH, which is an integral part of the oxidative energy-generating machinery of aerobic organisms, was produced in the ΔptsGglpK* mutant. NADPH helps maintain the reduc-tive environment necessary for oxidative phosphoryla-tion. Without continual supply of NADPH, production of ATP by oxidative phosphorylation cannot proceed effec-tively [56]. Finally, the activity of PntAB is energy depend-ent [45], indicating that the ΔptsGglpK* mutant requires more energy input at the dilution rate of 0.35 h−1. These could all lead to the decrease of ATP production. As a result, acetate overflow mechanism was activated to pro-vide additional energy supply in the ΔptsGglpK* mutant.
The potential of the ΔptsGglpK* mutant for the production of biofuels and biochemicalsThis study has increased our understanding of the physi-ological implications of the ΔptsGglpK* mutant, where the information obtained by 13C-MFA integrated with transcription/metabolite profiling is useful for the effec-tive manipulation and engineering of E. coli for the pro-duction of biofuels and biochemicals. 13C-MFA revealed that glucose shifted flux from the glycolytic pathway to the oxidative PP pathway to increase NADPH availability in the ΔptsGglpK* mutant, demonstrating the benefit of co-utilization of glycerol and glucose for NADPH sup-ply. In our previous work, we engineered an acetol over-producing strain (HJ05) through overexpressing of yqhD and silencing of gapA from the ΔptsGglpK* mutant [12]. Because the aldehyde oxidoreductase encoded by yqhD utilizes NADPH as a cofactor [57], NADPH availability is one important factor for the acetol production. Com-pared with utilization of glycerol as a sole carbon source in the control strain, co-utilization of glycerol and glu-cose in HJ05 increased NADPH availability and acetol production (1.82 g/L).
This study found that the ΔptsGglpK* mutant showed the increased NADH level and the NADH/NAD+ ratio. The excess reducing equivalents could be con-sumed by converting glycerol to more reduced prod-ucts under microaerobic conditions, such as ethanol
Page 10 of 14Yao et al. Biotechnol Biofuels (2016) 9:175
and 1,2-propanediol (1,2-PDO) [58, 59]. The 1,2-PDO biosynthesis pathways of E. coli using glycerol as a car-bon source with glucose as a co-substrate are shown in Additional file 7. The production of 1,2-PDO from glyco-lytic intermediate DHAP has been well established [59, 60]. Coupling parts of these strategies with our previous work on the efficient production of acetol (an intermedi-ate upstream of 1,2-PDO synthesis) could be an effective approach to increase 1,2-PDO and lower the NADH level and the NADH/NAD+ ratio.
ConclusionsThe present investigation shows the power of 13C-MFA using multiple isotopic tracers, applied in this case to the co-metabolism of glucose and glycerol in the E. coli ΔptsGglpK* mutant. The ΔptsGglpK* mutant preferen-tially consumed glycerol by reorganization of its flux-omes: fast glycerol consumption in the ΔptsGglpK* mutant affected the redox NADPH/NADH state and reduced the ATP level, activated the ArcA regulatory system, and repressed the TCA cycle, causing acetate overflow. In addition, glucose shifted flux from the gly-colytic pathway to the oxidative PP pathway to increase NADPH availability in the ΔptsGglpK* mutant, demon-strating that additional carbon source is usually required to help provide the cofactor and the production of other products from glycerol which is limited. The ΔptsGglpK* mutant can be used as a platform for the production of high-value products, especially those requiring excess reducing equivalents (such as alcohol biofuels).
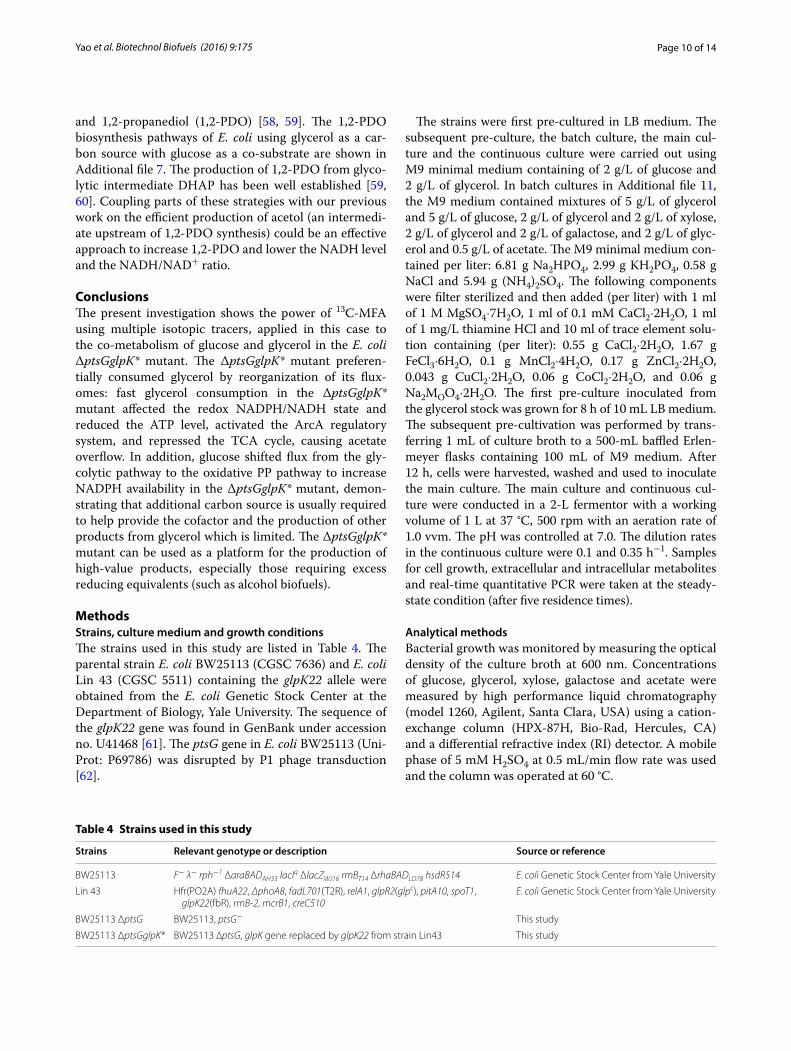
MethodsStrains, culture medium and growth conditionsThe strains used in this study are listed in Table 4. The parental strain E. coli BW25113 (CGSC 7636) and E. coli Lin 43 (CGSC 5511) containing the glpK22 allele were obtained from the E. coli Genetic Stock Center at the Department of Biology, Yale University. The sequence of the glpK22 gene was found in GenBank under accession no. U41468 [61]. The ptsG gene in E. coli BW25113 (Uni-Prot: P69786) was disrupted by P1 phage transduction [62].
The strains were first pre-cultured in LB medium. The subsequent pre-culture, the batch culture, the main cul-ture and the continuous culture were carried out using M9 minimal medium containing of 2 g/L of glucose and 2 g/L of glycerol. In batch cultures in Additional file 11, the M9 medium contained mixtures of 5 g/L of glycerol and 5 g/L of glucose, 2 g/L of glycerol and 2 g/L of xylose, 2 g/L of glycerol and 2 g/L of galactose, and 2 g/L of glyc-erol and 0.5 g/L of acetate. The M9 minimal medium con-tained per liter: 6.81 g Na2HPO4, 2.99 g KH2PO4, 0.58 g NaCl and 5.94 g (NH4)2SO4. The following components were filter sterilized and then added (per liter) with 1 ml of 1 M MgSO4·7H2O, 1 ml of 0.1 mM CaCl2·2H2O, 1 ml of 1 mg/L thiamine HCl and 10 ml of trace element solu-tion containing (per liter): 0.55 g CaCl2·2H2O, 1.67 g FeCl3·6H2O, 0.1 g MnCl2·4H2O, 0.17 g ZnCl2·2H2O, 0.043 g CuCl2·2H2O, 0.06 g CoCl2·2H2O, and 0.06 g Na2MOO4·2H2O. The first pre-culture inoculated from the glycerol stock was grown for 8 h of 10 mL LB medium. The subsequent pre-cultivation was performed by trans-ferring 1 mL of culture broth to a 500-mL baffled Erlen-meyer flasks containing 100 mL of M9 medium. After 12 h, cells were harvested, washed and used to inoculate the main culture. The main culture and continuous cul-ture were conducted in a 2-L fermentor with a working volume of 1 L at 37 °C, 500 rpm with an aeration rate of 1.0 vvm. The pH was controlled at 7.0. The dilution rates in the continuous culture were 0.1 and 0.35 h−1. Samples for cell growth, extracellular and intracellular metabolites and real-time quantitative PCR were taken at the steady-state condition (after five residence times).
Analytical methodsBacterial growth was monitored by measuring the optical density of the culture broth at 600 nm. Concentrations of glucose, glycerol, xylose, galactose and acetate were measured by high performance liquid chromatography (model 1260, Agilent, Santa Clara, USA) using a cation-exchange column (HPX-87H, Bio-Rad, Hercules, CA) and a differential refractive index (RI) detector. A mobile phase of 5 mM H2SO4 at 0.5 mL/min flow rate was used and the column was operated at 60 °C.
Table 4 Strains used in this study
Strains Relevant genotype or description Source or reference
BW25113 F− λ− rph−1 ΔaraBADAH33 lacIq ΔlacZWJ16 rrnBT14 ΔrhaBADLD78 hsdR514 E. coli Genetic Stock Center from Yale University
Lin 43 Hfr(PO2A) fhuA22, ΔphoA8, fadL701(T2R), relA1, glpR2(glpc), pitA10, spoT1, glpK22(fbR), rrnB-2, mcrB1, creC510
E. coli Genetic Stock Center from Yale University
BW25113 ΔptsG BW25113, ptsG− This study
BW25113 ΔptsGglpK* BW25113 ∆ptsG, glpK gene replaced by glpK22 from strain Lin43 This study
Page 11 of 14Yao et al. Biotechnol Biofuels (2016) 9:175
Quantification of intracellular cofactors and ATP analysisIntracellular NADP+/NADPH, NAD+/NADH were determined by using EnzyChrom NADP+/NAD Assay+/NADPH and NAD kit (BioAssay Systems, Hayward, CA), following the manufacturer’s instructions. Intracellular ATP was measured by capillary electrophoresis time-of-flight mass spectrometry (CE-TOFMS): Agilent CE capillary electrophoresis system (Agilent Technologies, Germany) and an Agilent G3250AA LC/MSD TOF sys-tem (Agilent Technologies, Palo Alto, CA). The measure-ment conditions have been described elsewhere [63]. The raw CE-TOFMS data were analyzed using MasterHands software version 2.9 [64], and the in vivo metabolite con-centrations were quantitated. Data represent the average and standard deviation, which was calculated as average of three technical and two biological replicates. Multiple comparisons among a set of experiments were made by one-way analysis of variance (ANOVA) with the level of significance set at P < 0.05.
Quantitative real‑time PCR (qRT‑PCR) analysisTotal RNA was isolated using an RNA Extraction Kit (ABigen Corporation, China). Contaminating DNA was removed with RNase-free DNase I (ABigen Corporation, China). The first-strand cDNA was synthesized using Pri-meScript™ II 1st Strand cDNA Synthesis Kit (Takara Co. Ltd., China). QRT-PCR was performed with the SYBR® Premix Ex Taq™ Kit (Takara Co. Ltd., China) on an ABI Stepone Real-Time PCR System (Applied Biosystems, USA). The primers used are listed in Additional file 8, and the housekeeping gene 16S rRNA was used to normal-ize the gene expression data. The PCR conditions were: 95 °C for 4 min, followed by 35 cycles of denaturation at 95 °C for 15 s, annealing at 57 °C for 15 s, and extension at 72 °C for 20 s. Three biological samples were analyzed, and each sample was analyzed three times. The data were averaged and presented as the mean ± standard devia-tion. Significant differences were determined by one-way analysis of variance (ANOVA). Statistical significance was defined as P < 0.05.
13C‑MFAThe labeling experiments were started after taking samples for cell growth, extracellular and intracellu-lar metabolites and real-time quantitative PCR. The unlabeled feeding medium was replaced by an identi-cal medium, a mixture of 50 % [1,3-13C]glycerol and 50 % [1-13C]glucose. GC–MS analyses of proteinogenic amino acids were made as described previously [65]. In brief, cells were harvested and hydrolyzed in 6 M HCl at 105 °C. The hydrolysate was dried then derivatized using N-(tert-butyldimethylsilyl)-N-methyl-trifluoroacetamide
(MTBSTFA) (Sigma-Aldrich, USA). GC–MS analysis was carried out using GC–MS (Hewlett Packard 7890A and 5975C, Agilent Technologies, Santa Clara, CA) equipped with a DB-5MS column (30 m × 0.25 mm × 0.25 μm).
13C-MFA was based on the isotopomer mapping matri-ces (IMMs), and details concerning the general frame-work of 13C-MFA may be found elsewhere [39]. This most frequently employed isotope tracer method detects in 10–15 protein-bound amino acids. The E. coli net-work model used for flux calculation included glucose metabolism, glycerol metabolism, glycolysis, PP pathway, TCA cycle, glyoxylate shunt, lumped biomass formation and transhydrogenation reaction (Additional file 9). The 116 and 120 mass isotopomers were used for the dilu-tion rates at 0.1 and 0.35 h−1, respectively. Three external fluxes (glucose, glycerol, acetate) were fitted to the model to estimate 17 or 18 free fluxes for the cases of the dilu-tion rates of 0.35 and 0.1 h−1, respectively.
For statistical analysis, 500 simulated measurement data sets of mass distribution were generated by addition of normally distributed measurement noise to the simu-lated measurement data set corresponding to the best fit flux distribution. Then, from the probability distribution of these re-calculated flux distributions, 90 % confidence intervals could be obtained [65].
AbbreviationsMetabolitesAcCoA: acetyl-CoA; AKG: α-ketoglutarate; CIT: citrate; DHAP: dihydroxyacetone phosphate; E4P: erythrose 4-phosphate; F6P: fructose 6-phosphate; FBP: fructose 1,6-bisphosphate; FUM: fumarate; G6P: glucose-6-phos-phate; GAP: glyceraldehyde 3-phosphate; GLX: glyoxy-late; Gly3P: glycerol-3-phosphate; ICIT: isocitrate; MAL: malate; OAA: oxaloacetate; 3PG: 3-phosphoglyceric acid; 6PG: 6-phosphogluconolactone; PEP: phosphoenolpyru-vate; PYR: pyruvate; R5P: ribose 5-phosphate; RU5P: ribulose 5-phosphate; S7P: sedoheptulose 7-phosphate; SUCCoA: succinyl-CoA; SUC: succinate; X5P: xylulose 5-phosphate.
Proteins (enzymes)AKGDH: α-ketoglutarate dehydrogenase; CS: citrate synthase; Cya: adenylate cyclase; EI: Enzyme I; EII: Enzyme II; G6PDH: glucose-6-phosphate dehydrogenase; GAPDH: glyceraldehyde 3-phosphate dehydrogenase; GLPDH: glycerol-3-phosphate dehydrogenase; GLPK: glycerol kinase; HPr: Histidine-containing protein; ICDH: isocitrate dehydrogenase; MDH: malate dehy-drogenase; 6PGDH: 6-phosphogluconolactone dehydro-genase; PDH: pyruvate dehydrogenase; SDH: succinate dehydrogenase.

Page 12 of 14Yao et al. Biotechnol Biofuels (2016) 9:175
GenesackA: acetate kinase gene; acs: acetyl-CoA synthetase gene; araF: arabinose ABC transporter gene; arcA: anoxic redox control protein gene; crp: cyclic AMP receptor; galP: galactose permease gene; gapA: glyceraldehyde 3-phosphate dehydrogenase gene; gatA: galactitol PTS permease gene; glpF: glycerol facilitator gene; glpK: glyc-erol kinase gene; gltA: citrate synthase gene; gnd: 6-phos-phogluconate dehydrogenase gene; icdA: isocitrate dehydrogenase gene; mglB: galactose ABC transporter gene; pckA: phosphoenolpyruvate carboxykinase gene; pntA: membrane-bound transhydrogenase gene; poxB: pyruvate oxidase gene; ppsA: phosphoenolpyruvate syn-thase gene; pta: phosphotransacetylase gene; ptsG, ptsHI: PTS genes; rbsB: ribose ABC transporter gene; sdhA: suc-cinate dehydrogenase; udhA: soluble transhydrogenase gene; xylF: xylose transporter gene; yqhD: aldehyde oxi-doreductase gene; zwf: glucose 6-phosphate dehydroge-nase gene.
Additional files
Additional file 1. Batch fermentation characteristics of the ΔptsGglpK* mutant using mixtures of carbon sources. a Glycerol-Glucose. b Glycerol-Xylose. c Glycerol-Galactose. d Glycerol-Acetate. Data represent the means ± SD from three independent cultures.
Additional file 2. Experimentally measured and simulated mass distributions (mol %) of amino acid fragment of E. coli BW25113 and the ΔptsGglpK* mutant at the dilution rates of 0.1 and 0.35 h−1.
Additional file 3. The exchange coefficients in E. coli BW25113 and the ΔptsGglpK* mutant at dilution rates of 0.1 and 0.35 h−1.
Additional file 4. Global regulators and their regulated genes.
Additional file 5. The regulation mechanism of the dilution rate on the metabolism of E. coli BW25113 (a) and the ΔptsGglpK* mutant (b).
Additional file 6. Fold changes of transcription levels of selected genes. a E. coli BW25113 at the dilution rate of 0.35 h−1 compared with 0.1 h−1. b The ΔptsGglpK* mutant at the dilution rate of 0.35 h−1 compared with 0.1 h−1. c The ΔptsGglpK* mutant compared with the wild-type at the dilution rate of 0.35 h−1. Asterisks indicate the statistical significance level: P < 0.05 (*). cyoA cytochrome bo terminal oxidase subunit II gene; cydA cytochrome bd-I terminal oxidase subunit I gene; gapC split glyceralde-hyde 3-phosphate dehydrogenase C gene; ndh NADH dehydrogenase NDH-2 gene; nuoA NADH dehydrogenase NDH-1 gene; pgi phospho-glucose isomerase gene; rpiB ribose-5-phosphate isomerase B gene; talA transaldolase A gene.
Additional file 7. Metabolic pathways involved in glycerol and glucose dissimilations and biosynthesis of 1,2-propanediol in E. coli. Broken lines illustrate multiple steps. aceE, aceF pyruvate dehydrogenase genes; adhE aldehyde-alcohol dehydrogenase gene; aldA lactaldehyde dehydroge-nase gene; dhaKLM dihydroxyacetone kinase genes; fbaA, fbaB fructose bisphosphate aldolase genes; fucO 1,2-propanediol reductase gene; gldA glycerol dehydrogenase gene; glk glucokinase gene; gloA glyoxylase type I gene; gloB glyoxylase type II gene; glpD glycerol-3-phosphate dehydrogenase gene; ldhA lactate dehydrogenase gene; lpdA lipoamide dehydrogenase gene; mgsA methylglyoxal synthase gene; pflB pyruvate formate-lyase gene; pykA, pykF pyruvate kinase gens; tpiA triosephosphate isomerase gene.
Additional file 8. Primers used in this study.
Additional file 9. Metabolic network model of E. coli used for 13C-MFA.
Authors’ contributionsRY designed and performed most of the experiments, analyzed the result, and wrote the manuscript. DX assisted with experiments. MW carried out CE-MS analysis of ATP. WY carried out GC–MS. HH, XZ and KS considered experimen-tal design, analyzed the result, and revised manuscript. All authors read and approved the final manuscript.
Author details1 State Key Laboratory of Microbial Metabolism and School of Life Sciences and Biotechnology, Shanghai Jiao Tong University, 800 Dongchuan Road, Shanghai 200240, China. 2 Institute for Advanced Biosciences, Keio University, 246-2, Mizukami, Kakuganji, Tsuruoka, Yamagata 997-0052, Japan. 3 Instru-mental Analysis Center, Shanghai Jiao Tong University, 800 Dongchuan Road, Shanghai 200240, China.
AcknowledgementsNone.
Competing interestsThe authors declare that they have no competing interests.
Availability of supporting dataThe data sets supporting the results of this article are included within the article and its additional files.
FundingThis work was supported by 973 Programs of China (2012CB721005) and the National Natural Science Foundation of China (31400086 and 31270084).
Received: 14 April 2016 Accepted: 15 August 2016
References 1. Clomburg JM, Gonzalez R. Anaerobic fermentation of glycerol: a platform
for renewable fuels and chemicals. Trends Biotechnol. 2013;31:20–8. 2. Wang Y, Zhang Y, Jiang T, Meng J, Sheng B, Yang C, Gao C, Xu P, Ma C. A
novel biocatalyst for efficient production of 2-oxo-carboxylates using glycerol as the cost-effective carbon source. Biotechnol Biofuels. 2015;8:1.
3. Moscoviz R, Trably E, Bernet N. Consistent 1, 3-propanediol production from glycerol in mixed culture fermentation over a wide range of pH. Biotechnol Biofuels. 2016;9:1.
4. Wang Z, Yang ST. Propionic acid production in glycerol/glucose co-fermentation by Propionibacterium freudenreichii subsp. shermanii. Bioresour Technol. 2013;137:116–23.
5. Lin ECC. Glycerol dissimilation and its regulation in bacteria. Annu Rev Microbiol. 1976;30:535–78.
6. Ormö M, Bystrom CE, James S. Remington Crystal Structure of a Complex of Escherichia coli glycerol kinase and an allosteric effector fructose 1,6-bisphosphate. Biochemistry. 1998;37:16565–72.
7. Yu P, Pettigrew DW. Linkage between fructose 1,6-bisphosphate binding and the dimer-tetramer equilibrium of Escherichia coli glycerol kinase: critical behavior arising from change of ligand stoichiometry. Biochemis-try. 2003;42:243–52.
8. Hurley JH, Faber HR, Worthylake D, Meadow ND, Roseman S, Pettigrew DW, Remington SJ. Structure of the regulatory complex of Escherichia coli IIIGlc with glycerol kinase. Science. 1993;259:673–7.
9. Feese M, Pettigrew DW, Meadow ND, Roseman S, Remington SJ. Cation-promoted association of a regulatory and target protein is controlled by protein phosphorylation. Proc Natl Acad Sci USA. 1994;91:3544–8.
10. Holtman CK, Pawlyk AC, Meadow ND, Pettigrew DW. Reverse genetics of Escherichia coli allosteric regulation and glucose control of glycerol utilization in vivo. J Bacteriol. 2001;183:3336–44.
11. Applebee MK, Joyce AR, Conrad TM, Pettigrew DW, Palsson BØ. Func-tional and metabolic effects of adaptive glycerol kinase (GLPK) mutants in Escherichia coli. J Biol Chem. 2011;286:23150–9.
12. Yao R, Liu Q, Hu H, Wood TK, Zhang X. Metabolic engineering of Escheri-chia coli to enhance acetol production from glycerol. Appl Microbiol Biotechnol. 2015;99:7945–52.

Page 13 of 14Yao et al. Biotechnol Biofuels (2016) 9:175
13. Martínez K, de Anda R, Hernández G, Escalante A, Gosset G, Ramírez OT, Bolívar FG. Coutilization of glucose and glycerol enhances the production of aromatic compounds in an Escherichia coli strain lacking the phospho-enolpyruvate: carbohydrate phosphotransferase system. Microb Cell Fact. 2008;7:1.
14. Nagarajan V, Nakamura CE. Production of 1,3-propanediol from glycerol by recombinant bacteria expressing recombinant diol dehydratase. United States Patent No. 5. 1997;633:362.
15. Görke B, Stülke J. Carbon catabolite repression in bacteria: many ways to make the most out of nutrients. Nat Rev Microbiol. 2008;6:613–24.
16. Deutscher J, Francke C, Postma PW. How phosphotransferase system-related protein phosphorylation regulates carbohydrate metabolism in bacteria. Microbiol Mol Biol R. 2006;70:939–1031.
17. Flores N, Xiao J, Berry A, Bolívar F, Valle F. Pathway engineering for the production of aromatic compounds in Escherichia coli. Nat Biotechnol. 1996;14:620–3.
18. Kim SM, Choi BY, Ryu YS, Jung SH, Park JM, Kim GH, Lee SK. Simultaneous utilization of glucose and xylose via novel mechanisms in engineered Escherichia coli. Metab Eng. 2015;30:141–8.
19. Rodriguez A, Martínez JA, Flores N, Escalante A, Gosset G, Bolívar F. Engineering Escherichia coli to overproduce aromatic amino acids and derived compounds. Microb Cell Fact. 2014;13:126.
20. Sauer U. Metabolic networks in motion: 13C-based flux analysis. Mol Syst Biol. 2006;2:62.
21. Stephanopoulos G. Synthetic biology and metabolic engineering. ACS Synth Biol. 2012;1:514–25.
22. Buescher JM, Antoniewicz MR, Boros LG, Burgess SC, Brunengraber H, Clish CB, DeBerardinis RJ, Feron O, Frezza C, Ghesquiere B, Gottlieb E, Hiller K, Jones RG, Kamphorst JJ, Kibbey RG, Kimmelman AC, Locasale JW, Lunt SY, Maddocks OD, Malloy C, Metallo CM, Meuillet EJ, Munger J, Nöh K, Rabinowitz JD, Ralser M, Sauer U, Stephanopoulos G, St-Pierre J, Ten-nant DA, Wittmann C, van der Heiden MG, Vazquez A, Vousden K, Young JD, Zamboni N, Fendt SM. A roadmap for interpreting 13C metabolite labeling patterns from cells. Curr Opin Biotechnol. 2015;34:189–201.
23. Toya Y, Shimizu H. Flux analysis and metabolomics for systematic meta-bolic engineering of microorganisms. Biotechnol Adv. 2013;31:818–26.
24. Wu SG, He L, Wang Q, Tang YJ. An ancient Chinese wisdom for metabolic engineering: Yin-Yang. Microb Cell Fact. 2015;14:39.
25. Walther JL, Metallo CM, Zhang J, Stephanopoylos G. Optimization of 13C isotopic tracers for metabolic flux analysis in mammalian cells. Metab Eng. 2012;14:162–71.
26. Kleijn RJ, Buescher JM, Le Chat L, Jules M, Aymerich S, Sauer U. Metabolic fluxes during strong carbon catabolite repression by malate in Bacillus subtilis. J Biol Chem. 2010;285:1587–96.
27. Quek LE, Nielsen LK. Steady-state 13C fluxomics using OpenFLUX. Meth-ods Mol Biol. 2014;1191:209–24.
28. Zamboni N, Fendt SM, Rühl M, Sauer U. 13C-based metabolic flux analysis. Nat Protoc. 2009;4:878–92.
29. Ying W. NAD+/NADH and NADP+/NADPH in cellular functions and cell death: regulation and biological consequences. Antioxid Redox Signal. 2008;10:179–206.
30. Spaans SK, Weusthuis RA, Van Der Oost J, Kengen SW. NADPH-generating systems in bacteria and archaea. Front Microbiol. 2015;6:742.
31. Gosset G, Zhang Z, Nayyar S, Cuevas WA, Saier MH. Transcriptome analysis of Crp-dependent catabolite control of gene expression in Escherichia coli. J Bacteriol. 2004;186:3516–24.
32. Valgepea K, Adamberg K, Vilu R. Decrease of energy spilling in Escherichia coli continuous cultures with rising specific growth rate and carbon wast-ing. BMC Syst Biol. 2011;5:1.
33. Georgellis D, Kwon O, Lin ECC. Quinones as the redox signal for the arc two-component system of bacteria. Science. 2001;292:2314–6.
34. Flores N, Flores S, Escalante A, de Anda R, Leal L, Malpica R, Georgellis D, Gosset G, Bolívar F. Adaptation for fast growth on glucose by differential expression of central carbon metabolism and gal regulon genes in an Escherichia coli strain lacking the phosphoenolpyruvate: carbohydrate phosphotransferase system. Metab Eng. 2005;7:70–87.
35. Martínez-Gómez K, Flores N, Castañeda HM, Martínez-Batallar G, Hernández-Chávez G, Ramírez OT, Gosset G, Encarnación S, Bolívar F. New insights into Escherichia coli metabolism: carbon scavenging, acetate metabolism and carbon recycling responses during growth on glycerol. Microb Cell Fact. 2012;11:46.
36. Wong MS, Wu S, Causey TB, Bennett GN, San KY. Reduction of acetate accumulation in Escherichia coli cultures for increased recombinant protein production. Metab Eng. 2008;10:97–108.
37. Franchini AG, Egli T. Global gene expression in Escherichia coli K-12 during short-term and long-term adaptation to glucose-limited continuous culture conditions. Microbiology. 2006;152:2111–27.
38. Hollinshead WD, Henson WR, Abernathy M, Moon TS, Tang YJ. Rapid metabolic analysis of Rhodococcus opacus PD630 via parallel 13C-metabo-lite fingerprinting. Biotechnol Bioeng. 2016;113:91–100.
39. Letek M, Valbuena N, Ramos A, Ordóñez E, Gil JA, Mateos LM. Characteri-zation and use of catabolite-repressed promoters from gluconate genes in Corynebacterium glutamicum. J Bacteriol. 2006;188:409–23.
40. Cheng KK, Lee BS, Masuda T, Ito T, Ikeda K, Hirayama A, Deng L, Dong J, Shimizu K, Soga T. Global metabolic network reorganization by adaptive mutations allows fast growth of Escherichia coli on glycerol. Nat Commun. 2014;5:3233.
41. Luo Y, Zhang T, Wu H. The transport and mediation mechanisms of the common sugars in Escherichia coli. Biotechnol Adv. 2014;32:905–19.
42. Nichols NN, Dien BS, Bothast RJ. Use of catabolite repression mutants for fermentation of sugar mixtures to ethanol. Appl Microbiol Biotechnol. 2001;56:120–5.
43. Eppler T, Postma P, Schütz A, Völker U, Boos W. Glycerol-3-phos-phate-induced catabolite repression in Escherichia coli. J Bacteriol. 2002;184:3044–52.
44. Zwaig N, Kistler WS, Lin ECC. Glycerol kinase, the pacemaker for the dis-similation of glycerol in Escherichia coli. J Bacteriol. 1970;102:753–9.
45. Sauer U, Canonaco F, Heri S, Perrenoud A, Fischer E. The soluble and membrane-bound transhydrogenases UdhA and PntAB have diver-gent functions in NADPH metabolism of Escherichia coli. J Biol Chem. 2004;279:6613–9.
46. He L, Xiao Y, Gebreselassie N, Zhang F, Antoniewicz MR, Tang YJ, Peng L. Central metabolic responses to the overproduction of fatty acids in Escherichia coli based on 13C-metabolic flux analysis. Biotechnol Bioeng. 2014;111:575–85.
47. Yeh JI, Chinte U, Du S. Structure of glycerol-3-phosphate dehydrogenase, an essential monotopic membrane enzyme involved in respiration and metabolism. Proc Natl Acad Sci USA. 2008;105:3280–5.
48. Mailloux RJ, Bériault R, Lemire J, Singh R, Chénier DR, Hamel RD, Appanna VD. The tricarboxylic acid cycle, an ancient metabolic network with a novel twist. PLoS One. 2007;2:e690.
49. Molgat GF, Donald LJ, Duckworth HW. Chimeric allosteric citrate synthases: construction and properties of citrate synthases contain-ing domains from two different enzymes. Arch Biochem Biophys. 1992;298:238–46.
50. Perrenoud A, Sauer U. Impact of global transcriptional regulation by ArcA, ArcB, Cra, Crp, Cya, Fnr, and Mlc on glucose catabolism in Escherichia coli. J Bacteriol. 2005;187:3171–9.
51. Chubukov V, Uhr M, Le Chat L, Kleijn RJ, Jules M, Link H, Aymerich S, Stelling J, Sauer U. Transcriptional regulation is insufficient to explain substrate-induced flux changes in Bacillus subtilis. Mol Syst Biol. 2013;9:709.
52. Farmer WR, Liao JC. Reduction of aerobic acetate production by Escheri-chiacoli. Appl Environ Microb. 1997;63:3205–10.
53. Zhuang K, Vemuri GN, Mahadevan R. Economics of membrane occu-pancy and respiro-fermentation. Mol Syst Biol. 2011;2011(7):500.
54. Mitsumori F, Rees D, Brindle KM, Radda GK, Campbell ID. 31P-NMR satura-tion transfer studies of aerobic Escherichia coli cells. Biochim Biophys Acta. 1988;969:185–93.
55. Holms H. Flux analysis and control of the central metabolic pathways in Escherichia coli. FEMS Microbiol Rev. 1996;19:85–116.
56. Singh R, Mailloux RJ, Puiseux-Dao S, Appanna VD. Oxidative stress evokes a metabolic adaptation that favors increased NADPH synthesis and decreased NADH production in Pseudomonas fluorescens. J Bacteriol. 2007;189:6665–75.
57. Lee C, Kim I, Lee J, Lee KL, Min B, Park C. Transcriptional activation of the aldehyde reductase YqhD by YqhC and its implication in glyoxal metabo-lism in Escherichia coli K-12. J Bacteriol. 2010;192:4205–14.
58. Durnin G, Clomburg JM, Yeates Z, Alvarez PJ, Zygourakis K, Campbell P, Gonzalez R. Understanding and harnessing the microaerobic metabolism of glycerol in Escherichia coli. Biotechnol Bioeng. 2009;103:148–61.
Page 14 of 14Yao et al. Biotechnol Biofuels (2016) 9:175
• We accept pre-submission inquiries
• Our selector tool helps you to find the most relevant journal
• We provide round the clock customer support
• Convenient online submission
• Thorough peer review
• Inclusion in PubMed and all major indexing services
• Maximum visibility for your research
Submit your manuscript atwww.biomedcentral.com/submit
Submit your next manuscript to BioMed Central and we will help you at every step:
59. Clomburg JM, Gonzalez R. Metabolic engineering of Escherichia coli for the production of 1,2-propanediol from glycerol. Biotechnol Bioeng. 2011;108:867–79.
60. Jain R, Sun X, Yuan Q, Yan Y. Systematically engineering Escherichia coli for enhanced production of 1,2-propanediol and 1-propanol. Acs Synth Biol. 2015;4:746–56.
61. Pettigrew DW, Liu WZ, Holmes C, Meadow ND, Roseman S. A single amino acid change in Escherichia coli glycerol kinase abolishes glucose control of glycerol utilization in vivo. J Bacteriol. 1996;178:2846–52.
62. Cherepanov PP, Wackernagel W. Gene disruption in Escherichia coli: TcR and KmR cassettes with the option of Flp-catalyzed excision of the antibiotic-resistance determinant. Gene. 1995;158:9–14.
63. Soga T, Igarashi K, Ito C, Mizobuchi K, Zimmermann HP, Tomita M. Metabolomic profiling of anionic metabolites by capillary electrophoresis mass spectrometry. Anal Chem. 2009;81:6165–74.
64. Sugimoto M, Wong DT, Hirayama A, Soga T, Tomita M. Capillary elec-trophoresis mass spectrometry-based saliva metabolomics identified oral, breast and pancreatic cancer-specific profiles. Metabolomics. 2010;6:78–95.
65. Zhao J, Shimizu K. Metabolic flux analysis of Escherichia coli K12 grown on 13C-labeled acetate and glucose using GC-MS and powerful flux calcula-tion method. J Biotechnol. 2003;101:101–17.