Embed Size (px)
DESCRIPTION
article
Citation preview
Chemical Engineering Science 55 (2000) 3461}3474
Equilibria and kinetics of CO2
adsorption on hydrotalcite adsorbent
Y. Ding, E. Alpay*Department of Chemical Engineering and Chemical Technology, Imperial College of Science, Technology and Medicine, Prince Consort Road,
London, SW7 2BY, UK
Received 8 September 1999; received in revised form 6 December 1999; accepted 13 December 1999
Abstract
The equilibria and kinetics of high temperature CO2
adsorption on hydrotalcite adsorbent have been studied using semi-technicaland bench-scale elution apparatus. The former unit enabled the simulation of the adsorption, depressurisation and purge steps ofa pressure swing adsorption-based process. Conditions of measurements were chosen to depict those of the separation enhancedsteam methane reforming process, i.e. temperatures up to 753 K and in the presence of water vapour. These conditions are alsoappropriate to some #ue gas CO
2recovery processes. At 753 K and in the presence of water vapour, adsorption saturation capacities
of &0.58 mol/kg were measured, and found to be insensitive to the actual concentration of feed water. Under dry feed conditions,a small reduction in the capacity of the fresh adsorbent (&10%) was observed, however, both dry and wet feed cases could beadequately described by Langmuir models. Measurements also suggest rapid and irreversible chemisorption on freshly packedadsorbent, followed by reversible and relatively weak adsorption on the material thereafter; adsorption appears to be promoted in thepresence of water. Nevertheless, a temporal decline in the reversible adsorption capacity was also observed, which was particularlysevere for dry feed operation. For example, at 673 K, a steady-state capacity 30% to 40% less than that of the fresh adsorbent wasmeasured. A steam purge was found to partially reactivate the adsorbent, but some irreversible loss in capacity was indicated for verylong times-on-stream (e.g. '90 d at 673 K). A mathematical model based on a linear driving force description of mass transfer, but inwhich the non-linearity of the isotherm is accounted for, was found to give a good description of the adsorption, depressurisation andpurge steps of operation. The model also accounts for non-isobaric and non-isothermal adsorption/desorption, and is thus suitable forthe purposes of large-scale design and process analysis. ( 2000 Elsevier Science Ltd. All rights reserved.
Keywords: Adsorption isotherms; Desorption kinetics; Carbon dioxide; Hydrotalcite; Mass transfer; Mathematical modelling; Steam methanereforming
1. Introduction
The equilibria and kinetics of CO2
adsorption overvarious adsorbents have been studied extensively sincethe early 1950s. Except for a few cases, most studies havebeen limited to low temperatures (273}400 K) and lowpartial pressures (0}1 bar) of operation, and in whichCO
2is the only adsorbate rather than the multicompo-
nent systems which are of industrial importance; seeValenzuela and Myers (1989), and Ritter and Yang(1987). Recent interest in CO
2recovery from #ue and
other process e%uent gases (see Suzuki, Sakoda, Suzuki& Izumi, 1997a, b), and in the use of CO
2adsorbents for
*Corresponding author. Tel.: 0044-171-594-5625; fax: 0044-171-594-
5604.
E-mail address: [email protected] (E. Alpay).
separation enhanced steam methane reforming (seeBrun}Tsekhovoi, Zadorin, Katsobashvili & Kou-rdyumov, 1986; Carvill, Hufton & Sircar, 1996; Hufton,Mayorga & Sircar, 1999), has generated motivation forthe study of CO
2adsorption under wider, and less facile,
operating conditions.Previous work has identi"ed a large number of adsor-
bents for CO2
adsorption, which include various metaloxides (e.g. CaO, MgO), alumina and metal-promotedalumina, activated carbon, and numerous zeolites, e.g.4A, 5A, CrA CrX, CrY, RhA, 13X and Na- and H-mordenites; see Ma and Mancel (1972), Ma and Roux(1973), Hayhurst (1980), Wilson and Danner (1983),Valenzuela and Myers (1989), Han and Harrison (1994),and Anand, Hufton, Mayorga, Nataraja, Sircar andGa!ney (1995). For these adsorbents, adsorption iso-therms are of Type I in terms of the Brunauer, Deming,Deming and Teller (BDDT) classi"cation, and can beadequately represented by Toth or Langmurian models.
0009-2509/00/$ - see front matter ( 2000 Elsevier Science Ltd. All rights reserved.PII: S 0 0 0 9 - 2 5 0 9 ( 9 9 ) 0 0 5 9 6 - 5

Fig. 1. Schematic diagram of the semi-technical scale experimentalsystem: HPLC * high performance liquid chromatography pump,p * pressure transducer, T * thermocouples, TC * temperaturecontroller, MFC*mass #ow controller, MFM*mass #owmeter, PC* personal computer.
Under relatively mild conditions of operation, thezeolite-based adsorbents have generally been found toyield relatively high adsorption capacities, even higherthan that of activated carbon. For example, at 300 K and1 bar CO
2partial pressure, the CO
2capacity of zeolite
13X (Linde, Union Carbide) has been measured as4 mol/kg, while that of the activated carbons range from1.5 mol/kg (BPL, Pittsburg Coke and Chem. Co.) to2.5 mol/kg (Fibre Carbon KF-1500, Toyobo Co. Ltd).For higher temperatures of operation, these capacitiesrapidly decline, and for both types of material are negli-gible for temperatures in excess of 500 K. At temper-atures of 673 K Anand et al. (1995) have shown someCO
2adsorption on metal-oxide and promoted alumina
systems, e.g. 0.2 and 0.5 mol/kg on MgO and promotedalumina-based adsorbents respectively.
Most recently CO2
adsorption capacity on hydrotal-cite have been presented. Hydrotalcite is an anionic clayconsisting of positively charged layers of metal oxide(or metal hydroxide) with inter-layers of anions, such ascarbonate. Exchange of the metal cations, as well asintercalation of the anionic layer can lead a wide rangeof catalytic and adsorptive properties, with particularstability under wet gas and high-temperature condi-tions. (See Bhattacharya et al., 1998; Hufton et al.,1999.) Thus, such materials are potentially suitablefor the separation enhanced steam methane reforming(SE-SMR) process. For example, at 673 K the authorsquote a working (steady-state) CO
2capacity of about
0.45 mol/kg, even in the presence of 10 bar steam partialpressure; a chemisorption mechanism is proposed by theauthors.
In the following sections, detailed studies on theadsorption kinetics and equilibria of an industriallysupplied potassium promoted hydrotalcite material,under conditions appropriate for SE-SMR, are present-ed. Attention is given to the deactivation (and reac-tivation) of the material under dry and wet conditions,and to the modelling of the kinetics of adsorption anddesorption during the fundamental steps of operationin a pressure-swing-based adsorptive reactor. A semi-technical scale adsorption unit is principally employedfor generating capacity and kinetic data, and for simu-lating the depressurisation and purge steps of thepressure swing process. A non-isothermal and non-isobaric dynamic model is presented for predicting theadsorption and desorption processes under this scale ofoperation. Further analyses of pellet mass transferissues, and the in#uence of a relatively high watervapour pressure on the adsorbent performance, are car-ried out with the use of a bench-scale unit, for whichaccurate temperature and pressure control could beachieved. The bench-scale unit is also used for furthermodel validation under, for example, near-isothermaloperation, and for consistency checks with semi-technicalscale operation.
2. Experimental
The adsorbent pellets were of cylindrical shape of1.6 mm diameter and 5.5 mm length. These were used intheir original form in the semi-technical scale unit, where-as both original and crushed pellets (average diameter of0.36 and 0.5 mm) were used in the bench-scale unit.Cylinder supply of two premixed gases, 5.81% (v/v) CO
2in N
2and 19.93% (v/v) CO
2in N
2, and pure oxygen-free
N2
were used to give the desired feed concentrations ofCO
2.
A schematic diagram of the semi-technical scale ad-sorption unit is given in Fig. 1. The unit consists ofa stainless steel adsorption column of internal diameter38.4 mm and length 607 mm. The column was dividedinto 3 sections: preheat, adsorbent and exit. The preheatand exit sections were packed with dense alumina balls of12 mm diameter, which aided in the temperature controlof the adsorbent section, as well as the steady modulationof gas #ow. The length of the adsorption section wasapproximately 318 mm and consisted of 350 g of adsor-bent. The vessel was "tted with inlet ports for introducingfeed gas (premixed CO
2/N
2, N
2and H
2O) and purge gas
(N2
and H2O). Switching from one feed stream to an-
other was via a manually operated 3-way valve. The inlet#ow rates of premixed CO
2/N
2gases and N
2were
controlled by Brooks 5850E mass#ow controllers. AnHPLC pump and an electrically heated vaporisationsystem were used to supply steam to the vessel. Surge(mixing) vessels enabled the constant supply of a desiredsteam concentration. Feed CO
2and water partial
pressures in the range of 0}4 bar could be achieved, witha maximum total operating pressure of 20 bar. Typically,a CO
2partial pressure in the range of 0}0.6 bar was used
3462 Y. Ding, E. Alpay / Chemical Engineering Science 55 (2000) 3461}3474

in this work, which is expected to be the common rangefor the SMR process (Ridler & Twigg, 1996).
Temperature control of the adsorption column was bymeans of 5 Electrotherm thin-band heaters, each of10 cm length. Heating tape was employed for the surgevessels, and for the heat tracing of the inlet and samplelines. Four type-K thermocouples were inserted in theadsorbent bed to detect the temperature distribution.Three type-K thermocouples were mounted in the outersurface of the column wall, and interfaced to the thin-band heaters via three Watlow temperature controllers.The heating tapes were regulated by an Electrothermalpower regulator. Temperatures up to 760 K could beachieved in the adsorption column, with a maximumvariation in axial temperature of 10 K under typical #owconditions.
The ventline #ow rate was monitored with an AalborgGFM-17 mass#ow meter, and the inlet and outlet pres-sures of the adsorption unit with RS pressure trans-ducers; bed temperature, pressure and ventline #ow ratewere logged to a microcomputer. Gas sampling could beachieved through a 1/16A line located at the interfacebetween the adsorbent and exit sections of the adsorptionunit. Such a sampling arrangement minimised delaytimes associated with dead volumes; this was estimatedas 10 s for typical operation. The sample line led directlyto a Valco 16-loop valve, both of which were heat tracedto a temperature of 383 K. A Shimadzu gas chromato-graph (GC-14B) equipped with a TCD detector anda Porapak-Q column was used for sample analysis. Inaddition to the GC, and particularly under relativelyhigh steam partial pressures, two on-line Telegan CO
2analysers (0}30% and 0}5% FSD), located downstreamof a condensing unit, could be used to monitor theventline CO
2concentration. The maximum delay time
associated with this latter arrangement was estimated as15 s under typical operating conditions.
The adsorption unit was used to monitor the break-through curves of CO
2, and to examine the e!ects of
pressure swing and purge on the desorption kinetics.A typical experimental run involved the following steps:(i) pressurisation and a 12 h purge of the adsorption unitwith N
2or H
2O/N
2, (ii) feed gas switch to CO
2/N
2or
CO2/N
2/H
2O to initiate the adsorption step, (iii) de-
pressurisation of the unit, and (iv) low pressure purge ofthe unit with N
2or H
2O/N
2until no detection of CO
2from the column. The measurement of the CO
2elution
(breakthrough) pro"le in step (ii) enabled the adsorbentcapacity to be determined from standard techniques(see, for example, Suzuki, 1990). Measurement of theCO
2elution pro"les during the depressurisation and
purge steps provided data on the e!ectiveness of adsor-bate recovery, and thus data for the quantitative analysisof the kinetics of desorption. Measurements of theadsorption and desorption amounts also enabled mater-ial balance checks on the system. For all experiments,
this error on the component balance closure did notexceed 15%.
The bench-scale equipment was mainly used tomeasure the adsorption capacity under conditions ofwell-de"ned temperature and pressure, especially in thepresence of high water concentrations, i.e. in excess of70% (v/v). Furthermore, crushed adsorbent pellets couldbe easily accommodated in this system for investigatingintraparticle mass transfer e!ects. The con"guration ofthe unit was similar to that of the semi-technical systemdescribed above, but employed an adsorption column of12.4 mm diameter and 220 mm length located withina convection oven. Water vaporisation and feed pre-heatlines were also located within the oven. In addition,a back pressure regulator was used for accurate columnpressure control.
The adsorption column for this case was packed withapproximately 14 g of adsorbent and diluted with anequal mass of silicon carbide particles of similar size. Thedilution enabled near-isothermal operation of the ad-sorption and desorption processes. For example, underthe operating conditions of this work, a maximum axialtemperature deviation of 5 K was measured, and typi-cally a deviation less than 2 K. Experiments with thebench-scale unit were conducted at temperatures in therange of 673}733 K, and operating pressures up to6.5 bar.
3. Mathematical model
3.1. Governing equations
A dynamic model was developed to describe adsorp-tion and desorption of CO
2under a semi-technical scale
of operation, i.e. non-isothermal, non-adiabatic, andnon-isobaric operation, and adsorbent in its original(pelletized) form. For computational and design conveni-ence, linear driving force (LDF) models were used todescribe intraparticle mass transfer processes (seeGlueckauf & Coates, 1947; Liow & Kenney, 1990; Kar-ger & Ruthven, 1992). These involved a driving forcebased on the linear di!erence between the equilibriumadsorption amount and the actual (volume-averaged)adsorption amount, and a constant of proportionalityaccounting for the intraparticle di!usional resistance ofthe adsorbent. An adsorption model based on instan-taneous local adsorption equilibrium (ILE) between thegas and adsorbed phases was also developed to furtherassess the importance of intraparticle mass transfer dur-ing di!erent steps of operation. Several adsorption iso-therm models could be readily employed, e.g. linear,Langmuir and Toth. As will be shown later, the Lang-muir model was found to give an adequate description ofCO
2adsorption on the hydrotalcite, and will be de-
scribed here. Other principal model assumptions can be
Y. Ding, E. Alpay / Chemical Engineering Science 55 (2000) 3461}3474 3463

summarised as: axially dispersed plug #ow, perfect gasbehaviour, no radial concentration or temperature gradi-ents, and an adsorbent section of uniform voidage andparticle size.
Based on the above assumptions, component massbalances for the packed bed could be written as
LLt
(etC
i#o
bqi)"
LLzADz
LCi
Lz B!L(uC
i)
Lz(1)
where i denotes N2
and CO2
for dry runs, and N2, CO
2and H
2O for wet runs. The semi-empirical correlation
proposed by Edwards and Richardson (1968) was usedto calculate the axial dispersion coe$cient D
z. Pressure
distribution in the packed bed was described by theErgun equation (Ergun, 1952):
LP
Lz"!K
Du!K
vu2, (2)
where KD
and KV
are parameters corresponding tothe viscous and kinetic pressure loss terms, respectively.For low particle Reynolds numbers (e.g. (5), the kineticcontribution to the total pressure loss is negligible, andEq. (2) reduces to Darcy's law. Semi-empirical relation-ships for K
Dand K
Vhave been derived by Ergun (1952)
as (see also MacDonald, El-Sayed, Mow & Dullten,1979):
KD"150
kg[j
s(1!e
b)]2
d2Pe3b
, (2a)
KV"1.75
js(1!e
b)o
gdPe3b
. (2b)
For compressible #ow, the energy balance for the bedis given by (see, for example, Bird, Stewart & Lightfoot,1960; Sircar, Kumar & Anselmo, 1983; Rota & Wankat,1990; Alpay, Kenney & Scott, 1993):
ACpget
P
R¹
#obC
psBL¹Lt
"et
LP
Lt#
LLzAKz
L¹Lz B!uC
pg
P
R¹
L¹Lz
!ob+iAHadi
Lqi
Lt B#4;
0D
r
(¹w!¹). (3)
The e!ective bed conductivity, Kz, can be expressed as
(see Yagi & Kunii, 1957; Kunii & Smith, 1960; De Wash& Froment, 1972; Li & Finlayson, 1977; Wakao& Kaguei, 1982):
Kz
kg
"
Koz
kg
#a(Pr)(Rep) (3a)
where Koz
is the static e!ective conductivity which ac-counts for the e!ects of conduction and radiation, andhas been derived by Kunii and Smith (1960) as
K0z
kg
"ebA1#b
1
hrv
dp
kgB#
b1(1!e
b)
1
1
U#
dphrs
kg
#cAkg
ksB
(3b)
where the void}void and solid}solid radiative heat trans-fer coe$cients, h
rvand h
rsrespectively, are given as
hrv"G0.1952NC1#
eb
2(1!eb))1!e
e DH (¹/100)3, (3c)
hrs"C0.1952
e
2!eD(¹/100)3. (3d)
Note that at temperatures less than 753 K, the radiativecontribution to heat transport is small. Eq. (3a) is applic-able to both axial and radial directions. For the axialdirection, the parameter a was determined to be 0.5(Wakao & Kaguei, 1982). The wall-bed heat transfercoe$cient, ;
oin Eq. (3) is given by Li and Finlayson
(1977) as
;oD
rkg
"1.26Re0.95p
expA!6d
pD
rB (cylindrical packing,
Rep"20!800, d
p/D
r"0.03!0.2)
;oD
rkg
"2.03Re0.8p
expA!6d
pD
rB (spherical packing,
Rep"20!7600, d
p/D
r"0.05!0.3) (3e)
Eq. (3e) is not applicable to very low feed #owrates, as;
oshould approach a "xed value when Re
pP0, i.e.
during the end of the depressurisation step. However, DeWash and Froment (1972) give the following correlationfor ;
oat very low Re
p:
;oDRep?0
"6.15 (Koz/D
r). (3f)
Eqs. (3e) and (3f) were linearly combined to describe;
oover the range of Re
p. The contribution of Eq. (3f) to
the combined equation was negligible under typical ad-sorption and purge steps, for which Re
p&200.
The Langmuir model for CO2
adsorption can be writ-ten as
qHCO2
"
mCO2
bCO2
PCO2
1#bCO2
PCO2
. (4)
Eq. (4) is adequate for CO2
adsorption under dry condi-tions as N
2is not adsorbed at the temperatures of con-
sideration. Under wet conditions, the coadsorption e!ectmay be important. However, as will be shown later, the
3464 Y. Ding, E. Alpay / Chemical Engineering Science 55 (2000) 3461}3474

partial pressure of water exerts little e!ect on the CO2
adsorption capacity under the conditions of this work,and thus the suitability of the single-component Lang-muir model. The temperature dependence of the Lang-muir model parameter, b
CO2in Eq. (4) is given by the
van't Ho! equation
bCO2
(¹)"bCO2
(¹0)e~(*H!$CO2 @R)(1@T~1@T0). (4a)
As mentioned above, both ILE and LDF models havebeen considered in this work to address the importanceof intraparticle mass transfer resistances. For the formermodel, the rate of adsorption given in Eq. (1) can besimply written as
Lqi
Lt"
LqHi
Lt. (5a)
The LDF model is given by
Lqi
Lt"k
i(qH
i!q
i) (5b)
where k is the e!ective mass transfer coe$cient. Note forboth ILE and LDF models, Lq
i/Lt"0 for non-adsorbing
species. Depending on the dominating mechanisms forintraparticle di!usion, k may be a function of pressure,temperature and the adsorbed phase concentration ofCO
2; see for example, Yang (1987), and the discussions in
Section 4.
3.2. Boundary and initial conditions
Initial conditions (t"0, z3(0,¸)) for the adsorptionstep are given by
qi"0, (6a)
LP
Lz"!K
Du0!K
vu20, (6b)
LP/Lt"0, (6c)
¹"¹0, (6d)
C"+Ci"P/(R¹
0). (6e)
The initial conditions for the depressurisation and purgesteps are taken as the conditions at the end of the adsorp-tion and depressurisation steps, respectively. The follow-ing boundary conditions were used to simulate theadsorption and desorption steps in the semi-technicalscale unit:
Adsorption step
(i) Inlet conditions (z"0)
!Dz(LC
i/Lz)"u(C
fi!C
i), (7a)
!Kz(L¹/Lz)"uo
gC
pg(¹
f!¹), (7b)
P"Pf, (7c)
(ii) Outlet conditions (z"¸)
LCi/Lz"0, (7d)
L¹/Lz"0, (7e)
u"(Qf/A)(1!y
f, CO2)/(1!y
CO2), (7f)
Depressurisation step
(i) Inlet conditions (z"0)
LCi/Lz"0, (7g)
L¹/Lz"0, (7h)
P"P(0, t) (measured value), (7i)
(ii) Outlet conditions (z"¸)
LCi/Lz"0, (7j)
L¹/Lz"0, (7k)
u"Q%9*5
/A!¸%9*5
e%9*5
DdP/dtD/P. (7l)
Eq. (7l) is derived from the mass balance of the exit zoneunder the assumption that the spatial pressure drop inthis zone is negligible. Note that Q
fin Eq. (7f) and Q
%9*5in
Eq. (7l) are volumetric #ow rates measured under localconditions.
Purge step
(i) Inlet conditions (z"0)
!Dz(LC
i/Lz)"u(C
pi!C
i), (8a)
!Kz(L¹/Lz)"uo
gC
pg(¹
p!¹), (8b)
P"Pp, (8c)
(ii) Outlet conditions (z"¸)
LCi/Lz"0, (8d)
L¹/Lz"0, (8e)
u"(Qp/A)/(1!y
CO2). (8f)
In this work, Eqs. (1), (2), (2a), (2b), (3a)}(3f), (4), (4a),(5a) and (5b), with the appropriate boundary conditions,were solved in the gPROMS modelling environment(Process Systems Enterprises Ltd.). The spatial discretisa-tion method of orthogonal collocation on "nite elementswas employed; second-order collocation on 100 elementswas found to give a converged solution in which com-ponent balance errors (associated with the numericalintegration) did not exceed 1%. The above model is, ofcourse, equally applicable to the simulation of the ad-sorption step in the bench-scale unit, except that theoutlet pressure and inlet velocity are known for this case,and replace boundary conditions (7c) and (7f), respective-ly. A summary of "xed design parameters used in thesimulations is given in Table 1.
Y. Ding, E. Alpay / Chemical Engineering Science 55 (2000) 3461}3474 3465

Table 1Parameters (constants) used in the simulations
Parameters (constants) Value Unit
dp
(original, equivalent) 2.75 mmD
r38.4 mm
Cpg
35 J/mol KC
ps850 J/kg K
e 0.35 *
Kg
0.05 J/m KK
s0.3 J/m K
¸%9*5
150 mmb1
0.95 *
eb
0.48 *
e%9*5
0.4 *
ep
0.24 *
et
0.61 *
U 0.2 *
c 0.667 *
js
(original pellet) 1.32 *
kg
3]10~5 Pa sob
811 kg/m3
op
1563 kg/m3
Fig. 2. CO2
adsorption isotherm under dry and wet feed conditions:(a) dry feed conditions (Langmuir model parameters: b
CO2"
16.9 bar~1 at 673 K, 17.0 bar~1 at 753 K; mCO2
"0.63 mol/kg at673 K, 0.52 mol/kg at 753 K), (b) wet feed conditions (Langmuir modelparameters: b
CO2"23.6 bar~1 at 673 K, 19.3 bar~1 at 753 K;
mCO2
"0.65 mol/kg at 673 K, 0.58 mol/kg at 753 K.
4. Results and discussion
The experimental data presented in this section wereprincipally attained from the semi-technical scale appar-atus, unless otherwise stated. Consistency checks on thedata from the two units were carried out, particularly inthe measurement of the adsorption isotherms; referenceto such data veri"cation is also given in the text whereappropriate.
4.1. Adsorption equilibria
Figs. 2(a) and (b) show CO2
adsorption isothermsunder dry and wet feed conditions, respectively.Measurements for these cases were carried out after the"rst 12 h purge period of freshly packed material. Datareproducibility was checked by typically two or threeelution experiments at each CO
2feed partial pressure. It
can be seen that the adsorption isotherms can be ad-equately described by a Langmuir adsorption model,from which the heats of adsorption (in the Henry'sregion) are estimated as 10 and 17 kJ/mol under dryand wet conditions, respectively, suggesting possiblephysisorption phenomenon and/or severe chemical alter-ation of the adsorbent surface to preclude or impede theexpected CO
2-carbonate chemistry. At lower temper-
atures of operation, i.e. 481 and 575 K, calculated heatsof adsorption are consistent with the high-temperaturemeasurements (data not shown). In all cases, however,and particularly at low temperatures, some irreversibleadsorption is indicated during the "rst contact withadsorbate, e.g. approximately 20% (v/v) unrecoveredCO
2at 481 K. This suggests the occurrence of strong
chemisorption on fresh material, followed by relativelyweak and reversible adsorption (perhaps on chemisorbedmaterial) with subsequent elution experiments. It is alsonoted that comparisons of calculated and measured tem-peratures pro"les are in good quantitative agreementbased on the low heats of adsorption mentioned above.
For wet feed conditions, the adsorption capacity wasfound to be approximately 10% higher than that underdry feed conditions. However, as shown in Fig. 3, theactual partial pressure of water (over the range of0.03}2.45 bar) has little e!ect on the capacity. This sug-gests that the presence of water vapour, even at relativelylow concentrations, is able to further activate adsorptionsites, possibly by maintaining the hydroxyl concentrationof the surface, and/or preventing site poisoning throughcarbonate or coke deposition. As will be shown below,further evidence of the deactivation of the adsorbent isgiven by the slow decline in adsorbent capacity, parti-cularly under dry conditions of operation. Experimentsinvolving water contact with fresh adsorbent (i.e. in theabsence of CO
2) show substantial retention of the water,
as well as relatively high temperature rises in the column
3466 Y. Ding, E. Alpay / Chemical Engineering Science 55 (2000) 3461}3474

Fig. 3. E!ect of partial pressure of water on the adsorption capacity ofCO
2.
Fig. 4. Time-dependence of the CO2
adsorption capacity under dryfeed conditions.
Fig. 5. Regeneration of the adsorbent by steam treatment;PCO2
"0.1 bar, 673 K, ST * steam treatment.
(i.e. 10 to 20 K). This observation suggests the rehydra-tion of the hydrotalcite following heat treatment.
Fig. 4 shows the time dependence of the CO2
adsorp-tion capacity under a dry nitrogen purge. Capacities aftereach purge period were measured at 673 K, with a feedCO
2partial pressure of 0.1 bar (2.4 mol%). The average
CO2
contact time was 2 hr/d. It is seen that the adsorp-tion capacity decreases rapidly in the "rst 200 h of opera-tion and tends to a constant value of 0.2 mol/kg. Theadsorption isotherm of the degraded adsorbent can alsobe described by the Langmuir model, in which the Lan-gmuir model parameter, b
CO2, is approximately the same
as that of the fresh adsorbent. The reversibility of thedeactivation was investigated by the steam treatment ofthe deactivated adsorbent. In speci"c, this involved thelow pressure (1.3}3 bar) purge of the adsorbent with10 mol% steam for 2 h, whilst maintaining the adsorbentbed at a temperature of 673 K, followed by dry N
2purge
for 12 h to remove all traces of water. With reference toFig. 5, it is seen that after steam treatment, there is almostcomplete recovery of the adsorbent capacity, i.e. to valuesmeasured in experiments directly proceeding the "rst12 h purge period. It has also been observed (data notshown), that adsorbent regeneration is particularly
favourable under conditions of high steam pressure, andfor longer purge durations.
Under wet conditions of feed, a relatively slow rate ofdeactivation was observed, i.e. an observable decline incapacity after 50 d times-on-stream. For example, fora bed in continuous contact with CO
2and water
(PCO2
"0.12}0.13 bar, PH2O
"0.14}0.31 bar, bed tem-perature"673 K, bed pressure"4.8}5.2 bar), the initial(fresh) adsorbent capacity was measured as 0.51 mol/kg,this decreased to 0.48 mol/kg and 0.45 mol/kg after 46and 90 d times-on-stream, respectively. The rate of de-activation was accelerated at higher temperatures. Forexample, after 90 d times-on-stream, an increase in bedtemperature from 673 to 758 K for an 8 d period, resultedin a capacity drop (as measured at 673 K) from 0.45 to0.34 mol/kg. The adsorbent capacity was only marginallyrecoverable by low pressure steam treatment for all of theabove cases.
4.2. Adsorption and desorption kinetics
Typical breakthrough curves under dry and wet feedconditions are shown in Figs. 6(a) and (b), respectively.Also shown are model predictions based on simple ILEand an LDF rate models. For the latter, the e!ectivemass transfer coe$cient was used as a "tting parameter,and is seen to be consistent for the two cases. At a higheroperating pressure, corresponding breakthrough pro"lesare shown in Figs. 7(a) and (b). The e!ect of operatingpressure on the mass transfer coe$cient is seen to besmall, given a pressure ratio of &4. This suggests thatthe intraparticle transport mechanism is not moleculardi!usion controlled, possibly due to the relatively lowpore to CO
2molecular diameter ratios. Under similar
operating conditions to the data shown in Fig. 6(b), thebreakthrough pro"le using crushed adsorbent pellets (ofmean diameter 0.5 mm) is shown in Fig. 8. This experi-ment was carried out using the bench-scale adsorption
Y. Ding, E. Alpay / Chemical Engineering Science 55 (2000) 3461}3474 3467
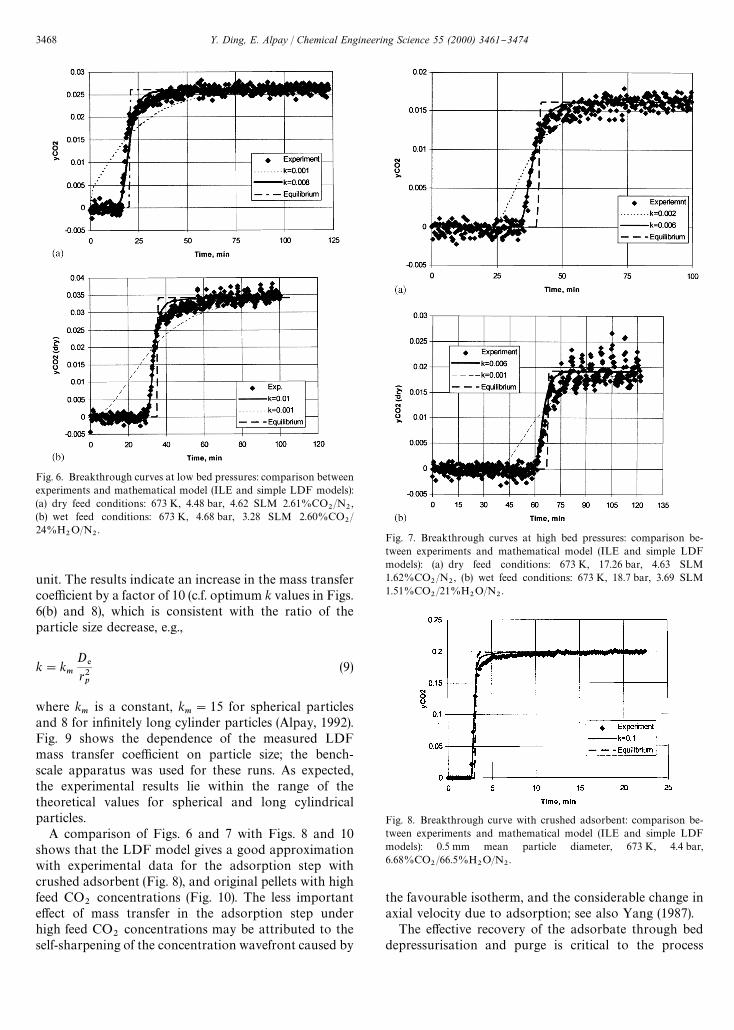
Fig. 6. Breakthrough curves at low bed pressures: comparison betweenexperiments and mathematical model (ILE and simple LDF models):(a) dry feed conditions: 673 K, 4.48 bar, 4.62 SLM 2.61%CO
2/N
2,
(b) wet feed conditions: 673 K, 4.68 bar, 3.28 SLM 2.60%CO2/
24%H2O/N
2.
Fig. 7. Breakthrough curves at high bed pressures: comparison be-tween experiments and mathematical model (ILE and simple LDFmodels): (a) dry feed conditions: 673 K, 17.26 bar, 4.63 SLM1.62%CO
2/N
2, (b) wet feed conditions: 673 K, 18.7 bar, 3.69 SLM
1.51%CO2/21%H
2O/N
2.
Fig. 8. Breakthrough curve with crushed adsorbent: comparison be-tween experiments and mathematical model (ILE and simple LDFmodels): 0.5 mm mean particle diameter, 673 K, 4.4 bar,6.68%CO
2/66.5%H
2O/N
2.
unit. The results indicate an increase in the mass transfercoe$cient by a factor of 10 (c.f. optimum k values in Figs.6(b) and 8), which is consistent with the ratio of theparticle size decrease, e.g.,
k"km
D%
r2p
(9)
where km
is a constant, km"15 for spherical particles
and 8 for in"nitely long cylinder particles (Alpay, 1992).Fig. 9 shows the dependence of the measured LDFmass transfer coe$cient on particle size; the bench-scale apparatus was used for these runs. As expected,the experimental results lie within the range of thetheoretical values for spherical and long cylindricalparticles.
A comparison of Figs. 6 and 7 with Figs. 8 and 10shows that the LDF model gives a good approximationwith experimental data for the adsorption step withcrushed adsorbent (Fig. 8), and original pellets with highfeed CO
2concentrations (Fig. 10). The less important
e!ect of mass transfer in the adsorption step underhigh feed CO
2concentrations may be attributed to the
self-sharpening of the concentration wavefront caused by
the favourable isotherm, and the considerable change inaxial velocity due to adsorption; see also Yang (1987).
The e!ective recovery of the adsorbate through beddepressurisation and purge is critical to the process
3468 Y. Ding, E. Alpay / Chemical Engineering Science 55 (2000) 3461}3474

Fig. 9. Comparison of the simple LDF mass transfer coe$cient ofthe original and crushed adsorbent: 673 K, 4.4 bar, 6.68%CO
2/
66.5%H2O/N
2.
Fig. 10. Breakthrough curve with the original adsorbent (bench-scalerig): comparison between experiments and mathematical model (ILEand simple LDF models): 673 K, 1.14 bar, 19.93%CO
2/N
2.
Fig. 11. Desorption percentage as function of depressurisation time:(a) dry conditions: see Fig. 6(a) for conditions of the adsorption step,(b) wet conditions: see Fig. 6(b) for conditions of the adsorption step;pressure swing from 4.7 bar to atmospheric pressure.
design, and often dictates the economics of the process.Useful indication of recovery is given in terms of thedesorption percentage, i.e. the total mass of CO
2desor-
bed from the bed in time t as the percentage of the totalmass of CO
2adsorbed in the adsorption step. Figs. 11(a)
and (b) show typical desorption percentages as functionsof the depressurisation time (see Figs. 6(a) and (b) for theoperation conditions of corresponding adsorption step).It can be seen that the desorption percentage is very low,i.e. less than 1.5% of the total adsorbed CO
2is recovered
at the end of depressurisation. At adsorption pressures ofapproximately 17 bar, and thus for a greater pressureswing at the end of depressurisation, respective increasesin desorption percentage to 1.8% and 2.3% for dry andwet feed conditions have been measured.
Desorption percentage as a function of the purge gasamount are shown in Fig. 12 (see Figs. 6(a), (b), 7(a) and(b) for the operating conditions of the correspondingadsorption step). For these experiments, a dry gas purgewas used for a bed which was previously exposed to a dry
feed of CO2, and a wet gas purge for one exposed to wet
CO2
feed. From these results, it is seen that for the samedesorption percentage at 673 K, considerably morepurge gas is needed under dry conditions than wet condi-tions. From Fig. 12(a) and (c), it can also be seen thatcomplete recovery of the adsorbent is di$cult under dryconditions. Fig. 13 shows the e!ect of the periodic addi-tion of a small amount of water in the purge gas (&10(v/v)% H
2O) after 4.2 h of dry purge; see Fig. 12(a) for the
desorption history. It is again seen that water can con-siderably enhance the desorption process. The experi-mental results also show that, over the range ofinvestigation, the amount of purge gas needed to achievea given desorption percentage under wet conditions isnot sensitive to the water concentration in the purge gas.At a higher bed temperature of 753 K (data not shown),the di!erence in the purge gas amount for dry and wetgases is less considerable. It is noted that the above datais subject to a small degree of error due to a 5}10% errorin the experimental material balance closure.
Simulations of the desorption percentage as a functionof dry purge gas amount with the ILE and LDF modelsare shown in Fig. 14. It is seen that the ILE model fails topredict the desorption kinetics. The "t of the experi-mental data by the simple LDF model is also poor. Thesigni"cant di!erence in the LDF mass transfer coe$cient(&20-fold) between the adsorption step (k&0.008,Fig. 6(a)) and desorption step (k&0.0004, Fig. 14(a)) may
Y. Ding, E. Alpay / Chemical Engineering Science 55 (2000) 3461}3474 3469

Fig. 12. Desorption percentage as function of purge gas amount (dry basis) at 673 K.
Fig. 13. E!ect of repeated addition of water on the desorption kineticsafter dry purge: 673 K, atmospheric pressure, &10% (v/v) water con-centration.
be due to the non-linearity of the isotherm (Karger& Ruthven, 1992), and perhaps inaccurate description ofthe di!usion mechanisms governing the value of the LDFmass transfer coe$cient; a further mathematical treatiseof these issues is given below.
For the adsorbent used in this study, three principaltypes of intraparticle di!usion may occur, i.e. mole-cular, Knudsen and surface di!usion. For a sphericaladsorbent, a pellet material balance leads to
ep
LC@i
Lt#(1!e
p)o
p
Lq@i
Lt
"
1
r2
LLrCepDp
r2LC@
iLr D#
1
r2LLrCop
Dsr2
Lq@i
Lr D (10)
where Ds
is the surface di!usivity and Dp
the combina-tion of molecular and Knudsen di!usivities. If D
sLq@
i/LC@
iand D
pare independent of the radial co-ordinate r, then,
Eq. (10) can be rewritten as
LC@i
Lt"C
epD
p#o
pD
s(Lq@
i/LC
i)
ep#(1!e
p)o
p(Lq@
i/LC
i)D
1
r2LLrAr2
LCi
Lr B. (10a)
Eq. (10a) de"nes the following e!ective di!usivity:
De"
epD
p#o
pD
s(Lq@
i/LC@
i)
ep#(1!e
p)o
p(Lq@
i/LC@
i). (11)
Combination of Eqs. (9) and (11) then gives
k"km
r2p
epD
p#o
pD
s(Lq@
i/LC@
i)
ep#(1!e
p)o
p(Lq@
i/LC@
i)
(12)
Eq. (12) explicitly shows the e!ect of the adsorptionisotherm on the adsorption/desorption kinetics. Due tolack of di!usivity data, it is not possible to use Eq. (12)directly in the modelling work. However, the followingtwo extreme cases can be examined: (i) surface di!usiondominates the overall #ux, and (ii) surface di!usion isnegligible to the overall #ux. In the former case,epD
p@o
pD
s(Lq@
i/LC@
i), and Eq. (12) reduces to
k"km
r2p
opD
s(Lq@
i/LC@
i)
ep#(1!e
p)o
p(Lq@
i/LC@
i)
(12a)
3470 Y. Ding, E. Alpay / Chemical Engineering Science 55 (2000) 3461}3474

Fig. 14. Desorption by purge with dry N2
at 673 K and 1.14 bar(2 psig): comparison between experiments and model (simple LDFmodel).
Fig. 15. Comparison between experiment and model assuming a highsurface di!usivity contribution to overall #ux: (a) adsorption step,(b) desorption step; 1.14 bar, 673 K, bench-scale apparatus.
Ds
is known to be concentration dependent, and can besimply expressed as (Yang, 1987):
Ds"D0
s/(1!h) (12b)
where h is the surface coverage, and D0s
is the surfacedi!usivity at h"0. Eq. (12a) then becomes
k"kmD0
sr2pC
op(Lq@
i/LC@
i)
ep#(1!e
p)o
p(Lq@
i/LC@
i)DN(1!h). (12c)
Since Lq@i/LC@
iand h can be evaluated from the isotherm,
then if kso"k
mD0
s/r2
pis used as a "tting parameter, Eq.
(12c) can be used directly in the simulations. Fig. 15shows the modelling results of a run under dry feedconditions at 673 K and 1.14 bar (2 psig) with thebench-scale unit. Only adsorption and purge steps wereconducted in this run. With reference to Fig. 15(b), it canbe seen that the "t of the experimental date is much betterthan that by the simple LDF model (Fig. 14(b)). Fig. 16shows the pro"les of e%uent CO
2molar fraction, which
again shows the improved "t. However, the kso
value inthe adsorption step (&0.0075) is still about 15 times that
in the purge step (0.0005). This suggests that the physicalbasis of Eq. (12c) is not fully appropriate for this case, i.e.surface di!usion unlikely to dominate the overall #ux ofmaterial.
In the other extreme, where pore di!usion dominates,epD
pAo
pD
s(Lq@
i/LC@
i), and Eq. (12) reduces to
k"km
r2p
epD
pep#(1!e
p)o
p(Lq@
i/LC@
i). (12d)
As before Eq. (12d) can be used directly for modelling ifkpo"k
mD
p/r2
pis used as the "tting parameter. For this
case, the calculated desorption percentage as a functionof purge gas amount is shown in Fig. 17. An improved"t to the experimental data over the simple LDF modelis again shown. Furthermore, the k
povalue in the
adsorption step (&3.5) is similar to that in the purge step(&1.8). This relatively small di!erence may be partlyattributed to the error of the Langmuir isotherm para-meter b
CO2. For example, with reference to Fig. 2(a),
a sensitivity analysis shows that a change of 20% inbCO2
results in less than 4% deviation from the best
Y. Ding, E. Alpay / Chemical Engineering Science 55 (2000) 3461}3474 3471

Fig. 16. E%uent molar fraction pro"les: comparison between experi-ment with simulations using simple LDF, low surface di!usivity andhigh surface di!usivity models: bench-scale apparatus.
Fig. 17. Comparison between experiment and model assuming a rela-tively low surface di!usivity contribution to overall #ux; 1.14 bar,673 K bench-scale apparatus.
isotherm "t, but considerably improves the "t of themodelling results with the pore di!usion model, andestablishes a consistent k
povalue of &2.0 for both the
adsorption and purge steps, see Fig. 17. Overall, theresults indicate that an LDF model accounting for poredi!usion and a non-linear adsorption isotherm is suitablefor describing the adsorption and desorption processes.
As a further check on parameter sensitivity on thesimulated kinetics of adsorption and desorption, calcu-lations were repeated for relatively high valves of adsorp-tion heat, i.e. up to 30 mJ/mol. Under these conditions,optimal pro"les were found to be almost identical tothose of the best-"t trends shown in Fig. 17, but anincrease in the K
povalve to approximately 2.5 (c.f. a valve
of 2.0 for Had"17 kJ/mol). An ILE model again failed to
give an adequate description of the desorption kinetics.The calculations thus indicate that under the conditionsof operation in this work, concentration front dispersionprincipally arises from mass transfer e!ects rather thanthermal e!ects.
Given the de"nition of the LDF mass transfer co-e$cient for pore di!usion (Eq. (12d)), and the meanvalue of k
op(&2.5), the di!usivity D
pcan be estimated
as 3.3]10~7 m2/s. This value is about two orders ofmagnitude smaller than the molecular di!usivity
(8]10~5 m2/s). The Knudsen di!usivity (Dk) can be esti-
mated as 6]10~8 m2/s (see Bird et al., 1960). Under thetypical operating conditions of the adsorption step, theKnudsen number (j/(2r
103%)) can be calculated as &5,
indicating that the di!usion is in the transition zone. Theweak dependence of k on the bed pressure supports theview that Knudsen di!usion dominates the mass transferprocess. Finally, recalculation of the k
41)%3%/k
#:-*/$%3ratios
in Fig. 9 using the modi"ed LDF model shows the sametrend as that using the simple LDF model.
5. Conclusions
Under conditions depicting the separation enhancedsteam-methane reforming process, experimental data forthe adsorption and desorption of CO
2on potassium
promoted hydrotalcite adsorbent have been measured.In this work, adsorption saturation capacities of 0.65 and0.58 mol/kg were measured at 673 and 753 K, respective-ly, under wet feed conditions. Under dry feed conditions,an &10% reduction of the saturation capacity was ob-served. In both cases, a Langmuir model was found toadequately describe the adsorption isotherm. Experi-mental data indicated the relatively rapid degradation of
3472 Y. Ding, E. Alpay / Chemical Engineering Science 55 (2000) 3461}3474

the adsorbent under dry feed conditions, e.g. a reductionin capacity of &30}40% at 673 K, and higher losses athigher temperatures. Adsorbent regeneration was pos-sible by means of a steam purge, but some irreversibleloss in capacity was indicated for very long times-on-stream (e.g. 90 d at 673 K). A dynamic model accountingfor semi-technical scale operation (i.e. non-isothermal,non-adiabatic and non-isobaric operation) was de-veloped to describe the key operating steps of the pres-sure swing based adsorptive process. Kinetic studiessuggested mass transfer control for the adsorption, de-pressurisation and purge steps of operation. This is parti-cularly so for low partial pressures of feed CO
2. An LDF
model based on pore di!usion, and accounting for thenon-linearity of the isotherm, was found to give a gooddescription the adsorption and desorption data.
The work illustrates the complexities of CO2
adsorp-tion on hydrotalcite in which, for example, pre-adsorbedlayers of water and CO
2may alter the capacity of
the material, and possibly generate adsorption sites forphysisorption. Thus, depending on the conditions ofpre-treatment of the adsorbent, some variation in ad-sorption parameters is expected. For adsorbent pre-viously not contacted with steam or CO
2feed, obser-
vations suggest an initial strong adsorption of material,depicting a chemisorption mechanism; further analysesof competitive and coupled physi- and chemisorption ofCO
2and water would further improve the model predic-
tions presented above.
Notation
a constant of the empirical correlation of the e!ectivethermal conductivity, dimensionless
A cross-sectional area of the adsorption column, m2
bi
Langmuir model constant for component i, bar~1
Cfi
gas-phase concentration of component i in the feed,mol/m3
Ci
molar concentration of gas phase component i,mol/m3
C@i
molar concentration of gas-phase component iinside adsorbent particles, mol/m3
Cpi
gas phase concentration of component i in thepurge gas, mol/m3
Cpg
gas phase heat capacity, J/mol KC
pssolid phase heat capacity, J/kg K
dp
particle diameter, mmD
ee!ective di!usivity, m2/s
Dr
inner diameter of the adsorption column, mmD0
ssurface di!usivity at h"0, m2/s
Ds
surface di!usivity, m2/sD
zaxial dispersion coe$cient, m2/s
e emissivity of the solid particles, dimensionlesshrs
solid}solid radiative heat transfer coe$cient, di-mensionless
hrv
void}void radiative heat transfer coe$cient, dimen-sionless
Hadi
adsorption heat of component i, J/molk LDF mass transfer coe$cient, s~1
kg
gas phase thermal conductivity, J/m Kkm
constant, dimensionlesskpo
"(kmD
p/r2
p)
kso
"(kmD0
s/r2
p)
ks
solid-phase thermal conductivity, J/m KK
DErgun equation coe$cient, N s/m4
KV
Ergun equation coe$cient, N s2/m5
K0z
static e!ective thermal conductivity, J/m KK
ze!ective thermal conductivity, J/m K
¸%9*5
length of the exit zone, mmm
iLangmuir model constant for component i, mol/kg
M molecular mass, gP pressure, barPf
feed gas pressure (inlet), barPi
partial pressure of gas phase component i, barPp
purge gas inlet pressure, barqi
solid-phase concentration (average over an adsor-bent particle), mol/kg
qHi
equilibrium solid-phase concentration, mol/kgq@i
solid-phase concentration, mol/kgQ
%9*5volumetric #owrate of the bed exit, m3/s
Qf
volumetric #owrate of the feed gas (inlet), m3/sQ
Pvolumetric #owrate of the purge gas (inlet), m3/s
r radial coordinate, mmrc
radius of cylindrical particle, mmrp
radius of the adsorbent, mmr103%
pore radius, Asrs
radius of spherical particle, mmR universal gas constant, J/mol Kt time, s¹ temperature, K¹
ffeed gas temperature (inlet), K
¹0
initial bed temperature, reference temperature, K¹
Ppurge gas inlet temperature, K
¹w
wall temperature, Ku super"cial velocity, m/su0
initial super"cial velocity, m/s;
0overall bed-wall heat transfer coe$cient, J/m2 K
yf,i
molar fraction of component i in the feed, dimen-sionless
yi
molar fraction of component i in the gas phase,dimensionless
Greek letters
b1
constant in Eq. (3b)eb
voidage of the adsorbent bed, dimensionlesse%9*5
bed voidage of the exit zone, dimensionlessep
pellet porosity, dimensionlesset
total voidage of the adsorbent bed, dimensionlessU constant in Eq. (3b)c constant in Eq. (3b)
Y. Ding, E. Alpay / Chemical Engineering Science 55 (2000) 3461}3474 3473
j free path length, Asjs
shape factor of the adsorbent particles, dimension-less
kg
gas phase viscosity, Pa sh surface coverage dimensionlessob
bulk density of the adsorbent bed, kg/m3
og
gas-phase density, kg/m3
op
bulk density of pellet, kg/m3
References
Alpay, E. (1992). Rapid pressure swing adsorption processes. Ph.D. thesis,Queen's College, Cambridge.
Alpay, E., Kenney, C. N., & Scott, D. M. (1993). Simulation of rapidpressure swing adsorption and reaction processes. Chemical En-gineering Science, 48, 3173}3186.
Anand, M., Hufton, J., Mayorga, S., Nataraja, S., Sircar, S., & Ga!ney,T. (1995). Sorption enhanced reaction (SERP) for the production ofhydrogen. APCI report for DOE.
Bhattacharya, A., Chang, V. W., Schumacher, D. J. (1998) Applied ClayScience, 13, 317.
Bird, R. B., Stewart, W. E., & Lightfoot, E. N. (1960). Transport phe-nomena. New York: Wiley.
Brun-Tsekhovoi, A. R., Zadorin, A. N., Katsobashvili, Ya. R., & Kou-rdyumov, S. S. (1986). The process of catalytic steam-reforming ofhydrocarbons in the presence of carbon dioxide acceptor. InProceedings of the World Hydrogen Energy Conference, Vol.2 (pp. 885}900) New York: Pergamon Press.
Carvil, B. T., Hufton, J. R., & Sircar, S. (1996). Sorption}enhancedreaction process. A.I.Ch.E. Journal, 42, 2765}2772.
De Wash, A. P., & Froment, G. F. (1972). Heat transfer in packed bed.Chemical Engineering Science, 27, 567}576.
Edwards, M. F., & Richardson, J. F. (1968). Gas dispersion in packedbeds. Chemical Engineering Science, 23, 109}123.
Ergun, S. (1952). Fluid #ow through packed columns. Chemical Engin-eering Progress, 48, 89}94.
Glueckauf, E., & Coates, J. I. (1947). Theory of chromatography (PartIV). Journal of Chemical Society, 1315}1321.
Han, C., & Harrison, D. P. (1994). Simultaneous shift reaction andcarbond dioxide separation for the direct production of hydrogen.Chemical Engineering Science, 49, 5875}5883.
Hayhurst, D. T. (1980). Gas adsorption by some natural zeolites.Chemical Engineering Communications, 4, 729}735.
Hufton, J. R., Mayorga, S., & Sircar, S. (1999). Sorption-enhancedreaction process for hydrogen production. A.I.Ch.E. Journal, 45,248}256.
Karger, J., & Ruthven, D. M. (1992). Diwusion in zeolites and othermicroporous solids. New York: Wiley.
Kunii, D., & Smith, J. M. (1960). Heat transfer characteristics of porousrocks. A.I.Ch.E. Journal, 6, 71}78.
Li, Chi-Hsiung, & Finlayson, B. A. (1977). Heat transfer in packedbeds * A reevaluation. Chemical Engineering Science, 32,1055}1066.
Liow, J. L., & Kenney, C. N. (1990). The back"ll cycle of the pressureswing adsorption process. A.I.Ch.E. Journal, 36, 53}65.
Ma, Y. H., & Mancel, C. (1972). Di!usion studies of CO2, NO, NO
2and SO2
on molecular sieve zeolites by gas chromatography.A.I.Ch.E. Journal, 18, 1148}1153.
Ma, Y. H., & Roux, A. J. (1973). Multicomponent rates of sorption ofSO
2and CO
2in sodium mordenite. A.I.Ch.E. Journal, 19,
1055}1059.MacDonald, I. F., E.-sayed, M. S., Mow, K., & Dullien, F. A. L. (1979).
Flow through porus media - the Ergun equation revisited. Indus-trial Engineering Chemistry, Fundamentals, 18, 199}207.
Ridler, D. E., & Twigg, M. V. (1996). Steam reforming. InM. V. Twigg, Catalyst Handbook. London, England: MasonPublishing Ltd.
Ritter, J. A., & Yang, R. T. (1987). Equilibrium adsorption of multicom-ponent gas mixtures at elevated pressures. Industrial EngineeringChemistry, Research, 26, 1679}1686.
Rota, R., & Wankat, P. C. (1990). Intensi"cation of pressure swingadsorption processes. A.I.Ch.E. Journal, 36, 1299}1312.
Sircar, S., Kumar, R., & Anselmo, K. J. (1983). E!ects of columnnonisothermality or nonadiabaticity on the adsorption break-through curves. Industrial Engineering Chemistry, Process Designand Development, 22, 10}15.
Suzuki, T. (1990). Adsorption engineering. Tokyo, Japan: Kodansha.Suzuki, T., Sakoda, A., Suzuki, M., & Izumi, J. (1997a). Adsorption of
carbon dioxide onto hydrophobic zeolite under high moisture.Journal of Chemical Engineering of Japan, 30, 954}958.
Suzuki, T., Sakoda, A., Suzuki, M., & Izumi, J. (1997b). Recoveryof carbon dioxide from stack gas by piston-driven ultra-rapid PSA. Journal of Chemical Engineering of Japan, 30,1026}1033.
Valenzuela, D. P., & Myers, A. L. (1989). In Adsorption equilibrium datahandbook (pp. 39}59). Englewood, Cli!s, NJ: Prentice}Hall.
Wakao, N., & Kaguei, S. (1982). Heat and mass transfer in packed bed.New York: Gordon and Breach.
Wilson, R. J., & Danner, R. P. (1983). Adsorption of synthesisedgas-mixture components on activated carbon. Journal of ChemicalEngineering Data, 28, 14}18.
Yagi, S., & Kunii, D. (1957). Studies on e!ective thermal conductivitiesin packed beds. A.I.Ch.E. Journal, 3, 373}381.
Yang, R. T. (1987). Gas separation by adsorption processes. Boston, USA:Butterworths.
3474 Y. Ding, E. Alpay / Chemical Engineering Science 55 (2000) 3461}3474