Embed Size (px)
Citation preview
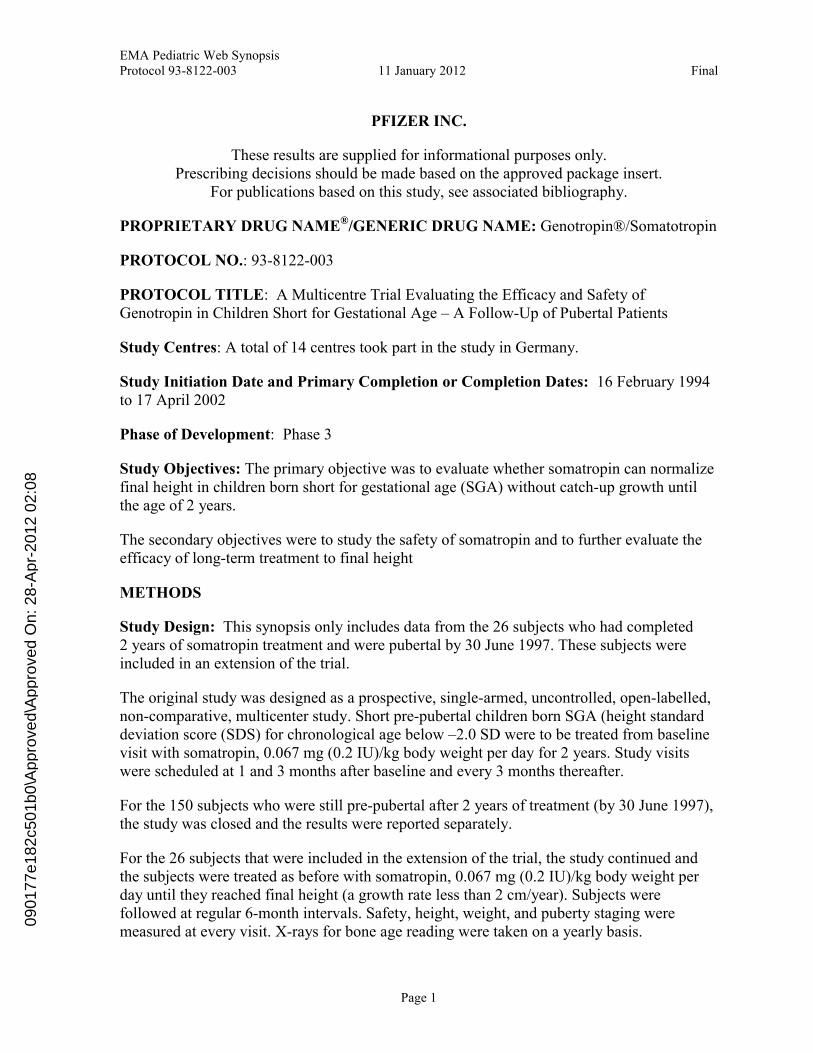
EMA Pediatric Web SynopsisProtocol 93-8122-003 11 January 2012 Final
Page 1
PFIZER INC.
These results are supplied for informational purposes only.Prescribing decisions should be made based on the approved package insert.
For publications based on this study, see associated bibliography.
PROPRIETARY DRUG NAME®/GENERIC DRUG NAME: Genotropin®/Somatotropin
PROTOCOL NO.: 93-8122-003
PROTOCOL TITLE: A Multicentre Trial Evaluating the Efficacy and Safety of Genotropin in Children Short for Gestational Age – A Follow-Up of Pubertal Patients
Study Centres: A total of 14 centres took part in the study in Germany.
Study Initiation Date and Primary Completion or Completion Dates: 16 February 1994 to 17 April 2002
Phase of Development: Phase 3
Study Objectives: The primary objective was to evaluate whether somatropin can normalize final height in children born short for gestational age (SGA) without catch-up growth until the age of 2 years.
The secondary objectives were to study the safety of somatropin and to further evaluate the efficacy of long-term treatment to final height
METHODS
Study Design: This synopsis only includes data from the 26 subjects who had completed 2 years of somatropin treatment and were pubertal by 30 June 1997. These subjects were included in an extension of the trial.
The original study was designed as a prospective, single-armed, uncontrolled, open-labelled, non-comparative, multicenter study. Short pre-pubertal children born SGA (height standard deviation score (SDS) for chronological age below –2.0 SD were to be treated from baseline visit with somatropin, 0.067 mg (0.2 IU)/kg body weight per day for 2 years. Study visits were scheduled at 1 and 3 months after baseline and every 3 months thereafter.
For the 150 subjects who were still pre-pubertal after 2 years of treatment (by 30 June 1997), the study was closed and the results were reported separately.
For the 26 subjects that were included in the extension of the trial, the study continued and the subjects were treated as before with somatropin, 0.067 mg (0.2 IU)/kg body weight per day until they reached final height (a growth rate less than 2 cm/year). Subjects were followed at regular 6-month intervals. Safety, height, weight, and puberty staging were measured at every visit. X-rays for bone age reading were taken on a yearly basis.
0901
77e1
82c5
01b0
\App
rove
d\A
ppro
ved
On:
28-
Apr
-201
2 02
:08
EMA Pediatric Web SynopsisProtocol 93-8122-003 11 January 2012 Final
Page 2
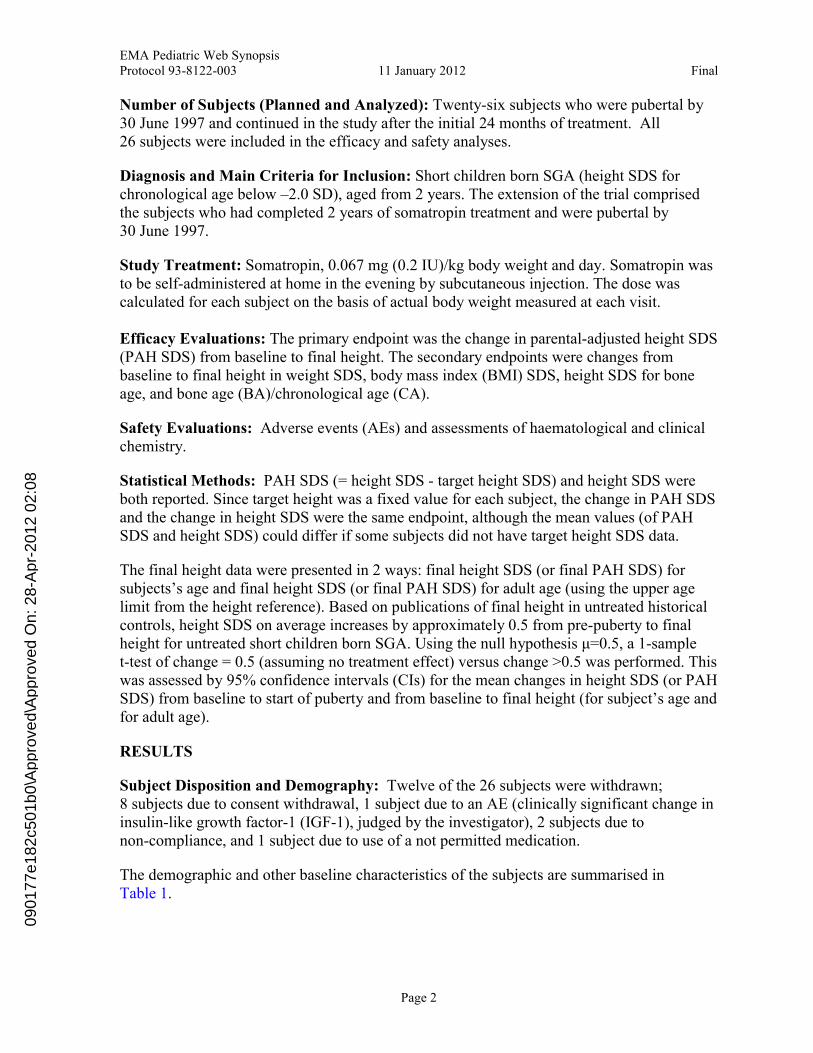
Number of Subjects (Planned and Analyzed): Twenty-six subjects who were pubertal by 30 June 1997 and continued in the study after the initial 24 months of treatment. All 26 subjects were included in the efficacy and safety analyses.
Diagnosis and Main Criteria for Inclusion: Short children born SGA (height SDS for chronological age below –2.0 SD), aged from 2 years. The extension of the trial comprised the subjects who had completed 2 years of somatropin treatment and were pubertal by 30 June 1997.
Study Treatment: Somatropin, 0.067 mg (0.2 IU)/kg body weight and day. Somatropin was to be self-administered at home in the evening by subcutaneous injection. The dose was calculated for each subject on the basis of actual body weight measured at each visit.
Efficacy Evaluations: The primary endpoint was the change in parental-adjusted height SDS (PAH SDS) from baseline to final height. The secondary endpoints were changes from baseline to final height in weight SDS, body mass index (BMI) SDS, height SDS for bone age, and bone age (BA)/chronological age (CA).
Safety Evaluations: Adverse events (AEs) and assessments of haematological and clinical chemistry.
Statistical Methods: PAH SDS (= height SDS - target height SDS) and height SDS were both reported. Since target height was a fixed value for each subject, the change in PAH SDS and the change in height SDS were the same endpoint, although the mean values (of PAH SDS and height SDS) could differ if some subjects did not have target height SDS data.
The final height data were presented in 2 ways: final height SDS (or final PAH SDS) for subjects’s age and final height SDS (or final PAH SDS) for adult age (using the upper age limit from the height reference). Based on publications of final height in untreated historical controls, height SDS on average increases by approximately 0.5 from pre-puberty to final height for untreated short children born SGA. Using the null hypothesis μ=0.5, a 1-sample t-test of change = 0.5 (assuming no treatment effect) versus change >0.5 was performed. This was assessed by 95% confidence intervals (CIs) for the mean changes in height SDS (or PAH SDS) from baseline to start of puberty and from baseline to final height (for subject’s age and for adult age).
RESULTS
Subject Disposition and Demography: Twelve of the 26 subjects were withdrawn; 8 subjects due to consent withdrawal, 1 subject due to an AE (clinically significant change in insulin-like growth factor-1 (IGF-1), judged by the investigator), 2 subjects due to non-compliance, and 1 subject due to use of a not permitted medication.
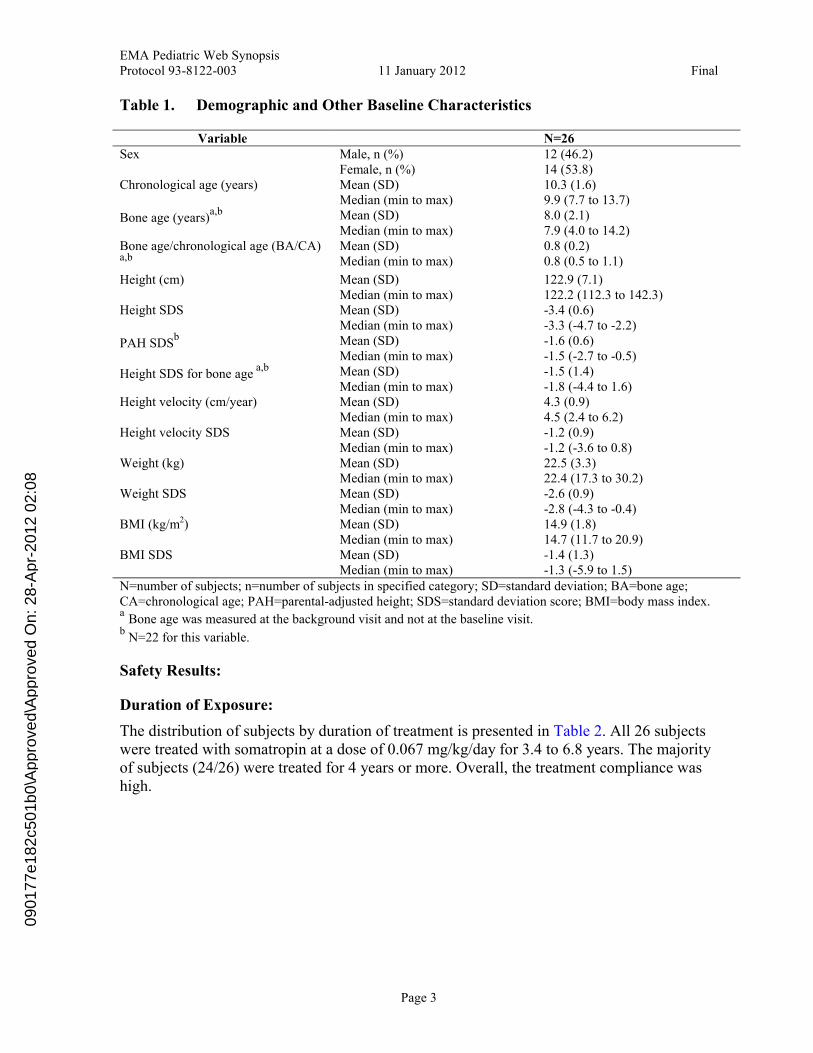
The demographic and other baseline characteristics of the subjects are summarised in Table 1.
0901
77e1
82c5
01b0
\App
rove
d\A
ppro
ved
On:
28-
Apr
-201
2 02
:08
EMA Pediatric Web SynopsisProtocol 93-8122-003 11 January 2012 Final
Page 3
Table 1. Demographic and Other Baseline Characteristics
Variable N=26Male, n (%) 12 (46.2)SexFemale, n (%) 14 (53.8)Mean (SD) 10.3 (1.6)Chronological age (years)Median (min to max) 9.9 (7.7 to 13.7)Mean (SD) 8.0 (2.1)Bone age (years)
a,b
Median (min to max) 7.9 (4.0 to 14.2)Mean (SD) 0.8 (0.2)Bone age/chronological age (BA/CA)
a,b Median (min to max) 0.8 (0.5 to 1.1)
Mean (SD) 122.9 (7.1)Height (cm)Median (min to max) 122.2 (112.3 to 142.3)Mean (SD) -3.4 (0.6)Height SDSMedian (min to max) -3.3 (-4.7 to -2.2)Mean (SD) -1.6 (0.6)PAH SDS
b
Median (min to max) -1.5 (-2.7 to -0.5)Mean (SD) -1.5 (1.4)Height SDS for bone age
a,b
Median (min to max) -1.8 (-4.4 to 1.6)Mean (SD) 4.3 (0.9)Height velocity (cm/year)Median (min to max) 4.5 (2.4 to 6.2)Mean (SD) -1.2 (0.9)Height velocity SDSMedian (min to max) -1.2 (-3.6 to 0.8)Mean (SD) 22.5 (3.3)Weight (kg)Median (min to max) 22.4 (17.3 to 30.2)Mean (SD) -2.6 (0.9)Weight SDSMedian (min to max) -2.8 (-4.3 to -0.4)Mean (SD) 14.9 (1.8)BMI (kg/m2)Median (min to max) 14.7 (11.7 to 20.9)Mean (SD) -1.4 (1.3)BMI SDSMedian (min to max) -1.3 (-5.9 to 1.5)
N=number of subjects; n=number of subjects in specified category; SD=standard deviation; BA=bone age; CA=chronological age; PAH=parental-adjusted height; SDS=standard deviation score; BMI=body mass index.a
Bone age was measured at the background visit and not at the baseline visit.b
N=22 for this variable.
Safety Results:
Duration of Exposure:
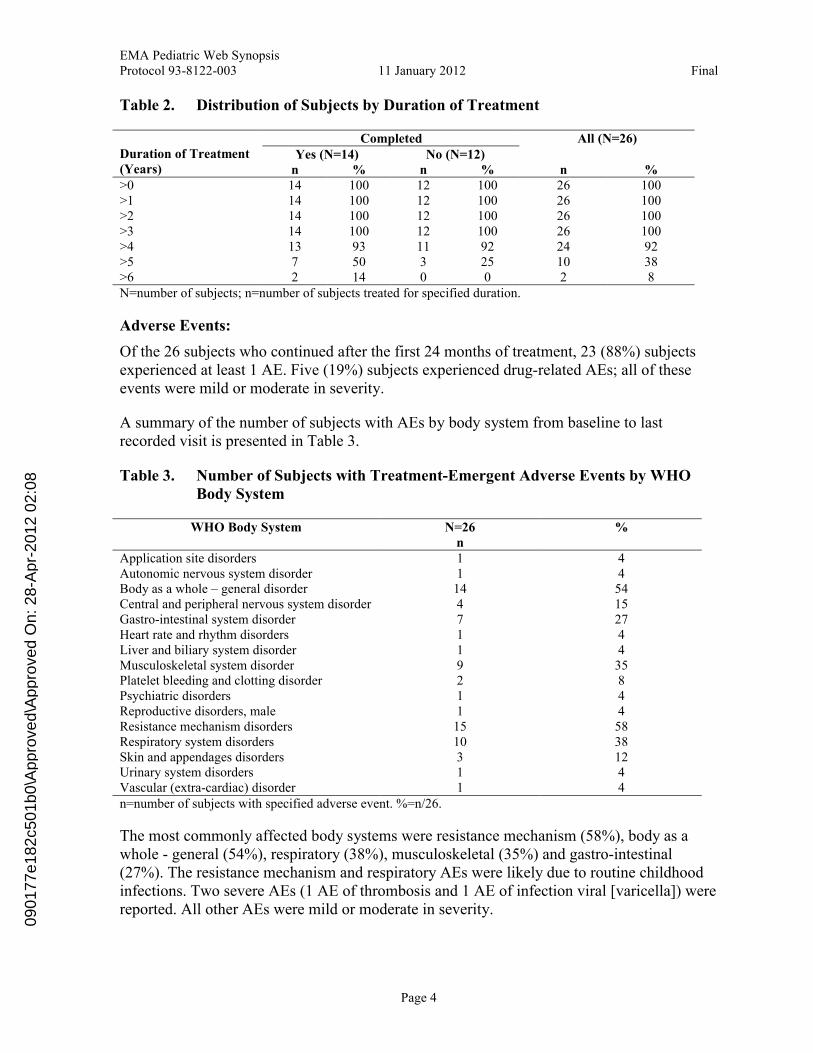
The distribution of subjects by duration of treatment is presented in Table 2. All 26 subjects were treated with somatropin at a dose of 0.067 mg/kg/day for 3.4 to 6.8 years. The majority of subjects (24/26) were treated for 4 years or more. Overall, the treatment compliance was high.
0901
77e1
82c5
01b0
\App
rove
d\A
ppro
ved
On:
28-
Apr
-201
2 02
:08
EMA Pediatric Web SynopsisProtocol 93-8122-003 11 January 2012 Final
Page 4
Table 2. Distribution of Subjects by Duration of Treatment
CompletedYes (N=14) No (N=12)
All (N=26)Duration of Treatment (Years) n % n % n %>0 14 100 12 100 26 100>1 14 100 12 100 26 100>2 14 100 12 100 26 100>3 14 100 12 100 26 100>4 13 93 11 92 24 92>5 7 50 3 25 10 38>6 2 14 0 0 2 8N=number of subjects; n=number of subjects treated for specified duration.
Adverse Events:
Of the 26 subjects who continued after the first 24 months of treatment, 23 (88%) subjects experienced at least 1 AE. Five (19%) subjects experienced drug-related AEs; all of these events were mild or moderate in severity.
A summary of the number of subjects with AEs by body system from baseline to last recorded visit is presented in Table 3.
Table 3. Number of Subjects with Treatment-Emergent Adverse Events by WHO Body System
WHO Body System N=26n
%
Application site disorders 1 4Autonomic nervous system disorder 1 4Body as a whole – general disorder 14 54Central and peripheral nervous system disorder 4 15Gastro-intestinal system disorder 7 27Heart rate and rhythm disorders 1 4Liver and biliary system disorder 1 4Musculoskeletal system disorder 9 35Platelet bleeding and clotting disorder 2 8Psychiatric disorders 1 4Reproductive disorders, male 1 4Resistance mechanism disorders 15 58Respiratory system disorders 10 38Skin and appendages disorders 3 12Urinary system disorders 1 4Vascular (extra-cardiac) disorder 1 4n=number of subjects with specified adverse event. %=n/26.
The most commonly affected body systems were resistance mechanism (58%), body as a whole - general (54%), respiratory (38%), musculoskeletal (35%) and gastro-intestinal (27%). The resistance mechanism and respiratory AEs were likely due to routine childhood infections. Two severe AEs (1 AE of thrombosis and 1 AE of infection viral [varicella]) were reported. All other AEs were mild or moderate in severity.
0901
77e1
82c5
01b0
\App
rove
d\A
ppro
ved
On:
28-
Apr
-201
2 02
:08
EMA Pediatric Web SynopsisProtocol 93-8122-003 11 January 2012 Final
Page 5
Overall, the number of AEs reported during the treatment period for the original protocol (Years 1 and 2) was similar to the number of AEs reported each year during the extension of the trial (after Year 2).
Five (19%) subjects experienced 10 drug-related AEs. All of these events were mild ormoderate in severity. The most common drug-related AEs were in the central and peripheral nervous system (3 subjects had a total of 3 AEs of headache and 1 AE of hyperkinesia) and in the musculo-skeletal body system (1 subject reported 3 AEs of tendinitis of which 1 was an SAE. One subject reported a drug-related AE of aggressive reaction, which was moderate in intensity and had not resolved on the last day of AE collection.
Discontinuation due to Adverse Events:
One subject was discontinued due to a clinically significant change in IGF-1.
Deaths: There were no deaths in the study.
Serious Adverse Events:
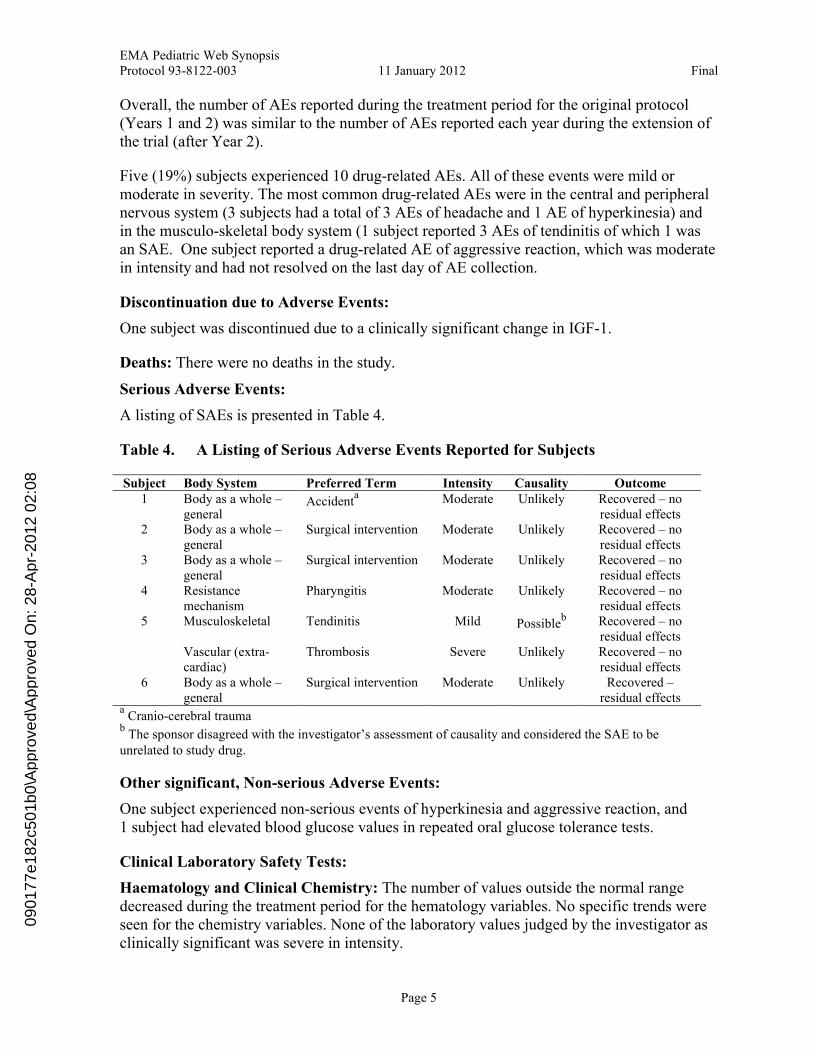
A listing of SAEs is presented in Table 4.
Table 4. A Listing of Serious Adverse Events Reported for Subjects
Subject Body System Preferred Term Intensity Causality Outcome1 Body as a whole –
generalAccident
a Moderate Unlikely Recovered – no residual effects
2 Body as a whole –general
Surgical intervention Moderate Unlikely Recovered – no residual effects
3 Body as a whole –general
Surgical intervention Moderate Unlikely Recovered – no residual effects
4 Resistance mechanism
Pharyngitis Moderate Unlikely Recovered – no residual effects
Musculoskeletal Tendinitis Mild Possibleb Recovered – no
residual effects5
Vascular (extra-cardiac)
Thrombosis Severe Unlikely Recovered – no residual effects
6 Body as a whole –general
Surgical intervention Moderate Unlikely Recovered –residual effects
aCranio-cerebral trauma
bThe sponsor disagreed with the investigator’s assessment of causality and considered the SAE to be
unrelated to study drug.
Other significant, Non-serious Adverse Events:
One subject experienced non-serious events of hyperkinesia and aggressive reaction, and 1 subject had elevated blood glucose values in repeated oral glucose tolerance tests.
Clinical Laboratory Safety Tests:
Haematology and Clinical Chemistry: The number of values outside the normal range decreased during the treatment period for the hematology variables. No specific trends were seen for the chemistry variables. None of the laboratory values judged by the investigator as clinically significant was severe in intensity.
0901
77e1
82c5
01b0
\App
rove
d\A
ppro
ved
On:
28-
Apr
-201
2 02
:08
EMA Pediatric Web SynopsisProtocol 93-8122-003 11 January 2012 Final
Page 6
Urinalysis: Only a few of the changes were reported as clinically significant.
IGF-1 and IGFBP-3: One subject was discontinued due to increased levels of IGF-1. One subject at each of Month 24 (N=5) and last examination (N=2) had IGF-1 values above the normal range compared to no subjects at baseline (N=24). Four subjects at Month 24 (N=5) and 1 subject at last examination (N=2) had IGFBP-3 values above the normal range compared to 4 subjects at baseline (N=24). No IGF-1 and IGFBP-3 values were below the normal range at Month 24 and at last examination.
Vital Signs: Mean systolic pressure increased from 106.5 mm Hg at baseline to 109.1 mm Hg at Month 24 and 113.5 mm Hg at last examination, while mean diastolic pressure was almost unchanged, 67.8 mm Hg, 65.3 mm Hg and 66.0 mmHg from baseline to Month 24 and last examination, respectively.
Efficacy Results:
Primary Efficacy Endpoint - PAH SDS (or Height SDS):
Change in PAH SDS is the same endpoint as change in height SDS. Parental height was missing for 4 subjects; therefore PAH SDS could only be calculated for 22 subjects, but change in PAH SDS could be calculated for all 26 subjects.
Of the 26 subjects, 10 had a HV >2 cm/year at their last visits (8 subjects with HV >3 cm/year, 4 subjects >4 cm/year, 2 subjects >5 cm/year). Since there was likely to be a further improvement of the height in these subjects, final height SDS for adult age probably underestimated the ultimate final height SDS and final height SDS for subject’s age wasprobably a better predictor of the ultimate final height SDS.
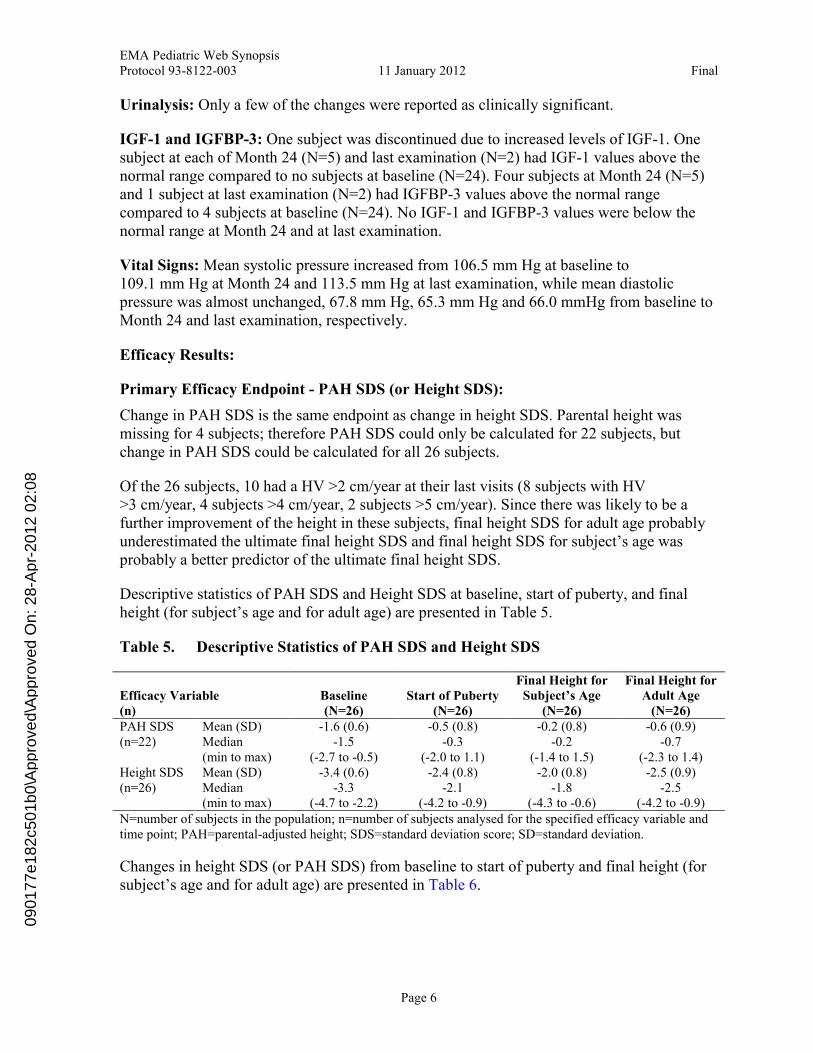
Descriptive statistics of PAH SDS and Height SDS at baseline, start of puberty, and final height (for subject’s age and for adult age) are presented in Table 5.
Table 5. Descriptive Statistics of PAH SDS and Height SDS
Efficacy Variable(n)
Baseline(N=26)
Start of Puberty(N=26)
Final Height for Subject’s Age
(N=26)
Final Height for Adult Age
(N=26)Mean (SD) -1.6 (0.6) -0.5 (0.8) -0.2 (0.8) -0.6 (0.9)PAH SDS
(n=22) Median (min to max)
-1.5(-2.7 to -0.5)
-0.3(-2.0 to 1.1)
-0.2(-1.4 to 1.5)
-0.7(-2.3 to 1.4)
Mean (SD) -3.4 (0.6) -2.4 (0.8) -2.0 (0.8) -2.5 (0.9)Height SDS(n=26) Median
(min to max)-3.3
(-4.7 to -2.2) -2.1
(-4.2 to -0.9)-1.8
(-4.3 to -0.6)-2.5
(-4.2 to -0.9)N=number of subjects in the population; n=number of subjects analysed for the specified efficacy variable and time point; PAH=parental-adjusted height; SDS=standard deviation score; SD=standard deviation.
Changes in height SDS (or PAH SDS) from baseline to start of puberty and final height (for subject’s age and for adult age) are presented in Table 6.
0901
77e1
82c5
01b0
\App
rove
d\A
ppro
ved
On:
28-
Apr
-201
2 02
:08
EMA Pediatric Web SynopsisProtocol 93-8122-003 11 January 2012 Final
Page 7
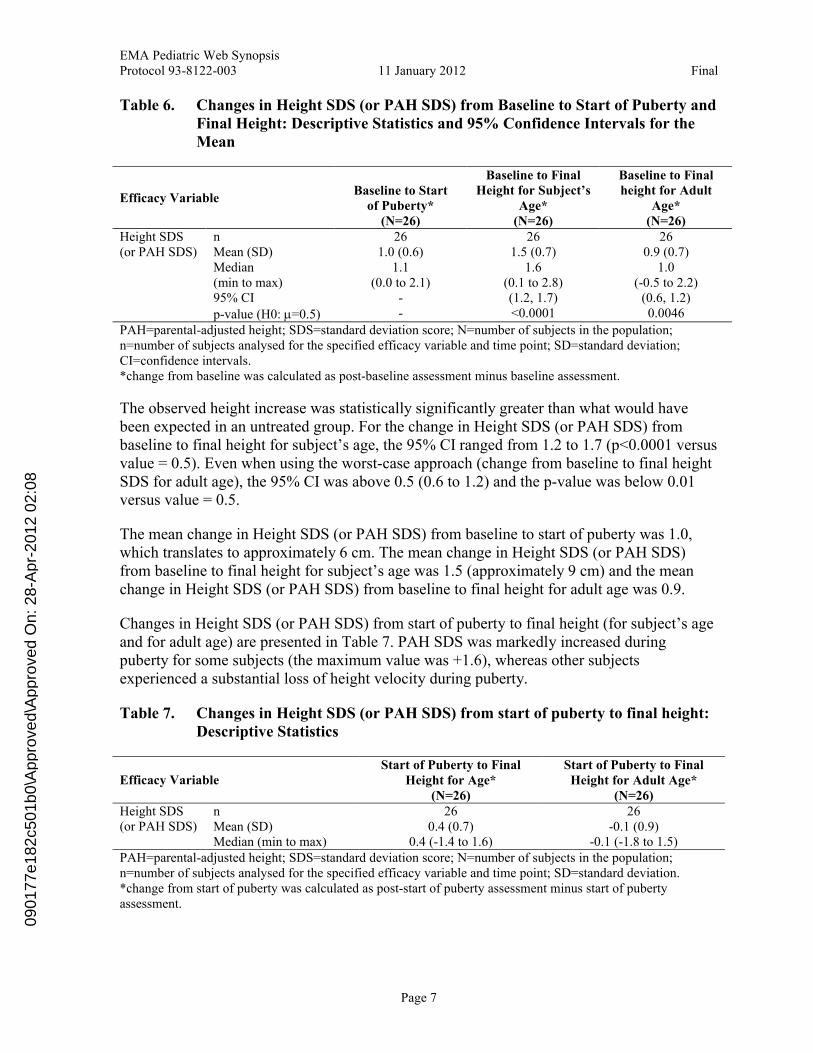
Table 6. Changes in Height SDS (or PAH SDS) from Baseline to Start of Puberty and Final Height: Descriptive Statistics and 95% Confidence Intervals for the Mean
Efficacy VariableBaseline to Start
of Puberty*(N=26)
Baseline to Final Height for Subject’s
Age*(N=26)
Baseline to Final height for Adult
Age*(N=26)
n 26 26 26Mean (SD) 1.0 (0.6) 1.5 (0.7) 0.9 (0.7)Median (min to max)
1.1 (0.0 to 2.1)
1.6(0.1 to 2.8)
1.0(-0.5 to 2.2)
95% CI - (1.2, 1.7) (0.6, 1.2)
Height SDS (or PAH SDS)
p-value (H0: =0.5) - <0.0001 0.0046
PAH=parental-adjusted height; SDS=standard deviation score; N=number of subjects in the population;n=number of subjects analysed for the specified efficacy variable and time point; SD=standard deviation; CI=confidence intervals.*change from baseline was calculated as post-baseline assessment minus baseline assessment.
The observed height increase was statistically significantly greater than what would have been expected in an untreated group. For the change in Height SDS (or PAH SDS) from baseline to final height for subject’s age, the 95% CI ranged from 1.2 to 1.7 (p<0.0001 versus value = 0.5). Even when using the worst-case approach (change from baseline to final height SDS for adult age), the 95% CI was above 0.5 (0.6 to 1.2) and the p-value was below 0.01 versus value = 0.5.
The mean change in Height SDS (or PAH SDS) from baseline to start of puberty was 1.0, which translates to approximately 6 cm. The mean change in Height SDS (or PAH SDS) from baseline to final height for subject’s age was 1.5 (approximately 9 cm) and the mean change in Height SDS (or PAH SDS) from baseline to final height for adult age was 0.9.
Changes in Height SDS (or PAH SDS) from start of puberty to final height (for subject’s age and for adult age) are presented in Table 7. PAH SDS was markedly increased during puberty for some subjects (the maximum value was +1.6), whereas other subjectsexperienced a substantial loss of height velocity during puberty.
Table 7. Changes in Height SDS (or PAH SDS) from start of puberty to final height: Descriptive Statistics
Efficacy VariableStart of Puberty to Final
Height for Age*(N=26)
Start of Puberty to Final Height for Adult Age*
(N=26)n 26 26Mean (SD) 0.4 (0.7) -0.1 (0.9)
Height SDS (or PAH SDS)
Median (min to max) 0.4 (-1.4 to 1.6) -0.1 (-1.8 to 1.5)PAH=parental-adjusted height; SDS=standard deviation score; N=number of subjects in the population; n=number of subjects analysed for the specified efficacy variable and time point; SD=standard deviation. *change from start of puberty was calculated as post-start of puberty assessment minus start of puberty assessment.
0901
77e1
82c5
01b0
\App
rove
d\A
ppro
ved
On:
28-
Apr
-201
2 02
:08
EMA Pediatric Web SynopsisProtocol 93-8122-003 11 January 2012 Final
Page 8
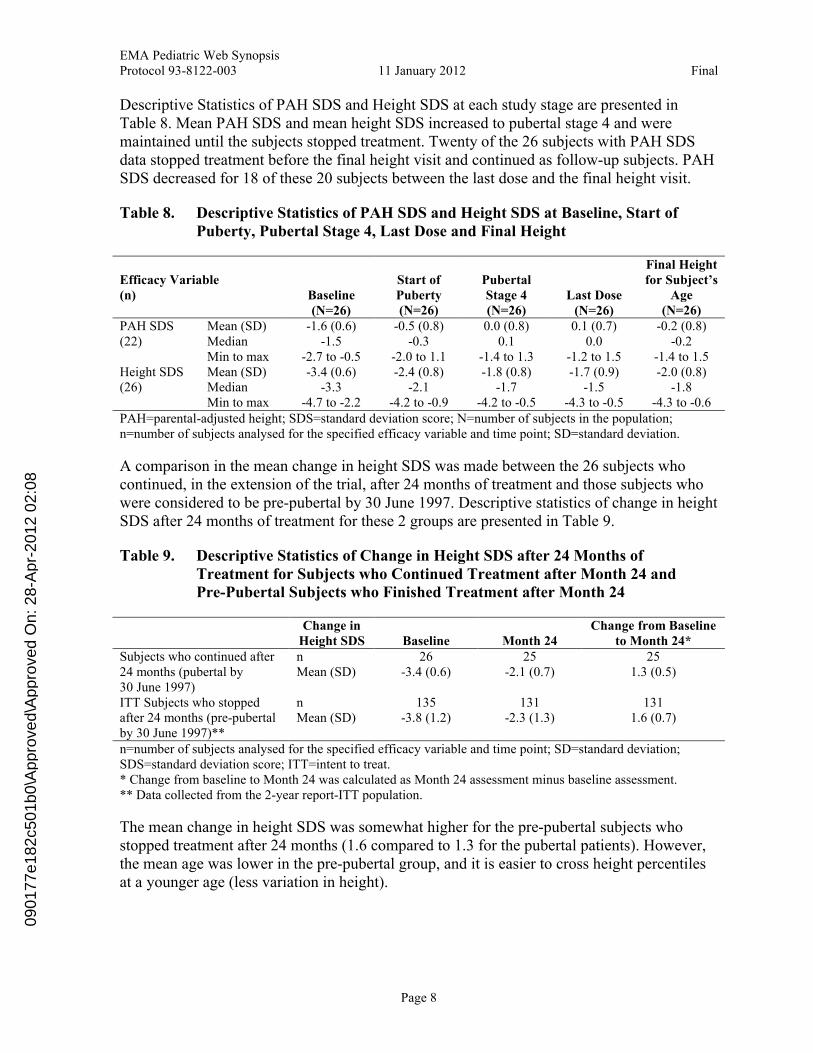
Descriptive Statistics of PAH SDS and Height SDS at each study stage are presented in Table 8. Mean PAH SDS and mean height SDS increased to pubertal stage 4 and were maintained until the subjects stopped treatment. Twenty of the 26 subjects with PAH SDS data stopped treatment before the final height visit and continued as follow-up subjects. PAH SDS decreased for 18 of these 20 subjects between the last dose and the final height visit.
Table 8. Descriptive Statistics of PAH SDS and Height SDS at Baseline, Start of Puberty, Pubertal Stage 4, Last Dose and Final Height
Efficacy Variable(n) Baseline
(N=26)
Start of Puberty(N=26)
Pubertal Stage 4 (N=26)
Last Dose(N=26)
Final Height for Subject’s
Age(N=26)
Mean (SD) -1.6 (0.6) -0.5 (0.8) 0.0 (0.8) 0.1 (0.7) -0.2 (0.8)Median -1.5 -0.3 0.1 0.0 -0.2
PAH SDS(22)
Min to max -2.7 to -0.5 -2.0 to 1.1 -1.4 to 1.3 -1.2 to 1.5 -1.4 to 1.5Mean (SD) -3.4 (0.6) -2.4 (0.8) -1.8 (0.8) -1.7 (0.9) -2.0 (0.8)Median -3.3 -2.1 -1.7 -1.5 -1.8
Height SDS(26)
Min to max -4.7 to -2.2 -4.2 to -0.9 -4.2 to -0.5 -4.3 to -0.5 -4.3 to -0.6PAH=parental-adjusted height; SDS=standard deviation score; N=number of subjects in the population; n=number of subjects analysed for the specified efficacy variable and time point; SD=standard deviation.
A comparison in the mean change in height SDS was made between the 26 subjects who continued, in the extension of the trial, after 24 months of treatment and those subjects who were considered to be pre-pubertal by 30 June 1997. Descriptive statistics of change in height SDS after 24 months of treatment for these 2 groups are presented in Table 9.
Table 9. Descriptive Statistics of Change in Height SDS after 24 Months of Treatment for Subjects who Continued Treatment after Month 24 andPre-Pubertal Subjects who Finished Treatment after Month 24
Change in Height SDS Baseline Month 24
Change from Baseline to Month 24*
n 26 25 25Subjects who continued after 24 months (pubertal by 30 June 1997)
Mean (SD) -3.4 (0.6) -2.1 (0.7) 1.3 (0.5)
n 135 131 131ITT Subjects who stopped after 24 months (pre-pubertal by 30 June 1997)**
Mean (SD) -3.8 (1.2) -2.3 (1.3) 1.6 (0.7)
n=number of subjects analysed for the specified efficacy variable and time point; SD=standard deviation; SDS=standard deviation score; ITT=intent to treat.* Change from baseline to Month 24 was calculated as Month 24 assessment minus baseline assessment.** Data collected from the 2-year report-ITT population.
The mean change in height SDS was somewhat higher for the pre-pubertal subjects who stopped treatment after 24 months (1.6 compared to 1.3 for the pubertal patients). However, the mean age was lower in the pre-pubertal group, and it is easier to cross height percentiles at a younger age (less variation in height).
0901
77e1
82c5
01b0
\App
rove
d\A
ppro
ved
On:
28-
Apr
-201
2 02
:08
EMA Pediatric Web SynopsisProtocol 93-8122-003 11 January 2012 Final
Page 9
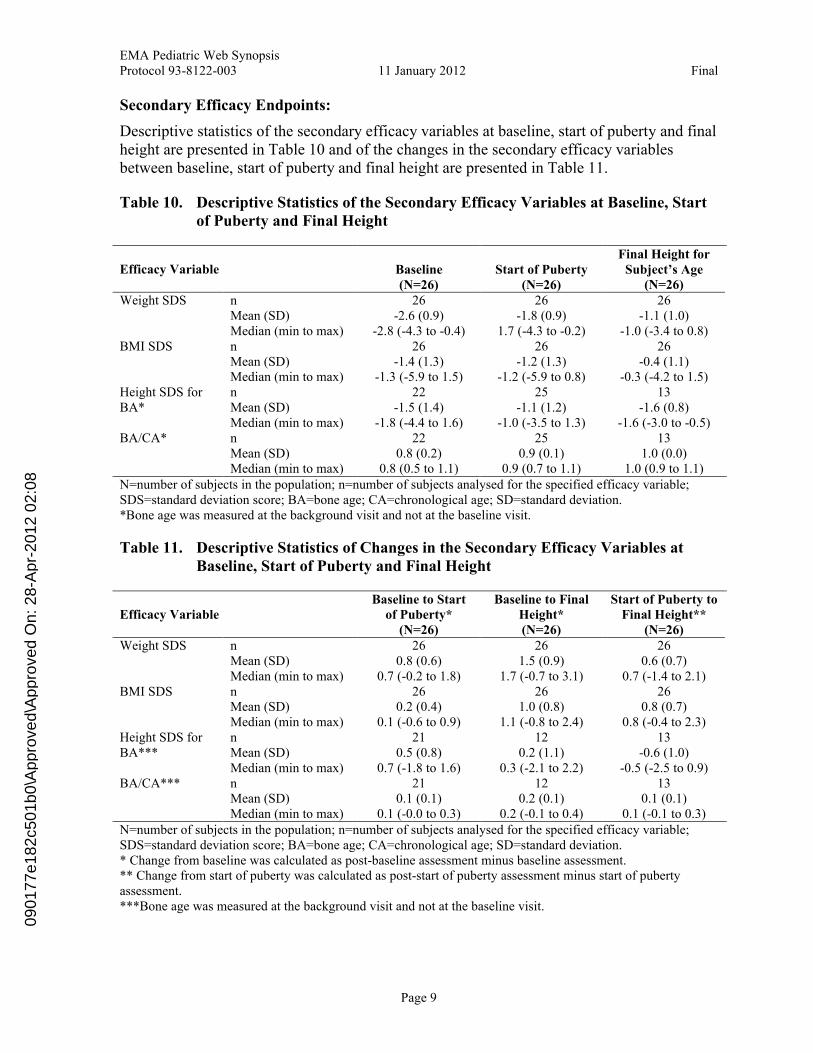
Secondary Efficacy Endpoints:
Descriptive statistics of the secondary efficacy variables at baseline, start of puberty and final height are presented in Table 10 and of the changes in the secondary efficacy variables between baseline, start of puberty and final height are presented in Table 11.
Table 10. Descriptive Statistics of the Secondary Efficacy Variables at Baseline, Start of Puberty and Final Height
Efficacy Variable Baseline(N=26)
Start of Puberty (N=26)
Final Height for Subject’s Age
(N=26)n 26 26 26Mean (SD) -2.6 (0.9) -1.8 (0.9) -1.1 (1.0)
Weight SDS
Median (min to max) -2.8 (-4.3 to -0.4) 1.7 (-4.3 to -0.2) -1.0 (-3.4 to 0.8)n 26 26 26Mean (SD) -1.4 (1.3) -1.2 (1.3) -0.4 (1.1)
BMI SDS
Median (min to max) -1.3 (-5.9 to 1.5) -1.2 (-5.9 to 0.8) -0.3 (-4.2 to 1.5)n 22 25 13Mean (SD) -1.5 (1.4) -1.1 (1.2) -1.6 (0.8)
Height SDS for BA*
Median (min to max) -1.8 (-4.4 to 1.6) -1.0 (-3.5 to 1.3) -1.6 (-3.0 to -0.5)n 22 25 13Mean (SD) 0.8 (0.2) 0.9 (0.1) 1.0 (0.0)
BA/CA*
Median (min to max) 0.8 (0.5 to 1.1) 0.9 (0.7 to 1.1) 1.0 (0.9 to 1.1)N=number of subjects in the population; n=number of subjects analysed for the specified efficacy variable; SDS=standard deviation score; BA=bone age; CA=chronological age; SD=standard deviation.*Bone age was measured at the background visit and not at the baseline visit.
Table 11. Descriptive Statistics of Changes in the Secondary Efficacy Variables at Baseline, Start of Puberty and Final Height
Efficacy VariableBaseline to Start
of Puberty*(N=26)
Baseline to Final Height* (N=26)
Start of Puberty to Final Height**
(N=26)n 26 26 26Mean (SD) 0.8 (0.6) 1.5 (0.9) 0.6 (0.7)
Weight SDS
Median (min to max) 0.7 (-0.2 to 1.8) 1.7 (-0.7 to 3.1) 0.7 (-1.4 to 2.1)n 26 26 26Mean (SD) 0.2 (0.4) 1.0 (0.8) 0.8 (0.7)
BMI SDS
Median (min to max) 0.1 (-0.6 to 0.9) 1.1 (-0.8 to 2.4) 0.8 (-0.4 to 2.3)n 21 12 13Mean (SD) 0.5 (0.8) 0.2 (1.1) -0.6 (1.0)
Height SDS for BA***
Median (min to max) 0.7 (-1.8 to 1.6) 0.3 (-2.1 to 2.2) -0.5 (-2.5 to 0.9)n 21 12 13Mean (SD) 0.1 (0.1) 0.2 (0.1) 0.1 (0.1)
BA/CA***
Median (min to max) 0.1 (-0.0 to 0.3) 0.2 (-0.1 to 0.4) 0.1 (-0.1 to 0.3)N=number of subjects in the population; n=number of subjects analysed for the specified efficacy variable; SDS=standard deviation score; BA=bone age; CA=chronological age; SD=standard deviation.* Change from baseline was calculated as post-baseline assessment minus baseline assessment.** Change from start of puberty was calculated as post-start of puberty assessment minus start of puberty assessment. ***Bone age was measured at the background visit and not at the baseline visit.
0901
77e1
82c5
01b0
\App
rove
d\A
ppro
ved
On:
28-
Apr
-201
2 02
:08
EMA Pediatric Web SynopsisProtocol 93-8122-003 11 January 2012 Final
Page 10
Mean weight SDS increased from −2.6 at baseline to −1.8 at the start of puberty and −1.1 atfinal height, but was still below normal. Mean BMI SDS was almost unchanged frombaseline to start of puberty, but increased from −1.4 at baseline to −0.4 at final height and was by then almost normalised.
The BA/CA ratio increased from 0.8 at baseline to 1.0 at final height. Because of the delay inBA at baseline, mean height SDS for BA increased only from −1.5 at baseline to −1.1 at
Month 24, and at final height the mean value had decreased to −1.4. This pattern was also seen in other SGA studies.
CONCLUSIONS: Somatropin, administered at a dose of 0.067 mg/kg/day for 3-7 years, was safe and well
tolerated.
Data from the 26 subjects in this report support the long-term benefits of somatropin therapy for short children born SGA. The observed increase in height, assessed as PAH SDS and height SDS, was statistically significantly greater than what would have beenexpected in an untreated group. Final height was normalised for their genetic potential for the majority of subjects.
0901
77e1
82c5
01b0
\App
rove
d\A
ppro
ved
On:
28-
Apr
-201
2 02
:08