Embed Size (px)
Citation preview

1615 L Street, N.W., Suite 700 Washington, D.C. 20036 Tel (202) 419-4350 Fax (202) 419-4399 www.pewglobal.org
EMBARGOED FOR RELEASE: THURSDAY, JUNE 12, 2008, 2:00 PM EDT Some Positive Signs for U.S. Image GLOBAL ECONOMIC GLOOM – CHINA AND INDIA NOTABLE EXCEPTIONS 24-Nation Pew Global Attitudes Survey FOR FURTHER INFORMATION CONTACT: Andrew Kohut, President Richard Wike, Associate Director Erin Carriere-Kretschmer, Senior Researcher Juliana Menasce Horowitz, Research Associate Kathleen Holzwart, Research Analyst (202) 419-4350 www.pewglobal.org


June 12, 2008
TABLE OF CONTENTS
Page Overview: Global Economic Gloom – China and India Notable Exceptions…………….1 About the Project .................................................................................................................11 Roadmap to the Report ........................................................................................................12
Chapter 1: Views on Economic Issues .............................................................................13
Chapter 2: Views of the U.S .............................................................................................21
Chapter 3: Views of China ...............................................................................................35
Chapter 4: Views of Asian Powers...................................................................................47
Chapter 5: Issues in Russia and Europe............................................................................51
Chapter 6: Views of Iran...................................................................................................57
Chapter 7: Which Governments Respect the Rights of Their People?.............................61
Chapter 8: Environmental Issues ......................................................................................65
Survey Methods ...................................................................................................................69
Survey Topline.....................................................................................................................77 Copyright © 2008 Pew Research Center www.pewresearch.org


Some Positive Signs for U.S. Image GLOBAL ECONOMIC GLOOM – CHINA AND INDIA NOTABLE EXCEPTIONS
ive years after the start of the war in Iraq, the image of the United States abroad remains far less positive than it was before the war and at the beginning of the century. However, the latest survey by the Pew Global Attitudes Project finds some encouraging signs for
America’s global image for the first time this decade. F
Favorable views of the United States have increased modestly since 2007 in 10 of 21
countries where comparative data are available. Perhaps more importantly, the polling finds many people around the world paying close attention to the U.S. presidential election. Moreover – except in countries that are extremely anti-American – those who are paying attention generally believe the next president may well change U.S. foreign policy for the better. In nearly every country surveyed, greater numbers express confidence in presidential candidate Barack Obama than in John McCain.
However, the survey of more than 24,000
people in 24 countries, conducted March 17 to April 21, finds another change in global opinion that could present a formidable challenge to the United States in the future. Around the world, people have a new concern: slumping economic conditions. And they have a familiar complaint – most think the U.S. is having a considerable influence on their economy, and it is largely seen as a negative one.
Majorities in 18 of the 24 countries
surveyed describe current economic conditions in their country as bad. Assessments have worsened over the past year among countries surveyed in both this year and 2007. The median percentage rating their national economy as bad rose from 50% in 2007 to 61% in the current poll. The proportion
Changing Views of National Economies
Number of countries Good Bad where economy 6 18 currently is seen as: Where “good” 2007 2008 Change ratings plummeted % % Britain 69 30 -39 U.S. 50 20 -30 Spain 65 35 -30 Turkey 46 21 -25 Argentina 45 23 -22 Pakistan 59 41 -18
Where “good” ratings prevail China 82 82 0 Australia n/a 69 -- India 74 62 -12 Germany 63 53 -10 Poland 36 52 +16 Russia 38 52 +14
Percent saying nation’s economic situation is very or somewhat good.

of respondents expressing a positive view of their nation’s economy has declined in 14 of the 22 countries since last year.
The publics of two emerging Asian superpowers – China and India – remain upbeat about
national economic conditions, though Indians are less positive than they were a year ago. In contrast, some of the most negative evaluations of economic conditions come from citizens of advanced Western countries. Positive views of the economy have declined sharply over the past year in Great Britain, the United States and Spain. France, where most people were already quite negative about the economy, registered a further decline; in the current survey, just 19% of the French view the national economy as good, down from 30% in 2007.
While American and Chinese publics
are at opposite poles with the respect to opinions about their national economies, the new Global Attitudes survey finds growing symmetry in the way that the United States and China are viewed by people all around the world. Overall, favorable ratings of the two countries are fairly comparable as China’s image has slipped a bit and the U.S. image, if anything, has improved slightly. Both the United States and China are widely viewed as taking a unilateralist approach in their relations with other nations, while at the same time both are seen as having considerable influence on other countries. And as global warming is of increasing importance to the citizens of the world, both the U.S, and China are criticized for the way they deal with environmental problems.
Blaming the United States
Large majorities in countries ranging from economically advanced Great Britain and Germany to developing nations such as Egypt and Indonesia say that what happens in the American economy affects economic conditions in their own countries. With only a few exceptions, the American economy is now seen as having a negative impact on national economies, both large and small, in all parts of the world.
U.S. Economic Influence
7272717070
6356
504949
4545
4141
37333130
2524
191818
121212
411
2210
410
201516
2029
2117
86
4127
3119
36
101112
1913
2633
3624
353134
2731
3946
2725
4027
4938
12
BritainGermany Australia
TurkeyFranceJapanSpain
ArgentinaEgypt
MexicoJordanBrazil
LebanonS. Korea
IndonesiaTanzania
RussiaPakistan
IndiaPoland
S. AfricaChina
Nigeria
Negative Positive No influence/Mixed*
*Includes those who say U.S. has not much or no
nfluence, and those who say the influence is neither
positive nor negative.
i
Samples in Brazil, China, India and Pakistan are
disproportionately urban. See the Methods section for
more information.
2

The view that the American economy is hurting their national economies is most prevalent among the publics of Western Europe. About seven-in-ten in Great Britain, Germany (72% each) and France (70%) say that the U.S. economy is having a negative impact on economic conditions in their country. India and Nigeria are the only nations surveyed where more than a third of respondents express a positive view of America’s economic influence.
U.S. Favorability Edges Up
Despite these economic concerns, there is little evidence that the overall image of the United States has slipped further as a consequence. In fact, positive views of the United States have risen sharply in Tanzania (by 19 points) and South Korea (12 points), and by smaller but significant margins in Indonesia, China, India and Poland. Overall, opinions of the United States are most positive in South Korea, Poland, India and in the three African countries surveyed this year – Tanzania, Nigeria and South Africa.
However, positive opinions of the United States have
declined by 11 points in Japan – a traditional U.S. ally – and in neighboring Mexico (by nine points). The image of the United States also remains overwhelmingly negative in most of the predominantly Muslim countries surveyed, though no more so than in recent years.
Fewer than a quarter of respondents express positive
opinions of the United States in Egypt (22%), Jordan (19%), Pakistan (19%) and Turkey (12%). Large majorities in Turkey and Pakistan say they think of the United States as “more of an enemy” rather than as “more of a friend” (70% in Turkey; 60% in Pakistan). In Lebanon, 80% of Shia Muslims consider the United States to be more of an enemy.
Favorable Views of the U.S.
2007 2008 Change % % France 39 42 +3 Britain 51 53 +2 Germany 30 31 +1 Spain 34 33 -1
Poland 61 68 +7 Russia 41 46 +5
Turkey 9 12 +3
Lebanon 47 51 +4 Egypt 21 22 +1 Jordan 20 19 -1
S. Korea 58 70 +12 Indonesia 29 37 +8 India 59 66 +7 China 34 41 +7 Pakistan 15 19 +4 Japan 61 50 -11
Argentina 16 22 +6 Brazil 44 47 +3 Mexico 56 47 -9
Tanzania 46 65 +19 Nigeria 70 64 -6
As in recent years, favorable views of the United States remain fairly low among the
publics of a number of its traditional Western European allies. Solid majorities continue to express unfavorable opinions of the U.S. in France, Germany and Spain. Great Britain is the only country – of four Western European nations surveyed – where a majority (53%) expresses a positive view of the U.S.
3

Next American President The survey also finds a widespread belief that U.S. foreign policy “will change for the
better” after the inauguration of a new American president next year. Among people who have been following the election, large majorities in France (68%), Spain (67%) and Germany (64%) say that they believe that U.S. foreign policy will improve after the election. This sentiment is also common in the African countries included in the survey – Nigeria (67%), South Africa (66%) and Tanzania (65%).
Yet this belief is far from universal. In Jordan and Egypt, more people who are following
the election say they expect new leadership to change U.S. foreign policy for the worse than say they expect a change for the better. Two-thirds of the Japanese (67%) who are following the election say it will not bring about much change in U.S. foreign policy. That is the plurality opinion in Russia and Turkey as well.
There is considerable interest in the presidential campaign in the surveyed countries. A large majority of Japanese say they are following the election very closely (24%) or somewhat closely (59%). As a point of comparison, a third of Americans are following the election very closely, with another 47% saying they are tracking the campaign
More Have Confidence in Obama than McCain
59
84848281
777472
58
5356
5248
393636
3433
31
2220
10
60
3350
3340
1935
3037
1732
2231
282528
231923
30
65
4440
U.S.
FranceTanzania
GermanyAustralia
JapanBritain
SpainBrazil
S. KoreaPoland
IndonesiaNigeriaRussia China
S. AfricaLebanon
IndiaEgypt
MexicoJordanTurkey
Pakistan
Obama McCain
Based on respondents who say th
following the U.S. presidential elec
somewhat closely.
somewhat
the
Pakistan
closely.
ampaign, Mexico (33%) and Spain (25%).
where few people have confidence in either candidate.
At least half or more of respondents in such countries as Germany, Australia, Great Britain and Jordan are closely following the election. There is less interest in the election in many other countries, including France, where 40% are focusing onc
People around the world who have been paying attention to the American election express more confidence in Barack Obama than in John McCain to do the right thing regarding world affairs. McCain is rated lower than Obama in every country surveyed, except for the United States where his rating matches Obama’s, as well as in Jordan and
ey have been
tion very or
4

Obama’s advantage over McCain is overwhelming in the Western European countries surveyed: Fully 84% of the French who have been following the election say they have confidence in Obama to do the right thing regarding world affairs, compared with 33% who say that about McCain. The differences in ratings for Obama and McCain are about as large in Spain and Germany, and are only somewhat narrower in Great Britain.
China Under the Microscope
With global attention focused on China in anticipation of the Beijing Olympics, people around the world express considerable concern about Chinese policies and the impact that China is having on their own countries and lives. China is faulted for a unilateral approach in its dealings with other countries and for not respecting human rights at home. And it is increasingly seen as hurting the global environment at a time when concerns about global warming run very high and have increased in
many countries.
favorably upon China’s burgeoning economic impact and influence.
29% to 14%). Favorable ratings of China are highest in Nigeria, Pakistan, Tanzania and Russia.
Holding the Olympics in China: Good Decision or Bad Decision?
The verdict is more mixed with regard to
China’s growing economic power and the impact it is having on the well being of other nations. China is a consistent worry to the publics of most Western nations, as well as to the South Koreans, but the publics of other Asian nations, including the Japanese, Indonesians and Pakistanis generally see increasing Chinese economic power as a good thing. And the publics of African nations, in particular Nigeria and Tanzania, are most likely to look
99
169
131922321228
3438473039
39
5519
7978
7675
67676358565554525050
4541413931
7
4
4
55
43
76
4545
72
NigeriaTanzania
IndiaBrazil
Indonesia Argentina
RussiaMexico
S. KoreaAustraliaS. AfricaLebanonPakistan
JordanBritain
GermanyEgyptSpain
FrancePoland U.S.Japan
Turkey
Bad Good
Overall the current survey, which was conducted at a time when China was coming under
harsh criticism for its crackdown on political dissent in Tibet, once again finds favorable ratings of China slipping in many countries. Positive views fell significantly in nine of 21 countries in which polls were taken in 2007, as well as in the current survey. Opinions of China tumbled the most in France (47% to 28%) and in Japan (
5

Despite growing anti-Chinese sentiment, people in most countries surveyed approve of the decision to hold the Olym jorities favor the idea. Dissenters are most prevalen nd the U.S. (43%).
nations that have strong economic ties to China, including Nigeria (79%), Argentina (72%), Mexico
of the two nations. The survey found the view of the U.S. than China, which was
view of China. (In three countries, publics had an equally favorable view of the U.S. and China.)
ermans rate bo the U.S. and the American people more positive
ntries in the formulation of international policies. Criticisms of Chines
in their country. This view is especially prevalent among Asian publics, as well as those of leading
pics in Beijing. In 14 of 23 countries, clear mat in Japan (55%), France (55%), Germany (47%) a
Advocates of the Olympics decision are most often found in neighboring Asian nations
India, Indonesia, Pakistan and South Korea. But many people in African and Latin American
(67%) and Brazil (76%), are also overwhelmingly enthusiastic about the decision. The new survey finds that global views of China and the U.S. are parallel in many
respects. First, there is parity in the worldwide imagespublics of nine countries holding a more favorable matched by 10 countries where there is a more favorable How Much Influence the U.S.
and China Are Having
8888
8464
7159
79
8986
9393
8573
7059
817473
7564
55
5455
6140
42
31
2432
26
8686
7264
6041
6237
59
7063
37
92
41
BritainGermany
FranceSpain
PolandRussia
Turkey
LebanonJordanEgypt
Japan S. KoreaAustralia
India Indonesia
Pakistan
MexicoArgentina
Brazil
NigeriaS. AfricaTanzania
In Asia, the U.S. is much better rated than
China by the Indians and the South Koreans. But, the Chinese image far outshines the U.S. image among Indonesians, Pakistanis and Russians. In Western Europe, the British, French, and G
ChinaU.S.
thly than they do China and the Chinese
people. As with the United States, people around the
world are critical of China for not taking into account the interests of other cou
e unilateralism are particularly prevalent in neighboring Japan and South Korea.
Also paralleling opinion of the United
States, many people around the world think that China has a direct bearing on how things are going
Percent saying _____ is having a great deal or fair
amount of influence on their country.
6
Western powers: Fully 86% of Japanese respondents think that China has a significant amount of influence on the way things are going in their country, a view shared by 76% of the American public. Somewhat smaller majorities in France, Germany and Great Britain concur.
However, large majorities of the publics of two of the three African nations included in
the survey are also of the view that China has an impact on their respective countries – 70% of Nigerians and 63% of South Africans believe that China has a bearing on the course of their nations. But, for the most part, African publics, unlike most people in other parts of the world, think that China’s influence is positive. For example, 85% of Nigerians who think China is having an influence on their country believe its impact is a good one, while only 22% of the British hold the same view. Human Rights Concerns
One continuing advantage for the U.S. over China is that large majorities of people in most countries are critical of China for not respecting the personal freedoms of its people. By contrast, for the most part, the U.S. is seen as mindful of the rights of its citizens. Overwhelming numbers of people in Western countries are critical of China in this regard, rating it as negatively as Iran in terms of respect for human rights. Only in Nigeria, Pakistan, Tanzania and Indonesia do most people think well of China’s concern for personal freedoms.
Closer to the lives of people all around the world, respondents in most countries say they think that products made in China are less safe than products made in other countries. Majorities of respondents in 18 of 24 countries expressed concerns about Chinese exports.
Yet, for all the criticisms of China with respect to how it operates both at home and abroad, there is little public alarm. China is not seen as an enemy by the vast majority of people in the countries surveyed. Even in Japan where views about China are highly unfavorable, only 23% of respondents describe China as an enemy. Indeed, China is more often thought of as a partner in Africa – majorities in Nigeria (78%), Tanzania (74%) and South Africa (53%) express this view. Additional Findings
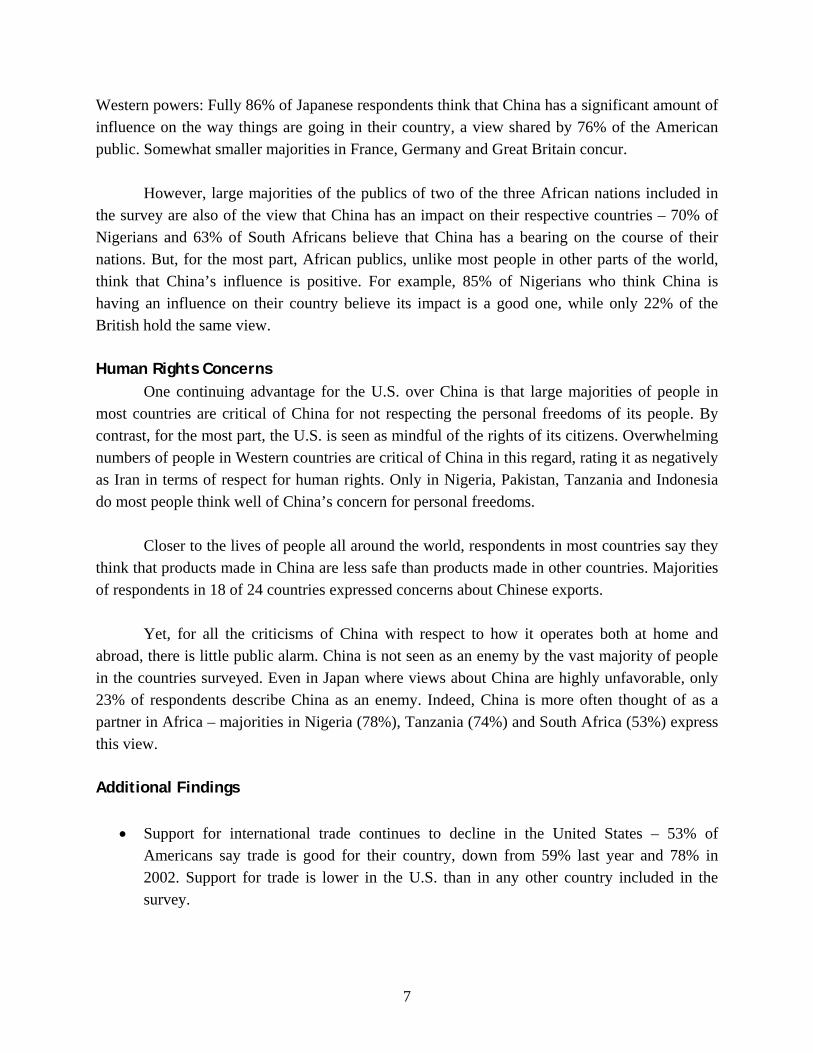
• Support for international trade continues to decline in the United States – 53% of Americans say trade is good for their country, down from 59% last year and 78% in 2002. Support for trade is lower in the U.S. than in any other country included in the survey.
7
• The survey finds little optimism about the likelihood of success in Iraq. Americans are much less optimistic than they were two years ago – 40% now say efforts to establish a stable democratic Iraqi government will succeed, down from 54% in 2006. However, optimism has increased slightly in both Egypt (32% in 2006, 41% now) and Jordan (34% in 2006, 41% now).
• Majorities or pluralities in 21 of 24 countries want the U.S. and NATO to remove their
troops from Afghanistan as soon as possible. However, public opinion in the U.S., Great Britain and Australia – all of which have a military presence in Afghanistan – leans toward keeping troops there until the situation has stabilized.
• In 22 of 24 countries, the U.S. is most commonly identified as the world’s leading
economic power. Pluralities in Germany and Australia, however, name China.
• Western European publics are more likely than China’s Asian neighbors to believe China will ultimately replace the United States as the world’s leading superpower. Most Chinese think their country either has already supplanted the U.S. (5%) or will eventually do so (53%).
• Asian publics generally have favorable views of both Japan and India, although neither
country fares so well among its traditional rivals. Only 21% of Chinese have a positive opinion of Japan and just 27% of Pakistanis hold a favorable view of India.
• As he nears the end of his second term, U.S. President George W. Bush continues to
receive negative reviews from international publics. In 14 of 24 countries, two-thirds or more of respondents express little or no confidence in him to do the right thing in world affairs.
• In the U.S., just 37% voice confidence in Bush, that compares to 78% in May 2003, just
months after the beginning of the Iraq war.
• Views of French President Nicholas Sarkozy are mixed, both inside and outside Europe. Among the French themselves, 51% have a lot or some confidence in their president to do the right thing in foreign policy, while 49% have little or no confidence. However, the French hold decidedly positive views of Angela Merkel – 84% have confidence in the German Chancellor. This is similar to 2006, when the French held Merkel in much higher regard than Sarkozy’s predecessor Jacques Chirac.
8

• Merkel also receives high marks from her fellow Germans – 76% have confidence in her. Of the three European leaders assessed on the survey – Merkel, Sarkozy and Russia’s Vladimir Putin – Merkel generally receives the highest ratings from global publics.
• The U.S. is blamed more often than any other country for harming the world’s
environment, although concerns about China’s environmental record are on the rise as well – the view that China is most to blame is up significantly in 13 of 20 countries.
9

10

About the Pew Global Attitudes Project
The Pew Global Attitudes Project is a series of worldwide public opinion surveys encompassing a broad array of subjects ranging from people’s assessments of their own lives to their views about the current state of the world and important issues of the day. The project is directed by Andrew Kohut, president of the Pew Research Center, a nonpartisan “fact tank” in Washington, DC, that provides information on the issues, attitudes, and trends shaping America and the world. The Pew Global Attitudes Project is principally funded by The Pew Charitable Trusts.
Since its inception in 2001, the Pew Global Attitudes Project has released 21 major reports, as well as numerous commentaries and other releases, on topics including attitudes toward the U.S. and American foreign policy, globalization, terrorism, and democratization.
Findings from the project are also analyzed in America Against the World: How We Are Different and Why We Are Disliked by Andrew Kohut and Bruce Stokes, international economics columnist at the National Journal. A paperback edition of the book was released in May 2007.
Pew Global Attitudes Project team members include Bruce Stokes; Mary McIntosh, president of Princeton Survey Research Associates International; and Wendy Sherman, principal at The Albright Group LLC. Contributors to the report and to the Pew Global Attitudes Project include Richard Wike, Erin Carriere-Kretschmer, Kathleen Holzwart, Juliana Menasce Horowitz, Jodie T. Allen, Elizabeth Mueller Gross, Carroll Doherty, Michael Dimock, and others of the Pew Research Center. The International Herald Tribune is the project’s international newspaper partner. For this survey, the Pew Global Attitudes Project team consulted with survey and policy experts, regional and academic experts, journalists, and policymakers. Their expertise provided tremendous guidance in shaping the survey.
Pew Global Attitudes Project Public Opinion Surveys
Survey Sample Interviews
Summer 2002 44 Nations 38,263
November 2002 6 Nations 6,056
March 2003 9 Nations 5,520
May 2003 21 Publics* 15,948
March 2004 9 Nations 7,765
May 2005 17 Nations 17,766
Spring 2006 15 Nations 16,710
Spring 2007 47 Publics* 45,239
Spring 2008 24 Nations 24,717
* Includes the Palestinian territories.
The Pew Global Attitudes Project’s co-chairs are on leave through 2008. The project is co-chaired by former U.S. Secretary of State Madeleine K. Albright, currently principal, the Albright Group LLC, and by former Senator John C. Danforth, currently partner, Bryan Cave LLP.
Following each release, the project also produces a series of in-depth analyses on specific topics covered in the survey, which will be found at www.pewglobal.org. The data are also made available on our website within two years of publication.
For further information, please contact: Richard Wike Associate Director Pew Global Attitudes Project 202.419.4400 / [email protected]
11

Roadmap to the Report The first chapter examines global publics’ views on economic issues, including assessments of their national economic conditions and personal financial situations, as well as opinions about trade and foreign ownership of companies. The next chapter explores international attitudes toward the United States, including views on American foreign policy, the impact of the American economy on other countries, and the U.S. presidential race. The third chapter focuses on international opinions regarding China, such as how publics perceive Chinese foreign policy, how they feel about the upcoming Beijing Olympics, and how they rate the safety of Chinese products. Chapter 4 looks at perceptions other Asian powers. Chapter 5 explores views of major European leaders, as well as other key issues in Europe and Russia. Chapter 6 examines international perceptions of Iran, especially Muslim publics’ views of Iran, its leader, and its nuclear program. Chapter 7 looks at opinions about whether various governments around the world respect the rights of their people. Finally, Chapter 8 examines attitudes toward global warming and the impact major countries have on the world’s environment. A summary of the survey’s methodology, followed by complete topline results, can be found at the end of the report.
12

1. VIEWS ON ECONOMIC ISSUES n the midst of rapidly evolving global economic conditions – notably including a U.S. economic slowdown – people around the world are largely dissatisfied with the way things are going in their country and with their nation’s economic conditions: Majorities in most
countries rate their national economic situation as bad and believe things will either worsen or stay the same over the next year. China and India are exceptions to these trends; publics in China and India are largely happy with their current economic situation and are very optimistic about their economic future.
I Despite the negative views of current conditions, many feel that their personal economic
situation is good and retain faith in a key component of globalization – international trade. Still, publics worldwide are uncomfortable with the idea of foreigners buying companies in their country. Dissatisfaction with Country Direction
Majorities in 18 of 24 countries surveyed worldwide are dissatisfied with the way things are going in their country. Some publics are clearly more dissatisfied than others; in Lebanon, dissatisfaction is nearly universal (92% dissatisfied) while smaller but still clear majorities are dissatisfied in India (58%) and Egypt (57%
Way Things are Going in Survey Country
9283817575747371706868676565636258574747434331
14
21242325292330303130343436
4249505461
11
6
86
13
4041
LebanonArgentina
S. KoreaTurkeyNigeria
Japan
PakistanFrance
U.S.Indonesia
MexicoBrazil
BritainTanzania
GermanyS. Africa
IndiaEgypt
PolandJordan
SpainRussia
AustraliaChina
Dissatisfied Satisfied
). Dissatisfaction with the general direction of
one’s country is not new; Pew trend data shows it typically dominates the public mood in most countries. But, since 2007, dissatisfaction has increased dramatically in a number of countries, most notably Argentina; 83% of Argentines are currently dissatisfied, up from 54% in 2007.
Running counter to global opinion about
national conditions, the vast majority of Chinese (86%) surveyed feel satisfied with their country’s direction. Roughly six-in-ten Australians (61%) are also satisfied while the Spanish and Russians are slightly more satisfied than not.
13

Positive gains in the public mood have
been realized in the past year in seven of the 22 countries surveyed. In a few countries, dissatisfaction levels have decreased substantially (Poland, Brazil, Russia, and Nigeria). Most striking is the case of Poland: In 2007, three-in-four Poles were dissatisfied; by 2008, fewer than half were.
nd just as many are dissatisfied in 2008.
Growin
econom c conditions are bad; far more than just one year ago.
nd just over nine-in-ten in South Korea (92%) s y their national economic conditions are bad.
in their country; more than three-quarters in each country view their country’s economy as bad.
Dissatisfaction with Country Direction 2002 2003 2004 2005 2006 2007 2008
% % % % % % % U.S. 55 -- 55 57 65 71 70
France 67 56 68 71 80 78 71 Britain 64 49 58 51 58 66 65
ermany 66 73 78 73 67 66 63 GSpain -- 52 -- 44 46 45 43
87 -- -- 82 -- 74 47 Poland Russia 71 64 69 71 62 56 43
Turkey 93 79 58 55 56 58 75
Lebanon 92 84 -- 59 -- 92 92 -- -- -- -- 42 51 57 Egypt
Jordan 78 56 30 30 44 42 47
S. Korea 81 73 -- -- -- 86 81 Japan 86 -- -- -- 72 71 74 Pakistan 39 67 41 39 58 57 73 Indonesia 92 85 -- 64 73 77 68 India 91 -- -- 57 67 56 58
-- 28 -- -- -- -- 31 AustraliaChina 33 -- -- 19 13 12 11
Argentina 96 -- -- -- -- 54 83 exico 79 -- -- -- -- 66 68 M
Brazil 88 77 -- -- -- 82 67
Nigeria 86 80 -- -- 93 87 75 55 -- -- -- -- 52 65 Tanzania
S. Africa 79 -- -- -- -- -- 62
More modest improvements in the
public mood have taken place in Indonesia, France and South Korea. No change in views occurred in the United States over the same time period; seven-in-ten were dissatisfied in 2007 a
g Concern for National Economy
Publics are not only dissatisfied with their country’s direction, but they are also concerned about their national economy: In three-quarters of the countries Pew surveyed (18), a majority now say that their national
dissatisfied with
lable trends shown.
Percent in each country saying they are the way things are going in our country today. Countries with avai
i In eight of the countries surveyed, large majorities (roughly three-quarters or more) say
that their current national economic situation is bad. No publics are more negative than South Korea and Lebanon; nine-in-ten in Lebanon (90%) a
a The French and Japanese are only a bit less downbeat about the state of their economies;
more than eight-in-ten French (81%) and Japanese (85%) feel that their economies are in bad shape. Americans and Indonesians are equally negative about the state of economic affairs
Not all publics view their national economic situation negatively. In fact, one-quarter of
the countries surveyed view their country’s economy positively; many of these publics live in
14

countries that have been experiencing strong economic growth. For example, in China, which has enjoyed high rates
Current Economic Situation
929085817977747467626260605957565451464342382814
19202023213036354139413941
535252626982
710
4448
13
S. KoreaLebanon
JapanFrance
IndonesiaU.S.
Argentina
TurkeyBritainMexico
SpainNigeria
JordanBrazil
S. AfricaPakistan
Egypt
TanzaniaGermany
RussiaPoland
India
AustraliaChina
Bad Good of growth in recent years, a large
majority (82%) say their national economic situation is good
their economies. Smaller majorities in Poland (52%), Russia (52%) and Ge
cs surveyed in both years, fewer view their national economic situation as good than did so a year a
from being in the majority (roughly two-thirds) to in the minority (roughly one-third) in just one
id. Less dramatic, but still substantial, drops in upbeat opinion
. Solid majorities in Australia (69%) and India
(62%) also hold positive views of
rmany (53%) say the same. Overall, though, publics worldwide are more
concerned in 2008 than in 2007 about their national economic conditions. Among more than half (14) of the 22 publi
go. In fact, in several countries, the declines in
positive views represent reversals in opinion from positive overall to negative overall; in both Britain and Spain, positive views of the national economic condition went
Growing Economic Concerns
’07-‘08 Where good 2002 2007 2008 Change ratings fell… % % % Britain 65 69 30 -39 U.S. 46 50 20 -30 Spain -- 65 35 -30 Turkey 14 46 21 -25 Argentina 1 45 23 -22 Pakistan 49 59 41 -18 Japan 6 28 13 -15 Mexico 31 51 36 -15 India 39 74 62 -12 France 45 30 19 -11 Germany 27 63 53 -10
Where they improved… Poland 7 36 52 +16 Russia 13 38 52 +14 Brazil 14 30 41 +11
year. In several other countries the decline in
“good” ratings marked a change from views being split or slightly “bad” overall, to overwhelmingly “bad.” In 2007, in the U.S., Turkey and Argentina, roughly half of those surveyed described the national economy as good; in 2008, only about one-fifth d
s occurred in Pakistan, Mexico and Japan. While not as substantial, increases in positive
views of one’s national economy have occurred among a few publics (Poland, Russia and Brazil). For Poland and Russia, the increases represent a change
15

from views being negative to positive overall. In 2007, slightly more than one-third in both Poland and Russia held positive views of the national economy; in 2008, slightly more than half do so. In Brazil, the share of the public holding a positive view of the economy has increased
om three-in-ten (30%) to about four-in-ten (41%).
Mixed
mthat it will remain the same.
worsen (China 2%, Brazil 9%, Nigeria 13%).
national economic futures (India, Pakistan, South A
ies. More than half in both Britain (55%) and Turkey (55%) anticipate that economic conditions will worsen
hose surveyed in Lebanon and Egypt are pessimistic about the future of their national economies, along with pluralities in Japan, France, Jordan, Spain, Australia, the U.S. and Argentina.
fr
Views on Economic Future While many of the publics surveyed
hold negative views of their current national economic situation and many are more negative than just one year ago, optimism about the economic future is not absent – in nine countries, majorities or pluralities think their nation’s economy will improve over the next 12 months. In 11 countries, majorities or pluralities say the economy will worsen, and in four countries the most com on response is
When asked to consider the future
economic situation in their countries, a strong majority of Chinese (85%), Brazilians (71%) and Nigerians (71%) say that they expect it to improve a lot or a little. Few in any of these three countries expect that conditions will
Majorities or pluralities in a number of
other countries are also optimistic about their
frica, Russia, Tanzania and Mexico). The situation is substantially more pessimistic, however, in a number of countr
in the next 12 months; few in either country (14%) expect things to get better. Half of t
Future Economic Situati
5555
5050484646434039
33292928
242321
16161313129
22
3330
2429
2139
194242
3527
1813
3944
189
5371
85
on
2817
3547
3434
1414
2415
51919
1828
3430
4432
412733
4255
4237
71
BritainTurkey
LebanonEgyptJapan
FranceJordan
SpainAustralia
U.S.Argentina
S. Africa
GermanyTanzaniaIndonesia
S. KoreaMexico
IndiaPakistan
NigeriaRussiaPoland
Brazil
Worsen Remain the same Improve
2China
16

Positive Views of Personal Economic Situation While publics worldwide hold largely
negative views of their national economic situations, views about personal financial situations are generally more positive.
s good.
o
ic situations are good.
Majorities in 13 of the countries surveyed say
that their personal economic situation is good, while majorities in only nine nations rate their situation as bad.
The most positive ratings are found in two
countries where views of the national economy are also positive: India and Australia. Eight-in-ten or more in India (84%) and Australia (80%) rate their personal economic situation a
Positive views of personal economic
situations are also common in China, the country where assessments of the national economy are the most upbeat. Two-thirds (66%) of Chinese describe their personal economic situation as go d.
However, views about national and personal
economic circumstances do not always correspond, especially in wealthier Western nations, where people tend to rate their personal situations more positively than their nation’s. Roughly seven-in-ten or more in the U.S. (71%), Britain (72%), France (68%) and Spain (68%) – countries with high negative ratings of their national economic conditions – say that their personal econom
Personal Economic Sit
16192625
2829323132343338
3946525249545461
67676872
8480
71
7068686766666362
60504847
4037
31313126
72
4446
India
Australia
Britain
U.S.
Pakistan
Spain
France
Germany
China
Brazil
Poland
Nigeria
Mexico
Argentina
Indonesia
Tanzania
Russia
S. Africa
Turkey
Japan
Lebanon
S. Korea
Jordan
Egypt
uation
Bad Good
Positive assessments are much less common in the Middle East: relatively few in Egypt
(26%), Jordan (31%), Lebanon (31%) or Turkey (40%) say their current situation is good. Poor ratings are also prevalent in the two wealthiest Asian nations included in the survey – only 31% of South Koreans and 37% of Japanese hold positive views of their personal economic situation.
17

Positive Views of International Trade Majorities in all 24 nations surveyed say
increasing trade and economic integration is a good thing for their countries. In fact, enthusiasm for trade is pervasive in a number of countries and not just in nations such as China, where there is widespread satisfaction with the economy. By contrast, of the countries surveyed, the U.S. is the least supportive of trade.
ood.”
Mexico, Jordan, Turkey, Argentina and the United States.
thusiasm for trade, most notably mong the U.S. public.
While enthusiasm for trade is broad based,
some publics are more convinced of its value than others. For example, an overwhelming majority of Nigerians (91%) say increased trade ties are either “very good” or “somewhat good,” with six-in-ten (59%) saying “very.” Large percentages of other publics also feel strongly about such ties; more than four-in-ten in Pakistan, South Africa, India, Tanzania and Lebanon say increased trade is “very g
There have been few large shifts in views about international trade over the last year. Still, some publics have grown slightly more supportive of trade, including Poland, Spain, Brazil and Nigeria, while a few have become slightly less supportive, including
Growing Trade Ties Between Countries are…for Cou
5944
21
1930
193541
1943
3028
144846
2819
1521
3424
12
2215 53
Nigeria
India
Spain
S. Korea
Germany
China
Australia
Lebanon
Poland
Tanzania
France
Russia
Brazil
Pakistan
S. Africa
Britain
Indonesia
Japan
Mexico
Turkey
Jordan
Argentina
Egypt
U.S.
ntry
91
89
8887878685
85838281
80787877
71
7169
6765
62
57
90
Very goodSomewhat good
Net
While views of trade ties have fluctuated some
between 2002 and 2008, the period is marked more by decreases than increases in en
Enthusiasm for Trade Ties
Trade good for your country
2007 2008 Change Decreased % % Mexico 77 69 -8 Jordan 72 65 -7 Turkey 73 67 -6 Argentina 68 62 -6 U.S. 59 53 -6
Increased Poland 77 85 +8 Brazil 72 80 +8 Spain 82 89 +7 Nigeria 85 91 +6
a
18
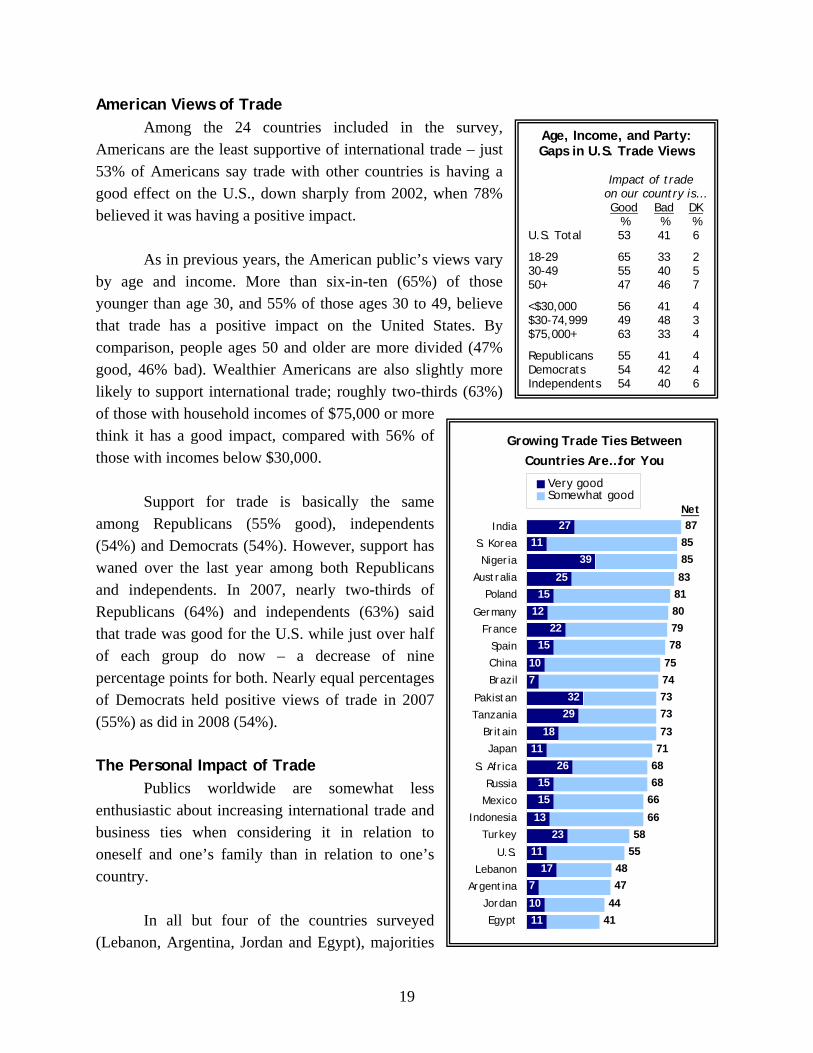
American Views of Trade Among the 24 countries included in the survey,
Americans are the least supportive of international trade – just 53% of Americans say trade with other countries is having a good effect on the U.S., down sharply from 2002, when 78% believed it was having a positive impact.
Age, Income, and Party: Gaps in U.S. Trade Views
Impact of trade on our country is… Good Bad DK % % % U.S. Total 53 41 6
18-29 65 33 2 30-49 55 40 5 50+ 47 46 7
<$30,000 56 41 4 $30-74,999 49 48 3 $75,000+ 63 33 4
Republicans 55 41 4 Democrats 54 42 4 Independents 54 40 6
As in previous years, the American public’s views vary
by age and income. More than six-in-ten (65%) of those younger than age 30, and 55% of those ages 30 to 49, believe that trade has a positive impact on the United States. By comparison, people ages 50 and older are more divided (47% good, 46% bad). Wealthier Americans are also slightly more likely to support international trade; roughly two-thirds (63%) of those with household incomes of $75,000 or more think it has a good impact, compared with 56% of those with incomes below $30,000.
Growing Trade Ties Between Countries Are…for You
2711
39
2515
1222
15
107
3229
1811
261515
1323
1117
7
1011
87
85
8381807978
75747373
7371
6868
66
6658
554847
4441
85India
S. Korea
Nigeria
Australia
Poland
Germany
France
Spain
China
Brazil
Pakistan
Tanzania
Britain
Japan
S. Africa
Russia
Mexico
Indonesia
Turkey
U.S.
Lebanon
Argentina
Jordan
Egypt
Very goodSomewhat good
NetSupport for trade is basically the same among Republicans (55% good), independents (54%) and Democrats (54%). However, support has waned over the last year among both Republicans and independents. In 2007, nearly two-thirds of Republicans (64%) and independents (63%) said that trade was good for the U.S. while just over half of each group do now – a decrease of nine percentage points for both. Nearly equal percentages of Democrats held positive views of trade in 2007 (55%) as did in 2008 (54%).
The Personal Impact of Trade
Publics worldwide are somewhat less enthusiastic about increasing international trade and business ties when considering it in relation to oneself and one’s family than in relation to one’s country.
In all but four of the countries surveyed
(Lebanon, Argentina, Jordan and Egypt), majorities
19

say that increasing economic and trade ties between their country and other countries are good for themselves and their family. In fact, more than three-quarters of the publics view increasing trade ties as being positive for themselves and their families.
Enthusiasm for trade in relation to its impact on families is not, however, as fervent.
Fewer among all of the publics feel that the personal impact of international trade is “very good.”
Opposition to Foreign Ownership Overall, publics worldwide are skeptical of
the value of foreigners buying domestically owned companies: Half or more in 18 of the 24 countries surveyed say that it is bad when foreigners buy domestically-owned companies. In several countries, this negative sentiment is particularly pervasive; seven-in-ten or more in Germany (78%), Turkey (76%), Argentina (71%) and Egypt (70%) say that foreign buying of domestic companies is bad.
Views Toward ForeiBuying Domestic Com
787671706967676767666563595856565654494743423938
Germany
TurkeyArgentina
EgyptJapan
U.S.Australia
TanzaniaFrance
IndonesiaRussia
JordanS. Korea
ChinaPoland
LebanonBrazil
NigeriaBritain
MexicoPakistan
S. AfricaSpain
India
Some publics are conflicted; publics in
Pakistan, Britain and Mexico are closely or evenly divided on the merit of foreign ownership of domestic companies.
gners panies
2016
27272530323328293338313739
434837525059
21
4240
Bad Good
Positive views of foreign ownership are less
pervasive but they do prevail in three countries: Half or more among the publics in India, Spain and South Africa say foreign buying of domestic companies is a good thing.
20
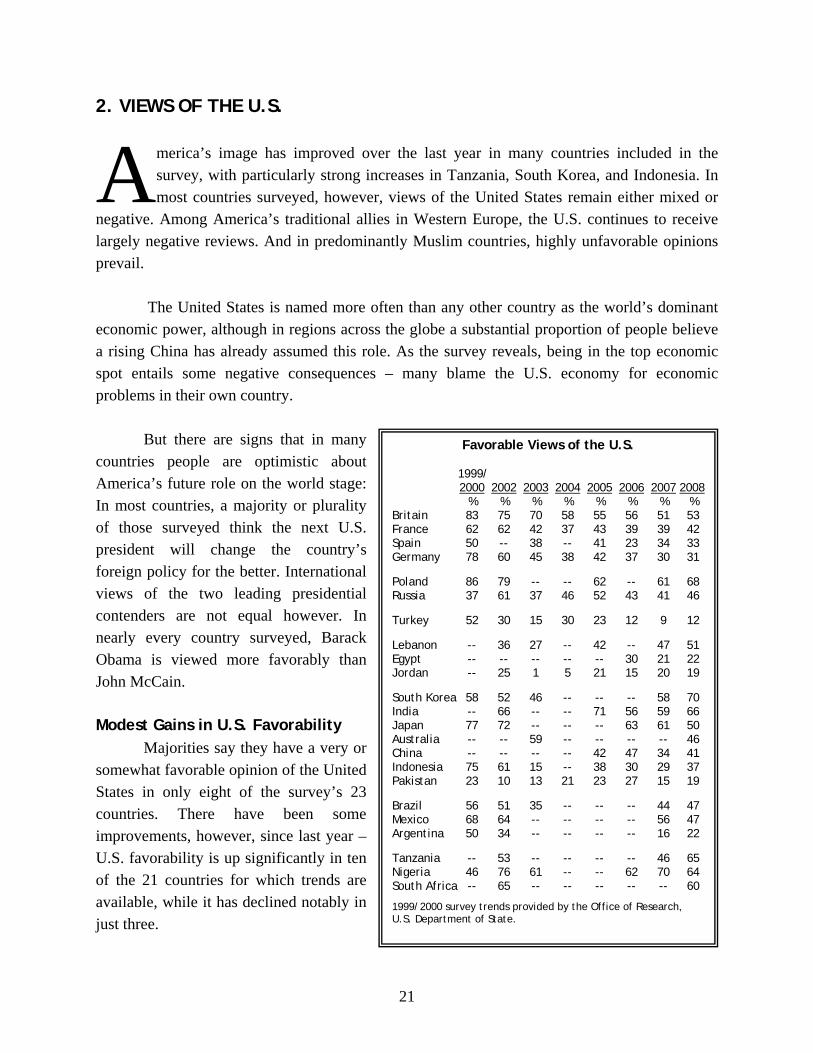
2. VIEWS OF THE U.S.
merica’s image has improved over the last year in many countries included in the survey, with particularly strong increases in Tanzania, South Korea, and Indonesia. In most countries surveyed, however, views of the United States remain either mixed or
negative. Among America’s traditional allies in Western Europe, the U.S. continues to receive largely negative reviews. And in predominantly Muslim countries, highly unfavorable opinions prevail.
A The United States is named more often than any other country as the world’s dominant
economic power, although in regions across the globe a substantial proportion of people believe a rising China has already assumed this role. As the survey reveals, being in the top economic spot entails some negative consequences – many blame the U.S. economy for economic problems in their own country. But there are signs that in many countries people are optimistic about America’s future role on the world stage: In most countries, a majority or plurality of those surveyed think the next U.S. president will change the country’s foreign policy for the better. International views of the two leading presidential contenders are not equal however. In nearly every country surveyed, Barack Obama is viewed more favorably than John McCain. Modest Gains in U.S. Favorability Majorities say they have a very or somewhat favorable opinion of the United States in only eight of the survey’s 23 countries. There have been some improvements, however, since last year – U.S. favorability is up significantly in ten of the 21 countries for which trends are available, while it has declined notably in just three.
Favorable Views of the U.S. 1999/ 2000 2002 2003 2004 2005 2006 2007 2008 % % % % % % % % Britain 83 75 70 58 55 56 51 53 France 62 62 42 37 43 39 39 42 Spain 50 -- 38 -- 41 23 34 33 Germany 78 60 45 38 42 37 30 31
Poland 86 79 -- -- 62 -- 61 68 Russia 37 61 37 46 52 43 41 46
Turkey 52 30 15 30 23 12 9 12
Lebanon -- 36 27 -- 42 -- 47 51 Egypt -- -- -- -- -- 30 21 22 Jordan -- 25 1 5 21 15 20 19 South Korea 58 52 46 -- -- -- 58 70 India -- 66 -- -- 71 56 59 66 Japan 77 72 -- -- -- 63 61 50 Australia -- -- 59 -- -- -- -- 46 China -- -- -- -- 42 47 34 41 Indonesia 75 61 15 -- 38 30 29 37 Pakistan 23 10 13 21 23 27 15 19 Brazil 56 51 35 -- -- -- 44 47 Mexico 68 64 -- -- -- -- 56 47 Argentina 50 34 -- -- -- -- 16 22
Tanzania -- 53 -- -- -- -- 46 65 Nigeria 46 76 61 -- -- 62 70 64 South Africa -- 65 -- -- -- -- -- 60
1999/2000 survey trends provided by the Office of Research, U.S. Department of State.
21

There has been little change, however, in America’s image among Western Europeans. A slim majority of the British continues to hold a positive view of the U.S., while only 42% in France give the U.S. favorable marks. Views are even more negative in Spain (33% favorable) and Germany (31%).
By contrast, assessments of the U.S. have grown somewhat more positive over the last year in both of the Eastern European countries included in the survey. Polish public opinion is more favorable to the U.S. now (68%) than at any time since the 2002 Pew poll, when roughly eight-in-ten Poles (79%) had a positive view. And a slight improvement is also seen in Russia, where U.S. favorability now stands at 46%, up from 41% last year.
Although it is no longer in single digits, U.S. favorability in Turkey remains low – only 12% of Turks have a positive opinion, the lowest rating for the U.S. on the survey. Attitudes toward the U.S. also remain grim in Egypt (22% favorable) and Jordan (19%). About half of those surveyed in Lebanon (51%) hold a favorable view, although there are significant differences among the country’s three major religious groups (see below).
Views of the U.S.
282425
213324374948
444448485748
535566
62
6377
7068
6564
535150
474746464241
37
222219
19
79
75
60
3331
66
12
S. Korea
Poland
India
Tanzania
Nigeria
S. Africa
Britain
Lebanon
Japan
Brazil
Mexico
Russia
Australia
France
China
Indonesia
Spain
Germany
Egypt
Argentina
Jordan
Pakistan
Turkey
Unfavorable Favorable
Opinions are mixed in the Asian/Pacific region. America’s image has improved
significantly in both South Korea (58% favorable in 2007, 70% in 2008) and India (59% in 2007, 66% in 2008). The opposite is true, however, in Japan, where ratings have turned more negative over the last year (61% favorable in 2007, 50% in 2008). Fewer than half of Australians (46%) now have a positive opinion, down from 59% the last time Pew surveyed Australia in 2003. The U.S. receives less-positive reviews in China, Indonesia, and Pakistan, although views of America have improved in all three countries since last year. And in China, after falling by 13 percentage points between 2006 and 2007, U.S. favorability has bounced back by seven points over the last year (from 34% to 41%). Also, the percentage of Indonesians with a favorable view of the U.S. has risen by eight points (from 29% to 37%), while Pakistan recorded a more modest four-point gain.
In all three Latin American nations included in the study, fewer than half of those surveyed give the U.S. a positive rating. Views have grown more negative in Mexico over the
22

last year (56% favorable in 2007, 47% in 2008). On the other hand, there has been a slight upturn in America’s image in Argentina, though even with this improvement, only 22% see the U.S. in a favorable light.
In recent years, Pew Global Attitudes surveys have found that the U.S. is relatively
popular in much of sub-Saharan Africa, and this year’s results again suggest this is true. At least six-in-ten Tanzanians, Nigerians, and South Africans express a positive opinion. At 65%, U.S. favorability is up 19 percentage points in Tanzania since last year, the largest gain among the 21 countries for which trend data are available. In Nigeria, opinions have become slightly less positive, with U.S. favorability dropping from 70% to 64%. Differing Views in the Muslim World Overall, the U.S. evokes negative reactions among the Muslim publics included in the study. Tanzania’s Muslim population is the only one in which a majority rates the U.S. favorably – 56% hold a positive view, up from 41% in 2007. The trend has moved in the opposite direction, however, in Nigeria, where roughly half of Muslims had a positive view of the U.S. in 2007, compared with 39% this year. Nigeria’s Christians are much more favorably disposed toward the U.S. (89% favorable). In the Middle East and Asia, Muslim views tend to be negative, although Lebanese Sunnis are a clear exception – 62% see the U.S. favorably, up from 52% in 2007. Sunnis in Lebanon are almost as positive as the country’s Christian population (76% favorable). The story among Lebanese Shia, however, is quite different – 98% have a negative view. Indeed, not one Shia respondent in the Lebanese sample expresses a favorable opinion of the United States.
Muslim Views of the U.S. Favor Unfav- able able DK N % % % Tanzania 56 29 15 241 Egypt 20 75 4 937 Nigeria 39 58 3 423 Lebanon 34 65 1 619 Shia 0 98 2 268 Sunni 62 38 0 302 Indonesia 34 55 10 919 Jordan 19 79 2 968 Pakistan 17 65 18 1198 Turkey 13 76 12 984 Based on Muslim respondents.
23

American People More Popular Than U.S. The American people continue to be viewed more positively than their country. Majorities in 14 of 23 countries have a favorable opinion of Americans, including at least 70% of those surveyed in South Korea, Lebanon, Poland and Britain.
Rating the U.S. and Its
41
13
3631
4538
20
5144
24
5342
3133
46
12
511922
4650
637
4119
4747
22
6560
64
BritainFrance
GermanySpain
PolandRussia
Turkey
LebanonJordanEgypt
S. Korea Australia
JapanIndia
IndonesiaChina
Pakistan
BrazilMexico
Argentina
TanzaniaS. AfricaNigeria
People
7064
55
70
74
77666563
696462
68
70
6
57
Americans Ameri
In many countries, there are significant gaps between the favorability rating for Americans and the rating for the United States, with the American people receiving much more positive reviews. This is especially true in Western Europe. For example, while only 31% of Germans have a positive view of the U.S., 55% have a favorable opinion of Americans. Similarly, just 42% in France take a positive view of the U.S., but nearly two-thirds (64%) see the American people in a favorable light.
caFavorable views of…
But this gap is present outside of Europe as well. Australians have a much more positive view of the American people (66%) than of the country (46%). And in Lebanon there is a 23-point gap between ratings of Americans (74%) and the U.S. (51%). The difference is particularly striking among Lebanese Shia – while no Shia respondents express a favorable opinion of the U.S., 43% say they have a positive view of Americans. The gap is not present everywhere, however. In the Latin American and African countries in the survey, ratings for Americans and the U.S. tend to track each other very closely. The same is true in India, China and Turkey. Generally, the trend on views of the American people resembles the trend on attitudes toward the U.S. Over the last year, there have been notable improvements in the image of Americans in Tanzania (+17 percentage points), Poland (+7), and South Korea (+7), and significant declines in Japan (-10) and Mexico (-8). And even though Germans continue to have a much more positive view of the American people than of the U.S., their view of Americans has soured somewhat since 2007 (-8).
24

America’s Economic Power Despite the recent slowdown in the U.S. economy, the United States is most commonly identified as the world’s leading economic power in 22 of the 24 countries surveyed. This is a common perception both in countries where the U.S. is relatively popular, such as South Korea, India, and Tanzania, and in places where the U.S. is generally unpopular, including Turkey, Pakistan, and Argentina. However, in only 12 countries does a majority take this view. Even among Americans, only 46% say their country is the world’s dominant economic power; roughly one-in-four (26%) name China and substantial minorities name either Japan (10%) or the European Union (10%). Similarly, fewer than half in Britain (44%), France (44%), and Spain (42%) see the U.S. as the world’s leading economy. In Germany, the U.S. actually comes in third place – more Germans rate the EU (31%) or China (30%) as the top economic power. Russians are among the least likely to name the United States (32%), while they are more likely than any other public to name Japan (25%). Only 6% of Japanese think their country is the world’s leading economic power.
U.S. Widely Seen as World’s Leading Economic Power
Named as the world’s leading economic power Other/ U.S. China Japan EU DK % % % % % U.S. 46 26 10 10 8
Britain 44 29 8 10 10 France 44 31 10 14 1 Spain 42 24 9 20 6 Germany 25 30 11 31 3
Poland 52 15 11 13 8 Russia 32 12 25 17 13
Turkey 62 7 6 8 18
Egypt 43 27 9 12 8 Jordan 36 31 9 18 6 Lebanon 35 22 7 20 15
S. Korea 74 15 2 4 4 India 65 12 10 5 9 Indonesia 53 15 18 6 8 Pakistan 52 18 4 1 25 Japan 52 19 6 19 4 China 48 21 2 9 19 Australia 37 40 7 11 4
Mexico 59 17 8 7 9 Argentina 53 13 9 15 9 Brazil 52 15 16 8 9 Tanzania 63 9 8 9 12 Nigeria 58 23 3 6 9 S. Africa 49 14 7 7 24 Respondents were asked “Today, which one of the following do think is the world’s leading economic power – the United States, China, Japan, or the countries of the European Union?”
By a slim margin, Australians name China as the world’s leading economy (40%, compared with 37% for the U.S.). For the most part, the Chinese themselves do not place their country in the top spot – 48% name the U.S., 21% say China, and 9% say it is the EU. American economic power is widely acknowledged in the Latin American and African nations included in the survey. Majorities in Mexico, Argentina, Brazil, Tanzania and Nigeria, as well as 49% of South Africans, identify the U.S. as the world’s economic leader.
25

A Partner to Some, an Enemy to Others The way in which people characterize their country’s relationship with the United States varies considerably across regions and even within regions. Despite tensions in recent years between the U.S. and its Western European allies, majorities in three of the four countries from the region think of the U.S. as a partner of their country. The exception is Spain, where only 31% believe the U.S. is a partner, 20% consider it an enemy, and 45% say it is neither.
Is the U.S. a Partner, an Enemy, or Neither?
Partner Enemy Neither DK % % % % Britain 66 6 25 2 France 59 5 36 0 Germany 55 6 38 1 Spain 31 20 45 5 Poland 48 7 39 6 Russia 29 34 32 5 Turkey 8 70 10 12 Lebanon 23 35 39 3 Jordan 22 37 34 7 Egypt 17 39 38 6 Australia 74 2 23 1 Japan 66 4 30 1 S. Korea 51 15 34 1 India 40 13 38 9 Indonesia 23 19 51 7 China 13 34 41 12 Pakistan 11 60 13 16 Mexico 48 31 17 3 Brazil 34 21 40 5 Argentina 25 45 21 9 Nigeria 67 17 10 6 Tanzania 65 11 20 4 S. Africa 60 8 17 15
About half (48%) of Poles think of the U.S. as a partner, very few see it as an enemy (7%), and 39% say it is neither. Russians however, are divided on this question – 29% say partner, 34% enemy and 32% neither. Majorities in all three African countries included in the survey (Nigeria, Tanzania, South Africa) consider the U.S. a partner, as do most of those surveyed in Australia, Japan, and South Korea. Elsewhere in Asia, four-in-ten Indians regard the U.S. as a partner, compared with just 13% of Chinese. About one-third of Chinese (34%) say the U.S. is an enemy. Relatively few respondents in the three Arab nations included in the study see the U.S. as a partner. At the same time, less than 40% in all three countries consider the U.S. an enemy. Indeed, Argentines are more likely to see the U.S. as an enemy than are the three Arab publics. However, the most negative views of the U.S. on this question are found in Turkey (70% enemy) and Pakistan (60%).
26

U.S. Influence Strong, But Often Harmful Throughout the nations included in this survey,
people believe the U.S. has an impact on the way things are going in their own countries. In all 23 countries outside the U.S., at least half of those surveyed say the U.S. is having either a great deal or a fair amount of influence. And more than 80% take this view in a diverse set of countries: South Korea, Japan, Lebanon, Jordan, Britain, Germany, Egypt, Australia, France and Mexico.
The Chinese are the least likely to believe the U.S. has an impact on their country – just 50% say it has a great deal or fair amount of influence. Russians (59%), Pakistanis (59%) and Tanzanians (55%) also are less likely than others to see American influence. For the most part, America’s influence is seen as a negative force. Turkey, Jordan, Argentina and Britain have the most negative views of American influence. In all four nations, more than half of those surveyed believe U.S influence has a detrimental effect. But large numbers regard America’s influence as harmful elsewhere as well, including at least 40% of those surveyed in Pakistan, Mexico, Lebanon, Egypt, Germany, Australia, and Japan. America’s influence is more welcome in Nigeria and South Africa, where more than four-in-ten see American influence as a good thing. Similarly, Tanzanians and Indians take a relatively favorable attitude toward U.S. influence in their country.
U.S. Influence Widely Felt *U.S. influence is a… U.S. influences Good Bad your country thing thing % % % Germany 88 11 42 Britain 88 11 51 France 84 7 37 Spain 64 7 36
Poland 71 17 28 Russia 59 9 34
Turkey 79 3 68 Lebanon 92 31 46 Jordan 89 21 56 Egypt 86 29 45
S. Korea 93 30 37 Japan 93 16 40 Australia 85 12 40 India 73 34 25 Indonesia 70 14 31 Pakistan 59 6 49 China 50 11 27
Mexico 81 17 49 Argentina 74 4 55 Brazil 73 16 40
Nigeria 75 46 20 S. Africa 64 42 12 Tanzania 55 28 21
*% of total sample saying U.S. influence is good/bad thing. Question asked only of those who say U.S. has great deal/fair amount of influence.
Most See U.S. Hurting Their Economy Across regions, most people see a connection between the American economy and their country’s economic situation. In 21 of 23 nations, majorities say what happens in the U.S. economy has a great deal or fair amount of influence on economic conditions in their country. Interestingly, one exception is China. Despite increasing economic ties in recent years between the U.S. and this growing Asian power, only 46% of Chinese think the American economy has a serious impact on their country.
27

In nine countries, more than 80% think the U.S. economy has a great deal or fair amount of influence. This is an especially common view in Japan (95%), South Korea (94%), Australia (91%), Britain (90%) and Germany (90%). While America’s economic reach is pervasive, it also is regarded as pernicious. In Britain, Germany, France, Spain, Turkey, Japan and Australia, majorities of those surveyed say that the U.S. economy is currently having a negative effect on their economies. In no country does a majority say the U.S. economy is having a positive effect, although Nigerians, Indians and South Africans are more likely to characterize it as a positive effect than as a negative one. The Chinese are divided on this issue – 19% of those surveyed believe it has a positive effect, while another 18% say it is negative. Americans generally recognize their country’s economic influence and they also largely agree with much of the world on the nature of this influence: Overwhelmingly, they say the U.S. economy is currently having a negative impact on other countries. Nearly nine-in-ten Americans (88%) think that what happens in the U.S. economy affects economic conditions in the rest of the world a great deal or a fair amount (55% great deal, 33% fair amount). About six-in-ten Americans (61%) believe that right now the U.S. economy is having a negative impact, while just 20% believe it is positive. Few Predict Success in Iraq Previous Pew surveys have shown that much of the decline in America’s image around the world over the last several years has been driven by opposition to U.S. foreign policy, especially the war in Iraq. The current poll indicates that optimism about the future of Iraq is scant. Moreover, many publics are less optimistic now than they were two years ago.
U.S. Economic Influence U.S. economy *U.S economic influences influence is… your country Pos. Neg. % % % Britain 90 12 72 Germany 90 12 72 France 81 11 70 Spain 74 10 56
Poland 67 26 24 Russia 54 9 31
Turkey 79 4 70
Egypt 86 10 49 Lebanon 83 20 42 Jordan 82 15 45
Japan 95 22 63 S. Korea 94 29 41 Australia 91 12 71 India 73 41 25 Indonesia 66 21 37 China 46 19 18 Pakistan 41 6 30
Mexico 78 20 49 Brazil 69 16 45 Argentina 62 4 50
Nigeria 62 36 18 S. Africa 61 31 19 Tanzania 55 17 33
*% of total sample saying U.S. economic influence is positive/negative. Asked only of those who say U.S. economy has great deal/fair amount of influence.
Fewer Think Efforts in Iraq will Succeed
2006 2008 Change % % U.S. 54 40 -14 Spain 18 25 +7 Germany 33 26 -7 France 43 33 -10 Britain 52 40 -12 Russia 17 18 +1 Turkey 17 12 -5 Egypt 32 41 +9 Jordan 34 41 +7 China 19 33 +14 Pakistan 39 41 +2 Indonesia 33 34 +1 India 59 56 -3 Japan 38 24 -14 Nigeria 72 61 -11
28

Majorities in only three countries – Nigeria (61%), India (56%) and Tanzania (54%) – think efforts to establish a stable democratic Iraqi government will succeed. In seven of the 15 nations for which trends from 2006 are available, significantly fewer people now believe these efforts will succeed. The number of people who think they will succeed has increased in four countries, and there is basically no change in four.
Americans have become much more pessimistic about the situation in Iraq over the last two years. Whereas in 2006 a 54% majority thought efforts there would ultimately succeed, now only 40% hold this view. There continue to be sharp partisan differences over Iraq. About six-in-ten (61%) Republicans expect there will be a successful outcome, compared with only 38% of independents and 30% of Democrats.
Optimism about Iraq has waned in Great
Britain (-12 percentage points), France (-10), and Germany (-7), although in neighboring Spain, people are slightly more likely to think a stable democratic government will be established than they were two years ago. Still, just 25% of the Spanish public thinks these efforts will be successful.
Keep or Remove U.S. & NATO Troops in Afghanistan?
50
4643
1424
8
141630
3221373360
61219
393828
44
56545443
7265
72
807666
7269
56
4233
827570
534543
48
98
34
46
60
U.S.
SpainFrance
GermanyBritain
RussiaPoland
Turkey
EgyptJordan
Lebanon
PakistanChinaJapan
IndonesiaS.Korea
IndiaAustralia
ArgentinaMexico
Brazil
TanzaniaNigeriaS.Africa
Keep troops in AfghanistanRemove troops
It is noteworthy, however, that in both Arab countries where trends are available – Egypt and Jordan – people have become slightly more optimistic. Trend data are not available for Lebanon, but 45% currently think the attempt to create a stable democratic Iraqi government will succeed, making the Lebanese among the most optimistic publics surveyed on this question. There are differences among the countries’ religious groups, however – 64% of Christians think these efforts will succeed, while only 33% of Sunnis and 30% of Shia agree. Most Want Withdrawal from Afghanistan In 21 of 24 countries, a majority or plurality of those surveyed say the U.S. and NATO should remove their troops from Afghanistan as soon as possible. Public opinion leans toward keeping troops in Afghanistan until the situation there has stabilized
29

in just three countries – the U.S., Britain, and Australia – all of which have military forces in the country. Among Americans, the margin between those who want to keep troops in Afghanistan (50%) and those who favor withdrawal (44%) is slim, and is basically unchanged from 2007, when 50% wanted to keep troops there and 42% favored removing them. There is a significant partisan gap on this issue: Republicans overwhelmingly want to keep a military presence in Afghanistan (75% keep troops there, 21% remove troops), Democrats generally favor withdrawal (35% keep, 59% remove), and independents are evenly divided on this issue (47% keep, 47% remove). The British public also slightly favors keeping U.S. and NATO forces in Afghanistan. This is not true, however, in any other NATO country included in survey, aside from the U.S. Narrow majorities in Spain, France, and Germany back withdrawal, as do large majorities in Turkey and Poland. Australians are more likely than any other public to favor keeping forces in Afghanistan. Australia is not a member of NATO, but it has contributed to the military effort in Afghanistan and continues to maintain a military presence there.
Following the U.S. Election
8380
5250
49474644424033332925
232019171510
172043484650475344525661556366687474
78
768486
50
2524
56
58
75
JapanU.S.
Germany Australia
JordanBritainNigeria
S. KoreaIndia
EgyptLebanon
FranceS. Africa
MexicoTanzania
TurkeySpain
PolandRussiaBrazil
PakistanChina
IndonesiaArgentina
Very closely/Somewhat closelyNot too closely/Not at all closely
Large majorities in all three Arab nations surveyed want U.S. and NATO troops removed. And in Afghanistan’s neighbor, Pakistan, 72% favor withdrawal. The American Presidential Race In several countries, there is considerable interest in the 2008 U.S. presidential race. In fact, the Japanese (83%) are slightly more likely than Americans (80%) to say they are following news about the race very or somewhat closely. While no other publics are nearly as attentive to the race as the Japanese or Americans, at least half of those surveyed in Germany (56%), Australia (52%), Jordan (50%) and Britain (50%) are following the election closely.
30

In much of the world, however, few are paying attention to the presidential contest at this point. In 12 of the countries included in the survey, one-third or less of the public is following the race closely. Only 17% of Chinese are monitoring the race. And despite the fact that one of the major presidential contenders, Barack Obama, spent several years of his childhood in Indonesia, only 15% of Indonesians are closely following the election. But no public is less interested than the Argentines – only 10% are paying close attention to the race. The Next Administration’s Foreign Policy Many of those who are following the U.S. presidential contest closely are optimistic about the next administration’s foreign policy. When asked whether next year, when there is a new U.S. president, American foreign policy will change for the better, change for the worse, or not change much at all, majorities or pluralities in 14 countries – including the United States itself – say it will change for t
New U.S. President Will Change U.S. Foreign Policy for the Better
Change for the betterNot change that muchChange for the worse
68
67
67
66
65
6459
54
53
48
47
45
42
40
37
32
31
3029
25
20
20
19
29
21
19
21
19
2915
36
33
37
39
37
41
39
40
42
31
3143
31
67
24
37
1
1
10
7
6
121
1
3
7
9
5
9
12
18
14
27
3313
37
7
24
36
France
Spain
Nigeria
S. Africa
Tanzania
Germany
India
Australia
Britain
Indonesia
Brazil
U.S.
S. Korea
China
Mexico
Russia
Poland
Lebanon
Turkey
Egypt
Japan
Pakistan
Jordan
he better.
65%).
(40%).
This includes more than six-in-ten in the Western European nations of France (68% change for the better), Spain (67%) and Germany (64%), where opposition to U.S. foreign policy has been strong throughout much of the Bush presidency. But it also includes solid majorities in several countries where opposition to Bush’s foreign policy has been less pervasive, such as India (59%) and the African nations of Nigeria (67%), South Africa (66%), and Tanzania ( In five nations, however, the most common view is that the election of a new president will not bring much change to American foreign policy. This is especially true in Japan (67% not change that much), Turkey (43%), Russia (42%), South Korea (41%) and Mexico
Based on respondents w ho say they have been follow ing new s about the U.S. presidential race very or somew hat closely.Argentina not show n as it has too few cases to analyze.
In several countries, significant minorities worry that U.S. foreign policy will get worse with the election of a new president. A 37%-plurality takes this view in Egypt, and it also is a
31

common concern in the other two Arab nations included in the study, Jordan (36%) and Lebanon (33%). On the other hand, only a very few Western Europeans think the next president will change American foreign policy for the worse – just 1% in France, Spain, and Germany, and 3% in Britain. Rating the Presidential Contenders At this point in the U.S. presidential race, public opinion in the countries surveyed is more favorable toward Democratic contender Illinois Sen. Barack Obama, than toward Arizona Sen. John McCain, the likely Republican nominee. Among those individuals who are following the race at least somewhat closely, in 20 of 23 countries surveyed, the percentage of people having confidence in Obama to do the right thing in world affairs is higher than the percentage expressing confidence in McCain. In three countries – including the U.S., as well as Jordan and Pakistan – the two candidates are essentially tied on this measure. In 12 of these countries, majorities of those following the election say they have confidence in Obama, while majorities have little or no confidence in just five nations. On the other hand, majorities lack confidence in McCain in 10 countries, while a majority expresses confidence in the Arizona senator in only one country: the United States. The gap between perceptions of Obama and McCain is particularly large in Western Europe. For example, in Spain confidence in Obama (72%) is more than
38
19161522
2937
62
586059
1740
22
4634
3751
353612
59
5339
20
31
33527710
5829
483684
14
30
72
8036
74
56
34
8284
22
U.S.
BritainFrance
GermanySpain
PolandRussia
Turkey
EgyptJordan
Lebanon
AustraliaChinaIndia
IndonesiaJapan
PakistanS. Korea
Brazilxico
NigeriaS. Africaanzania
Me
T
Global Publics Have More Confidence in Obama than McCain
Not too much/No confidenceA lot/Some confidence
38
42676166
3748
71
615869
5042
48
4953
5561
504039
60
3722
5
23
2817406
3519
322850
32
36
23
3333
25
31
44
3140
19
McCainObama
B
p
ased on respondents who say they have been following news about the U.S.
residential race very or somewhat closely.
Argentina not shown as it had too few cases to analyze.
32

three times higher than is confidence in McCain (19%). In both France and Germany, more than 80% voice confidence in Obama, while just one-in-three say the same about McCain.
confident in Bush, while not a single Shia Muslim in
Obama also is more warmly received in the Asian/Pacific region. Roughly eight-in-ten Australians (81%) and Japanese (77%) are confident in him, while just 40% in each country have confidence in McCain. And Obama also is much more popular among those who are following the race in his former boyhood home, Indonesia. Finally, Obama is more popular than McCain in a country from another part of the world where he has family ties: East Africa (his father was from Kenya). While 84% of Tanzanians believe he will do the right thing in international affairs, just half say this about his Republican rival. The survey also measured international perceptions of Democratic candidate Sen. Hillary Clinton of New York. Ratings for Sen. Clinton generally tend to be higher than those for McCain, but lower than those for Obama, although there are some notable exceptions. Clinton is rated higher than Obama in India (58% to 33%), South Africa (57% to 36%), and Mexico (36% to 30%). She receives lower ratings than either of her two Senate colleagues in Lebanon (34% for Obama, 25% for McCain, 16% for Clinton).
Confidence in Bush
60
81858788
5069
89
658689
3345
69
6661
807786
333952
37
4122
2
33
30252323
1716
605532
64
76
11
1413
7
7
7
16
3055
8
U.S.
BritainGermany
FranceSpain
PolandRussia
Turkey
LebanonEgypt
Jordan
IndiaChina
S. KoreaJapan
AustraliaIndonesiaPakistan
BrazilMexico
Argentina
TanzaniaNigeria
S. Africa
Not too much/No confidenceA lot/Some confidence
Negative Views of Bush Persist As his second term as president nears its close, George W. Bush continues to receive mostly negative ratings. Majorities in only three countries – Tanzania, Nigeria, and India – say they have a lot or some confidence in Bush to do the right thing in world affairs. Opinions of Bush are especially negative in Western Europe – more than eight-in-ten in Britain, Germany, France, and Spain lack confidence in the American president. He also is unpopular in the Middle East. Fully 89% of Jordanians and 86% of Egyptians have little or no confidence in him. He gets somewhat more positive marks in Lebanon, although this is largely due to his popularity among that country’s Christians, 60% of who express confidence in Bush. Just 23% of Lebanese Sunni Muslims are
33
the Lebanese sample voices confidence in the American leader. Assessments of Bush have mostly held steady over the last year, although his ratings
Only 37% of Americans say they have confidence in President Bush, down from 45% in 2007, a
have become more positive in a few countries. Most notably, opinions of Bush have improved in Poland (+12 percentage points), as well as in Tanzania (+20), which the president visited on his trip to Africa in February.
nd down steeply from the first time the Global Attitudes Project asked this question in May 2003, when, just months after the invasion of Iraq, confidence in Bush stood at 78%. Unsurprisingly, there are large partisan differences in the U.S. More than three-in-four Republicans (76%) have a lot or some confidence in Bush, compared with just 30% of independents and even fewer Democrats (15%).
34

3. VIEWS OF CHINA
s the international spotlight turns to China and the 2008 Beijing Olympics, international publics are showing signs of apprehension about the country and its growing power. Overall, favorable views of China have declined slightly over the last year, and this is
especially true in Asia, as well as in Western nations, where enthusiasm for the Beijing Games is muted and concern about China’s increasing military strength is on the rise.1
A For most publics included in the survey, a familiar complaint about American foreign policy – that it tends to be unilateralist – rings true for China as well. The perception that China fails to consider the interests of others when making foreign policy decisions is widespread, particularly in the U.S., Europe, the Middle East and among China’s neighbors South Korea, Japan and Australia. On this and other measures, Japanese attitudes toward China are among the most negative.
Views of China
42
36567268
3054
50
294252
34
49
84
403831
14
51
39
3128
6033
24
595044
52484614
473834
797137
8
8
40
45
47
5876
26
U.S.
BritainSpain
France Germany
RussiaPoland
Turkey
EgyptLebanon
Jordan
PakistanIndonesia
AustraliaS. Korea
IndiaJapan
BrazilMexico
Argentina
NigeriaTanzaniaS. Africa
Unfavorable Favorable
In addition to anxieties about China’s role in foreign affairs, there is significant concern about China’s growing economy in some countries, especially the U.S. and Western Europe. Even more widespread, however, are worries about the safety of Chinese products. The recent scandals involving recalls of Chinese exports are well known to many, and in most of the nations surveyed, relatively few believe products made in China are as safe as those made elsewhere. In many ways, the survey reflects China’s ascendance as a major power. In both the developing and developed world, people see China having a significant influence in their own countries. In Western Europe, majorities believe either that China has already replaced the U.S. as the world’s leading superpower or that it will at some point replace the U.S. Few Chinese think their country has already
1 The survey was conducted from March 17-April 21, 2008, following the onset of civil unrest on Tibet, which began on March 10, and prior to the May 12 earthquake in China’s Sichuan province.
35

supplanted the U.S., but most think it will eventually do so. China’s Image Declines Slightly Majorities in seven of the survey’s 23 nations give China a favorable rating. This is the same number of countries in which majorities rate the United States positively. China’s popularity has declined somewhat since last year in nine of 21 countries where trends are available, while increasing in only two countries and remaining basically stable in 10.
American public opinion regarding China is roughly divided between those with a favorable (39%) and those with an unfavorable (42%) view. U.S. attitudes toward China have changed little since 2007, when 42% had a positive and 39% a negative opinion.
Ratings for China are decidedly negative in
three of the four Western European countries included in the survey. Fewer than one-in-three respondents in Germany, France or Spain express a positive opinion. Moreover, attitudes toward China have grown more negative in all three countries since last year. This is especially true in France, where China’s favorability rating has plummeted from 47% to 28%. This year’s decline continues a slide among Western Europeans over the last few years – since 2005, China’s favorability score has dropped 30 percentage points in France, 26 points in Spain, and 20 points in Germany. And while a plurality in Great Britain continues to express a positive view, opinions of China there are down significantly from 2005, when 65% offered a positive rating.
China Favorability Trends 2002 2005 2006 2007 2008 % % % % % U.S. -- 43 52 42 39 Britain -- 65 65 49 47 Spain -- 57 45 39 31 France -- 58 60 47 28 Germany -- 46 56 34 26 Russia 71 60 63 60 60 Poland -- 37 -- 39 33 Turkey -- 40 33 25 24 Egypt -- -- 63 65 59 Lebanon -- 66 -- 46 50 Jordan -- 43 49 46 44 Pakistan -- 79 69 79 76 Indonesia 68 73 62 65 58 South Korea 66 -- -- 52 48 India -- 56 47 46 46 Japan 55 -- 27 29 14 Brazil -- -- -- 50 47 Mexico -- -- -- 43 38 Argentina -- -- -- 32 34 Nigeria -- -- 59 75 79 Tanzania -- -- -- 70 71 Countries with available trends shown.
In Asia, opinions about China vary considerably. China is overwhelmingly popular among Pakistanis – roughly three-in-four (76%) express a positive opinion, while just 8% hold a negative view. A clear majority of Indonesians (58%) also have a positive view, although China’s favorability rating has dropped seven percentage points among Indonesians over the last year. On balance, Australians take a positive view of China, while both South Koreans and Indians are divided on this question. On the other hand, the Japanese are more negative than any other public included on the survey – just 14% offer a positive assessment of China, down 15
36

points from an already low 29% in last year’s survey. Of course, China and Japan have a long and often difficult history with one another, but as recently as 2002, a majority of Japanese (55%) voiced a positive view of their longtime rival. Middle Eastern views of China are mixed. In both Egypt and Lebanon, positive views outweigh negative ones, but in Jordan negative ratings are slightly more common. Similarly, opinions are mixed in Latin America, and many in the region are unable to offer either a positive or negative assessment. Over 70% of both Nigerians and Tanzanians take a positive view of China, but public opinion is quite different in South Africa, where China’s favorability rating is just 37%. Rating the Chinese People Majorities in only nine of the 23 countries surveyed express a favorable view of the Chinese people. Some of the highest ratings come from neighboring countries, including Pakistan (78% favorable), Australia (73%) and Indonesia (59%). Elsewhere in Asia, views are mixed in South Korea and India, and decidedly negative in Japan, where 73% have an unfavorable opinion, by far the most negative assessment of the Chinese people in the survey. In most countries, views of the Chinese closely resemble views of China as a nation. For instance, this is true in the three African nations included in the survey: Tanzanians and Nigerians have overwhelmingly positive views of the Chinese people, while South Africans lean toward a negative assessment, the same pattern that characterizes opinions of China itself in these countries. In the U.S. and Western Europe, however, there is a gap between perceptions of China and perceptions of its people. This is similar to the gap that characterizes attitudes toward the U.S. and its people throughout much of the world.
Views of the Chinese People
18
16493845
2939
44
494654
49
372637
8
48
64
5148
6147
29
474639
59474325
503735
736535
73
18
42
33
7
20
46
7873
65
U.S.
BritainFrance
SpainGermany
RussiaPoland
Turkey
JordanLebanon
Egypt
kistanAustralia
IndonesiaS. Korea
IndiaJapan
BrazilArgentina
Mexico
TanzaniaNigeria
S. Africa
Unfavorable Favorable
Pa
37

In Britain, only 47% hold a positive view of China, but 65% have a favorable view of the Chinese people. An even larger gap exists in the U.S., where just 39% express a favorable opinion of China, but 64% express a positive opinion of the Chinese. Smaller, but still substantial, gaps exist in Spain, France and Germany.
e ar he or an enemy.
Rating China and Its People in the West
46
47
39
28
31
26
Britain
U.S.
France
Spain
Germany
65
64
51
48
Chinese ChinaFavorable views o
Most See China as Neither Partner Nor Enemy In most of the countries surveyed, majorities or pluralities think of China as neither a partner nor an enemy of their country. In six nations, the balance of opinion is that China is a partner, while no public included in the study characterizes China as an enemy. This stands in stark contrast to the results from this same question when it was asked about the United States – peoplU.S. as either a partner
f…
e much more likely to label t
Is Ch r or Moina More of a Partne
re of an Enemy? Partner Enemy Neither DK % % % % U.S. 13 20 62 5
Spain 24 7 63 6 France 21 6 72 0 Germany 21 14 64 0 Britain 17 7 73 3
Russia 49 12 35 5 Poland 18 19 56 6
Turkey 16 25 33 26
Jordan 40 18 38 5 Egypt 36 24 34 7 Lebanon 33 18 44 4
Pakistan 78 3 5 14 Indonesia 41 4 48 6 India 37 17 36 9 Australia 32 3 62 2 S. Korea 26 28 43 2 Japan 20 23 55 1
Mexico 45 22 28 5 Argentina 40 9 39 12 Brazil 34 13 49 5
Nigeria 78 4 9 9 anzania 74 6 16 4 T
S. A
The way in which people characterize their nation’s relationship with China varies extensively across regions. Pakistanis are especially likely to say China is a partner to their country, as are Nigerians and Tanzanians. A slim majority of South Africans also call China a partner. In neighboring Russia, about half of those surveyed (49%) say China is a partner. Fewer than one-quarter of those in the survey’s five European Union countries – Britain, France, Germany, Poland and Spain – consider China a partner. However, Americans are the least likely to say China is a partner of their country, and fully 20% characterize it as an enemy. But China is rated as an enemy by significant minorities in other countries as well, including South Korea (28%), Turkey (25%), Egypt (24%), Japan (23%) and Mexico (22%). frica 53 12 21 14
38

Many See China as Unilateralist Among the publics included in this survey, there is a widely held view that China acts unilaterally in international affairs. Majorities in 14 of 23 countries say that China does not take into account the interests of countries like theirs when making foreign policy decisions.
isagree.
ities believe China kes their interests into account.
, 83% of Chinese say they believe it does consider other countries a great eal or a fair amount.
Does China Consider Interests of Countries Like Yo
38
2217
4528
15
302423
50272618
484617
695752
56
59718277
4561
55
637472
26
68
79
444670
192726
15
6359
37
72
3811
U.S.
GermanyBritainFrance
Spain
RussiaPoland
Turkey
LebanonJordanEgypt
IndiaPakistan
IndonesiaS. Korea
AustraliaJapan
MexicoBrazil
Argentina
NigeriaTanzaniaS. Africa
urs?
Great deal/Fair amountNot too much/Not at
This view is prevalent in the U.S. and among EU nations – more than seven-in-ten in France, Spain and Britain, and somewhat smaller majorities in Poland, the U.S. and Germany, think China generally ignores their interests. Majorities in the Middle East also agree with this perspective. Opinions differ among the six Asian and Pacific countries – Indians, Pakistanis and Indonesians tend to believe China does consider the interests of countries like theirs, while South Koreans, Australians, and Japanese overwhelmingly d Elsewhere, Mexicans and Brazilians are divided on this question, while Argentines tend to think China acts unilaterally. In all three African nations, on the other hand, major
all
ta
While most of the publics in the survey believe China generally acts unilaterally, the Chinese tend to have a very different impression of their country’s approach to foreign policy. When asked whether China takes into account the interests of other countries when making foreign policy decisionsd
39
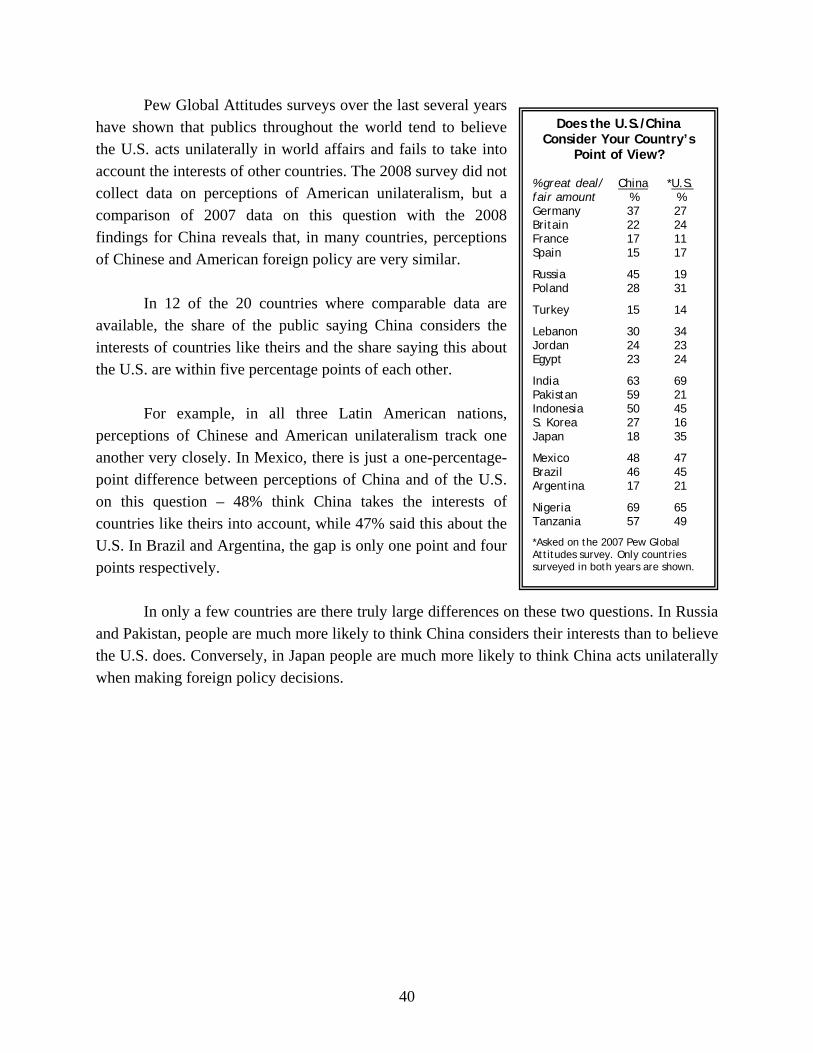
Pew Global Attitudes surveys over the last several years have shown that publics throughout the world tend to believe the U.S. acts unilaterally in world affairs and fails to take into account the interests of other countries. The 2008 survey did not collect data on perceptions of American unilateralism, but a comparison of 2007 data on this question with the 2008 findings for China reveals that, in many countries, perceptions of Chinese and American foreign policy are very similar.
Does the U.S./China Consider Your Country’s
Point of View? % great deal/ China *U.S. fair amount % % Germany 37 27 Britain 22 24 France 17 11 Spain 15 17
Russia 45 19 Poland 28 31 In 12 of the 20 countries where comparable data are available, the share of the public saying China considers the interests of countries like theirs and the share saying this about the U.S. are within five percentage points of each other.
Turkey 15 14
Lebanon 30 34 Jordan 24 23 Egypt 23 24
India 63 69 Pakistan 59 21
Indonesia 50 45 For example, in all three Latin American nations, perceptions of Chinese and American unilateralism track one another very closely. In Mexico, there is just a one-percentage-point difference between perceptions of China and of the U.S. on this question – 48% think China takes the interests of countries like theirs into account, while 47% said this about the U.S. In Brazil and Argentina, the gap is only one point and four points respectively.
S. Korea 27 16 Japan 18 35
Mexico 48 47 Brazil 46 45 Argentina 17 21
Nigeria 69 65 Tanzania 57 49
*Asked on the 2007 Pew Global Attitudes survey. Only countries surveyed in both years are shown.
In only a few countries are there truly large differences on these two questions. In Russia
and Pakistan, people are much more likely to think China considers their interests than to believe the U.S. does. Conversely, in Japan people are much more likely to think China acts unilaterally when making foreign policy decisions.
40

Leading Superpower China’s emergence as a world power is clearly reflected in public opinion throughout all major regions of the world. While there is no country in which a majority believes China has already overtaken the U.S. as the world’s dominant power, in several countries a significant minority holds this view, including 22% in America’s southern neighbor, Mexico, and 18% in another rising Asian power, India. Moreover, much larger percentages – and majorities in some countries – believe China will eventually supplant the U.S. as the world’s leading power. Most of those surveyed in Germany, Spain, France, Britain and Australia think China either has already replaced the U.S. or will do so in the future. While only 5% of Chinese currently think they have already become the leading superpower, 53% believe they will someday assume this rank. About one-in-four (23%) feel they will never surpass the U.S. Even in the U.S. more than one-in-three say China either has already overtaken their country (5%) or will eventually do so (31%). Still, a 54%-majority doubts China will ever unseat the U.S.
Will China Replace the U.S. as the World’s Leading Superpower?
Will Has Will never replace
Publics in Lebanon, Egypt, and Indonesia are about as confident that the United States will retain its superpower status as are Americans themselves. The Japanese are even more confident – two-thirds say China will never replace the U.S.
replaced replace DK % % % % U.S. 31 5 54 10
Germany 52 9 35 4 Spain 52 5 35 8 France 51 15 34 0 Britain 48 7 36 9
Russia 28 8 45 19 Poland 26 12 46 15
Turkey 28 6 38 28
Jordan 24 15 52 9 Egypt 20 14 55 10 Lebanon 17 10 56 17
Australia 53 5 34 9 China 53 5 23 19 S. Korea 43 4 49 4 Pakistan 34 11 20 35 Japan 23 8 67 2 India 22 18 33 27 Indonesia 22 5 55 18
Argentina 34 9 34 23 Brazil 33 11 42 14 Mexico 29 22 35 14
Tanzania 38 7 40 15 Nigeria 31 13 36 20 S. Africa 24 8 34 34
41

China’s Influence Another indicator of China’s growing power is the extent to which publics throughout the world see Chinese influence in their own countries. This is especially true among China’s Asian neighbors – 86% of both Japanese and South Koreans think China is having a great deal or fair amount of influence on the way things are going in their countries. And solid majorities agree with this perspective in Australia (72%), India (64%) and Indonesia (60%). But China’s impact is not limited to Asia. Majorities in France, Germany and Britain think China is having at least a fair amount of influence in their countries. And a remarkably high 76% of Americans believe China is influencing things in the U.S. How respondents characterize China’s influence varies considerably across countries. In the U.S., Europe, and the Middle East, people are more likely to say China is having a bad effect than a good effect. In Asia, the Japanese and South Koreans overwhelmingly view China’s impact in a negative light, while Indonesians and Pakistanis see it more positively, and Australians and Indians are divided on this question.
A great deal of attention has been paid in recent years to China’s increasing economic and political engagement with Africa. In all three African publics, people are more likely to characterize China’s impact positively than negatively. By a substantial margin, Nigerians are more likely than any other public to say China is having a positive effect in their country – 60% take this view, while only 6% see it as a negative influence.
China’s Influence *China’s influence is a… China influences Good Bad your country
thing thing % % % U.S. 76 8 38
France 61 5 27 Germany 55 8 23 Britain 54 12 21 Spain 40 6 21
Poland 42 6 22 Russia 41 6 19
Turkey 31 3 25
Jordan 32 6 13 Egypt 26 6 15 Lebanon 24 5 12
Japan 86 10 47 S. Korea 86 23 36 Australia 72 21 22 India 64 27 26 Indonesia 60 20 14 Pakistan 41 33 5
Mexico 62 14 35 Brazil 59 22 21 Argentina 37 8 16
Nigeria 70 60 6 S. Africa 63 34 17 Tanzania 37 29 5
*% of total sample saying China’s influence is good/bad thing. Question asked only of those who say China has great deal/fair amount of influence.
42

China’s and Military and Economic Power With a few exceptions, the publics in this survey worry about China’s growing military might. No one is more concerned about this than the Japanese, 90% of whom say their neighbor’s rising military strength is a bad thing for Japan. Nearly as many South Koreans (87%) see this as a bad thing for their country. Three-in-four Australians agree, as do 62% in India, a nation which fought a brief war with China in the early 1960s.
In India’s historic rival, Pakistan, however, 61% see China’s increasing military power as a good thing, the highest percentage found in the survey. Nigeria (60%) and Tanzania (51%) are the only other countries in which a majority characterizes China’s military strength as a positive factor.
How China’s Growing Power Affects Your Country
Growing military Growing power economy Good Bad Good Bad thing
Negative views of China’s military prowess are common in the U.S. and Europe – more than seven-in-ten in the U.S., France, Britain, Germany, Spain, Russia and Poland consider it a bad thing for their own countries. Moreover, concerns about China’s military have increased in each of these nations since last year. The trend has been especially dramatic in the U.S. and Spain – in both countries, the percentage of the public saying “bad thing” has risen by 14 points. Generally, publics across the world find China’s growing economic power less troubling than its increasing military strength. Turkey is a notable exception – Turks are about as likely to say China’s economic power is a bad thing (56%) as to characterize its military power as bad (52%). Nonetheless, the survey reveals significant concerns about China’s economy. Majorities in France, Germany, and the U.S. say China’s economic power is a bad thing for their countries, as do most South Koreans. Interestingly, however,
thing thing thing % % % % U.S. 8 82 35 53
France 12 87 37 63 Britain 9 74 43 44 Germany 8 81 39 56 Spain 7 72 38 45
Russia 11 77 43 34 Poland 9 74 31 46
Turkey 11 52 13 56
Jordan 33 46 52 37 Egypt 30 48 47 33 Lebanon 17 62 65 25
Pakistan 61 9 70 6 Indonesia 27 42 57 31 India 24 62 42 45 Australia 12 75 63 29 S. Korea 9 87 39 54 Japan 5 90 55 37
Brazil 24 54 53 31 Mexico 21 57 36 48 Argentina 10 48 38 25
Nigeria 60 19 87 5 Tanzania 51 39 77 16 S. Africa 24 36 56 25
More Concern About China’s Military in the U.S., Europe
“Bad thing” for your country 2007 2008 Change % % U.S. 68 82 +14 Spain 58 72 +14 Britain 66 74 +8 Russia 70 77 +7 Germany 77 81 +4 France 84 87 +3 Poland 72 74 +2
43

despite the history of conflict between the two nations and the negative views many Japanese currently hold about China, a majority of those surveyed in Japan describe China’s economic development as a good thing for their country. Majorities also believe China’s economy is having a positive effect on their countries in a diverse set of nations, including Pakistan, Indonesia, Lebanon, Jordan, Australia, and Brazil, as well as all three African countries. Views on the Olympics The survey finds that international opinion largely approves of holding the upcoming 2008 Summer Olympics in China. Majorities in 14 of 23 countries say the decision to hold the Games there was a good one.
However, European publics are notably less enthusiastic. In France, home to large demonstrations when the Olympic torch recently passed through the country, a clear 55%-majority calls the decision to hold the Games in China a mistake. On balance, the British and Spanish approve of holding the event in China, while Germans, Americans and Poles are more divided on this question.
Unlike in other Asian nations, opposition to the Beijing Games runs high in Japan – 55% of Japanese disapprove of the decision to hold the Olympics there, while just 39% approve.
Holding the Olympics in China: Good Decision or Bad Decision?
47
39
55
39
55
50
50
45
41
39
38
43 41
45
Britain
Germany
Spain
France
Poland
U.S.
Japan
Bad Good
44
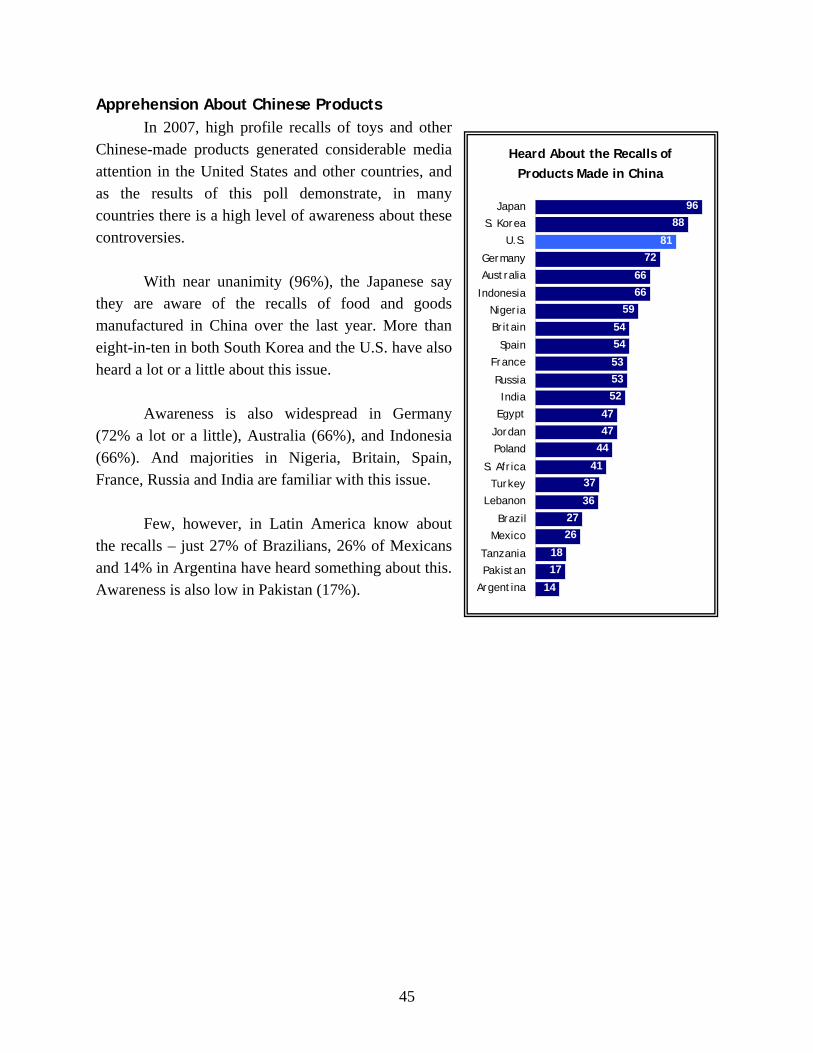
Apprehension About Chinese Products In 2007, high profile recalls of toys and other Chinese-made products generated considerable media attention in the United States and other countries, and as the results of this poll demonstrate, in many countries there is a high level of awareness about these controversies.
Heard About the Recalls of Products Made in
59
5454
535352
4747
44
4137
362726
1817
14
Japan
S. Korea
U.S.
Germany
Australia
Indonesia
Nigeria
Britain
Spain
France
Russia
India
Egypt
Jordan
Poland
S. Africa
Turkey
Lebanon
Brazil
Mexico
Tanzania
Pakistan
Argentina
China
9688
8172
6666
With near unanimity (96%), the Japanese say
they are aware of the recalls of food and goods manufactured in China over the last year. More than eight-in-ten in both South Korea and the U.S. have also heard a lot or a little about this issue. Awareness is also widespread in Germany (72% a lot or a little), Australia (66%), and Indonesia (66%). And majorities in Nigeria, Britain, Spain, France, Russia and India are familiar with this issue. Few, however, in Latin America know about the recalls – just 27% of Brazilians, 26% of Mexicans and 14% in Argentina have heard something about this. Awareness is also low in Pakistan (17%).
45

The survey finds considerable skepticism about the quality of Chinese products, and this is true even in many countries where awareness of recalls of Chinese projects is low. In 19 of 24 countries, at least half of those surveyed say Chinese products are generally less safe than those produced elsewhere.
Products Made in China as Safe as Products Made Else
73
50828579
7353
76
555354
58
89
556071
40
93
47
21
64
55
18
29
U.S.
BritainFrance
GermanySpain
PolandRussia
Turkey
JordanEgypt
Lebanon
ChinaPakistan
IndonesiaAustralia
IndiaJapan
S. Korea
ArgentinaBrazil
Mexico
NigeriaTanzaniaS. Africa
where?
19
17
282626
312820
252416
544425
12
12
9
8
6532
35
6
24
Less safe As safe
There is a consensus throughout much of the West that Chinese products are not as safe, although here again Britain is something of an outlier – just 50% of the British think Chinese projects are inferior to others in terms of safety. Nearly three-in-four Americans equate “Made in China” with safety risks. The South Koreans and Japanese are the least likely to say China’s products are as safe. In both countries roughly nine-in-ten say they are generally less safe than those produced elsewhere. Opinions are quite different, however, in China itself. Overwhelmingly, the Chinese public has confidence in its products – 65% say they are as safe as those from other countries, while just 18% say they are less safe.
46
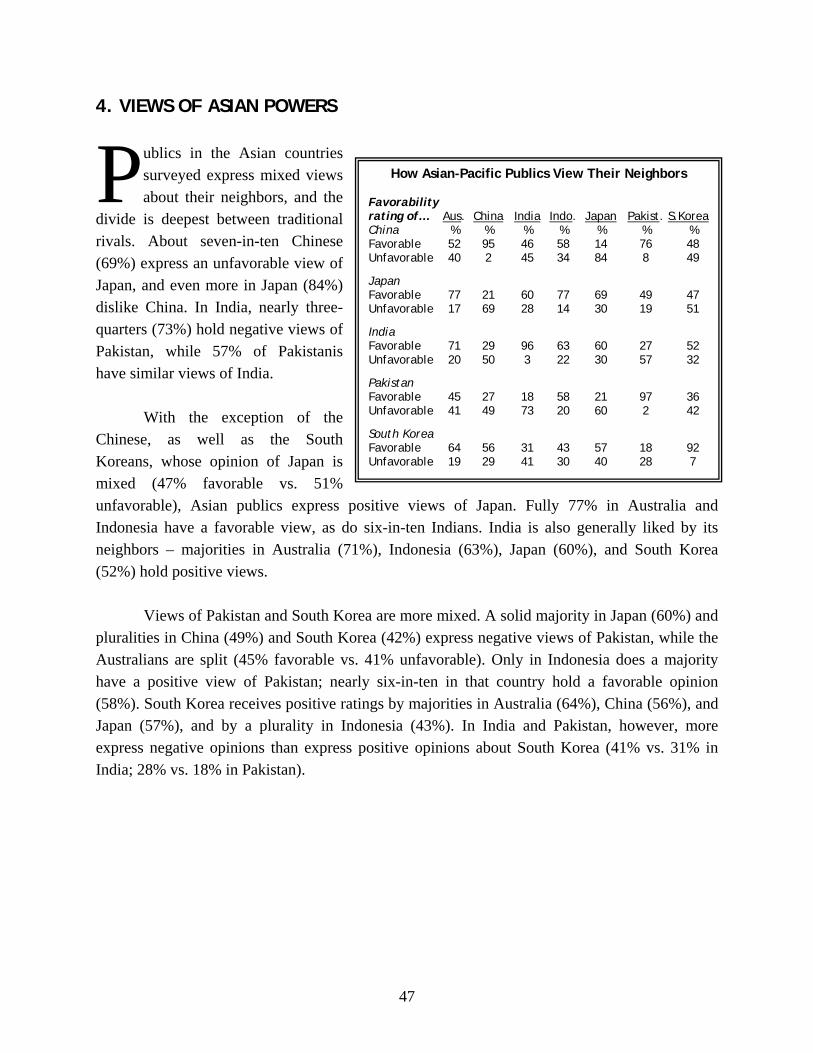
4. VIEWS OF ASIAN POWERS
ublics in the Asian countries surveyed express mixed views about their neighbors, and the
divide is deepest between traditional rivals. About seven-in-ten Chinese (69%) express an unfavorable view of Japan, and even more in Japan (84%) dislike China. In India, nearly three-quarters (73%) hold negative views of Pakistan, while 57% of Pakistanis have similar views of India.
P
With the exception of the Chinese, as well as the South Koreans, whose opinion of Japan is mixed (47% favorable vs. 51% unfavorable), Asian publics express positive views of Japan. Fully 77% in Australia and Indonesia have a favorable view, as do six-in-ten Indians. India is also generally liked by its neighbors – majorities in Australia (71%), Indonesia (63%), Japan (60%), and South Korea (52%) hold positive views.
How Asian-Pacific Publics View Their Neighbors Favorability rating of… Aus
Views of Pakistan and South Korea are more mixed. A solid majority in Japan (60%) and pluralities in China (49%) and South Korea (42%) express negative views of Pakistan, while the Australians are split (45% favorable vs. 41% unfavorable). Only in Indonesia does a majority have a positive view of Pakistan; nearly six-in-ten in that country hold a favorable opinion (58%). South Korea receives positive ratings by majorities in Australia (64%), China (56%), and Japan (57%), and by a plurality in Indonesia (43%). In India and Pakistan, however, more express negative opinions than express positive opinions about South Korea (41% vs. 31% in India; 28% vs. 18% in Pakistan).
. China India Indo. Japan Pakist. S.Korea China % % % % % % % Favorable 52 95 46 58 14 76 48 Unfavorable 40 2 45 34 84 8 49
Japan Favorable 77 21 60 77 69 49 47 Unfavorable 17 69 28 14 30 19 51
India Favorable 71 29 96 63 60 27 52 Unfavorable 20 50 3 22 30 57 32
Pakistan Favorable 45 27 18 58 21 97 36 Unfavorable 41 49 73 20 60 2 42
South Korea Favorable 64 56 31 43 57 18 92 Unfavorable 19 29 41 30 40 28 7
47

How the Rest of the World Views Asia Opinions of Asian countries are mixed in other parts of the world. Japan and India are generally viewed favorably, while views of Pakistan and South Korea are more mixed. Publics in 15 of the 17 countries surveyed in North America, Latin America, Europe, Africa, and the Middle East rate Japan favorably. Only in Jordan is Japan viewed negatively by a majority (53%), while South Africans are evenly split (39% favorable and 39% unfavorable). The balance of opinion about India is also favorable in much of the world, but publics in Middle Eastern countries largely dislike the Asian nation. Majorities in Egypt and Jordan (55% in each country) hold negative views, as do half of Lebanese and a 42%-plurality in Turkey. Opinion of India is most positive in Europe. Fully three-quarters in Britain express favorable views and about seven-in-ten in Russia (71%) and France (70%) express favorable views of the former British colony.
How the Rest of the World Rates Asian Powers Favorability rating of… Japan India Pakistan S. Korea Fav
The British also hold positive views about another country that once belonged to the British Empire – a 56%-majority offers favorable ratings of Pakistan. Egypt is the only other non-Asian country where a majority (51%) shares that view. Opinions of Pakistan are divided in the rest of the Middle East – 49% favorable vs. 45% unfavorable in Jordan, 48% vs. 45% in Lebanon, and 36% vs. 38% in Turkey. Americans are also split; 37% view Pakistan favorably and 39% view it unfavorably. The French, German, and Spanish respondents are the most negative about Pakistan; 69%, 64%, and 58%, respectively, have an unfavorable view.
Unfav Fav Unfav Fav Unfav Fav Unfav % % % % % % % % U.S. 70 11 63 14 37 39 51 25
Britain 70 8 75 9 56 24 50 18 France 78 22 70 29 31 69 54 44 Germany 78 14 60 29 21 64 50 34 Spain 67 20 48 34 21 58 32 41 Poland 73 14 59 20 27 47 39 40 Russia 74 17 71 15 39 35 46 30
Turkey 43 34 27 42 36 38 25 40
Egypt 51 44 33 55 51 40 18 70 Jordan 43 53 39 55 49 45 27 60 Lebanon 57 28 34 50 48 45 22 63
Argentina 47 19 25 27 13 38 22 28 Brazil 68 21 47 33 24 56 38 43 Mexico 40 32 27 37 13 49 25 36
Nigeria 69 18 53 30 43 34 47 30 S. Africa 39 39 38 48 15 55 21 44 Tanzania 70 8 61 17 38 27 46 18
48

Japan’s Role in World War II Overwhelming majorities in China and South Korea believe that Japan has not apologized sufficiently for its military actions during the 1930s and 1940s. This view is expressed virtually unanimously in South Korea (96%) and by about three in four (76%) in China. The Japanese are split – 42% think their country’s apology to its neighbors has been sufficient, while 41% disagree.
Has Japan ApologiSufficiently for Worl
42
1
8
41
96
76
S. Korea
China
Japan Japanese men and women are about equally likely to say their country has not apologized enough for its role in World War II – 40% of women and 42% of men share that view. The percentage of Japanese women who think their country’s apology is not sufficient has declined somewhat since 2006, when 47% thought that was the case. The percentage of Japanese women who think their country has either apologized sufficiently or that no apology is necessary is virtually unchange
zed d War II?
Yes No
d, but fewer now offer an pinion on the matter.
than it was two years ago, when 67% of Japanese respondents were against changing Article 9.
o While the Japanese are divided about whether their country’s apology for its military past has been adequate, a clear majority opposes changes to Article 9 of the Japanese constitution that would allow the country to establish an official military. Nearly six-in-ten (58%) oppose the changes, including a majority of men (55%) and women (60%), as well as majorities of all age groups. However, opposition to the measure is lower now
49

50

5. ISSUES IN RUSSIA AND EUROPE
f the three major European leaders for whom confidence levels were investigated in 2008, Pew data show that German
Chancellor Angela Merkel receives the highest praise for having good judgment in foreign affairs. The opposite is the case for Vladimir Putin: During this time of political transition from Russian president to prime minister, Putin’s ratings continue to be low, if not as low as those of U.S. President George Bush. Views of French President Nicolas Sarkozy are more mixed both at home and abroad.
O
Domestic opinion of these leaders is
consistent with foreign opinion in France and Germany but different in Russia. While Germans largely hold positive views of Merkel and the French are conflicted over Sarkozy, Russian confidence in Putin is unequivocal. Russian views on how much power Putin will wield are less definitive.
Confidence in Global Leaders
Bush
Apart from their opinion of the Russian leader,
however, one concern is widely shared among Europeans – worry about dependence on Russian energy resources. Views of Putin Remain Negative
In Europe and elsewhere, confidence in Putin to do the right thing in world affairs is low. Solid majorities in France (82%), Spain (80%), Poland (78%), Germany (60%), and Great Britain (56%) hold negative opinions of Putin. Views of Putin are equally negative in all countries surveyed in the Middle East. Large majorities in Egypt (74%), Jordan (72%), Turkey (70%), and Lebanon (59%) lack confidence in the Russian leader.
Putin Merkel Sarkozy In Europe % % % % Britain 16 28 53 53 France 13 17 84 51 Germany 14 38 76 45 Spain 8 10 51 36 Poland 41 14 45 45 Russia 22 83 49 29
Elsewhere U.S. 37 28 39 37 Japan 25 28 47 33 India 55 33 18 26 China 30 46 26 24 Australia 23 38 48 50
Percent in each country who say they have a lot or some confidence in ______ to do the right thing in world affairs.
Confidence in Russian President Vladimir Putin
A Not lot/ much/ Some None DK % % % U.S. 28 48 25
Germany 38 60 2 Britain 28 56 16 France 17 82 1 Spain 10 80 11
Russia 83 13 4 Poland 14 78 7
Turkey 9 70 21
Lebanon 37 59 4 Jordan 17 72 11 Egypt 16 74 10
China 46 26 28 Australia 38 44 18 India 33 31 36 Japan 28 62 10 S. Korea 27 46 26 Indonesia 18 37 45 Pakistan 5 42 53
Brazil 14 63 23 Mexico 10 52 39 Argentina 7 51 43
Tanzania 41 24 35 Nigeria 38 39 23 S. Africa 16 27 57
51

In half of the countries surveyed, views of Putin have remained basically steady between 2007 and 2008. Opinions of Putin have, however, become more negative in a number of countries including Mexico, China, India, and Britain. For China, 2008 marks the first time that Putin’s popularity has declined since being measured by Pew; in 2007 a solid majority (58%) of Chinese held positive views of Putin, while less than half (46%) do now.
Where Confidence in Putin Has Declined
2007
Despite worldwide skepticism of Putin, he
continues to remain popular at home. Just as in 2007, more than eight-in-ten (83%) Russians have faith in Putin’s handling of foreign affairs. Roughly half of Russians (48%) expect Putin to have more power than Dmitri Medvedev – the newly elected president of Russia. Still, a roughly equal percentage say either that Medvedev (22%) will have more power or volunteer that both Putin and Medvedev (24%) will share the political reigns equally.
ocracy and 39% favored a strong leader.
Regardless of who ultimately wields more
power, Russians are still inclined to favor “a leader with a strong hand” over a democracy to solve their country’s problems (57% vs. 33%). Russians are slightly less inclined to have faith in a strong leader and slightly more inclined to trust in a democracy in 2008 than in 2007 (In 2007, 63% favored a strong leader compared with 27% who saw democracy as a better problem solver). But support for democracy was much stronger among Russians seventeen years ago in the 1991 Pulse of Europe survey (conducted by the Times Mirror Center – the predecessor of the Pew Research Center for the People and the Press), when 51% preferred dem
Europeans Largely Confident in Merkel
Majorities of people in West European countries and pluralities in Poland and Russia have confidence in German Chancellor Angela Merkel to do the right thing in matters of foreign policy.
Confidence in Merkel is most pervasive in France, though it is still quite broad-based among her countrymen and women: More than eight-in-ten in France (84%) have faith in Merkel while three-in-four (76%) do in Germany. Fewer, but still about half in Britain (53%) and Spain (51%) hold Merkel in high regard. Positive evaluations also outweigh negative assessments in
2008 Change % % Mexico 23 10 -13 China 58 46 -12 India 43 33 -10 Britain 37 28 -9 Nigeria 45 38 -7 Indonesia 22 18 -4
Russians Expect Putin to Have More Power than Me
Vlad
Putin
Dmitri
Medvedev
dvedev
imir
(48%)
(22%)
Both equally
(vol.)
(24%)
DK
(5%)
52

Confidence in German Russia and Poland, though views are more closely divided in Poland (45% confident vs. 41% not confident).
Chancellor Angela Merkel
A Not lot/ much/
Confidence in Merkel is mixed in non-European nations with the largest economies, and many in these countries are unfamiliar with the German leader. Nearly half (47%) in Japan have positive views of Merkel’s foreign policy leadership while nearly four-in-ten do in the U.S (39%); many in both publics did not provide an answer. Few in either China (26%) or India (18%) trust in Merkel’s judgment although many in both countries offer no opinion (China 40%, India 54%).
Some None DK In Europe % % % France 84 15 1 Germany 76 24 0 Britain 53 20 27 Spain 51 33 17 Russia 49 28 24 Poland 45 41 14
Middle East Egypt 24 55 22 Jordan 20 59 21 Lebanon 34 60 6 Turkey 6 68 25
Elsewhere U.S. 39 20 41
Merkel is much less popular in the Middle East than in other parts of the world. Majorities in Turkey (68%), Lebanon (60%), Jordan (59%) and Egypt (55%) hold negative views of the German Chancellor.
Japan 47 26 27 India 18 28 54 China 26 33 40 Australia 48 14 38
Views of Merkel have fluctuated somewhat in the past year.
Positive views of Merkel increased substantially in Spain: In 2007 just over one-third (36%) in Spain had confidence in Merkel while in 2008, half (51%) say they do. A much smaller increase occurred among Russians as well (+5 points).
Confidence in German Chancellor Angela
Merkel 2007
The story is the reverse for both Germany and Britain; fewer
among both of these publics are confident in Merkel now than one year ago. In 2007 more than eight-in-ten Germans (85%) and six-in-ten British (62%) had faith in her foreign policy decisions, while just over three-quarters (76%) of Germans and half of those in Great Britain (53%) do now.
2008 In Europe % % Britain 62 53 France 87 84 Germany 85 76 Poland 42 45 Russia 44 49 Spain 36 51
Middle East Egypt 25 24 Jordan 26 20 Lebanon 40 34 Turkey 10 6 Elsewhere U.S. 44 39 Japan 27 47 India 28 18 China 31 26 Australia -- 48
53

Confidence in Sarkozy is Mixed Among the European publics surveyed, confidence in
Sarkozy to do the right thing in matters of foreign policy is mixed. In Britain, a majority hold a positive view of him (53%). The French themselves are conflicted; half (51%) have confidence while the other half (49%) do not. In Poland, positive assessments of Sarkozy (45%) slightly outweigh negative ones (34%). However, majorities or pluralities in Spain (56%), Germany (51%) and Russia (42%) lack faith in the French president.
Confidence in French President Nicolas Sarkozy
A Not lot/ much/
Views of Sarkozy are also largely mixed among non-
European publics. A plurality of Americans (37%) have a positive opinion of Sarkozy, though nearly as many in the U.S. hold a negative (30%) view or do not offer an answer (33%). Negative views are especially common in Japan, where half say they have little or no confidence in the French president.
Sarkozy receives mostly negative ratings in the Middle East with the exception of
Lebanon. More than seven-in-ten in Turkey (74%), and more than six-in-ten in Egypt (67%) and Jordan (63%), lack confidence in Sarkozy in the foreign policy arena. By contrast, a majority in Lebanon (56%) have faith in him. Europeans Concerned About Dependence on Russian Energy
Majorities in all European countries surveyed except Spain say they are concerned about their country’s dependence on Russian energy resources: Roughly six-in-ten or more among British (67%), Polish (66%), German (62%) and French (58%) publics express concern; the Spanish public is evenly split on this issue (46% concerned, 47% not concerned).
Concern for Dependence on Russian Energy Resources
67
62
58
46
66
75
58
53
38
66
Britain
Poland
Germany
France
Spain
2008 2007
Some None DK In Europe % % % Britain 53 30 17 France 51 49 * Germany 45 51 4 Poland 45 34 21 Spain 36 56 8 Russia 29 42 29
Middle East Egypt 21 67 11 Jordan 30 63 8 Lebanon 56 40 4 Turkey 5 74 22
Elsewhere U.S. 37 30 33 Japan 33 50 17 India 26 27 47 China 24 32 44 Australia 50 30 20
54

Some limited change in concern about dependence on Russian resources has occurred in the past year; slightly more are worried now in Germany (62%), France (58%), and Spain (46%) than in 2007 (Germany 58%, France 53%, Spain 38%). By contrast, fewer Poles are worried now (66%) than were one year ago (75%). British views have remained unchanged.
55

56

6. VIEWS OF IRAN
s has been the case in recent years, people around the world hold mostly negative views of Iran. Majorities or pluralities in
20 of the 24 countries surveyed express unfavorable opinions about the largely Shia nation, and opinions are often as negative in other Muslim nations as they are in other parts of the world. Many Muslim publics also continue to express doubt about Iranian President Mahmoud Ahmadinejad and majorities of Muslims in six of eight countries with large Muslim populations are opposed to Iran acquiring nuclear weapons. Still, Muslims in the Middle East, Asia and Africa generally do not think a nuclear-armed Iran would
A
lim
pose much of a threat to their country.
here are sizable Musminorities, are split.
nese Christians have a decidedly negative opinion of Iran (90% unfavorable vs. 11% favorable).
More than two-thirds in Poland (68%), Brazil (69%), Japan (70%), Spain (77%), France (82%), and Germany (82%) offer unfavorable ratings of Iran, as do somewhat smaller majorities in 11 other countries, including those in Iran’s backyard. Fully 66% in Lebanon, 56% in Turkey, 56% in Jordan, and 54% in Egypt express negative opinions of Iran, while publics in Nigeria and Tanzania, where t
Views of Iran
468282
3968
56
5666
1227
55
5570
695652
423858
20
1912
4016
24
464134
333124
1713
4334
77
54
64
47
53
10
10
2217
33
5367
11
U.S.
BritainFrance
GermanySpain
RussiaPoland
Turkey
EgyptJordan
Lebanon
PakistanIndonesia
S. KoreaAustralia
ChinaIndia
Japan
BrazilMexico
Argentina
NigeriaTanzaniaS. Africa
Unfavorable Favorable
In Nigeria, Tanzania and Lebanon, views of Iran reflect religious differences. About two-
thirds of Nigerian Muslims (68%) have a positive view, and the balance of opinion is also favorable among Muslims in Tanzania (42% vs. 35%). In contrast, only 16% of Christians in Nigeria and 29% of Christians in Tanzania have favorable views and 65% and 40%, respectively, have unfavorable views of the Muslim nation. Lebanese Muslims are split (48% favorable vs. 50% unfavorable), mirroring the divide between Shia and Sunnis in that country, while Leba
57

Positive views of Iran have declined in six countries, including an 11-point drop in Indone
ough Iran’s image remains largely he mos -third
ion of Iran, compared with about a quarter in 2007 (24%). ewer than half in Britain (46%) rate Iran negatively, down
orable view of Iran, co
e three ountries say they lack confidence in Mahmoud
Ahmad
Nigeria (61%), and sizeable numbers in Indonesia (39%) and Pa
s of Ahmadinejad re equally polarized – 96% of Lebanese Shia have
confidence in the leader to do the right thing regarding
sia (from 64% in 2007 to 53% today) and smaller drops in Jordan (5 points) and Turkey (4 points). Fewer people also offer positive ratings in Mexico, India and Spain.
Publics in Great Britain, France, Brazil and the United States, however, offer somewhat more favorable opinions of Iran than they did in 2007, even thnegative in those countries. Favorable ratings have increased tof respondents have a positive impress
t in Britain, where one
Ffrom 57%. In the U.S., one-in-five have a fav Muslim Views of Iran
mpared with 14% a year ago.
How Muslims View Iran and Its Leader
While Iran is viewed negatively in nearly every country surveyed, Muslim publics in the Middle East, Asia, and Africa offer mixed opinions about Iran and its president. Majorities in Turkey (55%), Jordan (55%) and Egypt (53%) rate Iran unfavorably and even larger majorities in th
Fav
cinejad to do the right thing regarding world affairs
(59% in Turkey, 71% in Jordan, and 73% in Egypt).
However, opinions of Iran and Ahmadinejad are more positive in Indonesia, Pakistan, and Nigeria. About two-thirds of Muslims in Nigeria (68%) and Pakistan (67%), and 55% in Indonesia, view Iran favorably. And although opinions about Ahmadinejad are less positive than opinions about his country, a majority of Muslims in
kistan (42%), have confidence in him (similar
numbers in Indonesia and Pakistan do not offer an answer). In Lebanon, Muslim opinions about Iran and its
president reflect differences between Sunnis and Shia. Sunnis are nearly unanimous in their negative view of the Shia nation (94%) while Shia Muslims are equally united in offering positive opinions (97%). Viewa
Unfav. DK. % % %
Turkey 25 55 20 Spring, 2007 28 56 16
Egypt 46 53 1 Spring, 2007 50 2 Jordan 41 55 4
49
a
lot/ much/
Spring, 2007 46 52 2 Lebanon 48 50 2 Spring, 2007 45 54 1
Indonesi 55 26 19 Spring, 2007 66 19 16 Pakistan 67 12 21 Spring, 2007 69 10 21
Nigeria 68 21 11 Spring, 2007 64 28 7
Tanzania 42 35 24 Spring, 2007 41 38 21
Confidence in Ahmadinejad
A Not Some None DK % % % Turkey 21 59 20 Spring, 2007 21 55 23
Egypt 20 73 7 Spring, 2007 20 72 8
Jordan 25 71 5 Spring, 2007 18 78 4 Lebanon 46 52 2 Spring, 2007 39 60 2
Indonesi 39 23 38 a
44 37
Nigeria 61 23 16 Spring, 2007 61 23 15
Based on Muslim respondents.
Spring, 2007 53 22 25 Pakistan 42 14 Spring, 2007 42 21
58

world a
up from an already strong 75%-majority in 2007. Confidence in the Iranian leader is about as low as it was a year ago among Lebanese Sunnis (98% unfavorable today vs.
s where ajorities of Muslims express support for Iran acquiring nuclear weapons. Six-in-ten in Pakistan,
and abo n obtaining nuclear weapons.
thirds of Muslims innd 71% in Tanzania see Iran’s nu
their country – a position held by 94% of Shia – about eight-in-ten Sunni Muslims (81%) and 87% of Christians worry that Iran would pose a threat to Lebanon if it were to
ffairs and 98% of Sunnis do not.
Lebanese Muslims express considerably more confidence in Iran’s president than they did a year ago, a change that reflects increasingly positive views among the Shia population. Fully 96% of Lebanese Shia have confidence in Ahmadinejad to do the right thing internationally,
93% in 2007).
Muslim Views of Iran’s Nuclear Weapons Program Muslims in six of the eight countries where respondents were asked about Iran’s weapons program say they would oppose Iran acquiring nuclear weapons. Opposition is strongest in Turkey and Tanzania, where about two-thirds of Muslims would not want Iran to obtain such weapons (67% and 66%, respectively). Pakistan and Nigeria are the only countriem
ut the same proportion in Nigeria (58%), favor Ira
Despite widespread opposition to Iran’s nuclear weapons program among Muslim publics, majorities of Muslims in five of eight countries surveyed do not think a nuclear-armed Iran would represent a threat to their country. Muslims in Pakistan and Nigeria are the least concerned about the possibility of Iran acquiring nuclear weapons – solid majorities in those countries say it would not pose a serious threat, while fewer than one-in-three believe it would pose a serious threat. On the other hand, about two-
25
52
45
57
58
62
71
65
44
41
30
18
25
54 40
44
Tanzania
Turkey
Lebanon
Indonesia
Egypt
Jordan
Nigeria
Pakistan
Minor/No threat at allVery serious/Somewhat serious threat
Based on Muslim respondents.
Does Iran Acquiring NucleaPose a Threat?
r Weapons
Turkey (65%) clear weapons a
program as a potential threat. In Lebanon, opinions about Iran’s nuclear weapons program again reflect religious and sectarian divides. About nine-in-ten Shia (91%) would welcome a nuclear-armed Iran. In contrast, nearly every Christian (95%) and Sunni (98%) respondent is against Iran obtaining nuclear weapons. And while 52% of all Lebanese Muslims say a nuclear-armed Iran would not pose much of a threat to
acquire weapons.
59

Differences in opinion by religion are also evident in Nigeria. Nearly six-in-ten Nigerian Muslims (58%) would be in favor of Iran obtaining nuclear weapons, and the same number do not think Iran would pose much of a threat to their country if it were to acquire such weapons.
mong Christians, however, 71% would be against Iran acquiring nuclear weapons and 65% armed Iran would pose a serious threat to Nigeria.
Athink a nuclear-
60

7. WHICH GOVERNMENTS RESPECT THE RIGHTS OF THEIR PEOPLE?
espite the negative views of the United States expressed by many people around the world, the U.S. receives largely positive reviews for the way it treats its own people. When respondents are asked whether the U.S., France, China, Russia, Saudi Arabia,
and Iran respect the personal freedoms of their country’s people, the American and French governments generally receive the highest ratings. Across the 24 countries surveyed, the median percentage saying the U.S. government respects the freedoms of its people is 65%, about the same as the median rating for France (63%). The governments of China (median equals 30%), Russia (28%), Saudi Arabia (24%) and Iran (10%) on average receive lower marks among the more than 24,000 people surveyed.
D
U.S.75
70696549
7966
47
554844
94807268585045
515038
7267
65
64
U.S.
GermanyBritainFrance
Spain
PolandRussia
Turkey
LebanonJordanEgypt
S. KoreaJapan
AustraliaIndia
IndonesiaChina
Pakistan
BrazilMexico
Argentina
NigeriaTanzaniaS. Africa
Median
France66
86787779
8267
49
875350
90787445465834
534549
6068
63
48
Does the Government of ____ Respect the Personal Freedoms of its People?
China14
1312711
739
30
484334
134957
66
223322
7265
30
37
236
Not asked
Russia23
16181417
1245
2729
325233
262822
4050
28
28
37
38
28222444
Saudi Arabia13
2414209
1823
13
646260
242418246134
11
9
5435
67
17
10
24
Percent in each country saying the government of ____ respects the personal freedoms of its people.
Iran
5
5
6
4
422
8
2930
9594938
87
3931
10
12
56
28
8
9
10
10
61

The United States Majorities in 16 of the 24 countries surveyed believe the U.S. government respects the personal freedoms of Americans. This includes large majorities throughout the Western and Eastern European nations included in the survey, with one exception: Spain. Just 49% of the Spanish think the U.S. respects the rights of its people, while 40% say it does not. Ratings for the U.S. on this question are generally positive in Asia, especially in South Korea and Japan. Indeed, South Koreans and Japanese are more likely to say the U.S respects its people’s rights than are Americans themselves. The Chinese and Pakistanis offer more mixed assessments, although on balance the U.S. receives favorable marks in both countries. Consistent with their generally positive perspective on the U.S., the African publics included on the survey – Nigeria, Tanzania and South Africa – give the American government positive ratings for the way it treats its people. There is no country in which a majority says the American government does not respect the rights of citizens. However, more than four-in-ten in Jordan, Egypt and Brazil take this position. Argentina, meanwhile, is the only country in which the percentage of people saying “no” (46%) to this question surpasses the percentage of people saying “yes” (38%).
Does Government Respect Personal Freedoms?
U.S. and France
U.S. France Yes
France Just as with the United States, majorities in 16 nations say the government of France respects the freedoms of its people. However, the percentage of people saying France does not respect these freedoms tends to be lower than is the case for the U.S. – the only countries in which more than 30% say this about the French government are Egypt (37%), Jordan (33%) and Brazil (32%). Overwhelmingly, their fellow Europeans believe the French government treats its people well. More than three-quarters of those surveyed in Germany (86%), Poland (82%), Spain (79%) and Great Britain (78%) believe the government in Paris respects the rights of the French people, as do two-thirds in Russia. The French themselves are actually more likely than any other
No Yes No % % % % U.S. 75 22 66 16
Germany 70 26 86 9 Britain 69 24 78 11 France 65 35 77 22 Spain 49 40 79 11
Poland 79 13 82 9 Russia 66 19 67 15
Turkey 47 28 49 19
Lebanon 55 36 87 11 Jordan 48 43 53 33 Egypt 44 43 50 37
S. Korea 94 5 90 4 Japan 80 17 78 9 Australia 72 23 74 10 India 68 12 45 15 Indonesia 58 26 46 15 China 50 27 58 12 Pakistan 45 21 34 11
Brazil 51 41 53 32 Mexico 50 37 45 26 Argentina 38 46 49 16
Nigeria 72 19 60 15 Tanzania 67 18 68 10 S. Africa 64 14 48 11
62

European public to say these rights are not respected in their country – still, only 22% feel this way. China and Russia Compared with the U.S. and France, the governments of China and Russia receive less favorable ratings. Majorities in only four countries think China respects the rights of its people. Meanwhile, China is the only country in which a majority say this about Russia (Russians themselves are almost evenly divided on this question). Throughout the U.S. and the European Union, large majorities believe individual freedoms are not respected in these two nations. More than seven-in-ten in the U.S., Germany, Britain, Spain, France, and Poland say the Chinese government lacks respect for personal liberty. The Russian government receives only slightly less negative evaluations.
Does Government Respect Personal Freedoms?
China and Russia
China Russia
Views of the Chinese and Russian governments are mixed in predominantly Muslim countries, although overall, opinions of the Chinese government are more positive. This is particularly the case in the Asian Muslim nations of Pakistan and Indonesia, where China receives largely positive reviews, while many are unable to rate the Russian government. Elsewhere in Asia, the picture is different. South Koreans, Australians, and especially the Japanese take dim views of both governments, but hold particularly negative opinions of China’s rulers. Saudi Arabia and Iran Overall, the governments of Saudi Arabia and Iran receive even less positive reviews than do those of China and Russia. Majorities in just six nations think the Saudi regime respects the personal freedoms of its people, while majorities in just two countries say this about Iran. Assessments of both governments – and particularly of the Iranian government – are especially negative in EU countries and the U.S. Attitudes toward Saudi Arabia and Iran vary across the Muslim world. In Turkey, few respondents think either government respects individual rights. In the predominantly Sunni
Yes No Yes No % % % % U.S. 14 74 23 59
Germany 13 84 16 80 Britain 12 77 18 64 Spain 11 77 17 64 France 7 93 14 86
Russia 39 39 45 44 Poland 7 84 12 79
Turkey 30 31 37 27
Lebanon 48 37 38 52 Jordan 43 46 27 60 Egypt 34 53 29 57
Pakistan 66 3 33 13 Indonesia 57 26 32 31 India 49 30 44 18 S. Korea 23 69 28 52 Australia 13 78 24 57 Japan 6 88 22 63 China* -- -- 52 17
Mexico 33 44 28 38 Argentina 22 50 22 31 Brazil 22 66 26 57
Nigeria 72 13 40 26 Tanzania 65 18 50 22 S. Africa 37 30 28 25
*Question about the Chinese government not asked in China.
63

Middle Eastern nations of Jordan and Egypt, about six-in-ten believe that Saudi Arabia, another largely Sunni nation ruled by a Sunni royal family, respects personal freedoms. On the other hand, only about three-in-ten Jordanians and Egyptians think Iran – a predominantly Shia nation – values these freedoms. Similar divisions between Sunni and Shia are found in Lebanon. Nine-in-ten (89%) Lebanese Shia believe Iran respects personal freedoms, compared with just 2% of the country’s Sunni population. However, Saudi Arabia actually receives positive evaluations from both Lebanese Sunni (77% respects personal freedoms) and Shia (89%). Christians in Lebanon tend to believe neither government shows respect for basic freedoms, although they are more likely to believe the Saudi government (36%) does so than the Iranian government (8%). The Christian and Muslim populations in Nigeria also have very different views of these regimes. Roughly three-quarters (76%) of Nigerian Muslims think Saudi Arabia values personal freedoms compared with just 32% of the country’s Christians. About six-in-ten Nigerian Muslims (61%) say this about Iran’s government, compared with only 17% of Christians.
Does Government Respect Personal Freedoms?
Saudi Arabia and Iran
Saudi Arabia Iran Yes
In Pakistan and Indonesia, both governments are generally seen in a positive light, although Saudi Arabia receives more favorable marks. More than six-in-ten Pakistanis (67%) and Indonesians (61%) believe personal freedoms are respected in the desert kingdom.
No Yes No % % % % U.S. 13 64 8 80
Germany 24 59 6 89 France 20 80 5 95 Britain 14 59 12 70 Spain 9 69 4 82
Russia 23 38 22 50 Poland 18 57 4 81
Turkey 13 57 8 67
Lebanon 64 29 29 66 Jordan 62 32 30 63 Egypt 60 29 28 61
Pakistan 67 8 56 9 Indonesia 61 23 49 25 China 34 29 38 29 India 24 37 59 24 Japan 24 47 10 75 S. Korea 24 55 10 68 Australia 18 57 9 75
Brazil 11 73 5 85 Mexico 10 55 8 71 Argentina 9 47 7 71
Nigeria 54 26 39 35 Tanzania 35 39 31 45 S. Africa 17 32 9 51
64

8. ENVIRONMENTAL ISSUES he environment continues to be a cause of major concern for publics around the world. Majorities in 14 of the 24 countries surveyed rate global warming as a very serious problem, and the proportion offering that view has increased since last year in 11 of the
20 countries for which trends are available. T
When asked which country is “hurting the world’s environment the most,” majorities or
pluralities in most countries surveyed cite the United States. But people are increasingly pointing fingers at China as well. The view that China is most to blame has risen significantly in 13 of the 20 countries where trends are available. China is blamed for environmental problems more often than any other country by the Japanese, South Koreans, Australians, Americans and Germans. (Respondents were asked to name a country from a list that included India, Germany, China, Brazil, Japan, the United States and Russia.)
The poll also finds that publics in 10 of the 24 countries surveyed have the most confidence in Germany to do the right thing in protecting the world’s environment. Nigerians, South Africans, Mexicans, and Tanzanians express the most confidence in the United States.
Global Warming Is a Very Serious Problem
9282
75
7372
707068
6766
6261
5651494847
4645434241
3824
Brazil
Turkey
Tanzania
Japan
France
Argentina
Mexico
S. Korea
Spain
India
Australia
Germany
Britain
Poland
Russia
Pakistan
S. Africa
Indonesia
Nigeria
Lebanon
U.S.
Jordan
Egypt
China
Global Warming Solid majorities in every country surveyed say global warming is a serious problem, and majorities in 14 of the 24 countries say it is “very serious.” Nearly every Brazilian (92%) and at least two-thirds of the publics in Turkey (82%), Tanzania (75%), Japan (73%), France (72%), Argentina (70%), Mexico (70%), South Korea (68%), and Spain (67%) consider global warming a very serious problem. Among the publics included on the survey, the Chinese express the least concern about climate change – only 24% say it is a very serious problem. Anxiety about global warming is also low among Lebanese (43%), Americans (42%), Jordanians (41%) and Egyptians (38%).
65

Concern about global warming has increased in many countries since 2007. In Great Britain and Poland, where fewer than half said climate change was a very serious problem a year ago (45% and 40%, respectively), majorities now rate it as very serious (56% in Britain and 51% in Poland). And in Russia, where 40% rated climate change as a very serious problem and 58% said it was less serious or not a problem in 2007, the public is now divided – 49% say it is a very serious problem and 46% see it as less serious. In four countries – China, Japan, South Korea, and the United States – publics are less worried about climate change than they were in 2007. The change has been most dramatic in China, where the proportion who rate global warming as a very serious problem has dropped 18 points, from 42% last year to 24% in the current poll.
In the U.S., where 42% say global warming is a very serious problem, compared with 47% in 2007, Democrats express the most concern – 58% say it is very serious – and Republicans continue to be the least concerned (25% say it is very serious). However, most of the recent decline in the number rating global warming a very serious problem has occurred among politically independent respondents. About four-in-ten independents (41%) now rate global warming as a very serious problem, compared with nearly half (49%) a year ago. Who Hurts the Environment? By a significant margin, publics in 13 of the 24 countries surveyed name the United States more than any other country as the world’s top polluter. This view is especially prevalent in Argentina (54%), Spain (51%), and Pakistan (51%), where more than half say the U.S. is hurting the world’s environment the most. More than four-in-ten in Turkey (46%), Brazil (44%), and Indonesia (42%) also place clear blame on the United States, as do smaller pluralities in several other countries, including its neighbor to the south; 38% of Mexicans fault the U.S. for global environmental problems. In the Asia-Pacific countries of Japan, South Korea, and Australia, neighboring China is seen as the biggest contributor to global environmental problems. Fully two-thirds of Japanese and about the same share of South Korean respondents (64%) identify China as the world’s major polluter. In Australia, fewer than half name China (46%), but even fewer name the United States (24%), which receives the second most mentions in that country.
66

Aside from the Japanese, South Koreans, and Australians, Americans are the only other public surveyed that sees China as a considerably bigger threat to the environment than the United States. Four-in-ten Americans name China, while fewer than a quarter (22%) name their own country, a reversal from last year, when 22% placed the most responsibility for environmental problems on China and a third blamed the U.S.
In no country is a nation other than China or the
United States named by a majority or a plurality as the world’s top polluter. Poles, however, are about as likely to say Russia is most to blame for environmental problems (25%) as the U.S. (26%) or China (23%). And Indians blame their own country (19%) as much as they blame China (21%) and the U.S. (21%).
Criticism of China with respect to the
environment increased markedly in 13 of the 20 countries since 2007. The shift has been most dramatic in Japan, where respondents blame China more than the United States by a 50-point margin (67% vs. 17%). Just last year, about as many Japanese blamed China (34%) as blamed the U.S. (36%).
Less drastic but significant shifts have also
occurred in Western Europe. In France, more than half (53%) saw the United States as the top polluter in 2007, compared with just 23% who named China. Today, the French are split – 34% blame China and 35% blame the U.S. The British are also about equally as likely to name each of the two nations; in 2007, the U.S. received considerably more mentions than China in both countries.
Who Hurts the World’s Environment the Most?
China U.S. Diff. % % U.S. 40 22 +18 Spring, 2007 22 33 -11
Britain 40 36 +4 Spring, 2007 31 41 -10 France 34 35 -1 Spring, 2007 23 53 -30 Germany 39 34 +5 Spring, 2007 33 45 -12 Spain 17 51 -34 Spring, 2007 7 56 -49
Poland 23 26 -3 Spring, 2007 11 29 -18 Russia 18 28 -10 Spring, 2007 14 26 -12
Turkey 6 46 -40 Spring, 2007 3 61 -58
Egypt 20 22 -2 Spring, 2007 19 27 -8 Jordan 19 24 -5 Spring, 2007 19 22 -3 Lebanon 18 36 -18 Spring, 2007 19 37 -18
Australia 46 24 +22 China 9 26 -17 Spring, 2007 11 38 -27 India 21 21 0 Spring, 2007 10 25 -15 Indonesia 11 42 -31 Spring, 2007 6 52 -46 Japan 67 17 +50 Spring, 2007 34 36 -2 Pakistan 1 51 -50 Spring, 2007 1 41 -40 S. Korea 64 19 +45 Spring, 2007 56 30 +26
Argentina 7 54 -47 Spring, 2007 3 49 -46 Brazil 11 44 -33 Spring, 2007 6 49 -43 Mexico 13 38 -25 Spring, 2007 11 39 -28
Nigeria 11 24 -13 S. Africa 16 11 +5 Tanzania 5 27 -22 Respondents were asked which country is hurting the world’s environment the most among the U.S., China, India, Germany, Brazil, Japan and Russia.
67
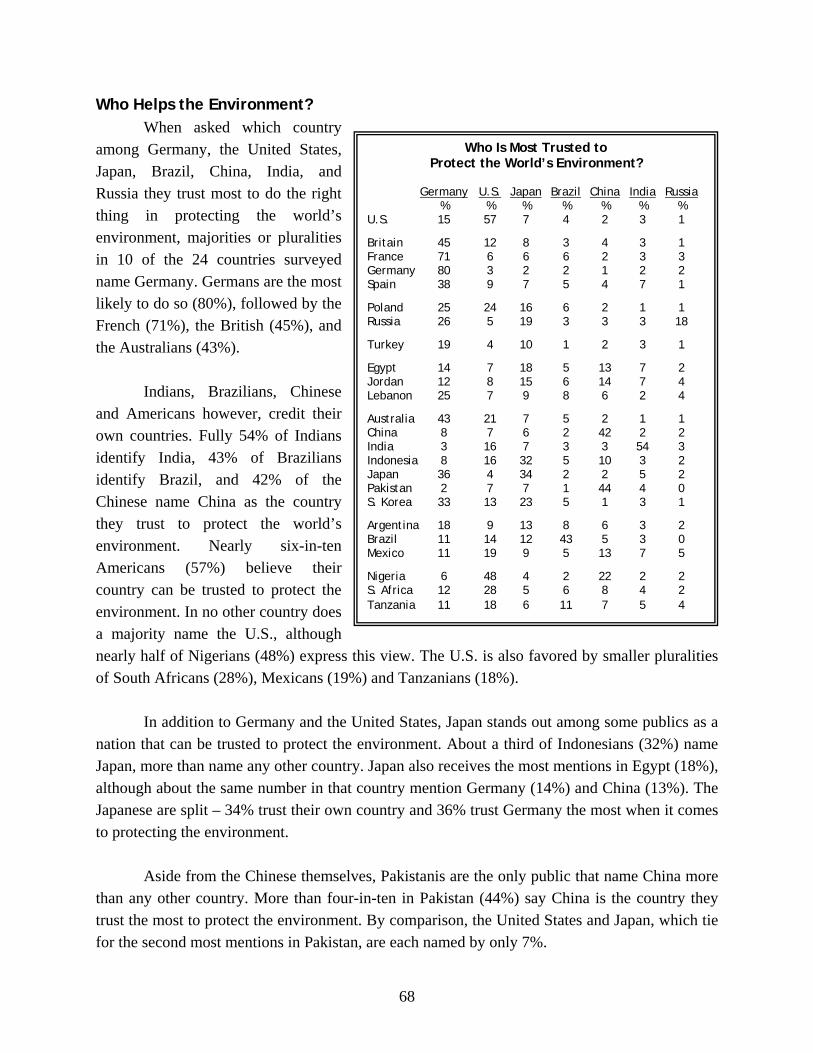
Who Helps the Environment? When asked which country among Germany, the United States, Japan, Brazil, China, India, and Russia they trust most to do the right thing in protecting the world’s environment, majorities or pluralities in 10 of the 24 countries surveyed name Germany. Germans are the most likely to do so (80%), followed by the French (71%), the British (45%), and the Australians (43%).
Indians, Brazilians, Chinese and Americans however, credit their own countries. Fully 54% of Indians identify India, 43% of Brazilians identify Brazil, and 42% of the Chinese name China as the country they trust to protect the world’s environment. Nearly six-in-ten Americans (57%) believe their country can be trusted to protect the environment. In no other country does a majority name the U.S., although nearly half of Nigerians (48%) express this view. The U.S. is also favored by smaller pluralities of South Africans (28%), Mexicans (19%) and Tanzanians (18%).
Who Is Most Trusted to Protect the World’s Environment?
In addition to Germany and the United States, Japan stands out among some publics as a
nation that can be trusted to protect the environment. About a third of Indonesians (32%) name Japan, more than name any other country. Japan also receives the most mentions in Egypt (18%), although about the same number in that country mention Germany (14%) and China (13%). The Japanese are split – 34% trust their own country and 36% trust Germany the most when it comes to protecting the environment.
Aside from the Chinese themselves, Pakistanis are the only public that name China more than any other country. More than four-in-ten in Pakistan (44%) say China is the country they trust the most to protect the environment. By comparison, the United States and Japan, which tie for the second most mentions in Pakistan, are each named by only 7%.
Germany U.S. Japan Brazil China India Russia % % % % % % % U.S. 15 57 7 4 2 3 1
Britain 45 12 8 3 4 3 1 France 71 6 6 6 2 3 3 Germany 80 3 2 2 1 2 2 Spain 38 9 7 5 4 7 1
Poland 25 24 16 6 2 1 1 Russia 26 5 19 3 3 3 18
Turkey 19 4 10 1 2 3 1
Egypt 14 7 18 5 13 7 2 Jordan 12 8 15 6 14 7 4 Lebanon 25 7 9 8 6 2 4
Australia 43 21 7 5 2 1 1 China 8 7 6 2 42 2 2 India 3 16 7 3 3 54 3 Indonesia 8 16 32 5 10 3 2 Japan 36 4 34 2 2 5 2 Pakistan 2 7 7 1 44 4 0 S. Korea 33 13 23 5 1 3 1
Argentina 18 9 13 8 6 3 2 Brazil 11 14 12 43 5 3 0 Mexico 11 19 9 5 13 7 5
Nigeria 6 48 4 2 22 2 2 S. Africa 12 28 5 6 8 4 2 Tanzania 11 18 6 11 7 5 4
68

Methodological Appendix
Country
Sample size
Margin of Error Field dates
Mode
Sample design
United States 1,000 3% April 9-17 Telephone National Britain 753 4% March 17 - April 6 Telephone National France 754 4% March 31 - April 8 Telephone National Germany 750 4% March 25 - April 9 Telephone National Spain 752 4% March 17 - April 17 Telephone National Poland 750 4% March 26 - April 14 Face-to-face National Russia 1,000 3% March 18 - April 4 Face-to-face National Turkey 1,003 3% March 31 - April 21 Face-to-face National Egypt 1,000 3% March 19 - April 7 Face-to-face National Jordan 1,000 3% March 18 - April 6 Face-to-face National Lebanon 1,000 3% March 19 - April 7 Face-to-face National Australia 700 4% March 20 - April 4 Telephone National China 3,212 2% March 28 - April 19 Face-to-face Disproportionately urban Pakistan 1,254 3% April 1-19 Face-to-face Disproportionately urban India 2,056 2% April 1-16 Face-to-face Disproportionately urban Indonesia 1,000 3% March 29 - April 14 Face-to-face National Japan 708 4% March 19 - April 13 Telephone National South Korea 714 4% March 20-27 Face-to-face National Argentina 801 3% March 25 - April 3 Face-to-face National Brazil 1,000 3% March 20 - April 8 Face-to-face Disproportionately urban Mexico 805 3% March 18-31 Face-to-face National Nigeria 1,000 3% April 8-21 Face-to-face National South Africa 1,001 3% March 18 - April 4 Face-to-face National Tanzania 704 4% March 31 - April 16 Face-to-face National Note: For more comprehensive information on the methodology of this study, see the “Methods in Detail” section.
69
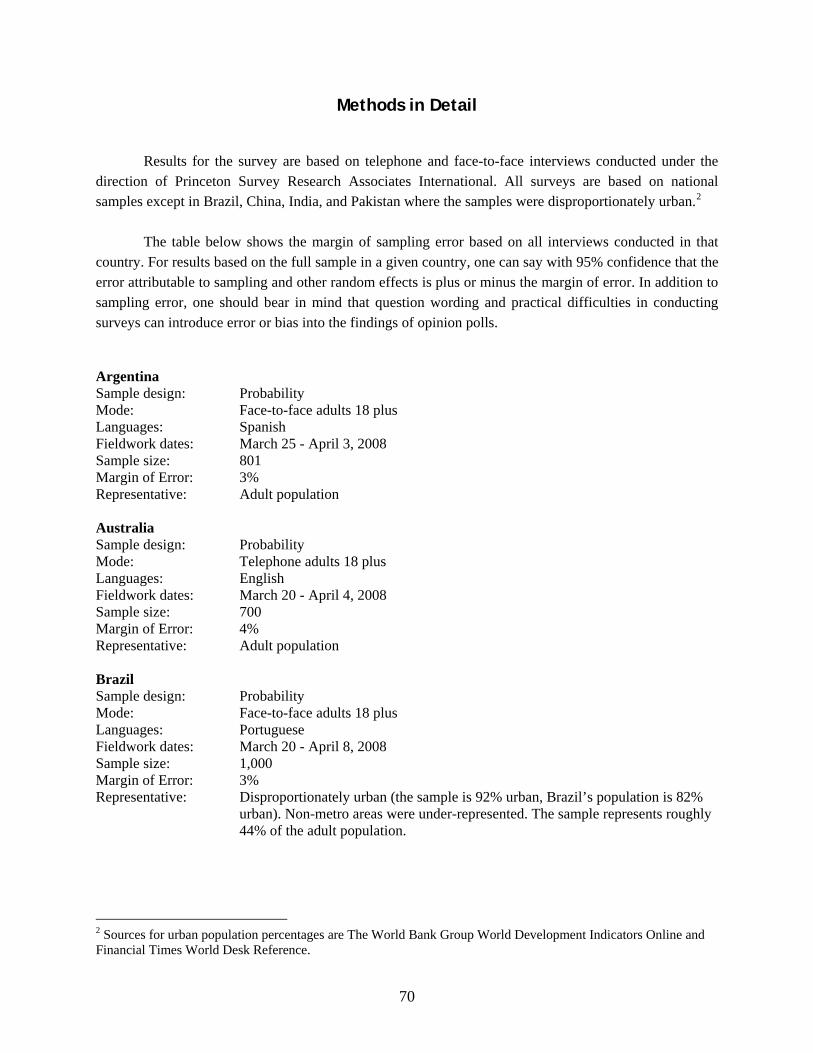
Methods in Detail Results for the survey are based on telephone and face-to-face interviews conducted under the direction of Princeton Survey Research Associates International. All surveys are based on national samples except in Brazil, China, India, and Pakistan where the samples were disproportionately urban.2 The table below shows the margin of sampling error based on all interviews conducted in that country. For results based on the full sample in a given country, one can say with 95% confidence that the error attributable to sampling and other random effects is plus or minus the margin of error. In addition to sampling error, one should bear in mind that question wording and practical difficulties in conducting surveys can introduce error or bias into the findings of opinion polls. Argentina Sample design: Probability Mode: Face-to-face adults 18 plus Languages: Spanish Fieldwork dates: March 25 - April 3, 2008 Sample size: 801 Margin of Error: 3% Representative: Adult population Australia Sample design: Probability Mode: Telephone adults 18 plus Languages: English Fieldwork dates: March 20 - April 4, 2008 Sample size: 700 Margin of Error: 4% Representative: Adult population Brazil Sample design: Probability Mode: Face-to-face adults 18 plus Languages: Portuguese Fieldwork dates: March 20 - April 8, 2008 Sample size: 1,000 Margin of Error: 3% Representative: Disproportionately urban (the sample is 92% urban, Brazil’s population is 82%
urban). Non-metro areas were under-represented. The sample represents roughly 44% of the adult population.
2 Sources for urban population percentages are The World Bank Group World Development Indicators Online and Financial Times World Desk Reference.
70
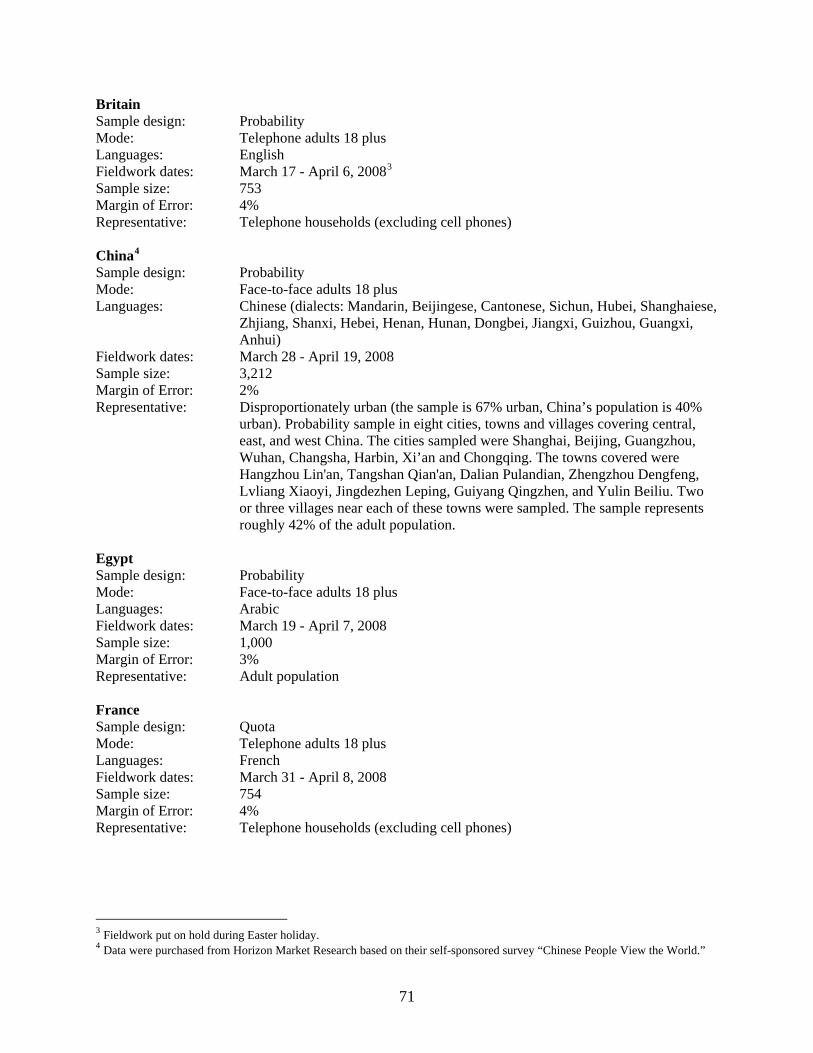
Britain Sample design: Probability Mode: Telephone adults 18 plus Languages: English Fieldwork dates: March 17 - April 6, 20083 Sample size: 753 Margin of Error: 4% Representative: Telephone households (excluding cell phones) China4 Sample design: Probability Mode: Face-to-face adults 18 plus Languages: Chinese (dialects: Mandarin, Beijingese, Cantonese, Sichun, Hubei, Shanghaiese,
Zhjiang, Shanxi, Hebei, Henan, Hunan, Dongbei, Jiangxi, Guizhou, Guangxi, Anhui)
Fieldwork dates: March 28 - April 19, 2008 Sample size: 3,212 Margin of Error: 2% Representative: Disproportionately urban (the sample is 67% urban, China’s population is 40%
urban). Probability sample in eight cities, towns and villages covering central, east, and west China. The cities sampled were Shanghai, Beijing, Guangzhou, Wuhan, Changsha, Harbin, Xi’an and Chongqing. The towns covered were Hangzhou Lin'an, Tangshan Qian'an, Dalian Pulandian, Zhengzhou Dengfeng, Lvliang Xiaoyi, Jingdezhen Leping, Guiyang Qingzhen, and Yulin Beiliu. Two or three villages near each of these towns were sampled. The sample represents roughly 42% of the adult population.
Egypt Sample design: Probability Mode: Face-to-face adults 18 plus Languages: Arabic Fieldwork dates: March 19 - April 7, 2008 Sample size: 1,000 Margin of Error: 3% Representative: Adult population France Sample design: Quota Mode: Telephone adults 18 plus Languages: French Fieldwork dates: March 31 - April 8, 2008 Sample size: 754 Margin of Error: 4% Representative: Telephone households (excluding cell phones)
3 Fieldwork put on hold during Easter holiday. 4 Data were purchased from Horizon Market Research based on their self-sponsored survey “Chinese People View the World.”
71

Germany Sample design: Probability Mode: Telephone adults 18 plus Languages: German Fieldwork dates: March 25 - April 9, 2008 Sample size: 750 Margin of Error: 4% Representative: Telephone households (excluding cell phones) India Sample design: Probability Mode: Face-to-face adults 18 plus Languages: Hindi, Telegu, Gujarati, Tamil, Bengali, English Fieldwork dates: April 1-16, 2008 Sample size: 2,056 Margin of Error: 2% Representative: Disproportionately urban (the sample is 76% urban, India’s population is 28%
urban). Eight states were surveyed representing roughly 61% of the population – Uttar Pradesh and National Capital Territory of Delhi in the north, Tamil Nadu and Andhra Pradesh in the south, West Bengal and Bihar in the east, and Gujarat and Maharashtra in the west. Towns and villages were under-represented.
Indonesia Sample design: Probability Mode: Face-to-face adults 18 plus Languages: Bahasa Indonesia, Palembang, Javanese, Banjar, Minang, Batak, Manado, Sunda,
Sasak, Melayu Fieldwork dates: March 29 - April 14, 2008 Sample size: 1,000 Margin of Error: 3% Representative: Adult population excluding Papua and remote areas or provinces with small
populations (excludes 12% of population) Japan Sample design: Probability Mode: Telephone adults 18 plus Languages: Japanese Fieldwork dates: March 19 - April 13, 2008 Sample size: 708 Margin of Error: 4% Representative: Adult population Jordan Sample design: Probability Mode: Face-to-face adults 18 plus Languages: Arabic Fieldwork dates: March 18 - April 6, 2008 Sample size: 1,000 Margin of Error: 3% Representative: Adult population
72

Lebanon Sample design: Probability Mode: Face-to-face adults 18 plus Languages: Arabic Fieldwork dates: March 19 - April 7, 2008 Sample size: 1,000 Margin of Error: 3% Representative: Adult population Mexico Sample design: Probability Mode: Face-to-face adults 18 plus Languages: Spanish Fieldwork dates: March 18-31, 2008 Sample size: 805 Margin of Error: 3% Representative: Adult population Nigeria Sample design: Probability Mode: Face-to-face adults 18 plus Languages: Hausa, Yoruba, Igbo, English, other local languages Fieldwork dates: April 8-21, 2008 Sample size: 1,000 Margin of Error: 3% Representative: Adult population Pakistan Sample design: Probability Mode: Face-to-face adults 18 plus Languages: Urdu, Punjabi, Sindhi, Pashto, Sariki, Hindko, Brahvi, Balochi Fieldwork dates: April 1-19, 2008 Sample size: 1,254 Margin of Error: 3% Representative: Disproportionately urban, excluding areas of instability particularly in the North
West Frontier and Baluchistan (the sample is 55% urban, Pakistan’s population is 33% urban). All four provinces of Pakistan are included in sample design. Towns and villages were under-represented. Sample covers roughly 90% of the adult population.
Poland Sample design: Probability Mode: Face-to-face adults 18 plus Languages: Polish Fieldwork dates: March 26 - April 14, 2008 Sample size: 750 Margin of Error: 4% Representative: Adult population
73

Russia Sample design Probability Mode: Face-to-face adults 18 plus Languages: Russian Fieldwork dates: March 18 - April 4, 2008 Sample size: 1,000 Margin of Error: 3% Representative: Adult population South Africa Sample design: Probability Mode: Face-to-face adults 18 plus Languages: Zulu, Afrikaans, South Sotho, North Sotho, Xhosa, Tswana, English, other local
languages Fieldwork dates: March 18 - April 4, 2008 Sample size: 1,001 Margin of Error: 3% Representative: Adult population South Korea Sample design: Probability Mode: Face-to-face adults 18 plus Languages: Korean Fieldwork dates: March 20-27, 2008 Sample size: 714 Margin of Error: 4% Representative: Adult population Spain Sample design: Probability Mode: Telephone adults 18 plus Languages: Spanish Fieldwork dates: March 17 - April 17, 20085 Sample size: 752 Margin of Error: 4% Representative: Adult population Tanzania Sample design: Probability Mode: Face-to-face adults 18 plus Languages: Kiswahili Fieldwork dates: March 31 - April 16, 2008 Sample size: 704 Margin of Error: 4% Representative: Adult population
5 Fieldwork put on hold during Easter holiday.
74

75
Turkey Sample design: Probability Mode: Face-to-face adults 18 plus Languages: Turkish, Kurdish Fieldwork dates: March 31 - April 21, 2008 Sample size: 1,003 Margin of Error: 3% Representative: Adult population United States Sample design: Probability Mode: Telephone adults 18 plus Languages: English Fieldwork dates: April 9-17, 2008 Sample size: 1,000 Margin of Error: 3% Representative: Telephone household in continental U.S. (excluding cell phones)

76

Pew Global Attitudes Project: Spring 2008 Survey Survey of 24 Nations
----FINAL 2008 TRENDS TOPLINE---- Countries and regions included in the survey:
The Americas: Argentina, Brazil, Mexico, United States Europe: Britain, France, Germany, Poland, Russia, Spain, Middle East: Egypt, Jordan, Lebanon, Turkey Asia/Pacific: Australia, China, India, Indonesia, Japan, Pakistan, South Korea Africa: Nigeria, South Africa, Tanzania
Methodological notes:
• Data based on national samples except in Brazil, China, India, and Pakistan where the samples are disproportionately urban.
• Due to rounding, percentages may not total 100%. The topline “total” columns always show
100%, however, because they are based on unrounded numbers.
• The 2007 and 2008 Global Attitudes surveys use a different process to generate toplines than previous Global Attitudes surveys. As a result, numbers may differ slightly from previously published numbers.
• Data from 2002 in India and Nigeria have been reweighted since their initial publication, and the
revised numbers may differ from previously published numbers.
• Previous trends from Egypt in 2002 and South Africa in 2007 are not shown because those results were based on disproportionately urban samples, while the 2008 samples are nationally representative in this country.
77

QUESTION Q1 HELD FOR FUTURE RELEASE
23 70 6 100
25 71 4 100
29 65 6 100
39 57 5 100
39 55 6 100
41 55 4 100
30 65 5 100
30 66 4 100
35 58 6 100
44 51 5 100
38 58 4 100
46 49 5 100
30 63 6 100
32 64 4 100
29 71 0 100
22 78 0 100
20 80 0 100
28 71 0 100
32 68 0 100
44 56 0 100
31 67 2 100
32 67 1 100
34 63 3 100
33 66 2 100
29 67 5 100
25 73 2 100
20 78 2 100
25 73 2 100
18 79 3 100
31 66 3 100
50 43 7 100
51 45 4 100
50 46 4 100
51 44 5 100
45 52 3 100
41 47 12 100
42 47 11 100
18 74 8 100
13 82 5 100
7 89 4 100
9 87 4 100
Spring, 2008 --Spring, 2007Spring, 2006May, 2005March, 2004Summer, 2002
UnitedStates
Spring, 2008 --Spring, 2007Spring, 2006May, 2005March, 2004May, 2003March, 2003Summer, 2002
Britain
Spring, 2008 --Spring, 2007Spring, 2006May, 2005March, 2004May, 2003March, 2003Summer, 2002
France
Spring, 2008 --Spring, 2007Spring, 2006May, 2005March, 2004May, 2003March, 2003Summer, 2002
Germany
Spring, 2008 --Spring, 2007Spring, 2006May, 2005May, 2003March, 2003
Spain
Spring, 2008 --Spring, 2007May, 2005March, 2003Summer, 2002
Poland
Satisfied Dissatisfied DK/Refused
Q2 Overall, are you satisfied or dissatisfiedwith the way things are going in our country
today?Total
78
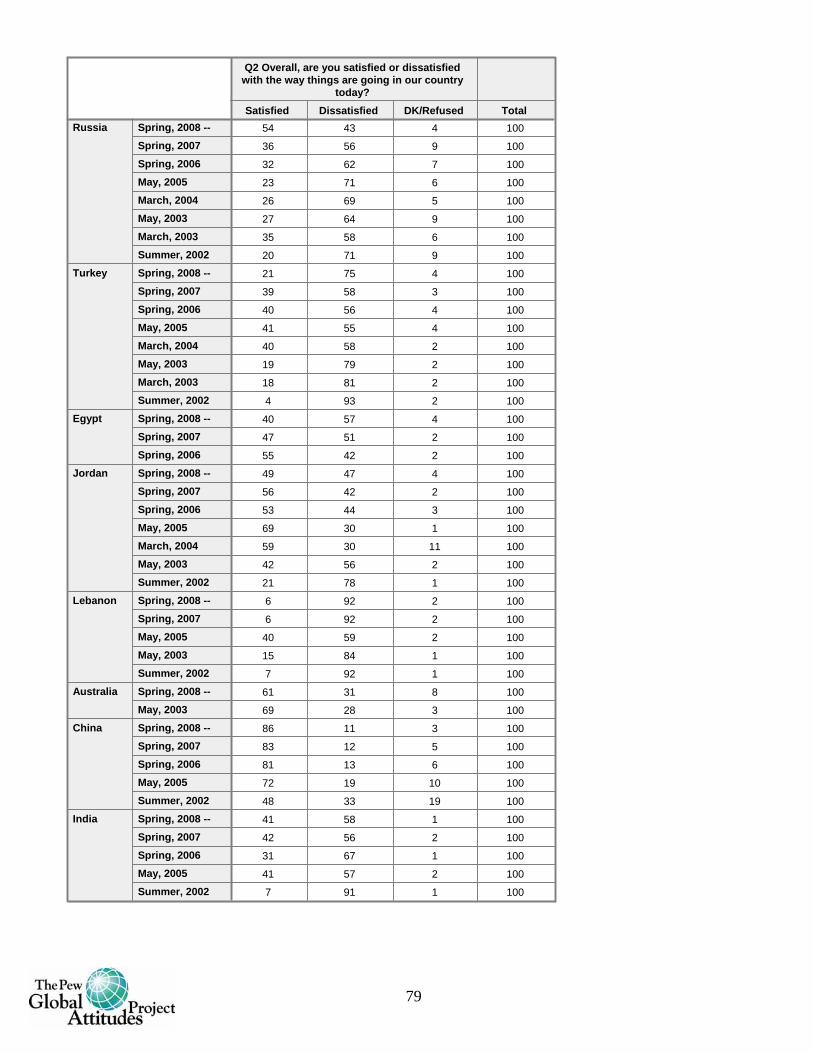
54 43 4 100
36 56 9 100
32 62 7 100
23 71 6 100
26 69 5 100
27 64 9 100
35 58 6 100
20 71 9 100
21 75 4 100
39 58 3 100
40 56 4 100
41 55 4 100
40 58 2 100
19 79 2 100
18 81 2 100
4 93 2 100
40 57 4 100
47 51 2 100
55 42 2 100
49 47 4 100
56 42 2 100
53 44 3 100
69 30 1 100
59 30 11 100
42 56 2 100
21 78 1 100
6 92 2 100
6 92 2 100
40 59 2 100
15 84 1 100
7 92 1 100
61 31 8 100
69 28 3 100
86 11 3 100
83 12 5 100
81 13 6 100
72 19 10 100
48 33 19 100
41 58 1 100
42 56 2 100
31 67 1 100
41 57 2 100
7 91 1 100
Spring, 2008 --Spring, 2007Spring, 2006May, 2005March, 2004May, 2003March, 2003Summer, 2002
Russia
Spring, 2008 --Spring, 2007Spring, 2006May, 2005March, 2004May, 2003March, 2003Summer, 2002
Turkey
Spring, 2008 --Spring, 2007Spring, 2006
Egypt
Spring, 2008 --Spring, 2007Spring, 2006May, 2005March, 2004May, 2003Summer, 2002
Jordan
Spring, 2008 --Spring, 2007May, 2005May, 2003Summer, 2002
Lebanon
Spring, 2008 --May, 2003
Australia
Spring, 2008 --Spring, 2007Spring, 2006May, 2005Summer, 2002
China
Spring, 2008 --Spring, 2007Spring, 2006May, 2005Summer, 2002
India
Satisfied Dissatisfied DK/Refused
Q2 Overall, are you satisfied or dissatisfiedwith the way things are going in our country
today?Total
79

30 68 2 100
22 77 1 100
26 73 1 100
35 64 1 100
15 85 1 100
7 92 1 100
23 74 3 100
22 71 7 100
27 72 1 100
12 86 2 100
25 73 2 100
39 57 4 100
35 58 7 100
57 39 4 100
54 41 5 100
29 67 4 100
49 39 12 100
13 81 5 100
9 86 5 100
20 73 7 100
14 81 5 100
14 83 3 100
38 54 7 100
3 96 1 100
31 67 2 100
17 82 1 100
22 77 1 100
11 88 1 100
30 68 2 100
30 66 3 100
16 79 6 100
24 75 1 100
11 87 2 100
7 93 0 100
19 80 0 100
13 86 1 100
36 62 2 100
20 79 1 100
34 65 0 100
46 52 1 100
40 55 5 100
Spring, 2008 --Spring, 2007Spring, 2006May, 2005May, 2003Summer, 2002
Indonesia
Spring, 2008 --Spring, 2007Spring, 2006Summer, 2002
Japan
Spring, 2008 --Spring, 2007Spring, 2006May, 2005March, 2004May, 2003Summer, 2002
Pakistan
Spring, 2008 --Spring, 2007May, 2003Summer, 2002
SouthKorea
Spring, 2008 --Spring, 2007Summer, 2002
Argentina
Spring, 2008 --Spring, 2007May, 2003Summer, 2002
Brazil
Spring, 2008 --Spring, 2007Summer, 2002
Mexico
Spring, 2008 --Spring, 2007Spring, 2006May, 2003Summer, 2002
Nigeria
Spring, 2008 --Summer, 2002
SouthAfrica
Spring, 2008 --Spring, 2007Summer, 2002
Tanzania
Satisfied Dissatisfied DK/Refused
Q2 Overall, are you satisfied or dissatisfiedwith the way things are going in our country
today?Total
QUESTIONS Q3a - Q3c HELD FOR FUTURE RELEASE
80

2 18 41 36 3 100
9 41 32 16 3 100
4 42 39 13 2 100
2 28 47 20 2 100
13 56 20 8 3 100
8 57 24 8 4 100
0 19 61 20 0 100
1 29 53 17 0 100
1 44 47 6 2 100
4 49 39 7 1 100
8 55 25 11 1 100
1 26 55 16 1 100
1 34 43 19 3 100
9 56 29 5 1 100
3 49 36 6 6 100
0 36 48 13 3 100
0 7 40 51 2 100
5 47 37 6 4 100
3 35 45 11 6 100
0 13 57 26 4 100
4 17 27 47 4 100
9 37 29 22 3 100
2 12 15 70 2 100
10 34 29 25 2 100
13 40 23 23 2 100
8 31 44 16 1 100
12 32 41 13 2 100
6 27 49 18 1 100
1 9 38 52 1 100
2 7 32 54 4 100
0 5 25 70 0 100
11 58 22 6 3 100
5 77 13 1 4 100
16 66 13 1 4 100
3 49 37 10 1 100
11 51 23 15 1 100
19 55 16 9 2 100
2 37 24 35 2 100
1 19 44 35 0 100
2 21 52 25 1 100
0 15 53 32 0 100
1 12 57 28 1 100
1 27 54 17 2 100
0 6 42 51 0 100
Spring, 2008 --Spring, 2007Summer, 2002
UnitedStates
Spring, 2008 --Spring, 2007Summer, 2002
Britain
Spring, 2008 --Spring, 2007Summer, 2002
France
Spring, 2008 --Spring, 2007Summer, 2002
Germany
Spring, 2008 --Spring, 2007
Spain
Spring, 2008 --Spring, 2007Summer, 2002
Poland
Spring, 2008 --Spring, 2007Summer, 2002
Russia
Spring, 2008 --Spring, 2007Summer, 2002
Turkey
Spring, 2008 --Spring, 2007
Egypt
Spring, 2008 --Spring, 2007Summer, 2002
Jordan
Spring, 2008 --Spring, 2007Summer, 2002
Lebanon
Spring, 2008 --AustraliaSpring, 2008 --Spring, 2007Summer, 2002
China
Spring, 2008 --Spring, 2007Summer, 2002
India
Spring, 2008 --Spring, 2007Summer, 2002
Indonesia
Spring, 2008 --Spring, 2007Summer, 2002
Japan
Very goodSomewhat
good Somewhat bad Very bad DK/Refused
Q4 Now thinking about our economic situation, how would you describe thecurrent economic situation in (survey country) – is it very good, somewhat good,
somewhat bad or very bad?
Total
81

8 33 21 35 4 100
20 39 20 12 9 100
8 41 16 20 14 100
0 7 66 26 1 100
0 8 63 28 1 100
1 19 72 7 1 100
1 22 49 25 2 100
3 42 42 8 5 100
0 1 26 72 0 100
3 38 44 15 1 100
1 29 48 21 1 100
1 13 53 32 2 100
6 30 35 27 2 100
7 44 29 18 1 100
3 28 36 30 3 100
10 31 25 35 0 100
5 32 27 36 0 100
6 26 29 39 1 100
12 27 29 28 4 100
6 23 28 42 1 100
2 46 33 18 1 100
5 47 32 15 2 100
3 44 32 19 3 100
Spring, 2008 --Spring, 2007Summer, 2002
Pakistan
Spring, 2008 --Spring, 2007Summer, 2002
SouthKorea
Spring, 2008 --Spring, 2007Summer, 2002
Argentina
Spring, 2008 --Spring, 2007Summer, 2002
Brazil
Spring, 2008 --Spring, 2007Summer, 2002
Mexico
Spring, 2008 --Spring, 2007Summer, 2002
Nigeria
Spring, 2008 --Summer, 2002
SouthAfrica
Spring, 2008 --Spring, 2007Summer, 2002
Tanzania
Very goodSomewhat
good Somewhat bad Very bad DK/Refused
Q4 Now thinking about our economic situation, how would you describe thecurrent economic situation in (survey country) – is it very good, somewhat good,
somewhat bad or very bad?
Total
82

7 27 24 26 13 4 100
9 39 28 17 5 2 100
2 12 28 37 18 2 100
5 22 39 24 7 3 100
1 18 34 33 13 0 100
3 29 36 23 6 2 100
3 29 39 23 6 1 100
3 37 39 17 4 1 100
1 17 33 36 7 5 100
4 33 44 10 2 7 100
0 12 51 19 11 7 100
8 34 39 10 3 6 100
1 21 53 13 5 7 100
2 12 17 29 26 14 100
3 18 22 22 27 8 100
1 14 35 31 19 2 100
5 14 34 25 21 1 100
6 25 40 21 7 2 100
2 22 22 32 18 4 100
1 13 23 22 36 5 100
6 22 30 34 6 2 100
32 53 9 2 0 3 100
4 32 53 6 1 3 100
12 43 27 9 7 3 100
4 35 29 14 13 5 100
4 23 42 18 6 7 100
6 35 46 9 2 2 100
0 5 47 38 10 0 100
0 11 63 21 5 0 100
14 39 18 8 8 12 100
7 33 18 6 5 30 100
1 32 42 20 3 3 100
3 45 39 10 2 1 100
1 29 29 24 9 7 100
1 29 26 21 12 11 100
35 36 18 5 4 1 100
20 38 19 10 10 3 100
12 30 35 16 5 2 100
11 33 29 12 8 6 100
32 39 13 6 7 3 100
44 28 10 7 5 5 100
19 25 21 15 14 6 100
27 23 17 15 15 3 100
8 33 19 12 16 11 100
8 35 18 10 10 18 100
Spring, 2008 --Summer, 2002
UnitedStates
Spring, 2008 --Summer, 2002
Britain
Spring, 2008 --Summer, 2002
France
Spring, 2008 --Summer, 2002
Germany
Spring, 2008 --SpainSpring, 2008 --Summer, 2002
Poland
Spring, 2008 --Summer, 2002
Russia
Spring, 2008 --Summer, 2002
Turkey
Spring, 2008 --EgyptSpring, 2008 --Summer, 2002
Jordan
Spring, 2008 --Summer, 2002
Lebanon
Spring, 2008 --AustraliaSpring, 2008 --Summer, 2002
China
Spring, 2008 --Summer, 2002
India
Spring, 2008 --Summer, 2002
Indonesia
Spring, 2008 --Summer, 2002
Japan
Spring, 2008 --Summer, 2002
Pakistan
Spring, 2008 --Summer, 2002
SouthKorea
Spring, 2008 --Summer, 2002
Argentina
Spring, 2008 --Summer, 2002
Brazil
Spring, 2008 --Summer, 2002
Mexico
Spring, 2008 --Summer, 2002
Nigeria
Spring, 2008 --Summer, 2002
SouthAfrica
Spring, 2008 --Summer, 2002
Tanzania
Improve a lotImprove a
littleRemain the
same Worsen a little Worsen a lot DK/Refused
Q5 And over the next 12 months do you expect the economic situation in our country to improve alot, improve a little, remain the same, worsen a little or worsen a lot?
Total
83

13 58 18 7 3 100
9 63 21 5 2 100
3 65 26 6 0 100
7 60 23 8 1 100
3 65 23 6 3 100
2 61 28 5 4 100
3 43 40 9 5 100
3 37 29 25 5 100
6 20 39 33 1 100
3 28 44 24 1 100
4 27 42 25 2 100
15 65 14 5 1 100
3 63 28 4 2 100
3 53 36 6 2 100
16 68 13 3 1 100
2 46 40 12 1 100
1 36 48 13 3 100
14 56 18 10 2 100
1 30 60 7 2 100
3 47 35 11 5 100
2 64 29 5 0 100
6 54 30 9 2 100
16 46 23 15 1 100
10 34 29 25 2 100
3 44 29 23 1 100
Spring, 2008 --United StatesSpring, 2008 --BritainSpring, 2008 --FranceSpring, 2008 --GermanySpring, 2008 --SpainSpring, 2008 --PolandSpring, 2008 --RussiaSpring, 2008 --TurkeySpring, 2008 --EgyptSpring, 2008 --JordanSpring, 2008 --LebanonSpring, 2008 --AustraliaSpring, 2008 --Spring, 2007
China
Spring, 2008 --IndiaSpring, 2008 --IndonesiaSpring, 2008 --JapanSpring, 2008 --PakistanSpring, 2008 --South KoreaSpring, 2008 --ArgentinaSpring, 2008 --BrazilSpring, 2008 --MexicoSpring, 2008 --NigeriaSpring, 2008 --South AfricaSpring, 2008 --Tanzania
Very goodSomewhat
good Somewhat bad Very bad DK/Refused
Q6 Now thinking about your personal economic situation, how would youdescribe it – is it very good, somewhat good, somewhat bad or very bad?
Total
QUESTIONS Q7A - Q9 HELD FOR FUTURE RELEASE
84

53 31 8 6 3 100
47 33 12 6 2 100
49 27 10 7 6 100
50 33 10 4 3 100
8 45 25 12 10 100
9 42 29 13 7 100
11 45 20 13 11 100
13 42 27 11 7 100
15 43 24 10 8 100
18 52 14 12 5 100
14 34 24 16 11 100
27 48 12 4 9 100
4 38 39 18 0 100
5 34 44 16 0 100
2 37 43 17 1 100
3 40 42 15 0 100
6 31 42 20 2 100
8 34 38 19 1 100
6 25 45 22 2 100
8 54 26 8 3 100
3 28 53 13 4 100
2 28 47 19 4 100
2 35 46 14 3 100
4 38 44 10 5 100
3 35 49 10 3 100
6 39 42 12 1 100
4 21 41 30 4 100
9 51 31 4 4 100
2 31 33 22 12 100
2 32 32 28 6 100
4 19 37 36 5 100
14 27 34 16 9 100
8 30 29 26 6 100
3 11 35 39 12 100
6 62 20 4 8 100
12 49 25 6 9 100
11 51 18 5 14 100
9 41 33 11 7 100
14 65 10 1 10 100
12 34 28 20 7 100
8 33 32 16 11 100
9 34 28 19 10 100
9 43 31 9 8 100
9 37 29 15 11 100
11 26 32 23 8 100
4 24 43 25 4 100
8 53 27 6 7 100
Spring, 2008 --Spring, 2007
Spring, 2006May, 2005
UnitedStates
Spring, 2008 --Spring, 2007
Spring, 2006May, 2005March, 2004
May, 2003March, 2003Summer, 2002
Britain
Spring, 2008 --Spring, 2007Spring, 2006May, 2005
March, 2004May, 2003March, 2003
Summer, 2002
France
Spring, 2008 --Spring, 2007
Spring, 2006May, 2005March, 2004May, 2003
March, 2003Summer, 2002
Germany
Spring, 2008 --
Spring, 2007Spring, 2006May, 2005
May, 2003March, 2003
Spain
Spring, 2008 --Spring, 2007
May, 2005March, 2003Summer, 2002
Poland
Spring, 2008 --Spring, 2007Spring, 2006
May, 2005March, 2004May, 2003March, 2003
Summer, 2002
Russia
Very favorableSomewhatfavorable
Somewhatunfavorable
Veryunfavorable DK/Refused
Q10a On a different topic, please tell me if you have a very favorable, somewhatfavorable, somewhat unfavorable or very unfavorable opinion of: a. The United States
Total
85

4 8 7 70 11 100
2 7 8 75 8 100
2 10 9 67 12 100
4 19 13 54 10 100
6 24 18 45 7 100
2 13 15 68 3 100
3 9 17 67 5 100
6 24 13 41 16 100
10 12 35 40 4 100
7 14 32 46 2 100
5 25 33 36 1 100
5 14 31 48 2 100
8 12 26 52 2 100
6 9 30 55 0 100
9 12 21 59 0 100
2 3 26 67 1 100
0 1 16 83 0 100
6 19 18 57 0 100
18 33 19 30 1 100
16 31 24 28 1 100
22 20 18 40 0 100
8 19 23 48 2 100
9 27 21 38 6 100
6 40 34 14 6 100
16 43 27 11 3 100
5 36 37 11 11 100
2 32 47 10 8 100
9 38 37 6 10 100
5 37 40 13 5 100
23 43 10 15 9 100
20 39 18 10 12 100
18 38 14 14 16 100
29 42 8 9 12 100
21 45 13 15 5 100
7 30 37 16 10 100
4 25 41 25 5 100
7 23 42 25 4 100
6 32 40 17 5 100
2 13 35 48 1 100
5 56 27 9 3 100
4 46 41 7 2 100
8 53 33 3 3 100
8 55 29 6 3 100
13 59 23 3 2 100
Spring, 2008 --Spring, 2007
Spring, 2006May, 2005March, 2004May, 2003
March, 2003Summer, 2002
Turkey
Spring, 2008 --
Spring, 2007Spring, 2006
Egypt
Spring, 2008 --
Spring, 2007Spring, 2006May, 2005March, 2004
May, 2003Summer, 2002
Jordan
Spring, 2008 --
Spring, 2007May, 2005May, 2003
Summer, 2002
Lebanon
Spring, 2008 --May, 2003
Australia
Spring, 2008 --
Spring, 2007Spring, 2006May, 2005
China
Spring, 2008 --Spring, 2007Spring, 2006
May, 2005Summer, 2002
India
Spring, 2008 --Spring, 2007
Spring, 2006May, 2005May, 2003
Summer, 2002
Indonesia
Spring, 2008 --Spring, 2007
Spring, 2006Summer, 2002
Japan
Very favorableSomewhatfavorable
Somewhatunfavorable
Veryunfavorable DK/Refused
Q10a On a different topic, please tell me if you have a very favorable, somewhatfavorable, somewhat unfavorable or very unfavorable opinion of: a. The United States
Total
86

6 13 11 52 17 100
4 11 14 54 16 100
7 20 14 42 17 100
6 17 12 48 18 100
4 17 10 50 18 100
3 10 10 71 6 100
2 8 11 58 20 100
4 66 25 3 2 100
3 55 33 5 5 100
3 43 39 11 4 100
4 48 37 7 3 100
3 19 29 33 17 100
3 13 31 41 11 100
9 25 26 23 17 100
4 43 33 11 9 100
4 40 38 13 5 100
5 30 47 14 5 100
6 45 26 6 16 100
13 34 25 19 9 100
10 46 26 15 3 100
15 49 15 10 10 100
40 24 13 20 3 100
44 26 9 18 3 100
34 28 20 16 3 100
31 30 15 21 3 100
38 38 7 5 12 100
28 32 8 16 16 100
31 34 9 19 8 100
35 30 11 10 14 100
20 26 15 24 13 100
17 36 16 10 21 100
Spring, 2008 --Spring, 2007
Spring, 2006May, 2005March, 2004May, 2003
Summer, 2002
Pakistan
Spring, 2008 --Spring, 2007
May, 2003Summer, 2002
SouthKorea
Spring, 2008 --
Spring, 2007Summer, 2002
Argentina
Spring, 2008 --Spring, 2007
May, 2003Summer, 2002
Brazil
Spring, 2008 --
Spring, 2007Summer, 2002
Mexico
Spring, 2008 --
Spring, 2007Spring, 2006May, 2003Summer, 2002
Nigeria
Spring, 2008 --Summer, 2002
SouthAfrica
Spring, 2008 --
Spring, 2007Summer, 2002
Tanzania
Very favorableSomewhatfavorable
Somewhatunfavorable
Veryunfavorable DK/Refused
Q10a On a different topic, please tell me if you have a very favorable, somewhatfavorable, somewhat unfavorable or very unfavorable opinion of: a. The United States
Total
87

50 38 7 2 3 100
46 40 10 2 2 100
53 32 6 3 6 100
49 39 8 1 2 100
13 57 14 5 11 100
16 54 16 4 10 100
20 49 16 5 10 100
18 52 18 4 8 100
20 52 14 5 9 100
27 53 9 5 5 100
24 58 8 3 8 100
7 57 26 10 0 100
7 54 31 8 1 100
5 60 27 8 0 100
5 59 29 7 1 100
5 48 30 13 3 100
13 45 29 13 1 100
10 61 21 5 3 100
7 48 29 5 11 100
10 53 26 7 5 100
5 61 22 4 7 100
9 57 20 4 11 100
9 59 20 5 6 100
15 52 23 7 4 100
12 58 20 3 7 100
2 39 24 15 19 100
6 40 27 18 10 100
4 33 33 18 11 100
16 40 22 8 15 100
11 36 25 16 13 100
8 62 18 3 8 100
11 52 22 4 11 100
13 55 14 3 16 100
12 65 11 1 11 100
12 45 22 12 9 100
8 46 26 8 11 100
11 46 23 11 10 100
10 51 23 6 11 100
13 51 17 8 11 100
17 48 18 7 10 100
9 58 21 3 9 100
Spring, 2008 --Spring, 2007
Spring, 2006May, 2005
UnitedStates
Spring, 2008 --Spring, 2007
Spring, 2006May, 2005March, 2004
May, 2003Summer, 2002
Britain
Spring, 2008 --
Spring, 2007Spring, 2006May, 2005March, 2004
May, 2003Summer, 2002
France
Spring, 2008 --
Spring, 2007Spring, 2006May, 2005
March, 2004May, 2003Summer, 2002
Germany
Spring, 2008 --
Spring, 2007Spring, 2006May, 2005
May, 2003
Spain
Spring, 2008 --Spring, 2007
May, 2005Summer, 2002
Poland
Spring, 2008 --Spring, 2007
Spring, 2006May, 2005March, 2004
May, 2003Summer, 2002
Russia
Very favorableSomewhatfavorable
Somewhatunfavorable
Veryunfavorable DK/Refused
Q10b On a different topic, please tell me if you have a very favorable, somewhatfavorable, somewhat unfavorable or very unfavorable opinion of: b. Americans
Total
88

3 10 11 59 17 100
1 12 14 63 10 100
2 15 14 55 14 100
4 19 17 46 14 100
6 26 21 33 15 100
5 27 17 43 8 100
6 26 12 38 18 100
11 20 30 35 5 100
7 24 27 40 2 100
8 28 30 33 1 100
9 27 35 28 2 100
6 30 32 30 3 100
3 36 31 30 1 100
9 25 27 39 0 100
4 17 40 33 6 100
3 15 36 46 0 100
21 33 17 29 1 100
21 53 10 16 1 100
25 44 14 17 1 100
32 34 18 14 1 100
21 41 21 17 1 100
14 33 22 24 7 100
12 54 21 4 9 100
19 55 17 2 6 100
5 33 38 12 12 100
3 35 44 9 9 100
6 44 34 5 12 100
5 38 38 11 8 100
18 45 14 16 7 100
18 40 21 13 9 100
23 44 14 12 7 100
28 42 9 9 11 100
23 49 10 12 5 100
7 38 32 12 11 100
4 38 39 13 6 100
6 30 42 18 5 100
8 38 37 9 8 100
6 50 31 11 2 100
5 60 25 8 3 100
5 60 27 3 4 100
11 64 18 1 5 100
16 66 13 3 2 100
10 63 22 2 4 100
Spring, 2008 --Spring, 2007
Spring, 2006May, 2005March, 2004May, 2003
Summer, 2002
Turkey
Spring, 2008 --Spring, 2007
Spring, 2006
Egypt
Spring, 2008 --Spring, 2007
Spring, 2006May, 2005March, 2004May, 2003
Summer, 2002
Jordan
Spring, 2008 --Spring, 2007
May, 2005May, 2003Summer, 2002
Lebanon
Spring, 2008 --May, 2003
Australia
Spring, 2008 --Spring, 2007
Spring, 2006May, 2005
China
Spring, 2008 --
Spring, 2007Spring, 2006May, 2005
Summer, 2002
India
Spring, 2008 --Spring, 2007Spring, 2006
May, 2005May, 2003Summer, 2002
Indonesia
Spring, 2008 --Spring, 2007Spring, 2006
Summer, 2002
Japan
Very favorableSomewhatfavorable
Somewhatunfavorable
Veryunfavorable DK/Refused
Q10b On a different topic, please tell me if you have a very favorable, somewhatfavorable, somewhat unfavorable or very unfavorable opinion of: b. Americans
Total
89

4 16 17 39 24 100
4 15 18 42 21 100
5 22 18 34 20 100
5 17 14 41 22 100
5 20 13 34 27 100
8 30 11 40 11 100
3 14 12 50 22 100
3 74 19 2 2 100
3 67 23 3 4 100
4 70 17 3 6 100
3 57 30 5 4 100
2 22 24 28 23 100
3 23 28 30 17 100
5 27 23 20 25 100
3 48 31 9 8 100
3 42 39 10 5 100
4 40 40 10 7 100
6 48 24 5 16 100
9 35 27 19 11 100
10 42 30 12 6 100
11 45 19 13 12 100
34 28 15 20 3 100
38 28 11 17 5 100
28 28 21 19 5 100
32 35 12 17 3 100
38 34 11 5 12 100
26 38 10 12 14 100
30 37 8 17 9 100
37 32 9 7 14 100
20 32 14 18 16 100
16 36 15 10 23 100
Spring, 2008 --Spring, 2007
Spring, 2006May, 2005March, 2004May, 2003
Summer, 2002
Pakistan
Spring, 2008 --Spring, 2007
May, 2003Summer, 2002
SouthKorea
Spring, 2008 --
Spring, 2007Summer, 2002
Argentina
Spring, 2008 --Spring, 2007
May, 2003Summer, 2002
Brazil
Spring, 2008 --
Spring, 2007Summer, 2002
Mexico
Spring, 2008 --
Spring, 2007Spring, 2006May, 2003Summer, 2002
Nigeria
Spring, 2008 --Summer, 2002
SouthAfrica
Spring, 2008 --
Spring, 2007Summer, 2002
Tanzania
Very favorableSomewhatfavorable
Somewhatunfavorable
Veryunfavorable DK/Refused
Q10b On a different topic, please tell me if you have a very favorable, somewhatfavorable, somewhat unfavorable or very unfavorable opinion of: b. Americans
Total
90

9 30 26 16 19 100
8 34 25 14 18 100
12 40 19 10 19 100
9 34 22 13 22 100
7 40 24 12 17 100
7 42 21 6 25 100
10 55 11 3 20 100
13 52 13 3 18 100
3 25 39 33 0 100
4 43 38 13 1 100
7 53 29 12 0 100
6 52 29 13 0 100
2 24 45 23 6 100
5 29 42 12 12 100
6 50 28 5 10 100
5 41 33 4 16 100
3 28 33 23 13 100
4 35 30 13 17 100
5 40 26 12 18 100
18 39 16 5 23 100
1 32 39 15 13 100
4 35 34 8 19 100
5 32 25 9 30 100
10 50 24 6 10 100
9 51 21 5 13 100
14 49 20 7 10 100
11 49 23 6 12 100
12 59 16 2 11 100
6 18 11 39 26 100
4 21 17 36 22 100
7 26 12 32 24 100
9 31 15 24 22 100
22 37 21 8 12 100
26 39 25 6 4 100
20 43 20 12 6 100
9 35 36 16 4 100
7 39 35 14 6 100
8 41 36 10 5 100
6 37 35 18 5 100
12 38 18 24 8 100
13 33 19 29 6 100
19 47 21 7 6 100
6 46 31 9 8 100
60 35 2 0 2 100
53 40 6 0 2 100
58 36 4 1 2 100
53 35 8 1 2 100
Spring, 2008 --Spring, 2007Spring, 2006May, 2005
UnitedStates
Spring, 2008 --
Spring, 2007Spring, 2006May, 2005
Britain
Spring, 2008 --Spring, 2007Spring, 2006May, 2005
France
Spring, 2008 --
Spring, 2007Spring, 2006May, 2005
Germany
Spring, 2008 --Spring, 2007Spring, 2006May, 2005
Spain
Spring, 2008 --
Spring, 2007May, 2005
Poland
Spring, 2008 --Spring, 2007Spring, 2006May, 2005Summer, 2002
Russia
Spring, 2008 --Spring, 2007
Spring, 2006May, 2005
Turkey
Spring, 2008 --Spring, 2007Spring, 2006
Egypt
Spring, 2008 --Spring, 2007Spring, 2006
May, 2005
Jordan
Spring, 2008 --Spring, 2007May, 2005
Lebanon
Spring, 2008 --AustraliaSpring, 2008 --Spring, 2007Spring, 2006
May, 2005
China
Very favorableSomewhatfavorable
Somewhatunfavorable
Veryunfavorable DK/Refused
Q10c On a different topic, please tell me if you have a very favorable, somewhatfavorable, somewhat unfavorable or very unfavorable opinion of: c. China
Total
91

9 37 21 24 10 100
14 32 23 20 11 100
12 35 17 22 13 100
15 41 12 8 23 100
6 52 28 6 8 100
5 60 26 4 5 100
11 51 28 3 6 100
16 57 23 2 2 100
4 64 24 6 2 100
1 13 50 34 2 100
3 26 51 16 4 100
3 24 49 22 1 100
8 47 35 7 3 100
54 22 3 5 16 100
57 22 2 4 15 100
47 22 4 3 23 100
56 23 2 2 17 100
2 46 41 8 3 100
1 51 37 5 5 100
5 61 29 2 4 100
4 30 16 15 35 100
4 28 16 15 37 100
4 43 32 8 13 100
4 46 33 7 11 100
8 30 23 15 24 100
10 33 28 13 15 100
37 42 9 5 7 100
35 40 12 6 8 100
14 45 23 9 10 100
10 27 21 30 12 100
36 35 6 2 21 100
36 34 6 5 20 100
Spring, 2008 --Spring, 2007Spring, 2006May, 2005
India
Spring, 2008 --
Spring, 2007Spring, 2006May, 2005Summer, 2002
Indonesia
Spring, 2008 --Spring, 2007Spring, 2006Summer, 2002
Japan
Spring, 2008 --Spring, 2007Spring, 2006May, 2005
Pakistan
Spring, 2008 --Spring, 2007Summer, 2002
South Korea
Spring, 2008 --
Spring, 2007
Argentina
Spring, 2008 --Spring, 2007
Brazil
Spring, 2008 --Spring, 2007
Mexico
Spring, 2008 --Spring, 2007Spring, 2006
Nigeria
Spring, 2008 --South Africa
Spring, 2008 --Spring, 2007
Tanzania
Very favorableSomewhatfavorable
Somewhatunfavorable
Veryunfavorable DK/Refused
Q10c On a different topic, please tell me if you have a very favorable, somewhatfavorable, somewhat unfavorable or very unfavorable opinion of: c. China
Total
92
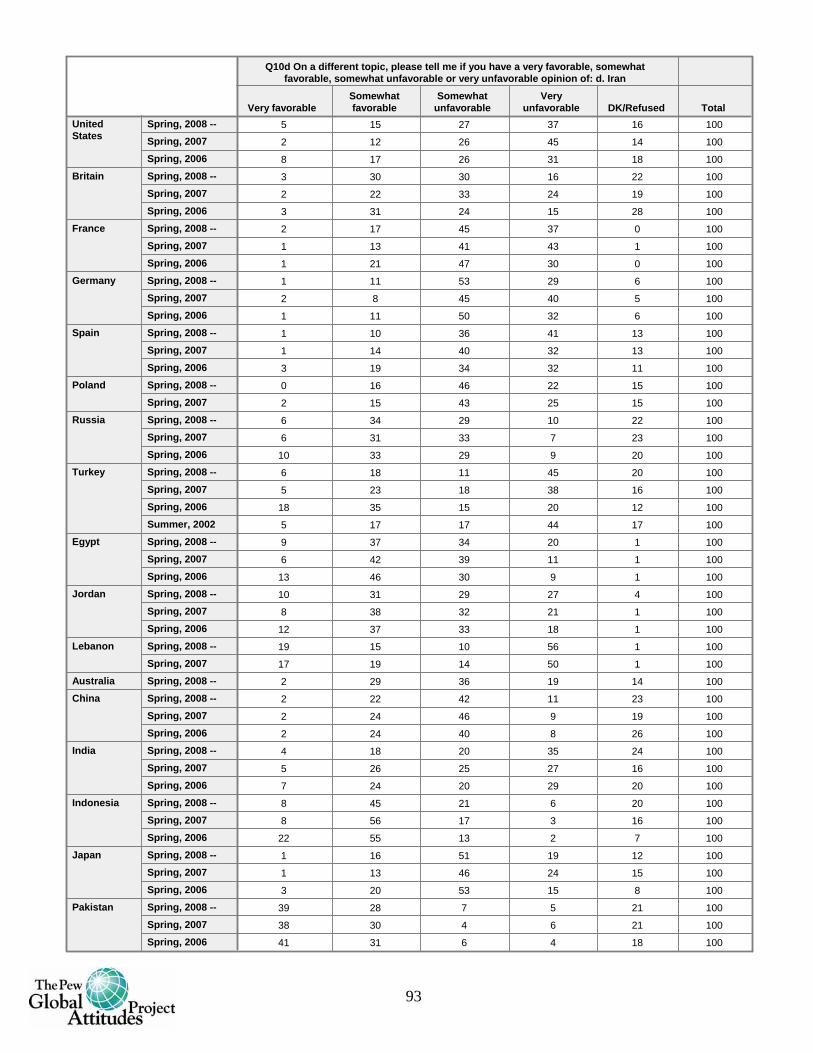
5 15 27 37 16 100
2 12 26 45 14 100
8 17 26 31 18 100
3 30 30 16 22 100
2 22 33 24 19 100
3 31 24 15 28 100
2 17 45 37 0 100
1 13 41 43 1 100
1 21 47 30 0 100
1 11 53 29 6 100
2 8 45 40 5 100
1 11 50 32 6 100
1 10 36 41 13 100
1 14 40 32 13 100
3 19 34 32 11 100
0 16 46 22 15 100
2 15 43 25 15 100
6 34 29 10 22 100
6 31 33 7 23 100
10 33 29 9 20 100
6 18 11 45 20 100
5 23 18 38 16 100
18 35 15 20 12 100
5 17 17 44 17 100
9 37 34 20 1 100
6 42 39 11 1 100
13 46 30 9 1 100
10 31 29 27 4 100
8 38 32 21 1 100
12 37 33 18 1 100
19 15 10 56 1 100
17 19 14 50 1 100
2 29 36 19 14 100
2 22 42 11 23 100
2 24 46 9 19 100
2 24 40 8 26 100
4 18 20 35 24 100
5 26 25 27 16 100
7 24 20 29 20 100
8 45 21 6 20 100
8 56 17 3 16 100
22 55 13 2 7 100
1 16 51 19 12 100
1 13 46 24 15 100
3 20 53 15 8 100
39 28 7 5 21 100
38 30 4 6 21 100
41 31 6 4 18 100
Spring, 2008 --Spring, 2007Spring, 2006
UnitedStates
Spring, 2008 --Spring, 2007
Spring, 2006
Britain
Spring, 2008 --Spring, 2007Spring, 2006
France
Spring, 2008 --Spring, 2007Spring, 2006
Germany
Spring, 2008 --
Spring, 2007Spring, 2006
Spain
Spring, 2008 --Spring, 2007
Poland
Spring, 2008 --Spring, 2007Spring, 2006
Russia
Spring, 2008 --
Spring, 2007Spring, 2006Summer, 2002
Turkey
Spring, 2008 --Spring, 2007Spring, 2006
Egypt
Spring, 2008 --Spring, 2007Spring, 2006
Jordan
Spring, 2008 --Spring, 2007
Lebanon
Spring, 2008 --AustraliaSpring, 2008 --Spring, 2007Spring, 2006
China
Spring, 2008 --Spring, 2007
Spring, 2006
India
Spring, 2008 --Spring, 2007Spring, 2006
Indonesia
Spring, 2008 --Spring, 2007Spring, 2006
Japan
Spring, 2008 --
Spring, 2007Spring, 2006
Pakistan
Very favorableSomewhatfavorable
Somewhatunfavorable
Veryunfavorable DK/Refused
Q10d On a different topic, please tell me if you have a very favorable, somewhatfavorable, somewhat unfavorable or very unfavorable opinion of: d. Iran
Total
93

1 32 39 8 20 100
1 35 38 5 20 100
1 9 26 26 37 100
1 10 23 30 37 100
1 16 47 22 15 100
1 12 53 25 9 100
2 11 24 32 32 100
6 18 33 25 17 100
24 19 20 22 16 100
24 20 23 24 10 100
19 24 19 25 14 100
1 9 16 42 32 100
11 23 15 23 28 100
13 20 16 27 24 100
Spring, 2008 --Spring, 2007
South Korea
Spring, 2008 --Spring, 2007
Argentina
Spring, 2008 --
Spring, 2007
Brazil
Spring, 2008 --Spring, 2007
Mexico
Spring, 2008 --Spring, 2007Spring, 2006
Nigeria
Spring, 2008 --South AfricaSpring, 2008 --
Spring, 2007
Tanzania
Very favorableSomewhatfavorable
Somewhatunfavorable
Veryunfavorable DK/Refused
Q10d On a different topic, please tell me if you have a very favorable, somewhatfavorable, somewhat unfavorable or very unfavorable opinion of: d. Iran
Total
QUESTIONS Q10e - Q10g HELD FOR FUTURE RELEASE
94

21 43 13 5 18 100
11 54 12 4 19 100
4 47 29 20 0 100
5 41 33 12 10 100
2 46 23 15 13 100
3 44 30 9 13 100
11 50 22 7 11 100
11 59 17 3 10 100
6 23 11 33 27 100
2 37 42 12 7 100
5 42 42 7 4 100
7 39 35 11 8 100
10 63 14 4 9 100
57 37 3 1 2 100
6 37 19 23 16 100
7 52 30 3 7 100
4 55 32 7 2 100
2 23 46 27 3 100
7 51 33 6 4 100
51 27 4 3 17 100
1 46 42 7 4 100
3 61 28 3 5 100
3 34 14 12 37 100
2 48 29 8 12 100
6 29 22 15 28 100
24 41 13 7 15 100
7 28 18 30 16 100
40 33 5 3 19 100
Spring, 2008 --United StatesSpring, 2008 --BritainSpring, 2008 --FranceSpring, 2008 --GermanySpring, 2008 --SpainSpring, 2008 --PolandSpring, 2008 --Summer, 2002
Russia
Spring, 2008 --TurkeySpring, 2008 --EgyptSpring, 2008 --JordanSpring, 2008 --LebanonSpring, 2008 --AustraliaSpring, 2008 --ChinaSpring, 2008 --IndiaSpring, 2008 --Summer, 2002
Indonesia
Spring, 2008 --Summer, 2002
Japan
Spring, 2008 --PakistanSpring, 2008 --Summer, 2002
South Korea
Spring, 2008 --ArgentinaSpring, 2008 --BrazilSpring, 2008 --MexicoSpring, 2008 --NigeriaSpring, 2008 --South AfricaSpring, 2008 --Tanzania
Very favorableSomewhatfavorable
Somewhatunfavorable
Veryunfavorable DK/Refused
Q10h On a different topic, please tell me if you have a very favorable, somewhatfavorable, somewhat unfavorable or very unfavorable opinion of: h. The Chinese
Total
95

25 45 8 3 18 100
22 44 9 4 21 100
17 46 12 5 21 100
13 57 6 2 22 100
15 53 6 3 24 100
14 55 8 3 20 100
13 65 15 7 0 100
13 70 12 5 0 100
10 66 16 6 1 100
10 68 12 2 7 100
10 60 12 2 16 100
9 55 16 2 18 100
9 58 12 8 14 100
14 51 13 5 18 100
22 44 9 3 22 100
13 60 11 3 14 100
13 51 18 3 15 100
12 48 11 2 26 100
23 51 13 4 10 100
17 53 13 3 15 100
24 49 12 5 10 100
23 52 13 3 10 100
12 31 6 28 24 100
9 28 10 29 24 100
15 31 8 24 22 100
21 34 8 18 19 100
18 33 31 13 4 100
21 37 28 11 4 100
22 41 18 13 5 100
11 32 39 14 5 100
14 36 31 15 6 100
7 39 38 13 4 100
11 35 28 21 6 100
12 45 16 12 15 100
13 45 19 9 15 100
29 43 15 9 5 100
11 66 13 4 7 100
2 19 35 34 9 100
1 14 35 43 7 100
2 19 41 29 10 100
3 14 33 43 7 100
19 41 12 16 12 100
24 41 16 8 11 100
23 37 14 11 16 100
28 39 7 4 23 100
Spring, 2008 --Spring, 2006May, 2005
UnitedStates
Spring, 2008 --Spring, 2006May, 2005
Britain
Spring, 2008 --Spring, 2006May, 2005
France
Spring, 2008 --Spring, 2006May, 2005
Germany
Spring, 2008 --Spring, 2006May, 2005
Spain
Spring, 2008 --Spring, 2007May, 2005
Poland
Spring, 2008 --Spring, 2007Spring, 2006May, 2005
Russia
Spring, 2008 --Spring, 2007Spring, 2006May, 2005
Turkey
Spring, 2008 --Spring, 2007Spring, 2006
Egypt
Spring, 2008 --Spring, 2007Spring, 2006May, 2005
Jordan
Spring, 2008 --Spring, 2007May, 2005
Lebanon
Spring, 2008 --AustraliaSpring, 2008 --Spring, 2007Spring, 2006May, 2005
China
Spring, 2008 --Spring, 2007Spring, 2006May, 2005
India
Very favorableSomewhatfavorable
Somewhatunfavorable
Veryunfavorable DK/Refused
Q10i On a different topic, please tell me if you have a very favorable, somewhatfavorable, somewhat unfavorable or very unfavorable opinion of: i. Japan
Total
96
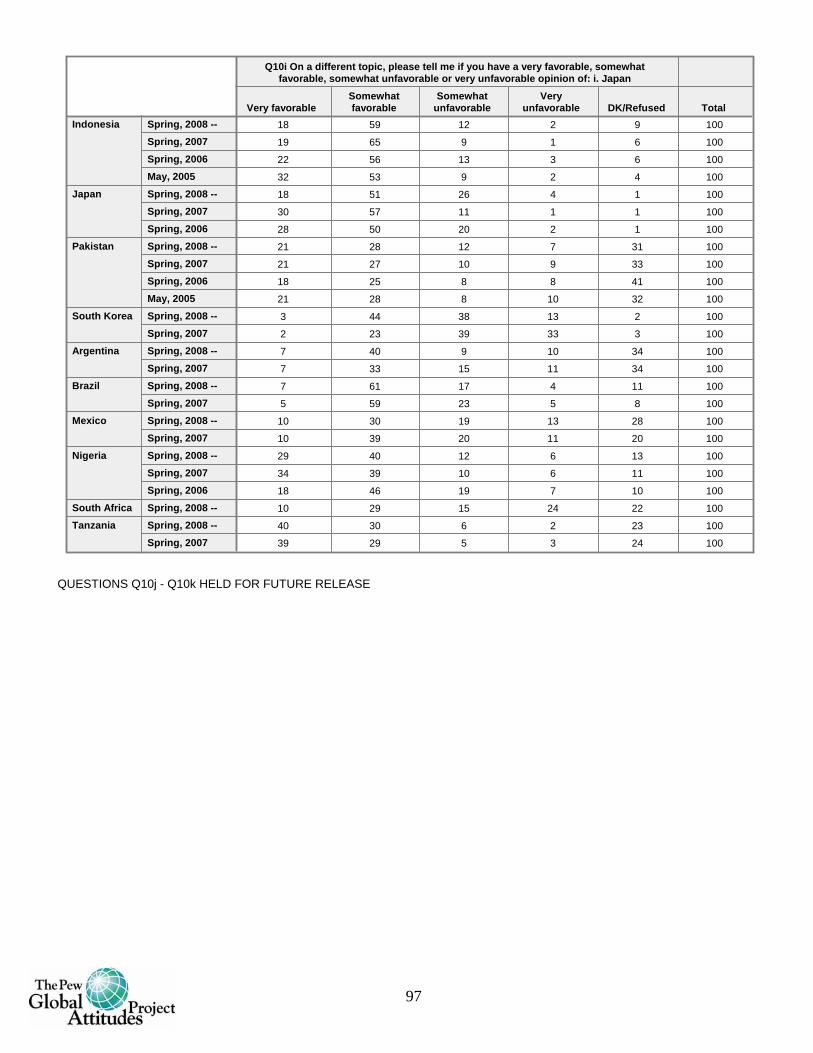
18 59 12 2 9 100
19 65 9 1 6 100
22 56 13 3 6 100
32 53 9 2 4 100
18 51 26 4 1 100
30 57 11 1 1 100
28 50 20 2 1 100
21 28 12 7 31 100
21 27 10 9 33 100
18 25 8 8 41 100
21 28 8 10 32 100
3 44 38 13 2 100
2 23 39 33 3 100
7 40 9 10 34 100
7 33 15 11 34 100
7 61 17 4 11 100
5 59 23 5 8 100
10 30 19 13 28 100
10 39 20 11 20 100
29 40 12 6 13 100
34 39 10 6 11 100
18 46 19 7 10 100
10 29 15 24 22 100
40 30 6 2 23 100
39 29 5 3 24 100
Spring, 2008 --Spring, 2007Spring, 2006May, 2005
Indonesia
Spring, 2008 --Spring, 2007Spring, 2006
Japan
Spring, 2008 --Spring, 2007Spring, 2006May, 2005
Pakistan
Spring, 2008 --Spring, 2007
South Korea
Spring, 2008 --Spring, 2007
Argentina
Spring, 2008 --Spring, 2007
Brazil
Spring, 2008 --Spring, 2007
Mexico
Spring, 2008 --Spring, 2007Spring, 2006
Nigeria
Spring, 2008 --South AfricaSpring, 2008 --Spring, 2007
Tanzania
Very favorableSomewhatfavorable
Somewhatunfavorable
Veryunfavorable DK/Refused
Q10i On a different topic, please tell me if you have a very favorable, somewhatfavorable, somewhat unfavorable or very unfavorable opinion of: i. Japan
Total
QUESTIONS Q10j - Q10k HELD FOR FUTURE RELEASE
97

18 45 11 3 22 100
13 62 6 3 15 100
7 63 22 7 0 100
6 54 25 4 12 100
5 43 21 13 18 100
6 53 17 3 21 100
16 55 11 4 14 100
5 22 10 32 31 100
7 26 26 29 11 100
10 29 32 23 7 100
7 27 31 19 16 100
7 64 17 3 9 100
2 27 38 12 20 100
2 27 45 12 15 100
2 31 38 5 24 100
81 15 2 1 2 100
73 17 4 1 4 100
7 56 20 2 16 100
9 65 13 2 11 100
5 55 26 4 10 100
7 44 30 5 14 100
8 57 26 2 7 100
7 20 20 37 15 100
9 24 18 32 17 100
1 5 9 71 14 100
1 51 28 4 16 100
2 57 20 4 17 100
2 23 14 13 48 100
1 46 26 7 19 100
4 23 21 16 36 100
20 33 17 13 18 100
8 30 20 28 15 100
24 37 12 5 23 100
Spring, 2008 --United StatesSpring, 2008 --BritainSpring, 2008 --FranceSpring, 2008 --GermanySpring, 2008 --SpainSpring, 2008 --PolandSpring, 2008 --RussiaSpring, 2008 --TurkeySpring, 2008 --EgyptSpring, 2008 --JordanSpring, 2008 --LebanonSpring, 2008 --AustraliaSpring, 2008 --Spring, 2007Spring, 2006
China
Spring, 2008 --Spring, 2007
India
Spring, 2008 --Spring, 2007
Indonesia
Spring, 2008 --Spring, 2007Spring, 2006
Japan
Spring, 2008 --Spring, 2006Summer, 2002
Pakistan
Spring, 2008 --Spring, 2007
South Korea
Spring, 2008 --ArgentinaSpring, 2008 --BrazilSpring, 2008 --MexicoSpring, 2008 --NigeriaSpring, 2008 --South AfricaSpring, 2008 --Tanzania
Very favorableSomewhatfavorable
Somewhatunfavorable
Veryunfavorable DK/Refused
Q10l On a different topic, please tell me if you have a very favorable, somewhatfavorable, somewhat unfavorable or very unfavorable opinion of: l. India
Total
QUESTION Q10m HELD FOR FUTURE RELEASE
98

10 27 26 13 24 100
8 48 18 6 20 100
3 28 47 22 0 100
1 20 50 14 15 100
1 20 35 23 21 100
2 25 36 11 26 100
7 32 23 12 26 100
10 26 11 27 26 100
10 41 27 13 9 100
12 37 30 15 7 100
14 34 32 13 7 100
3 42 30 11 14 100
2 25 37 12 23 100
2 31 37 5 26 100
2 16 20 53 9 100
4 19 19 49 10 100
2 4 7 83 4 100
11 47 18 2 22 100
0 21 47 13 19 100
2 31 43 6 19 100
91 6 1 1 2 100
0 36 37 5 22 100
1 12 21 17 49 100
1 23 41 15 20 100
1 12 25 24 37 100
20 23 17 17 23 100
2 13 18 37 29 100
10 28 12 15 35 100
Spring, 2008 --United StatesSpring, 2008 --BritainSpring, 2008 --FranceSpring, 2008 --GermanySpring, 2008 --SpainSpring, 2008 --PolandSpring, 2008 --RussiaSpring, 2008 --TurkeySpring, 2008 --EgyptSpring, 2008 --JordanSpring, 2008 --LebanonSpring, 2008 --AustraliaSpring, 2008 --Spring, 2006
China
Spring, 2008 --Spring, 2006Summer, 2002
India
Spring, 2008 --IndonesiaSpring, 2008 --Spring, 2006
Japan
Spring, 2008 --PakistanSpring, 2008 --South KoreaSpring, 2008 --ArgentinaSpring, 2008 --BrazilSpring, 2008 --MexicoSpring, 2008 --NigeriaSpring, 2008 --South AfricaSpring, 2008 --Tanzania
Very favorableSomewhatfavorable
Somewhatunfavorable
Veryunfavorable DK/Refused
Q10n On a different topic, please tell me if you have a very favorable, somewhatfavorable, somewhat unfavorable or very unfavorable opinion of: n. Pakistan
Total
99

14 37 14 11 25 100
6 44 12 6 33 100
5 49 31 13 2 100
4 46 28 6 17 100
1 31 27 14 26 100
3 36 30 10 22 100
8 38 20 10 24 100
6 19 10 30 35 100
3 15 45 25 12 100
4 23 45 15 14 100
3 19 43 20 14 100
7 57 15 4 18 100
8 48 23 6 15 100
9 54 16 2 18 100
4 27 17 24 28 100
4 39 26 4 27 100
4 53 32 8 3 100
6 50 34 9 1 100
4 14 14 14 55 100
26 66 6 1 1 100
2 20 15 13 50 100
2 36 35 8 20 100
2 23 19 17 39 100
14 33 18 12 23 100
4 17 13 31 34 100
18 28 10 8 37 100
Spring, 2008 --United StatesSpring, 2008 --BritainSpring, 2008 --France
Spring, 2008 --GermanySpring, 2008 --SpainSpring, 2008 --PolandSpring, 2008 --RussiaSpring, 2008 --Turkey
Spring, 2008 --EgyptSpring, 2008 --JordanSpring, 2008 --LebanonSpring, 2008 --AustraliaSpring, 2008 --Spring, 2006
China
Spring, 2008 --IndiaSpring, 2008 --IndonesiaSpring, 2008 --Spring, 2006
Japan
Spring, 2008 --PakistanSpring, 2008 --South Korea
Spring, 2008 --ArgentinaSpring, 2008 --BrazilSpring, 2008 --MexicoSpring, 2008 --NigeriaSpring, 2008 --South AfricaSpring, 2008 --Tanzania
Very favorableSomewhatfavorable
Somewhatunfavorable
Veryunfavorable DK/Refused
Q10o On a different topic, please tell me if you have a very favorable, somewhatfavorable, somewhat unfavorable or very unfavorable opinion of: o. South Korea
Total
QUESTIONS Q11a - Q13 HELD FOR FUTURE RELEASE
15 38 26 15 6 100
14 45 21 15 5 100
21 57 14 4 4 100
28 49 13 4 6 100
28 50 13 2 7 100
32 55 7 2 4 100
30 52 14 4 0 100
22 56 16 5 0 100
32 56 8 3 1 100
30 57 10 2 1 100
30 55 8 5 1 100
37 54 7 1 2 100
Spring, 2008 --Spring, 2007Summer, 2002
UnitedStates
Spring, 2008 --Spring, 2007Summer, 2002
Britain
Spring, 2008 --Spring, 2007Summer, 2002
France
Spring, 2008 --Spring, 2007Summer, 2002
Germany
Very goodSomewhat
good Somewhat bad Very bad DK/Refused
Q14 What do you think about the growing trade and business ties between(survey country) and other countries – do you think it is a very good thing,
somewhat good, somewhat bad or a very bad thing for our country?
Total
100

21 68 6 2 3 100
35 47 6 2 9 100
19 66 9 1 5 100
21 56 12 3 7 100
17 61 12 3 7 100
28 53 11 3 5 100
30 52 10 2 6 100
26 62 5 2 4 100
34 33 9 11 13 100
41 32 11 2 15 100
54 29 6 6 6 100
22 35 25 12 6 100
17 44 20 15 4 100
24 41 25 8 3 100
28 44 20 5 3 100
15 37 37 11 0 100
41 44 7 4 3 100
42 39 10 5 4 100
29 54 12 3 3 100
35 51 10 2 3 100
19 68 6 0 6 100
38 53 4 1 5 100
32 58 2 1 6 100
44 46 6 2 2 100
41 48 6 2 3 100
46 42 4 3 5 100
19 52 21 2 5 100
16 55 20 4 6 100
25 62 9 1 3 100
15 56 24 2 3 100
17 55 15 2 10 100
12 60 19 3 6 100
48 30 5 2 15 100
52 30 3 1 14 100
62 16 1 1 20 100
19 69 8 0 3 100
24 62 8 1 5 100
37 53 6 1 3 100
12 50 19 8 11 100
15 53 14 5 12 100
18 42 21 10 9 100
14 66 13 1 5 100
13 59 22 3 3 100
14 59 14 4 9 100
Spring, 2008 --Spring, 2007
Spain
Spring, 2008 --Spring, 2007Summer, 2002
Poland
Spring, 2008 --Spring, 2007Summer, 2002
Russia
Spring, 2008 --Spring, 2007Summer, 2002
Turkey
Spring, 2008 --Spring, 2007
Egypt
Spring, 2008 --Spring, 2007Summer, 2002
Jordan
Spring, 2008 --Spring, 2007Summer, 2002
Lebanon
Spring, 2008 --AustraliaSpring, 2008 --Spring, 2007Summer, 2002
China
Spring, 2008 --Spring, 2007Summer, 2002
India
Spring, 2008 --Spring, 2007Summer, 2002
Indonesia
Spring, 2008 --Spring, 2007Summer, 2002
Japan
Spring, 2008 --Spring, 2007Summer, 2002
Pakistan
Spring, 2008 --Spring, 2007Summer, 2002
SouthKorea
Spring, 2008 --Spring, 2007Summer, 2002
Argentina
Spring, 2008 --Spring, 2007Summer, 2002
Brazil
Very goodSomewhat
good Somewhat bad Very bad DK/Refused
Q14 What do you think about the growing trade and business ties between(survey country) and other countries – do you think it is a very good thing,
somewhat good, somewhat bad or a very bad thing for our country?
Total
101
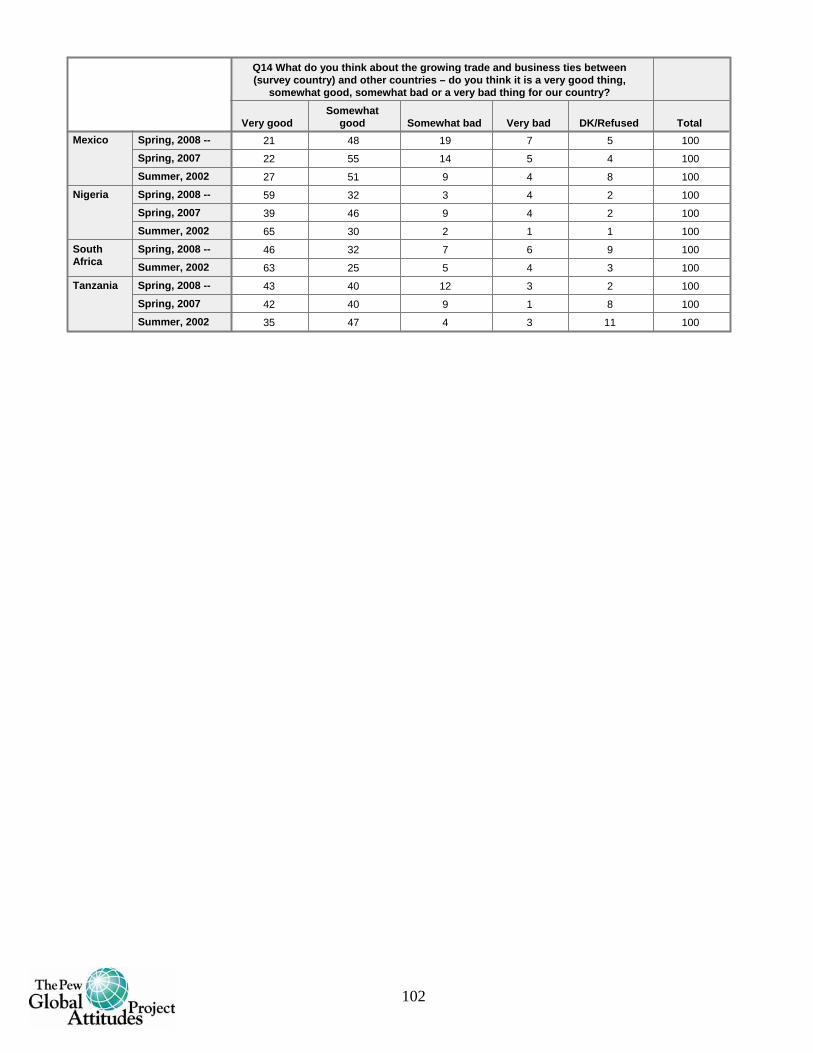
21 48 19 7 5 100
22 55 14 5 4 100
27 51 9 4 8 100
59 32 3 4 2 100
39 46 9 4 2 100
65 30 2 1 1 100
46 32 7 6 9 100
63 25 5 4 3 100
43 40 12 3 2 100
42 40 9 1 8 100
35 47 4 3 11 100
Spring, 2008 --Spring, 2007Summer, 2002
Mexico
Spring, 2008 --Spring, 2007Summer, 2002
Nigeria
Spring, 2008 --Summer, 2002
SouthAfrica
Spring, 2008 --Spring, 2007Summer, 2002
Tanzania
Very goodSomewhat
good Somewhat bad Very bad DK/Refused
Q14 What do you think about the growing trade and business ties between(survey country) and other countries – do you think it is a very good thing,
somewhat good, somewhat bad or a very bad thing for our country?
Total
102

11 44 27 12 6 100
20 59 11 4 7 100
18 55 14 2 10 100
28 59 5 1 7 100
22 57 16 5 0 100
24 65 7 1 3 100
12 68 13 2 5 100
23 65 6 1 6 100
15 63 7 2 14 100
15 66 8 1 10 100
12 60 11 2 15 100
15 53 11 4 17 100
15 54 7 1 22 100
23 35 13 12 17 100
42 36 5 5 11 100
11 30 36 20 4 100
10 34 30 20 6 100
20 33 30 17 1 100
17 31 32 12 8 100
23 54 14 3 6 100
25 58 10 2 5 100
10 65 11 1 12 100
18 61 5 0 16 100
27 60 8 2 3 100
37 45 5 5 8 100
13 53 24 3 6 100
27 61 9 1 3 100
11 60 20 2 7 100
16 67 6 1 10 100
32 41 5 2 20 100
55 18 2 2 23 100
11 74 8 0 7 100
15 67 8 1 9 100
7 40 22 10 20 100
15 43 15 6 20 100
7 67 15 2 8 100
9 66 13 1 11 100
15 51 19 7 8 100
25 51 8 3 13 100
39 46 8 4 3 100
58 36 3 2 2 100
26 42 15 8 9 100
45 37 7 7 4 100
29 44 15 9 4 100
28 50 8 2 13 100
Spring, 2008 --Summer, 2002
UnitedStates
Spring, 2008 --Summer, 2002
Britain
Spring, 2008 --Summer, 2002
France
Spring, 2008 --Summer, 2002
Germany
Spring, 2008 --SpainSpring, 2008 --Summer, 2002
Poland
Spring, 2008 --Summer, 2002
Russia
Spring, 2008 --Summer, 2002
Turkey
Spring, 2008 --EgyptSpring, 2008 --Summer, 2002
Jordan
Spring, 2008 --Summer, 2002
Lebanon
Spring, 2008 --AustraliaSpring, 2008 --Summer, 2002
China
Spring, 2008 --Summer, 2002
India
Spring, 2008 --Summer, 2002
Indonesia
Spring, 2008 --Summer, 2002
Japan
Spring, 2008 --Summer, 2002
Pakistan
Spring, 2008 --Summer, 2002
SouthKorea
Spring, 2008 --Summer, 2002
Argentina
Spring, 2008 --Summer, 2002
Brazil
Spring, 2008 --Summer, 2002
Mexico
Spring, 2008 --Summer, 2002
Nigeria
Spring, 2008 --Summer, 2002
SouthAfrica
Spring, 2008 --Summer, 2002
Tanzania
Very goodSomewhat
good Somewhat bad Very bad DK/Refused
Q15 Now thinking about you and your family – do you think the growing tradeand business ties between our country and other countries are very good,
somewhat good, somewhat bad or very bad for you and your family?
Total
103

3 22 33 34 7 100
6 37 34 15 9 100
3 30 42 25 0 100
2 18 58 20 3 100
7 43 31 8 12 100
4 33 36 20 7 100
7 22 33 32 5 100
5 11 15 61 8 100
5 22 32 38 3 100
10 23 35 28 3 100
13 26 31 25 5 100
4 26 46 21 3 100
3 28 42 16 11 100
18 41 21 17 3 100
4 24 39 27 5 100
2 25 52 17 4 100
13 24 17 26 20 100
3 35 50 9 4 100
2 19 37 34 9 100
4 36 43 13 4 100
15 33 27 20 5 100
17 25 16 38 3 100
26 26 16 26 5 100
13 19 28 39 2 100
Spring, 2008 --United StatesSpring, 2008 --BritainSpring, 2008 --FranceSpring, 2008 --GermanySpring, 2008 --SpainSpring, 2008 --PolandSpring, 2008 --RussiaSpring, 2008 --TurkeySpring, 2008 --EgyptSpring, 2008 --JordanSpring, 2008 --LebanonSpring, 2008 --AustraliaSpring, 2008 --ChinaSpring, 2008 --IndiaSpring, 2008 --IndonesiaSpring, 2008 --JapanSpring, 2008 --PakistanSpring, 2008 --South KoreaSpring, 2008 --ArgentinaSpring, 2008 --BrazilSpring, 2008 --MexicoSpring, 2008 --NigeriaSpring, 2008 --South AfricaSpring, 2008 --Tanzania
Very goodSomewhat
good Somewhat bad Very bad DK/Refused
Q16 When foreigners buy (survey country) companies, do you think this has avery good, somewhat good, somewhat bad, or a very bad impact on our country?
Total
104

46 26 10 10 0 1 7 100
44 29 8 10 1 5 4 100
44 31 10 14 0 0 1 100
25 30 11 31 1 0 2 100
42 24 9 20 0 1 5 100
52 15 11 13 1 0 7 100
32 12 25 17 2 3 8 100
62 7 6 8 2 1 15 100
43 27 9 12 1 4 3 100
36 31 9 18 3 1 2 100
35 22 7 20 1 12 2 100
37 40 7 11 0 0 4 100
48 21 2 9 3 0 16 100
65 12 10 5 1 1 7 100
53 15 18 6 1 1 6 100
52 19 6 19 1 1 2 100
52 18 4 1 1 1 23 100
74 15 2 4 1 1 2 100
53 13 9 15 1 1 7 100
52 15 16 8 1 1 7 100
59 17 8 7 0 1 8 100
58 23 3 6 0 1 8 100
49 14 7 7 3 2 19 100
63 9 8 9 2 1 9 100
Spring, 2008 --United StatesSpring, 2008 --Britain
Spring, 2008 --FranceSpring, 2008 --GermanySpring, 2008 --Spain
Spring, 2008 --PolandSpring, 2008 --RussiaSpring, 2008 --TurkeySpring, 2008 --Egypt
Spring, 2008 --JordanSpring, 2008 --LebanonSpring, 2008 --Australia
Spring, 2008 --ChinaSpring, 2008 --IndiaSpring, 2008 --Indonesia
Spring, 2008 --JapanSpring, 2008 --PakistanSpring, 2008 --South KoreaSpring, 2008 --Argentina
Spring, 2008 --BrazilSpring, 2008 --MexicoSpring, 2008 --Nigeria
Spring, 2008 --South AfricaSpring, 2008 --Tanzania
The UnitedStates China Japan [OR]
The countriesof the
EuropeanUnion Other (VOL)
None/ There isno leadingeconomic
power (VOL) DK/Refused
Q17 Today, which ONE of the following do you think is the world’s leading economic power?
Total
105

31 5 54 10 100
48 7 36 9 100
51 15 34 0 100
52 9 35 4 100
52 5 35 8 100
26 12 46 15 100
28 8 45 19 100
28 6 38 28 100
20 14 55 10 100
24 15 52 9 100
17 10 56 17 100
53 5 34 9 100
53 5 23 19 100
22 18 33 27 100
22 5 55 18 100
23 8 67 2 100
34 11 20 35 100
43 4 49 4 100
34 9 34 23 100
33 11 42 14 100
29 22 35 14 100
31 13 36 20 100
24 8 34 34 100
38 7 40 15 100
Spring, 2008 --United StatesSpring, 2008 --BritainSpring, 2008 --FranceSpring, 2008 --GermanySpring, 2008 --SpainSpring, 2008 --PolandSpring, 2008 --RussiaSpring, 2008 --TurkeySpring, 2008 --EgyptSpring, 2008 --JordanSpring, 2008 --LebanonSpring, 2008 --AustraliaSpring, 2008 --ChinaSpring, 2008 --IndiaSpring, 2008 --IndonesiaSpring, 2008 --JapanSpring, 2008 --PakistanSpring, 2008 --South KoreaSpring, 2008 --ArgentinaSpring, 2008 --BrazilSpring, 2008 --MexicoSpring, 2008 --NigeriaSpring, 2008 --South AfricaSpring, 2008 --Tanzania
Will eventuallyreplace US
Has alreadyreplaced US
Will neverreplace US DK/Refused
Q18 Which comes closest to your view – China will eventuallyreplace the U.S. as the world’s leading superpower; China has
already replaced the U.S. as the world’s leading superpower; orChina will never replace the U.S. as the world’s leading
superpower?
Total
QUESTIONS Q19 - Q20 HELD FOR FUTURE RELEASE
106

11 26 16 44 3 100
18 27 19 34 2 100
22 28 19 29 2 100
34 28 19 17 2 100
49 29 11 9 2 100
3 13 22 59 3 100
5 19 25 45 5 100
4 26 26 42 2 100
9 29 27 33 2 100
16 35 25 22 1 100
4 26 36 28 6 100
3 10 26 61 0 100
1 13 26 59 0 100
2 13 23 62 0 100
5 20 27 48 0 100
3 17 28 51 0 100
2 18 43 32 5 100
4 10 26 59 1 100
1 18 31 49 1 100
3 22 26 46 2 100
8 22 34 35 1 100
8 25 28 38 1 100
3 48 27 19 3 100
2 6 24 64 5 100
1 6 29 59 4 100
2 5 19 71 3 100
4 14 33 47 2 100
9 17 15 56 3 100
5 36 36 14 9 100
4 25 36 19 16 100
8 39 29 11 13 100
7 15 28 41 9 100
3 15 34 36 11 100
5 16 33 32 14 100
4 24 40 17 16 100
1 7 27 54 11 100
0 2 4 85 9 100
0 2 8 81 8 100
0 3 4 80 14 100
2 6 8 75 9 100
1 7 8 80 4 100
3 8 18 68 4 100
0 8 20 67 5 100
1 7 21 70 1 100
Spring, 2008 --Spring, 2007Spring, 2006May, 2005May, 2003
UnitedStates
Spring, 2008 --Spring, 2007Spring, 2006May, 2005May, 2003August, 2001
Britain
Spring, 2008 --Spring, 2007Spring, 2006May, 2005May, 2003August, 2001
France
Spring, 2008 --Spring, 2007Spring, 2006May, 2005May, 2003August, 2001
Germany
Spring, 2008 --Spring, 2007Spring, 2006May, 2005May, 2003
Spain
Spring, 2008 --Spring, 2007May, 2005
Poland
Spring, 2008 --Spring, 2007Spring, 2006May, 2005May, 2003
Russia
Spring, 2008 --Spring, 2007Spring, 2006May, 2005May, 2003
Turkey
Spring, 2008 --Spring, 2007Spring, 2006
Egypt
A lot ofconfidence
Someconfidence
Not too muchconfidence
No confidence atall DK/Refused
Q21a For each, tell me how much confidence you have in each leader to do the rightthing regarding world affairs – a lot of confidence, some confidence, not too much
confidence, or no confidence at all: a. U.S. President George W. Bush1
Total
107

3 4 30 59 4 100
1 7 33 55 4 100
0 7 29 64 0 100
0 1 25 75 0 100
0 1 3 96 0 100
8 25 22 43 1 100
9 25 22 43 0 100
6 17 21 55 1 100
4 13 20 62 1 100
4 19 25 51 1 100
17 42 20 21 0 100
4 26 31 14 26 100
3 28 35 16 17 100
6 28 29 8 29 100
21 34 11 22 11 100
18 32 22 21 8 100
14 42 16 20 9 100
20 34 19 12 15 100
2 21 42 24 11 100
1 13 44 35 7 100
4 16 35 39 6 100
2 17 48 25 7 100
2 6 27 63 2 100
2 23 43 26 5 100
2 33 45 13 7 100
5 27 43 24 0 100
2 5 5 56 31 100
2 5 9 57 27 100
1 8 10 54 27 100
2 8 19 47 24 100
1 4 3 81 11 100
1 29 53 11 6 100
1 21 51 22 6 100
12 24 34 27 3 100
1 6 15 71 7 100
1 4 16 71 7 100
3 14 17 63 3 100
2 15 19 61 3 100
4 9 13 67 7 100
4 12 23 54 6 100
3 25 26 41 6 100
29 26 13 26 5 100
36 26 12 21 5 100
26 26 22 22 4 100
31 19 15 32 3 100
Spring, 2008 --Spring, 2007Spring, 2006May, 2005May, 2003
Jordan
Spring, 2008 --Spring, 2007May, 2005May, 2003
Lebanon
Spring, 2008 --May, 2003
Australia
Spring, 2008 --Spring, 2007Spring, 2006
China
Spring, 2008 --Spring, 2007Spring, 2006May, 2005
India
Spring, 2008 --Spring, 2007Spring, 2006May, 2005May, 2003
Indonesia
Spring, 2008 --Spring, 2007Spring, 2006
Japan
Spring, 2008 --Spring, 2007Spring, 2006May, 2005May, 2003
Pakistan
Spring, 2008 --Spring, 2007May, 2003
South Korea
Spring, 2008 --Spring, 2007
Argentina
Spring, 2008 --Spring, 2007May, 2003
Brazil
Spring, 2008 --Spring, 2007
Mexico
Spring, 2008 --Spring, 2007Spring, 2006May, 2003
Nigeria
A lot ofconfidence
Someconfidence
Not too muchconfidence
No confidence atall DK/Refused
Q21a For each, tell me how much confidence you have in each leader to do the rightthing regarding world affairs – a lot of confidence, some confidence, not too much
confidence, or no confidence at all: a. U.S. President George W. Bush1
Total
108

11 21 16 36 16 100
28 32 14 19 7 100
16 24 15 34 11 100
Spring, 2008 --South AfricaSpring, 2008 --Spring, 2007
Tanzania
A lot ofconfidence
Someconfidence
Not too muchconfidence
No confidence atall DK/Refused
Q21a For each, tell me how much confidence you have in each leader to do the rightthing regarding world affairs – a lot of confidence, some confidence, not too much
confidence, or no confidence at all: a. U.S. President George W. Bush1
Total
In the U.S., the question excluded the text "U.S."1.
109

2 26 22 26 25 100
2 28 25 25 21 100
3 30 26 19 22 100
2 39 28 19 13 100
3 25 24 32 16 100
3 34 26 21 16 100
3 30 27 24 16 100
10 43 23 13 10 100
1 25 35 22 17 100
1 16 30 52 1 100
2 17 36 45 0 100
2 22 33 43 1 100
5 43 27 25 1 100
2 12 39 38 9 100
7 31 31 29 2 100
5 27 37 29 2 100
5 45 29 17 4 100
24 51 18 6 1 100
4 37 31 24 4 100
1 9 32 48 11 100
2 5 33 43 17 100
1 9 31 46 13 100
5 26 24 33 13 100
1 13 38 40 7 100
0 7 37 44 12 100
53 30 10 3 4 100
46 38 8 2 6 100
27 48 13 4 8 100
28 48 19 3 1 100
2 7 8 62 21 100
1 9 11 60 20 100
1 8 6 62 22 100
2 14 41 33 10 100
1 17 42 28 12 100
1 18 47 25 9 100
1 16 36 36 11 100
1 19 32 32 17 100
2 12 45 33 8 100
7 30 27 32 4 100
7 26 28 33 6 100
2 36 26 18 18 100
5 48 25 12 11 100
9 37 18 8 28 100
11 47 19 4 19 100
13 37 16 2 32 100
Spring, 2008 --Spring, 2007Spring, 2006May, 2003
UnitedStates
Spring, 2008 --Spring, 2007Spring, 2006May, 2003August, 2001
Britain
Spring, 2008 --Spring, 2007Spring, 2006May, 2003August, 2001
France
Spring, 2008 --Spring, 2007Spring, 2006May, 2003August, 2001
Germany
Spring, 2008 --Spring, 2007Spring, 2006May, 2003
Spain
Spring, 2008 --Spring, 2007
Poland
Spring, 2008 --Spring, 2007Spring, 2006May, 2003
Russia
Spring, 2008 --Spring, 2007Spring, 2006
Turkey
Spring, 2008 --Spring, 2007Spring, 2006
Egypt
Spring, 2008 --Spring, 2007Spring, 2006
Jordan
Spring, 2008 --Spring, 2007
Lebanon
Spring, 2008 --May, 2003
Australia
Spring, 2008 --Spring, 2007Spring, 2006
China
A lot ofconfidence
Someconfidence
Not too muchconfidence
No confidence atall DK/Refused
Q21b For each, tell me how much confidence you have in each leader to do the rightthing regarding world affairs – a lot of confidence, some confidence, not too much
confidence, or no confidence at all: b. Russian President Vladimir Putin
Total
110

10 23 12 19 36 100
15 28 18 20 18 100
11 25 14 14 36 100
1 17 25 12 45 100
1 21 37 10 31 100
2 19 29 11 38 100
3 25 41 21 10 100
1 18 46 22 14 100
2 38 44 11 5 100
1 4 7 35 53 100
1 5 12 45 38 100
1 6 11 30 51 100
1 26 40 6 26 100
0 24 44 7 25 100
3 34 39 8 16 100
1 6 13 38 43 100
0 5 13 31 51 100
2 12 16 47 23 100
1 14 19 48 19 100
4 18 14 35 29 100
3 7 21 31 39 100
5 18 21 27 29 100
10 28 22 17 23 100
9 36 21 13 21 100
4 22 28 16 29 100
11 27 29 13 21 100
3 13 12 15 57 100
14 27 15 9 35 100
13 29 13 13 32 100
Spring, 2008 --Spring, 2007Spring, 2006
India
Spring, 2008 --Spring, 2007Spring, 2006
Indonesia
Spring, 2008 --Spring, 2007Spring, 2006
Japan
Spring, 2008 --Spring, 2007Spring, 2006
Pakistan
Spring, 2008 --Spring, 2007May, 2003
South Korea
Spring, 2008 --Spring, 2007
Argentina
Spring, 2008 --Spring, 2007May, 2003
Brazil
Spring, 2008 --Spring, 2007
Mexico
Spring, 2008 --Spring, 2007Spring, 2006May, 2003
Nigeria
Spring, 2008 --South AfricaSpring, 2008 --Spring, 2007
Tanzania
A lot ofconfidence
Someconfidence
Not too muchconfidence
No confidence atall DK/Refused
Q21b For each, tell me how much confidence you have in each leader to do the rightthing regarding world affairs – a lot of confidence, some confidence, not too much
confidence, or no confidence at all: b. Russian President Vladimir Putin
Total
111
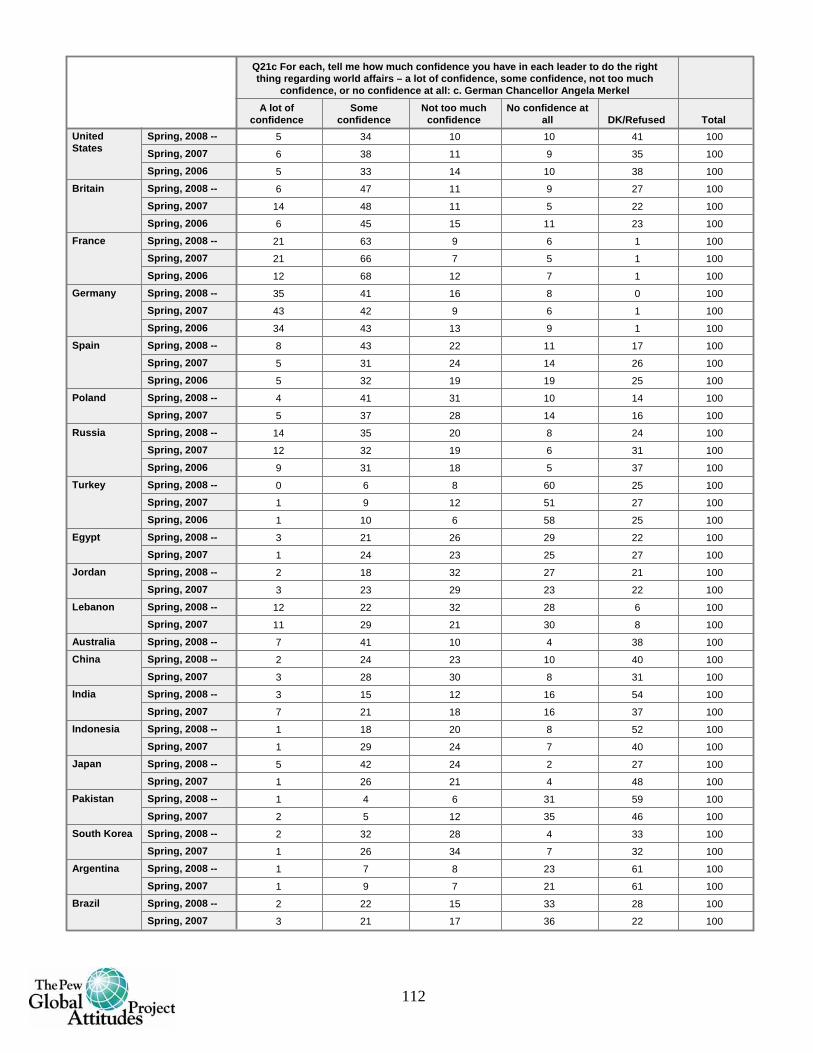
5 34 10 10 41 100
6 38 11 9 35 100
5 33 14 10 38 100
6 47 11 9 27 100
14 48 11 5 22 100
6 45 15 11 23 100
21 63 9 6 1 100
21 66 7 5 1 100
12 68 12 7 1 100
35 41 16 8 0 100
43 42 9 6 1 100
34 43 13 9 1 100
8 43 22 11 17 100
5 31 24 14 26 100
5 32 19 19 25 100
4 41 31 10 14 100
5 37 28 14 16 100
14 35 20 8 24 100
12 32 19 6 31 100
9 31 18 5 37 100
0 6 8 60 25 100
1 9 12 51 27 100
1 10 6 58 25 100
3 21 26 29 22 100
1 24 23 25 27 100
2 18 32 27 21 100
3 23 29 23 22 100
12 22 32 28 6 100
11 29 21 30 8 100
7 41 10 4 38 100
2 24 23 10 40 100
3 28 30 8 31 100
3 15 12 16 54 100
7 21 18 16 37 100
1 18 20 8 52 100
1 29 24 7 40 100
5 42 24 2 27 100
1 26 21 4 48 100
1 4 6 31 59 100
2 5 12 35 46 100
2 32 28 4 33 100
1 26 34 7 32 100
1 7 8 23 61 100
1 9 7 21 61 100
2 22 15 33 28 100
3 21 17 36 22 100
Spring, 2008 --Spring, 2007Spring, 2006
UnitedStates
Spring, 2008 --Spring, 2007Spring, 2006
Britain
Spring, 2008 --Spring, 2007Spring, 2006
France
Spring, 2008 --Spring, 2007Spring, 2006
Germany
Spring, 2008 --Spring, 2007Spring, 2006
Spain
Spring, 2008 --Spring, 2007
Poland
Spring, 2008 --Spring, 2007Spring, 2006
Russia
Spring, 2008 --Spring, 2007Spring, 2006
Turkey
Spring, 2008 --Spring, 2007
Egypt
Spring, 2008 --Spring, 2007
Jordan
Spring, 2008 --Spring, 2007
Lebanon
Spring, 2008 --AustraliaSpring, 2008 --Spring, 2007
China
Spring, 2008 --Spring, 2007
India
Spring, 2008 --Spring, 2007
Indonesia
Spring, 2008 --Spring, 2007
Japan
Spring, 2008 --Spring, 2007
Pakistan
Spring, 2008 --Spring, 2007
South Korea
Spring, 2008 --Spring, 2007
Argentina
Spring, 2008 --Spring, 2007
Brazil
A lot ofconfidence
Someconfidence
Not too muchconfidence
No confidence atall DK/Refused
Q21c For each, tell me how much confidence you have in each leader to do the rightthing regarding world affairs – a lot of confidence, some confidence, not too much
confidence, or no confidence at all: c. German Chancellor Angela Merkel
Total
112
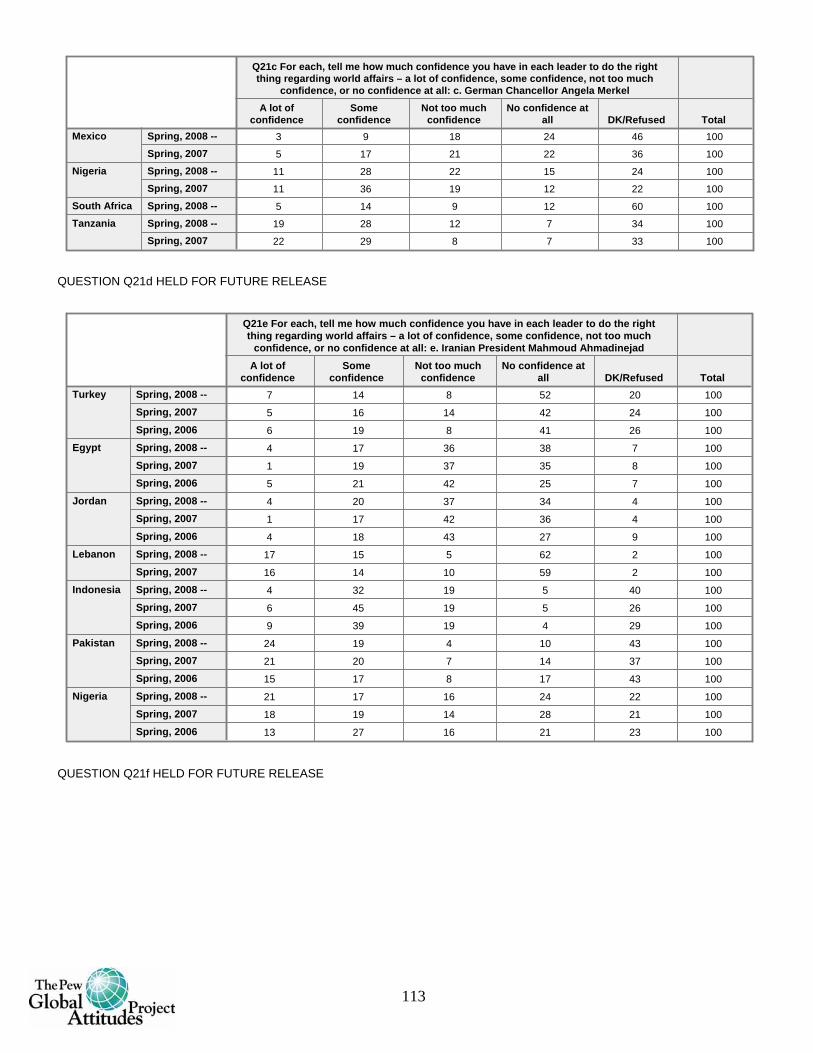
3 9 18 24 46 100
5 17 21 22 36 100
11 28 22 15 24 100
11 36 19 12 22 100
5 14 9 12 60 100
19 28 12 7 34 100
22 29 8 7 33 100
Spring, 2008 --Spring, 2007
Mexico
Spring, 2008 --Spring, 2007
Nigeria
Spring, 2008 --South AfricaSpring, 2008 --Spring, 2007
Tanzania
A lot ofconfidence
Someconfidence
Not too muchconfidence
No confidence atall DK/Refused
Q21c For each, tell me how much confidence you have in each leader to do the rightthing regarding world affairs – a lot of confidence, some confidence, not too much
confidence, or no confidence at all: c. German Chancellor Angela Merkel
Total
QUESTION Q21d HELD FOR FUTURE RELEASE
7 14 8 52 20 100
5 16 14 42 24 100
6 19 8 41 26 100
4 17 36 38 7 100
1 19 37 35 8 100
5 21 42 25 7 100
4 20 37 34 4 100
1 17 42 36 4 100
4 18 43 27 9 100
17 15 5 62 2 100
16 14 10 59 2 100
4 32 19 5 40 100
6 45 19 5 26 100
9 39 19 4 29 100
24 19 4 10 43 100
21 20 7 14 37 100
15 17 8 17 43 100
21 17 16 24 22 100
18 19 14 28 21 100
13 27 16 21 23 100
Spring, 2008 --Spring, 2007Spring, 2006
Turkey
Spring, 2008 --Spring, 2007Spring, 2006
Egypt
Spring, 2008 --Spring, 2007Spring, 2006
Jordan
Spring, 2008 --Spring, 2007
Lebanon
Spring, 2008 --Spring, 2007Spring, 2006
Indonesia
Spring, 2008 --Spring, 2007Spring, 2006
Pakistan
Spring, 2008 --Spring, 2007Spring, 2006
Nigeria
A lot ofconfidence
Someconfidence
Not too muchconfidence
No confidence atall DK/Refused
Q21e For each, tell me how much confidence you have in each leader to do the rightthing regarding world affairs – a lot of confidence, some confidence, not too much
confidence, or no confidence at all: e. Iranian President Mahmoud Ahmadinejad
Total
QUESTION Q21f HELD FOR FUTURE RELEASE
113

5 32 15 15 33 100
6 47 17 13 17 100
13 38 23 26 0 100
3 42 37 14 4 100
3 33 37 19 8 100
4 41 26 8 21 100
5 24 30 12 29 100
1 4 6 68 22 100
3 18 33 34 11 100
4 26 33 30 8 100
23 33 17 23 4 100
3 47 19 11 20 100
3 21 22 10 44 100
5 21 14 13 47 100
1 14 19 8 57 100
2 31 40 10 17 100
1 4 5 26 64 100
2 26 32 8 33 100
2 11 13 29 46 100
2 20 16 37 24 100
1 11 19 26 43 100
9 26 23 14 28 100
5 14 10 13 58 100
17 29 13 9 31 100
Spring, 2008 --United StatesSpring, 2008 --BritainSpring, 2008 --FranceSpring, 2008 --GermanySpring, 2008 --Spain
Spring, 2008 --PolandSpring, 2008 --RussiaSpring, 2008 --TurkeySpring, 2008 --EgyptSpring, 2008 --JordanSpring, 2008 --Lebanon
Spring, 2008 --AustraliaSpring, 2008 --ChinaSpring, 2008 --IndiaSpring, 2008 --IndonesiaSpring, 2008 --JapanSpring, 2008 --Pakistan
Spring, 2008 --South KoreaSpring, 2008 --ArgentinaSpring, 2008 --BrazilSpring, 2008 --MexicoSpring, 2008 --NigeriaSpring, 2008 --South Africa
Spring, 2008 --Tanzania
A lot ofconfidence
Someconfidence
Not too muchconfidence
No confidence atall DK/Refused
Q21g For each, tell me how much confidence you have in each leader to do the rightthing regarding world affairs – a lot of confidence, some confidence, not too much
confidence, or no confidence at all: g. French President Nicolas Sarkozy
Total
114

21 36 16 21 5 100
13 49 12 11 16 100
16 61 12 10 2 100
24 49 16 5 6 100
8 40 20 13 20 100
3 32 22 8 35 100
5 15 19 11 50 100
2 5 5 53 35 100
4 19 27 30 21 100
4 16 26 36 18 100
5 17 22 37 19 100
17 51 12 6 14 100
2 17 23 10 48 100
6 20 11 15 49 100
2 17 18 11 52 100
11 61 16 2 9 100
2 3 5 27 63 100
4 39 28 6 24 100
5 17 8 23 47 100
5 25 13 35 22 100
4 16 20 27 33 100
16 23 19 17 26 100
8 14 9 13 55 100
33 26 8 5 29 100
Spring, 2008 --United StatesSpring, 2008 --BritainSpring, 2008 --FranceSpring, 2008 --GermanySpring, 2008 --Spain
Spring, 2008 --PolandSpring, 2008 --RussiaSpring, 2008 --TurkeySpring, 2008 --EgyptSpring, 2008 --JordanSpring, 2008 --Lebanon
Spring, 2008 --AustraliaSpring, 2008 --ChinaSpring, 2008 --IndiaSpring, 2008 --IndonesiaSpring, 2008 --JapanSpring, 2008 --Pakistan
Spring, 2008 --South KoreaSpring, 2008 --ArgentinaSpring, 2008 --BrazilSpring, 2008 --MexicoSpring, 2008 --NigeriaSpring, 2008 --South Africa
Spring, 2008 --Tanzania
A lot ofconfidence
Someconfidence
Not too muchconfidence
No confidence atall DK/Refused
Q21h For each, tell me how much confidence you have in each leader to do the rightthing regarding world affairs – a lot of confidence, some confidence, not too muchconfidence, or no confidence at all: h. U.S. Presidential candidate Barack Obama2
Total
In the U.S., the question excluded the text "U.S. Presidential candidate."2.
115
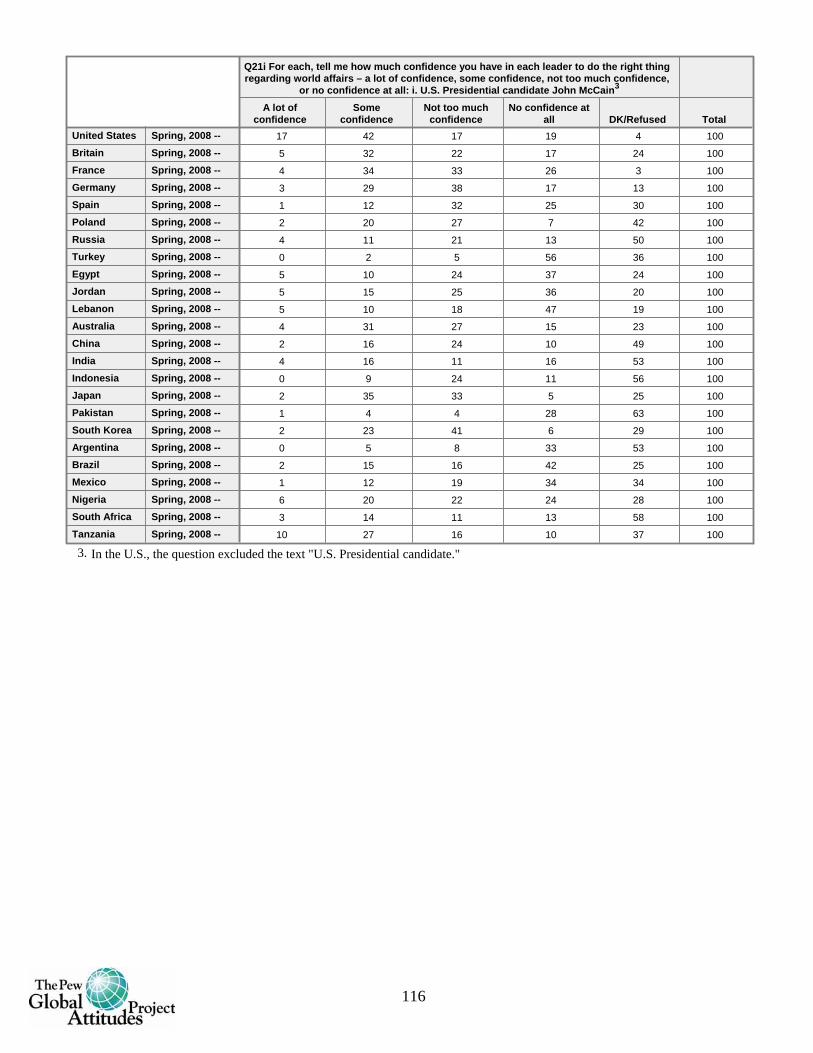
17 42 17 19 4 100
5 32 22 17 24 100
4 34 33 26 3 100
3 29 38 17 13 100
1 12 32 25 30 100
2 20 27 7 42 100
4 11 21 13 50 100
0 2 5 56 36 100
5 10 24 37 24 100
5 15 25 36 20 100
5 10 18 47 19 100
4 31 27 15 23 100
2 16 24 10 49 100
4 16 11 16 53 100
0 9 24 11 56 100
2 35 33 5 25 100
1 4 4 28 63 100
2 23 41 6 29 100
0 5 8 33 53 100
2 15 16 42 25 100
1 12 19 34 34 100
6 20 22 24 28 100
3 14 11 13 58 100
10 27 16 10 37 100
Spring, 2008 --United StatesSpring, 2008 --BritainSpring, 2008 --FranceSpring, 2008 --GermanySpring, 2008 --Spain
Spring, 2008 --PolandSpring, 2008 --RussiaSpring, 2008 --TurkeySpring, 2008 --EgyptSpring, 2008 --JordanSpring, 2008 --Lebanon
Spring, 2008 --AustraliaSpring, 2008 --ChinaSpring, 2008 --IndiaSpring, 2008 --IndonesiaSpring, 2008 --JapanSpring, 2008 --Pakistan
Spring, 2008 --South KoreaSpring, 2008 --ArgentinaSpring, 2008 --BrazilSpring, 2008 --MexicoSpring, 2008 --NigeriaSpring, 2008 --South Africa
Spring, 2008 --Tanzania
A lot ofconfidence
Someconfidence
Not too muchconfidence
No confidence atall DK/Refused
Q21i For each, tell me how much confidence you have in each leader to do the right thingregarding world affairs – a lot of confidence, some confidence, not too much confidence,
or no confidence at all: i. U.S. Presidential candidate John McCain3
Total
In the U.S., the question excluded the text "U.S. Presidential candidate."3.
116

18 36 18 25 4 100
9 40 22 19 9 100
10 49 25 16 0 100
19 47 22 10 3 100
5 29 34 21 11 100
6 31 27 10 26 100
6 18 22 11 44 100
3 6 6 57 28 100
5 12 18 39 26 100
6 9 24 44 17 100
4 10 20 48 18 100
13 50 20 11 6 100
3 21 24 10 43 100
13 35 10 10 33 100
2 14 27 11 46 100
5 42 39 9 6 100
2 4 4 29 62 100
3 42 35 4 15 100
2 11 12 37 38 100
3 22 15 40 20 100
7 21 17 28 26 100
12 23 19 21 25 100
11 25 8 11 46 100
17 31 15 10 28 100
Spring, 2008 --United StatesSpring, 2008 --BritainSpring, 2008 --FranceSpring, 2008 --GermanySpring, 2008 --Spain
Spring, 2008 --PolandSpring, 2008 --RussiaSpring, 2008 --TurkeySpring, 2008 --EgyptSpring, 2008 --JordanSpring, 2008 --Lebanon
Spring, 2008 --AustraliaSpring, 2008 --ChinaSpring, 2008 --IndiaSpring, 2008 --IndonesiaSpring, 2008 --JapanSpring, 2008 --Pakistan
Spring, 2008 --South KoreaSpring, 2008 --ArgentinaSpring, 2008 --BrazilSpring, 2008 --MexicoSpring, 2008 --NigeriaSpring, 2008 --South Africa
Spring, 2008 --Tanzania
A lot ofconfidence
Someconfidence
Not too muchconfidence
No confidence atall DK/Refused
Q21j For each, tell me how much confidence you have in each leader to do the right thingregarding world affairs – a lot of confidence, some confidence, not too much confidence,
or no confidence at all: j. U.S. Presidential candidate Hillary Clinton4
Total
In the U.S., the question excluded the text "U.S. Presidential candidate."4.
48 22 24 1 4 100Spring, 2008 --RussiaVladimir Putin
DmitriMedvedev
Both equally(VOL) Neither (VOL) DK/Refused
Q22 Going forward, who do you think will have more political power in our country –Vladimir Putin or Dmitri Medvedev?
Total
QUESTIONS Q23a - Q23e HELD FOR FUTURE RELEASE
117

40 48 9 2 1 100
34 50 13 2 0 100
40 48 11 1 0 100
22 42 26 8 2 100
15 56 23 1 5 100
27 32 25 10 7 100
57 22 7 3 11 100
45 41 9 3 1 100
44 45 8 3 1 100
47 45 6 1 2 100
36 49 14 1 1 100
7 43 32 6 12 100
26 47 12 5 9 100
26 44 18 5 7 100
63 30 5 1 1 100
36 23 10 6 25 100
47 46 6 0 1 100
39 35 11 9 6 100
31 36 14 5 15 100
38 35 12 10 4 100
47 35 7 7 4 100
50 31 9 5 4 100
38 37 13 5 7 100
46 29 10 9 6 100
42 33 15 5 6 100
36 28 13 5 19 100
32 23 22 13 10 100
22 25 18 19 16 100
Spring, 2008 --BritainSpring, 2008 --FranceSpring, 2008 --GermanySpring, 2008 --SpainSpring, 2008 --PolandSpring, 2008 --Russia
Spring, 2008 --TurkeySpring, 2008 --EgyptSpring, 2008 --JordanSpring, 2008 --LebanonSpring, 2008 --AustraliaSpring, 2008 --China
Spring, 2008 --IndiaSpring, 2008 --IndonesiaSpring, 2008 --JapanSpring, 2008 --PakistanSpring, 2008 --South KoreaSpring, 2008 --
Spring, 2007
Argentina
Spring, 2008 --Spring, 2007
Brazil
Spring, 2008 --Spring, 2007
Mexico
Spring, 2008 --Spring, 2007
Nigeria
Spring, 2008 --South AfricaSpring, 2008 --Spring, 2007
Tanzania
A great deal A fair amount Not too muchNo influence at
all DK/Refused
Q24 Overall, how much influence do you think the United States is having on the waythings are going in our country? Would you say it is having a great deal of influence, a
fair amount, not too much, or no influence at all?5
Total
Not asked in the U.S.5.
118

13 58 28 2 100 669
8 44 47 0 100 637
12 47 39 1 100 641
11 56 30 3 100 478
24 40 34 2 100 525
16 59 22 4 100 587
4 86 9 1 100 774
34 52 11 3 100 860
24 64 11 2 100 884
34 50 14 2 100 915
15 47 38 1 100 591
23 54 20 4 100 1622
47 34 17 2 100 1501
20 45 35 0 100 705
17 43 39 1 100 669
10 83 5 2 100 754
32 39 28 1 100 665
5 75 16 4 100 592
5 80 8 6 100 531
22 55 22 1 100 739
14 64 20 2 100 818
21 60 17 2 100 651
22 60 16 2 100 631
62 26 10 1 100 758
58 27 14 1 100 840
66 19 15 0 100 670
52 38 9 1 100 395
36 52 10 2 100 330
Spring, 2008 --BritainSpring, 2008 --FranceSpring, 2008 --GermanySpring, 2008 --SpainSpring, 2008 --PolandSpring, 2008 --RussiaSpring, 2008 --TurkeySpring, 2008 --EgyptSpring, 2008 --JordanSpring, 2008 --LebanonSpring, 2008 --AustraliaSpring, 2008 --ChinaSpring, 2008 --IndiaSpring, 2008 --IndonesiaSpring, 2008 --JapanSpring, 2008 --PakistanSpring, 2008 --South KoreaSpring, 2008 --Spring, 2007
Argentina
Spring, 2008 --Spring, 2007
Brazil
Spring, 2008 --Spring, 2007
Mexico
Spring, 2008 --Spring, 2007
Nigeria
Spring, 2008 --South AfricaSpring, 2008 --Spring, 2007
Tanzania
Good Bad Neither DK/Refused
Q25 ASK IF ‘A GREAT DEAL’ OR ‘A FAIR AMOUNT’ IN Q24:Is this a good thing, a bad thing, or neither good nor bad?6
Total N
Not asked in the U.S.6.
119

25 51 16 3 5 100
13 41 34 7 5 100
18 43 32 7 0 100
13 42 36 8 2 100
9 31 41 11 8 100
6 36 40 10 9 100
11 30 31 21 7 100
15 16 23 20 25 100
9 17 41 32 2 100
9 23 34 33 1 100
4 20 40 28 8 100
22 50 23 2 2 100
17 47 18 9 10 100
16 44 29 5 6 100
42 44 11 2 1 100
27 14 12 22 25 100
27 59 13 1 1 100
10 27 22 22 19 100
10 26 19 16 30 100
23 36 20 13 8 100
26 39 13 12 9 100
29 33 16 13 10 100
24 37 18 10 10 100
41 29 15 6 9 100
32 38 14 7 10 100
34 29 12 10 16 100
18 19 22 27 14 100
23 27 12 17 21 100
Spring, 2008 --United StatesSpring, 2008 --BritainSpring, 2008 --FranceSpring, 2008 --GermanySpring, 2008 --SpainSpring, 2008 --PolandSpring, 2008 --RussiaSpring, 2008 --TurkeySpring, 2008 --EgyptSpring, 2008 --JordanSpring, 2008 --LebanonSpring, 2008 --AustraliaSpring, 2008 --IndiaSpring, 2008 --IndonesiaSpring, 2008 --JapanSpring, 2008 --PakistanSpring, 2008 --South KoreaSpring, 2008 --Spring, 2007
Argentina
Spring, 2008 --Spring, 2007
Brazil
Spring, 2008 --Spring, 2007
Mexico
Spring, 2008 --Spring, 2007
Nigeria
Spring, 2008 --South AfricaSpring, 2008 --Spring, 2007
Tanzania
A great deal A fair amount Not too muchNo influence at
all DK/Refused
Q26 How much influence do you think China is having on the way things are going inour country? Would you say it is having a great deal of influence, a fair amount, not too
much, or no influence at all?7
Total
Not asked in China.7.
120

11 51 35 4 100 770
22 38 37 3 100 411
8 44 48 0 100 458
15 42 42 2 100 391
14 52 31 3 100 299
15 53 29 4 100 313
15 45 36 3 100 414
9 78 11 2 100 301
22 58 18 2 100 259
20 42 30 8 100 317
22 49 27 1 100 234
28 30 39 2 100 513
42 41 15 2 100 1307
33 23 43 1 100 608
11 55 33 0 100 623
82 12 5 1 100 497
27 42 28 2 100 615
22 43 26 8 100 307
21 51 14 14 100 291
38 35 23 3 100 568
26 54 18 2 100 656
23 58 16 3 100 502
20 63 13 4 100 516
85 9 6 0 100 698
79 12 8 1 100 785
54 27 17 2 100 646
80 14 4 1 100 258
78 13 7 2 100 349
Spring, 2008 --United StatesSpring, 2008 --BritainSpring, 2008 --FranceSpring, 2008 --GermanySpring, 2008 --SpainSpring, 2008 --PolandSpring, 2008 --RussiaSpring, 2008 --TurkeySpring, 2008 --EgyptSpring, 2008 --JordanSpring, 2008 --LebanonSpring, 2008 --AustraliaSpring, 2008 --IndiaSpring, 2008 --IndonesiaSpring, 2008 --JapanSpring, 2008 --PakistanSpring, 2008 --South KoreaSpring, 2008 --Spring, 2007
Argentina
Spring, 2008 --Spring, 2007
Brazil
Spring, 2008 --Spring, 2007
Mexico
Spring, 2008 --Spring, 2007
Nigeria
Spring, 2008 --South AfricaSpring, 2008 --Spring, 2007
Tanzania
Good thing Bad thing Neither DK/Refused
Q27 ASK IF ‘A GREAT DEAL’ OR ‘A FAIR AMOUNT’ IN Q26:Is this a good thing, a bad thing, or neither good nor bad?8
Total N
Not asked in China.8.
121

53 37 6 1 2 100
38 43 14 5 0 100
39 51 8 1 0 100
23 51 19 3 4 100
15 52 24 3 7 100
20 34 26 11 10 100
48 31 6 3 12 100
41 45 12 2 1 100
49 33 15 2 2 100
36 47 12 3 3 100
43 48 9 0 1 100
7 39 34 8 13 100
28 45 14 5 9 100
18 48 19 5 10 100
60 35 4 1 1 100
22 19 13 10 35 100
52 42 4 0 1 100
26 36 15 13 9 100
32 37 16 10 6 100
50 28 12 7 4 100
36 26 15 16 7 100
33 28 10 7 22 100
26 29 17 18 10 100
Spring, 2008 --BritainSpring, 2008 --FranceSpring, 2008 --GermanySpring, 2008 --SpainSpring, 2008 --PolandSpring, 2008 --RussiaSpring, 2008 --TurkeySpring, 2008 --EgyptSpring, 2008 --JordanSpring, 2008 --LebanonSpring, 2008 --AustraliaSpring, 2008 --ChinaSpring, 2008 --IndiaSpring, 2008 --IndonesiaSpring, 2008 --JapanSpring, 2008 --PakistanSpring, 2008 --South KoreaSpring, 2008 --ArgentinaSpring, 2008 --BrazilSpring, 2008 --MexicoSpring, 2008 --NigeriaSpring, 2008 --South AfricaSpring, 2008 --Tanzania
Great deal Fair amount Not too much Not at all DK/Refused
Q28 In your opinion, how much, if at all, does what happens in the Americaneconomy affect economic conditions in (survey country)—a great deal, fair
amount, not too much, or not at all?9
Total
Not asked in the U.S.9.
122
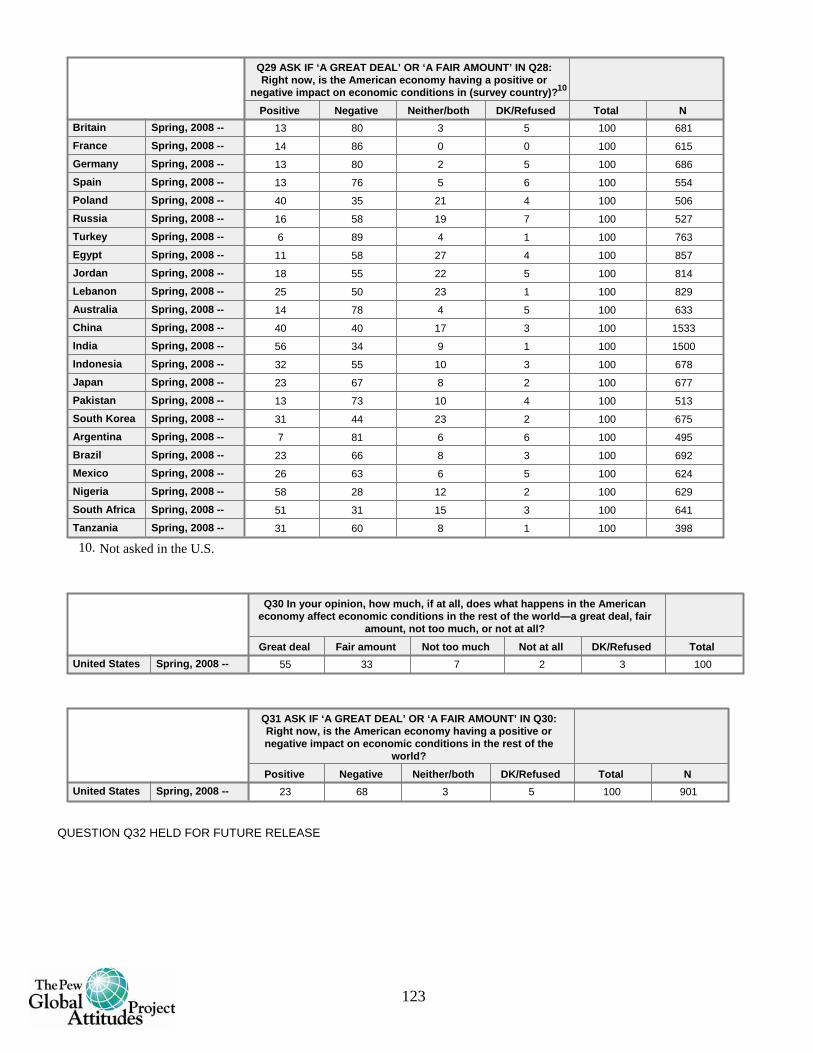
13 80 3 5 100 681
14 86 0 0 100 615
13 80 2 5 100 686
13 76 5 6 100 554
40 35 21 4 100 506
16 58 19 7 100 527
6 89 4 1 100 763
11 58 27 4 100 857
18 55 22 5 100 814
25 50 23 1 100 829
14 78 4 5 100 633
40 40 17 3 100 1533
56 34 9 1 100 1500
32 55 10 3 100 678
23 67 8 2 100 677
13 73 10 4 100 513
31 44 23 2 100 675
7 81 6 6 100 495
23 66 8 3 100 692
26 63 6 5 100 624
58 28 12 2 100 629
51 31 15 3 100 641
31 60 8 1 100 398
Spring, 2008 --BritainSpring, 2008 --FranceSpring, 2008 --GermanySpring, 2008 --SpainSpring, 2008 --PolandSpring, 2008 --RussiaSpring, 2008 --TurkeySpring, 2008 --EgyptSpring, 2008 --JordanSpring, 2008 --LebanonSpring, 2008 --AustraliaSpring, 2008 --ChinaSpring, 2008 --IndiaSpring, 2008 --IndonesiaSpring, 2008 --JapanSpring, 2008 --PakistanSpring, 2008 --South KoreaSpring, 2008 --ArgentinaSpring, 2008 --BrazilSpring, 2008 --MexicoSpring, 2008 --NigeriaSpring, 2008 --South AfricaSpring, 2008 --Tanzania
Positive Negative Neither/both DK/Refused
Q29 ASK IF ‘A GREAT DEAL’ OR ‘A FAIR AMOUNT’ IN Q28:Right now, is the American economy having a positive or
negative impact on economic conditions in (survey country)?10
Total N
Not asked in the U.S.10.
55 33 7 2 3 100Spring, 2008 --United StatesGreat deal Fair amount Not too much Not at all DK/Refused
Q30 In your opinion, how much, if at all, does what happens in the Americaneconomy affect economic conditions in the rest of the world—a great deal, fair
amount, not too much, or not at all?Total
23 68 3 5 100 901Spring, 2008 --United StatesPositive Negative Neither/both DK/Refused
Q31 ASK IF ‘A GREAT DEAL’ OR ‘A FAIR AMOUNT’ IN Q30:Right now, is the American economy having a positive ornegative impact on economic conditions in the rest of the
world?Total N
QUESTION Q32 HELD FOR FUTURE RELEASE
123

33 47 16 4 1 100
10 40 37 13 0 100
5 35 45 16 0 100
14 42 37 6 1 100
3 22 53 21 1 100
2 22 43 31 3 100
6 17 33 42 2 100
4 21 17 51 7 100
12 32 32 20 4 100
13 37 32 14 4 100
8 34 32 24 2 100
12 40 33 15 0 100
2 15 44 32 7 100
11 35 23 21 9 100
2 13 36 48 0 100
24 59 14 3 0 100
4 15 14 44 23 100
6 41 38 15 1 100
1 9 27 59 3 100
6 14 39 39 1 100
8 25 31 32 4 100
19 30 28 19 4 100
10 23 21 34 13 100
12 17 28 38 5 100
Spring, 2008 --United StatesSpring, 2008 --BritainSpring, 2008 --FranceSpring, 2008 --GermanySpring, 2008 --SpainSpring, 2008 --PolandSpring, 2008 --RussiaSpring, 2008 --TurkeySpring, 2008 --EgyptSpring, 2008 --JordanSpring, 2008 --LebanonSpring, 2008 --AustraliaSpring, 2008 --ChinaSpring, 2008 --IndiaSpring, 2008 --IndonesiaSpring, 2008 --JapanSpring, 2008 --PakistanSpring, 2008 --South KoreaSpring, 2008 --ArgentinaSpring, 2008 --BrazilSpring, 2008 --MexicoSpring, 2008 --NigeriaSpring, 2008 --South AfricaSpring, 2008 --Tanzania
Very closelySomewhat
closelyNot tooclosely Not at all DK/Refused
Q32a How closely have you been following news about the U.S. presidentialrace – very closely, somewhat closely, not too closely, or not at all?11
Total
In the U.S., the question excluded the text "U.S."11.
124

45 5 37 13 100 817
53 3 33 11 100 379
68 1 29 1 100 300
64 1 29 5 100 477
67 1 21 12 100 189
31 27 31 10 100 172
32 14 42 12 100 221
29 13 43 16 100 235
25 37 31 7 100 437
19 36 37 7 100 506
30 33 31 6 100 430
54 1 36 9 100 363
40 12 39 10 100 562
59 21 15 5 100 961
48 7 37 9 100 157
20 7 67 7 100 590
20 24 24 32 100 243
42 9 41 8 100 334
53 5 23 19 100 85
47 9 39 5 100 209
37 18 40 5 100 268
67 10 19 4 100 491
66 7 21 6 100 353
65 6 19 10 100 230
Spring, 2008 --United StatesSpring, 2008 --BritainSpring, 2008 --FranceSpring, 2008 --GermanySpring, 2008 --SpainSpring, 2008 --PolandSpring, 2008 --RussiaSpring, 2008 --TurkeySpring, 2008 --EgyptSpring, 2008 --JordanSpring, 2008 --LebanonSpring, 2008 --AustraliaSpring, 2008 --ChinaSpring, 2008 --IndiaSpring, 2008 --IndonesiaSpring, 2008 --JapanSpring, 2008 --PakistanSpring, 2008 --South KoreaSpring, 2008 --ArgentinaSpring, 2008 --BrazilSpring, 2008 --MexicoSpring, 2008 --NigeriaSpring, 2008 --South AfricaSpring, 2008 --Tanzania
Change forthe better
Change forthe worse
Not changethat much DK/Refused
Q32b ASK IF ‘VERY CLOSELY’ OR ‘SOMEWHAT CLOSELY’ INQ32a: What is your opinion—next year when there is a new USpresident, do you think that US foreign policy will change for
the better, change for the worse or not change that much?12
Total N
In the U.S., the questionnaire excluded the text "U.S."12.
QUESTIONS Q32c - Q32d HELD FOR FUTURE RELEASE
125

42 30 13 11 3 100
47 28 13 9 2 100
56 28 10 5 1 100
45 37 10 5 3 100
72 24 3 1 0 100
68 27 4 1 0 100
61 29 7 2 1 100
60 26 8 4 2 100
67 28 2 2 1 100
70 25 2 0 3 100
51 35 8 1 4 100
40 47 8 2 4 100
49 25 14 7 4 100
40 33 19 6 3 100
82 7 3 2 5 100
70 18 3 1 8 100
38 38 16 6 3 100
32 37 18 8 6 100
41 35 20 4 1 100
32 32 25 8 3 100
43 35 19 2 1 100
41 42 15 2 1 100
62 27 6 3 1 100
24 51 17 1 7 100
42 46 7 1 4 100
66 22 5 1 5 100
57 28 4 1 10 100
46 32 9 3 10 100
43 32 9 3 12 100
73 22 4 1 0 100
78 19 2 1 1 100
48 12 5 3 31 100
41 21 5 3 30 100
68 29 3 1 0 100
75 22 2 0 0 100
70 24 3 1 3 100
69 21 2 1 7 100
92 4 1 1 1 100
88 8 1 2 2 100
70 18 6 1 4 100
57 24 10 2 7 100
45 25 11 6 13 100
47 19 10 4 20 100
75 14 6 3 2 100
Spring, 2008 --Spring, 2007
UnitedStates
Spring, 2008 --Spring, 2007
Britain
Spring, 2008 --Spring, 2007
France
Spring, 2008 --Spring, 2007
Germany
Spring, 2008 --Spring, 2007
Spain
Spring, 2008 --Spring, 2007
Poland
Spring, 2008 --Spring, 2007
Russia
Spring, 2008 --Spring, 2007
Turkey
Spring, 2008 --Spring, 2007
Egypt
Spring, 2008 --Spring, 2007
Jordan
Spring, 2008 --Spring, 2007
Lebanon
Spring, 2008 --AustraliaSpring, 2008 --Spring, 2007
China
Spring, 2008 --Spring, 2007
India
Spring, 2008 --Spring, 2007
Indonesia
Spring, 2008 --Spring, 2007
Japan
Spring, 2008 --Spring, 2007
Pakistan
Spring, 2008 --Spring, 2007
South Korea
Spring, 2008 --Spring, 2007
Argentina
Spring, 2008 --Spring, 2007
Brazil
Spring, 2008 --Spring, 2007
Mexico
Spring, 2008 --NigeriaSpring, 2008 --South AfricaSpring, 2008 --Tanzania
Very seriousSomewhat
seriousNot tooserious Not a problem DK/Refused
Q33 On another topic, in your view, is global warming a very serious problem,somewhat serious, not too serious, or not a problem?
Total
126

3 15 2 4 7 57 1 0 2 9 100
3 45 4 3 8 12 1 6 0 19 100
3 71 2 6 6 6 3 0 2 1 100
2 80 1 2 2 3 2 0 1 6 100
7 38 4 5 7 9 1 5 3 20 100
1 25 2 6 16 24 1 0 3 21 100
3 26 3 3 19 5 18 0 2 20 100
3 19 2 1 10 4 1 2 6 51 100
7 14 13 5 18 7 2 17 8 9 100
7 12 14 6 15 8 4 20 8 6 100
2 25 6 8 9 7 4 16 15 7 100
1 43 2 5 7 21 1 0 5 14 100
2 8 42 2 6 7 2 0 1 29 100
54 3 3 3 7 16 3 0 1 10 100
3 8 10 5 32 16 2 0 3 22 100
5 36 2 2 34 4 2 0 4 13 100
4 2 44 1 7 7 0 0 10 26 100
3 33 1 5 23 13 1 0 6 16 100
3 18 6 8 13 9 2 7 2 33 100
3 11 5 43 12 14 0 1 0 10 100
7 11 13 5 9 19 5 0 4 28 100
2 6 22 2 4 48 2 0 1 12 100
4 12 8 6 5 28 2 0 4 32 100
5 11 7 11 6 18 4 0 7 32 100
Spring, 2008 --United StatesSpring, 2008 --BritainSpring, 2008 --FranceSpring, 2008 --GermanySpring, 2008 --SpainSpring, 2008 --PolandSpring, 2008 --RussiaSpring, 2008 --TurkeySpring, 2008 --EgyptSpring, 2008 --JordanSpring, 2008 --LebanonSpring, 2008 --AustraliaSpring, 2008 --ChinaSpring, 2008 --IndiaSpring, 2008 --IndonesiaSpring, 2008 --JapanSpring, 2008 --PakistanSpring, 2008 --South Korea
Spring, 2008 --ArgentinaSpring, 2008 --BrazilSpring, 2008 --MexicoSpring, 2008 --NigeriaSpring, 2008 --South AfricaSpring, 2008 --Tanzania
India Germany China Brazil Japan United States Russia None (VOL) Other (VOL) DK/RefusedQ34 Which one of the following countries would you trust most to do the right thing in protecting the world’s environment? (READ) (ONE RESPONSE ONLY)
Total
4 0 40 3 5 22 7 0 1 18 100
5 0 22 2 3 33 10 0 4 22 100
4 3 40 2 2 36 4 1 0 10 100
5 1 31 3 1 41 4 0 3 13 100
10 1 34 3 3 35 12 0 0 0 100
9 1 23 1 2 53 9 0 0 2 100
6 1 39 3 2 34 9 0 0 6 100
4 1 33 1 1 45 8 0 1 8 100
4 2 17 2 3 51 7 0 1 13 100
7 0 7 2 4 56 2 0 0 22 100
2 3 23 2 2 26 25 0 1 17 100
3 4 11 2 3 29 19 0 0 29 100
6 1 18 3 4 28 18 0 2 18 100
2 2 14 2 3 26 16 0 2 33 100
3 1 6 1 1 46 5 0 3 34 100
2 1 3 0 2 61 4 0 2 25 100
6 5 20 9 18 22 13 0 4 4 100
6 8 19 6 19 27 6 0 3 7 100
7 7 19 8 15 24 15 0 6 1 100
5 6 19 6 19 22 6 0 2 14 100
18 4 18 4 3 36 8 0 8 1 100
5 5 19 5 7 37 7 0 7 9 100
9 1 46 4 3 24 4 0 1 8 100
11 5 9 4 9 26 4 0 1 31 100
7 1 11 2 9 38 2 0 3 29 100
19 6 21 4 7 21 4 0 2 15 100
29 4 10 5 4 25 3 0 2 17 100
7 3 11 1 5 42 11 0 1 19 100
3 2 6 1 4 52 4 0 2 27 100
2 1 67 1 3 17 2 0 1 7 100
1 1 34 0 7 36 1 0 1 18 100
23 1 1 0 0 51 2 0 1 19 100
24 0 1 0 0 41 1 0 1 31 100
4 0 64 1 2 19 1 0 2 6 100
1 0 56 1 2 30 0 0 1 9 100
1 2 7 4 5 54 4 0 5 18 100
1 1 3 3 4 49 1 0 4 35 100
5 3 11 14 6 44 5 0 0 13 100
3 1 6 16 3 49 4 0 1 16 100
2 4 13 3 5 38 7 0 4 24 100
5 6 11 3 5 39 6 0 2 22 100
6 5 11 2 7 24 8 0 6 31 100
7 4 16 2 6 11 6 0 2 44 100
11 3 5 2 8 27 9 0 1 32 100
Spring, 2008 --Spring, 2007
UnitedStates
Spring, 2008 --Spring, 2007
Britain
Spring, 2008 --Spring, 2007
France
Spring, 2008 --Spring, 2007
Germany
Spring, 2008 --Spring, 2007
Spain
Spring, 2008 --Spring, 2007
Poland
Spring, 2008 --Spring, 2007
Russia
Spring, 2008 --Spring, 2007
Turkey
Spring, 2008 --Spring, 2007
Egypt
Spring, 2008 --Spring, 2007
Jordan
Spring, 2008 --Spring, 2007
Lebanon
Spring, 2008 --AustraliaSpring, 2008 --Spring, 2007
China
Spring, 2008 --Spring, 2007
India
Spring, 2008 --Spring, 2007
Indonesia
Spring, 2008 --Spring, 2007
Japan
Spring, 2008 --Spring, 2007
Pakistan
Spring, 2008 --Spring, 2007
South Korea
Spring, 2008 --Spring, 2007
Argentina
Spring, 2008 --Spring, 2007
Brazil
Spring, 2008 --Spring, 2007
Mexico
Spring, 2008 --NigeriaSpring, 2008 --South AfricaSpring, 2008 --Tanzania
India Germany China Brazil Japan United States Russia None (VOL) Other (VOL) DK/RefusedQ35 Which ONE of the following, if any, is hurting the world’s environment the most? (READ) (ONE RESPONSE ONLY)
Total
127

19 4 18 8 13 15 14 1 8 100 808
17 1 27 6 8 24 12 0 5 100 677
16 2 25 7 9 22 18 0 1 100 752
16 2 28 5 5 25 18 0 1 100 710
4 5 22 4 10 17 19 0 17 100 653
8 5 26 6 7 15 24 2 7 100 631
8 5 21 6 5 22 18 1 14 100 800
5 8 15 2 4 11 22 5 27 100 637
4 5 18 13 2 19 29 8 3 100 964
19 6 24 4 3 16 19 6 2 100 990
9 3 21 6 8 14 22 12 5 100 995
26 2 24 7 8 19 10 1 3 100 642
12 7 8 6 20 18 12 2 15 100 2242
9 7 19 5 8 10 6 1 35 100 1745
5 8 18 3 10 14 20 2 21 100 814
13 1 16 3 7 37 10 2 10 100 669
36 2 1 1 1 24 11 4 21 100 980
22 1 21 5 3 20 8 3 18 100 674
5 7 19 9 11 12 15 3 18 100 658
5 6 26 11 10 19 11 1 11 100 860
6 8 18 7 12 12 15 4 18 100 620
6 12 10 3 13 7 19 6 23 100 690
12 8 13 9 14 13 10 3 17 100 596
9 7 16 4 16 12 17 3 14 100 487
Spring, 2008 --United StatesSpring, 2008 --BritainSpring, 2008 --FranceSpring, 2008 --GermanySpring, 2008 --SpainSpring, 2008 --PolandSpring, 2008 --RussiaSpring, 2008 --TurkeySpring, 2008 --EgyptSpring, 2008 --JordanSpring, 2008 --LebanonSpring, 2008 --AustraliaSpring, 2008 --ChinaSpring, 2008 --IndiaSpring, 2008 --IndonesiaSpring, 2008 --JapanSpring, 2008 --PakistanSpring, 2008 --South KoreaSpring, 2008 --ArgentinaSpring, 2008 --BrazilSpring, 2008 --MexicoSpring, 2008 --NigeriaSpring, 2008 --South AfricaSpring, 2008 --Tanzania
India Germany China Brazil Japan United States Russia Other (VOL) DK/Refused
Q35a ASK IF PROVIDED ANSWER IN Q35 Which country would you name next? (READ) (ONE RESPONSE ONLY) (DO NOT MARK SAMERESPONSE AS Q35)
Total N
20 4 55 9 15 35 18 2 25 182
19 3 64 8 10 57 14 1 14 190
26 3 60 10 12 57 30 0 1 200
21 3 66 7 6 58 26 0 7 194
8 7 36 6 11 66 24 1 28 187
9 7 44 7 7 39 45 2 23 183
12 6 35 8 9 46 33 3 30 182
6 7 16 2 4 54 20 6 52 166
10 9 37 22 19 40 41 11 6 196
25 13 43 12 18 40 33 12 3 199
27 7 38 10 12 50 30 20 6 199
32 3 68 10 10 41 14 2 11 192
19 10 14 9 23 39 12 2 41 169
26 12 37 8 14 29 10 3 45 185
11 9 26 4 13 53 27 3 36 181
14 2 82 4 9 52 12 2 16 193
53 3 1 1 1 71 11 4 36 181
25 1 83 6 5 38 8 4 23 194
5 8 23 11 14 63 17 0 7 33 182
10 7 34 24 15 61 14 1 22 187
6 10 26 8 15 47 18 7 38 176
11 14 18 4 16 29 21 11 47 169
14 8 23 8 14 19 12 0 4 54 155
17 8 17 5 19 35 21 3 42 168
Spring, 2008 --United StatesSpring, 2008 --BritainSpring, 2008 --FranceSpring, 2008 --GermanySpring, 2008 --SpainSpring, 2008 --PolandSpring, 2008 --RussiaSpring, 2008 --TurkeySpring, 2008 --EgyptSpring, 2008 --JordanSpring, 2008 --LebanonSpring, 2008 --AustraliaSpring, 2008 --ChinaSpring, 2008 --IndiaSpring, 2008 --IndonesiaSpring, 2008 --JapanSpring, 2008 --PakistanSpring, 2008 --South Korea
Spring, 2008 --ArgentinaSpring, 2008 --BrazilSpring, 2008 --MexicoSpring, 2008 --NigeriaSpring, 2008 --South AfricaSpring, 2008 --Tanzania
India Germany China Brazil Japan United States Russia None (VOL) Other (VOL) DK/RefusedQ.35/Q.35a COMBINED
Total
QUESTION Q35b HELD FOR FUTURE RELEASE
128

6 34 37 16 6 100
9 45 31 8 6 100
2 38 41 12 6 100
2 50 35 8 5 100
3 30 45 22 0 100
3 40 40 17 0 100
3 23 51 21 3 100
2 31 52 12 4 100
1 24 43 22 9 100
2 16 45 23 14 100
2 25 40 21 13 100
2 16 32 24 25 100
3 14 38 20 25 100
3 9 15 51 21 100
2 15 22 42 18 100
4 37 35 22 2 100
1 31 38 25 6 100
7 34 29 25 5 100
2 32 37 29 2 100
8 37 29 22 4 100
1 36 46 12 5 100
2 31 31 7 29 100
2 17 34 8 40 100
13 43 13 8 23 100
23 36 13 6 22 100
4 30 27 14 26 100
3 30 36 16 15 100
0 24 58 9 8 100
2 36 51 4 7 100
16 25 13 21 25 100
11 28 10 14 38 100
3 33 44 4 17 100
2 18 23 29 28 100
2 20 33 29 17 100
8 27 28 24 13 100
23 38 11 10 17 100
23 49 12 6 11 100
7 24 25 15 30 100
19 35 10 26 11 100
Spring, 2008 --Spring, 2006
UnitedStates
Spring, 2008 --Spring, 2006
Britain
Spring, 2008 --Spring, 2006
France
Spring, 2008 --Spring, 2006
Germany
Spring, 2008 --Spring, 2006
Spain
Spring, 2008 --PolandSpring, 2008 --Spring, 2006
Russia
Spring, 2008 --Spring, 2006
Turkey
Spring, 2008 --Spring, 2006
Egypt
Spring, 2008 --Spring, 2006
Jordan
Spring, 2008 --LebanonSpring, 2008 --AustraliaSpring, 2008 --Spring, 2006
China
Spring, 2008 --Spring, 2006
India
Spring, 2008 --Spring, 2006
Indonesia
Spring, 2008 --Spring, 2006
Japan
Spring, 2008 --Spring, 2006
Pakistan
Spring, 2008 --South KoreaSpring, 2008 --ArgentinaSpring, 2008 --BrazilSpring, 2008 --MexicoSpring, 2008 --Spring, 2006
Nigeria
Spring, 2008 --South AfricaSpring, 2008 --Tanzania
Definitelysucceed
Probablysucceed Probably fail Definitely fail DK/Refused
Q36 Regardless of what you think about the original decision to use militaryforce in Iraq, do you now believe that efforts to establish a stable democraticgovernment in Iraq will definitely succeed, probably succeed, probably fail, or
definitely fail?
Total
129

50 44 6 100
50 42 7 100
48 43 9 100
45 42 13 100
46 54 1 100
48 51 1 100
43 54 3 100
44 49 8 100
34 56 10 100
22 67 11 100
24 65 11 100
24 63 13 100
14 72 14 100
12 73 16 100
8 72 19 100
11 74 15 100
14 80 6 100
12 82 6 100
16 76 7 100
15 78 7 100
30 66 4 100
27 70 3 100
60 33 7 100
8 69 22 100
5 80 15 100
33 42 25 100
34 49 18 100
21 56 23 100
8 80 12 100
32 60 8 100
29 47 24 100
9 72 19 100
3 75 22 100
37 46 17 100
28 60 12 100
6 82 12 100
3 85 12 100
19 70 11 100
19 74 6 100
12 75 13 100
17 70 14 100
38 45 17 100
48 42 11 100
28 43 30 100
Spring, 2008 --Spring, 2007
UnitedStates
Spring, 2008 --Spring, 2007
Britain
Spring, 2008 --Spring, 2007
France
Spring, 2008 --Spring, 2007
Germany
Spring, 2008 --Spring, 2007
Spain
Spring, 2008 --Spring, 2007
Poland
Spring, 2008 --Spring, 2007
Russia
Spring, 2008 --Spring, 2007
Turkey
Spring, 2008 --Spring, 2007
Egypt
Spring, 2008 --Spring, 2007
Jordan
Spring, 2008 --Spring, 2007
Lebanon
Spring, 2008 --AustraliaSpring, 2008 --Spring, 2007
China
Spring, 2008 --Spring, 2007
India
Spring, 2008 --Spring, 2007
Indonesia
Spring, 2008 --Spring, 2007
Japan
Spring, 2008 --Spring, 2007
Pakistan
Spring, 2008 --Spring, 2007
South Korea
Spring, 2008 --Spring, 2007
Argentina
Spring, 2008 --Spring, 2007
Brazil
Spring, 2008 --Spring, 2007
Mexico
Spring, 2008 --Spring, 2007
Nigeria
Spring, 2008 --South Africa
Keep troops inAfghanistan
Remove theirtroops DK/Refused
Q37 Do you think the U.S. and NATO should keepmilitary troops in Afghanistan until the situation has
stabilized, or do you think the U.S. and NATOshould remove their troops as soon as possible?
Total
130

39 53 9 100
19 67 14 100
Spring, 2008 --Spring, 2007
Tanzania
Keep troops inAfghanistan
Remove theirtroops DK/Refused
Q37 Do you think the U.S. and NATO should keepmilitary troops in Afghanistan until the situation has
stabilized, or do you think the U.S. and NATOshould remove their troops as soon as possible?
Total
QUESTION Q38 HELD FOR FUTURE RELEASE
41 43 17 100
50 38 13 100
45 55 0 100
50 47 3 100
45 39 15 100
41 39 20 100
67 13 20 100
31 19 50 100
45 30 25 100
52 34 14 100
55 28 17 100
58 32 10 100
76 9 15 100
75 9 17 100
39 55 6 100
54 4 42 100
63 22 15 100
72 7 21 100
76 16 9 100
67 19 14 100
79 4 18 100
56 12 32 100
78 9 13 100
Spring, 2008 --United StatesSpring, 2008 --BritainSpring, 2008 --FranceSpring, 2008 --GermanySpring, 2008 --SpainSpring, 2008 --PolandSpring, 2008 --RussiaSpring, 2008 --TurkeySpring, 2008 --EgyptSpring, 2008 --JordanSpring, 2008 --LebanonSpring, 2008 --AustraliaSpring, 2008 --IndiaSpring, 2008 --IndonesiaSpring, 2008 --JapanSpring, 2008 --PakistanSpring, 2008 --South KoreaSpring, 2008 --ArgentinaSpring, 2008 --BrazilSpring, 2008 --MexicoSpring, 2008 --NigeriaSpring, 2008 --South AfricaSpring, 2008 --Tanzania
Good Bad DK/Refused
Q39 Turning to China, all things considered,was the decision to hold the 2008 SummerOlympics in China a good or bad decision?13
Total
Not asked in China.13.
QUESTIONS Q40 - Q43b HELD FOR FUTURE RELEASE
131
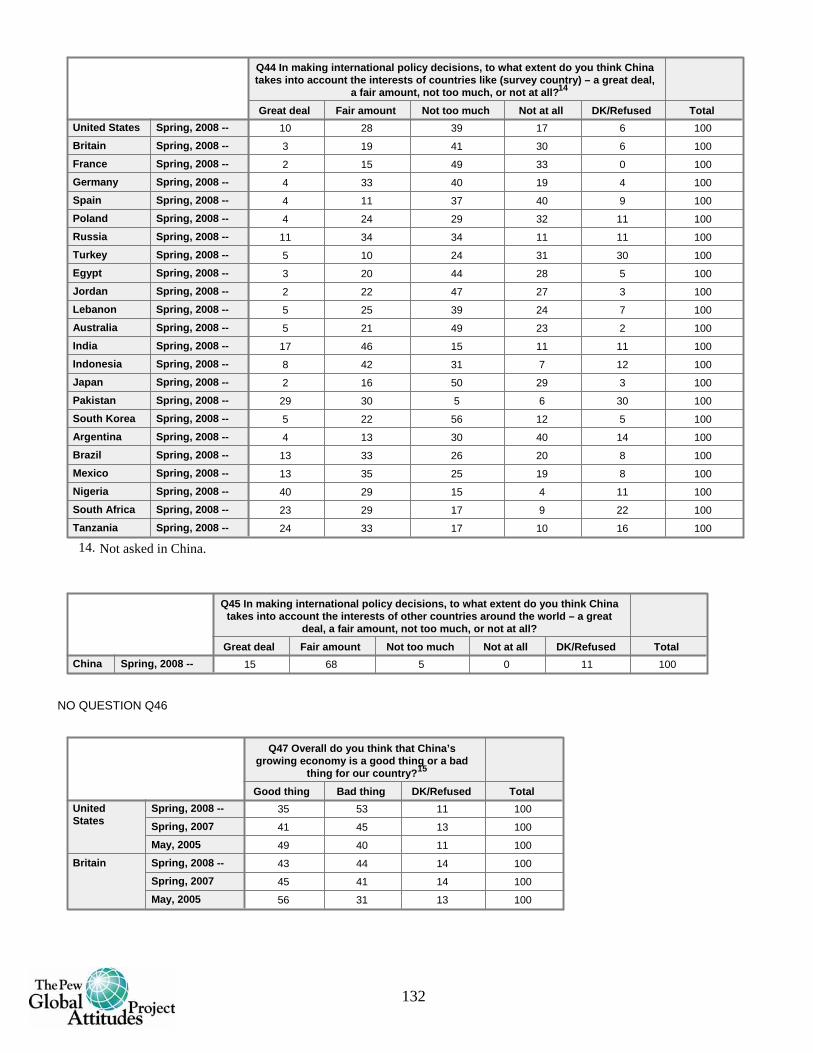
10 28 39 17 6 100
3 19 41 30 6 100
2 15 49 33 0 100
4 33 40 19 4 100
4 11 37 40 9 100
4 24 29 32 11 100
11 34 34 11 11 100
5 10 24 31 30 100
3 20 44 28 5 100
2 22 47 27 3 100
5 25 39 24 7 100
5 21 49 23 2 100
17 46 15 11 11 100
8 42 31 7 12 100
2 16 50 29 3 100
29 30 5 6 30 100
5 22 56 12 5 100
4 13 30 40 14 100
13 33 26 20 8 100
13 35 25 19 8 100
40 29 15 4 11 100
23 29 17 9 22 100
24 33 17 10 16 100
Spring, 2008 --United StatesSpring, 2008 --BritainSpring, 2008 --FranceSpring, 2008 --GermanySpring, 2008 --SpainSpring, 2008 --PolandSpring, 2008 --RussiaSpring, 2008 --TurkeySpring, 2008 --EgyptSpring, 2008 --JordanSpring, 2008 --LebanonSpring, 2008 --AustraliaSpring, 2008 --IndiaSpring, 2008 --IndonesiaSpring, 2008 --JapanSpring, 2008 --PakistanSpring, 2008 --South KoreaSpring, 2008 --ArgentinaSpring, 2008 --BrazilSpring, 2008 --MexicoSpring, 2008 --NigeriaSpring, 2008 --South AfricaSpring, 2008 --Tanzania
Great deal Fair amount Not too much Not at all DK/Refused
Q44 In making international policy decisions, to what extent do you think Chinatakes into account the interests of countries like (survey country) – a great deal,
a fair amount, not too much, or not at all?14
Total
Not asked in China.14.
15 68 5 0 11 100Spring, 2008 --ChinaGreat deal Fair amount Not too much Not at all DK/Refused
Q45 In making international policy decisions, to what extent do you think Chinatakes into account the interests of other countries around the world – a great
deal, a fair amount, not too much, or not at all?Total
NO QUESTION Q46
35 53 11 100
41 45 13 100
49 40 11 100
43 44 14 100
45 41 14 100
56 31 13 100
Spring, 2008 --Spring, 2007May, 2005
UnitedStates
Spring, 2008 --Spring, 2007May, 2005
Britain
Good thing Bad thing DK/Refused
Q47 Overall do you think that China’sgrowing economy is a good thing or a bad
thing for our country?15
Total
132

37 63 0 100
35 64 1 100
37 61 2 100
39 56 5 100
39 55 6 100
53 38 9 100
38 45 17 100
35 44 21 100
36 48 15 100
31 46 23 100
33 44 24 100
36 38 26 100
43 34 23 100
53 27 20 100
48 39 13 100
46 40 14 100
13 56 31 100
27 49 24 100
47 33 20 100
50 37 13 100
52 37 11 100
57 34 9 100
65 25 10 100
61 30 8 100
63 29 9 100
42 45 13 100
42 48 10 100
40 50 10 100
53 36 10 100
57 31 12 100
66 27 8 100
55 37 8 100
57 27 16 100
68 28 4 100
70 6 24 100
63 10 27 100
39 54 6 100
36 60 4 100
38 25 37 100
39 24 38 100
53 31 17 100
47 40 13 100
36 48 16 100
28 55 16 100
Spring, 2008 --Spring, 2007May, 2005
France
Spring, 2008 --Spring, 2007May, 2005
Germany
Spring, 2008 --Spring, 2007May, 2005
Spain
Spring, 2008 --Spring, 2007May, 2005
Poland
Spring, 2008 --Spring, 2007Spring, 2006May, 2005
Russia
Spring, 2008 --Spring, 2007
Turkey
Spring, 2008 --Spring, 2007
Egypt
Spring, 2008 --Spring, 2007
Jordan
Spring, 2008 --Spring, 2007
Lebanon
Spring, 2008 --AustraliaSpring, 2008 --Spring, 2007Spring, 2006May, 2005
India
Spring, 2008 --Spring, 2007
Indonesia
Spring, 2008 --Spring, 2007Spring, 2006
Japan
Spring, 2008 --Spring, 2007
Pakistan
Spring, 2008 --Spring, 2007
South Korea
Spring, 2008 --Spring, 2007
Argentina
Spring, 2008 --Spring, 2007
Brazil
Spring, 2008 --Spring, 2007
Mexico
Good thing Bad thing DK/Refused
Q47 Overall do you think that China’sgrowing economy is a good thing or a bad
thing for our country?15
Total
133

87 5 7 100
80 7 13 100
56 25 19 100
77 16 7 100
75 10 16 100
Spring, 2008 --Spring, 2007
Nigeria
Spring, 2008 --South AfricaSpring, 2008 --Spring, 2007
Tanzania
Good thing Bad thing DK/Refused
Q47 Overall do you think that China’sgrowing economy is a good thing or a bad
thing for our country?15
Total
Not asked in China.15.
8 82 10 100
15 68 17 100
9 74 17 100
12 66 22 100
12 87 1 100
15 84 1 100
8 81 11 100
10 77 14 100
7 72 21 100
15 58 27 100
9 74 17 100
8 72 20 100
11 77 12 100
12 70 18 100
12 76 12 100
11 52 37 100
15 53 32 100
30 48 22 100
31 50 18 100
33 46 21 100
36 43 21 100
17 62 20 100
20 67 14 100
12 75 13 100
24 62 15 100
31 59 10 100
26 63 11 100
27 42 31 100
37 43 20 100
5 90 5 100
6 80 14 100
3 93 3 100
61 9 30 100
57 8 35 100
Spring, 2008 --Spring, 2007
UnitedStates
Spring, 2008 --Spring, 2007
Britain
Spring, 2008 --Spring, 2007
France
Spring, 2008 --Spring, 2007
Germany
Spring, 2008 --Spring, 2007
Spain
Spring, 2008 --Spring, 2007
Poland
Spring, 2008 --Spring, 2007Spring, 2006
Russia
Spring, 2008 --Spring, 2007
Turkey
Spring, 2008 --Spring, 2007
Egypt
Spring, 2008 --Spring, 2007
Jordan
Spring, 2008 --Spring, 2007
Lebanon
Spring, 2008 --AustraliaSpring, 2008 --Spring, 2007Spring, 2006
India
Spring, 2008 --Spring, 2007
Indonesia
Spring, 2008 --Spring, 2007Spring, 2006
Japan
Spring, 2008 --Spring, 2007
Pakistan
Good thing Bad thing DK/Refused
Q48 And overall do you think that China’sgrowing military power is a good thing or a
bad thing for our country?16
Total
134

9 87 5 100
8 89 3 100
10 48 42 100
10 39 51 100
24 54 22 100
29 50 21 100
21 57 22 100
22 56 22 100
60 19 21 100
58 16 26 100
24 36 41 100
51 39 10 100
41 41 17 100
Spring, 2008 --Spring, 2007
South Korea
Spring, 2008 --Spring, 2007
Argentina
Spring, 2008 --Spring, 2007
Brazil
Spring, 2008 --Spring, 2007
Mexico
Spring, 2008 --Spring, 2007
Nigeria
Spring, 2008 --South AfricaSpring, 2008 --Spring, 2007
Tanzania
Good thing Bad thing DK/Refused
Q48 And overall do you think that China’sgrowing military power is a good thing or a
bad thing for our country?16
Total
Not asked in China.16.
19 73 2 6 100
35 50 7 8 100
17 82 1 0 100
12 85 2 1 100
8 79 9 4 100
12 73 9 5 100
9 53 29 8 100
6 76 5 12 100
26 53 14 7 100
28 55 14 3 100
26 54 17 3 100
28 58 9 5 100
65 18 9 8 100
20 64 7 8 100
31 55 9 6 100
4 93 2 1 100
32 21 19 28 100
2 89 9 0 100
25 55 12 9 100
24 60 9 7 100
16 71 8 5 100
54 29 11 6 100
25 47 20 8 100
44 40 10 6 100
Spring, 2008 --United StatesSpring, 2008 --BritainSpring, 2008 --FranceSpring, 2008 --GermanySpring, 2008 --SpainSpring, 2008 --PolandSpring, 2008 --RussiaSpring, 2008 --TurkeySpring, 2008 --EgyptSpring, 2008 --JordanSpring, 2008 --LebanonSpring, 2008 --AustraliaSpring, 2008 --ChinaSpring, 2008 --IndiaSpring, 2008 --IndonesiaSpring, 2008 --JapanSpring, 2008 --PakistanSpring, 2008 --South KoreaSpring, 2008 --ArgentinaSpring, 2008 --BrazilSpring, 2008 --MexicoSpring, 2008 --NigeriaSpring, 2008 --South AfricaSpring, 2008 --Tanzania
Chineseproducts as
safe
Chineseproductsless safe
Depends(VOL) DK/Refused
Q49 Do you think products made in China are as safe asproducts made in other countries, or do you think they are
less safe than products made in other countries?
Total
135

52 29 9 8 1 100
19 35 20 25 1 100
20 33 33 15 0 100
35 37 14 14 0 100
8 46 30 15 1 100
8 36 29 24 3 100
29 24 21 18 8 100
9 28 8 42 13 100
20 27 33 15 5 100
19 28 28 18 7 100
14 22 36 22 5 100
24 42 18 16 1 100
15 37 17 9 22 100
36 30 21 4 10 100
65 31 3 1 0 100
10 7 6 37 41 100
61 27 7 5 0 100
3 11 16 63 6 100
8 19 12 52 9 100
7 19 23 45 6 100
31 28 20 17 4 100
19 22 17 35 8 100
8 10 14 64 4 100
Spring, 2008 --United StatesSpring, 2008 --BritainSpring, 2008 --FranceSpring, 2008 --GermanySpring, 2008 --SpainSpring, 2008 --PolandSpring, 2008 --RussiaSpring, 2008 --TurkeySpring, 2008 --EgyptSpring, 2008 --JordanSpring, 2008 --LebanonSpring, 2008 --AustraliaSpring, 2008 --IndiaSpring, 2008 --IndonesiaSpring, 2008 --JapanSpring, 2008 --PakistanSpring, 2008 --South KoreaSpring, 2008 --ArgentinaSpring, 2008 --BrazilSpring, 2008 --MexicoSpring, 2008 --NigeriaSpring, 2008 --South AfricaSpring, 2008 --Tanzania
A lot A little Not much Nothing at all DK/Refused
Q50 How much, if anything, have you read or heard about the recalls of foodand goods manufactured in China over the past year – a lot, a little, not much,
or nothing at all?17
Total
Not asked in China.17.
QUESTION Q51 HELD FOR FUTURE RELEASE
8 76 2 14 100
3 81 4 12 100
42 41 10 6 100
40 44 14 2 100
1 96 1 2 100
Spring, 2008 --Spring, 2006
China
Spring, 2008 --Spring, 2006
Japan
Spring, 2008 --South Korea
Yes – hasapologizedsufficiently
No – has notapologizedsufficiently
No apologynecessary DK/Refused
Q52 Thinking about Japan, overall, do you think that Japan hasapologized sufficiently for its military actions during the 1930s and1940s, that Japan has not apologized sufficiently, or do you think
no apology is necessary?18
Total
In 2006 and 2008, the wording was modified for Japan only to read as follows: Now thinking aboutour country, overall, do you think Japan has apologized sufficiently for its military actions in thePacific War and World War II during the 1940s, that Japan has...
18.
136

31 58 12 100
27 67 6 100
Spring, 2008 --Spring, 2006
JapanFavor Oppose DK/Refused
Q53 Do you favor or oppose changingArticle Nine of the Japanese constitution so
that Japan could officially have a militaryand could declare war?
Total
21 67 11 100
25 59 16 100
23 61 16 100
26 61 12 100
24 57 19 100
44 42 14 100
29 61 10 100
32 55 13 100
45 42 12 100
28 69 4 100
29 69 2 100
24 58 19 100
29 59 12 100
30 59 11 100
60 19 21 100
58 13 29 100
52 15 33 100
36 50 14 100
28 66 7 100
17 77 5 100
Spring, 2008 --Spring, 2007Spring, 2006
Turkey
Spring, 2008 --Spring, 2007Spring, 2006
Egypt
Spring, 2008 --Spring, 2007Spring, 2006
Jordan
Spring, 2008 --Spring, 2007
Lebanon
Spring, 2008 --Spring, 2007Spring, 2006
Indonesia
Spring, 2008 --Spring, 2007Spring, 2006
Pakistan
Spring, 2008 --Spring, 2006
Nigeria
Spring, 2008 --Tanzania
Favor Oppose DK/Refused
Q54 Now thinking about Iran, would youfavor or oppose Iran acquiring nuclear
weapons?Total
137

45 20 6 19 10 100
37 22 9 17 15 100
13 30 29 27 2 100
17 32 25 26 1 100
20 21 15 39 6 100
29 19 8 41 4 100
43 18 8 27 4 100
42 21 11 24 1 100
23 23 17 26 11 100
21 26 17 27 9 100
11 7 10 52 20 100
9 12 8 47 25 100
30 18 9 31 12 100
57 18 7 13 4 100
Spring, 2008 --Spring, 2007
Turkey
Spring, 2008 --Spring, 2007
Egypt
Spring, 2008 --Spring, 2007
Jordan
Spring, 2008 --Spring, 2007
Lebanon
Spring, 2008 --Spring, 2007
Indonesia
Spring, 2008 --Spring, 2007
Pakistan
Spring, 2008 --NigeriaSpring, 2008 --Tanzania
Very seriousthreat
Somewhatserious threat Minor threat No threat at all DK/Refused
Q55 If Iran were to acquire nuclear weapons, would this represent a very serious threat toour country, a somewhat serious threat, a minor threat, or no threat at all?
Total
QUESTIONS Q55aa - Q55d HELD FOR FUTURE RELEASE
26 41 23 6 4 100
27 39 21 7 6 100
19 39 29 13 0 100
17 36 29 18 0 100
24 38 30 7 2 100
25 33 30 11 1 100
9 37 29 18 7 100
10 28 31 23 9 100
21 45 24 5 7 100
22 53 17 3 5 100
Spring, 2008 --Spring, 2007
Britain
Spring, 2008 --Spring, 2007
France
Spring, 2008 --Spring, 2007
Germany
Spring, 2008 --Spring, 2007
Spain
Spring, 2008 --Spring, 2007
Poland
Veryconcerned
Fairlyconcerned
Not tooconcerned
Not at allconcerned DK/Refused
Q56 On a different subject, how concerned are you, if at all, that (survey country)has become too dependent on Russia for its energy resources? Are you very
concerned, fairly concerned, not too concerned, or not at all concerned?
Total
138

13 20 62 5 100
17 7 73 3 100
21 6 72 0 100
21 14 64 0 100
24 7 63 6 100
18 19 56 6 100
49 12 35 5 100
16 25 33 26 100
36 24 34 7 100
40 18 38 5 100
33 18 44 4 100
32 3 62 2 100
37 17 36 9 100
41 4 48 6 100
20 23 55 1 100
78 3 5 14 100
26 28 43 2 100
40 9 39 12 100
34 13 49 5 100
45 22 28 5 100
78 4 9 9 100
53 12 21 14 100
74 6 16 4 100
Spring, 2008 --United StatesSpring, 2008 --BritainSpring, 2008 --FranceSpring, 2008 --GermanySpring, 2008 --SpainSpring, 2008 --PolandSpring, 2008 --RussiaSpring, 2008 --TurkeySpring, 2008 --EgyptSpring, 2008 --JordanSpring, 2008 --LebanonSpring, 2008 --AustraliaSpring, 2008 --IndiaSpring, 2008 --IndonesiaSpring, 2008 --JapanSpring, 2008 --PakistanSpring, 2008 --South KoreaSpring, 2008 --ArgentinaSpring, 2008 --BrazilSpring, 2008 --MexicoSpring, 2008 --NigeriaSpring, 2008 --South AfricaSpring, 2008 --Tanzania
More of apartner
More of anenemy Neither DK/Refused
Q57 Overall, do you think of China as more of a partner ofsurvey country), more of an enemy of (survey country), or
neither?
Total
139

66 6 25 2 100
59 5 36 0 100
55 6 38 1 100
31 20 45 5 100
48 7 39 6 100
29 34 32 5 100
8 70 10 12 100
17 39 38 6 100
22 37 34 7 100
23 35 39 3 100
74 2 23 1 100
13 34 41 12 100
40 13 38 9 100
23 19 51 7 100
66 4 30 1 100
11 60 13 16 100
51 15 34 1 100
25 45 21 9 100
34 21 40 5 100
48 31 17 3 100
67 17 10 6 100
60 8 17 15 100
65 11 20 4 100
Spring, 2008 --BritainSpring, 2008 --FranceSpring, 2008 --GermanySpring, 2008 --SpainSpring, 2008 --PolandSpring, 2008 --RussiaSpring, 2008 --TurkeySpring, 2008 --EgyptSpring, 2008 --JordanSpring, 2008 --LebanonSpring, 2008 --AustraliaSpring, 2008 --ChinaSpring, 2008 --IndiaSpring, 2008 --IndonesiaSpring, 2008 --JapanSpring, 2008 --PakistanSpring, 2008 --South KoreaSpring, 2008 --ArgentinaSpring, 2008 --BrazilSpring, 2008 --MexicoSpring, 2008 --NigeriaSpring, 2008 --South AfricaSpring, 2008 --Tanzania
More of apartner
More of anenemy Neither DK/Refused
Q58 Overall, do you think of the U.S. as more of a partner ofsurvey country), more of an enemy of survey country), or
neither?
Total
33 57 10 100
27 63 11 100
29 61 10 100
28 66 6 100
21 70 9 100
Spring, 2008 --Spring, 2007Spring, 2006May, 2005Summer, 2002
Russia
Democraticform of
government Strong leader DK/Refused
Q58a Some feel that we should rely on ademocratic form of government to solve our
country's problems. Others feel that we shouldrely on a leader with a strong hand to solve our
country's problems. Which comes closer to youropinion?
Total
QUESTIONS Q58b - Q58c HELD FOR FUTURE RELEASE
140

8 80 12 100
12 70 18 100
5 95 0 100
6 89 5 100
4 82 14 100
4 81 15 100
22 50 28 100
8 67 25 100
28 61 11 100
30 63 7 100
29 66 5 100
9 75 16 100
38 29 33 100
59 24 17 100
49 25 27 100
10 75 15 100
56 9 35 100
10 68 22 100
7 71 22 100
5 85 11 100
8 71 20 100
39 35 26 100
9 51 39 100
31 45 23 100
Spring, 2008 --United StatesSpring, 2008 --BritainSpring, 2008 --FranceSpring, 2008 --GermanySpring, 2008 --SpainSpring, 2008 --PolandSpring, 2008 --RussiaSpring, 2008 --TurkeySpring, 2008 --EgyptSpring, 2008 --JordanSpring, 2008 --LebanonSpring, 2008 --AustraliaSpring, 2008 --ChinaSpring, 2008 --IndiaSpring, 2008 --IndonesiaSpring, 2008 --JapanSpring, 2008 --PakistanSpring, 2008 --South KoreaSpring, 2008 --ArgentinaSpring, 2008 --BrazilSpring, 2008 --MexicoSpring, 2008 --NigeriaSpring, 2008 --South AfricaSpring, 2008 --Tanzania
Yes –respectspersonalfreedoms
No – does notrespect
personalfreedoms DK/Refused
Q59a Do you think the government of (INSERT)respects the personal freedoms of its people,
or don’t you think so? a. Iran
Total
141

14 74 12 100
12 77 11 100
7 93 0 100
13 84 3 100
11 77 12 100
7 84 9 100
39 39 22 100
30 31 39 100
34 53 13 100
43 46 11 100
48 37 15 100
13 78 8 100
49 30 21 100
57 26 17 100
6 88 6 100
66 3 31 100
23 69 8 100
22 50 28 100
22 66 13 100
33 44 22 100
72 13 15 100
37 30 33 100
65 18 16 100
Spring, 2008 --United StatesSpring, 2008 --BritainSpring, 2008 --FranceSpring, 2008 --GermanySpring, 2008 --SpainSpring, 2008 --PolandSpring, 2008 --RussiaSpring, 2008 --TurkeySpring, 2008 --EgyptSpring, 2008 --JordanSpring, 2008 --LebanonSpring, 2008 --AustraliaSpring, 2008 --IndiaSpring, 2008 --IndonesiaSpring, 2008 --JapanSpring, 2008 --PakistanSpring, 2008 --South KoreaSpring, 2008 --ArgentinaSpring, 2008 --BrazilSpring, 2008 --MexicoSpring, 2008 --NigeriaSpring, 2008 --South AfricaSpring, 2008 --Tanzania
Yes –respectspersonalfreedoms
No – does notrespect
personalfreedoms DK/Refused
Q59b Do you think the government of(INSERT) respects the personal freedoms ofits people, or don’t you think so? b. China19
Total
Not asked in China.19.
142

75 22 4 100
69 24 7 100
65 35 0 100
70 26 4 100
49 40 11 100
79 13 7 100
66 19 15 100
47 28 24 100
44 43 12 100
48 43 10 100
55 36 9 100
72 23 5 100
50 27 23 100
68 12 20 100
58 26 15 100
80 17 3 100
45 21 34 100
94 5 1 100
38 46 16 100
51 41 8 100
50 37 13 100
72 19 8 100
64 14 22 100
67 18 14 100
Spring, 2008 --United StatesSpring, 2008 --BritainSpring, 2008 --FranceSpring, 2008 --GermanySpring, 2008 --SpainSpring, 2008 --PolandSpring, 2008 --RussiaSpring, 2008 --TurkeySpring, 2008 --EgyptSpring, 2008 --JordanSpring, 2008 --LebanonSpring, 2008 --AustraliaSpring, 2008 --ChinaSpring, 2008 --IndiaSpring, 2008 --IndonesiaSpring, 2008 --JapanSpring, 2008 --PakistanSpring, 2008 --South KoreaSpring, 2008 --ArgentinaSpring, 2008 --BrazilSpring, 2008 --MexicoSpring, 2008 --NigeriaSpring, 2008 --South AfricaSpring, 2008 --Tanzania
Yes –respectspersonalfreedoms
No – does notrespect
personalfreedoms DK/Refused
Q59c Do you think the government of (INSERT)respects the personal freedoms of its people,
or don’t you think so? c. The United States
Total
143

13 64 23 100
14 59 26 100
20 80 0 100
24 59 17 100
9 69 22 100
18 57 25 100
23 38 39 100
13 57 30 100
60 29 10 100
62 32 6 100
64 29 6 100
18 57 25 100
34 29 37 100
24 37 39 100
61 23 16 100
24 47 30 100
67 8 24 100
24 55 21 100
9 47 44 100
11 73 15 100
10 55 35 100
54 26 20 100
17 32 51 100
35 39 26 100
Spring, 2008 --United StatesSpring, 2008 --BritainSpring, 2008 --FranceSpring, 2008 --GermanySpring, 2008 --SpainSpring, 2008 --PolandSpring, 2008 --RussiaSpring, 2008 --TurkeySpring, 2008 --EgyptSpring, 2008 --JordanSpring, 2008 --LebanonSpring, 2008 --AustraliaSpring, 2008 --ChinaSpring, 2008 --IndiaSpring, 2008 --IndonesiaSpring, 2008 --JapanSpring, 2008 --PakistanSpring, 2008 --South KoreaSpring, 2008 --ArgentinaSpring, 2008 --BrazilSpring, 2008 --MexicoSpring, 2008 --NigeriaSpring, 2008 --South AfricaSpring, 2008 --Tanzania
Yes –respectspersonalfreedoms
No – does notrespect
personalfreedoms DK/Refused
Q59d Do you think the government of (INSERT)respects the personal freedoms of its people,
or don’t you think so? d. Saudi Arabia
Total
144
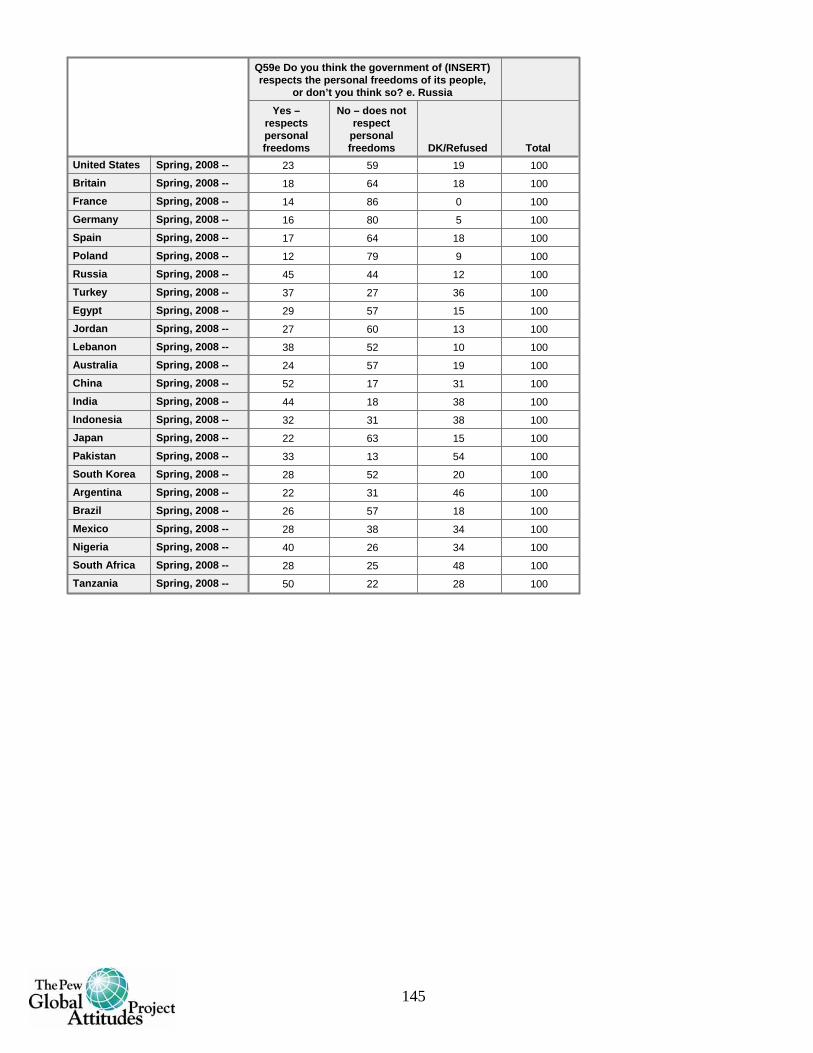
23 59 19 100
18 64 18 100
14 86 0 100
16 80 5 100
17 64 18 100
12 79 9 100
45 44 12 100
37 27 36 100
29 57 15 100
27 60 13 100
38 52 10 100
24 57 19 100
52 17 31 100
44 18 38 100
32 31 38 100
22 63 15 100
33 13 54 100
28 52 20 100
22 31 46 100
26 57 18 100
28 38 34 100
40 26 34 100
28 25 48 100
50 22 28 100
Spring, 2008 --United StatesSpring, 2008 --BritainSpring, 2008 --FranceSpring, 2008 --GermanySpring, 2008 --SpainSpring, 2008 --PolandSpring, 2008 --RussiaSpring, 2008 --TurkeySpring, 2008 --EgyptSpring, 2008 --JordanSpring, 2008 --LebanonSpring, 2008 --AustraliaSpring, 2008 --ChinaSpring, 2008 --IndiaSpring, 2008 --IndonesiaSpring, 2008 --JapanSpring, 2008 --PakistanSpring, 2008 --South KoreaSpring, 2008 --ArgentinaSpring, 2008 --BrazilSpring, 2008 --MexicoSpring, 2008 --NigeriaSpring, 2008 --South AfricaSpring, 2008 --Tanzania
Yes –respectspersonalfreedoms
No – does notrespect
personalfreedoms DK/Refused
Q59e Do you think the government of (INSERT)respects the personal freedoms of its people,
or don’t you think so? e. Russia
Total
145

66 16 18 100
78 11 11 100
77 22 0 100
86 9 5 100
79 11 10 100
82 9 9 100
67 15 18 100
49 19 32 100
50 37 13 100
53 33 15 100
87 11 2 100
74 10 16 100
58 12 29 100
45 15 39 100
46 15 39 100
78 9 13 100
34 11 55 100
90 4 6 100
49 16 35 100
53 32 15 100
45 26 29 100
60 15 25 100
48 11 41 100
68 10 23 100
Spring, 2008 --United StatesSpring, 2008 --BritainSpring, 2008 --FranceSpring, 2008 --GermanySpring, 2008 --SpainSpring, 2008 --PolandSpring, 2008 --RussiaSpring, 2008 --TurkeySpring, 2008 --EgyptSpring, 2008 --JordanSpring, 2008 --LebanonSpring, 2008 --AustraliaSpring, 2008 --ChinaSpring, 2008 --IndiaSpring, 2008 --IndonesiaSpring, 2008 --JapanSpring, 2008 --PakistanSpring, 2008 --South KoreaSpring, 2008 --ArgentinaSpring, 2008 --BrazilSpring, 2008 --MexicoSpring, 2008 --NigeriaSpring, 2008 --South AfricaSpring, 2008 --Tanzania
Yes –respectspersonalfreedoms
No – does notrespect
personalfreedoms DK/Refused
Q59f Do you think the government of (INSERT)respects the personal freedoms of its people,
or don’t you think so? f. France
Total
146