Embed Size (px)
Citation preview

A Higher Education Academy Engineering Subject Centre Mini Project 1
Mini-project report
Embedding sustainable development into structural design teaching using sustainability appraisal tools
C. Arya, A. Amiri and P.R. Vassie Department of Civil, Environmental and Geomatic Engineering, University College London

1
Embedding sustainable development into structural design
teaching using sustainability appraisal tools
C. Arya, A. Amiri and P.R. Vassie
Department of Civil, Environmental and Geomatic Engineering
University College London
April 2010

2
CONTENTS
Summary 3
1. Sustainability Appraisal tools 5
1.1 Introduction 5
1.2 BREEAM 7
1.3 CEEQUAL 9
1.4 Sustainability Accounting 11
1.5 SPeAR 12
1.6 GSAP 14
1.7 SASS 16
1.8 Conclusions 21
2. A comparison of bridge options 22
2.1 Introduction 22
2.2 Bridge Options 22
2.3 Sustainability appraisal 22
2.3.1 Environmental impact assessment 23
2.3.1.1 Climate change 23
2.3.1.2 Energy consumption 26
2.3.1.3 Materials usage 28
2.3.2 Economic impact assessment 29
2.3.2.1 Cost of construction 29
2.3.2.2 Cost of maintenance work 29
2.3.2.3 Traffic delay cost 32
2.3.2 Societal impact assessment 35
2.3.2.1 Aesthetics 35
2.3.2.2 Dust 39
2.3.2.3 Noise 41
2.3.2.4 Vibration 43
2.3.4 Calculating the sustainability score for a bridge 45
2.4 Discussion 47
3. Sustainability appraisal of bridges by the SASS method – Student exercises 49
4. Evaluation 72
5. Reflection 73
6. Conclusions 74
7. References 75
Appendix A 77
A1. CO2 for production and transport of materials
A2. CO2 due to maintenance
A3. Energy for production and transportation
A4. Energy due to maintenance
A5. Maintenance costs
A6. Traffic delay costs
Appendix B: QUADRO Tables 81
Appendix C: Maintenance & Traffic delay costs 83
C1. Bridge 1 – Inspection, drain cleaning, steelwork painting, concrete repairs
C2. Bridge 1 – Inspection, drain cleaning, concrete repairs
C3. Bridge 1 – Inspection, drain cleaning, concrete repairs
Appendix D 94
D1. Aesthetics
D2. Dust
D3. Noise
D4. Vibration
Appendix E: Assessment form 107
Appendix F: Power point presentation – Sustainability Appraisal Tools 108

3
SUMMARY
The Department of Civil, Environmental and Geomatic Engineering (CEGE) at University College London (UCL) was
commissioned by the Higher Education Academy Subject Centre to undertake a mini-project entitled „Embedding
sustainable development into structural design teaching using sustainability appraisal tools‟ in 2008. The primary aims of
the project were to develop teaching material and student exercises that would
1. Develop expertise in sustainability appraisal tools and methods
2. Help students enrolled on courses in civil and structural engineering develop a deeper understanding of
sustainable development and its relevance to structural design
3. Introduce students to a new sustainability performance evaluation tool called SASS.
The Joint Board of Moderators in their accreditation guidelines, Annex C, note that engineers have been expected to be
able to respond to societies‟ concerns about the impact of human activity on the environment for some years but that there
is a growing desire from governments and the public that this environmental concern is now placed in the context of
achieving the correct balance between environmental, societal and economic outcomes within the overarching concept of
sustainable development. Nevertheless, currently structural design teaching at universities is mostly focused on technical
and economic issues. Environmental factors such as global warming and social factors such as noise pollution are largely
ignored. The choices of construction material, structural form and method of construction have a significant effect on the
environment and society. This omission in the teaching syllabus chiefly arises for two main reasons
(i) it is not clear which factors should be considered
(ii) how individual impacts can be evaluated and accounted for in design.
Knowledge of sustainability appraisal tools would appear to offer a solution to both these problems and should also help
develop some expertise in sustainability appraisal which is now increasingly being specified by clients.
There are a number of tools that can be used to evaluate the sustainability performance of various forms of construction
such as BREEAM, CEEQUAL, SPeAR, Sustainability Accounting and SASS. Chapter 1 provides an overview of these
tools and explains how they are used and discusses their merits. SASS has primarily been developed to help Engineers
assess the sustainability performance of bridge structures. Unlike the other methods discussed in this report SASS is
largely quantitative. This approach should appeal to engineering students used to precision and allow the effects of
design decisions on sustainability to be readily evaluated. It also enables the effect of changes in the relative priority
given to the environment, society and economy to be investigated.
In Chapter 2 SASS is used to compare the sustainability performance of three different design options for a new bridge
over a dual two-lane motorway. Bridge 1 is a four span continuous steel beam and slab bridge with integrated bank seat
foundations and three intermediate leaf piers. Bridge 2 is a two-span simply supported prestressed concrete beam and
slab bridge with cantilever abutments and an intermediate leaf pier. Bridge 3 is a three span voided concrete slab bridge
with a full height abutment at one end and a bank seat at the other and two intermediate portal piers. Two phases of
bridge provision are considered, namely construction and in-service, to give the life-time sustainability. Details of the
key appraisal parameters are provided. The way in which individual impacts are evaluated and combined to produce an
overall sustainability score for individual structures is described. The study is concluded with a short discussion on the
findings.
The output from this study has been used to develop a series of worked examples and related exercises for students,
presented in Chapter 3 of the report, which are designed to
test their understanding of the process involved in determining sustainability scores for bridges
test their ability to calculate the scores for the three sustainability themes (environment, economy and
society)
test their ability in normalising these scores and applying weighting factors to find the sustainability
scores
use their results to establish whether construction or lifetime maintenance is the major contributor to
poor sustainability
use their results to rank environment, economy and society components in terms of their contribution to
poor sustainability
use their knowledge of bridge design/durability and maintenance strategies to suggest ways of
improving the sustainability of bridges.
The commentary on these student exercises provided at the end of Chapter 3 suggests some ways in which
environmental, economic and social impacts may be reduced. The commentary also highlights the
interconnectedness of the three sustainability themes so that a change introduced in order to reduce, say, the
environmental impact may have an adverse effect on the economics or social components. In a similar way the

4
use of more durable design materials aimed at reducing lifetime maintenance costs may have an adverse affect
on the environment.
The importance of traffic delay costs is emphasised. On busy road the traffic delay costs resulting from
maintenance work can be very high substantially increasing the economic impact, making it the critical
sustainability component. Thus steps taken to minimise maintenance time can be especially sustainable.
The discounted cash flow technique is used for the calculation of lifetime costs allowing all costs to be compared
at the same date (the year of construction).
The report is concluded with a short discussion on the outcome of a trial of the student exercises and some comments on
perceived benefits, resource implications/prerequisites and future direction.

5
Chapter 1: Sustainability Appraisal Tools
1.1 Introduction
The Joint Board of Moderators requires that sustainable development be integrated into engineering education1, a
core component of which is design. Sustainable development is a complex concept and a universally accepted
definition does not exist at this moment in time. The most often quoted description is that given in the
Brundtland report2: „development which meets the needs of the present without compromising the ability of
future generations to meet their own needs‟. This has been widely interpreted to mean the simultaneous pursuit
of economic prosperity, environmental preservation and social equity, as depicted in the Venn diagram3 shown
in Fig. 1.
Fig. 1: Sustainable development model
Construction is a major sector of the UK national economy and accounts for around 10% gross domestic
product. It employs around 3 million people, is estimated to consume about 6 tonnes of materials per person per
year and generates large amounts of waste and emissions4,5
. Construction activity can also have a significant
effect on the local community6. It should be remembered too that significant environmental, social and
economic impacts occur during the operational life of built facilities, which are directly related to decisions taken
at the design stage. Nonetheless the construction industry is responsible for the provision and maintenance of
much of the nation‟s infrastructure – transport, housing, hospitals, schools, water supply, effluent disposal, etc -
and therefore provides an invaluable service. Moreover, the construction process lends itself to detailed
measurements and thus provides an idea test bed to evaluate policy on sustainable development. It was for these
reasons the industry was selected in 1998 by the UK Government – New Labour – as a suitable platform to
develop a framework for sustainable development5. To achieve sustainable development, a number of legislative
directives and acts have been passed over the past decade on waste, water, air, wildlife, land and climate change,
many of which are aimed at curbing the adverse effects of construction activity whilst at the same time
improving the quality, competitiveness and profitability of the industry. In recent years, because of the growing
awareness of sustainable development, the push for sustainable construction has also come from the public and
led some client organisations, research institutes and professional bodies to produce voluntary codes and
standards on this subject7,8
.
To assist the construction industry act on the plethora of legislation, policy, codes, standards etc on sustainable
development a number of appraisal tools have been proposed. Generally, these tools have been developed,
singly or in combination, by professional bodies, private companies and academia. Some are relevant to urban
planning e.g. regional LADF9 and BEQUEST
10 whereas others are primarily applicable to building projects e.g.
BREEAM11
, LEED12
and Green Star13
. Two are relatable to civil infrastructure: CEEQUAL14
and SASS15
.
Generally speaking these tools all claim to act as both a guide to the inputs of sustainable design and as a
measure of sustainability performance post-construction.
Ideally, a sustainability appraisal tool should allow the separate assessment of all relevant lifetime economic,
environmental and social impacts in a straightforward, transparent, rigorous and repeatable manner. It should also
include a means of combining the impacts to provide an overall assessment of sustainability.
Currently the use of appraisal tools is voluntary but may at some future date become mandatory. The purpose of
this chapter is to provide an overview of the following typical appraisal tools and explains how they are used and
discusses their merits.
Environment
Social Economic
Sustainable Development

6
BREEAM
CEEQUAL
Sustainability Accounting16
SPeAR17
GSAP18
SASS
Knowledge of these tools should help Civil and Structural Engineers extend their understanding of the issues
relevant to sustainable design/construction as well as develop some expertise in sustainability appraisal which is
now routinely specified by clients.

7
1.2 Building Research Establishment Environmental Assessment Method (BREEAM)
BREEAM is a popular and easy to understand tool developed by the UK Building Research Establishment to
assess the environmental performance of building projects. It has been designed to evaluate the environmental
performance of new builds as well as extensions, major refurbishments and fit-outs of existing buildings.
BREEAM Sections Weighting (%)
New builds, extensions and major
refurbishments
Building fit-out only
Management
Health and Wellbeing
Energy
Transport
Water
Materials
Waste
Land Use and Ecology
Pollution
12
15
19
8
6
12.5
7.5
10
10
13
17
21
9
7
14
8
N/A
11
Table 1.1: BREEAM Sections and weighting
Table 1.1 lists the nine major indicators (sections) used in BREEAM. The table also shows the recommended
weightings applicable to each section. It can be seen that the weightings not only depend on the section but also
on the nature of the work being assessed. The weightings in the Table have been derived by consulting a wide
cross-section of stakeholders from the construction industry including designers, developers, end users,
financiers, insurers, regulators, experts, etc.
Performance in each section is evaluated by addressing a number of questions. For example the questions
addressed within the section on Water cover the following issues:
Wat 1: Water consumption
Wat 2: Water meter
Wat 3: Major leak detection
Wat 4: Sanitary supply shut off
Wat 5: Water recycling
Wat 6: Irrigation systems
Clearly the overall aim of this section is to appraise water consumption. Thus the use of fittings/equipment and
features which reduce consumption of potable water such as low flush toilets or grey water for flushing, tap
inserts, water meters, equipment which can monitor and shut off supplies of water when leaks are detected, the
provision of low-water irrigation systems/strategies, etc, will achieve a high score and vice versa.
Scores (or credits) are awarded based on the responses obtained, in accordance with defined criteria, backed by
various types of evidence considered acceptable such as copies of management plans, written statements, audits,
correspondence, photographs, etc.
The credits are used to calculate a BREEAM rating for the project. In order to achieve a rating, however, it is
necessary to achieve a certain minimum number of credits in some key issues within each section. Generally,
the scores shown in Table 1.2 are used to classify performance. But this is subject to the condition that the
minimum standards applicable to that rating have also been met. Table 1.3 shows the minimum BREEAM
standards for educational buildings. If say the final BREEAM score is 75% the building could be awarded an
EXCELLENT rating. However if the credits achieved for Ene 1 (i.e. Reduction of CO2 emissions) is 4 the
BREEAM rating would be downgraded to VERY GOOD as the minimum standard necessary for an
EXCELLENT rating is 6 credits (see Table 1.3). If the building is to achieve an OUTSTANDING rating there
are additional conditions which must be met, details of which can be found in the BREEAM manual.

8
BREEAM rating % score
UNCLASSIFIED
PASS
GOOD
VERY GOOD
EXCELLENT
OUTSTANDING
< 30
≥ 30
≥ 45
≥ 55
≥ 70
≥ 85
Table 1.2: BREEAM rating benchmarks
Various versions of BREEAM have been developed. Currently there are BREEAM assessments for the
following building types:
Courts
Schools
Industrial units
Hospitals
Offices
Retail outlets
Prisons
In recent years the scope of BREEAM has been extended to include some socio-economic factors in order to
provide a more holistic measure of building performance. Nevertheless, BREEAM is heavily biased towards
measuring environmental performance and use of this tool alone may not necessarily achieve sustainability in
building construction.
BREEAM issues BREEAM Rating / Minimum
number of credits
PA
SS
GO
OD
VE
RY
GO
OD
EX
CE
LL
EN
T
OU
TS
TA
ND
ING
Man 1: Commissioning
Man 2: Considerate Constructors
Man 4: Building user guide
Man 9: Publication of Building information
Man 10: Development as a learning resource
Hea 4: High frequency lighting
Hea 12: Microbial contamination
Ene 1: Reduction of CO2 emissions
Ene 2: Sub-metering of substantial energy uses
Ene 5: Low zero carbon technologies
Wat 1: Water consumption
Wat 2: Water meter
Wst 3: Recyclable waste storage
LE 4: Mitigating ecological impact
1
1
1
1
1
1
1
1
1
1
1
1
1
1
1
1
1
1
1
1
6
1
1
1
1
1
1
2
2
1
1
1
1
1
10
1
1
2
1
1
1
Table 1.3: Minimum BREEAM standards for Educational buildings11

9
1.3 Civil Engineering Environmental Quality Assessment and Award Scheme (CEEQUAL)
CEEQUAL14
is a tool developed by a team led by the UK Institution of Civil Engineers to assess the
environmental performance of civil engineering projects based on the factors listed in Table 1.4.
CEEQUAL Sections Maximum number of
questions
Maximum available
score
Project environmental management
Land use
Landscape issues
Ecology and biodiversity
Archaeological and cultural heritage
Water issues
Energy
Material use
Waste management
Transport
Nuisance to neighbours
Community relations
23
15
13
14
10
14
13
21
16
13
17
11
120
82
69
85
62
89
85
95
87
76
73
77
Total 180 1000
Table 1.4: CEEQUAL Sections, maximum question numbers and available scores
It is the civil engineering equivalent to BREEAM in that like BREEAM it aims to improve the environmental
performance of construction projects. However, there are a number of differences in detail which are worth
noting.
Firstly, there are more sections in CEEQUAL than BREEAM and sections which are seemingly the same are
differently defined. For example, in CEEQUAL the aim of the section headed Water issues is to reduce the use
of potable water as well as reduce the risk of pollution of groundwater and existing water features during
construction. In BREEAM, the latter is covered within the section on Pollution. In BREEAM there is no
equivalent to CEEQUAL‟s section on Archaeology and cultural heritage. Similarly there is no equivalent in
CEEQUAL to BREEAM‟s section on Health and wellbeing because of differences in the nature of the projects
covered by the two schemes. Thus Health and wellbeing addresses issues related to the comfort of occupants of
building structures e.g. indoor air quality, thermal comfort, view-out, all of which generally have none or very
little relevance to users of civil engineering structures. Nevertheless, where a predominantly civil engineering
project includes individual building structures it may be appropriate to carry out both BREEAM and CEEQUAL
assessments.
Like BREEAM, CEEQUAL assesses environmental performance by means of a number of questions. Table 1.4
shows the number of questions applicable to each section. From the associated scores it will be appreciated that
the questions are differently weighted within and between sections, which reflects the relative importance of the
issue to the overall performance of the project. However unlike BREEAM there is only one version of
CEEQUAL. This means that not all the questions will be relevant in all cases and therefore the first stage of the
assessment involves identifying relevant questions from each section, a process referred to as scoping, which are
subsequently used to evaluate performance. Not all questions can be treated in this way as they are regarded as
core and are therefore compulsory for all projects. Table 1.5 lists the questions which must be included in all
CEEQUAL assessments within the section on Energy, for example
Like BREEAM, scores are awarded based on the responses obtained, in accordance with defined criteria, backed
by various types of evidence considered appropriate during the scoping stage.
The scores are used to determine the CEEQUAL award for the project. The scores represent the percentage by
which the project exceeds the statutory/regulatory minimum required for this type of project. If the project
exceeds this minimum by 25% it is awarded a PASS. Higher scores attract higher awards in accordance with
the criteria given in Table 1.6.

10
Question
number
Question Scores
Client Design Contraction
93 Is there evidence of appropriate measures having been
incorporated to reduce energy consumption in use?
16 0
94 Is there evidence that the design has explored
opportunities for the incorporation of energy from
renewable sources?
4 0
95 Has energy from renewable sources been incorporated
in the scheme where appropriate?
9 0
97 Is there evidence that the design has incorporated
appropriate measures to reduce energy consumption
during consumption where feasible?
4 0
98 Has an energy management plan or energy
management section of SEMP or integrated project
plan been drawn up and implemented?
0 0 5
Table 1.5: Compulsory questions within the Energy section
CEEQUAL award score
PASS
GOOD
VERY GOOD
EXCELLENT
> 25%
> 40%
> 60%
> 75%
Table 1.6: CEEQUAL award benchmarks
Five award types are possible with this scheme:
Whole project awards
Design only awards
Construction only awards
Design and Build awards
Client and Design awards
Whole project awards are applied for on behalf of the whole team i.e. clients, designers and contractors. The
remainder are applied for by team members either to seek rewards for their individual effort or because one or
more of the parties do not wish to participate in the application.
The CEEQUAL tool when conceived had a limited range of social and economic themes but newer releases of
the tool are trying to address this drawback. Another drawback of this tool is that much of the input data is
qualitative which can lead to inconsistencies in scoring.

11
1.4 Sustainability Accounting16
The method takes as its starting point the traditional financial information that is normally compiled for a project
such as the cost of construction, cost of operation, revenues, taxes paid and grants received. This information is used
to prepare a sustainability statement which details the direct financial impacts (costs and savings) of sustainability
initiatives as well as the indirect environmental and social impacts (Table 1.7). Generally, the direct financial savings
will accrue to clients but may be passed on to the construction company depending upon the contractual
arrangements, whereas the indirect saving accrues to third parties such as the users and society.
The direct accounts provide details of the extra expenditure arising out of various environmental and social initiatives
undertaken as part of the proposed works, which are recorded as costs. The benefits that accrue as a result of
undertaking each of these initiatives over the design life of the project are recorded as savings. Both values will
normally be expressed in monetary terms. For example, the use of ground granulated blast furnace slag (GGBS) in
concrete bridges increases the cost of construction because of the need for improved curing (item X in Table 1.7).
However it should also reduce the incidence of chloride-induced reinforcement corrosion, necessitating fewer and
possibly less extensive repairs thereby resulting in a saving in maintenance expenditure (item Y).
Environmental & Social Features
Direct Indirect
Costs (£) Savings
(£) Environmental Social
Stakeholders
Affected
Environmental costs/benefits
Additional expenditure for
extra curing during construction
Saving in maintenance expenditure
X
Y
Reduction in
CO2, SO2
emissions,
waste, etc
Net Direct Savings (environment)
Social cost/benefits
Traffic Delay Costs
Z
Net Direct Savings (social)
Total Direct Savings
Table 1.7. Sustainability Accounting statement
The indirect accounts provide details of the environmental and social benefits that will accrue to third parties as a
result of proposed sustainability initiatives. These benefits should preferably be expressed in financial terms but
where this is not possible a statement containing numerical estimates of the benefits should be provided. Thus
continuing the above example, the indirect environmental benefit of using GGBS would include a reduction in the
use of virgin materials and harmful emissions associated with manufacture of an equivalent amount of ordinary
Portland cement. The indirect social benefits would include an overall reduction in delays to road user because of the
need for fewer and less prolonged lane closures during repair work. This reduction in delays could be expressed in
monetary terms as traffic delay costs and would be regarded as a social benefit as it accrues to users (item Z).
Sustainability accounting would appear to provide a very systematic method of comparing the impact of construction
on clients, users and society. However, it would generally be quite difficult to optimise design options using this
method as it makes no attempt to combine impacts in order to make an overall assessment of sustainability.
12
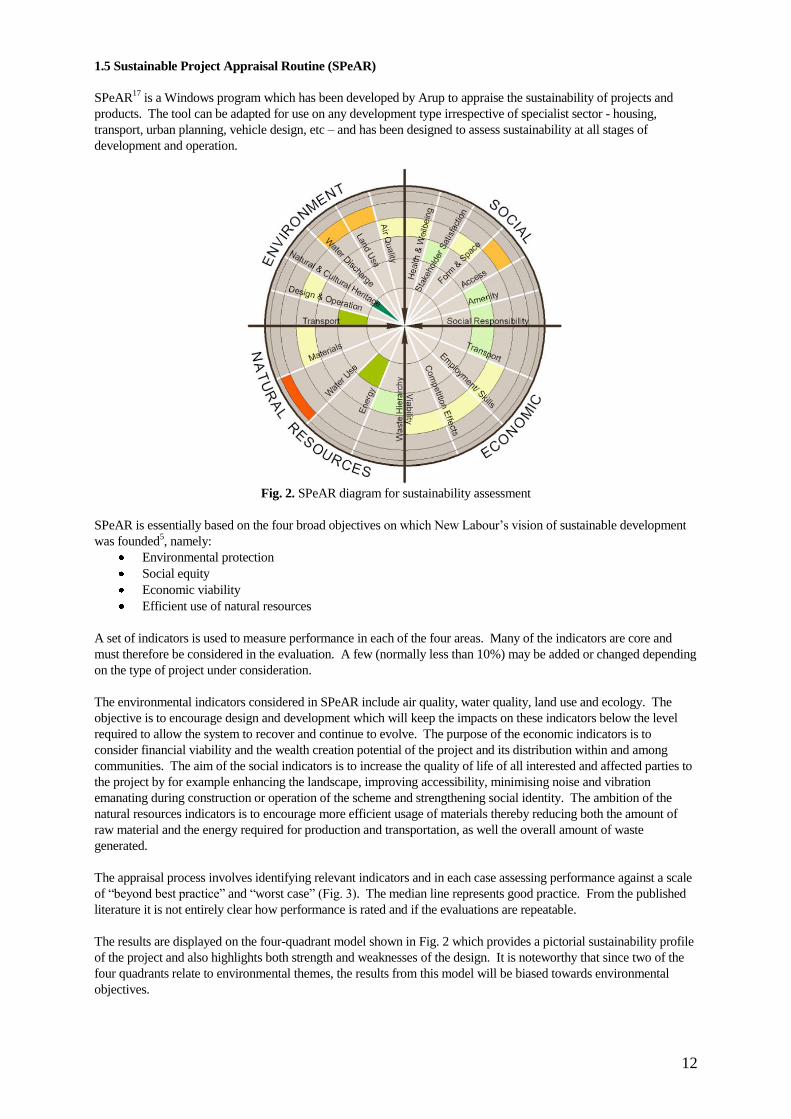
1.5 Sustainable Project Appraisal Routine (SPeAR)
SPeAR17
is a Windows program which has been developed by Arup to appraise the sustainability of projects and
products. The tool can be adapted for use on any development type irrespective of specialist sector - housing,
transport, urban planning, vehicle design, etc – and has been designed to assess sustainability at all stages of
development and operation.
Fig. 2. SPeAR diagram for sustainability assessment
SPeAR is essentially based on the four broad objectives on which New Labour‟s vision of sustainable development
was founded5, namely:
Environmental protection
Social equity
Economic viability
Efficient use of natural resources
A set of indicators is used to measure performance in each of the four areas. Many of the indicators are core and
must therefore be considered in the evaluation. A few (normally less than 10%) may be added or changed depending
on the type of project under consideration.
The environmental indicators considered in SPeAR include air quality, water quality, land use and ecology. The
objective is to encourage design and development which will keep the impacts on these indicators below the level
required to allow the system to recover and continue to evolve. The purpose of the economic indicators is to
consider financial viability and the wealth creation potential of the project and its distribution within and among
communities. The aim of the social indicators is to increase the quality of life of all interested and affected parties to
the project by for example enhancing the landscape, improving accessibility, minimising noise and vibration
emanating during construction or operation of the scheme and strengthening social identity. The ambition of the
natural resources indicators is to encourage more efficient usage of materials thereby reducing both the amount of
raw material and the energy required for production and transportation, as well the overall amount of waste
generated.
The appraisal process involves identifying relevant indicators and in each case assessing performance against a scale
of “beyond best practice” and “worst case” (Fig. 3). The median line represents good practice. From the published
literature it is not entirely clear how performance is rated and if the evaluations are repeatable.
The results are displayed on the four-quadrant model shown in Fig. 2 which provides a pictorial sustainability profile
of the project and also highlights both strength and weaknesses of the design. It is noteworthy that since two of the
four quadrants relate to environmental themes, the results from this model will be biased towards environmental
objectives.

13
Fig. 3
In the full model shown in Fig. 2, some of the indicators appear in two places e.g. water, transportation and land use
and care is need in using the model as there is a risk of double accounting. Some of the other limitations of this
appraisal tool noted by the authors of the tool include
Open to misuse/bias
Involves a thinking process of a team not an individual
Needs a diverse skills base team, many experts can be subjective, one person should co-ordinate and
capture the balance and increase objectivity
Oversimplification
Key indicators could be lost
Comparisons can only be made within a project not between different projects due to specificity of
indicators
Not an answer to sustainability, rather a tool to guide step change towards sustainability
-3 +3
Median good practice
Beyond best practice Worst case

14
1.6 Gifford Sustainability Appraisal Process (GSAP)
GSAP18
is described as a process rather than an appraisal tool. This is because although within it there is an
appraisal tool and a sustainability framework, it also incorporates a technique called Appreciative Inquiry (AI),
whose aims are
to identify the project-specific sustainability opportunities using the collective experience of the project
team and client;
to stretch the breadth of the sustainability opportunities available;
to spread the shared understanding of sustainability aspirations to all members of the project team prior
to formulation of design solutions.
The authors believe this feature makes to it superior to other appraisal methods which largely involve measuring
the performance of a “prepared solution”, with the expectation that some incremental improvement might then
be engineered.
Fig. 4 shows the GSAP methodology. The first stage involves carrying out a literature review to gather
background information on the project as well as relevant local, regional and national sustainability aspirations,
opportunities and policies. The second stage involves presenting the findings at a sustainability workshop
facilitated by sustainability specialists and the use of Appreciative Inquiry to search out and agree possible
unconstrained sustainability aspirations and measures, on the following themes (categories):
Climate change & Energy
Pollution
Biodiversity, Heritage and Landscaping
Waste & Resources
Community
Economics
Fig. 4: GSAP process

15
They are similar to the indicators mentioned in Opportunities for change: Consultation paper on a UK strategy
for sustainable construction, published by the Department of Environment, Transport and the Regions in 1998.
Each category consists of a number of issues. Climate change and energy, for example, considers the following
matters
flooding
heat island
sustainable energy
climate change adaptation
Their impacts are evaluated by addressing one or more questions. For example, the questions considered within
sustainable energy may include
What steps will the developer take to produce an energy strategy for the proposed development to
optimise the energy consumption of the site?
What % of total site energy demand will be produced from a renewable source (e.g. wind, solar, hydro,
photovoltaic bank, etc)?
To what extent will the development take into account the hierarchy for feasible heating system?
Some possible responses and associated scores are provided and used together with weighting factors to
determine the project‟s current (initial) sustainability performance. The process is repeated as the design
progresses and any changes to sustainability performance recorded. This not only allows sustainability
performance to be monitored but also the decisions which resulted in the changed status recorded.
After each assessment has been carried out, the sustainability performance of each category as well as an overall
sustainability performance score is determined and a comparison of current status and unconstrained
opportunities illustrated by means of the spider graph shown in Fig. 5 produced, where the outer layers represent
the highest attainable sustainability performance.
Fig. 5

16
1.7 System for Appraising the Sustainability of Structures (SASS)
SASS15
is a quantitative method developed at UCL to appraise the sustainability of bridges. However, the
methodology is sufficiently general that its use could be extended to other civil engineering structures. Unlike
the other methods discussed in this chapter, SASS does not give an absolute measure of sustainability but is used
to compare different design and maintenance strategies. Fig. 6 shows the indicators used to appraise
sustainability. Note that resource use includes energy, materials, land and water. In all cases, performance is
evaluated in numerical terms. The following briefly describes the scope of each factor and how individual
impacts are scored and ultimately combined in order to obtain an overall sustainability score for the scheme.
Fig. 6: SASS sustainability indicators
1.7.1 Climate change
SASS assumes climate change is directly related to carbon dioxide emissions. The model enables the CO2
equivalent emissions associated with the following items/activities to be estimated:
manufacture of materials for construction and maintenance work
transport of materials from factory gate to building site
plant required for construction
transport of construction and demolition waste
transport for employees from home to building site
traffic congestion during maintenance work.
The impact is measured in tonnes of CO2 emissions.
1.7.2 Energy
The aim is to promote energy efficiency. SASS enables the energy required for the following operations to be
taken into account:
manufacture of materials for construction and maintenance work
transport of materials from factory gate to building site
operation of plant/equipment
transport of construction and demolition waste.
transport for employees from home to building site
traffic congestion during maintenance work.
The impact is measured in gigajoules of energy required.
1.7.3 Materials
This indicator takes account of both the amount and source of materials required for construction and
maintenance work. Thus the use of virgin materials, especially those derived from non-renewable sources, is
discouraged whereas the opposite is true of construction material reused on site.
The impact is assessed by multiplying the weight of material required by the corresponding resource impact
factor (Table 1.8) and summing the scores.

17
Origin Weight (t) Resource
impact factor
Score
% reused on site
% reused transported off site
% recycled onsite
% recycled transported offsite
% virgin responsibly sourced
% virgin
× 1
× 2
× 2
× 3
× 4
× 5
Total score
Table 1.8 Material use impact
1.7.4 Land
The aim is to minimise the area of land required for the project as well as any adverse effect of construction
and/or maintenance work at or below ground level or to adjacent property. SASS recommends that the impact of
land is determined taking account of
total land take
quality of land at end of project
% brown-field
% agricultural land
adverse effect on surrounding properties due to proposed works e.g. increased risk of flooding and
potential loss of mineral resources.
1.7.5 Water
The aim is to minimise water usage on the project and the risk of contamination of surface and ground water.
On this basis, SASS recommends that the impact is based on the following factors:
total volume of potable water required
risk of contamination of water courses and mitigation measures
risk of contamination of ground water and mitigation measures
past performance.
1.7.6 Waste
The aim here is to minimise the amount of hazardous waste and the volume of material going to land fill. A
further aim is to promote the greater use of waste materials during construction and maintenance operations and
design for deconstruction. SASS recommends performance in this area should be evaluated by considering
total volume of waste
volume of waste going to land fill
volume of waste reused/recycled
volume of hazardous waste produced
past performance ?????????.
The impact is assessed by multiplying the amount of waste in each category by the corresponding waste impact
factor (Table 1.9) and summing the results.
Disposal Weight
(t)
Waste impact
factor
Score
% reused on site
% transported off site & reused
% recycled onsite
% recycled transported offsite & reused
% landfill no hazard
% land fill hazardous
× 1
× 2
× 2
× 3
× 4
× 5
Total score
Table 1.9 Waste impact

18
1.7.7 Heritage, Ecology and Biodiversity
The aim is to minimise use of land of high ecological or heritage/archaeological value. A further aim is to
minimise any adverse effect on wildlife and artefacts of heritage/archaeological value during construction and
maintenance operations. The impact is based on
area of land of high ecological value required
% of wildlife that will be adversely affected during construction and operation phases
area of site on land of high heritage/archaeological value
% of heritage/archaeological features that will be adversely affected during construction and operation
phases
1.7.8 Aesthetics
Aesthetics is assessed using work presented by the Australian Roads and Traffic Authority and the Highways
Agency. Aesthetics is based purely on a series of questions. The method involves making separate assessment of
the bridge as a whole
the bridge and its surroundings
parts and details
public consultation.
The responses are used to score the design.
1.7.9 Noise
Undesirable sound is referred to as noise. Noise can affect human being in several ways including annoyance,
interference with various activities, hearing loss and stress leading to a number of health problems. SASS
assesses noise impact based on
net increase in noise level
duration
effect on neighbours
public consultation and past performance
mitigation measures.
1.7.10 Dust
Dust emissions from construction activity are a common and well recognised problem. Some of the harmful
effects of dust include lung problems, eye irritation and carcinogenicity, nuisance due to surface soiling of
property, damage to plant and aquatic life.
SASS assesses the impact based on a set of questions which examine
net increase in dust level
duration
effect on neighbours
public consultation and past performance.
1.7.11 Vibration
Site operations such as blasting, pile driving, dynamic compaction of loose soils and use of heavy equipment can
cause ground and structural vibrations. Excessive vibrations can also result in nuisance to local communities,
interference with sensitive equipment and decrease in serviceability and durability of structures.
Vibration is assessed in a similar fashion to noise and involves consideration of
vibration dose
duration
effect on neighbours
public consultation and past performance.
1.7.12 Constructions costs
The aim is to minimise the initial cost of construction. This principally involves estimating the cost of labour,
equipment and materials. The impact is measured in monetary terms.

19
1.7.13 Maintenance costs
The aim is to minimise the cost of routine maintenance and repair work required over the life time of the
structure. This principally involves estimating engineering as well traffic management costs in monetary terms.
1.7.14 Traffic delay costs
The aim is to minimise the amount of traffic disruption during maintenance operations. This involves principally
taking account of
number of maintenance interventions
durability of the repair
length of road closure
duration of road closure
timing of work
traffic flow rate
percentage of heavy goods vehicles.
This impact is also measured in monetary terms.
1.7.15 Employment and businesses
The aim is to minimise impacts and maximise opportunities for local communities/businesses. This is assessed
by means of a series of questions which evaluate the potential to employ local labour and benefits for local
businesses. Also considered are the potential adverse effects on local communities and mitigation measures.
1.7.16 Calculating the sustainability score
The scores for the various indicators are recorded in the column headed Quantity in Table 1.10. In order to
obtain an overall sustainability score the individual values must be combined. In SASS this is achieved using a
normalising technique in which the score for a given factor are reduced to a dimensionless value. This also
allows comparison with similar normalized scores for other factors. The normalised scores may then be
weighted and the weighted scores summed in order to arrive at an overall sustainability score for the scheme.

20
Indicators Bridge 1
Weighting Quantity Normalised Weighted (W) Score Score (N) (W × N)
Bridge 2 Weighting Quantity Normalised Weighted
Score Score
Bridge 3 Weighting Quantity Normalised Weighted
Score Score
Environment CO2 emitted Energy consumed Material use Waste Heritage, Ecology & Biodiversity Water Land Society Dust Noise Vibration Aesthetic Safety & Accessibility Economy Construction cost Maintenance cost Traffic delay cost Employment & Business
Sustainability score
Table 1.10: Specimen table for use with SASS
21
1.8 Conclusions
This chapter has discussed the salient features of a number of appraisal tools which can be employed to measure
the sustainability performance of various forms of construction such as buildings, civil infrastructure and even
entire cities, at different stages of their life cycle. These tools are largely based on the indicators introduced by
the UK government to define and monitor sustainable development. Use of these tools should assist the
construction industry take account of the plethora of recent legislation, policy, codes of practice, voluntary
standards, etc, on achieving sustainable development. Some of the tools discussed are well established such as
BREEAM and CEEQUAL whereas others are perhaps less well-known e.g. SASS and GSAP, either because
they are relatively new or have been developed by private organisations and are predominantly used in-house.
The review has also revealed that
some of the tools are heavily biased towards evaluation of environmental impacts and do not in actual fact
measure sustainability
in some cases the method of assessment is not robust and the tool open to misuse/bias
some tools do not combine impacts thus making it difficult to determine which solution is the most
sustainable where several options exist and also to optimise designs
it is important to identify and agree sustainability aspirations at the outset of the project before devising
design solutions.
Tools such as BREEAM are largely concerned with measuring performance during operational life since this
generally represents the major impact associated with building structures. However this can make it difficult for
civil and structural engineers to readily appreciate their role in achieving sustainable construction. Road traffic
is one of the major sources of carbon dioxide emissions in the UK19
and beyond. It reduces air quality and also
adds significantly to noise and dust pollution. The emissions/pollution from road traffic will no doubt increase
still further in future years as population levels rise and the world becomes more affluent. Some of the major
initiatives used to reduce road traffic impact include
implementation of tighter emission standards for new vehicles,
the development of cleaner fuels,
encouraging less car usage
greater use of public transport.
Another important initiative which appears to have been overlooked thus far is to reduce the idle time
experienced by drivers during repair and maintenance of highways, in particular bridge structures. Lane closures
or other forms of traffic management during maintenance work invariably leads to a reduction in traffic speeds
and sometimes stop-start driving. This increases both fuel consumption and CO2 emissions. SASS can be used
to appraise the impact of alternative bridges designs on these and other environmental as well as societal and
economic factors. The following chapter provides detailed guidance on this method of sustainability appraisal
and will hopefully assist students of civil and structural engineering appreciate the effect of design decisions
pertaining to choice of construction material, structural form and method of construction on sustainability and
thus show how they can fully contribute to the vision of sustainable development.

22
Chapter 2: A comparison of bridge options
2.1 Introduction
In order to demonstrate the SASS methodology three outline bridge designs were prepared. All were intentionally
overbridges carrying a two-way access road, with a total carriageway width of 7.3 m and 2.5 m wide footpaths on both
sides, across a dual two lane motorway. Both the road and the motorway were assumed to be regularly salted in winter
which would lead to corrosion of embedded reinforcing steel.
The motorway was assumed to have an AADT (Average Annual Daily Traffic Flow) of approximately 80,000
vehicles in both directions of which 20% are heavy goods vehicles (HGV). The AADT for the access road was
taken as 6,000 vehicles of which 10% are HGV. It was further assumed that the motorway and bridge would
open to traffic at the same time.
The scheme is situated in an area of „outstanding natural beauty‟ and any structure at the proposed location will
be highly visible, therefore an aesthetically pleasing design was deemed necessary. Moreover it was assumed
that the bridge is sited close to a hospital.
2.2. Bridge options
Details of three proposed bridge options are shown in Fig. 720
. Bridge 1 is a four span continuous steel beam and slab
bridge with integrated bank seat foundations and three intermediate leaf piers. Bridge 2 is a two-span simply supported
prestressed concrete beam and slab bridge with cantilever abutments and an intermediate leaf pier. Bridge 3 is a three
span voided concrete slab bridge with a full height abutment at one end and a bank seat at the other and two intermediate
portal piers. Further construction details can be found in Chapter 3. It should be noted that these options are not
necessarily typical of designs that would be used in practice but were selected for various practical reasons and also
provide sufficient scope to demonstrate the versatility of the appraisal method. The evaluation considered two phases of
bridge provision, namely construction and in-service, to give the life time sustainability.
(a) Bridge 1
(b) Bridge 2
(c) Bridge 3
2.3 Sustainability Appraisal
The measurement of sustainability involves combining the effects of an activity on the environment, the
economy and society. The following discusses how SASS was used to evaluate the individual themes of
sustainability and how they are combined to give a measure of sustainability.
Figure 7 - Bridge design options

23
2.3.1 Environmental Impact Assessment
As discussed in section 1.7, SASS recommends use of the following set of indicators to measure environmental
performance:
Climate change
Energy consumption
Materials usage
Waste
Heritage, Biodiversity and Ecology
Water
Land
In this exercise only the first three indicators were considered. It was assumed that the other indicators would
have similar impacts across all schemes. The way in which each indicator was assessed is discussed below.
2.3.1.1 CLIMATE CHANGE
SASS assumes climate change is directly related to carbon dioxide emissions. In this exercise the CO2
equivalent emissions associated with the following items/activities were calculated:
manufacture of materials for construction and repair work
transport of materials from factory gate to building site
traffic congestion due to repair and maintenance work.
The other items/activities recommended by SASS were assumed to be the same for all schemes and were
therefore excluded from consideration.
(a) CO2 for production and transportation of materials
(i) Embodied CO2
Table 2.1 shows for selected materials the embodied tons of CO2 produced per tonne of material production and
per tonne.km of material transported to the construction site. The values in the table are based on
inventories/guidance produced by a number of bodies including the University of Bath21
, DEFRA (Department
for Environment, Food and Rural Affairs)22
and the Environment Agency23
. The transport emission factor (i.e.
1.32 × 10⁻⁴
) is for an average heavy goods vehicle (HGV).
Material
Tons of CO2
Production emission Transport emission
factor (tonne) factor (tonne.km)
OPC
Aggregate
Stainless steel
Steel beams
Steel reinforcement
Parapets
Water proofing
Paint
0.97
0.008
6.15
1.79
1.72
2.82
8.28
6.10
1.32 × 10⁻⁴
Table 2.1: Embodied tonnes of CO2 per ton of construction material for production and transportation
(ii) Weights of materials
The weights of materials required for construction and lifetime maintenance of the three bridge structures are
shown in Table 2.2. The weights of materials necessary for construction were estimated from the working
drawings. The weights of materials required for repair were obtained using the information in Table 2.3. This is
based on DMRB BD3624
and assumes that, because of deterioration, a percentage of the relevant surface area of
material/item will need to be replaced at given intervals of time.
(iii) Transportation
The CO2 produced during transportation of materials from factory gate to building site was calculated assuming
the transport distance for all materials was 25 km.

24
Table 2.2: Materials required for construction and lifetime maintenance of Bridges 1-3
Maintenance
activity
Frequency
(years)
Defect repair
area
Concrete repairs - E2
Concrete repairs – E3
Stainless steel
Steel beams
Steel reinforcement
Parapet replacement
Water proofing
Steelwork painting
30
30
120
120
120
30
30
25
10%
50%
-
-
-
10%
100%
10%
Table 2.3: Frequency of repair work and defect area
(iv) CO2 emissions: production and transportation
The CO2 produced during manufacture of materials was obtained from
Mass of material × Production emission factor --------------(1)
The CO2 produced during transport of materials was obtained from
Mass of material × Transport distance × Transport emission factor --------------(2)
The results for Bridges 1-3 are summarise in respectively Tables A1-A3 (Appendix A).
(b) CO2 due to traffic congestion
Lane closures or other forms of traffic management during maintenance work invariably leads to a reduction in
traffic speeds and sometimes stop-start driving. This increases both fuel consumption and CO2 emissions.
The quantities of extra CO2 produced as a result of traffic congestion during maintenance operations depend on
duration of maintenance work over life time in days
length of road with traffic management
flow of HGV per day and the normal kg of CO2 per km produced
flow of other vehicles per day and the normal kg of CO2 per km produced
kg of CO2 emitted per km by HGV and other vehicles22
i.e. vehicle emission factor (respectively, 0.906
and 0.2042)
additional emissions during maintenance work25
i.e. congestion emission factor (assumed to be 30% of
normal values)
whether or not the work is carried out at night or during off-peak hours i.e. road user delay influence
factor
Bridge 1 Bridge 2 Bridge 3
Material Construction
(tonnes)
Lifetime
repairs
(tonnes)
Construction
(tonnes)
Lifetime
repairs
(tonnes)
Construction
(tonnes)
Lifetime
repairs
(tonnes)
OPC
Aggregate
Stainless steel reinforcement
Steel beams
High Yield reinforcement
Parapets
Water proofing
Paint
Asphaltic joints
357
1386
140
65
340
17
1.2
0.08
-
19
72
-
-
-
6
0.36
0.03
-
341
1327
-
-
482
17
0.4
-
3
42
163
-
-
-
6
1.2
-
-
417
1618
296
-
204
17
0.6
-
4
49
190
-
-
-
6
1.8
-
-
Total weights 2306.3 97.4 2170.4 212.2 2556.6 246.8

25
(i) Lifetime duration of maintenance work
This principally depends on
Type of maintenance activity
Frequency of repair work
Extent of repair
Rate of repair
Lifetime number of treatments
Table 2.4 shows the various maintenance activities required for Bridge 1. Note that waterproofing renewal,
parapet repair and joint replacement were not considered as it was assumed that these operations will be carried
out from the top surface of the bridge where traffic volumes are comparatively low and would therefore cause
negligible congestion. The table also shows the expected frequency of each maintenance activity, the associated
extent of deterioration as well as the rates of repair. The latter were used to calculate the works duration time.
The total number of treatments required over the life of the structure was estimated using the design life, which
for bridges is normally taken as 120 years. For example, in the case of concrete repairs a total of three
maintenance interventions will be necessary in order that the structure remains serviceable throughout its design
life i.e. in years 30, 60 and 90. Finally the lifetime duration of each maintenance action is obtained by
multiplying the time required to undertake a single action by the total number of actions required during the life
of the structure.
Maintenance
Activity
Frequency
(years)
Total
extent
Extent of
inspection/repair
Rate of
inspection/repair
Duration of
work
Lifetime number
of treatments
Lifetime
duration (days)
Inspection
Drain cleaning
Concrete repairs – E2 Steelwork painting
5
2
30 25
4 spans
4 spans
500 m2 800 m2
100%
100%
10% × 500 = 50 m2 10% × 800 = 80 m2
1 span/day
½ span/day
2 m2 per wk 25 m2 per wk
4 days
2 days
25 wks (175 days) 3.2 wks (23 days)
23
59
3 4
4 × 23 = 92
2 × 59 = 118
175 × 3 = 525 23 × 4 = 92
Table 2.4: Maintenance data for Bridge 1
(ii) Length of lane closures
Table 2.5 shows the assumed lengths of lane closures required for maintenance of Bridge 1. It was assumed that
bridge inspection would be carried out from a mobile elevated platform and would require short lengths of lane
closures in order to complete. Concrete repairs and steelwork painting are both substantive operations however
and would both require a full carriageway closure and the provision of a contraflow. Since the central
reservation crossover points are 2 km apart a minimum traffic management length of 3 km was judged
appropriate.
Maintenance Activity Length of traffic
management (km)
Inspection
Concrete repair
Painting
0.2
3
3
Table 2.5: Length of the closure required for maintenance work
(iii) Road user delay influence factor
Some maintenance activities such as bridge inspections can be carried out over short periods of time. Thus, it would be
reasonable to assume that this work would be scheduled at weekends or other off peak times when traffic volumes are
low, thus minimising the disruption to road users. Under these circumstances it would be appropriate to use the road user
delay influence factor to calculate CO2 emissions (Table 2.6). However, it should be remembered that off-peak and
particularly night working will also increase labour costs.
Table 2.6: Road user delay influence factor22
Road user delay influence factor
Day working
Off peak / Night working
1.0
0.25
26
(iv) CO2 emissions: traffic congestion
The CO2 emissions due to traffic congestion were determined using the following expression
Lifetime duration of maintenance work × length of lane closure required ×
average daily vehicle flow × vehicle emission factor × congestion emission factor ×
road user delay influence factor (where relevant) -------------(3)
Tables A4-A6 summarise the CO2 emissions due to traffic congestion for Bridges 1-3 respectively.
(c) Lifetime CO2 emissions
Table 2.7 summarises the lifetime CO2 emissions for the three bridge structures.
Bridge CO2 for production and transport
(tonnes)
CO2 due to congestion (tonnes)
Lifetime CO2 emissions (tonnes)
1 2 3
2,025 1,299 2,732
15,245 12,522 14,616
17,270 13,821 17,348
Table 2.7: Lifetime CO2 emissions for Bridges 1, 2 and 3 2.3.1.2 ENERGY CONSUMPTION
In this exercise the energy consumed during the following operations was considered:
manufacture of materials for construction and repair
transport of materials from factory gate to building site
traffic congestion occurring during repair work due to any enabling works e.g. lane closures.
The other items/activities recommended by SASS (see Section 1.7.2) were assumed to be the same for all
schemes and were therefore excluded from consideration.
(a) Energy for production and transportation of materials
(i) Embodied energy
Table 2.8 shows for selected materials the energy consumed per tonne of material for production and per
tonne.km of material transported to the construction site. This data is principally based on inventories produced
by the University of Bath21
, DEFRA (Department for Environment, Food and Rural Affairs)22
and the
Environment Agency23
. The transport energy factor is based on the DEFRA transport emission factor for an
average heavy goods vehicle (HGV) and the DEFRA GHG (green house gas) conversion factor which gives
respectively the average diesel consumption per ton.km for an HGV and the CO2 produced per ton.km. The
energy consumed per ton.km is based on the diesel consumption and the calorific value of diesel.
Material Gj of energy
Production energy Transport energy
factor (tonne) factor (tonne.km)
OPC
Aggregate
Stainless steel
Steel beams
Steel reinforcement
Parapets
Water proofing
Paint
6.1
0.15
51.5
22.7
22.7
35.8
140
80
2.0 × 10⁻³
Table 2.8: Gj of energy per ton of construction material for production and transportation
(ii) Weights of materials
The weights of materials required for construction and lifetime maintenance are shown in Table 2.2 above.

27
(iii) Transportation
The energy required for transportation of construction and repair materials from factory gate to building site was
calculated assuming the transport distance for all materials was 25 km.
(iv) Embodied energy: production and transportation
The energy required for production was determined from
Mass of material × Production energy factor ------------------(4)
The calculation of energy required for the transportation of materials to site was obtained from
Mass of material × Transport distance × Transport energy factor --------------(5)
Tables A7-A9 summarise the energy required for production and transportation of materials obtained for Bridges
1-3 respectively.
(b) Extra energy consumption due to traffic congestion
The quantities of extra energy used as a result of traffic congestion during maintenance operations depends on
duration of maintenance work over lifetime in days (Table 2.4)
length of road with traffic management (Table 2.5)
flow of HGV per day and the normal fuel consumption
flow of other vehicles per day and the normal fuel consumption
additional fuel consumption during maintenance work i.e. congestion energy factor (assumed to be
30%25
of normal values)
whether or not the work is carried out during off-peak hours (Table 2.6)
kg of CO2 emitted per km by HGV and other vehicles (respectively, 0.906 and 0.2042)
kg of CO2 emitted per litre of fuel (2.63 kg and 2.33 kg for respectively diesel and petrol)
calorific value of fuel (46 Mj/kg and 44.8 Mj/kg for respectively diesel and petrol
density of fuel (0.885 kg/l and 0.737 kg/l for respectively diesel and petrol)
The last four quantities were used to calculate the energy consumption factor as follows:
Energy consumption factor for HGVs = kmMj /14885.04663.2
906.0
Energy consumption factor for HGVs = kmMj /3737.085.4533.2
2042.0
(ii) Energy consumption: Traffic congestion
The extra energy consumption due to traffic congestion during maintenance work was determined using the
following expression
Total duration of maintenance work × length of lane closure required × average daily vehicles flow ×
energy consumption factor × congestion energy factor ×
road user delay influence factor (where relevant) --------------(6)
Tables A10-A12 show the results of this analysis for Bridges 1-3 respectively.
(c) Lifetime energy consumption
Table 2.9 summarises the lifetime energy consumption for the three bridges.
Bridge Energy for production and transport (Gj)
Energy due to congestion (Gj)
Lifetime energy consumption (Gj)
1 2 3
20,055 14,676 24,299
230,080 188,985 220,578
250,135 203,661 244,877
Table 2.9: Lifetime energy consumption for Bridges 1, 2 and 3

28
2.3.1.3 MATERIALS USAGE
This represents the sum of the materials needed for construction and lifetime maintenance of the structure (see
Table 2.2) and was simply obtained by summing the weights of all the materials required for each bridge. The
results are summarised in Table 2.10.
Bridge Weight of materials for construction
(tonnes)
Weight of materials for maintenance (tonnes)
Lifetime material use (tonnes)
1 2 3
2,306 2,171 2,556
98 212 247
2,404 2,383 2803
Table 2.10: Lifetime material use for Bridges 1, 2 and 3

29
2.3.2 Economic Impacts Assessment
SASS assesses lifetime economic impacts in terms of
cost of construction
cost of maintenance
cost of traffic delays caused by maintenance work.
The latter two costs are discounted to take account of when, during the life of the structure, the costs occurred.
As noted in the introduction it was assumed that the motorway and bridge would open to traffic at the same time
and therefore no traffic delay costs would occur during construction.
2.3.2.1 COST OF CONSTRUCTION
The initial cost of construction can be obtained using standard surveying techniques. This involves preparing bills of
quantities which itemise the types of work and the quantities required. An estimate of the price of unit item of work can
be obtained from past contracts or via the SPON‟s Price Book26
and used to calculate the total cost of the structure.
However in this work, the cost of construction was simply based on a rate per m2 of deck, assumed to £1000/m
2, thus
giving the values shown in Table 2.11.
Bridge Area of bridge deck (m
2) Cost (£)
1 2 3
64 × 12.3 = 787.2 32 × 12.3 = 393.6 48 × 12.3 = 590.4
787,200 393,600 590,400
Table 2.11: Cost of construction of Bridges 1, 2 and 3
2.3.2.2 COST OF MAINTENANCE WORK
SASS assumes that the cost of maintenance work principally depends on:
Engineering costs
Access cost
Traffic management costs
Overheads
The way in which these costs are estimated is outlined below.
(i) Engineering costs
Engineering costs depend on
Type of maintenance work
Extent of work
Rate of repair
Table 2.12 lists common maintenance options for bridges together with some information necessary for estimating the
engineering costs of the various treatments. The data has been taken from Design Manual for Roads and Bridges BD3624
issued in draft form in 2002. The maintenance costs in this document are at 1998 prices and have been updated to 2009
values using the Price Index Factor given by
Price Index Factor = 2.160
IndexricePetailRcurrentThe --------------(7)
Also included in the table is information on the frequency of maintenance work. In some cases e.g. inspection
and drain clearing, the figures quoted are based on recommended practice. In other cases e.g. joint replacement
and steelwork painting, the frequency may be based on past experience and/or manufacturer‟s recommendations.
Yet in other case e.g. deck waterproofing replacement, it would make sense if this work coincided with
pavement renewal, in order to minimise traffic disruption.
The service life of the element or maintenance option also depends on the exposure. Table 2.12 gives details of
exposure classes relevant to bridge structures. The values for concrete subjected to E2 exposure shown in Table
2.12 assume that concrete will be repaired every 30 years which will result in 10% of the existing surface area
needing replacement. From Table 2.14 it can be seen that if the work was carried out sooner it would be cheaper
and quicker to complete as both the severity and extent of the defective concrete would be smaller. However, a

30
greater number of maintenance intervention would be required, which could well increase lifetime costs due to
higher traffic management and traffic delay costs (see below).
Generally it will be economical to combine maintenance activities e.g. repainting the steelwork and carrying out
concrete repairs, as this should reduce overall disruption to road traffic and hence reduce traffic delay costs.
Maintenance options Frequency
(years)
Defect repair
area
Cost (£) Rate
Inspection
Drain cleaning
Water proofing
Buried joint replacement
Steelwork painting - E2
Concrete repairs - E2
Concrete repairs – E3
Parapet replacement
5
2
30
10
25
30
30
30
100%
10%
10%
50%
10%
£1,100/span
£300/span
n/a
£100/m
£35/m2
£1,600/m2
£1,600/m2
n/a
1 span/day
½ span/day
n/a
60m/wk
25 m2/wk
2 m2/wk
2 m2/wk
n/a
Table 2.12: Maintenance options and access
Exposure class Corrosion
Environment
Typical element location
E1 Protected
Low
Element protected from slat spray with silane or
enhanced durability measures
Elements protected from salt spray by a protective
enclosure.
E2 Sheltered
Exposure
Medium
Bridge soffit subject to light vehicle spray from
salted road.
Top of roadside bridge pier or abutment subject to
light vehicle spray from salted road.
E3 Severe
High
Roadside bridge abutment, parapet upstand or deck
edge beam subject to heavy vehicle spray from
salted road.
Section of bridge deck of leaking expansion joint
or gutter e.g. deck end crosshead
Top surface of unwaterproofed bridge decks.
Areas where corrosion or spalling of surface
concrete is evident.
Table 2.13: Exposure classes
Exposure
class
Time to
Maintenance
(years)
Defect repair
area
Cost
(£ per m2)
Rate
(m2 per week)
Reinforced concrete decks and main members, including substructures
E1 No defects
E2 10
20
30
2%
5%
10%
300
600
1200
8
4
2
E3 10
20
30
10%
20%
50%
1200
1200
1200
2
2
2
Pre-stressed decks and main members
E1 No defects
E2 10
20
30
-
5%
10%
-
1200
1200
-
2
2
E3 10
20
30
5%
10%
20%
1200
1200
1200
2
2
2
Table 2.14: Concrete repairs to reinforced concrete and prestressed elements (DMRB BD 3624
)

31
(ii) Access cost
Table 2.15 shows two methods which are used to gain access to bridges during maintenance work. The costs have been
taken from DMRB BD3624
and updated to 2009 values by multiplying by the Price Index Factor (equation 7).
Methods Cost
Scaffolding
Mobile elevated platform
£1.50 m2/day
£400/day
Table 2.15 Access costs
(iii) Traffic management costs
Traffic management costs depends on
type of maintenance work
method of maintenance
element to be maintained
density and mix of traffic
extent, duration and length of the lane closure required.
Table 2.16 shows various traffic management systems applicable to bridge maintenance contracts. Again, the costs have
been taken from DMRB BD3624
and updated to 2009 values by multiplying by the Price Index Factor (equation 7).
Type of traffic management Cost
Single lane closure
Two lane closure *Two lane closure with contraflow
**Full carriageway closure
Automatic traffic control
£600 per day
£700 per day
£1800 per day
£1100 per day
£1100 per day *
For a two lane dual motorway **
For a two-lane dual carriageway road
Table 2.16 Traffic management costs
(iv) Overheads
DMRB BD36 recommends that the cost of contract overheads should be based on the value of preventative
maintenance work but excluding the cost of traffic management and access. Preventative maintenance is defined
as work that is not essential now but may be justified on economic grounds. It includes items such as joint
replacement, steelwork painting and concrete repairs. In this work overhead costs were estimated using the
figures shown in Table 2.17 which have been taken from DMRB BD36 and updated to 2009 values by
multiplying by the Price Index Factor.
Table 2.17 Overhead costs
(v) Discount rates
Expenditure on construction and maintenance (including the effects of traffic delays) will occur at different stages during
the life of the structure, which means that cost estimates should take account of the time value of money. Costs arising in
different years may be reduced to their present values by a process known as discounting. Normally this is achieved
using the following formula
Discounted cost = n
i
tedUndiscount
1
cos ------------------(8)
where
i is the discount rate
n is the age of the bridge when the maintenance activity is carried out.
Value of preventative maintenance work Weekly cost (£)
< £50,000
£50,000 – £250,000
£250,000 - £1,000,000
> £1,000,000
700
1,300
6,500
13,000
32
The discount rates for highway structures used in this work are shown in Table 2.18 and were obtained from the
Treasury Green Book27
.
Age (years) Discount
rate (%)
0 - 30
31 - 75
76 -125
3.5
3.0
2.5
Table 2.18: Discount rates for different ages
2.3.2.3 TRAFFIC DELAY COSTS
2.3.2.2 TRAFFIC DELAY COST
Some types of maintenance activity cause traffic congestion as a result of lane closures to provide access to parts
of the bridge or for the protection of workers. The extent of this disruption depends on
the number of lanes closed
the total number of lanes
whether or not there is contraflow working
the length of the lane closure
the average daily traffic flow
the proportion of the traffic that are HGVs.
The Department for Transport‟s (DfT) computer program called Queues and Delays at Roadworks (QUADRO)
takes these factors into account to calculate the monetary consequences of the delays caused by the disruption to
traffic for each day the disruption lasts. The DfT has also produced tables which can be used in lieu of running
QUADRO (see Appendix B). Note that the costs in these tables are given at 1998 prices and should be updated
to 2009 prices using the Price Index Factor discussed earlier, prior to use.
Example 1: Cost of inspecting Bridge 1
Labour/equipment
Cost = £1100/span (Table 2.10)
Assuming work will be carried out at weekends, increase cost by 1.5 cost = £1100 × 1.5 = £1,650/span
Total number of spans = 4 (Fig. 2.1)
Total cost = £1,650 × 4 = £6,600
Gaining Access
Assume access will be from a mobile working platform
Cost of mobile platform = £400 / day (Table 2.14)
Rate of inspection = 1 span/day
Since bridge has four spans, work duration = 4 days
Total cost = £400 × 4 = £1,600
Traffic management
Assume two lanes will be closed while the inspection work is carried out.
Cost = £700/day (Table 2.11). Since work will be carried out at weekends, increase cost by 1.5 = £700 × 1.5 =
£1,050/day
Cost of traffic management = £1050 × 4 = £4,200
Overheads
Not applicable since this is routine maintenance
Engineering cost
Engineering cost = Labour/equipment + Gaining access + Traffic management + Overheads
= £6,600 + £1,600 + £4,200 + 0 = £12,400
Lifetime number of treatments = 23 (Table 2.3)
Lifetime engineering cost = Cost of treatment × Lifetime number of treatments = £12,400 × 23 = £285,200
Discounted lifetime engineering cost =
6
15
035.01
400,12
ii
+
15
75
03.01
400,12
jj
+
23
165
025.01
400,12
kk
= £76,935.46

33
As previously noted it was assumed that drain cleaning, parapet repair and joint replacement will be undertaken
from above deck. This should result in minimal traffic disruption because the vehicle flow rate on the bridge is
relatively small and therefore the associated traffic delay costs would also be quite small.
It is further assumed that waterproofing will be carried out at the same as time as pavement reconstruction. In all
likelihood the reconstruction operation would be part of a much wider road resurfacing scheme and not just
confined to the bridge. Therefore, no allowance for traffic management and user delay costs regarding
waterproofing was made in this work.
The delay cost for an activity is given
Daily delay cost × number of days the activity takes------------------(9)
The lifetime delay cost is obtained by multiplying the values obtained from equation (9) by the number of
treatments needed during the life of the bridge.
Like the engineering costs, delay costs must also be discounted which is carried out using equation (8). The
lifetime discounted costs for a maintenance activity are obtained by summing the discounted lifetime cost for
each activity.
Details of the engineering and traffic delay costs of the other maintenance options for Bridge 1 can be found in Appendix
C. Appendix C also provides full details of the engineering and traffic delay costs for the various maintenance actions
required for Bridges 2 and 3.
Tables 2.19 and 2.20 summarises respectively the lifetime engineering and traffic delay costs for the maintenance
activities required on Bridge 1.
Maintenance Activity Frequency
(years)
Cost of single
application (£)
Age of bridge at each
application
Life time cost
(£)
Discounted life time
cost (£)
Inspection
Drain cleaning
Painting Concrete repair
5
2
25 30
12,400
1,200
58,000 655,000
5, 10, 15, etc…… 115
2, 4, 6, 8, etc … 118
25, 50, 75, 100 30, 60, 90
285,200
70,800
232,000 1,965,000
76,935.46
19,278.67
49,001.10 415,510.57
Total £ 560,725.80
Table 2.19: Engineering costs of maintenance activities for Bridge 1
Example 2: Traffic delay cost of inspecting Bridge 1
For a two lane dual motorway with 80,000 AADT and 20% HGV, one primary and two secondary lanes
unaffected, Table 32 (TRRM Vol. 1 Annex 5.5.2)28
gives a traffic delay cost of £103,000/day at 1998 prices
over a length of 0.2km (Table 2.4).
Price Index Factor = 1.316 Traffic delay cost at 2009 prices = 1.316 × £103,000 £135,600/day
Work will be carried out at weekends Road user delay influence factor = 0.25 (Table 2.5)
Modified traffic delay cost = £135,600 × 0.25 = £33,900/day
From above, work duration = 4 days
Traffic delay cost per inspection = £33,900 × 4 = £135,600
Total number of inspections required = 23 (Table 2.3)
Lifetime undiscounted delay cost = £135,600 × 23 = £3,118,800
Discounted lifetime delay costs =
6
15
035.01
600,135
ii
+
15
75
03.01
600,135
jj
+
23
165
025.01
600,135
kk
= £841,326.42

34
Maintenance activity Length of
lane closure
(km)
Delay cost per day
(£)
Duration of closure
for each activity
(days)
Delay cost for
each activity (£)
Lifetime delay
cost (£)
Discounted lifetime
delay cost (£)
Inspection
Painting
Concrete repair
0.2
3
3
33,900
201,400
36,100
4
23
175
135,600
4,632,000
6,317,500
3,118,800
18,528,800
18,952,500
841,326.42
3,913,498.40
4,007,614.80
Total £ 8,762,439.62
Table 2.20: Traffic delay costs of maintenance activities for Bridge 1
Tables 2.21 and 2.22 summarises respectively the lifetime engineering and traffic delay costs for the maintenance
activities required on Bridge 2.
Maintenance Activity Frequency
(years)
Cost of single
application (£)
Age of bridge at each
application
Life time cost
(£)
Discounted life time
cost (£)
Inspection
Drain cleaning
Concrete repair
5
2
30
6,200
600
1,156,700
5, 10, 15, etc…… 115
2, 4, 6, 8, etc … 118
30, 60, 90
142,600
35,400
3, 470,100
38,467.73
9,639.34
733,772.64
Total £ 781,879.71
Table 2.21: Engineering costs of maintenance activities for Bridge 2
Maintenance activity Length of
lane closure
(km)
Delay cost per day
(£)
Duration of closure
for each activity
(days)
Delay cost for
each activity (£)
Lifetime delay
cost (£)
Discounted lifetime
delay cost (£)
Inspection Concrete repair
0.2 3
33,900 36,100
2 322
67,800 11,624,200
1,559,400 34,872,600
420,663.21 7,374,011.20
Total £ 7,794,674.40
Table 2.22: Traffic delay costs of maintenance activities for Bridge 2
Tables 2.23 and 2.24 summarises respectively the lifetime engineering and traffic delay costs for the maintenance
activities required on Bridge 3.
Maintenance Activity Frequency (years)
Cost of single application (£)
Age of bridge at each application
Life time cost (£)
Discounted life time cost (£)
Inspection Drain cleaning
Concrete repair
5 2
30
9,300 900
1,360,800
5, 10, 15, etc…… 115 2, 4, 6, 8, etc … 118
30, 60, 90
213,900 53,100
4,082,400
57,701.59 14,459.01
863,246.89
Total £ 935,407.49
Table 2.23: Engineering costs of maintenance activities for Bridge 3
Maintenance activity Length of
lane closure
(km)
Delay cost per day
(£)
Duration of closure
for each activity
(days)
Delay cost for
each activity (£)
Lifetime delay
cost (£)
Discounted lifetime
delay cost (£)
Inspection
Concrete repair
0.2
3
33,900
36,100
3
371
101,700
13,393,100
2,339,100
40,179,300
630,994.81
8,496,143.30
Total £ 9,127,138.11
Table 2.24: Traffic delay costs of maintenance activities for Bridge 3

35
2.3.3 Societal Impact Assessment
SASS takes account of the following issues
aesthetic
dust
noise
vibration
The following describes how these factors are measured.
2.3.3.1 Aesthetics
This impact is measured by considering the following
percentage of guidelines followed
past performance and the provision of a liaison officer
The guidelines recommended for bridge aesthetics are shown in Tables 2.25-2.27 and refer respectively to the
following features
The bridge as a whole 8 guidelines
The bridge and its surroundings 23 guidelines
The parts and details of a bridge 36 guidelines
They are based on guidance prepared by the Austrian Roads and Transport Authority29
and the Highways
Agency30
on Bridge Aesthetics/Appearance.
Each aspect contributes 25% to the total score for this provision of sustainability (Table 2.28).
The remaining 25% is obtained from past performance/provision of liaison officer in accordance with the scores
shown in Table 2.29.
Individual aspects Score
1,1,1 - Excessive imbalanced proportions between significant elements
should be avoided as much as possible.
1,1,2 - Similar proportions or ratios throughout the structure can create a
harmony.
1,1,3 - The ratio of Deck to Parapet Depth is also considered a significant
aesthetic proportion and guidelines have been developed by Cardiff
University School of Engineering
1,1,4 - the Span to Depth ratio is determined by the structural design. The
value of the span-to-depth ratio can be an indicator of aesthetic design. The
general agreement among bridge design experts states that span-to-depth
ratio between 15 and 30 provi
1,4,2 - Honesty of form is about the materials and structures to look like what
they are.
1,2,1 - it must be considered as an important aesthetic indicator because
symmetrical bridges are often more aesthetically pleasing than non
symmetricals.
1,4,1 - The complexity of a bridge should be minimized especially in natural
landscape settings as it tends to attract the eye and competes with views of
the landscape.
Justifications/Actions for
the scores (text or
drawing no.)
1,3,1 - to achieve a consistent order, bridge spans should match where
possible. Also, the interaction of bridge elements like lighting columns,
barrier supports and piers should be considered.
Table 2.25: Guidelines for Bridge as a whole

36
2,1,1 - Make the bridge as invisible as possible to hide it in the landscape.
(suits to smaller bridges)
2,1,2 - Make the bridge as simple and elegant as possible to complement the
landscape: This approach is a practical, cost effective objective for
overpasses and larger bridges and can lead to good looking bridge
solutions.
2,1,3 - Maximize views of the landscape through the bridge: By minimizing
the profile of the bridge, the landscape setting will dominate the view and be
appreciated from all viewpoints.
2,1,4 - Bridges with a horizontal form are generally preferable to bridges on a
grade over flat simple landscapes and significant expanses of water
2,1,5 - Significant stands of existing vegetation should be retained
2,1,6 - Footprint of the bridge (e.g. pile caps, abutments) should be minimized
so that the retention of local vegetations maximized.
2,1,7 - The presence and extent of intermediate structures and hard surfaces
between the bridge and landscape should be minimized.
2,1,8 - Careful design of earthworks and planting and the selection of
endemic species grown from locally collected seed.
2,2,1 - A landmark structure should be created in a way that complements or
contrasts with its visual catchments.
2,2,2 - Maximizing views from the bridge of the local urban setting
2,2,3 - Maximizing views through the bridge from the urban setting
2,2,4 - Respecting locally valued structures and their cartilages by
complementing local styles and materials
2,2,5 - Ensuring the space under the bridge is not dark, degraded and unsafe.
2,3,1 - In such cases plants should be located to the outside of the space and
irrigation may be required.
2,3,2 - Combining planting with a hard paved or gravel surface is often
appropriate.
2,3,3 - Clean uncluttered surfaces, neat connections and simple layout of
girders will help to give a neat appearance.
2,3,4 - When designing the soffit, consider bracing, when it is required, and
ensure an orderly and regular pattern where possible.
2,4,1 - Short span (up to approximately 18m): prestressed concrete plank
bridges.
2,4,2 - Short to medium span (approximately 18-40m): pre-stressed concrete
girders or pre-stressed concrete voided slabs.
2,4,3 - Medium span (approximately 40-80m): ste
Table 2.26: Guidelines for Bridge and its surroundings

37
3,1,1 - They should appear as continuous uninterrupted lines, extending the
full length of the bridge with a generous overlap of the abutments.
3,1,2 - A neat, sharp edge will help define them against the background.
3,1,3 - Maximizing the shadow cast on the superstructure will further
accentuate and express their form.
3,1,4 - The outer face should be a smooth single plane surface, slanted
slightly outwards towards the bottom, to better catch the sunlight.
3,1,5 - The top should angle towards the road, to channel rainwater onto the
bridge, minimizing staining of the outside face.
3,1,6 - If the deck soffit is visually complex, consideration should be given to
hiding this complexity, by extending the parapet soffit below the deck soffit.
3,2,1 - In the elevation, hunched girders are expressive and responsive to the
forces in the bridge. They can often be more distinctive and elegant than
single depth beams.
3,2,2 - Three or five span haunches are aesthetically very elegant balanced
structures.
3,2,3 - In cross section, if the girder is right angled it can catch the light and a
double line may be visible. Maximizing the overhang will increase the
shadow. A curved soffit will provide a gradation of tone and minimize a sharp
line at the base of th
3,3,1 - In an urban area that vertical forms are present and only close views
available, headstock may provide a reassuring sense of strength and
durability, as well as visual interest.
3,3,2 - In a rural area where horizontal forms predominate, headstock can be
overly complex and should be carefully considered and designed with their
visual impact in mind, or avoided.
3,3,3 - If possible headstocks should not extend across the outer face of the
girder. This introduces unnecessary complexity and appears in elevation as
if the headstock is supporting the deck rather than the girder.
3,4,1 - Bridges which have pier spacings or spans which are roughly
proportional to the bridge's height above ground level are more aesthetically
pleasing than bridges which do not follow this proportion. They seem more
responsive to their context.
3,4,2 - Collecting multiple piers into pairs or clusters can open up views
below the deck and also give rhythm and elegance to the supports.
3,4,3 - Rounding off the corners of rectangular piers provides a softer form,
which may be preferable in certain contexts. For example where the
presence of the pier needs to be down played so that superstructure is
dominant, e.g. in a rural setting.
3,4,4 - Pier shapes which have a slight taper (A taper of around 1:80) are
desirable.
3,4,5 - The reverse taper should only be used where the appearance of
rigidity is required between superstructure and pier. Otherwise the
appearance of the top heavy pier can be imbalanced and does not reflect the
forces acting on the pier well.
3,5,1 - The proportion of pier size to pile cap size should be considered.
Imbalanced proportions should be avoided.
3,6,1 - If using of wall abutments is unavoidable the use of planting should
be considered to screen the abutment walls.
3,6,2 - Reducing the abutments can create a more refined and better looking
bridge. It does however increase the span and therefore depth of beam.
3,6,3 - Continuing the superstructure or the parapet allows the shadow line
to reduce the dominance of the abutment, and makes the bridge appear
longer and more elegant.
3,6,4 - Angling the abutments provides a more open sleek look and helps
visually anchor the span.
3,6,5 - Spill through abutments allow open views to the landscape and better
visibility to the road beyond.
3,6,6 - slight angle on the taper can make the wall appear less dominating
especially if next to a footpath. This avoids visual crowding.
3,8,2 - The screens should extend to the ends of the bridge span and
consideration should be given to integrating the bridge barrier and safety
screens.
3,9,1 - Where possible lighting on bridges should be minimized or avoided.
3,9,2 - If necessary lighting should be used in the median as far from the
parapet as possible to reduce clutter or designed into the parapet structure.
3,9,3 - If considerable effort is put into the design of the appearance of the
bridge it is better value for money to allow the bridge to be viewed at night
(dependent on context, cost, safety and environmental issues).
3,11,1 - Where possible avoid the use of noise walls on bridges.
3,12,2 - A neutral palette of black, gray and white tend to give a clear
definition of the bridge as an object in the landscape.
3,10,1 - The colour and grade of the pipe system must be considered as
these aspects can jar with the overall bridge design.
3,11,2 - The use of transparent panels should be considered so that the
apparent slenderness of the superstructure is not affected.
3,8,1 - An outward curving screen creates a more open feeling for bridge
users. However it presents a greater apparent depth of structure for
onlookers.
3,5,2 - In a tidal watercourse, if the view of the piles is to be minimised, the
pile cap may require a skirt as they need to be visible to boats and shipping
as a safety measure.
3,12,1 - Landscape tones are generally subdued and dark; therefore light
colours and textures (for bridge primary elements) provide a good contrast.
(the exception is when they are culturally appropriate such as traditional
Chinese bridges or unique icon
3,7,1 - With the exception of name plates and navigation signs, signage
should be kept off bridges as far as possible. They add clutter and
complexity and detract from the structure. They also obstruct views from the
bridge.
Table 2.27: Guidelines for Bridges: The parts and details

38
Aesthetic Aspects Max Score
Bridges as whole
Bridge & its surroundings
Parts & Details
Past performance/Public consultation
25%
25%
25%
25%
Table 2.28: Weighting factors for aesthetics
Table 2.29: Impact scores for past performance and liaison officer
Aesthetic impact is obtained from
%25wholeaasbridgeforguidelinesrelevantofNo
satisfiedguidelinesofNo + %25
gssurroundinitsandbridgeforguidelinesrelevantofNo
satisfiedguidelinesofNo +
%25tailsdeandpartsforguidelinesrelevantofNo
satisfiedguidelinesofNo + %25
101
scorempactI
Aesthetics - Summary
Table 2.30 shows the aesthetics impact scores for Bridge 1. Also included are the impact scores for Bridges 2 and 3.
Full details of the supporting calculations can be found in Appendices D1-2 and D1-3.
Table 2.30
Past performance Liaison officer allocated Impact score out of 10
Poor
Good
None
Poor
Good
None
Yes
Yes
Yes
No
No
No
5
1
3
10
7
9
Bridge Guidelines Past performance/liaison officer Aesthetics score
1
2
3
67.3
64.7
39.1
7.5
7.5
7.5
74.8
72.2
46.6
Example 3: Aesthetics - Bridge 1
With the aid of Fig. 7 estimate the aesthetic impact score for Bridge 1. Assume the designer has no past
performance but has appointed a liaison officer to consult with the public.
(i) Guidelines
Appendix D1 shows completed copies of Tables 2.24-2.26 for Bridge 1. The results are summarised in the table
below and used in conjunction with the weighting factors included in Table 2.28 to score the guidelines.
Guidelines Relevant
guidelines
Guidelines
observed
% observed Score
(%)
Bridge as a whole
Bridge and its surroundings
Parts and details
8
9
31
8
8
25
100
88.9
80.6
25
22.2
20.1
Total 67.3
(ii) Past performance/liaison officer
From Table 2.29 it can be seen that the score is 7 out of 10 giving an impact of
5.7%2510
71
(iii) Aesthetics score
The aesthetics impact score for Bridge 1 is
67.3 + 7.5 = 74.8%
--------------------(10)

39
2.3.3.2 Dust
This impact is evaluated by considering the following31
the net increase in dust level
the presence of sensitive buildings nearby
public consultation and past performance of contractor
duration of dust nuisance
(i) Net increase in dust level ( g)
This is given by
Predicted maximum dust level – Ambient dust level
(ii) Sensitive premises
This impact is assessed using Table 2.31.
Type of Premises Working Time/Period
Weekday Weekend
Day Night Day Night
Hospitals, care homes &
similar
10 (Hazardous
for patients.)
10 (Hazardous
for patients.)
10 (Hazardous
for patients.)
10 (Hazardous
for patients.)
Offices & similar 8 (Hazardous
for staff & extra
cleaning
required.)
6 (Extra
cleaning
required.)
6 (Extra
cleaning
required.)
6 (Extra
cleaning
required.)
Commercial/business &
similar
8 (Hazardous
for shoppers,
staff & extra
cleaning
required.)
6 (Extra
cleaning
required.)
8 (Hazardous
for
shoppers/staff &
extra cleaning
required.)
6 (Extra
cleaning
required.)
Schools/colleges &
similar
10 (Hazardous
for students,
staff & extra
cleaning
required.)
6 (Extra
cleaning
required.)
6 (Hazardous
for students,
staff & extra
cleaning
required.)
6 (Extra
cleaning
required.)
Residential & similar 10 (Hazardous
for residents &
extra cleaning
required.)
8 (Extra
cleaning
required.)
10 (Hazardous
for residents &
extra cleaning
required.)
8 (Extra
cleaning
required.)
Others 8 (assumed) 6 (assumed) 8 (assumed) 6 (assumed)
Table 2.31: Sensitive premises
(iii) Public consultation and past performance
This impact is assessed using the data in Table 2.29.
(iv) Duration
This is the total number of days during construction and maintenance work when the dust level is expected to
reach the declared value.
(v) Impact assessment
Dust impact is obtained from
Net increase in dust level × Presence of sensitive buildings nearby ×
Public consultation/past performance × Duration --------------------(11)

40
Table 2.32 summarises the dust scores for Bridge 1. Also included are the results for Bridges 2 and 3. Further details
of the assumptions for these bridges can be found in Appendices D2-1 and D2-2.
Bridge Dust level Sensitive
premises
Public
consultation/contractors
performance
Duration Score
1
2
3
20
10
10
20
20
20
3
3
3
615
580
678
738,000
348,000
406,000
Table 2.32
Example 4: Dust score for Bridge 1
Calculate the dust score for Bridge 1assuming the following
ambient dust level = 150 g
declared maximum dust level = 170 g
hospital nearby
dust producing activities occur throughout the week during daytime hours
contractor has no past performance but has appointed a liaison officer to consult with the public
duration of dust nuisance : construction period - 90 days
: maintenance period – 175 days per treatment.
Thus the scores are as follows
(i) Dust level
170 – 150 = 20 g
(ii) Sensitive premises
From Table 2.31 the score is 20
(iii) Public consultation and contractor performance
From Table 2.29 it can be seen that the score is 3
(iv) Duration
No of maintenance treatments = 3
Total duration of dust nuisance = 90 + 3 × 175 = 615 days
(v) Sustainability score
The overall sustainability score for dust is
20 × 20 × 3 × 615 = 738,000

41
2.3.3.3 Noise
Noise impact is measured by considering the following32
net increase in noise level
duration of nuisance
presence of sensitive buildings nearby
public consultation and past performance
measures taken to mitigate the effect of noise.
(i) Net increase in noise level
This is given by
Maximum declared noise level - Ambient noise level
(ii) Duration
This is total number of days during construction and maintenance work the noise nuisance is likely to persist.
(iii) Presence of sensitive buildings
See Table 2.29
(iv) Public consultation and past performance
See Table 2.30
(v) Measures taken to mitigate the effect of noise
Possible measures include use of
low noise surfaces
noise walls
The mitigation factor is 1/10 for each measure employed.
(vi) Impact assessment
Noise impact is given by
Net increase in noise level × Duration × Presence of sensitive buildings nearby ×
Public consultation/past performance × Mitigation measures ------------(12)

42
Table 2.33 summarises the noise scores for Bridge 1. Also included are the results for Bridges 2 and 3. Further details
of the assumptions for these bridges can be found in Appendices C3-1 and C3-2.
Bridge Noise level
(dBA)
Duration
(days)
Sensitive
premises
Public consultation /
past performance
Mitigation
measure factor
Score
1
2
3
30
30
30
615
580
678
20
20
20
3
3
3
0.1
0.1
0.1
110,700
104,400
122,040
Table 2.33
Example 5: Noise score for Bridge 1
Calculate the dust impact score for Bridge 1assuming the following
ambient noise level = 60 dBA
declared maximum noise level = 90 dBA
duration of noise nuisance : construction period – 90 days
: maintenance period - 175 days per treatment
hospital nearby
contractor has no past performance but has appointed a liaison officer to consult with the public
noise walls deployed
(i) Net increase in noise level
90 – 60 = 30 dBA
(ii) Duration
No of maintenance treatments = 3
Total duration of dust nuisance = 90 + 3 × 175 = 615 days
(iii) Sensitive premises
From Table 2.29 the score is 20
(iv) Public consultation and contractor performance
From Table 2.28 it can be seen that the score is 3
(v) Mitigation measures
Since noise walls are to be deployed mitigation factor = 1/10.
(vi) Sustainability score
Noise impact
= 30 × 615 × 20 × 3 × 1/10 = 110,700
43
2.3.3.4 Vibration
This impact on society is quantified by considering the following four factors
vibration dose
duration of nuisance
presence of sensitive premises nearby
public consultation/contractor past performance
Vibration dose
The total vibration dose for a day is given by the formula taken from BS 6472-133
1.4at0.25
------------(13)
where
a is the rms (root mean square) acceleration
t is the duration of vibration occurrence in seconds multiplied by average number of occurrences per day
Duration
This is the number of days during construction and during maintenance work the vibration level is expected to
reach the maximum level declared.
Sensitive buildings
See Table 2.29
Public consultation and past performance
See Table 2.28
Impact assessment
The noise impact is obtained from
Vibration dose × Duration × Presence of sensitive buildings ×
Public consultation and past performance of contractor ------------(14)

44
Table 2.34 summarises the vibration scores for Bridge 1. Also included are the results for Bridges 2 and 3. Further
details of the assumptions for these bridges can be found in Appendices D4-1 and D4-2.
Bridge Vibration
dose
Duration
(days)
Sensitive
premises
Public consultation /
past performance
Score
1
2
3
6.45
6.45
6.45
615
580
678
20
20
20
3
3
3
238,005
224,460
262,386
Table 2.34
Example 6: Vibration score for Bridge 1
Calculate the vibration score for Bridge 1 assuming the following
the root mean square acceleration is 0.5
the duration of vibration occurrence in seconds is 1200 sec and the average number of
occurrences per day is 6
duration of nuisance: construction period – 90 days
: maintenance period - 175 days per treatment
hospital nearby
the contractor has no past performance but has appointed a liaison officer to consult with the
public
Vibration dose
The vibration dose is given by
= 1.4at0.25
= 1.4 × 0.5 × (1200 × 6)0.25
= 6.45
Duration
No of maintenance treatments = 3
Total duration of nuisance = 90 + 3 × 175 = 615 days
Sensitive premises
From Table 2.29 the score is 20
Public consultation and past performance
From Table 2.28 it can be seen that the score is 3
Sustainability score
Vibration impact
= 6.45 × 615 × 20 × 3 = 238,005

45
2.3.4 Calculating the sustainability score for a bridge
Table 2.35 could be used to summarise the impacts of each of the above factors for the three bridge structures.
Table 2.35 Normalised scores
In order to obtain an overall sustainability score we have to combine the scores. This is problematical because
they are measured in different units. SASS, unlike other the appraisal methods discussed in Chapter 1, is
designed to give a relative measure of sustainability rather than an absolute measure. It is used to compare the
sustainability of a number of design options or maintenance strategies.
Each environmental factor such as CO2 emitted, energy consumed or tonnage of materials consumed is
compared for each design/maintenance strategy. The comparison is carried out by a normalization technique.
Assuming the scores for a particular factor for Bridges 1, 2 and 3 are X, Y and Z respectively then the
normalized score for Bridge 1 is given by
1001ZYX
X------------(15)
Using this approach the bridge with the highest impact will have the lowest score.
These normalized scores are dimensionless and therefore can be compared with similar normalized scores for
other factors.
SASS also permits the relative weightings between the three sustainability themes (environment, economy and
society) to be varied. It also permits the relative weightings of the different factors within a sustainability theme
to be varied. Normally an equal weighting is applied to both sustainability themes and factors, however
sometimes constraints may justify non-equal weightings.
Thus, if we assume equal weightings apply to both themes and factors, the weighting factor for each of the three
themes is 1/3 or 0.33. For the economy themes there are three factors so these will have a weighting factor of
0.33/3 = 0.11 (Table 2.36).
If we assume the ratio of weighting factors for the sustainability themes is Environment 1: Society 1: Economy
2, the weighting factor for each theme is
Environment 0.25
Society 0.25
Economy 0.5
Table 2.37 shows the effect of these weightings on sustainability.
Indicators Bridge 1
Quantity Normalised
score
Bridge 2
Quantity Normalised
score
Bridge 3
Quantity Normalised
score
Environment
CO2 emitted
Energy consumed
Materials consumed
Society
Dust
Noise
Vibration
Aesthetic
Economy
Construction cost
Maintenance cost
Traffic delay cost
X
1001
ZYX
X
Y
1001ZYX
Y
Z
1001ZYX
Z

46
Indicators Bridge 1
Weighting Quantity Normalised Weighted (W) Score Score (N) (W × N)
Bridge 2 Weighting Quantity Normalised Weighted
Score Score
Bridge 3 Weighting Quantity Normalised Weighted
Score Score
Environment CO2 emitted Energy consumed Materials consumed Society Dust Noise Vibration Aesthetic Economy Construction cost Maintenance cost Traffic delay cost
0.11 0.11 0.11
0.0833 0.0833 0.0833 0.0833
0.11 0.11 0.11
17,267 250,135 2,404
738,000 110,700 238,005
-
787,200 560,726
8,762,440
64.35 64.20 68.33
50.54 67.17 67.17 74.8
55.56 75.39 65.88
7.08 7.06 7.52
4.21 5.60 5.60 6.23
6.11 8.29 7.25
0.11 0.11 0.11
0.0833 0.0833 0.0833 0.0833
0.11 0.11 0.11
13,821
203,661 2383
348,000 104,400 224,460
-
393,600 781,880
7,794,674
71.47 70.85 68.60
76.68 69.03 69.03 72.2
77.78 65.68 69.65
7.86 7.79 7.55
6.39 5.75 5.75 6.01
8.56 7.22 7.66
0.11 0.11 0.11
0.0833 0.0833 0.0833 0.0833
0.11 0.11 0.11
17,348 244,877
2803
406,000 122,040 262,386
-
590,400 935,407
9,127,138
64.18 64.95 63.07
72.79 63.80 63.80 46.6
66.67 58.94 64.46
7.06 7.14 6.94
6.06 5.32 5.32 3.88
7.33 6.48 7.09
Sustainability score 64.95 70.54 62.62
Table 2.36: Sustainability scores for Bridges 1, 2 and 3 - Weighting for Environment 1, Society 1, Economy 1.
Indicators Bridge 1
Weighting Quantity Normalised Weighted Score Score
Bridge 2 Weighting Quantity Normalised Weighted
Score Score
Bridge 3 Weighting Quantity Normalised Weighted
Score Score
Environment CO2 emitted Energy consumed Materials consumed Society Dust Noise Vibration Aesthetic Economy Construction cost Maintenance cost Traffic delay cost
0.0833 0.0833 0.0833
0.0625 0. 0625 0. 0625 0. 0625
0.1666 0.1666 0.1666
17,267 250,135 2,404
738,000 110,700 238,005
-
787,200 560,726
8,762,440
64.35 64.20 68.33
50.56 67.17 67.17 74.8
55.56 75.39 65.88
5.36 5.35 5.69
3.16 4.20 4.20 4.68
9.26 12.54 10.98
0.0833 0.0833 0.0833
0.0625 0. 0625 0. 0625 0. 0625
0.1666 0.1666 0.1666
13,821
203,661 2383
348,000 104,400 224,460
-
393,600 781,880
7,794,674
71.47 70.85 68.60
76.69 69.03 69.03 72.2
77.78 65.68 69.65
5.95 5.90 5.72
4.79 4.32 4.32 4.51
12.96 10.94 11.60
0.0833 0.0833 0.0833
0.0625 0. 0625 0. 0625 0. 0625
0.1666 0.1666 0.1666
17,348 244,877
2803
406,000 122,040 262,386
-
590,400 935,407
9,127,138
64.18 64.95 63.07
72.79 63.80 63.80 46.6
66.67 58.94 64.46
5.35 5.41 5.25
4.55 3.99 3.99 2.91
11.11 9.82
10.74
Sustainability score 65.44 71.01 63.12
Table 2.37: Sustainability scores for Bridges 1, 2 and 3 - Weighting for Environment 1, Society 1, Economy 2
47
2.4 Discussion
Sustainability is a concept that is presently not precisely defined. It is not directly measurable in the same way
that for example temperature can be measured. The three sustainability themes namely environment, economics
and society can be individually calculated but they have different units so it is not possible to combine them in a
simple way to give a measure of sustainability. In SASS the values of the component parts are normalised to
give three unitless values that can be easily combined. Before carrying out this combination it is necessary to
decide the relative importance of the three components. This is best done using engineering judgement by
consensus of a group of experts yielding a weighting factor for each component. In a similar way the constituent
parts of each of the three themes can be combined using normalisation and weighting factors.
Using this approach the normalised scores, weighting factors and sustainability scores for the three bridges
described in Chapter 2 are reported in Tables 2.36 and 2.37. The methodology described in Chapter 2 for
determining sustainability means that it is a comparative measure rather than an absolute measure. Therefore a
sustainability score for a particular structure has no significance. It is only when the sustainability scores for
different bridges are compared that a meaningful interpretation of the results is achieved. Thus we can say that
the three bridges are ranked in order of increasing sustainability. It is in this way that the sustainability of
bridges with different structural forms/material or different maintenance strategies may be compared. Thus on
the basis of Table 2.36 the following comments can be made:
Overall Bridge 2 is the most sustainable and Bridge 3 is the least sustainable overall
In terms of the environmental theme, Bridge 3 was the least sustainable and Bridge 2 the most
sustainable
In terms of the social theme, Bridge 3 was the least sustainable and Bridge 2 the most sustainable
In terms of the economic theme, Bridge 2 was the most sustainable and Bridge 3 was the least
sustainable
For each bridge the environmental factor (CO2 emitted, energy consumed and materials required) scores
were similar
For each bridge there were significant differences in the economic factors (construction, maintenance
and traffic delay cost) scores. In particular Bridge 2 has the lowest construction cost and Bridge 1 the
highest construction cost. Bridge 1 conversely has the lowest maintenance cost whereas Bridge 3 has
the highest maintenance cost. Bridge 2, however, has the lowest traffic delay cost and Bridge 3 the
highest traffic delay cost. The traffic delay costs on Bridge 1 are higher than on Bridge 2 because
Bridge 1 requires a full carriageway closure for the painting work.
Bridge 2 is clearly the most sustainable because it scores best for each of the three sustainability themes
Bridge 3 is clearly the least sustainable as it scores lowest for each of the three sustainability themes
The design of Bridge 1 has a continuous reinforced concrete deck supported on steel beams, with two
integral bank seat abutments and three piers. Bridge 2 consists of two spans of prestressed concrete
deck beams, two wall abutments and one pier. Bridge 3 has three voided reinforced concrete spans, one
wall and one bank seat abutment and two piers. These bridges are all overbridges so the dual two-lane
motorway passes under the bridge with a minor road passing over the bridge. Both roads are de-iced
with rock salt during the winter and the top surface of the bridge decks are protected from salt with
water proofing membranes. Thus the areas of concrete exposed to salt and hence vulnerable to
corrosion of reinforcing steel are (a) the lower parts of the piers and abutments facing the road and
exposed to traffic spray and (b) the deck ends and tops of piers/abutments under deck joints that have a
tendency to leak salt water from the deck. Bridges 1, 2 and 3 each have four faces of pier/abutments
facing the traffic. Bridge 1 has no joints since it has a continuous deck with integral abutments, Bridge
2 has three joints (two over abutments and one over a pier) and Bridge 3 has four joints (two over
abutments and two over piers). Therefore Bridge 1 would be expected to need the least maintenance
since only the lower parts of the piers/abutments would need maintenance. Bridge 3 would be expected
to need more maintenance than Bridge 2 because whilst both these bridges need a similar amount of
maintenance to their piers/abutments, Bridge 3 has one more deck joint than Bridge 2. The advantage
of Bridge 1 is partly countered by the requirement of its steel beams for maintenance painting, a
procedure that is also very disruptive to traffic. The above reasoning explains why maintenance cost

48
scores within the economy theme are ranked Bridge 1(highest), Bridge 2, Bridge 3 (lowest). It also
explains why the traffic delay cost scores within the economy theme are ranked Bridge 2 (highest),
Bridge 1, Bridge 3 (lowest).
From Table 2.37 (different weightings)
The overall sustainability ranking is unchanged by giving the economy twice the weighting of the
environment and society factors
Comparing the economy scores for each bridge in Table 2.36 and Table 2.37 it can be seen that
changing the weighting factors has increased the differences. Thus the economy scores for Bridge 2
that were the highest in Table 2.36 are comparatively even better in Table 2.37 when the economy
weighting factor has been increased.

49
Chapter 3: Sustainability appraisal of bridges by the SASS method – Student exercises
Introduction
Bridge construction and maintenance costs the UK economy several hundreds of millions of pounds annually
and can have significant social and environmental impacts. However design decisions continue to be dominated
by initial costs although in recent years decisions have also been based on life time costs. None or very little
account is taken of the environmental and social factors relevant to sustainable development. This is largely due
to the fact that few structural engineers know what sustainable development actually is and the lack of a clear
methodology for sustainability appraisal of civil engineering structures.
The measurement of sustainability involves combining the effects of an activity, in our case the provision of a
bridge crossing, on the environment, the economy and society. The exercises that follow deal with the
calculation of the individual themes of sustainability namely
environment
economy
society
and how they are combined to give a measure of sustainability. The way the relative priorities given to the
environment, economy and society for a particular bridge scheme affect the overall sustainability is also
investigated.
For each situation a worked example is provided as a teaching aid together with related exercises to test
understanding.
In these exercises and worked examples two phases of bridge provision are considered
construction
in-service
to give the life time sustainability.
The work presented is based on research carried out at UCL to develop a model called SASS (System for
Appraising the Sustainability of Structures) to evaluate the sustainability of civil engineering structures.
Problem
A new road bridge is required to cross a dual two lane motorway, the cross-section of which is shown in Fig. E1.
Fig. E1 Cross-section of motorway
It is to be designed to carry a two-way access road, with a total carriageway width of 7.3 m and 2.5 m wide
footpaths on both sides.
The motorway has an AADT (Average Annual Daily Traffic Flow) of approximately 80,000 vehicles in both
directions of which 20% are heavy goods vehicles (HGV). The AADT for the access road is 6,000 vehicles of
which 10% are HGV. The motorway is assumed to be closed to traffic during construction of the bridge.
The scheme is located in an area of „outstanding natural beauty‟ and since the bridge will be highly visible an
aesthetically pleasing solution is necessary. Also, the bridge site is close to a hospital.
Fig. E2 shows three possible design solutions for the bridge.

50
Bridge 1 is 64 m long and has a 225 mm thick continuous reinforced concrete deck which acts compositely with
four steel UBs (914 × 305 × 253). The substructure comprises integrated bank-seat abutments (Fig. 3) and three
intermediate wall piers (Fig. 4). The parapets are type N2 (Fig. 5).
280
mm
1440
mm
Fig. E3: Bank-seat abutment Fig. E5: Bridge parapet
Fig. E4: Wall pier
Bridge 1
Bridge 2
Bridge 3
Figure E2 - Bridge design options
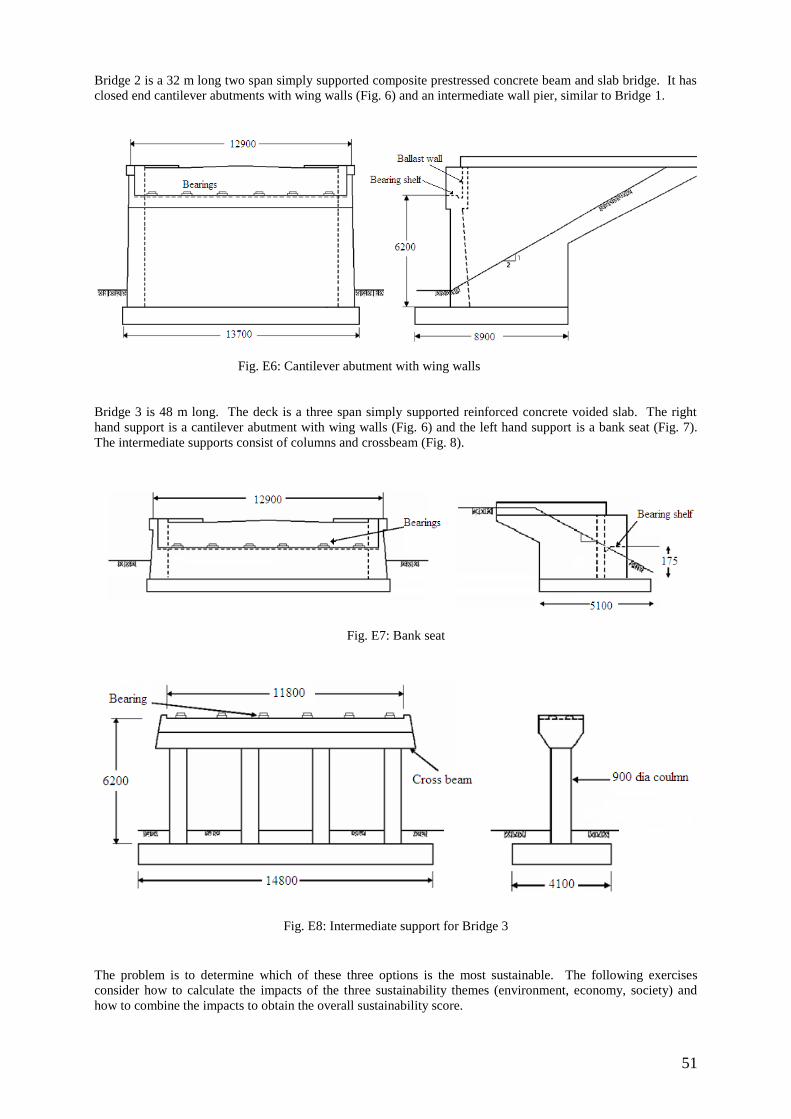
51
Bridge 2 is a 32 m long two span simply supported composite prestressed concrete beam and slab bridge. It has
closed end cantilever abutments with wing walls (Fig. 6) and an intermediate wall pier, similar to Bridge 1.
Fig. E6: Cantilever abutment with wing walls
Bridge 3 is 48 m long. The deck is a three span simply supported reinforced concrete voided slab. The right
hand support is a cantilever abutment with wing walls (Fig. 6) and the left hand support is a bank seat (Fig. 7).
The intermediate supports consist of columns and crossbeam (Fig. 8).
Fig. E7: Bank seat
Fig. E8: Intermediate support for Bridge 3
The problem is to determine which of these three options is the most sustainable. The following exercises
consider how to calculate the impacts of the three sustainability themes (environment, economy, society) and
how to combine the impacts to obtain the overall sustainability score.

52
Ex. 1: Environmental Impact
As noted above, Bridge 1 has steel beams and a reinforced concrete deck slab giving a composite action
superstructure that is continuous across the piers and integrated with bank seat pads made from reinforced
concrete (Fig. E2). The deck is reinforced with stainless steel bars; the remaining elements of the bridge are
reinforced with high yield steel bars.
In the example it is assumed that the effect of constructing this bridge on the environment is principally based on
the embodied tons of carbon dioxide (CO2) produced and the gigajoules (Gj) of energy consumed in the
production of the construction materials and similar quantities for the transportation of materials to the
construction site.
Table Ex1.1 lists the quantities of the different materials required for the construction of this bridge. Table
Ex1.2 gives the embodied tons of CO2 produced and Gj of energy consumed per unit mass of each of these
materials for production and transport to the construction site.
The values of tons of CO2 produced and Mj consumed in transport are based on the DEFRA (Department for
Environment, Food and Rural Affairs) Emission Factor for an average heavy goods vehicle (HGV) and the
DEFRA GHG (green house gas) conversion factor which gives the average diesel consumption per ton.km for an
HGV and the CO2 produced per ton.km. The energy consumed per ton.km is based on the diesel consumption
and the calorific value of diesel. In this example it is assumed that all the materials are transported 25 km to site.
Material Tonnage
OPC
Aggregate
Stainless steel reinforcement
Steel beams
High Yield Steel reinforcement
Parapets
Water proofing
Paint
357
1386
140
65
340
17
1.2
0.08
Table Ex 1.1: Construction materials
Material Production
ton of CO2 Gj of energy
Transport (per km)
ton of CO2 Gj of energy
OPC
Aggregate
Stainless steel
Steel beams
Steel reinforcement
Parapets
Water proofing
Paint
0.97
0.008
6.15
1.79
1.72
2.82
8.28
6.10
6.1
0.15
51.5
22.7
22.7
35.8
140
80
1.32 × 10⁻⁴
1.66 × 10⁻³
Table Ex. 1.2: Embodied tons of CO2 and Gj of energy per ton of each construction material for production and
transportation
The calculation of the tons of CO2 produced and Gj of energy consumed for each material used in the bridge is
straightforward involving the multiplication of the mass of material from Table Ex1.1 by the embodied CO2 per
ton of material. For example for OPC we have
357 × 0.97 = 346.29 tons of CO2
357 × 6.1 = 2177.70 Gj
The calculation of similar quantities for the transportation of materials to site is also straightforward involving
the multiplication of the relevant figures from Tables Ex1.1 and 1.2 by the transport distance, assumed to be 25
km in this example, thus giving
357 × 1.32 × 10-4
× 25 = 1.18 tons of CO2
357 × 1.66 × 10-3
× 25 = 14.82 Gj
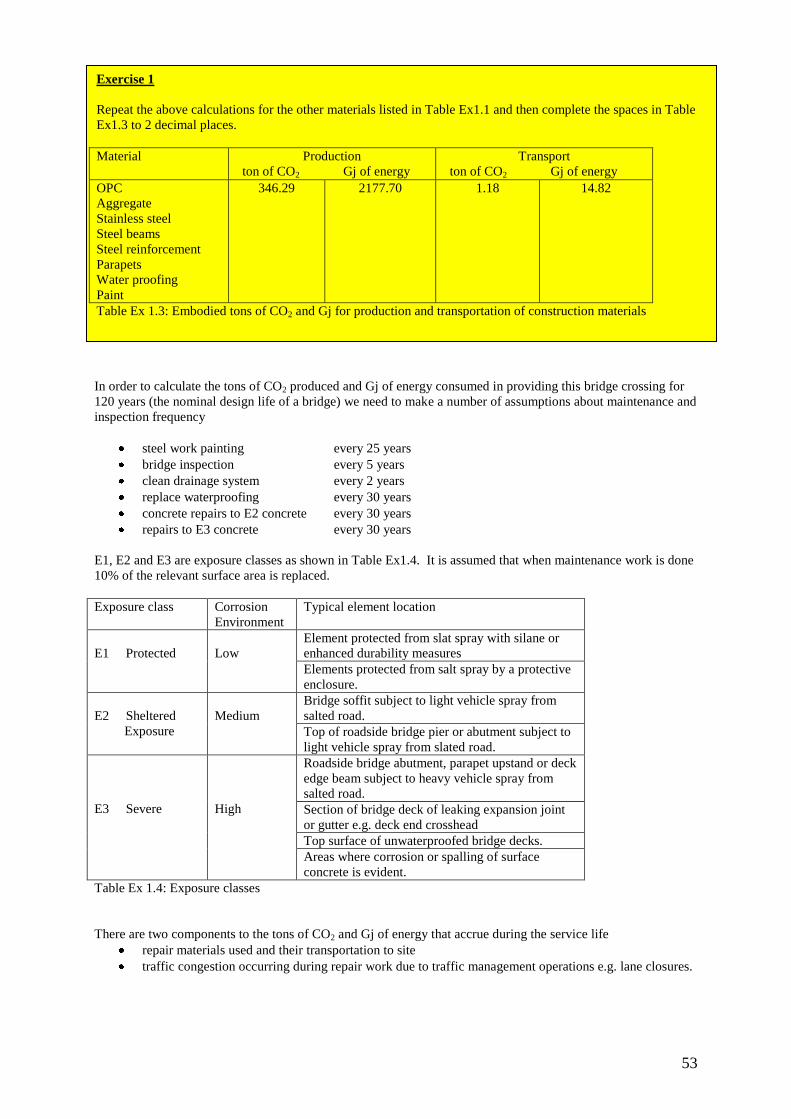
53
In order to calculate the tons of CO2 produced and Gj of energy consumed in providing this bridge crossing for
120 years (the nominal design life of a bridge) we need to make a number of assumptions about maintenance and
inspection frequency
steel work painting every 25 years
bridge inspection every 5 years
clean drainage system every 2 years
replace waterproofing every 30 years
concrete repairs to E2 concrete every 30 years
repairs to E3 concrete every 30 years
E1, E2 and E3 are exposure classes as shown in Table Ex1.4. It is assumed that when maintenance work is done
10% of the relevant surface area is replaced.
Exposure class Corrosion
Environment
Typical element location
E1 Protected
Low
Element protected from slat spray with silane or
enhanced durability measures
Elements protected from salt spray by a protective
enclosure.
E2 Sheltered
Exposure
Medium
Bridge soffit subject to light vehicle spray from
salted road.
Top of roadside bridge pier or abutment subject to
light vehicle spray from slated road.
E3 Severe
High
Roadside bridge abutment, parapet upstand or deck
edge beam subject to heavy vehicle spray from
salted road.
Section of bridge deck of leaking expansion joint
or gutter e.g. deck end crosshead
Top surface of unwaterproofed bridge decks.
Areas where corrosion or spalling of surface
concrete is evident.
Table Ex 1.4: Exposure classes
There are two components to the tons of CO2 and Gj of energy that accrue during the service life
repair materials used and their transportation to site
traffic congestion occurring during repair work due to traffic management operations e.g. lane closures.
Exercise 1
Repeat the above calculations for the other materials listed in Table Ex1.1 and then complete the spaces in Table
Ex1.3 to 2 decimal places.
Material Production
ton of CO2 Gj of energy
Transport
ton of CO2 Gj of energy
OPC
Aggregate
Stainless steel
Steel beams
Steel reinforcement
Parapets
Water proofing
Paint
346.29
2177.70
1.18
14.82
Table Ex 1.3: Embodied tons of CO2 and Gj for production and transportation of construction materials

54
Material Tonnage
OPC
Aggregate
Parapets
Water proofing
Paint
19
72
6
0.36
0.03
Table Ex. 1.5: Life time quantities of repair materials
The second of these components arises because fuel consumption of the vehicles using the bridge increases at
low speeds with stop-start driving.
The quantities of materials needed over the life time of the bridge are given in Table Ex1.5.
Inspection and drain cleaning do not consume materials. Stainless steel is maintenance free. The values of
service life production of CO2 and energy consumption for the repair materials are calculated as before using
Tables Ex1.2 and 1.5.
The quantities of extra CO2 produced and energy consumed as a result of traffic congestion during maintenance
work depends on
duration of maintenance work over life time in days
length of road with traffic management
flow of HGV per day and the normal kg of CO2 per km produced
flow of other vehicles per day and the normal kg of CO2 per km produced
additional emissions and fuel consumption during maintenance work (assumed to be 30% of normal
values)
whether or not the work is carried out during off-peak hours
kg of CO2 emitted per km by HGV and other vehicles (respectively, 0.906 and 0.2042)
kg of CO2 emitted per litre of fuel
calorific value of the fuel
density of fuel
The last four quantities are used to calculate the energy consumption factor for HGV‟s as 14 Mj per km and for
other vehicles it is 3 Mj per km.
Waterproofing and parapet work will cause negligible congestion because they are carried out from the top
surface of the bridge where traffic flows are comparatively low.
We use the information in Table Ex1.7 and the figures for energy consumption per km for HGV and other
vehicles to calculate the traffic congestion component of the effect on the environment of providing the bridge
for 120 years.
Exercise 2
Calculate the values of CO2 emissions and energy consumption for each repair material and insert your
answers in Table Ex1.6.
Material Embodied
ton of CO2 Gj of energy
Transport
ton of CO2 Gj of energy
OPC
Aggregate
Parapets
Water proofing
Paint
Table Ex. 1.6: Tons of CO2 emitted and Gj of energy consumed in providing repair materials

55
Consider bridge inspections, for example, the extra HGV emissions as a result of the congestion caused by
inspections is calculated as follows
92 (Table Ex1.7) × 0.2 (Table Ex1.7) × 0.3 (extra fuel consumption) × 0.25 (off-peak coefficient) ×
16,000 (Average HGV flow per day) × 0.906 (kg of CO2 per HGV per km)
= 20,004 kg of CO2
The extra energy consumed by HGVs as a result of traffic congestion during maintenance work is calculated as
follows
92 days × 0.2 km × 0.3 (extra fuel consumption) × 0.25 (off-peak coefficient) × 16,000 vehicles per day
× 14 Mj per km (average energy consumption of an HGV) × 10-3
= 309.12 Gj
Maintenance Activity Lifetime duration
(days)
Length of traffic
management (km)
Inspection
Concrete repair
Painting
92
525
88
0.2
3
3
Table Ex. 1.7: Duration and length of the closure required for maintenance work
Exercise 3
(i) Repeat the above calculations for the other maintenance activities and enter your results in Table Ex1.8.
Activity HGVs
kg of CO2 Gj of energy
Other vehicles
kg of CO2 Gj of energy
Total
kg of CO2 Gj of energy
Inspection
Concrete repair
Painting
20,004
309.12
Table Ex. 1.8: Tons of CO2 emitted and Gj of energy consumed in providing repair materials
(ii) Compare the results in your completed versions of Tables Ex1.3, Ex1.6 and Ex1.8 and
a) decide whether construction and maintenance has most effect on the environment over the life time of the bridge
b) whether the use of repair materials or the congestion resulting from traffic management has the greater effect on the
environment, which materials and maintenance activities have the greatest effect on the environment and make
suggestions about how to reduce the impact on the environment
c) find the total tonnage of materials used over the lifetime of the bridge from Tables Ex1.1 and Ex1.5
d) list other key factors associated with construction and maintenance operations which could adversely affect the
environment and in each case discuss how the impact might be evaluated.

56
Ex 2. Economic Impact
The total cost of a bridge over its lifetime comprises three main components
cost of construction
cost of maintenance
cost of traffic delays caused by maintenance work.
The latter two costs are discounted to take account of when, during the life of the bridge, the costs occurred.
The construction cost is relatively straightforward to calculate and in this exercise is given as £ 787,200.
The maintenance cost is more complicated to calculate as it depends on the type of maintenance and the
frequency of its application.
Exercise 4
In Table Ex2.1 you are given
the maintenance activities for this bridge
the frequency at which they need to be applied
the cost of a single maintenance treatment.
You are required to calculate the total maintenance cost for each activity to achieve a 120 years life for the bridge.
This involves finding the age of the bridge when each activity is needed and then discounting the cost of the single
maintenance activity based on this age. The discount rates for different ages are given in Table Ex2.2 taken from
the Treasury‟s Green Book. The total lifetime cost for all the maintenance activities is then obtained by summing
the single application costs over the lifetime both with and without discounting. You should use the following
formula and Table Ex2.2 to carry out the discounting
Discount cost = ni
tedUndiscount
1
cos -----------(E1)
where
i is the discount rate
n is the age of the bridge when the maintenance activity is carried out.
For example the discounted cost of the inspection carried out when the bridge is 40 years old is given by
Discount cost = 30.3801£40
%0.31
3104.12
The inspection row in Table Ex2.1 has been completed for you. You are required to complete the rest of the
Table.
Activity Frequency
(years)
Cost of single
application (£)
Age of bridge at
each application
Life time
cost (£)
Discounted life
time cost (£)
Inspection
Concrete repair
Painting
Drain cleaning
5
30
25
2
12,400
655,000
58,000
1,200
5, 10, etc ….. 115 285,200 76,935
Table Ex. 2.1: Cost and frequency of application of maintenance activity
Age (years) Discount
rate (%)
0 - ≤ 30
30 - ≤ 75
75 - ≤ 125
3.5
3.0
2.5
Table Ex. 2.2: Discount rates for different ages

57
Some types of maintenance activity cause traffic congestion as a result of lane closures to provide access to parts
of the bridge or for the protection of workers. The extent of this disruption depends on
the number of lanes closed
the total number of lanes
whether or not there is contraflow working
the length of the lane closure
the average daily traffic flow
the proportion of the traffic that are HGVs.
The Department for Transport‟s computer program called QUADRO takes these factors into account to calculate
the monetary consequences of the delays caused by the disruption to traffic for each day the disruption lasts.
The DfT has also produced tables which can be used in lieu of running QUADRO (see Appendix B). As the
costs in these tables are based on 1998 prices, however, the values should be increased in line with inflation.
Thus, the delay cost for painting shown in Table Ex 2.3 is based on Table 31 and has been adjusted for inflation.
Concrete repairs will cause traffic disruption on and below the bridge. The delay cost for concrete repair shown
in Table 2.3 has been obtained using, respectively, Tables 42 and 28, and adjusted for inflation. It is assumed
that inspection work will be carried out during off-peak hours and therefore the delay cost for inspection given in
the table has been obtained from Table 32 and adjusted for inflation and off-peak working.
For this bridge it is assumed that drain cleaning can be carried out from the top of the deck which causes little
disruption because of the relatively low flow of traffic over the bridge compared with under the bridge.
Table Ex2.3 gives the duration in days of the lane closures for each maintenance activity, the length of the lane
closure in km and the user delay cost per day assuming an average daily traffic flow of 80,000 under the bridge
of which 20% are HGVs.
Maintenance
activity
Length of
lane closure
(km)
Delay
cost per
day (£)
Duration of
closure for each
activity (days)
Delay cost
for each
activity (£)
Lifetime
delay cost
(£)
Discounted
lifetime delay
cost (£)
Inspection
Concrete repair
Painting
0.2
3
3
33,900
36,100
201,400
4
175
23
135,600 3,118,800 841,326
Table Ex. 2.3: Traffic delay costs
The delay cost for each activity is obtained by multiplying the delay cost per day by the number of days each
activity takes and the lifetime delay cost by further multiplying by the number of treatments needed in the 120
years life of the bridge. The discounted delay costs are calculated as before (Exercise 4) on the basis of age of
the bridge when maintenance is carried out using equation (E1) and Table Ex2.2. The discounted costs for a
maintenance activity carried out at different ages are then summed to give the discounted lifetime cost for this
activity.
Exercise 5
(i) Row 1 of Table Ex2.3 has been completed for you and now you are required to complete the rest of the Table.
(ii) From your result
a) sum the construction cost, maintenance cost and traffic delay cost for each activity over the 120 year life
(discounted and non-discounted cost)
b) calculate the grand total lifetime cost for the bridge (discounted and non-discounted)
c) comment on the contributions to the total made by construction, maintenance and traffic delay
d) comment on the contributions made to service life costs of maintenance and traffic delay costs
e) suggest ways of reducing the lifetime cost of a bridge and whether or not they may influence environmental and
social aspects of sustainability.
(iii) List any other economic factors which should be considered and in each case discuss how the impact on sustainability
might be measured.
(iv) The discounted lifetime delay costs in Table Ex 2.3 assume that the base year for discounting is 2009. However, the
Highways Agency recommends that the base year for discounting should be the Department for Transport‟s standard base
year which is currently 2002. Recalculate the discounted delay cost for inspection assuming the base year is 2002.

58
Ex3. Societal Impact
The construction and maintenance of a bridge over its lifetime can have an impact on people living nearby. The
main impacts are due to
dust
noise
vibration
aesthetic
The following describes how these impacts are quantified.
(i) Aesthetics
This impact is measured by considering the following
percentage of guidelines followed
past performance and the provision of a liaison officer
The guidelines recommended for bridge aesthetics are shown in Tables Ex3.1-3.3 and refer respectively to the
following features
The bridge as a whole 8 guidelines
The bridge and its surroundings 23 guidelines
The parts and details of a bridge 36 guidelines
Note that not all guidelines will be relevant to a particular scheme and should therefore not influence the
assessment.
Each aspect contributes 25% to the total score for this provision of sustainability (Table Ex 3.4).
The remaining 25% is obtained from past performance/provision of liaison officer in accordance with the scores
shown in Table Ex3.5. Note that in this case the lower the score the smaller the impact, hence the score is
subtracted from 1 to give a score such that the higher the score the smaller the impact.
Example: Aesthetics
Determine the aesthetics score for the bridge assuming the following
bridge as a whole 6 out of 8 guidelines observed
bridge and its surroundings 20 out of 23 guidelines observed
parts and details of a bridge 30 out of 36 guidelines observed
the designer has no past performance but has appointed a liaison officer to consult with the public
the scores are as follows
Guidelines
Design feature Number of guidelines
observed
Percentage of guidelines
observed
Score
Bridge as a whole
Bridge and its surroundings
Parts and details of a bridge
6
20
30
(6/8)100 = 75
(20/23)100 = 87
(30/36)100 = 83
75 × 25% = 18.75
87 × 25% = 21.75
83 × 25% = 20.75
Past performance and public consultation
From Table Ex3.5 it can be seen that the score is 3 out of 10 giving an impact of 5.17%2510
31
The overall sustainability score for aesthetics is obtained by adding the score for each aspect, giving
18.75 + 21.75 + 20.75 + 17.5 = 78.75

59
Individual aspects Score
1,1,1 - Excessive imbalanced proportions between significant elements
should be avoided as much as possible.
1,1,2 - Similar proportions or ratios throughout the structure can create a
harmony.
1,1,3 - The ratio of Deck to Parapet Depth is also considered a significant
aesthetic proportion and guidelines have been developed by Cardiff
University School of Engineering
1,1,4 - the Span to Depth ratio is determined by the structural design. The
value of the span-to-depth ratio can be an indicator of aesthetic design. The
general agreement among bridge design experts states that span-to-depth
ratio between 15 and 30 provi
1,4,2 - Honesty of form is about the materials and structures to look like what
they are.
Justifications/Actions for
the scores (text or
drawing no.)
1,3,1 - to achieve a consistent order, bridge spans should match where
possible. Also, the interaction of bridge elements like lighting columns,
barrier supports and piers should be considered.
1,2,1 - it must be considered as an important aesthetic indicator because
symmetrical bridges are often more aesthetically pleasing than non
symmetricals.
1,4,1 - The complexity of a bridge should be minimized especially in natural
landscape settings as it tends to attract the eye and competes with views of
the landscape.
Table Ex3.1: Guidelines for Bridge as a whole
Exercise 6
For Bridge 1 (see Fig. E2)
(i) Determine which, if any, of the guidelines in Tables Ex3.1-Ex 3.3 should be excluded from
consideration.
(ii) Provisionally establish the guidelines which will be observed in the final design and during
the construction phase of the bridge.
(iii) Assuming the designer has a good record of past performance but that there are no specific
provisions to liaise with the public, calculate the overall sustainability score for aesthetics.
List any assumptions.

60
2,1,1 - Make the bridge as invisible as possible to hide it in the landscape.
(suits to smaller bridges)
2,1,2 - Make the bridge as simple and elegant as possible to complement the
landscape: This approach is a practical, cost effective objective for
overpasses and larger bridges and can lead to good looking bridge
solutions.
2,1,3 - Maximize views of the landscape through the bridge: By minimizing
the profile of the bridge, the landscape setting will dominate the view and be
appreciated from all viewpoints.
2,1,4 - Bridges with a horizontal form are generally preferable to bridges on a
grade over flat simple landscapes and significant expanses of water
2,1,5 - Significant stands of existing vegetation should be retained
2,1,6 - Footprint of the bridge (e.g. pile caps, abutments) should be minimized
so that the retention of local vegetations maximized.
2,1,7 - The presence and extent of intermediate structures and hard surfaces
between the bridge and landscape should be minimized.
2,1,8 - Careful design of earthworks and planting and the selection of
endemic species grown from locally collected seed.
2,2,1 - A landmark structure should be created in a way that complements or
contrasts with its visual catchments.
2,2,2 - Maximizing views from the bridge of the local urban setting
2,2,3 - Maximizing views through the bridge from the urban setting
2,2,4 - Respecting locally valued structures and their cartilages by
complementing local styles and materials
2,2,5 - Ensuring the space under the bridge is not dark, degraded and unsafe.
2,3,1 - In such cases plants should be located to the outside of the space and
irrigation may be required.
2,3,2 - Combining planting with a hard paved or gravel surface is often
appropriate.
2,3,3 - Clean uncluttered surfaces, neat connections and simple layout of
girders will help to give a neat appearance.
2,3,4 - When designing the soffit, consider bracing, when it is required, and
ensure an orderly and regular pattern where possible.
2,4,1 - Short span (up to approximately 18m): prestressed concrete plank
bridges.
2,4,2 - Short to medium span (approximately 18-40m): pre-stressed concrete
girders or pre-stressed concrete voided slabs.
2,4,3 - Medium span (approximately 40-80m): ste
Table Ex3.2: Guidelines for Bridge and its surroundings

61
3,1,1 - They should appear as continuous uninterrupted lines, extending the
full length of the bridge with a generous overlap of the abutments.
3,1,2 - A neat, sharp edge will help define them against the background.
3,1,3 - Maximizing the shadow cast on the superstructure will further
accentuate and express their form.
3,1,4 - The outer face should be a smooth single plane surface, slanted
slightly outwards towards the bottom, to better catch the sunlight.
3,1,5 - The top should angle towards the road, to channel rainwater onto the
bridge, minimizing staining of the outside face.
3,1,6 - If the deck soffit is visually complex, consideration should be given to
hiding this complexity, by extending the parapet soffit below the deck soffit.
3,2,1 - In the elevation, hunched girders are expressive and responsive to the
forces in the bridge. They can often be more distinctive and elegant than
single depth beams.
3,2,2 - Three or five span haunches are aesthetically very elegant balanced
structures.
3,2,3 - In cross section, if the girder is right angled it can catch the light and a
double line may be visible. Maximizing the overhang will increase the
shadow. A curved soffit will provide a gradation of tone and minimize a sharp
line at the base of th
3,3,1 - In an urban area that vertical forms are present and only close views
available, headstock may provide a reassuring sense of strength and
durability, as well as visual interest.
3,3,2 - In a rural area where horizontal forms predominate, headstock can be
overly complex and should be carefully considered and designed with their
visual impact in mind, or avoided.
3,3,3 - If possible headstocks should not extend across the outer face of the
girder. This introduces unnecessary complexity and appears in elevation as
if the headstock is supporting the deck rather than the girder.
3,4,1 - Bridges which have pier spacings or spans which are roughly
proportional to the bridge's height above ground level are more aesthetically
pleasing than bridges which do not follow this proportion. They seem more
responsive to their context.
3,4,2 - Collecting multiple piers into pairs or clusters can open up views
below the deck and also give rhythm and elegance to the supports.
3,4,3 - Rounding off the corners of rectangular piers provides a softer form,
which may be preferable in certain contexts. For example where the
presence of the pier needs to be down played so that superstructure is
dominant, e.g. in a rural setting.
3,4,4 - Pier shapes which have a slight taper (A taper of around 1:80) are
desirable.
3,4,5 - The reverse taper should only be used where the appearance of
rigidity is required between superstructure and pier. Otherwise the
appearance of the top heavy pier can be imbalanced and does not reflect the
forces acting on the pier well.
3,5,1 - The proportion of pier size to pile cap size should be considered.
Imbalanced proportions should be avoided.
3,6,1 - If using of wall abutments is unavoidable the use of planting should
be considered to screen the abutment walls.
3,6,2 - Reducing the abutments can create a more refined and better looking
bridge. It does however increase the span and therefore depth of beam.
3,6,3 - Continuing the superstructure or the parapet allows the shadow line
to reduce the dominance of the abutment, and makes the bridge appear
longer and more elegant.
3,6,4 - Angling the abutments provides a more open sleek look and helps
visually anchor the span.
3,6,5 - Spill through abutments allow open views to the landscape and better
visibility to the road beyond.
3,6,6 - slight angle on the taper can make the wall appear less dominating
especially if next to a footpath. This avoids visual crowding.
3,8,2 - The screens should extend to the ends of the bridge span and
consideration should be given to integrating the bridge barrier and safety
screens.
3,9,1 - Where possible lighting on bridges should be minimized or avoided.
3,9,2 - If necessary lighting should be used in the median as far from the
parapet as possible to reduce clutter or designed into the parapet structure.
3,9,3 - If considerable effort is put into the design of the appearance of the
bridge it is better value for money to allow the bridge to be viewed at night
(dependent on context, cost, safety and environmental issues).
3,11,1 - Where possible avoid the use of noise walls on bridges.
3,12,2 - A neutral palette of black, gray and white tend to give a clear
definition of the bridge as an object in the landscape.
3,10,1 - The colour and grade of the pipe system must be considered as
these aspects can jar with the overall bridge design.
3,11,2 - The use of transparent panels should be considered so that the
apparent slenderness of the superstructure is not affected.
3,8,1 - An outward curving screen creates a more open feeling for bridge
users. However it presents a greater apparent depth of structure for
onlookers.
3,5,2 - In a tidal watercourse, if the view of the piles is to be minimised, the
pile cap may require a skirt as they need to be visible to boats and shipping
as a safety measure.
3,12,1 - Landscape tones are generally subdued and dark; therefore light
colours and textures (for bridge primary elements) provide a good contrast.
(the exception is when they are culturally appropriate such as traditional
Chinese bridges or unique icon
3,7,1 - With the exception of name plates and navigation signs, signage
should be kept off bridges as far as possible. They add clutter and
complexity and detract from the structure. They also obstruct views from the
bridge.
Table Ex3.3: Guidelines for Bridges: The parts and details
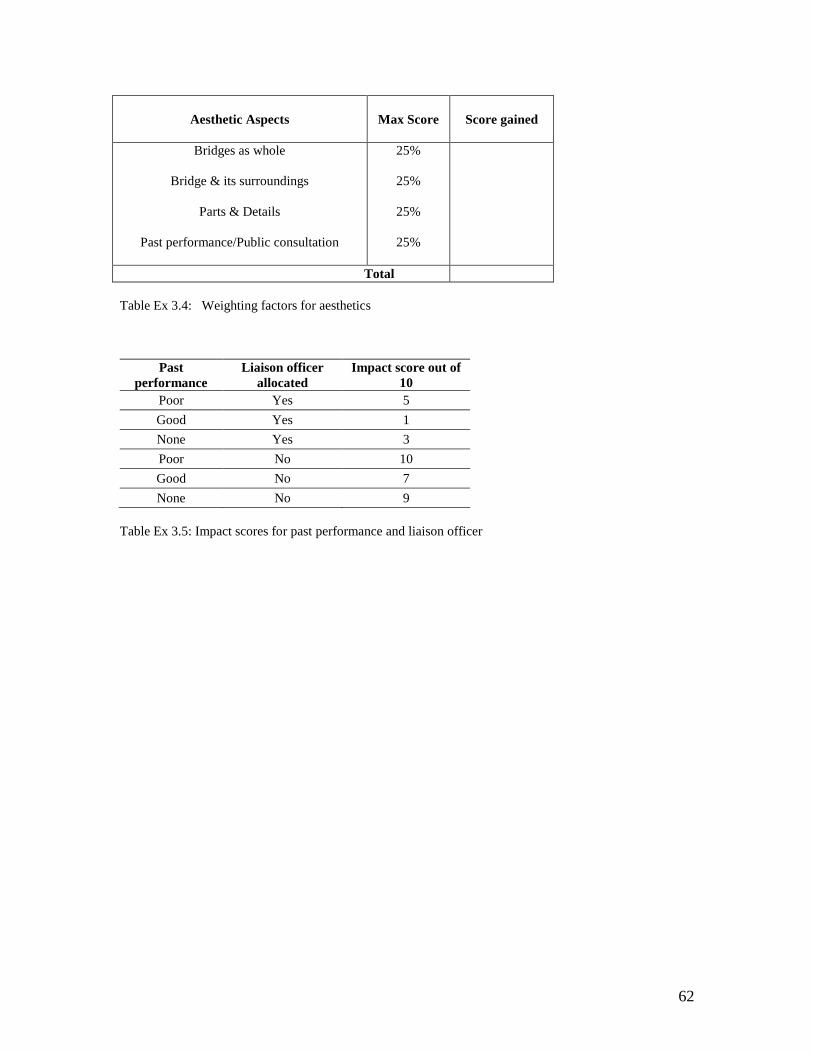
62
Aesthetic Aspects
Max Score
Score gained
Bridges as whole
Bridge & its surroundings
Parts & Details
Past performance/Public consultation
25%
25%
25%
25%
Total
Table Ex 3.4: Weighting factors for aesthetics
Past
performance
Liaison officer
allocated
Impact score out of
10
Poor Yes 5
Good Yes 1
None Yes 3
Poor No 10
Good No 7
None No 9
Table Ex 3.5: Impact scores for past performance and liaison officer

63
(ii) Dust
This impact is quantified by considering the following four factors
the net increase in dust level
the presence of sensitive buildings nearby (Table Ex3.6)
public consultation and past performance of contractor (Table Ex3.7)
duration of dust nuisance
The relevant assumptions for this bridge are
the ambient dust level is 150 g and the maximum expected dust level during construction and
maintenance does not exceed 170 g
it is in the vicinity of a hospital
dust producing activities are carried out during the daytime during weekdays and at weekends
the contractor has no past performance but has appointed a liaison officer to consult with the
public
duration of dust nuisance : construction period - 90 days
: maintenance period – 175 days per treatment.
Thus the scores are as follows
Dust level
20150170
Sensitive premises
From Table Ex3.6 the score is 20
Public consultation and contractor performance
From Table Ex3.7 it can be seen that the score is 3
Duration
No of maintenance treatments = 3
The score is (90 + 3 × 175 = ) 615 being equal to the total duration of dust nuisance.

64
Type of
Sensitive
Premises
Working Time/Period
Weekday Weekend
Day Night Day Night
Hospital,
Caring
homes &
Similar
premises
10 (Hazardous
for patients.)
10
(Hazardous
for
patients.)
10 (Hazardous for
patients.)
10
(Hazardous
for
patients.)
Offices &
Similar
premises
8 (Hazardous for
staff & extra
cleaning
required.)
6 (Extra
cleaning
required.)
6 (Extra cleaning
required.)
6 (Extra
cleaning
required.)
Commercial
/ Businesses
& Similar
premises
8 (Hazardous for
shoppers, staff
& extra cleaning
required.)
6 (Extra
cleaning
required.)
8 (Hazardous for
shoppers/staff &
extra cleaning
required.)
6 (Extra
cleaning
required.)
Schools/
Colleges &
Similar
premises
10 (Hazardous
for students,
staff & extra
cleaning
required.)
6 (Extra
cleaning
required.)
6 (Hazardous for
students, staff &
extra cleaning
required.)
6 (Extra
cleaning
required.)
Residential
& Similar
premises
10 (Hazardous
for residents &
extra cleaning
required.)
8 (Extra
cleaning
required.)
10 (Hazardous for
residents & extra
cleaning required.)
8 (Extra
cleaning
required.)
Others: 8 (assumed) 6
(assumed) 8 (assumed)
6
(assumed)
Table Ex3.6: Sensitive premises
Past
performance
Liaison officer
allocated
Impact score out of
10
Poor Yes 5
Good Yes 1
None Yes 3
Poor No 10
Good No 7
None No 9
Table Ex3.7: Past performance and public consultation

65
(ii) Noise
This impact on society is quantified by considering five factors as follows
1) the net increase in noise level
2) the time the impact is present
3) the presence of sensitive buildings nearby
4) public consultation and past performance
5) measures taken to mitigate the effect of noise.
Factors (2), (3) and (4) are the same as for dust and are calculated in the same way. Thus the scores for
these factors are respectively 615, 20 and 3.
Net increase in noise level
Assuming the ambient noise level is 60 dBA and the maximum expected noise level is 90 dBA during
construction and maintenance work, the score is
90 – 60 = 30
Measures taken to mitigate the effect of noise
Two measures are commonly used
low noise surfaces
noise walls
The score for this factor is obtained by allowing one tenth for each of the above measures. For this bridge
it is assumed that only low noise surfaces are used to mitigate the effect of noise so the score is 1/10.

66
(iii) Vibration
This impact on society is quantified by considering four factors
vibration dose
duration
presence of sensitive premises nearby
public consultation/contractor past performance
The scores for the last three factors are the same as for dust and noise. The scores are respectively 615, 20
and 3.
The total vibration dose for a day is given by the formula
1.4at0.25
------------(2)
where
a is the rms (root mean square) acceleration
t is the duration of vibration occurrence in seconds multiplied by average number of occurrences
per day (respectively, 1200 sec and 6 in this case).
Thus the vibration dose is
1.4 × 0.5 × (1200 × 6)0.25
= 6.45
Exercise 7
(i) From the above information calculate the overall impact scores for dust, noise and vibration.
(ii) Compare the impacts of aesthetics, dust, noise and vibration and comment on how the impacts could be
reduced and what consequences this may have for the environmental and economic impacts.

67
Ex4. Calculating the sustainability score for a bridge
Exercises 1-3 have determined the impact scores of providing a bridge for 120 years on the environment,
economy and society. In order to obtain an overall sustainability score we have to combine these three
scores. This is problematical because they are measured in different units. SASS, unlike other appraisal
methods such as BREEAM and CEEEQUAL, is designed to give a relative measure of sustainability rather
than an absolute measure. It is used to compare the sustainability of a number of bridge designs or
maintenance strategies.
Each environmental factor such as CO2 emitted, energy consumed or tonnage of materials consumed is
compared for each design/maintenance strategy. The comparison is carried out by a normalization
technique.
Assuming the cost of construction of the three bridge designs 1, 2 and 3 to be £787 200, £393 600 and £590
400 respectively then the normalized score for Bridge 1 is given by
%6.55100400590600393200787
2007871
Using this approach the bridge with the highest cost of construction will have the lowest score.
These normalized scores are dimensionless and therefore can be compared with similar normalized scores
for other economy, environment and society factor.
Exercise 8
(i) Enter your results for Bridge 1 in Table Ex 4.1
(ii) Using the information in Table Ex4.1 calculate the normalized score for the other factors using the method above and
insert the values in Table Ex 4.1 for Bridges 1, 2 and 3.
Indicators Bridge 1
Quantity Normalised
score
Bridge 2
Quantity Normalised
score
Bridge 3
Quantity Normalised
score
Environment
CO2 emitted
Energy consumed
Materials consumed
Society
Dust
Noise
Vibration
Aesthetic
Economy
Construction cost
Maintenance cost
Traffic delay cost
787,200
55.6
13,821
203,661
2383
348,000
104,400
224,460
62.2
393,600
781,880
7,794,674
17,348
244,877
2803
406,800
122,040
262,386
46.5
590,400
935,407
9,127,138
Table Ex4.1: Normalized scores for Bridges 1, 2 and 3

68
SASS also permits the relative weightings between the three sustainability themes (environment, economy
and society) to be varied. It also permits the relative weightings of the different factors within a
sustainability theme to be varied. Normally an equal weighting is applied to both sustainability themes and
factors, however sometimes constraints may justify non-equal weightings.
In the example given in Table Ex4.1 we will initially assume equal weightings apply to both themes and
factors. Thus the weighting factor for each of the three themes is 1/3 or 0.33. For the economy themes
there are three factors so these will have a weighting factor of 0.33/3 = 0.11.
Exercise 9
(i) Determine the weighting factors for the environment and society factors and insert them in Table
Ex4.2.
(ii) Determine the weighted score for each factor by multiplying the normalized score by the weighting
factor, for example the weighted score for cost of construction is given by
55.6 × 0.11 = 6.1 for Bridge 1
and insert your values in Table Ex4.2.
(iii) Sum all the weighted scores to give a sustainability score for each bridge and rank the three
bridges in order of decreasing sustainability.
Exercise 10
Assume the economy is constrained and hence has a higher weighting factor compared with the other
themes. Assume the ratio of weighting factors for the sustainability themes is environment 1: society
1: Economy 2. Therefore the weighting factor for each theme is
Environment 0.25
Society 0.25
Economy 0.5
You should now determine
the weighting factors for each bridge as before
the weighted score for each bridge
the sustainability score for each bridge
Enter your values in a revised version of Table Ex4.2 and comment on how the weighting factors have
changed the sustainability ranking of the three bridges.

69
Indicators Bridge 1
Weighting Quantity Normalised Weighted Score score
Bridge 2 Weighting Quantity Normalised Weighted
Score score
Bridge 3 Weighting Quantity Normalised Weighted
Score score
Environment CO2 emitted Energy consumed Materials consumed Society Dust Noise Vibration Aesthetic Economy Construction cost Maintenance cost Traffic delay cost
Table Ex. 4.2: Normalised scores for Bridges 1, 2 and 3

70
Commentary on exercises
The commentary provided below on these student exercises suggests some ways in which environmental,
economic and social impacts may be reduced. The commentary also highlights the interconnectedness of the
three sustainability components so that a change introduced in order to reduce, say, the environmental impact
may have an adverse effect on the economics or social components. In a similar way the use of more durable
design materials aimed at reducing lifetime maintenance costs may have an adverse affect on the environment.
It is important to know whether construction or maintenance is the major contributor to environment
degradation. If construction was the major contributor then alternative design materials could be considered.
For example carbon fibre type reinforcement may be less harmful for the environment; steel bridges may be
more harmful than concrete bridges. Masonry bridges may be the least harmful. Different materials may
influence the cost of construction, maintenance frequency and design characteristics such as span length. Thus
all these factors must be considered.
If maintenance was the major contributor to environmental degradation then more durable design materials could
be considered. These would reduce the maintenance frequency and associated traffic delays. Corrosion of steel
is the main cause of bridge deterioration requiring maintenance work. The onset of corrosion can be delayed and
its subsequent rate of progress reduced by modifying the design materials or incorporating protective measures.
For example using better quality concrete with lower water/cement ratio or a greater depth of concrete cover will
slow the rate of chloride ion ingress, increase the time to corrosion and reduce the number of maintenance
treatments. The use of stainless steel instead of mild steel will prevent corrosion and eliminate maintenance
work resulting from corrosion. Dosing the concrete with corrosion inhibitors can have a similar effect. The
reduction in maintenance achieved by using these modifications of the design materials would have to be
balanced against their higher embodied CO2, energy and cost. The use of more efficient maintenance treatments
with longer lives will also reduce maintenance frequency. For example cathodic protection could be compared
with the traditional method, concrete repair. The impact of more durable materials or repair methods on lifetime
cost would also have to be taken into account.
If traffic delay costs are the major contributor to poor sustainability attempts would be needed to reduce
maintenance frequency and the time for which traffic lanes are closed to traffic or diversions are in operation.
This could be achieved by using more durable materials, improved repair methods and faster methods for repair
work. Night time working is a useful way of limiting traffic delay costs. Traffic delay costs may increase over
the life of the bridge due to increased traffic flows or proportion of HGV‟s, although discounting costs will have
the opposite effect. The impact of traffic diversions as opposed to lane closures could be compared with respect
to costs and environmental impact. For example if a suitable alternative route is available it may be better to
divert some or all of the traffic thereby allowing the repairs to be made more quickly. Diverted traffic, especially
if it includes HGV‟s, can cause problems such as noise, fumes and vibrations to buildings and people on the
alternative route. This may be important if there are sensitive buildings such as hospitals or schools on the
alternative route. Slow moving traffic caused by lane closures during maintenance work also results in a higher
level of exhaust pollutants such as oxides of nitrogen and sulphur as the fuel is burnt less efficiently in the
internal combustion engine. The higher frequency of accidents of traffic passing through maintenance work or
on diversions also needs to be taken into account.
The availability of natural resources for bridge construction materials is not a major problem. There are
adequate supplies of iron ore, coal, clay and aggregates. In densely populated built environments such as the UK
the extraction of gravel aggregates is a problem not because of an insufficient supply but owing to the land take
involved in its extraction. This has resulted in the use of recycled and sea dredged aggregates. The latter
requires washing to remove sea salts that could cause corrosion of the reinforcing steel and this places a heavy
demand on clean water, a limited resource in many countries.
Lifecycle costs may be reduced by using more durable materials, as previously discussed, since this will reduce
the maintenance frequency. This is particularly relevant on heavily trafficked roads where maintenance work
cannot be undertaken without using traffic management schemes that often cause delays. Costs are compared at
the date of construction by using the discounted cash flow technique. This means that maintenance and traffic
delay costs that accrue later in the life of the bridge are substantially reduced. For example if the discount rate is
3% then costs incurred after age 80 are reduced by more than 90% and could be neglected on the calculations of
lifetime cost.
The procedure for assessing aesthetics is fundamentally different to that used for the other social factors
considered namely noise, dust and vibration. Generally, measures which reduce construction time and increase
the time to maintenance will result in lower social impacts. Reductions in construction time could be achieved
by for example increasing the percentage of off-site fabrication. The time to maintenance could be increased by

71
using more durable materials. Off-site fabrication could reduce both environmental as well as economic impacts
because of reduced waste and reduced labour, the need for less plant, tools and materials storage, quicker
installation, fewer quality difficulties and guaranteed delivery. Improving durability may increase the initial cost
of construction but should reduce maintenance costs with a concomitant reduction in environmental costs due to
reduced material use, CO2 emissions, energy and waste.
The calculation of sustainability inevitably involves a number of estimates and assumptions so the results will
lack precision. Therefore when comparing the sustainability scores for the alternative bridges we are looking for
distinct differences in value in order to reliably rank the bridges in terms of increasing sustainability. If the
values are similar a reliable ranking may not be possible so all we can say is that the bridges have similar
sustainability scores. In order to decide on the most sustainable bridge we can consider the relative contributions
of environment, cost and social factors as well as the overall score. In most cases we would probably prefer
these contributions to be similar instead of one of the factors being particularly poor.
The calculation of the lifetime sustainability scores usually employs equal weighting for the environment, cost
and society themes. Sometimes, however, one of the factors will be more important than the others. For
example if the funds available are limited then costs will be more important and this is often the case. The
weighting factors can be varied to take account of this, although the actual value to use is best decided by a
consensus of experts. Similarly in some situations the environment or social factors can be the most important.
It is clear that almost any change to the construction and maintenance of a bridge will have far reaching and
diverse effects on its lifetime sustainability. This is why it is not intuitively possible to know how such changes
affect sustainability and therefore why a standard method for calculating sustainability is essential.
72
Chapter 4: Evaluation
The examples and exercises were trialled on a group of third year students enrolled on the BEng/MEng
programme in civil engineering at University College London. Students were asked to carry out the work in
groups of three and given approximately four weeks to complete the task, which was ample. So as to achieve
consistency of marking and feedback to students the assessment form in Appendix E was used. The feedback
session consisted of a short talk on sustainable development and a review of common sustainability appraisal
tools such as those discussed in chapter 1 to help put SASS into context. This was followed by a detailed
discussion on the work submitted: common mistakes/omissions and to highlight any interesting points raised in
individual submissions.
It was clear from the submissions that students had not experienced any difficulties understanding the questions
or completing Exercises 1 and 2.
Exercise 3 required students to calculate CO2 emissions and energy consumed due to various maintenance
activities. The example in the brief was for inspection which, unlike the other maintenance activities considered,
could be carried out during off-peak hours. Unfortunately, most students did not realise this fact and therefore
underestimated the quantities of CO2 and energy involved. Nonetheless, this did not invalidate the rest of the
analysis. Exercise 3ii(b) asked students to make recommendations on how to reduce the impact of maintenance
activity on the environment. Possible measures included enhanced concrete quality and cover, stainless steel
rebar in the substructure and the provision of a protective enclosure system. Many, but by no means all, students
made quite a poor attempt at this question which was partly attributable to the fact that durability, which is a
topic in Engineering Materials, was covered after the hand-in date for the assignment.
Exercise 5 focused on traffic delay costs for various maintenance treatments. Students did not experience any
difficulties calculating costs but a few were rather sceptical of the order of values obtained and were eager to
learn more about this technique. Having correctly identified which maintenance treatment has the largest
impact, some students made quite poor attempts at suggesting ways of reducing lifetime costs and discussing
possible influences on environmental and social factors (i.e. Ex 5(ii)(e)). Again the mismatch with the timetable
for Engineering Materials may have contributed to this problem.
Except for the part on bridge aesthetics (Ex 6) the section on social impact assessment was generally well
attempted (Ex 7).
The students did not seem to experience any difficulty calculating the overall sustainability scores for the three
bridge designs but the discussion of results (Ex 9(iv) and Ex 10) could have been more thorough. It appeared
that while the students had a good understanding of modes of deterioration such as corrosion they showed less
appreciation of which parts of bridges are vulnerable to deterioration. The lack of this practical knowledge
probably demonstrates that their training has been dominated by design to the detriment of maintenance.
One group of students only attempted those exercises requiring numerical answers.
Some students felt that they would have performed better if they had received more instructions at the outset of
this work, this being the only negative feedback received, whereas others felt that the assignment had provided
good context for the talk on sustainability and sustainability appraisal tools at the feedback session.
Overall the students made a good attempt at the work and unlike previous years‟ seemed to have enjoyed this
element of the design course. Equally important was the fact that they had gained some understanding of the
implications of sustainable development on structural design, construction and maintenance.

73
Chapter 5: Reflections
Previous attempts at teaching sustainable development to students of structural design on degree courses were
found to be rather passive and somewhat ineffective. Generally, two one hour lectures were devoted to the topic.
Aspects discussed included the definition of sustainable development, implications for civil engineering and
current approaches to achieving sustainable development such as performance indicators, economic instruments
and sustainability appraisal tools. Some examples of sustainable construction practices were also provided.
Students‟ understanding of the subject matter was assessed either via an essay or a question on the end of year
examination paper. Although the students performed well on these assessments, the feedback received from
some students suggested that the lectures were not actually very useful as they were already aware of many of
the issues highlighted. Worse was the fact that they didn‟t really understand how they would take account of
these issues in scheme design. Experience of teaching engineering students suggested that worked examples are
a good way of clarifying principles and procedures and it was with this thought in mind that the assignment
presented in chapter 3 was developed.
Since this assignment has only been trialled once it is perhaps a little premature to draw firm conclusions about
this style of teaching and learning sustainable design. Nevertheless, based on the submissions and feedback
received from students it would seem reasonable to conclude that the approach was largely successful in that it
(a) helped develop an awareness of the impact of design decisions on the environment, society and
economy
(b) raised awareness of the inter-relationships between the various issues relatable to sustainable
development
(c) developed some expertise in appraisal tools and how they can assist the production of sustainable
designs
(d) provided first-hand experience of the processes involved in sustainability appraisal.
Furthermore it was found that this project-based, analytical approach seemed to appeal to engineering students as
evidenced in their general level of interest in the topic as well as specific aspects of the work such as traffic delay
costs and bridge aesthetics. Another advantage was the fact that it was quite easy to distinguish between those
students who had applied themselves and thought deeply about the work and others who had adopted a more
mechanical approach. To further encourage students to address the more challenging parts of the assignment
perhaps a marking scheme could be added.
From the comments made in Chapter 4 it might be concluded that students should have prior knowledge of the
following topics
Bridges e.g. construction, modes of deterioration and maintenance methods
Whole life cost analysis e.g. principles, assumptions, methodology and key input parameters
Bridge aesthetics
However, this is not absolutely necessary since these topics could be discussed either when requested by students
or during the feedback session, when they are fully engaged.
From a resource point of view it was found that the coursework is largely self-explanatory and actually required
very little time to administer. This approach to teaching and learning sustainable development could be extended
to other types of structures but the basic data would have to be collated. To prevent the risk of plagiarism in
future years some alternative design options will be developed. This will not entail too much extra work as it
should be possible to mix and match various elements from the existing designs in order to obtain new options.
Thus a fourth option could be a two span continuous steel beam and slab bridge with two full height abutments
and one pier. Option 5 could be a four span simply supported prestressed concrete beam and slab bridge with
bank seats and three intermediate piers. Further developments of this work might include the provision of
spreadsheets to eliminate the tedium of performing a large number of hand calculations and perhaps an oral
component.

74
Chapter 6: Conclusions
Courses in structural design have traditionally focused on technical and economic issues and largely ignored
environmental and social factors. Civil infrastructure can have a significant impact on the environment, society and
economy and it is important therefore that civil engineers develop sustainable designs. But the problem is that currently
it is not clear how this can be achieved in practice.
The work presented in this report is an attempt to address this problem. It consists of a series of examples and related
exercises which involve carrying out a sustainability appraisal on a four span continuous steel beam and slab bridge with
integrated bank seat foundations and three intermediate leaf piers. Initially, students are asked to assess the impact of the
scheme on various sustainability factors, including CO2 emissions, energy use, maintenance costs, traffic delay costs,
noise and dust. Subsequently they are asked to propose measures to reduce the impact on each of the three main
sustainability themes in turn (i.e. environment, economy and society) and consider the consequences on the remaining
themes, with the aim of minimising the overall impact.
The impact on the various factors is measured in different units and must be combined in order to establish which of the
proposed measures or, in our case, alternative bridge schemes is the most sustainable. This is achieved using a
normalising technique which converts the scores into dimensionless values. However, before carrying out this
combination it is necessary to decide the relative importance of the three sustainability themes. This is best done using
engineering judgement by consensus of a group of experts yielding a weighting factor for each theme.
The work presented in this report shows that choices of construction material, structural form and method of maintenance
can have far reaching and diverse effects on the lifetime sustainability of structures. It is not intuitively possible to know
how these factors affect sustainability performance and that judicious use of sustainability appraisal tools present a way
forward.

75
References
1. Joint Board of Moderators. Annex C – Sustainability in degree programmes, 2009,
http://www.jbm.org.uk/downloads.aspx
2. World Commission on Environment and Development, Our common future. Oxford University Press,
Oxford, 1987.
3. Robert B. Gibson and Selma Hassan, Sustainability assessment: criteria, processes and applications.
Earthscan, 2005.
4. Department for Business, Enterprise & Regulatory Reform (BERR), Strategy for Sustainable construction.
Construction Sector Unit, 2008.
5. Department of the Environment, Transport and the Regions (DETR), Opportunities for change:
Consultation paper on a UK strategy for sustainable construction. Her Majesties Stationery Office
(HMSO), London, 1998.
6. Sustainable Construction Group, Guidance Note 5: Considerate Constructors’ Scheme, Guidance for
Project Sponsors and Project Managers. 2006.
7. Claire Appleby, The Mayor’s Green Procurement Code. London Remade, Journal of Local Economy, 22:
1, 98 – 101, 2007.
8. BS 8902: Responsible Sourcing. Responsible sourcing sector certification schemes for construction
products, 2009.
9. http://www.planningportal.gov.uk/england/public/tools/ldfguide/
10. Hamilton, A., Mitchell, G. and Yli-Karjanmaa, S. The BEQUEST tool kit: a decision support system for
urban sustainability. Building Research and Information, 2002, 30(2), 109-115, Spon Press
11. BREEAM Education 2008 Assessor Manual. BRE Global, Building Research Establishment, 2008.
12. Daniele Cesano, Market needs for promoting LEEDTM
Rating System and green building design. Arup
NY, KCI program, 2002.
13. Carol Atkinson, Alan Yates and Martin Wyatt, Green Star, Sustainability in the Built Environment - An
Introduction to its Definition and Measurement, BRE Press, Building Research Establishment, 2009.
www.gbca.org.au/green-star/
14. CIRIA and CRANE Environmental, CEEQUAL Assessment Manual for Projects Version 4.
CEEQUAL Ltd, 2008, www.ceequal.com
15. Amiri, A., Arya, C., Vassie, P.R., A model for appraising the sustainability of bridges. Building a
Sustainable Future, fib 2009 Symposium: Concrete 21st Century Superhero, London.
16. Casella Stanger, Sustainability Accounting in the Construction Business. Forum for the Future,
Carillion plc, 2002.
17. Oasys SPeAR Handbook, Version 9.0, Oasys Ltd, 2006. http://www.arup.com/environment SPeAR
18. S. D. Price, B. Miller & A. Amiri, Unlocking the Potential Change for Delivering Transformational
Change in the Sustainability Performance of Civil Engineering Projects. Building a Sustainable Future,
fib 2009 Symposium: Concrete 21st Century Superhero, London.
19. Department for Transport, The environmental impacts of road vehicles in use. 2009.
http://webarchive.nationalarchives.gov.uk/+/http://www.dft.gov.uk/pgr/roads/environment/cvtf/theenviron
mentalimpactsofroa3793
20. Wallbank, E.J. and Lickiss, D.A., Economic appraisal of durability options for reinforced concrete bridges.
Unpublished Transport and Road Research Laboratory report, 1990.
21. Hammond, G. and Jones, C., Inventory of Carbon and Energy, Univ. of Bath.
22. Department for environment, food and rural affairs (DEFRA), Guidelines to DEFRA's GHG
Conversion Factors, 2008.
23. http://www.environment-agency.gov.uk/
24. Highways Agency, Evaluation of maintenance costs in comparing alternative designs and maintenance
schemes for highway structures (draft). The Highways Agency, London, Advice Note BA 28/XX,
Departmental Standard BD 36/XX, 2002.
25. Boulter, P.G. et al, The impacts of traffic calming measures on vehicle exhaust emissions. TRL Report
482, Transport Research Laboratory Ltd, 2001.
26. Davis Langdon, SPON’S Civil engineering and highway works price book. Taylor & Francis, 24 edition,
2009.
27. The Green Book, Appraisal and Evaluation in Central Government. Treasury Guidance, London. http://www.hm-treasury.gov.uk/d/green_book_complete.pdf
28. Department of Transport, Annex 5.5.2 QUADRO reference tables. Trunk Road Maintenance Manual,
Vol. 1, 1999.
29. Australian Roads & Transport Authority, Bridge Aesthetics, 2004.
30. Highways Agency, The Design & Appearance of Bridges. Design Manual for Roads and Bridges
(DMRB) Vol. 1, Section 3, Part 11, 1998. http://www.standardsforhighways.co.uk/dmrb/
31. Highways Agency, Air quality (HA 207-07). DMRB, Vol. 11, Section 3, Part 1, 2007.
32. Highways Agency, Noise and Vibration (HA 213-08). DMRB, Vol. 11, Section 3, Part 7, 2008.

76
33. British Standards Institute, Guide to evaluation of human exposure to vibration in buildings Part 1:
Vibration sources other than blasting. BS 6472-1, London, 2008.
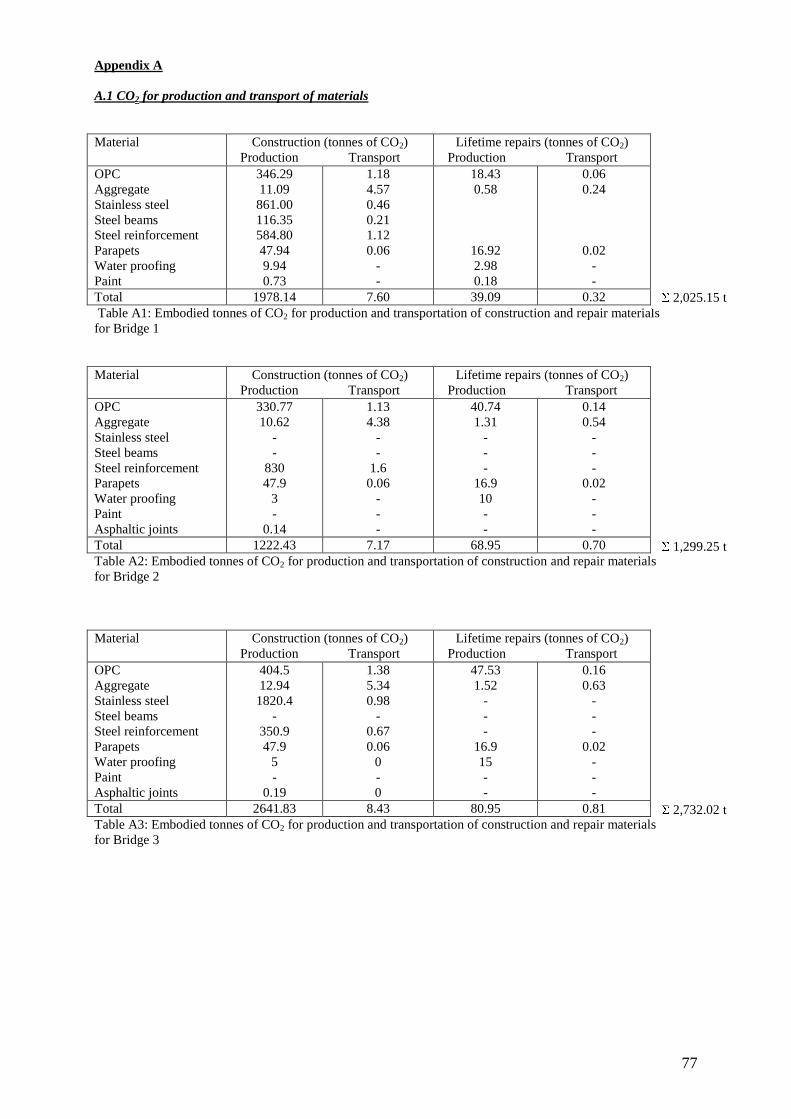
77
Appendix A
A.1 CO2 for production and transport of materials
Material Construction (tonnes of CO2)
Production Transport
Lifetime repairs (tonnes of CO2)
Production Transport
OPC
Aggregate
Stainless steel
Steel beams
Steel reinforcement
Parapets
Water proofing
Paint
346.29
11.09
861.00
116.35
584.80
47.94
9.94
0.73
1.18
4.57
0.46
0.21
1.12
0.06
-
-
18.43
0.58
16.92
2.98
0.18
0.06
0.24
0.02
-
-
Total 1978.14 7.60 39.09 0.32
Table A1: Embodied tonnes of CO2 for production and transportation of construction and repair materials
for Bridge 1
Material Construction (tonnes of CO2)
Production Transport
Lifetime repairs (tonnes of CO2)
Production Transport
OPC
Aggregate
Stainless steel
Steel beams
Steel reinforcement
Parapets
Water proofing
Paint
Asphaltic joints
330.77
10.62
-
-
830
47.9
3
-
0.14
1.13
4.38
-
-
1.6
0.06
-
-
-
40.74
1.31
-
-
-
16.9
10
-
-
0.14
0.54
-
-
-
0.02
-
-
-
Total 1222.43 7.17 68.95 0.70
Table A2: Embodied tonnes of CO2 for production and transportation of construction and repair materials
for Bridge 2
Material Construction (tonnes of CO2)
Production Transport
Lifetime repairs (tonnes of CO2)
Production Transport
OPC
Aggregate
Stainless steel
Steel beams
Steel reinforcement
Parapets
Water proofing
Paint
Asphaltic joints
404.5
12.94
1820.4
-
350.9
47.9
5
-
0.19
1.38
5.34
0.98
-
0.67
0.06
0
-
0
47.53
1.52
-
-
-
16.9
15
-
-
0.16
0.63
-
-
-
0.02
-
-
-
Total 2641.83 8.43 80.95 0.81
Table A3: Embodied tonnes of CO2 for production and transportation of construction and repair materials
for Bridge 3
2,025.15 t
1,299.25 t
2,732.02 t

78
A.2 CO2 emissions due to maintenance
Activity HGVs Other vehicles
(tonnes of CO2)
Inspection
Concrete repair
Painting
20
6,849
1,148
18
6,175
1, 035
8,017 7,228
Table A4: CO2 emissions due to maintenance of Bridge 1
Activity HGVs Other vehicles
(tonnes of CO2)
Inspection
Concrete repair
10
6,575
9
5,928
6,585 5,937
Table A5: CO2 emissions due to maintenance of Bridge 2
Activity HGVs Other vehicles
(tonnes of CO2)
Inspection
Concrete repair
15
7,671
14
6,916
7,686 6,930
Table A6: CO2 emissions due to maintenance of Bridge 3
A3. Energy for production and transport of materials
Material Construction (Gj)
Production Transport
Lifetime repairs (Gj)
Production Transport
OPC
Aggregate
Stainless steel
Steel beams
Steel reinforcement
Parapets
Water proofing
Paint
2177.70
207.90
7210.00
1475.50
7718.00
608.60
168.00
9.60
17.85
69.30
7.00
3.25
17.00
0.85
0.05
-
115.90
10.80
182.58
50.40
0.95
3.60
0.30
0.12
-
Total 19,575.30 115.30 359.68 5.03
Table A7: Energy required for production and transport of materials for Bridge 1
Material Construction (Gj)
Production Transport
Lifetime repairs (Gj)
Production Transport
OPC
Aggregate
Stainless steel
Steel beams
Steel reinforcement
Parapets
Water proofing
Paint
Asphaltic joints
2080
200
-
-
10,941.4
608.60
168.00
-
7.8
17.05
66.35
-
-
24.10
0.85
0.02
-
0.15
256.2
24.5
-
-
-
214.8
50.4
-
-
2.10
8.17
-
-
-
0.30
0.06
-
-
Total 14005.80 108.52 545.9 10.63
Table A8: Energy required for production and transport of materials for Bridge 2
15,245 t
12,522 t
14,616 t
20,055.31 Gj
14,675.59 Gj

79
Material Construction (Gj)
Production Transport
Lifetime repairs (Gj)
Production Transport
OPC
Aggregate
Stainless steel
Steel beams
Steel reinforcement
Parapets
Water proofing
Paint
Asphaltic joints
2543.7
242.7
15,244
-
4,630.8
608.6
84
-
10.4
20.85
80.90
14.80
-
10.20
0.85
0.03
-
0.20
298.9
28.5
-
-
-
214.8
252
-
-
2.45
9.50
-
-
-
0.30
0.09
-
-
Total 23,364.20 127.83 794.20 12.34
Table A9: Energy required for production and transport of materials for Bridge 3
A.4 Energy for maintenance
Activity HGVs Other vehicles
(Gj) (Gj)
Inspection
Concrete repair
Painting
309
105,840
17,740
265
90,720
15,206
Total 123,889 106,191
Table A10: Energy for maintenance of Bridge 1
Activity HGVs Other vehicles
(Gj) (Gj)
Inspection
Concrete repair
155
101,606
133
87,091
Total 101,761 87,224
Table A11: Energy for maintenance of Bridge 2
Activity HGVs Other vehicles
(Gj) (Gj)
Inspection
Concrete repair
232
118,541
199
100,606
Total 118,773 101,805
Table A12: Energy for maintenance of Bridge 3
A5. Maintenance costs
Activity Frequency
(years)
Cost of single
application (£)
Age of bridge at
each application
Life time
cost (£)
Discounted life
time cost (£)
Inspection
Concrete repair
Painting
Drain cleaning
5
30
25
2
12,400
655,000
58,000
1,200
5, 10, 15 ……115
30, 60, 90
25, 50, 75, 100
2, 4, 6 ……. 118
285,200
1,965,000
232,000
70,800
76,935.46
415,510.57
49,001.10
19,278.67
Total £ 560,725.80
Table A13: Lifetime discounted and undiscounted maintenance costs for Bridge 1
Activity Frequency
(years)
Cost of single
application (£)
Age of bridge at
each application
Life time
cost (£)
Discounted life
time cost (£)
Inspection
Concrete repair
Drain cleaning
5
30
2
6,200
1,156,900
600
5, 10, 15 ……115
30, 60, 90
2, 4, 6 ……. 118
142,600
3,470,100
35,400
38,467.73
733,772.64
9,639.34
Total £ 781,879.71
Table A14: Lifetime discounted and undiscounted maintenance costs for Bridge 2
24,298.57 Gj
230,080 Gj
188,985 Gj
220,578 Gj

80
Activity Frequency
(years)
Cost of single
application (£)
Age of bridge at
each application
Life time
cost (£)
Discounted life
time cost (£)
Inspection
Concrete repair
Drain cleaning
5
30
2
9,300
1,360,800
900
5, 10, 15 ……115
30, 60, 90
2, 4, 6 ……. 118
213,900
4,082,400
53,100
57,701.59
863,246.89
14,459.01
Total £ 935,407.49
Table A15: Lifetime discounted and undiscounted maintenance costs for Bridge 3
A6. Traffic delay costs
Maintenance
activity
Length of
lane closure
(km)
Delay
cost per
day (£)
Duration of
closure for each
activity (days)
Delay cost
for each
activity (£)
Lifetime
delay cost
(£)
Discounted
lifetime delay
cost (£)
Inspection
Concrete repair
Painting
0.2
3
3
23,900
36,100
201,400
4
175
23
135,600
6,137,500
4,632,200
3,118,800
18,952,500
18,528,800
841,326.42
4,007,614.80
3,913,498.70
Total £ 8,762,439.90
Table A16: Traffic delay costs for Bridge 1
Maintenance
activity
Length of
lane closure
(km)
Delay
cost per
day (£)
Duration of
closure for each
activity (days)
Delay cost
for each
activity (£)
Lifetime
delay cost
(£)
Discounted
lifetime delay
cost (£)
Inspection
Concrete repair
0.2
3
33,900
36,100
2
322
67,800
11,624,200
1,559,400
34,872,600
420,663.21
7,374,011.20
Total £ 7,794,674.40
Table A17: Traffic delay costs for Bridge 2
Maintenance
activity
Length of
lane closure
(km)
Delay
cost per
day (£)
Duration of
closure for each
activity (days)
Delay cost
for each
activity (£)
Lifetime
delay cost
(£)
Discounted
lifetime delay
cost (£)
Inspection
Concrete repair
0.2
3
33,900
36,100
3
371
101,700
13,393,100
2,339,100
40,179,300
630,994.81
8,496,143.30
Total £ 9,127,138.10
Table A18: Traffic delay costs for Bridge 3

81
Appendix B: Quadro Tables
QUADRO Table 28
QUADRO Table 31

82
QUADRO Table 32
QUADRO Table 42

83
Appendix C: Maintenance and Traffic delay costs
C1 - Bridge 1
C1-1 Drain cleaning
Labour/equipment
Cost = £300/span (Table 2.11)
No of spans = 4
Total cost = £300 × 4 = £1,200
Gaining Access
Assume drain cleaning is carried out from the top surface of the deck and therefore are no access costs.
Traffic management
No carriageway closures required.
Cost of traffic management = 0
Overheads
Not applicable since this is routine maintenance
Cost of treatment
Engineering cost of treatment = Labour/equipment + Gaining access + Traffic management + Overheads
= £1,200 + £0 + £0 + 0 = £1,200
Lifetime number of treatments = 59 (Table 2.3)
Lifetime engineering cost = Cost of treatment × Lifetime number of treatments = £1,200 × 59 = £70,800
Discounted lifetime cost =
15
12
035.01
200,1
ii
+
37
162
03.01
200,1
jj
+
59
382
025.01
200,1
kk
= £19,278.67
Traffic delay cost
No lane closure required
Traffic delay cost = £0.
C1-2 Steelwork painting
Labour/equipment
Total area of steelwork = 800 m2.
From Table 2.11 assume 10% area of steelwork to repaint every 25 years.
Steelwork painting to 80 m2.
Price = £35 / m2.
Cost of single treatment = £35 × 80 = £2,800
Gaining Access
Assume access by scaffolding and that full carriageway closure is required.
Scaffold over half deck area = 64 × 12.3 × ½ 400 m2
Scaffold cost £1.5/ m2/day
Steelwork painting to 80 m2 @ 25 m
2/wk (Table 2.5) = 3.2 wk 23 days
Cost of scaffolding = 400 × £1.5 × 23 = £13,800
Traffic management
Carriageway closure with contraflow = £1,700/day
Cost of traffic management = £1,700 × 23 = £39,100

84
Overheads
Cost of contract = £2,800
Since contract < £50,000 overhead rate = £700/wk (Table 2.16)
Total overhead cost = £700 × 3.2 £2,300
Cost of treatment
Engineering cost of treatment = Labour/equipment + Gaining access + Traffic management + Overheads
= £2,800 + £13,800 + £39,100 + £2,300 = £58,000
Lifetime number of treatments = 4 (Table 2.3)
Lifetime cost of treatment = £58,000 × 4 = £232,000
Discounted lifetime cost of treatment =25
035.01
000,58+
5003.01
000,58+
7503.01
000,58+
100025.01
000,58= £49,001.10
Traffic delay cost
Assume steelwork painting will require a full carriageway closure. The central reservation crossover points are 2km
apart giving a minimum traffic management length of 3km. For a two lane dual motorway with 80,000 AADT and 20%
HGV, one primary and two secondary lanes with contraflow, Table 31 (TRRM Vol. 1 Annex 5.5.2) gives a traffic delay
cost of £153,000/day at 1998 prices over a length of 3km.
RPI factor = 1.316 Traffic delay cost at 2009 prices = 1.316 × £153,000 £201,400/day
Traffic delay cost per treatment = £201,400 × 23 = £4,632,200
Lifetime traffic delay cost = 4 × £4,632,200 = £ 18,528,800
Undiscounted lifetime delay costs =25
035.01
200,632,4+
5003.01
200,632,4+
7503.01
200,632,4+
100025.01
200,632,4= £3,913,498.40
C1-3: Concrete repairs
Some of this work will be undertaken from a mobile platform positioned on the bridge whereas other work will
be carried out from scaffolding erected on the motorway. Therefore both costs were determined for this
maintenance action. Repairs to the deck slab will require shuttle working and a load restriction to HGVs. For
moderate and major repairs much of the deck repair work will be carried out from above deck.
(I) ON THE ROAD BELOW
Cost of treatment
Total surface area of concrete = 500 m2.
From Table 2.7 assume 10% of surface area of concrete to repair every 30 years.
Concrete repair to 50 m2.
Price = £1600 / m2.
Cost of single treatment = £1600 × 50 = £80,000
Gaining Access
Assume access by scaffolding and that repairs will be undertaken using two closed lanes for the duration of the
works.
Scaffold over quarter of deck area = 64 × 12.3 × ¼ 200 m2
Scaffold cost £1.5/ m2/day
Concrete repair to 50 m2 @ 2 m
2/wk (Table 2.7) = 25 wk = 175 days
Cost of scaffolding = 200 × £1.5 × 175 = £52,500

85
Traffic management
Two lane carriageway closure with contraflow = £1,700/day
(II) ON THE ROAD ABOVE
Gaining Access
Not applicable
Traffic management
Automatic traffic control = £1,100/day
Total works cost = £80,000
Cost of gaining access = £52,500
Total cost of traffic management = (£1,700 + £1,100) × 175 = £490,000
Overheads
Since cost of work (= £80,000) is between £50,000 and £250,000 overhead rate = £1300/wk (Table 2.16)
Total overhead cost = £1,300 × 25 = £32,500
Cost of treatment
Total cost of single treatment = Labour/equipment + Gaining access + Traffic management + Overheads
= £80,000 + £52,500 + £490,000 + £32,500 = £655,000
Lifetime number of treatment = 3 (Table 2.3)
Lifetime cost of concrete repairs = £655,000 × 3 = £1,965,000
Discounted lifetime cost of concrete repairs =30
035.01
000,655+
6003.01
000,655+
90025.01
000,655= £415,510.57
Traffic delay cost
(I) ON THE ROAD BELOW
For a two lane dual motorway with 80,000 AADT and 20% HGV, two primary and two secondary lanes with contraflow,
Table 28 (TRRM Vol. 1 Annex 5.5.2) gives a traffic delay cost of £27,000/day at 1998 prices over a length of 3km.
RPI factor = 1.316 Traffic delay cost at 2009 prices = 1.316 × £27,000 £35,600/day
(II) ON THE ROAD ABOVE
For shuttle working on a single 7.3m road with 6,000 AADT and 10% HGV, Table 42 gives a value of £350/day.
RPI factor = 1.316 Traffic delay cost at 2009 prices = 1.316 × £350 £500/day
Total traffic delay cost per treatment = (£35,600 + £500) × 175 = £6,317,500
Lifetime traffic delay cost = 3 × £6,317,500 = £18,952,500
Lifetime delay costs =30
035.01
500,317,6+
6003.01
500,317,6+
90025.01
500,317,6= £4,007,614.80

86
C2 - Bridge 2
C2-1 Cost of inspection
Labour/equipment
Cost = £1100/span (Table 2.10)
Assuming work will be carried out at weekends, increase cost by 1.5 cost = £1100 × 1.5 = £1,650/span
Total number of spans = 2 (Fig. 2.1)
Total cost = £1,650 × 2 = £3,300
Gaining Access
Assume access will be from a mobile working platform
Cost of mobile platform = £400 / day (Table 2.14)
Rate of inspection = 1 span/day
Since bridge has two spans, work duration = 2 days
Total cost = £400 × 2 = £800
Traffic management
Assume two lanes will be closed while the inspection work is carried out.
Cost = £700/day (Table 2.11). Since work will be carried out at weekends, increase cost by 1.5 = £700 × 1.5 =
£1,050/day
Cost of traffic management = £1050 × 2 = £2,100
Overheads
Not applicable since this is routine maintenance
Engineering cost
Engineering cost = Labour/equipment + Gaining access + Traffic management + Overheads
= £3,300 + £800 + £2,100 + 0 = £6,200
Lifetime number of treatments = 23 (Table 2.3)
Lifetime engineering cost = Cost of treatment × Lifetime number of treatments = £6,200 × 23 = £142,600
Discounted lifetime engineering cost =
6
15
035.01
200,6
ii
+
15
75
03.01
200,6
jj
+
23
165
025.01
200,6
kk
=£38,467.73
Traffic delay cost of inspecting
For a two lane dual motorway with 80,000 AADT and 20% HGV, one primary and two secondary lanes
unaffected, Table 32 (TRRM Vol. 1 Annex 5.5.2) gives a traffic delay cost of £103,000/day at 1998 prices
over a length of 0.2km (Table 2.4).
Price Index Factor = 1.316 Traffic delay cost at 2009 prices = 1.316 × £103,000 £135,600/day
Work will be carried out at weekends Road user delay influence factor = 0.25 (Table 2.5)
Modified traffic delay cost = £135,600 × 0.25 = £33,900/day
From above, work duration = 2 days
Traffic delay cost per inspection = £33,900 × 2 = £67,800
Total number of inspections required = 23 (Table 2.3)
Lifetime undiscounted delay cost = £67,800 × 23 = £1,559,400
Discounted lifetime delay costs =
5
15
035.01
800,67
ii
+
15
65
03.01
800,67
jj
+
23
165
025.01
800,67
kk
=£420,663.21
C2-2 Drain cleaning
Labour/equipment
Cost = £300/span (Table 2.11)

87
No of spans = 2
Total cost = £300 × 2 = £600
Gaining Access
Assume drain cleaning is carried out from the top surface of the deck and therefore are no access costs.
Traffic management
No carriageway closures required.
Cost of traffic management = 0
Overheads
Not applicable since this is routine maintenance
Cost of treatment
Engineering cost of treatment = Labour/equipment + Gaining access + Traffic management + Overheads
= £600 + £0 + £0 + 0 = £600
Lifetime number of treatments = 59 (Table 2.3)
Lifetime engineering cost = Cost of treatment × Lifetime number of treatments = £600 × 59 = £35,400
Discounted lifetime cost =
15
12
035.01
600
ii
+
37
162
03.01
600
jj
+
59
382
025.01
600
kk
= £9,639.34
Traffic delay cost
No lane closure required traffic delay cost = £0.
C2-3: Concrete repairs
Some of this work will be undertaken from a mobile platform positioned on the bridge whereas other work will
be carried out from scaffolding erected on the motorway. Therefore both costs were determined for this
maintenance action. Repairs to the deck slab will require shuttle working and a load restriction to HGVs. For
moderate and major repairs much of the deck repair work will be carried out from above deck.
(I) ON THE ROAD BELOW
Cost of treatment
(i) E2 concrete repairs
Total surface area of concrete = 480 m2.
From Table 2.7 assume 10% of surface area of concrete to repair every 30 years.
Concrete repair to 48 m2.
Rate of repair = 2 m2/week
Work duration = 48/2 = 24 weeks = 168 days
(ii) E3 concrete repairs
Total surface area of concrete = 220 m2.
From Table 2.7 assume 20% of surface area of concrete to repair every 30 years.
Concrete repair to 44 m2.
Rate of repair = 2 m2/week
Work duration = 44/2 = 22 weeks = 154 days
Price = £1600 / m2.
Cost of single treatment = (48 + 44) × £1600 = £147,200

88
Gaining Access
(I) ON THE ROAD BELOW
Assume access by scaffolding and that repairs will be undertaken using two closed lanes for the duration of the
works.
Scaffold over quarter of deck area = 32 × 12.3 × ¼ 100 m2
Scaffold cost £1.5/ m2/day
Total duration of concrete repairs = 168 + 154 = 322 days
Cost of scaffolding = 100 × £1.5 × 322 = £48,300
(II) ON THE ROAD ABOVE
Not applicable
Traffic management
(I) ON THE ROAD BELOW
Two lane carriageway closure with contraflow = £1,700/day
(II) ON THE ROAD ABOVE
Automatic traffic control = £1,100/day
Cost of traffic management = (£1,700 + £1,100) × 322 = £901,600
Total works cost = £147,200
Cost of gaining access = £48,300
Cost of traffic management = £901,600
Overheads
Since cost of work (= £147,200) is between £50,000 and £250,000 overhead rate = £1300/wk (Table 2.16)
Total overhead cost = £1,300 × 46 = £59,800
Cost of treatment
Total cost of single treatment = Labour/equipment + Gaining access + Traffic management + Overheads
= £147,200 + £48,300 + £901,600 + £59,800= £1,156,700
Lifetime number of treatment = 3 (Table 2.3)
Lifetime cost of concrete repairs = £1,156,700 × 3 = £3,470,100
Discounted lifetime cost of concrete repairs =30
035.01
700,156,1+
6003.01
700,156,1+
90025.01
700,156,1= £733,772.64
Traffic delay cost
(I) ON THE ROAD BELOW
For a two lane dual motorway with 80,000 AADT and 20% HGV, two primary and two secondary lanes with contraflow,
Table 28 (TRRM Vol. 1 Annex 5.5.2) gives a traffic delay cost of £27,000/day at 1998 prices over a length of 3km.
RPI factor = 1.316 Traffic delay cost at 2009 prices = 1.316 × £27,000 £35,600/day
(II) ON THE ROAD ABOVE
For shuttle working on a single 7.3m road with 6,000 AADT and 10% HGV, Table 42 gives a value of £350/day.

89
RPI factor = 1.316 Traffic delay cost at 2009 prices = 1.316 × £350 £500/day
Total traffic delay cost per treatment = (£35,600 + £500) × 322 = £11,624,200
Lifetime traffic delay cost = 3 × £11,624,200 = £34,872,600
Lifetime delay costs =30
035.01
200,624,11+
6003.01
200,624,11+
90025.01
200,624,11= £7,374,011.20

90
C3 - Bridge 3
C3-1 Cost of inspection
Labour/equipment
Cost = £1100/span (Table 2.10)
Assuming work will be carried out at weekends, increase cost by 1.5 cost = £1100 × 1.5 = £1,650/span
Total number of spans = 3 (Fig. 2.1)
Total cost = £1,650 × 3 = £4,950
Gaining Access
Assume access will be from a mobile working platform
Cost of mobile platform = £400 / day (Table 2.14)
Rate of inspection = 1 span/day
Since bridge has three spans, work duration = 3 days
Total cost = £400 × 3 = £1,200
Traffic management
Assume two lanes will be closed while the inspection work is carried out.
Cost = £700/day (Table 2.11). Since work will be carried out at weekends, increase cost by 1.5 = £700 × 1.5 =
£1,050/day
Cost of traffic management = £1050 × 3 = £3,150
Overheads
Not applicable since this is routine maintenance
Engineering cost
Engineering cost = Labour/equipment + Gaining access + Traffic management + Overheads
= £4,950 + £1,200 + £3,150 + 0 = £9,300
Lifetime number of treatments = 23 (Table 2.3)
Lifetime engineering cost = Cost of treatment × Lifetime number of treatments = £9,300 × 23 = £213,900
Discounted lifetime engineering cost =
6
15
035.01
300,9
ii
+
15
75
03.01
300,9
jj
+
23
165
025.01
300,9
kk
= £ 57,701.59
Traffic delay cost of inspecting For a two lane dual motorway with 80,000 AADT and 20% HGV, one primary and two secondary lanes
unaffected, Table 32 (TRRM Vol. 1 Annex 5.5.2) gives a traffic delay cost of £103,000/day at 1998 prices
over a length of 0.2km (Table 2.4).
Price Index Factor = 1.316 Traffic delay cost at 2009 prices = 1.316 × £103,000 £135,600/day
Work will be carried out at weekends Road user delay influence factor = 0.25 (Table 2.5)
Modified traffic delay cost = £135,600 × 0.25 = £33,900/day
From above, work duration = 3 days
Traffic delay cost per inspection = £33,900 × 3 = £101,700
Total number of inspections required = 23 (Table 2.3)
Lifetime undiscounted delay cost = £101,700 × 23 = £2,339,100
Discounted lifetime delay costs =
6
15
035.01
700,101
ii
+
15
75
03.01
700,101
jj
+
23
165
025.01
700,101
kk
= £630,994.81

91
C3-2 Drain cleaning
Labour/equipment
Cost = £300/span (Table 2.11)
No of spans = 3
Total cost = £300 × 3 = £900
Gaining Access
Assume drain cleaning is carried out from the top surface of the deck and therefore are no access costs.
Traffic management
No carriageway closures required.
Cost of traffic management = 0
Overheads
Not applicable since this is routine maintenance
Cost of treatment
Engineering cost of treatment = Labour/equipment + Gaining access + Traffic management + Overheads
= £900 + £0 + £0 + 0 = £900
Lifetime number of treatments = 59 (Table 2.3)
Lifetime engineering cost = Cost of treatment × Lifetime number of treatments = £900 × 59 = £53,100
Discounted lifetime cost =
15
12
035.01
900
ii
+
37
162
03.01
900
jj
+
59
382
025.01
900
kk
= £ 14,459.01
Traffic delay cost
No lane closure required traffic delay cost = £0
C3-3: Concrete repairs
Some of this work will be undertaken from a mobile platform positioned on the bridge whereas other work will
be carried out from scaffolding erected on the motorway. Therefore both costs were determined for this
maintenance action. Repairs to the deck slab will require shuttle working and a load restriction to HGVs. For
moderate and major repairs much of the deck repair work will be carried out from above deck.
(I) ON THE ROAD BELOW
Cost of treatment
(i) E2 concrete repairs
Total surface area of concrete = 560 m2.
From Table 2.7 assume 10% of surface area of concrete to repair every 30 years.
Concrete repair to 56 m2.
Rate of repair = 2 m2/week
Work duration = 56/2 = 28 weeks = 196 days
(ii) E3 concrete repairs
Total surface area of concrete = 250 m2.
From Table 2.7 assume 20% of surface area of concrete to repair every 30 years.
Concrete repair to 50 m2.
Rate of repair = 2 m2/week
Work duration = 50/2 = 25 weeks = 175 days
Price = £1600 / m2.
Cost of single treatment = (56 + 50) × £1600 = £169,600
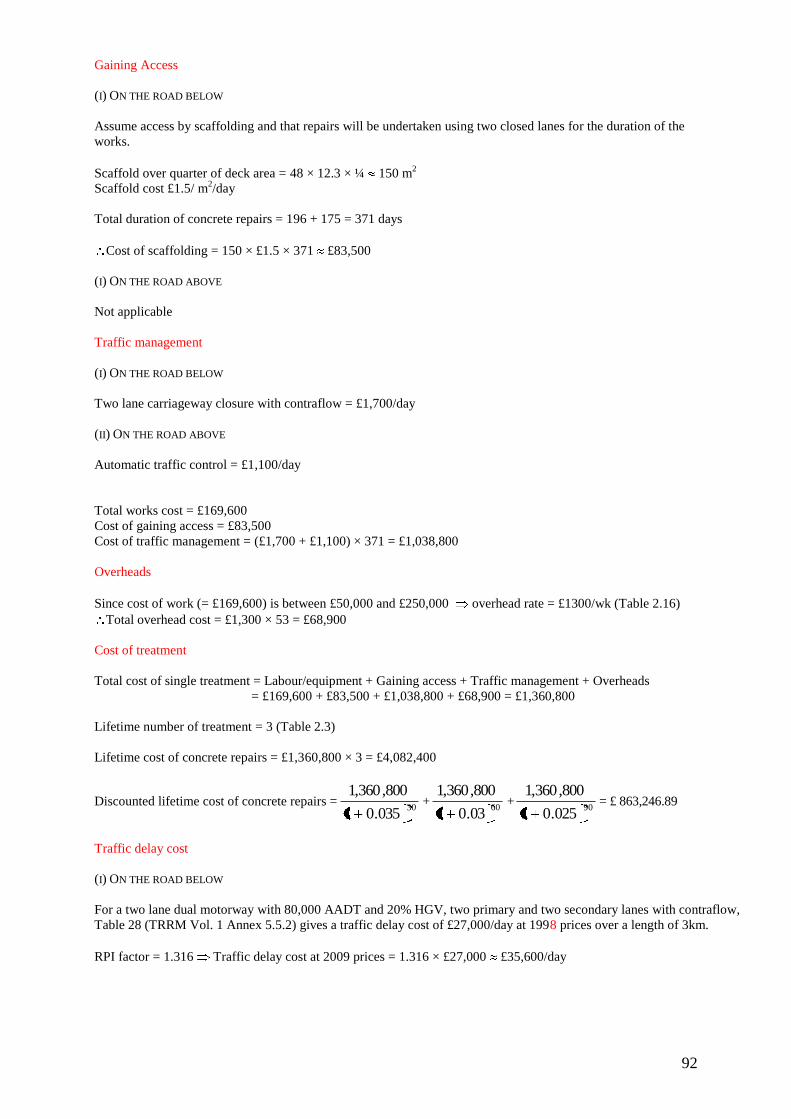
92
Gaining Access
(I) ON THE ROAD BELOW
Assume access by scaffolding and that repairs will be undertaken using two closed lanes for the duration of the
works.
Scaffold over quarter of deck area = 48 × 12.3 × ¼ 150 m2
Scaffold cost £1.5/ m2/day
Total duration of concrete repairs = 196 + 175 = 371 days
Cost of scaffolding = 150 × £1.5 × 371 £83,500
(I) ON THE ROAD ABOVE
Not applicable
Traffic management
(I) ON THE ROAD BELOW
Two lane carriageway closure with contraflow = £1,700/day
(II) ON THE ROAD ABOVE
Automatic traffic control = £1,100/day
Total works cost = £169,600
Cost of gaining access = £83,500
Cost of traffic management = (£1,700 + £1,100) × 371 = £1,038,800
Overheads
Since cost of work (= £169,600) is between £50,000 and £250,000 overhead rate = £1300/wk (Table 2.16)
Total overhead cost = £1,300 × 53 = £68,900
Cost of treatment
Total cost of single treatment = Labour/equipment + Gaining access + Traffic management + Overheads
= £169,600 + £83,500 + £1,038,800 + £68,900 = £1,360,800
Lifetime number of treatment = 3 (Table 2.3)
Lifetime cost of concrete repairs = £1,360,800 × 3 = £4,082,400
Discounted lifetime cost of concrete repairs =30
035.01
800,360,1+
6003.01
800,360,1+
90025.01
800,360,1= £ 863,246.89
Traffic delay cost
(I) ON THE ROAD BELOW
For a two lane dual motorway with 80,000 AADT and 20% HGV, two primary and two secondary lanes with contraflow,
Table 28 (TRRM Vol. 1 Annex 5.5.2) gives a traffic delay cost of £27,000/day at 1998 prices over a length of 3km.
RPI factor = 1.316 Traffic delay cost at 2009 prices = 1.316 × £27,000 £35,600/day

93
(II) ON THE ROAD ABOVE
For shuttle working on a single 7.3m road with 6,000 AADT and 10% HGV, Table 42 gives a value of £350/day.
RPI factor = 1.316 Traffic delay cost at 2009 prices = 1.316 × £350 £500/day
Total traffic delay cost per treatment = (£35,600 + £500) × 371 = £13,393,100
Lifetime traffic delay cost = 3 × £13,393,100 = £40,179,300
Lifetime delay costs =30
035.01
100,393,13+
6003.01
100,393,13+
90025.01
100,393,13= £ 8,496,143.30

94
APPENDIX D D1-1) Aesthetics – Bridge 1
1,1,1 - Excessive imbalanced proportions between significant elements
should be avoided as much as possible.Yes
1,1,2 - Similar proportions or ratios throughout the structure can create a
harmony.Yes
1,1,3 - The ratio of Deck to Parapet Depth is also considered a significant
aesthetic proportion and guidelines have been developed by Cardiff
University School of Engineering
Yes
1,1,4 - the Span to Depth ratio is determined by the structural design. The
value of the span-to-depth ratio can be an indicator of aesthetic design. The
general agreement among bridge design experts states that span-to-depth
ratio between 15 and 30 provi
Yes
1,4,2 - Honesty of form is about the materials and structures to look like what
they are.Yes
1,2,1 - it must be considered as an important aesthetic indicator because
symmetrical bridges are often more aesthetically pleasing than non
symmetricals.
1,4,1 - The complexity of a bridge should be minimized especially in natural
landscape settings as it tends to attract the eye and competes with views of
the landscape.
Yes
Assumed to be considered.
Yes
Yes
1,3,1 - to achieve a consistent order, bridge spans should match where
possible. Also, the interaction of bridge elements like lighting columns,
barrier supports and piers should be considered.
It is an integral bridge therefore simpilified
in terms of bearings etc. and looks as a
solid object. (???)
Can be seen from the drawing.
Can be seen from the drawing.
Elegant design.
Can be seen from the drawing.
Assumed to be considered.
Assumed to be considered.
Table D1.1.1: Bridge as a whole

95
2,1,1 - Make the bridge as invisible as possible to hide it in the landscape.
(suits to smaller bridges)Yes
2,1,2 - Make the bridge as simple and elegant as possible to complement the
landscape: This approach is a practical, cost effective objective for
overpasses and larger bridges and can lead to good looking bridge
solutions.
Yes
2,1,3 - Maximize views of the landscape through the bridge: By minimizing
the profile of the bridge, the landscape setting will dominate the view and be
appreciated from all viewpoints.
Yes
2,1,4 - Bridges with a horizontal form are generally preferable to bridges on a
grade over flat simple landscapes and significant expanses of waterYes
2,1,5 - Significant stands of existing vegetation should be retained Yes
2,1,6 - Footprint of the bridge (e.g. pile caps, abutments) should be minimized
so that the retention of local vegetations maximized.Yes
2,1,7 - The presence and extent of intermediate structures and hard surfaces
between the bridge and landscape should be minimized.Yes
2,1,8 - Careful design of earthworks and planting and the selection of
endemic species grown from locally collected seed.No
2,2,1 - A landmark structure should be created in a way that complements or
contrasts with its visual catchments.
2,2,2 - Maximizing views from the bridge of the local urban setting
2,2,3 - Maximizing views through the bridge from the urban setting
2,2,4 - Respecting locally valued structures and their cartilages by
complementing local styles and materials
2,2,5 - Ensuring the space under the bridge is not dark, degraded and unsafe.
2,3,1 - In such cases plants should be located to the outside of the space and
irrigation may be required.
2,3,2 - Combining planting with a hard paved or gravel surface is often
appropriate.
2,3,3 - Clean uncluttered surfaces, neat connections and simple layout of
girders will help to give a neat appearance.
2,3,4 - When designing the soffit, consider bracing, when it is required, and
ensure an orderly and regular pattern where possible.
2,4,1 - Short span (up to approximately 18m): prestressed concrete plank
bridges.
2,4,2 - Short to medium span (approximately 18-40m): pre-stressed concrete
girders or pre-stressed concrete voided slabs.
2,4,3 - Medium span (approximately 40-80m): ste
Not Applicable
Assumed to be considered.
Assumed to be considered.
See-through abutments and slender
design allows for this.
Assumed to be considered.
This hasn't been considered.
Can be seen from the drawing.
See-through abutments and slender
design allow for this.
Can be seen from the drawing.
Not Applicable
Not Applicable
Not Applicable
Not Applicable
Not Applicable
Not Applicable
Not Applicable
Not Applicable
Yes
Table D1.1.2: Bridge and its surroundings

96
3,1,1 - They should appear as continuous uninterrupted lines, extending the
full length of the bridge with a generous overlap of the abutments.Yes
3,1,2 - A neat, sharp edge will help define them against the background. Yes
3,1,3 - Maximizing the shadow cast on the superstructure will further
accentuate and express their form.Yes
3,1,4 - The outer face should be a smooth single plane surface, slanted
slightly outwards towards the bottom, to better catch the sunlight.Yes
3,1,5 - The top should angle towards the road, to channel rainwater onto the
bridge, minimizing staining of the outside face.Yes
3,1,6 - If the deck soffit is visually complex, consideration should be given to
hiding this complexity, by extending the parapet soffit below the deck soffit.Yes
3,2,1 - In the elevation, hunched girders are expressive and responsive to the
forces in the bridge. They can often be more distinctive and elegant than
single depth beams.
No
3,2,2 - Three or five span haunches are aesthetically very elegant balanced
structures.Yes
3,2,3 - In cross section, if the girder is right angled it can catch the light and a
double line may be visible. Maximizing the overhang will increase the
shadow. A curved soffit will provide a gradation of tone and minimize a sharp
line at the base of th
Yes
3,3,1 - In an urban area that vertical forms are present and only close views
available, headstock may provide a reassuring sense of strength and
durability, as well as visual interest.
3,3,2 - In a rural area where horizontal forms predominate, headstock can be
overly complex and should be carefully considered and designed with their
visual impact in mind, or avoided.
Yes
3,3,3 - If possible headstocks should not extend across the outer face of the
girder. This introduces unnecessary complexity and appears in elevation as
if the headstock is supporting the deck rather than the girder.
Yes
3,4,1 - Bridges which have pier spacings or spans which are roughly
proportional to the bridge's height above ground level are more aesthetically
pleasing than bridges which do not follow this proportion. They seem more
responsive to their context.
Yes
3,4,2 - Collecting multiple piers into pairs or clusters can open up views
below the deck and also give rhythm and elegance to the supports.Yes
3,4,3 - Rounding off the corners of rectangular piers provides a softer form,
which may be preferable in certain contexts. For example where the presence
of the pier needs to be down played so that superstructure is dominant, e.g.
in a rural setting.
No
3,4,4 - Pier shapes which have a slight taper (A taper of around 1:80) are
desirable.No
3,4,5 - The reverse taper should only be used where the appearance of
rigidity is required between superstructure and pier. Otherwise the
appearance of the top heavy pier can be imbalanced and does not reflect the
forces acting on the pier well.
No
3,5,1 - The proportion of pier size to pile cap size should be considered.
Imbalanced proportions should be avoided.
3,6,1 - If using of wall abutments is unavoidable the use of planting should be
considered to screen the abutment walls.Yes
3,6,2 - Reducing the abutments can create a more refined and better looking
bridge. It does however increase the span and therefore depth of beam.Yes
3,6,3 - Continuing the superstructure or the parapet allows the shadow line to
reduce the dominance of the abutment, and makes the bridge appear longer
and more elegant.
Yes
3,6,4 - Angling the abutments provides a more open sleek look and helps
visually anchor the span.No
3,6,5 - Spill through abutments allow open views to the landscape and better
visibility to the road beyond.Yes
3,6,6 - slight angle on the taper can make the wall appear less dominating
especially if next to a footpath. This avoids visual crowding.No
3,8,2 - The screens should extend to the ends of the bridge span and
consideration should be given to integrating the bridge barrier and safety
screens.
3,9,1 - Where possible lighting on bridges should be minimized or avoided. Yes
3,9,2 - If necessary lighting should be used in the median as far from the
parapet as possible to reduce clutter or designed into the parapet structure.Yes
3,9,3 - If considerable effort is put into the design of the appearance of the
bridge it is better value for money to allow the bridge to be viewed at night
(dependent on context, cost, safety and environmental issues).
Yes
3,11,1 - Where possible avoid the use of noise walls on bridges. Yes
3,12,2 - A neutral palette of black, gray and white tend to give a clear
definition of the bridge as an object in the landscape.Yes
3,11,2 - The use of transparent panels should be considered so that the
apparent slenderness of the superstructure is not affected.
3,8,1 - An outward curving screen creates a more open feeling for bridge
users. However it presents a greater apparent depth of structure for
onlookers.
Not Applicable
Assumed to be considered.Yes
Yes3,10,1 - The colour and grade of the pipe system must be considered as
these aspects can jar with the overall bridge design.
3,5,2 - In a tidal watercourse, if the view of the piles is to be minimised, the
pile cap may require a skirt as they need to be visible to boats and shipping
as a safety measure.
Assumed to be considered.
Yes Assumed to be considered.
Yes Assumed to be considered.
3,12,1 - Landscape tones are generally subdued and dark; therefore light
colours and textures (for bridge primary elements) provide a good contrast.
(the exception is when they are culturally appropriate such as traditional
Chinese bridges or unique icon
Not Applicable
Assumed to be considered.
Can be seen from the drawing.
Assumed to be considered.
Can be seen from the drawing.
Assumed to be considered.
Assumed to be considered.
This hasn't been considered.
Assumed to be considered.
Assumed to be considered.
This hasn't been considered.
Assumed to be considered.
Assumed to be considered.
Assumed to be considered.
This hasn't been considered.
This hasn't been considered.
This hasn't been considered.
Not Applicable
3,7,1 - With the exception of name plates and navigation signs, signage
should be kept off bridges as far as possible. They add clutter and
complexity and detract from the structure. They also obstruct views from the
bridge.
Not Applicable
Assumed to be considered.
Can be seen from the drawing.
Assumed to be considered.
Assumed to be considered.
Assumed to be considered.
Assumed to be considered.
Can be seen from the drawing.
This hasn't been considered.
Not Applicable
Assumed to be considered.
Assumed to be considered.
Assumed to be considered.
Table D1.1.3: Parts and details

97
D1-2) Aesthetics - Bridge 2
With the aid of Fig. E2 (chapter 3) estimate the aesthetics impact score for Bridge 2. Assume the designer has no past
performance but has appointed a liaison officer to consult with the public.
(i) Guidelines
Completed copies of Tables 2.25-2.27 for Bridge 2 are shown below. The results are summarised in the table and used in
conjunction with the weighting factors given in Table 2.28 to score the guidelines.
Guidelines Relevant
guidelines
Guidelines
observed
% observed Score
(%)
Bridge as a whole
Bridge and its surroundings
Parts and details
8
9
31
8
4
23
100
44.4
74.2
25
11.1
18.6
Total 64.7
(ii) Past performance/liaison officer
From Table 2.29 it can be seen that the score is 7 out of 10 giving an impact of
5.7%2510
71
(iii) Sustainability score
The sustainability score for aesthetics is
64.7 + 7.5 = 72.2
1,1,1 - Excessive imbalanced proportions between significant elements
should be avoided as much as possible.Yes
1,1,2 - Similar proportions or ratios throughout the structure can create a
harmony.Yes
1,1,3 - The ratio of Deck to Parapet Depth is also considered a significant
aesthetic proportion and guidelines have been developed by Cardiff
University School of Engineering
Yes
1,1,4 - the Span to Depth ratio is determined by the structural design. The
value of the span-to-depth ratio can be an indicator of aesthetic design. The
general agreement among bridge design experts states that span-to-depth
ratio between 15 and 30 provi
Yes
1,4,2 - Honesty of form is about the materials and structures to look like what
they are.Yes
1,2,1 - it must be considered as an important aesthetic indicator because
symmetrical bridges are often more aesthetically pleasing than non
symmetricals.
1,4,1 - The complexity of a bridge should be minimized especially in natural
landscape settings as it tends to attract the eye and competes with views of
the landscape.
Yes
Assumed to be considered.
Yes
Yes
1,3,1 - to achieve a consistent order, bridge spans should match where
possible. Also, the interaction of bridge elements like lighting columns,
barrier supports and piers should be considered.
it's symmetrical and simple.
Can be seen from the drawing.
Can be seen from the drawing.
Can be seen from the drawing.
Can be seen from the drawing.
Assumed to be considered.
Assumed to be considered.
Table D1.2.1: Bridge as a whole

98
2,1,1 - Make the bridge as invisible as possible to hide it in the landscape.
(suits to smaller bridges)No
2,1,2 - Make the bridge as simple and elegant as possible to complement the
landscape: This approach is a practical, cost effective objective for
overpasses and larger bridges and can lead to good looking bridge
solutions.
No
2,1,3 - Maximize views of the landscape through the bridge: By minimizing
the profile of the bridge, the landscape setting will dominate the view and be
appreciated from all viewpoints.
No
2,1,4 - Bridges with a horizontal form are generally preferable to bridges on a
grade over flat simple landscapes and significant expanses of waterYes
2,1,5 - Significant stands of existing vegetation should be retained Yes
2,1,6 - Footprint of the bridge (e.g. pile caps, abutments) should be
minimized so that the retention of local vegetations maximized.Yes
2,1,7 - The presence and extent of intermediate structures and hard surfaces
between the bridge and landscape should be minimized.No
2,1,8 - Careful design of earthworks and planting and the selection of
endemic species grown from locally collected seed.No
2,2,1 - A landmark structure should be created in a way that complements or
contrasts with its visual catchments.
2,2,2 - Maximizing views from the bridge of the local urban setting
2,2,3 - Maximizing views through the bridge from the urban setting
2,2,4 - Respecting locally valued structures and their cartilages by
complementing local styles and materials
2,2,5 - Ensuring the space under the bridge is not dark, degraded and unsafe.
2,3,1 - In such cases plants should be located to the outside of the space and
irrigation may be required.
2,3,2 - Combining planting with a hard paved or gravel surface is often
appropriate.
2,3,3 - Clean uncluttered surfaces, neat connections and simple layout of
girders will help to give a neat appearance.
2,3,4 - When designing the soffit, consider bracing, when it is required, and
ensure an orderly and regular pattern where possible.
2,4,1 - Short span (up to approximately 18m): prestressed concrete plank
bridges.
2,4,2 - Short to medium span (approximately 18-40m): pre-stressed concrete
girders or pre-stressed concrete voided slabs.
2,4,3 - Medium span (approximately 40-80m): ste
Not Applicable
Assumed to be considered.
Assumed to be considered.
Bridge abutments do not allow for this.
Bridge abutments do not allow for this.
This hasn't been considered.
Bridge abutments do not allow for this.
Bridge abutments do not allow for this.
Can be seen from the drawing.
Not Applicable
Not Applicable
Not Applicable
Not Applicable
Not Applicable
Not Applicable
Not Applicable
Not Applicable
Yes
Table D1.2.2: Bridge and its surroundings

99
3,1,1 - They should appear as continuous uninterrupted lines, extending the
full length of the bridge with a generous overlap of the abutments.Yes
3,1,2 - A neat, sharp edge will help define them against the background. Yes
3,1,3 - Maximizing the shadow cast on the superstructure will further
accentuate and express their form.Yes
3,1,4 - The outer face should be a smooth single plane surface, slanted
slightly outwards towards the bottom, to better catch the sunlight.Yes
3,1,5 - The top should angle towards the road, to channel rainwater onto the
bridge, minimizing staining of the outside face.Yes
3,1,6 - If the deck soffit is visually complex, consideration should be given to
hiding this complexity, by extending the parapet soffit below the deck soffit.Yes
3,2,1 - In the elevation, hunched girders are expressive and responsive to the
forces in the bridge. They can often be more distinctive and elegant than
single depth beams.
No
3,2,2 - Three or five span haunches are aesthetically very elegant balanced
structures.Yes
3,2,3 - In cross section, if the girder is right angled it can catch the light and a
double line may be visible. Maximizing the overhang will increase the
shadow. A curved soffit will provide a gradation of tone and minimize a sharp
line at the base of th
Yes
3,3,1 - In an urban area that vertical forms are present and only close views
available, headstock may provide a reassuring sense of strength and
durability, as well as visual interest.
3,3,2 - In a rural area where horizontal forms predominate, headstock can be
overly complex and should be carefully considered and designed with their
visual impact in mind, or avoided.
Yes
3,3,3 - If possible headstocks should not extend across the outer face of the
girder. This introduces unnecessary complexity and appears in elevation as
if the headstock is supporting the deck rather than the girder.
Yes
3,4,1 - Bridges which have pier spacings or spans which are roughly
proportional to the bridge's height above ground level are more aesthetically
pleasing than bridges which do not follow this proportion. They seem more
responsive to their context.
Yes
3,4,2 - Collecting multiple piers into pairs or clusters can open up views
below the deck and also give rhythm and elegance to the supports.Yes
3,4,3 - Rounding off the corners of rectangular piers provides a softer form,
which may be preferable in certain contexts. For example where the
presence of the pier needs to be down played so that superstructure is
dominant, e.g. in a rural setting.
No
3,4,4 - Pier shapes which have a slight taper (A taper of around 1:80) are
desirable.No
3,4,5 - The reverse taper should only be used where the appearance of
rigidity is required between superstructure and pier. Otherwise the
appearance of the top heavy pier can be imbalanced and does not reflect the
forces acting on the pier well.
No
Assumed to be considered.
Assumed to be considered.
Assumed to be considered.
Assumed to be considered.
This hasn't been considered.
This hasn't been considered.
This hasn't been considered.
Can be seen from the drawing.
Assumed to be considered.
Assumed to be considered.
Assumed to be considered.
Not Applicable
Assumed to be considered.
Can be seen from the drawing.
Assumed to be considered.
Assumed to be considered.
This hasn't been considered.
Table D1.2.3: Parts and details

100
3,5,1 - The proportion of pier size to pile cap size should be considered.
Imbalanced proportions should be avoided.
3,6,1 - If using of wall abutments is unavoidable the use of planting should
be considered to screen the abutment walls.No
3,6,2 - Reducing the abutments can create a more refined and better looking
bridge. It does however increase the span and therefore depth of beam.No
3,6,3 - Continuing the superstructure or the parapet allows the shadow line
to reduce the dominance of the abutment, and makes the bridge appear
longer and more elegant.
Yes
3,6,4 - Angling the abutments provides a more open sleek look and helps
visually anchor the span.No
3,6,5 - Spill through abutments allow open views to the landscape and better
visibility to the road beyond.Yes
3,6,6 - slight angle on the taper can make the wall appear less dominating
especially if next to a footpath. This avoids visual crowding.No
3,8,2 - The screens should extend to the ends of the bridge span and
consideration should be given to integrating the bridge barrier and safety
screens.
3,9,1 - Where possible lighting on bridges should be minimized or avoided. Yes
3,9,2 - If necessary lighting should be used in the median as far from the
parapet as possible to reduce clutter or designed into the parapet structure.Yes
3,9,3 - If considerable effort is put into the design of the appearance of the
bridge it is better value for money to allow the bridge to be viewed at night
(dependent on context, cost, safety and environmental issues).
Yes
3,11,1 - Where possible avoid the use of noise walls on bridges. Yes
3,12,2 - A neutral palette of black, gray and white tend to give a clear
definition of the bridge as an object in the landscape.Yes
3,11,2 - The use of transparent panels should be considered so that the
apparent slenderness of the superstructure is not affected.
3,8,1 - An outward curving screen creates a more open feeling for bridge
users. However it presents a greater apparent depth of structure for
onlookers.
Not Applicable
Assumed to be considered.Yes
Yes3,10,1 - The colour and grade of the pipe system must be considered as
these aspects can jar with the overall bridge design.
Not Applicable
3,5,2 - In a tidal watercourse, if the view of the piles is to be minimised, the
pile cap may require a skirt as they need to be visible to boats and shipping
as a safety measure.
3,12,1 - Landscape tones are generally subdued and dark; therefore light
colours and textures (for bridge primary elements) provide a good contrast.
(the exception is when they are culturally appropriate such as traditional
Chinese bridges or unique icon
Yes
Yes Assumed to be considered.
Not Applicable
3,7,1 - With the exception of name plates and navigation signs, signage
should be kept off bridges as far as possible. They add clutter and
complexity and detract from the structure. They also obstruct views from the
bridge.
Not Applicable
Assumed to be considered.
Assumed to be considered.
This hasn't been considered.
Bridge abutments do not allow for this.
Assumed to be considered.
Assumed to be considered.
This hasn't been considered.
Assumed to be considered.
Assumed to be considered.
Assumed to be considered.
Assumed to be considered.
Can be seen from the drawing.
This hasn't been considered.
Table D1.2.3: Parts and details (Cont‟d)

101
D1-3) Aesthetics - Bridge 3
With the aid of Fig. E2 (chapter 3) determine the aesthetics impact score for Bridge 3. Assume the designer has no past
performance but has appointed a liaison officer to consult with the public.
(i) Guidelines
Completed copies of Tables 2.25-2.27 for Bridge 3 are shown below. The results are summarised in the table and used in
conjunction with the weighting factors shown in Table 2.28 to score the guidelines.
Guidelines Relevant
guidelines
Guidelines
observed
% observed Score
(%)
Bridge as a whole
Bridge and its surroundings
Parts and details
8
9
31
3
4
23
37.5
44.4
74.2
9.4
11.1
18.6
Total 39.1
(ii) Past performance/liaison officer
From Table 2.29 it can be seen that the score is 7 out of 10 giving an impact of
5.7%2510
71
(iii) Sustainability score
The overall sustainability score for aesthetics is
39.1 + 7.5 = 46.6
1,1,1 - Excessive imbalanced proportions between significant elements
should be avoided as much as possible.No
1,1,2 - Similar proportions or ratios throughout the structure can create a
harmony.No
1,1,3 - The ratio of Deck to Parapet Depth is also considered a significant
aesthetic proportion and guidelines have been developed by Cardiff
University School of Engineering
Yes
1,1,4 - the Span to Depth ratio is determined by the structural design. The
value of the span-to-depth ratio can be an indicator of aesthetic design. The
general agreement among bridge design experts states that span-to-depth
ratio between 15 and 30 provi
Yes
1,4,2 - Honesty of form is about the materials and structures to look like what
they are.Yes
1,2,1 - it must be considered as an important aesthetic indicator because
symmetrical bridges are often more aesthetically pleasing than non
symmetricals.
1,4,1 - The complexity of a bridge should be minimized especially in natural
landscape settings as it tends to attract the eye and competes with views of
the landscape.
No
Assumed to be considered.
No
No
1,3,1 - to achieve a consistent order, bridge spans should match where
possible. Also, the interaction of bridge elements like lighting columns,
barrier supports and piers should be considered.
Unnecessary implication by having
abutment wall on one side and bankseat
on the other.
Can be seen from the drawing.
Abutments and the deck are not in
harmony.
Abutments are not in the same prportion.
Abutments are not in the same prportion.
Assumed to be considered.
Assumed to be considered.
Table D1.3.1: Bridge as a whole

102
2,1,1 - Make the bridge as invisible as possible to hide it in the landscape.
(suits to smaller bridges)No
2,1,2 - Make the bridge as simple and elegant as possible to complement the
landscape: This approach is a practical, cost effective objective for
overpasses and larger bridges and can lead to good looking bridge
solutions.
No
2,1,3 - Maximize views of the landscape through the bridge: By minimizing
the profile of the bridge, the landscape setting will dominate the view and be
appreciated from all viewpoints.
No
2,1,4 - Bridges with a horizontal form are generally preferable to bridges on a
grade over flat simple landscapes and significant expanses of waterYes
2,1,5 - Significant stands of existing vegetation should be retained Yes
2,1,6 - Footprint of the bridge (e.g. pile caps, abutments) should be minimized
so that the retention of local vegetations maximized.Yes
2,1,7 - The presence and extent of intermediate structures and hard surfaces
between the bridge and landscape should be minimized.No
2,1,8 - Careful design of earthworks and planting and the selection of
endemic species grown from locally collected seed.No
2,2,1 - A landmark structure should be created in a way that complements or
contrasts with its visual catchments.
2,2,2 - Maximizing views from the bridge of the local urban setting
2,2,3 - Maximizing views through the bridge from the urban setting
2,2,4 - Respecting locally valued structures and their cartilages by
complementing local styles and materials
2,2,5 - Ensuring the space under the bridge is not dark, degraded and unsafe.
2,3,1 - In such cases plants should be located to the outside of the space and
irrigation may be required.
2,3,2 - Combining planting with a hard paved or gravel surface is often
appropriate.
2,3,3 - Clean uncluttered surfaces, neat connections and simple layout of
girders will help to give a neat appearance.
2,3,4 - When designing the soffit, consider bracing, when it is required, and
ensure an orderly and regular pattern where possible.
2,4,1 - Short span (up to approximately 18m): prestressed concrete plank
bridges.
2,4,2 - Short to medium span (approximately 18-40m): pre-stressed concrete
girders or pre-stressed concrete voided slabs.
2,4,3 - Medium span (approximately 40-80m): ste
Not Applicable
Assumed to be considered.
Assumed to be considered.
Bridge abutments do not allow for this.
Bridge abutments do not allow for this.
This hasn't been considered.
Bridge abutments do not allow for this.
Bridge abutments do not allow for this.
Can be seen from the drawing.
Not Applicable
Not Applicable
Not Applicable
Not Applicable
Not Applicable
Not Applicable
Not Applicable
Not Applicable
Yes
Table D1.3.2: Bridge and its surroundings

103
3,1,1 - They should appear as continuous uninterrupted lines, extending the
full length of the bridge with a generous overlap of the abutments.Yes
3,1,2 - A neat, sharp edge will help define them against the background. Yes
3,1,3 - Maximizing the shadow cast on the superstructure will further
accentuate and express their form.Yes
3,1,4 - The outer face should be a smooth single plane surface, slanted
slightly outwards towards the bottom, to better catch the sunlight.Yes
3,1,5 - The top should angle towards the road, to channel rainwater onto the
bridge, minimizing staining of the outside face.Yes
3,1,6 - If the deck soffit is visually complex, consideration should be given to
hiding this complexity, by extending the parapet soffit below the deck soffit.Yes
3,2,1 - In the elevation, hunched girders are expressive and responsive to the
forces in the bridge. They can often be more distinctive and elegant than
single depth beams.
No
3,2,2 - Three or five span haunches are aesthetically very elegant balanced
structures.Yes
3,2,3 - In cross section, if the girder is right angled it can catch the light and a
double line may be visible. Maximizing the overhang will increase the
shadow. A curved soffit will provide a gradation of tone and minimize a sharp
line at the base of th
Yes
3,3,1 - In an urban area that vertical forms are present and only close views
available, headstock may provide a reassuring sense of strength and
durability, as well as visual interest.
3,3,2 - In a rural area where horizontal forms predominate, headstock can be
overly complex and should be carefully considered and designed with their
visual impact in mind, or avoided.
Yes
3,3,3 - If possible headstocks should not extend across the outer face of the
girder. This introduces unnecessary complexity and appears in elevation as
if the headstock is supporting the deck rather than the girder.
Yes
3,4,1 - Bridges which have pier spacings or spans which are roughly
proportional to the bridge's height above ground level are more aesthetically
pleasing than bridges which do not follow this proportion. They seem more
responsive to their context.
Yes
3,4,2 - Collecting multiple piers into pairs or clusters can open up views
below the deck and also give rhythm and elegance to the supports.Yes
3,4,3 - Rounding off the corners of rectangular piers provides a softer form,
which may be preferable in certain contexts. For example where the presence
of the pier needs to be down played so that superstructure is dominant, e.g.
in a rural setting.
No
3,4,4 - Pier shapes which have a slight taper (A taper of around 1:80) are
desirable.No
3,4,5 - The reverse taper should only be used where the appearance of
rigidity is required between superstructure and pier. Otherwise the
appearance of the top heavy pier can be imbalanced and does not reflect the
forces acting on the pier well.
No
3,5,1 - The proportion of pier size to pile cap size should be considered.
Imbalanced proportions should be avoided.
3,6,1 - If using of wall abutments is unavoidable the use of planting should be
considered to screen the abutment walls.No
3,6,2 - Reducing the abutments can create a more refined and better looking
bridge. It does however increase the span and therefore depth of beam.No
3,6,3 - Continuing the superstructure or the parapet allows the shadow line to
reduce the dominance of the abutment, and makes the bridge appear longer
and more elegant.
Yes
3,6,4 - Angling the abutments provides a more open sleek look and helps
visually anchor the span.No
3,6,5 - Spill through abutments allow open views to the landscape and better
visibility to the road beyond.Yes
3,6,6 - slight angle on the taper can make the wall appear less dominating
especially if next to a footpath. This avoids visual crowding.No
3,8,2 - The screens should extend to the ends of the bridge span and
consideration should be given to integrating the bridge barrier and safety
screens.
3,9,1 - Where possible lighting on bridges should be minimized or avoided. Yes
3,9,2 - If necessary lighting should be used in the median as far from the
parapet as possible to reduce clutter or designed into the parapet structure.Yes
3,9,3 - If considerable effort is put into the design of the appearance of the
bridge it is better value for money to allow the bridge to be viewed at night
(dependent on context, cost, safety and environmental issues).
Yes
3,11,1 - Where possible avoid the use of noise walls on bridges. Yes
3,12,2 - A neutral palette of black, gray and white tend to give a clear
definition of the bridge as an object in the landscape.Yes Assumed to be considered.
Assumed to be considered.
Assumed to be considered.
Can be seen from the drawing.
This hasn't been considered.
Not Applicable
Assumed to be considered.
Assumed to be considered.
Bridge abutments do not allow for this.
Assumed to be considered.
Assumed to be considered.
This hasn't been considered.
Assumed to be considered.
Assumed to be considered.
This hasn't been considered.
This hasn't been considered.
This hasn't been considered.
Not Applicable
3,7,1 - With the exception of name plates and navigation signs, signage
should be kept off bridges as far as possible. They add clutter and
complexity and detract from the structure. They also obstruct views from the
bridge.
This hasn't been considered.
Can be seen from the drawing.
Assumed to be considered.
Assumed to be considered.
This hasn't been considered.
Assumed to be considered.
Assumed to be considered.
3,12,1 - Landscape tones are generally subdued and dark; therefore light
colours and textures (for bridge primary elements) provide a good contrast.
(the exception is when they are culturally appropriate such as traditional
Chinese bridges or unique icon
Yes Assumed to be considered.
Yes Assumed to be considered.
3,5,2 - In a tidal watercourse, if the view of the piles is to be minimised, the
pile cap may require a skirt as they need to be visible to boats and shipping
as a safety measure.
Assumed to be considered.
Not Applicable
Assumed to be considered.
Can be seen from the drawing.
Assumed to be considered.
Not Applicable
Assumed to be considered.
3,11,2 - The use of transparent panels should be considered so that the
apparent slenderness of the superstructure is not affected.
3,8,1 - An outward curving screen creates a more open feeling for bridge
users. However it presents a greater apparent depth of structure for
onlookers.
Not Applicable
Assumed to be considered.Yes
Yes3,10,1 - The colour and grade of the pipe system must be considered as
these aspects can jar with the overall bridge design.
Table D1.3.3: Parts and details

104
D2-1) Dust - Bridge 2
Assuming the following determine the dust score for Bridge 2
the ambient dust level is 150 g and the maximum expected dust level during construction and
maintenance does not exceed 160 g
it is in the vicinity of a hospital
dust, noise and vibrating producing activities are carried out during the daytime during weekdays and at
weekends
the contractor has no past performance but has appointed a liaison officer to consult with the public
duration of dust nuisance : construction period – 76 days
: maintenance period – 168 days
Thus the scores are as follows
Dust level
10150160
Sensitive premises
From Table 2.29 the score is 20
Public consultation and contractor performance
From Table 2.28 it can be seen that the score is 3
Duration
The score is (76 + 3 × 168 = ) 580 being equal to the number of days required for construction and
maintenance.
Sustainability score
The overall sustainability score for dust is
10 × 20 × 3 × 580 = 348,000
D2-2) Dust - Bridge 3
Assuming the following determine the dust score for Bridge 3
the ambient dust level is 150 g and the maximum expected dust level during construction and
maintenance does not exceed 160 g
it is in the vicinity of a hospital
dust, noise and vibrating producing activities are carried out during the daytime during weekdays and at
weekends
the contractor has no past performance but has appointed a liaison officer to consult with the public
duration of dust nuisance : construction period – 90 days
: maintenance period – 196 days
Thus the scores are as follows
Dust level
10150160
Sensitive premises
From Table 2.29 the score is 20
Public consultation and contractor performance
From Table 2.28 it can be seen that the score is 3
Duration
The score is (90 + 3 × 196 = ) 678 being equal to the number of days required for construction and
maintenance.
Sustainability score
The overall sustainability score for dust is
10 × 20 × 3 × 678 = 406,000

105
D3-1) Noise score for Bridge 2
Assuming the following calculate the dust score for Bridge 2
the ambient noise level is 60 dBA and the maximum expected noise level during construction and
maintenance is 90 dBA
duration of noise nuisance : construction period – 76 days
: maintenance period – 168 days
it is in the vicinity of a hospital
the contractor has no past performance but has appointed a liaison officer to consult with the public
the design incorporates a low noise road surface
Net increase in noise level
Assuming the ambient noise level is 60 dBA and the maximum expected noise level is 90 dBA during
construction and maintenance work, the score is
90 – 60 = 30
Duration
The score for this factor is
76 + 3 × 168 = 580
Sensitive premises
From Table 2.29 the score is 20
Public consultation and contractor performance
From Table 2.28 it can be seen that the score is 3
Mitigation measures
Modify score by 1/10.
Sustainability score
The overall sustainability score for noise is
30 × 580 × 20 × 3 × 1/10 = 104,400
D3-2) Noise score for Bridge 3
Assuming the following calculate the dust score for Bridge 3
the ambient noise level is 60 dBA and the maximum expected noise level during construction and
maintenance is 90 dBA
duration of noise nuisance : construction period – 90 days
: maintenance period – 196 days
it is in the vicinity of a hospital
the contractor has no past performance but has appointed a liaison officer to consult with the public
the design incorporates a low noise road surface
Net increase in noise level
Assuming the ambient noise level is 60 dBA and the maximum expected noise level is 90 dBA during
construction and maintenance work, the score is
90 – 60 = 30
Duration
The score for this factor is
90 + 3 × 196 = 678
Sensitive premises
From Table 2.29 the score is 20
Public consultation and contractor performance
From Table 2.28 it can be seen that the score is 3
Mitigation measures
Modify score by 1/10.
Sustainability score
The overall sustainability score for noise is
30 × 678 × 20 × 3 × 1/10 = 122,040

106
D4-1) Vibration score for Bridge 2
Assuming the following calculate the vibration score for Bridge 2
the root mean square acceleration is 0.5
the duration of vibration occurrence in seconds is 1200 sec and the average number of occurrences per
day is 6
duration of vibration nuisance : construction period – 76 days
: maintenance period – 168 days
the bridge is in the vicinity of a hospital
the contractor has no past performance but has appointed a liaison officer to consult with the public
Vibration dose
The vibration dose is given by
= 1.4at0.25
= 1.4 × 0.5 × (1200 × 6)0.25
= 6.45
Duration
The score for this factor is
76 + 3 × 168 = 580
Sensitive premises
From Table 2.29 the score is 20
Public consultation and contractor performance
From Table 2.28 it can be seen that the score is 3
Sustainability score
The overall sustainability score for vibration is
6.45 × 580 × 20 × 3 = 224, 460
D4-2) Vibration score for Bridge 3
Assuming the following calculate the vibration score for Bridge 3
the root mean square acceleration is 0.5
the duration of vibration occurrence in seconds is 1200 sec and the average number of occurrences per
day is 6
duration of vibration nuisance : construction period – 90 days
: maintenance period – 196 days
the bridge is in the vicinity of a hospital
the contractor has no past performance but has appointed a liaison officer to consult with the public
Vibration dose
The vibration dose is given by
= 1.4at0.25
= 1.4 × 0.5 × (1200 × 6)0.25
= 6.4
Duration
The score for this factor is
90 + 3 × 196 = 678
Sensitive premises
From Table 2.29 the score is 20
Public consultation and contractor performance
From Table 2.28 it can be seen that the score is 3
Sustainability score
The overall sustainability score for vibration is
6.45 × 678 × 20 × 3 = 262, 386

107
Appendix E: Assessment form
Project Assessment Sheet: Sustainability Appraisal of Bridges
NAME ………………………………………………
v. good poor/not attempted
Exercise 1
Exercise 2
Exercise 3
- Table Ex 1.8
- (a)
- (b)
- (c)
- (d)
Exercise 4
Exercise 5
- Table Ex 2.3
- (ii) (a)
- (ii) (b)
- (ii) (c)
- (ii) (d)
- (ii) (e)
- (iii)
- (iv)
Exercise 6
- Scoping
- Scoring
- Assessment
Exercise 7
- Dust
- Noise
- Vibration
- Comparison
Exercise 8
Exercise 9
- (i)
- (ii)
- (iii)
Exercise 10
- Table Ex 4.2
- Comment
Overall Appreciation
Appearance and Layout
Other comments
Grade ………………..

108
Appendix F: PowerPoint presentation – Sustainability Appraisal Tools

A Higher Education Academy Engineering Subject Centre Mini Project