Embed Size (px)
DESCRIPTION
Stages of Lung Development. Embryonic (E9 – E12) Primitive lung buds emerge from ventral gut epithelium Pseudoglandular (E12-E15) Stereo-specific branching of the lung bronchi. Differentiation of epithelial cells to form prealveolate saccules Canalicular (E15-E17) - PowerPoint PPT Presentation
Citation preview

• Embryonic (E9 – E12)– Primitive lung buds emerge from
ventral gut epithelium
• Pseudoglandular (E12-E15)– Stereo-specific branching of the lung
bronchi. Differentiation of epithelial cells to form prealveolate saccules
• Canalicular (E15-E17)– Formation of terminal sacs and
vasculature
• Saccular (E17 – Birth)– Expansion in the numbers of terminal
sacs and capillaries. Differentiation of Type I and II alveolar cells
• Alveolar (Birth-P30)– terminal sacs develop into mature
alveolar ducts and alveoli
Stages of Lung Development
http://www.cincinnatichildrens.org/research/div/pulmonary-biology/faculty-research/whitsett-lab/projects.htm
E = EmbryonicP = Postnatal

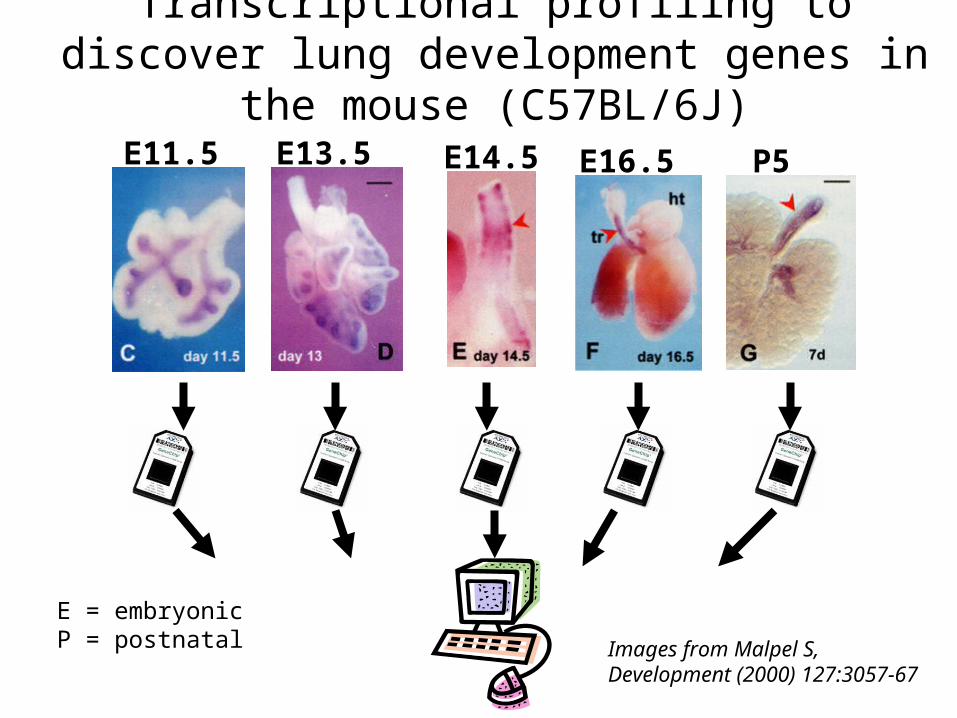
Transcriptional profiling to discover lung development genes in the mouse (C57BL/6J)
E11.5 E13.5 E14.5 E16.5 P5
Images from Malpel S, Development (2000) 127:3057-67
E = embryonicP = postnatal

Temporal gene expression patterns
Ernst et al. (2005) Bioinformatics 21:159.
• Used Short Time-series Expression Miner (STEM)• STEM first builds model expression profiles based on
the number of time points– Profiles are complete and distinct
• Clustering algorithm assigns each gene to the profile that most closely matches its expression pattern across the time series
• Permutation tests used to determine significance of the profiles
Ernst and Bar-Joseph. (2006) BMC Bioinformatics 7:191.

349312 196 141 431
320 139
Gene expression profiles in normal mouse lung development
http://www.cs.cmu.edu/~jernst/stem/
Number of genes that match the expression profile
Data shown for three time points:E14.5, E16.5, P5

Expression change plots for STEM profiles


Gene List Interpretation1110005A23Rik, 1700009P03Rik, 1700020C11Rik, 1810058I14Rik, 2210018M11Rik, 2610301G19Rik, 2810407C02Rik, 4931406I20Rik, 4932432K03Rik, 5730467H21Rik, 5830411E10Rik, 6330581L23Rik, 9030612M13Rik, AI848100, Abca3, Abcc4, Abcd1, Acad10, Acads, Acsbg1, Acsl5, Adam12, Adamts20, Adamts5, Adamts9, Adcy3, Akap2, Alas1, Aldh1a1, Aldh1l1, Aldoc, Alg14, Alg6, Amph, Aox3, Aplp2, Appbp2, Aqp5, Arf2, Arf4, Arhgap6, Art3, Atf6, Atm, Atp1b1, Atp6v0b, Atp6v1e1, Atp7a, Atp8a1, Atp8b2, B230118G17Rik, BC016495, Bbs4, Bcat1, Bcl2l2, Bclaf1, Bid, Bpgm, Bphl, Braf, Brunol4, Btbd4, Bzw1, C1qtnf3, C730048C13Rik, Cacna1d, Cadps2, Calm2, Camk2d, Camkk2, Cart1, Casp7, Cav1, Ccnb1, Ccni, Cd36, Cdc26, Cdca5, Cdkn1b, Cdkn1c, Cdkn3, Cdx2, Cebpg, Ches1, Cited1, Clca1, Clta, Clu, Cmpk, Cnot6, Cntn4, Col18a1, Col3a1, Col4a1, Col4a6, Col9a1, Cox6b2, Cpm, Cpne5, Crbn, Crls1, Cse1l, Ctnnb1, Ctps2, Ctse, Cul3, Cyp11a1, D11Ertd333e, D1Ertd161e, D230025D16Rik, D830007F02Rik, Daam2, Dab1, Dach1, Dapk2, Dcamkl1, Dhfr, Dhrs8, Dnajc15, Dtymk, Dusp4, Dyrk1a, E2f7, Eda2r, Ednra, Ell2, Elmo3, Enah, Enpep, Enpp2, Epb4.1, Eps8, Esm1, Etv5, Eya1, Fabp3, Fabp5, Fank1, Fath, Fblim1, Fbxl20, Fbxl3, Fbxw7, Fem1c, Fgfr2, Fhit, Fhl2, Fkbp6, Folr1, Foxp1, Frk, Fusip1, Fxyd6, Fzd9, Gas7, Gata2, Gdpd2, Gja1, Gpc3, Gpx3, Gstk1, Gstp1, H2-Aa, H3f3a, Hdac9, Hel308, Hesx1, Heyl, Hhip, Hif3a, Hipk2, Hist1h2bc, Hnrpf, Hook1, Hoxd8, Hsd17b12, Hsp90b1, Hspa1b, Htra3, Ifitm3, Ifnar2, Igf1, Igfbp2, Igfbp3, Igfbp7, Ing3, Ipo7, Itga4, Itgb1, Itpr2, Jarid1d, Kcnab1, Kcnb1, Kcnip1, Kcnip4, Kcnj16, Kcns2, Kdr, Keap1, Kif2a, Klf6, Klf7, Klk1, Krt2-7, Krt2-8, Lama5, Lass6, Lcn2, Lgals7, Lgtn, Lhx1, Lhx9, Lmo4, Lrrc16, Lrrk1, Lsp1, Lss, Ltf, Madd, Mafa, Man1a2, Mapk1, Mapre1, Masp1, Mef2c, Mlph, Mmp19, Mod1, Morf4l1, Morf4l2, Mrpl18, Mrpl44, Mt1, Mt2, Mtdh, Mterf, Mthfd1, Mtm1, Mtr, Mtx2, Myef2, Myl1, Mylc2b, Mylk, Myo1b, Myo5b, Narg1, Nedd9, Neo1, Nfe2l2, Npc1, Npepl1, Npr2, Nr2f2, Nrg1, Nusap1, Ogt, Otx2, Pak1, Pak3, Papss2, Pard6b, Parp1, Pbx3, Pcbd1, Pcmtd1, Pcsk5, Pctk1, Pctk3, Pdcd6ip, Pdia3, Pfdn4, Pftk1, Phb2, Phca, Phf8, Phka1, Pitx2, Pja1, Pja2, Pnck, Pomgnt1, Porcn, Ppargc1a, Ppfibp1, Ppih, Ppp1r16b, Prc1, Prcp, Prkag2, Prkar2b, Prkcd, Psmb3, Psrc1, Ptch1, Pten, Ptgds, Ptk2b, Ptp4a1, Ptp4a2, Ptp4a3, Ptpn13, Ptx3, Qscn6, Rab2b, Rab31, Rab3a, Rab3b, Rad51l3, Rec8L1, Ren2, Rims4, Rkhd3, Rnf11, Rnf20, Robo2, Rpl39, Rps6ka3, Runx1, Runx2, Rxrb, Ryr2, S100a6, S100a9, Sat1, Scd1, Scmh1, Scn3a, Scn7a, Scn8a, Scrn1, Sdk2, Sec24a, Sec61a2, Sema3a, Sept11, Serpina3g, Sesn3, Sf4, Sfrs1, Sgk3, Shb, Sin3b, Slc11a2, Slc16a10, Slc16a7, Slc18a2, Slc25a5, Slc26a1, Slc2a13, Slc38a5, Slc39a10, Slc41a2, Slc6a14, Slc6a15, Slc6a6, Slc7a4, Slc9a2, Smc2l1, Smg5, Snapap, Sncaip, Snrk, Soat1, Sorl1, Sox10, Sox11, Sox9, Spp1, Srp54, St3gal5, Star, Strbp, Stxbp1, Sulf1, Suv420h1, Sv2b, Sycp3, Syn2, Sypl, Tacc1, Tcea3, Tcf12, Tdgf1, Tesc, Tfrc, Tgfa, Tgfb2, Thap7, Timp1, Tinagl, Tm9sf3, Tmed7, Tmed9, Tmem23, Tmpo, Tmprss13, Tradd, Tram2, Trappc5, Trim23, Trim66, Tsc1, Tspyl2, Txndc10, Txndc2, Tyro3, Uchl5, Uhrf2, Usp12, Usp7, Utp15, Uty, Vcpip1, Vim, Vldlr, Yes1, Ywhaz, Zdhhc2, Zfhx1b, Zfp148, Zfp192, Zfp275, Zfp277, Zfp28, Zfp30, Zfp36, Zfp583, Zfp62, Zfp68

Nat Genet (2000) 25: 25-29

What is an Ontology?
“Ontologies provide controlled, consistent vocabularies to describe concepts and relationships, thereby enabling knowledge-sharing”
(Tom Gruber, Stanford University)
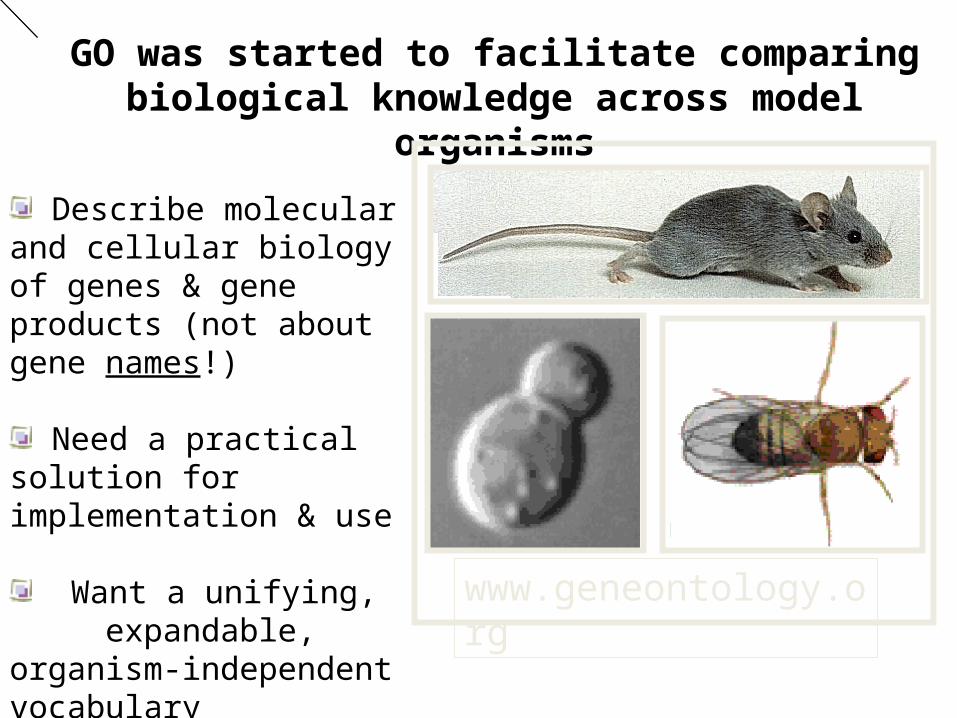
GO was started to facilitate comparing biological knowledge across model organisms
Describe molecular and cellular biology of genes & gene products (not about gene names!)
Need a practical solution for implementation & use
Want a unifying, expandable, organism-independent vocabulary www.geneontology.org

The GO vocabularies
• Molecular Function: What a product ‘does’, precise activity
• Biological Process Biological objective, accomplished via one or more ordered assemblies of
functions
• Cellular Component ‘is located in’ (‘is a subcomponent of’ )
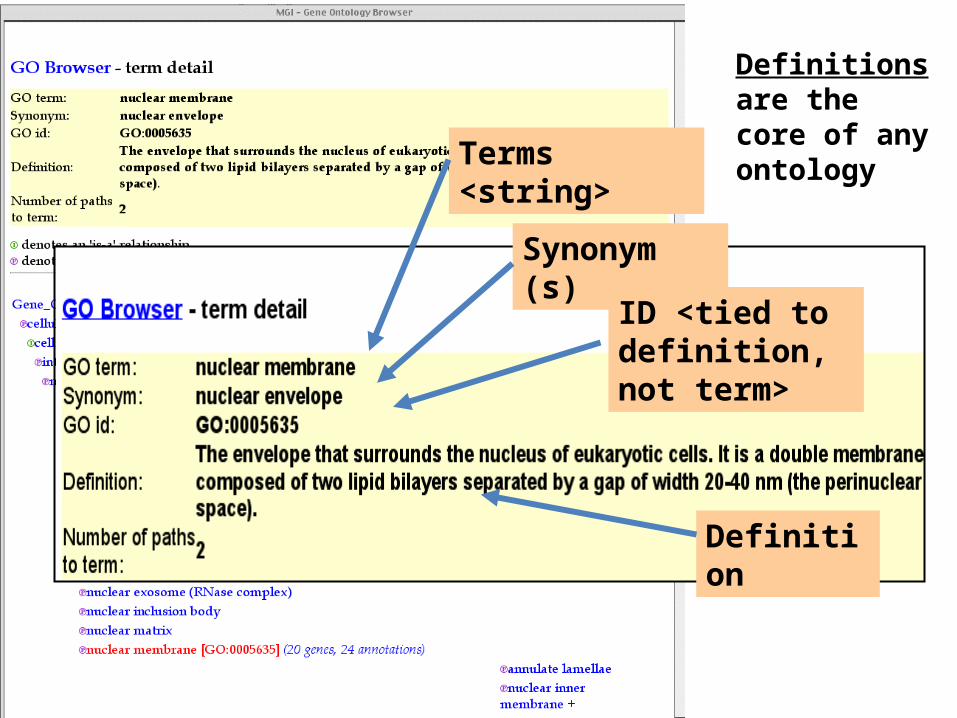
Definitions are the core of any ontologyTerms <string>
Synonym (s)
ID <tied to definition, not term>
Definition
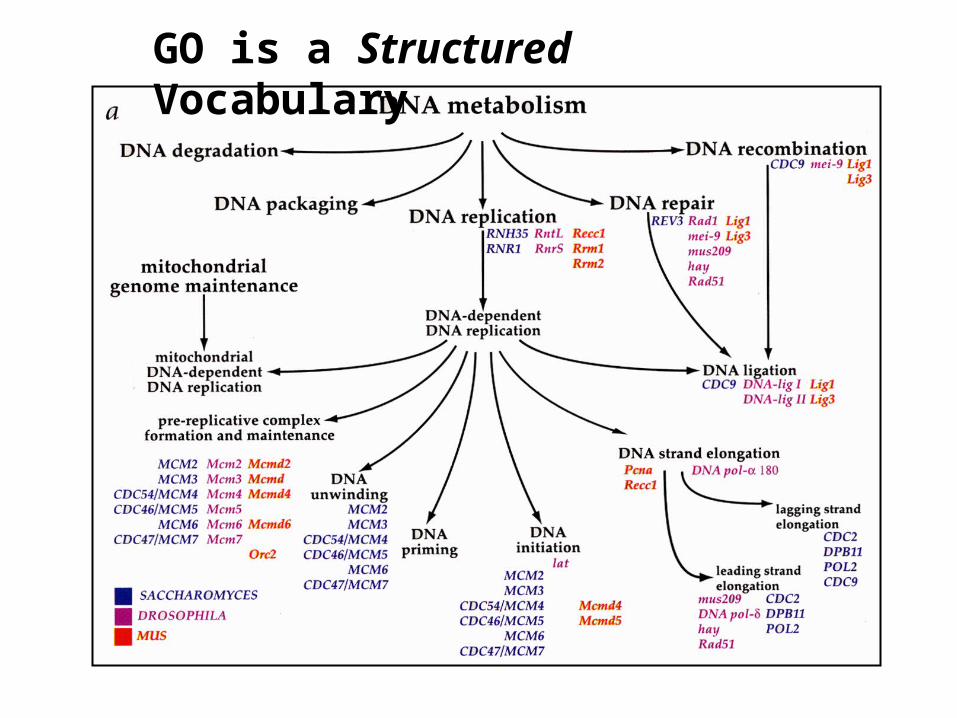
GO is a Structured Vocabulary
Transcriptional profiling to discover lung development genes in the mouse (C57BL/6J)
E11.5 E13.5 E14.5 E16.5 P5
Images from Malpel S, Development (2000) 127:3057-67
E = embryonicP = postnatal
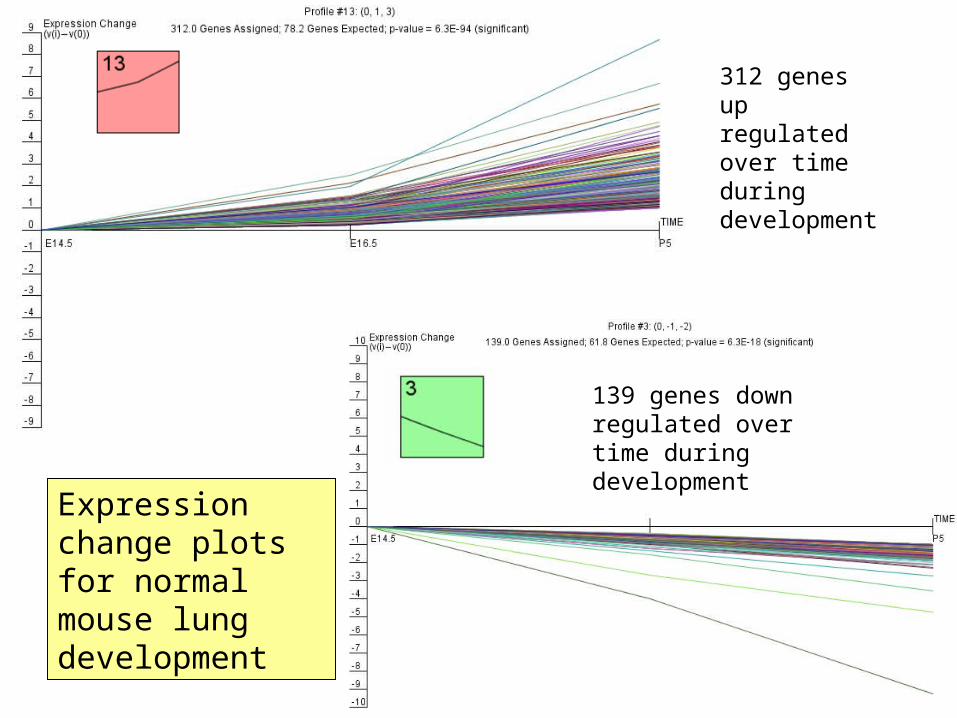
Expression change plots for normal mouse lung development
312 genes up regulated over time during development
139 genes down regulated over time during development

1110005A23Rik, 1700009P03Rik, 1700020C11Rik, 1810058I14Rik, 2210018M11Rik, 2610301G19Rik, 2810407C02Rik, 4931406I20Rik, 4932432K03Rik, 5730467H21Rik, 5830411E10Rik, 6330581L23Rik, 9030612M13Rik, AI848100, Abca3, Abcc4, Abcd1, Acad10, Acads, Acsbg1, Acsl5, Adam12, Adamts20, Adamts5, Adamts9, Adcy3, Akap2, Alas1, Aldh1a1, Aldh1l1, Aldoc, Alg14, Alg6, Amph, Aox3, Aplp2, Appbp2, Aqp5, Arf2, Arf4, Arhgap6, Art3, Atf6, Atm, Atp1b1, Atp6v0b, Atp6v1e1, Atp7a, Atp8a1, Atp8b2, B230118G17Rik, BC016495, Bbs4, Bcat1, Bcl2l2, Bclaf1, Bid, Bpgm, Bphl, Braf, Brunol4, Btbd4, Bzw1, C1qtnf3, C730048C13Rik, Cacna1d, Cadps2, Calm2, Camk2d, Camkk2, Cart1, Casp7, Cav1, Ccnb1, Ccni, Cd36, Cdc26, Cdca5, Cdkn1b, Cdkn1c, Cdkn3, Cdx2, Cebpg, Ches1, Cited1, Clca1, Clta, Clu, Cmpk, Cnot6, Cntn4, Col18a1, Col3a1, Col4a1, Col4a6, Col9a1, Cox6b2, Cpm, Cpne5, Crbn, Crls1, Cse1l, Ctnnb1, Ctps2, Ctse, Cul3, Cyp11a1, D11Ertd333e, D1Ertd161e, D230025D16Rik, D830007F02Rik, Daam2, Dab1, Dach1, Dapk2, Dcamkl1, Dhfr, Dhrs8, Dnajc15, Dtymk, Dusp4, Dyrk1a, E2f7, Eda2r, Ednra, Ell2, Elmo3, Enah, Enpep, Enpp2, Epb4.1, Eps8, Esm1, Etv5, Eya1, Fabp3, Fabp5, Fank1, Fath, Fblim1, Fbxl20, Fbxl3, Fbxw7, Fem1c, Fgfr2, Fhit, Fhl2, Fkbp6, Folr1, Foxp1, Frk, Fusip1, Fxyd6, Fzd9, Gas7, Gata2, Gdpd2, Gja1, Gpc3, Gpx3, Gstk1, Gstp1, H2-Aa, H3f3a, Hdac9, Hel308, Hesx1, Heyl, Hhip, Hif3a, Hipk2, Hist1h2bc, Hnrpf, Hook1, Hoxd8, Hsd17b12, Hsp90b1, Hspa1b, Htra3, Ifitm3, Ifnar2, Igf1, Igfbp2, Igfbp3, Igfbp7, Ing3, Ipo7, Itga4, Itgb1, Itpr2, Jarid1d, Kcnab1, Kcnb1, Kcnip1, Kcnip4, Kcnj16, Kcns2, Kdr, Keap1, Kif2a, Klf6, Klf7, Klk1, Krt2-7, Krt2-8, Lama5, Lass6, Lcn2, Lgals7, Lgtn, Lhx1, Lhx9, Lmo4, Lrrc16, Lrrk1, Lsp1, Lss, Ltf, Madd, Mafa, Man1a2, Mapk1, Mapre1, Masp1, Mef2c, Mlph, Mmp19, Mod1, Morf4l1, Morf4l2, Mrpl18, Mrpl44, Mt1, Mt2, Mtdh, Mterf, Mthfd1, Mtm1, Mtr, Mtx2, Myef2, Myl1, Mylc2b, Mylk, Myo1b, Myo5b, Narg1, Nedd9, Neo1, Nfe2l2, Npc1, Npepl1, Npr2, Nr2f2, Nrg1, Nusap1, Ogt, Otx2, Pak1, Pak3, Papss2, Pard6b, Parp1, Pbx3, Pcbd1, Pcmtd1, Pcsk5, Pctk1, Pctk3, Pdcd6ip, Pdia3, Pfdn4, Pftk1, Phb2, Phca, Phf8, Phka1, Pitx2, Pja1, Pja2, Pnck, Pomgnt1, Porcn, Ppargc1a, Ppfibp1, Ppih, Ppp1r16b, Prc1, Prcp, Prkag2, Prkar2b, Prkcd, Psmb3, Psrc1, Ptch1, Pten, Ptgds, Ptk2b, Ptp4a1, Ptp4a2, Ptp4a3, Ptpn13, Ptx3, Qscn6, Rab2b, Rab31, Rab3a, Rab3b, Rad51l3, Rec8L1, Ren2, Rims4, Rkhd3, Rnf11, Rnf20, Robo2, Rpl39, Rps6ka3, Runx1, Runx2, Rxrb, Ryr2, S100a6, S100a9, Sat1, Scd1, Scmh1, Scn3a, Scn7a, Scn8a, Scrn1, Sdk2, Sec24a, Sec61a2, Sema3a, Sept11, Serpina3g, Sesn3, Sf4, Sfrs1, Sgk3, Shb, Sin3b, Slc11a2, Slc16a10, Slc16a7, Slc18a2, Slc25a5, Slc26a1, Slc2a13, Slc38a5, Slc39a10, Slc41a2, Slc6a14, Slc6a15, Slc6a6, Slc7a4, Slc9a2, Smc2l1, Smg5, Snapap, Sncaip, Snrk, Soat1, Sorl1, Sox10, Sox11, Sox9, Spp1, Srp54, St3gal5, Star, Strbp, Stxbp1, Sulf1, Suv420h1, Sv2b, Sycp3, Syn2, Sypl, Tacc1, Tcea3, Tcf12, Tdgf1, Tesc, Tfrc, Tgfa, Tgfb2, Thap7, Timp1, Tinagl, Tm9sf3, Tmed7, Tmed9, Tmem23, Tmpo, Tmprss13, Tradd, Tram2, Trappc5, Trim23, Trim66, Tsc1, Tspyl2, Txndc10, Txndc2, Tyro3, Uchl5, Uhrf2, Usp12, Usp7, Utp15, Uty, Vcpip1, Vim, Vldlr, Yes1, Ywhaz, Zdhhc2, Zfhx1b, Zfp148, Zfp192, Zfp275, Zfp277, Zfp28, Zfp30, Zfp36, Zfp583, Zfp62, Zfp68

A Brief Statistical Detour…

Consider a population of genes representing a diverse set of biological roles or themes shown below as different colors.
Diverse Biological Roles
Thanks to John Quackenbushhttp://compbio.dfci.harvard.edu/colon_cancer.html

Many algorithms can be applied to expression data to partition genes based on expression profiles over multiple conditions.
Many of these techniques work solely on expression data and disregard biological information.
John Q.

-What are the some of the predominant biological themes represented in the gene set and how should significance be assigned to a discovered biological theme?
Consider a particular gene set…
John Q.

Example:
Population Size: 40 genesGene Set Size: 12 genes
10 genes, shown in green, have a common biological theme (GO annotation) and 8 occur within the gene set.
John Q.

The frequency of the theme in the population is 10/40 = 25%
The frequency of the theme within the cluster is 8/12 = 67%
40
12
10
8
* 80% of the genes related to the theme in the populationended up within the relatively small cluster.
AND
Consider the Outcome
John Q.

Contingency Matrix
A 2x2 contingency matrix is typically used to capture the relationships between gene set membership and membership to a biological theme.
John Q.

out
in
Theme
outin
Gene Set
2
4 26
8
ContingencyMatrix
John Q.

Assigning Significance to the Findings
The Fisher’s Exact Test permits us to determine if there arenon-random associations between the two variables, expressionbased cluster membership and membership to a particular biological theme.
8 2
4 26
in out
in
out
Gene Set
Theme p .0002
( 2x2 contingency matrix )John Q.

Hypergeometric Distribution
a b
c d
a+c
a+b
b+d
c+d
!!!!!
)!()!()!()!(
)!()!(!
!!)!(
!!)!(
dcban
dbcadcba
dcban
dbdb
caca
The probability of any particularmatrix occurring by randomselection, given no associationbetween the two variables, is givenby the hypergeometric rule.
John Q.

Probability Computation
For our matrix, 8 2
4 26, we are not only
interested in getting the probability of getting exactly8 annotation hits in the cluster but rather the probabilityof having 8 or more hits. In this case the probabilities of each of the possible matrices is summed.
9 1
3 27
10 0
2 28
8 2
4 26
.0002207 + 7.27x10⁻⁶ + 7.79x10⁻⁸ .000228John Q.

http://proto.informatics.jax.org/prototypes/vlad-1.0.3/
Are there biological processes that are enriched in the up and down regulated gene sets during lung development?
Gene list goes here
Exclude annotations made based on “sketchy” evidence

http://proto.informatics.jax.org/prototypes/vlad-1.03
VisuaL Annotation Display (VLAD) at MGI
This is a graph of GO terms, NOT genes.
The deeper the color, the more significant the association of that GO term with the gene set being analyzed.
Nodes with no text are terms in the GO hierarchy that weren’t statistically significant in the analysis.
Some aspects of graph display can be controlled by the user.

http://www.geneontology.org/GO.tools.shtml#micro
There are MANY tools designed to help you with the functional analysis of gene lists…..

http://tolfalas.informatics.jax.org/vlad/