Embed Size (px)
Citation preview

Process Control System EN 02/06
Solutions for
Courseware
Process Control
System
2 © Festo Didactic GmbH & Co. • Process Control System
This courseware has been developed and manufactured exclusively for vocational
and continuing training in process automation and control engineering.
The training company and / or trainers have the duty to ensure that trainees observe
all safety precautions described in the accompanying manuals and data sheets.
Festo Didactic GmbH & Co. and ADIRO Automatisierungstechnik GmbH will not be
liable for any damage or injury to trainees, the training company and / or other third
parties resulting from use of the equipment for any other purpose than training,
unless Festo Didactic GmbH & Co. or ADIRO Automatisierungstechnik GmbH has
caused such damage or injury willfully or through negligence.
Order no
Designation Courseware
Description Exercises for process and control engineering
Status 03/2005
Authors Jürgen Helmich, Stefan Knoblauch, Andreas Wierer (ADIRO)
Translation Williams Technical Communication Pty Ltd, Brisbane
Graphics Jürgen Helmich, Stefan Knoblauch (ADIRO)
Layout Jürgen Helmich (ADIRO)
© Festo Didactic GmbH & Co., 03/2005
Internet: www.festo.com/didactic http://www.festo.com/didactic/de/ProcessAutomation
e-mail: [email protected]
The copying, distribution and utilization of this document as well as the communication of its contents
to others without expressed authorization is prohibited. Offenders will be held liable for the payment of
damages. All rights reserved, in particular the right to carry out patent, utility model or ornamental
design registration.
Intended application
© Festo Didactic GmbH & Co. • Process Control System 3
Solutions for process and control engineering _____________________________ 5
Solution for Exercise 2.2 _______________________________________________ 5
Solution for Exercise 2.3.1______________________________________________ 9
Solution for Exercise 2.3.2 _____________________________________________ 13
Solution for Exercise 2.3.3 _____________________________________________ 14
Solution for Worksheet 3.1.1 ___________________________________________ 18
Solution for Worksheet 3.2.1 ___________________________________________ 19
Solution for Worksheet 3.2.2 ___________________________________________ 20
Solution for Worksheet 3.2.3 ___________________________________________ 21
Solution for Worksheet 3.3.1 ___________________________________________ 24
Solution for Worksheet 3.3.2 ___________________________________________ 25
Solution for Worksheet 3.4.1 ___________________________________________ 27
Solution for Worksheet 3.4.2 ___________________________________________ 29
Solution for Worksheet 3.4.3 ___________________________________________ 30
Solution for Worksheet 3.5.1 ___________________________________________ 31
Solution for Worksheet 3.6.1 for Siemens BE.SI.0193 ultrasound sensor _______ 32
Solution for Worksheet 3.6.1 for Festo 170710 ultrasound sensor _____________ 33
Solution for Worksheet 3.6.2 ___________________________________________ 34
Solution for Worksheet 3.7.1 ___________________________________________ 36
Solution for Worksheet 3.7.2 ___________________________________________ 37
Solution for Worksheet 3.8.1 ___________________________________________ 38
Contents
Contens
4 © Festo Didactic GmbH & Co. • Process Control System
Solution for Worksheet 3.8.2 ___________________________________________ 39
Solution for Worksheet 3.8.2 ___________________________________________ 40
Solution for Worksheet 3.9.1 ___________________________________________ 41
Solution for Worksheet3.9.2____________________________________________ 41
Solution for Worksheet 3.10____________________________________________ 42
Contens
Solution for Worksheet 4.1.1 ___________________________________________ 50
Solution for Worksheet 4.1.2 ___________________________________________ 51
Solution for Worksheet 4.1.3 ___________________________________________ 52
Solution for Worksheet 4.2.1 ___________________________________________ 54
Solution for Worksheet 4.2.2 ___________________________________________ 54
Solution for Worksheet 4.2.3 ___________________________________________ 56
Solution for Worksheet 4.2.4___________________________________________ 57
Solution for Worksheet 4.2.5 ___________________________________________ 59
Solution for Worksheet 4.3.1 ___________________________________________ 60
Solution for Worksheet 4.3.2 ___________________________________________ 60
Solution for Worksheet 4.3.3___________________________________________ 62
Solution for Worksheet 4.3.4___________________________________________ 63
Solution for Worksheet 4.3.5___________________________________________ 65
Solution for Worksheet 5.1.1 ___________________________________________ 66
Solution for Worksheet 5.1.1 ___________________________________________ 68
Solution for Worksheet5.1.1____________________________________________ 69
Solution for Worksheet 5.1.1 ___________________________________________ 70
Solution for Worksheet 5.1.1 ___________________________________________ 71
Solution for Worksheet 5.2.6 ___________________________________________ 72
Solution for Worksheet 5.3.1 ___________________________________________ 74
© ADIRO Automatisierungstechnik GmbH • Process Control System 6
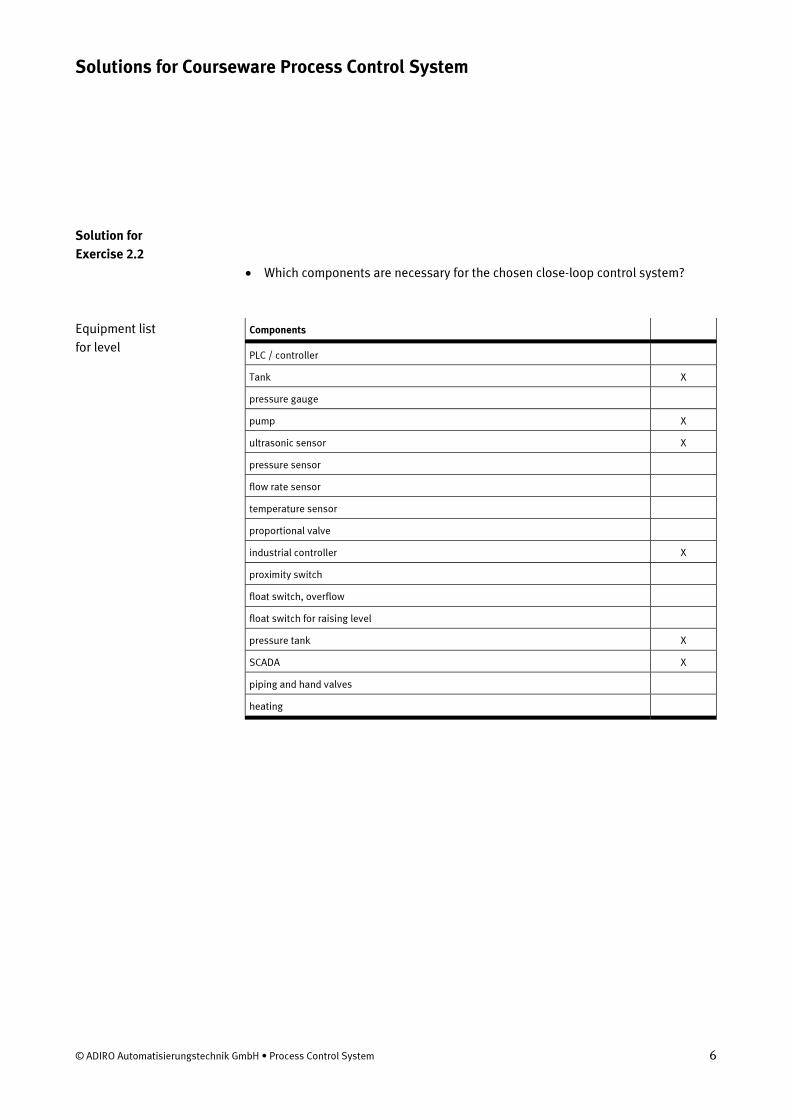
• Which components are necessary for the chosen close-loop control system?
Components
PLC / controller
Tank X
pressure gauge
pump X
ultrasonic sensor X
pressure sensor
flow rate sensor
temperature sensor
proportional valve
industrial controller X
proximity switch
float switch, overflow
float switch for raising level
pressure tank X
SCADA X
piping and hand valves
heating
Solutions for Courseware Process Control System
Solution for
Exercise 2.2
Equipment list
for level
Solutions for process and control engineering
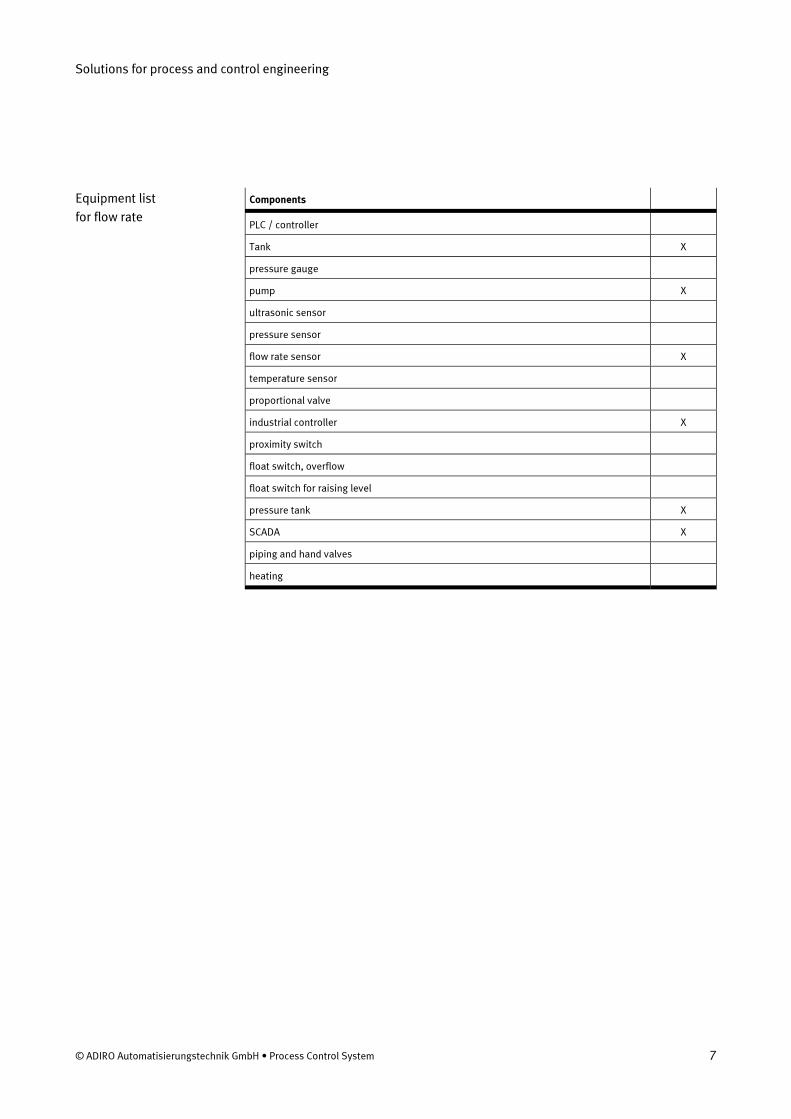
© ADIRO Automatisierungstechnik GmbH • Process Control System 7
Components
PLC / controller
Tank X
pressure gauge
pump X
ultrasonic sensor
pressure sensor
flow rate sensor X
temperature sensor
proportional valve
industrial controller X
proximity switch
float switch, overflow
float switch for raising level
pressure tank X
SCADA X
piping and hand valves
heating
Equipment list
for flow rate
Solutions for process and control engineering
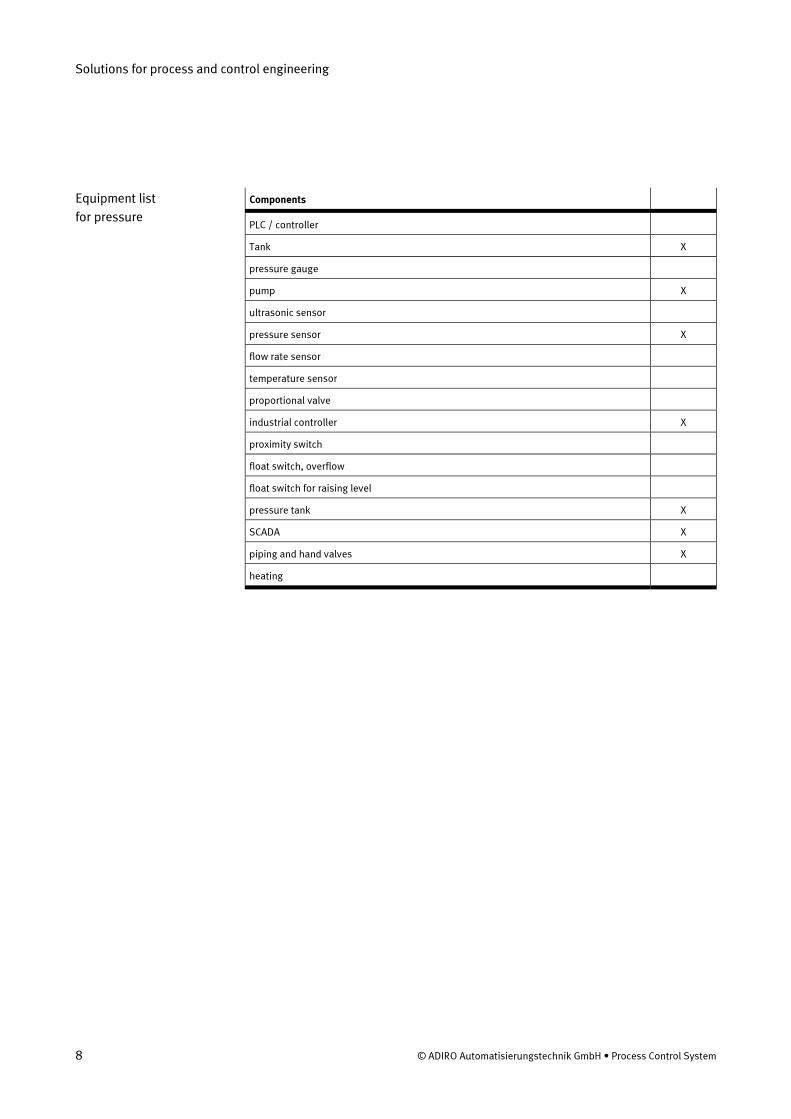
8 © ADIRO Automatisierungstechnik GmbH • Process Control System
Components
PLC / controller
Tank X
pressure gauge
pump X
ultrasonic sensor
pressure sensor X
flow rate sensor
temperature sensor
proportional valve
industrial controller X
proximity switch
float switch, overflow
float switch for raising level
pressure tank X
SCADA X
piping and hand valves X
heating
Equipment list
for pressure

Solutions for process and control engineering
© ADIRO Automatisierungstechnik GmbH • Process Control System 9
Components
PLC / controller
Tank X
pressure gauge
pump X
ultrasonic sensor
pressure sensor
flow rate sensor
temperature sensor X
proportional valve
industrial controller X
proximity switch
float switch, overflow
float switch for raising level
pressure tank X
SCADA X
piping and hand valves X
heating
Equipment list
for temperature
Solutions for process and control engineering
10 © ADIRO Automatisierungstechnik GmbH • Process Control System
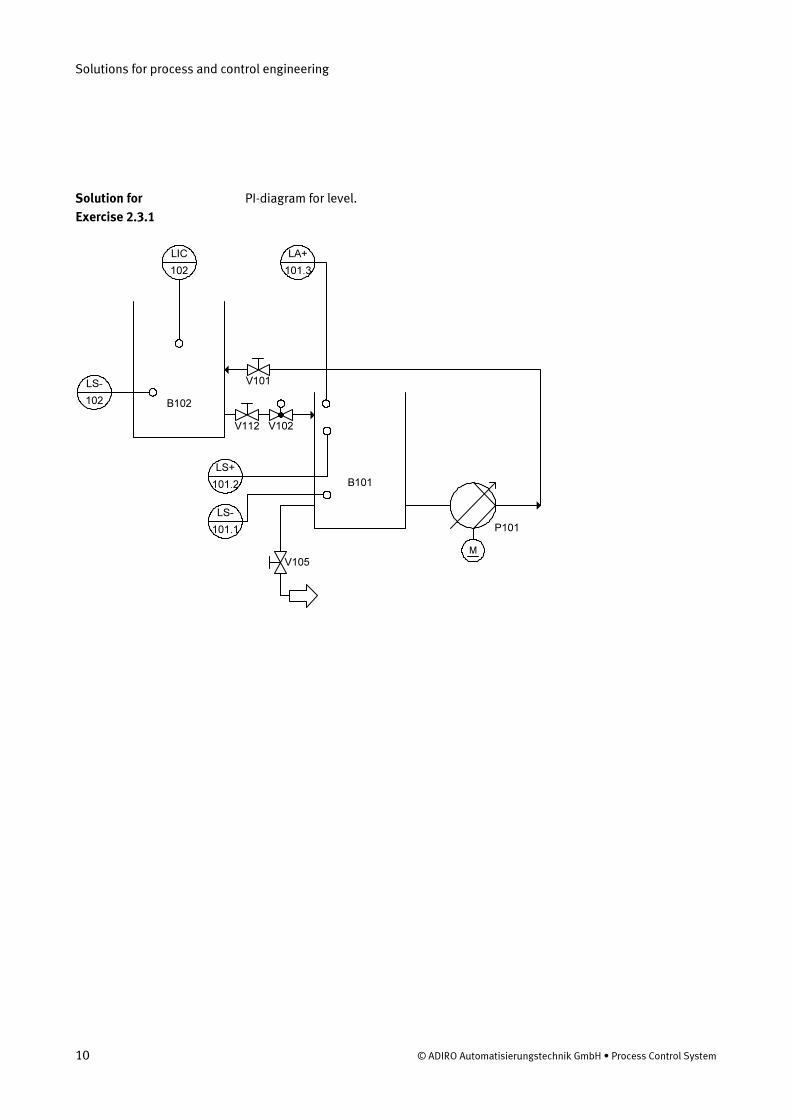
PI-diagram for level.
B101
B102
LIC
102
LA+
101.3
LS-
102
V101
V112
V105
P101
M
V102
LS-
101.1
LS+
101.2
Solution for
Exercise 2.3.1
Solutions for process and control engineering
© ADIRO Automatisierungstechnik GmbH • Process Control System 11
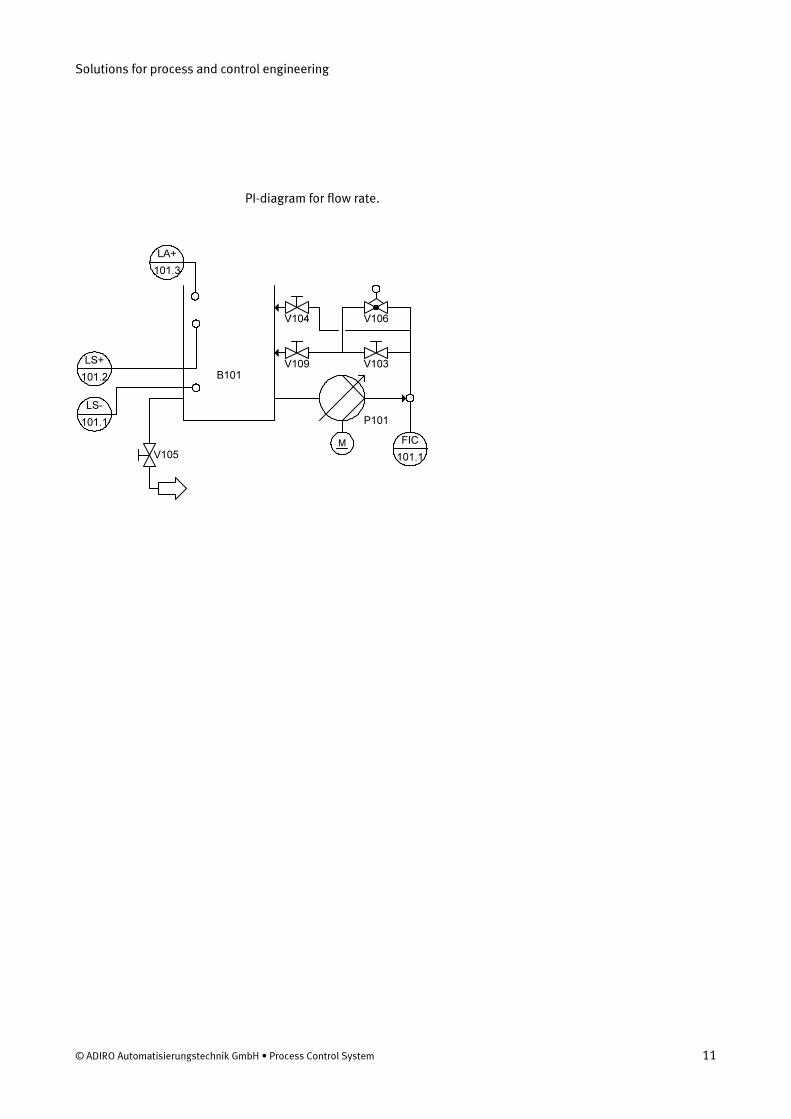
PI-diagram for flow rate.
B101
LA+
101.3
V105
LS-
101.1
LS+
101.2
FIC
101.1
V104
V109 V103
V106
P101
M
Solutions for process and control engineering
12 © ADIRO Automatisierungstechnik GmbH • Process Control System
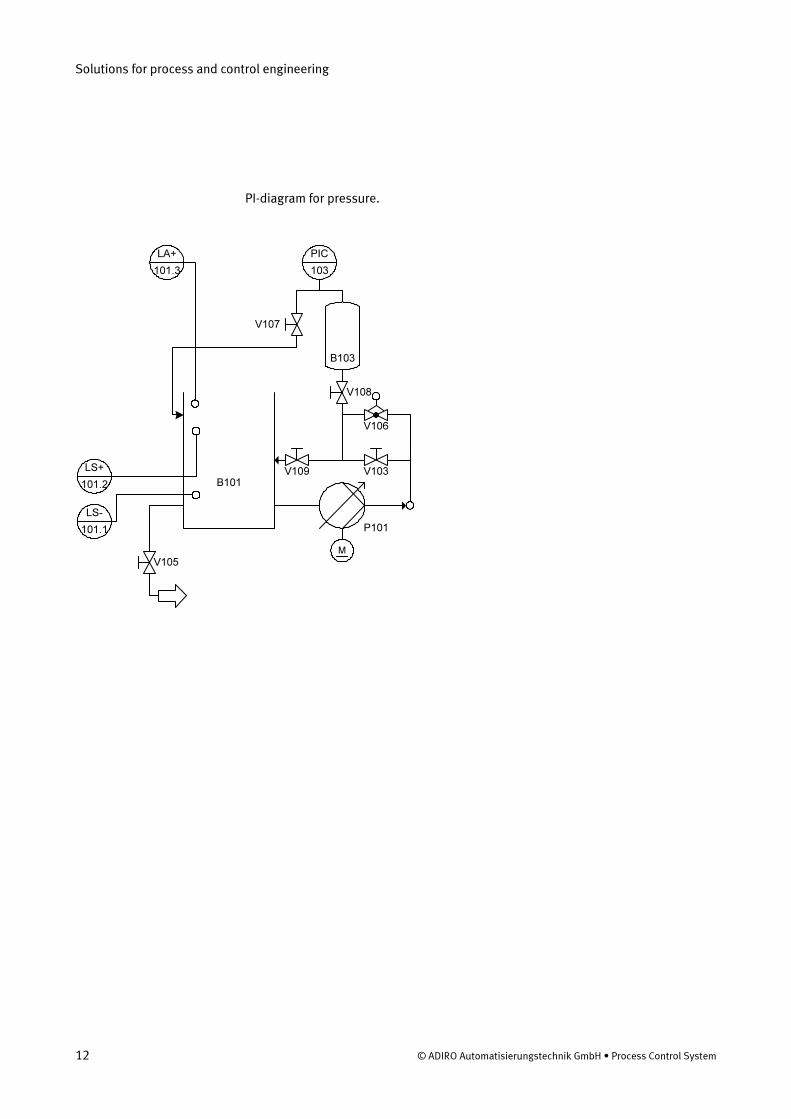
PI-diagram for pressure.
B101
LA+
101.3
V105
LS-
101.1
LS+
101.2
V109 V103
V106
P101
M
PIC
103
B103
V108
V107
Solutions for process and control engineering
© ADIRO Automatisierungstechnik GmbH • Process Control System 13
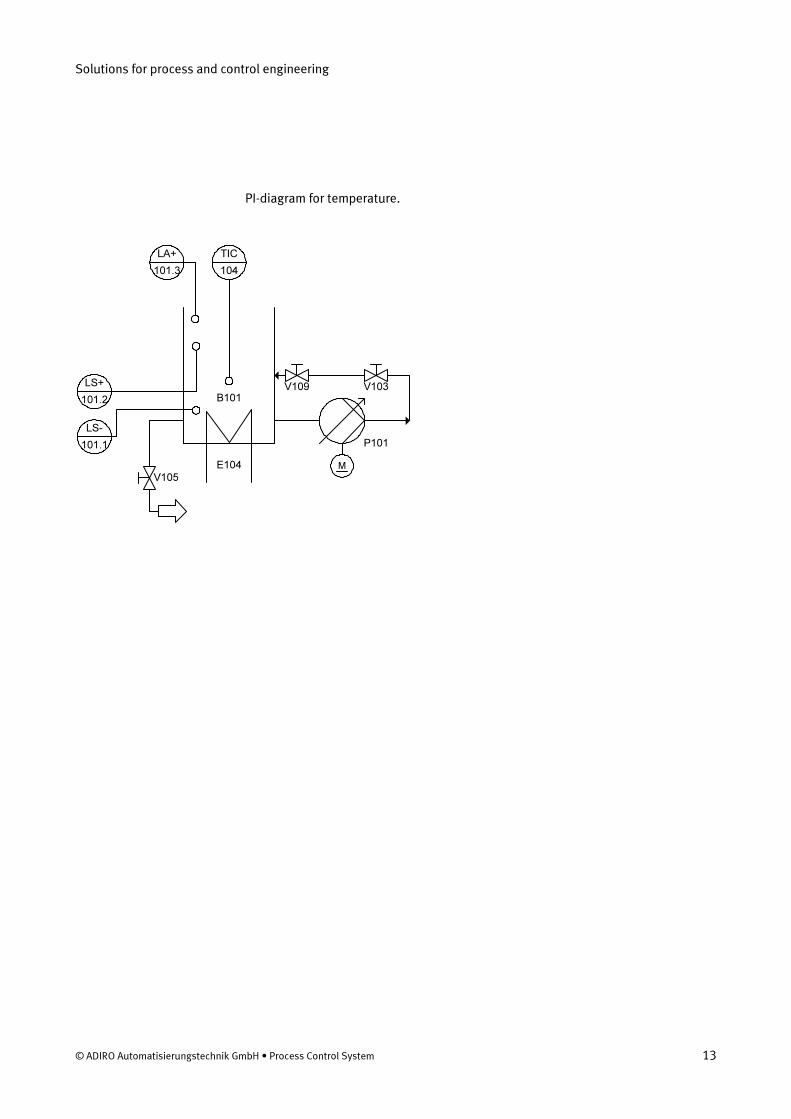
PI-diagram for temperature.
B101
LA+
101.3
V105
LS-
101.1
LS+
101.2
V109 V103
P101
ME104
TIC
104
Solutions for process and control engineering
14 © ADIRO Automatisierungstechnik GmbH • Process Control System
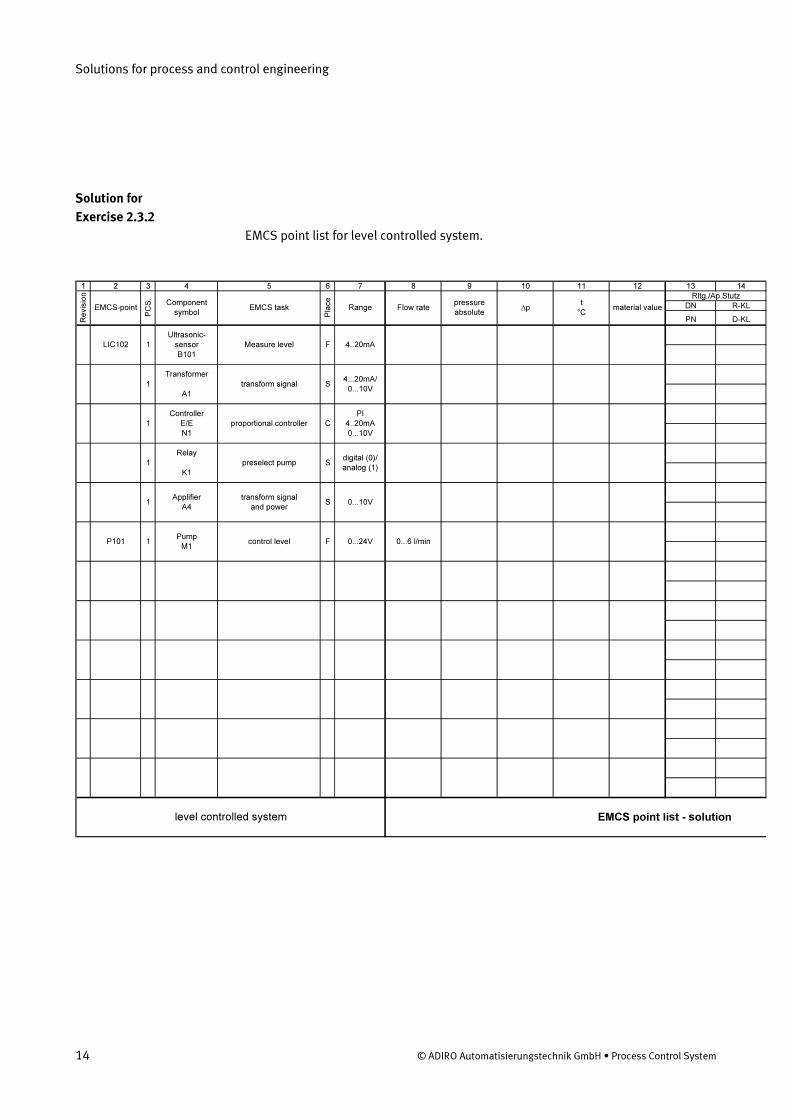
EMCS point list for level controlled system.
1 2 3 4 5 6 7 8 9 10 11 12 13 14
DN R-KL
PN D-KL
Rltg./Ap.Stutz
material valuet
°CRange ∆p
pressure
absoluteFlow rate
PCS.
EMCS-point
Revision
Component
symbolEMCS task
Place
1
Ultrasonic-
sensor
B101
Measure level 4..20mA
transform signal
F
Transformer
A1
1 S
1
Controller
E/E
N1
proportional controller
1
Relay
K1
preselect pump
Applifier
A41
transform signal
and power
1Pump
M1control level
C
S
S
F
4...20mA/
0...10V
PI
4..20mA
0...10V
0...6 l/min
digital (0)/
analog (1)
0...10V
0...24V
LIC102
P101
level controlled system EMCS point list - solution
Solution for
Exercise 2.3.2
Solutions for process and control engineering
© ADIRO Automatisierungstechnik GmbH • Process Control System 15
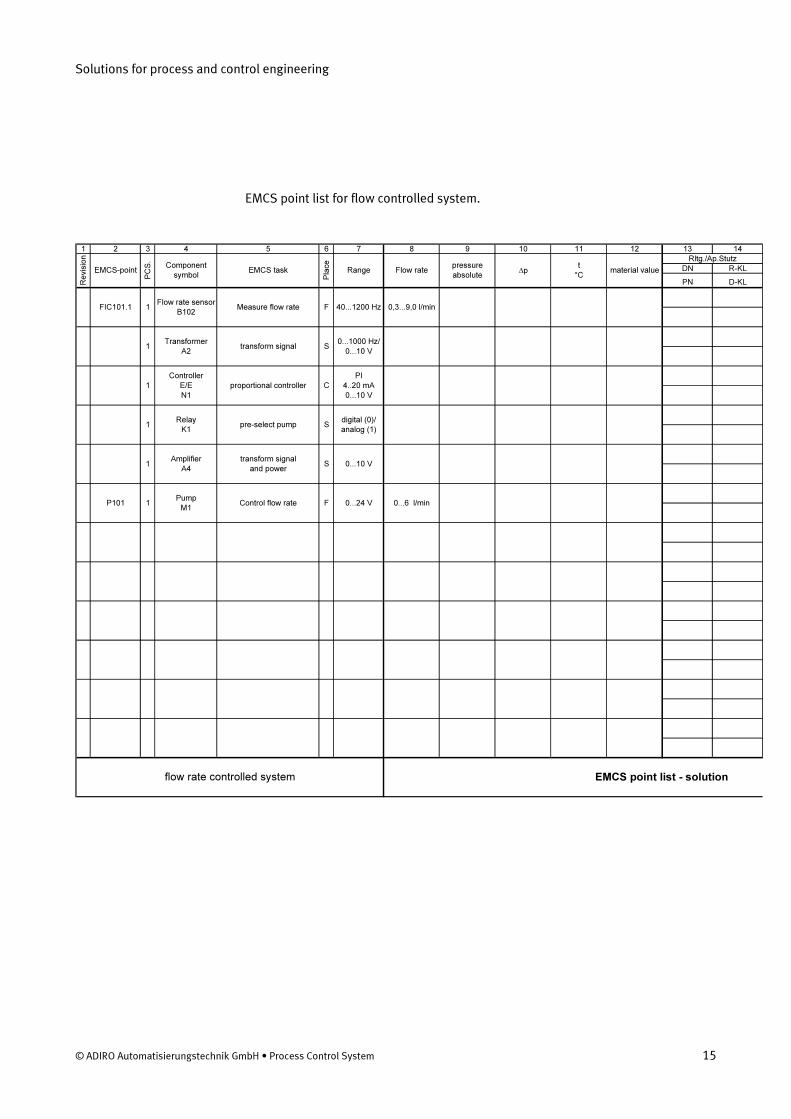
EMCS point list for flow controlled system.
1 2 3 4 5 6 7 8 9 10 11 12 13 14
DN R-KL
PN D-KL
Rltg./Ap.Stutz
material valuet
°CRange ∆p
pressure
absoluteFlow rate
PCS.
EMCS-point
Revision
Component
symbolEMCS task
Place
1Flow rate sensor
B102Measure flow rate 40...1200 Hz 0,3...9,0 l/min
transform signal
F
Transformer
A21 S
1
Controller
E/E
N1
proportional controller
1Relay
K1pre-select pump
Amplifier
A41
transform signal
and power
1Pump
M1Control flow rate
C
S
S
F
0...1000 Hz/
0...10 V
PI
4..20 mA
0...10 V
0...6 l/min
digital (0)/
analog (1)
0...10 V
0...24 V
FIC101.1
P101
flow rate controlled system EMCS point list - solution
Solutions for process and control engineering
16 © ADIRO Automatisierungstechnik GmbH • Process Control System
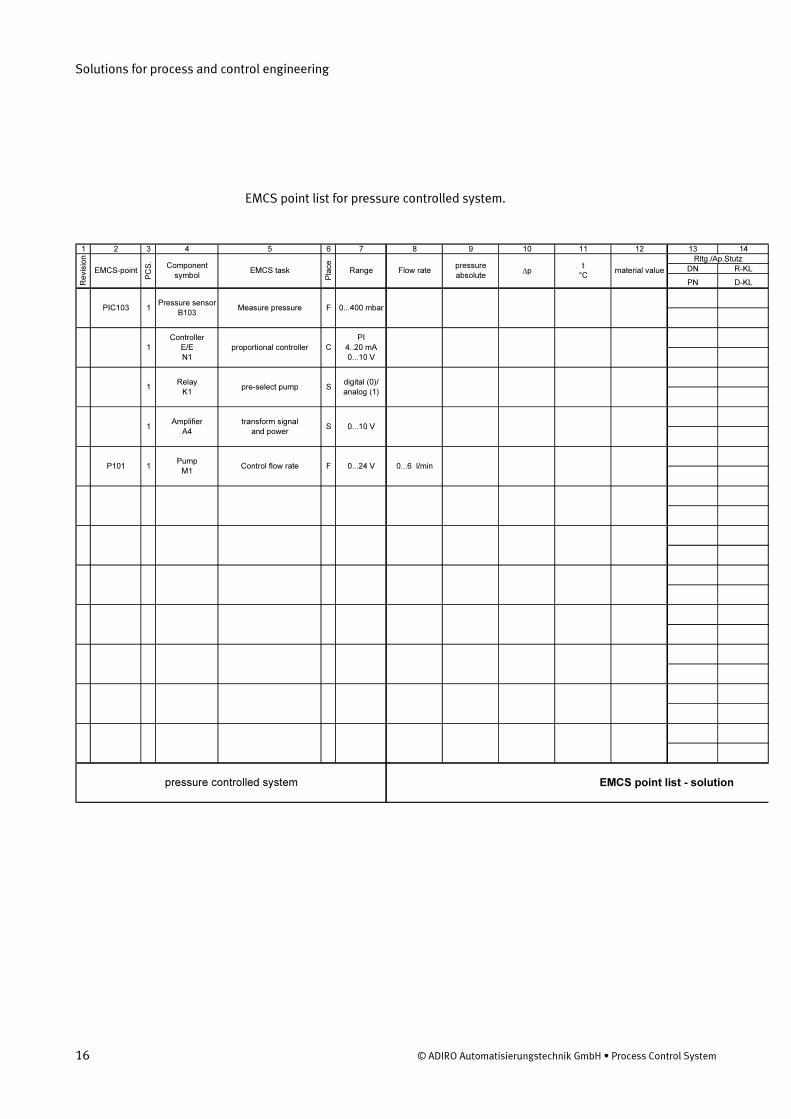
EMCS point list for pressure controlled system.
1 2 3 4 5 6 7 8 9 10 11 12 13 14
DN R-KL
PN D-KL
pressure controlled system EMCS point list - solution
P101
PIC103
0...10 V
0...24 V 0...6 l/min
digital (0)/
analog (1)
PI
4..20 mA
0...10 V
S
S
FPump
M11 Control flow rate
1Relay
K1pre-select pump
1Amplifier
A4
transform signal
and power
proportional controller
F
Controller
E/E
N1
1 C
1Pressure sensor
B103Measure pressure 0...400 mbar
PCS.
EMCS-point
Revision
Component
symbolEMCS task
Place
Range ∆ppressure
absoluteFlow rate
Rltg./Ap.Stutz
material valuet
°C
Solutions for process and control engineering
© ADIRO Automatisierungstechnik GmbH • Process Control System 17
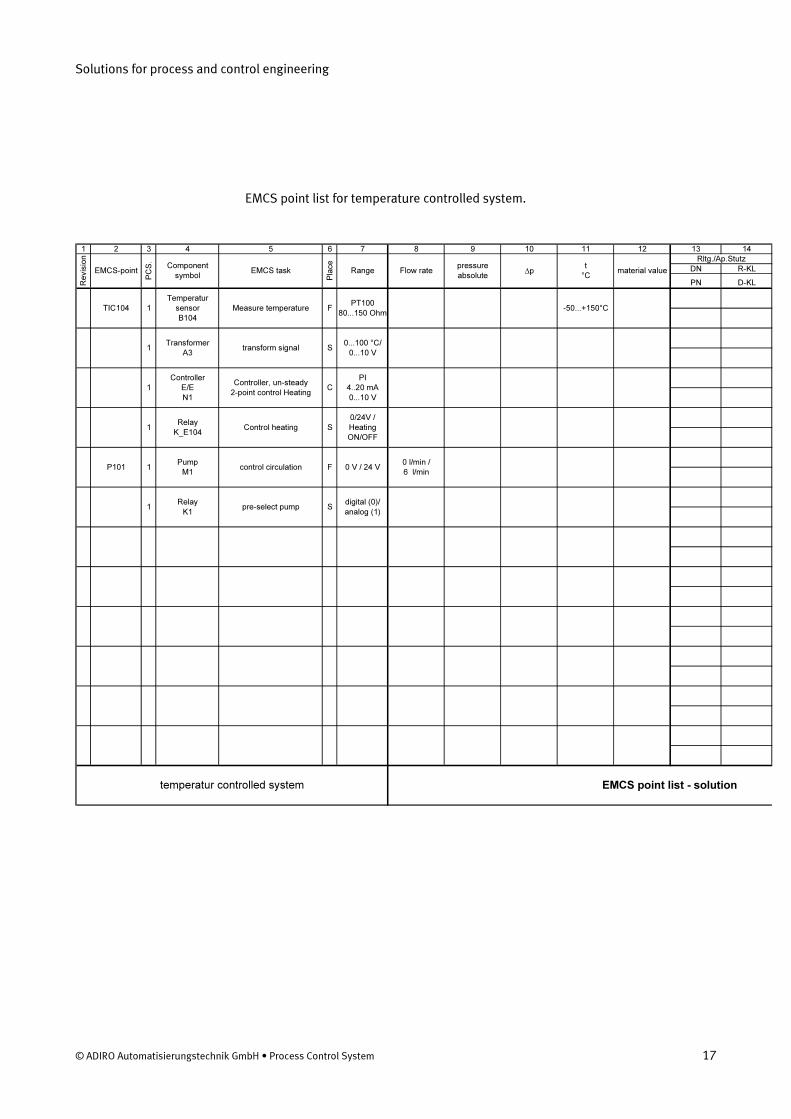
EMCS point list for temperature controlled system.
1 2 3 4 5 6 7 8 9 10 11 12 13 14
DN R-KL
PN D-KL
temperatur controlled system EMCS point list - solution
P101
TIC104
0 V / 24 V0 l/min /
6 l/min
digital (0)/
analog (1)
PI
4..20 mA
0...10 V
C
F
S
S
1 control circulation
1Relay
K1pre-select pump
1
Controller
E/E
N1
Controller, un-steady
2-point control Heating
1Relay
K_E104Control heating
Pump
M1
transform signal
F
Transformer
A31 S
1
Temperatur
sensor
B104
Measure temperaturePT100
80...150 Ohm-50...+150°C
PCS.
EMCS-point
Revision
Component
symbolEMCS task
Place
0/24V /
Heating
ON/OFF
Rltg./Ap.Stutz
material valuet
°CRange ∆p
pressure
absoluteFlow rate
0...100 °C/
0...10 V
Solutions for process and control engineering
18 © ADIRO Automatisierungstechnik GmbH • Process Control System
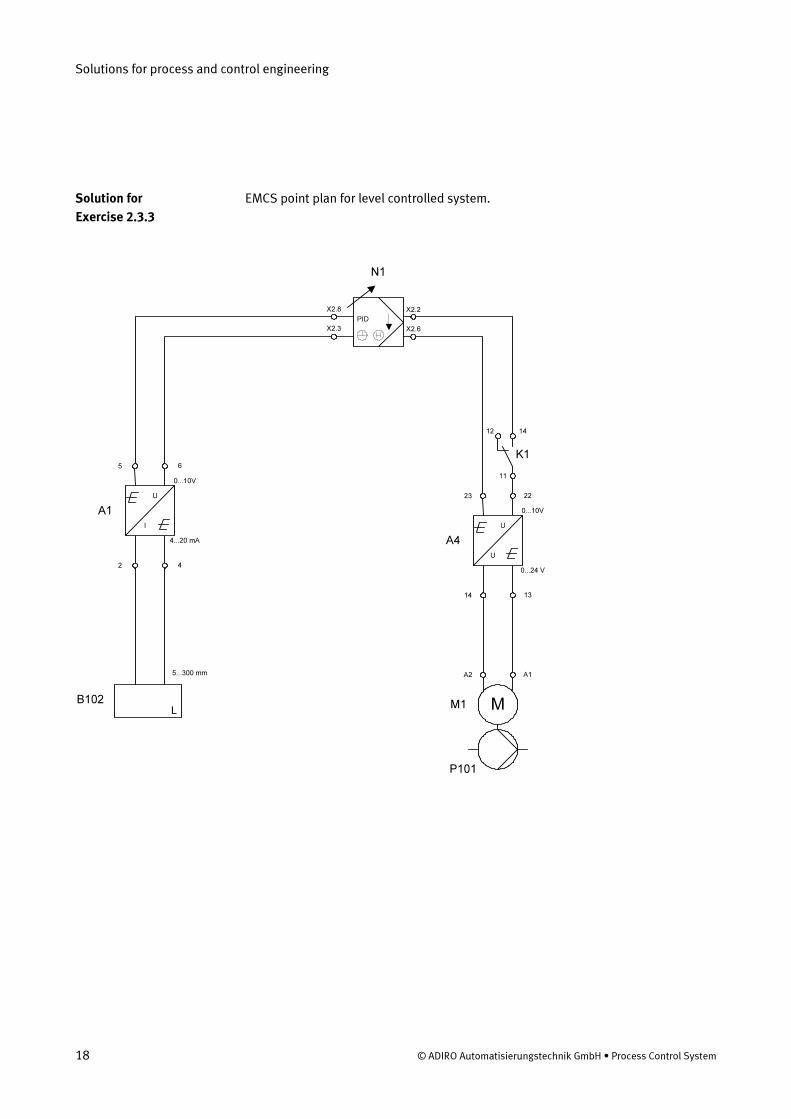
EMCS point plan for level controlled system.
ML
PID
X2.8
X2.3
X2.2
X2.6
B102
N1
5...300 mm
0...10V
4...20 mA
5 6
A1
2 4
U
I
0...10V
0...24 V
23 22
A4
14 13
U
U
12 14
11
K1
A2 A1
M1
P101
Solution for
Exercise 2.3.3
Solutions for process and control engineering
© ADIRO Automatisierungstechnik GmbH • Process Control System 19
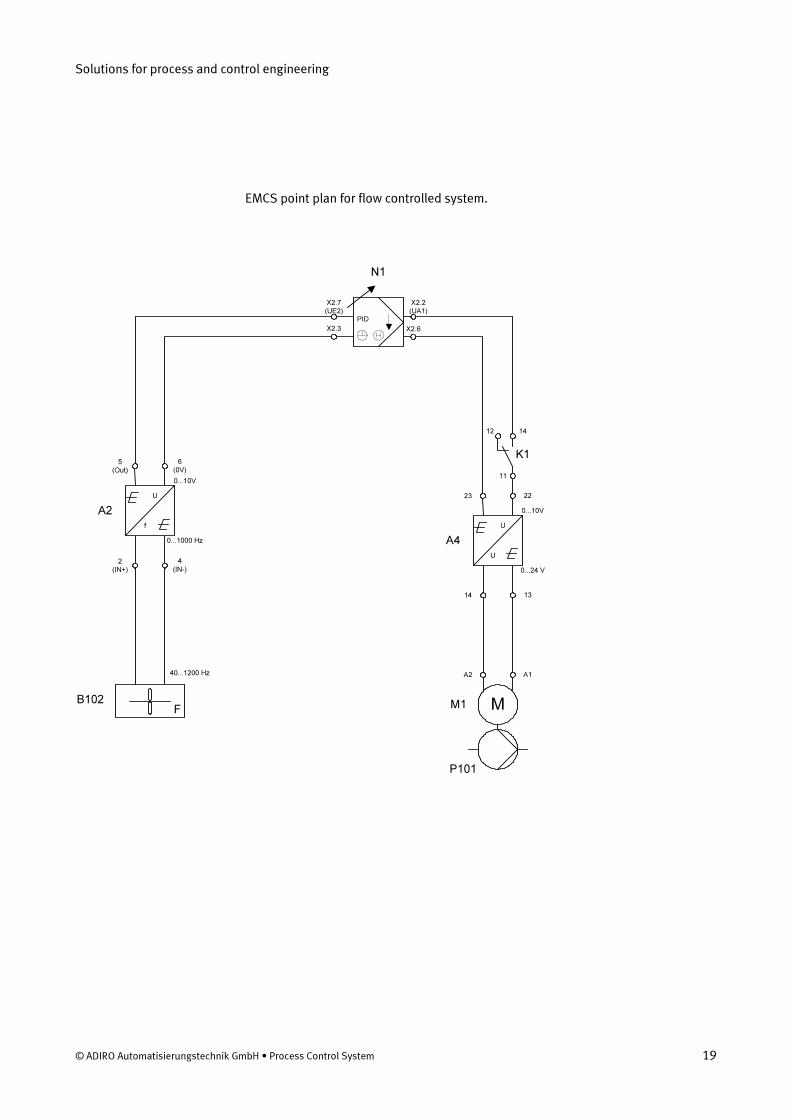
EMCS point plan for flow controlled system.
M
PID
X2.7
(UE2)
X2.3
X2.2
(UA1)
X2.6
B102
N1
40...1200 Hz
0...10V
0...1000 Hz
5
(Out)
6
(0V)
A2
2
(IN+)
4
(IN-)
U
f
0...10V
0...24 V
23 22
A4
14 13
U
U
12 14
11
K1
A2 A1
M1
P101
F
Solutions for process and control engineering
20 © ADIRO Automatisierungstechnik GmbH • Process Control System
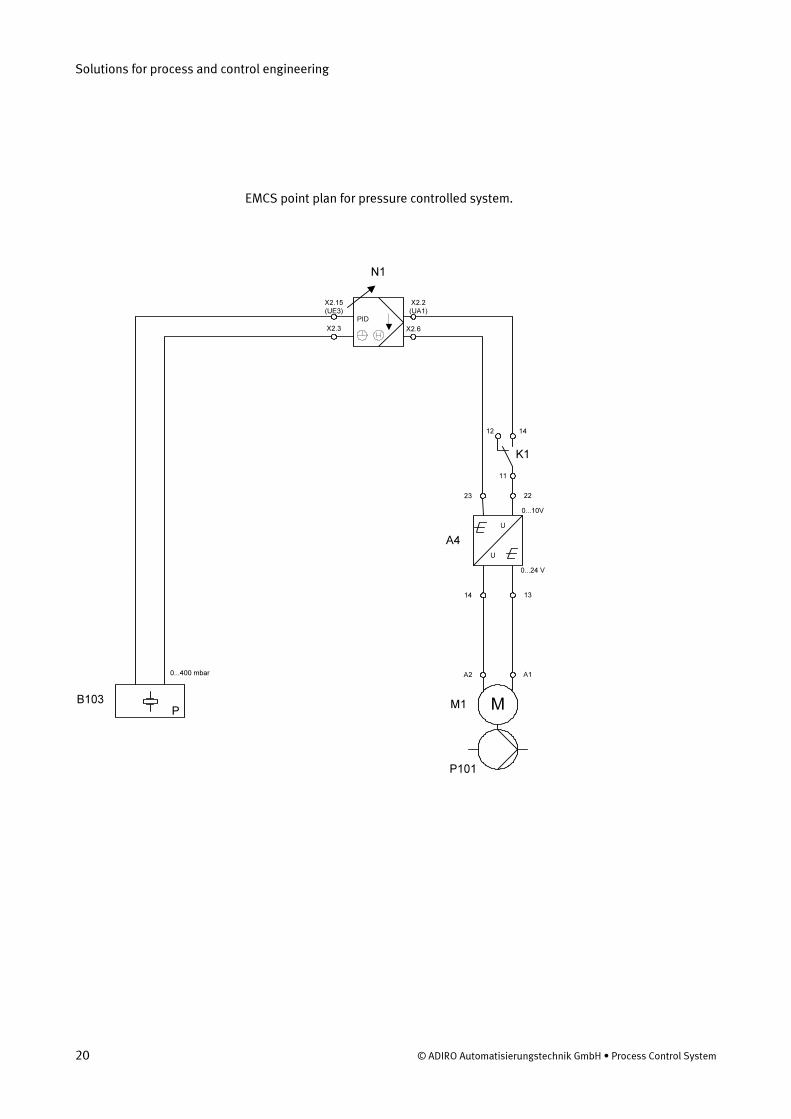
EMCS point plan for pressure controlled system.
M
PID
X2.15
(UE3)
X2.3
X2.2
(UA1)
X2.6
B103
N1
0...400 mbar
0...10V
0...24 V
23 22
A4
14 13
U
U
12 14
11
K1
A2 A1
M1
P101
P
Solutions for process and control engineering
© ADIRO Automatisierungstechnik GmbH • Process Control System 21
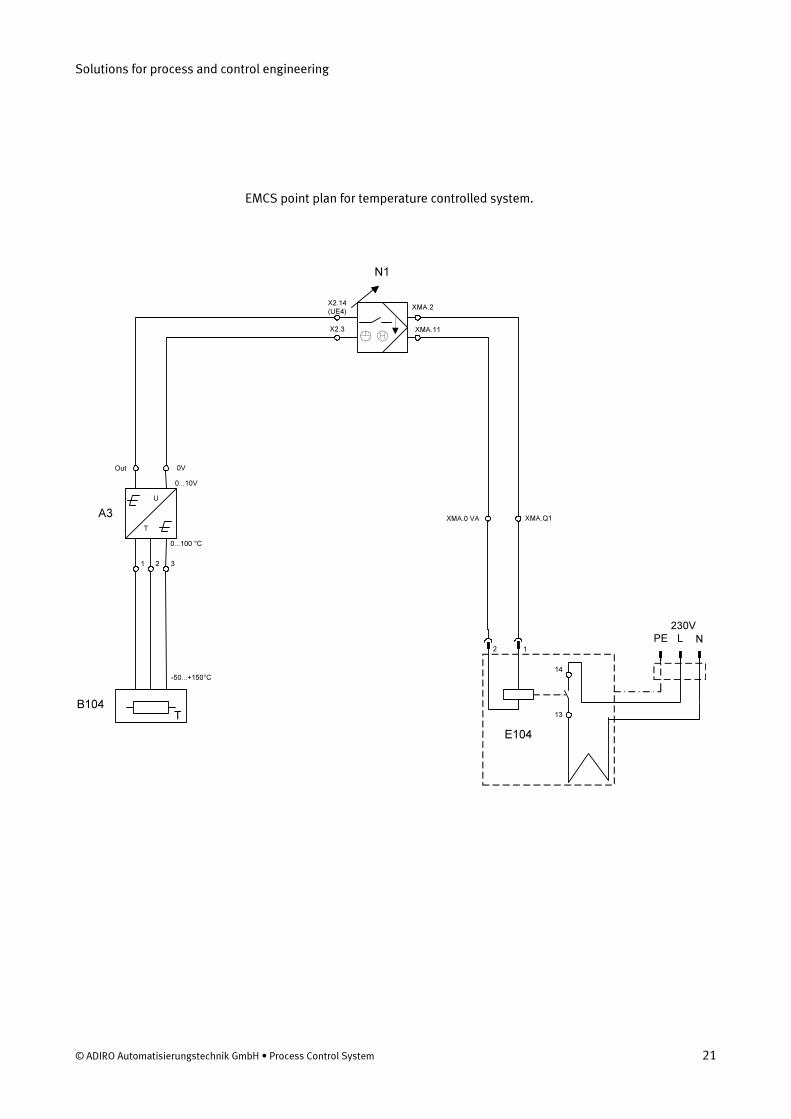
EMCS point plan for temperature controlled system.
X2.14
(UE4)
X2.3
XMA.2
XMA.11
B104
N1
-50...+150°C
0...10V
0...100 °C
Out 0V
A3
1 3
U
T
2 1
E104
T
2
14
13
NLPE
230V
XMA.0 VA XMA.Q1
Solutions for process and control engineering
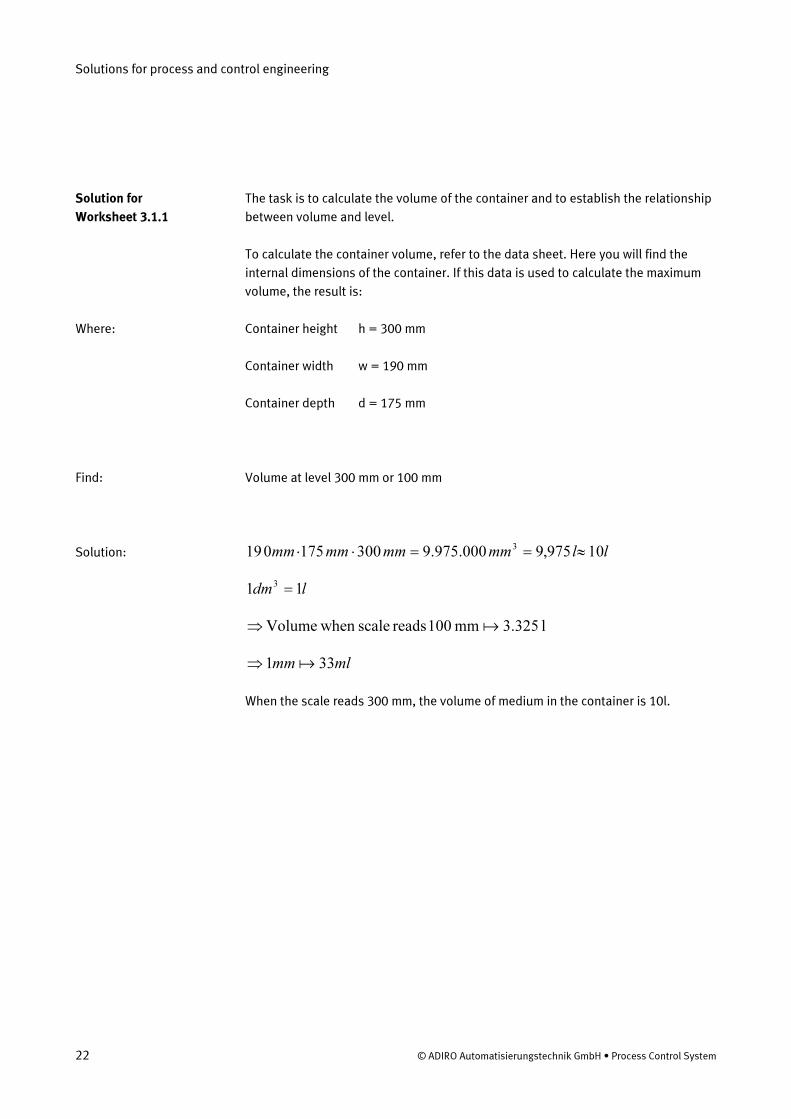
22 © ADIRO Automatisierungstechnik GmbH • Process Control System
The task is to calculate the volume of the container and to establish the relationship
between volume and level.
To calculate the container volume, refer to the data sheet. Here you will find the
internal dimensions of the container. If this data is used to calculate the maximum
volume, the result is:
Container height h = 300 mm
Container width w = 190 mm
Container depth d = 175 mm
Volume at level 300 mm or 100 mm
llmmmmmmmm 10975,9000.975.93001750193
≈==⋅⋅
ldm 113=
l 3.325mm 100 reads scale when Volume a⇒
mlmm 331 a⇒
When the scale reads 300 mm, the volume of medium in the container is 10l.
Solution for
Worksheet 3.1.1
Where:
Find:
Solution:
Solutions for process and control engineering
© ADIRO Automatisierungstechnik GmbH • Process Control System 23
The pump is a normally primed centrifugal pump. This type of pump requires an
absolutely tight suction pipe that should always be inclined up away from the pump
in order to prevent the formation of air pockets. The pump and suction pipe must be
filled with medium.
The following points must be taken into account during operation:
Before operation, the pump must be filled with medium.
The pumps must not run dry – but a dry-running period of less than 30 minutes will
not damage the pump.
The pump must always run in the prescribed direction.
The pump is suitable for continuous operation.
The medium to be pumped should not contain large particles of contaminant.
1.1.1 Calculating the rated current
VV 24= WP 26=
The rated current of the pump
AV
W
V
PIIVP 083.1
24
26===⇒⋅=
Solution for
Worksheet 3.2.1
Where:
Find:
Solution:
Solutions for process and control engineering
24 © ADIRO Automatisierungstechnik GmbH • Process Control System
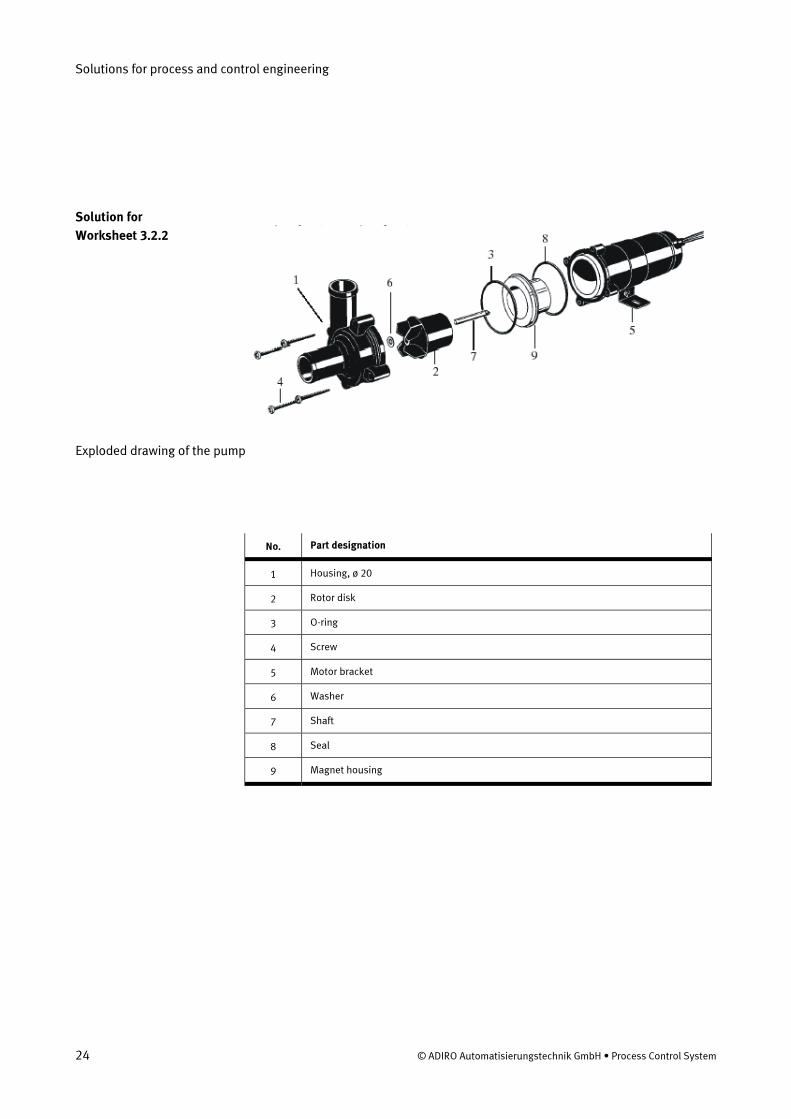
Exploded drawing of the pump
No. Part designation
1 Housing, ø 20
2 Rotor disk
3 O-ring
4 Screw
5 Motor bracket
6 Washer
7 Shaft
8 Seal
9 Magnet housing
Solution for
Worksheet 3.2.2
Solutions for process and control engineering
© ADIRO Automatisierungstechnik GmbH • Process Control System 25
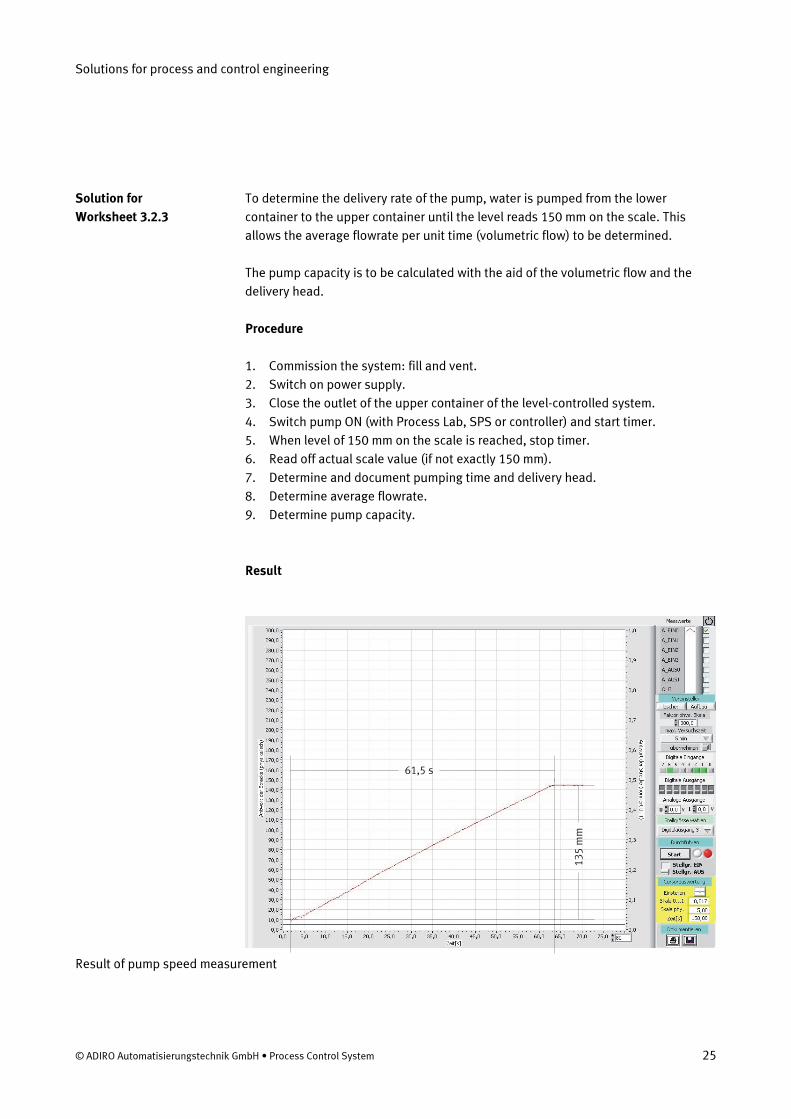
To determine the delivery rate of the pump, water is pumped from the lower
container to the upper container until the level reads 150 mm on the scale. This
allows the average flowrate per unit time (volumetric flow) to be determined.
The pump capacity is to be calculated with the aid of the volumetric flow and the
delivery head.
Procedure
1. Commission the system: fill and vent.
2. Switch on power supply.
3. Close the outlet of the upper container of the level-controlled system.
4. Switch pump ON (with Process Lab, SPS or controller) and start timer.
5. When level of 150 mm on the scale is reached, stop timer.
6. Read off actual scale value (if not exactly 150 mm).
7. Determine and document pumping time and delivery head.
8. Determine average flowrate.
9. Determine pump capacity.
Result 1
35
mm
61,5 s
Result of pump speed measurement
Solution for
Worksheet 3.2.3
Solutions for process and control engineering
26 © ADIRO Automatisierungstechnik GmbH • Process Control System
Measured values from diagram:
Pumping time s5,61tF=
Delivery head mm135hF=
Container width mmw 190=
Container depth mm175l =
Calculation of volumetric flow s V& :
min38.4
min260.379.4
608.72987
8.729875.61
4488750
5.61
175190135
33
33
lmm
s
mmV
s
mm
s
mm
s
mmmmmm
t
lwh
t
VV
F
F
==
⋅
=
==
⋅⋅
=
⋅⋅
==
&
&
The volumetric flow is the volume flowing through the cross-sectional area per unit
time.
The capacity of the pump can be calculated with the following formula:
hgVP ⋅⋅ρ⋅= & with 2
81.9s
mg =
The system comprises a low and a high container and a pump between them. The maximum delivery head hmax is the distance between the inlet port of the pump and the maximum delivery head in the upper container hoB, less the minimum suction height in the lower container huB in relation to the surface of the profile plate.
Distance pump inlet – maximum delivery head in the upper container:
mm35mm145mm350hoB −+= =460mm
Minimum suction height:
mm120mm35mm155huB =−=
The maximum delivery head hmax is:
mm340mm120mm460hhh uBoBmax =−=−=
The density of water is 33
0.100000.1m
kg
dm
kg==ρ
Solutions for process and control engineering
© ADIRO Automatisierungstechnik GmbH • Process Control System 27
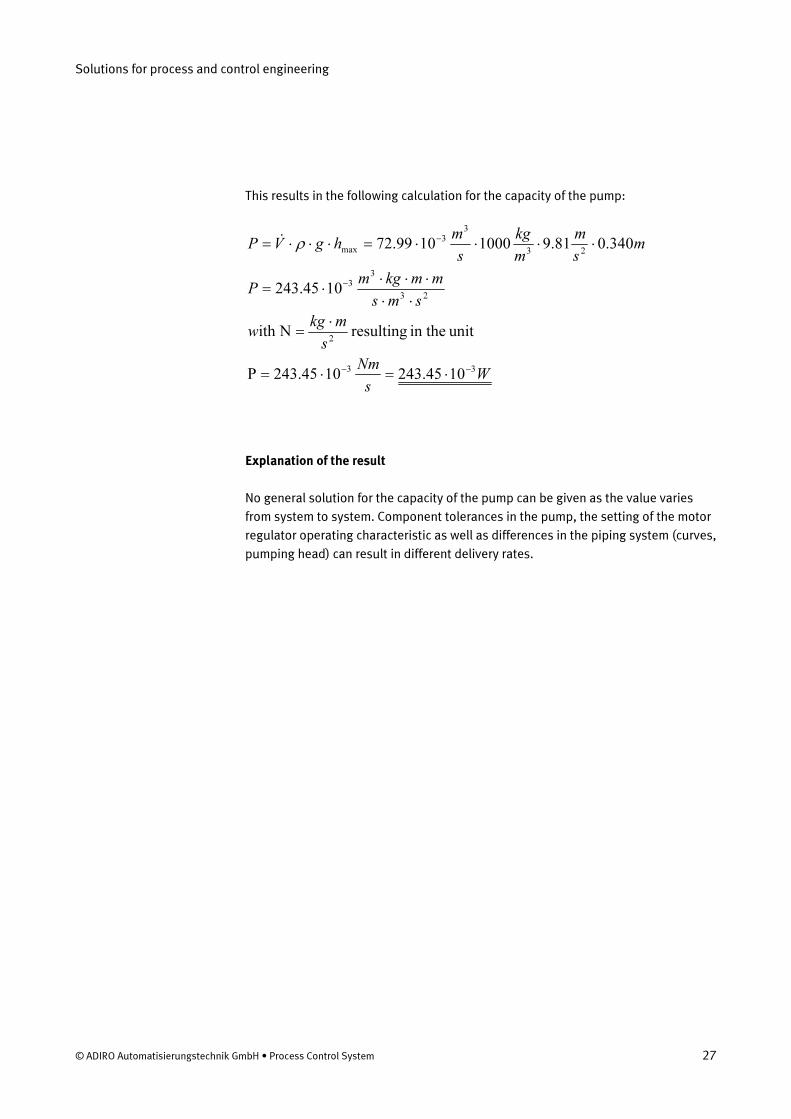
This results in the following calculation for the capacity of the pump:
Ws
Nm
s
mkgw
sms
mmkgmP
ms
m
m
kg
s
mhgVP
33
2
23
3
3
23
3
3
max
1045.2431045.243P
unit in the resulting Nith
1045.243
340.081.910001099.72
−−
−
−
⋅=⋅=
⋅
=
⋅⋅
⋅⋅⋅
⋅=
⋅⋅⋅⋅=⋅⋅⋅= ρ&
Explanation of the result
No general solution for the capacity of the pump can be given as the value varies
from system to system. Component tolerances in the pump, the setting of the motor
regulator operating characteristic as well as differences in the piping system (curves,
pumping head) can result in different delivery rates.
© ADIRO Automatisierungstechnik GmbH • Process Control System 28
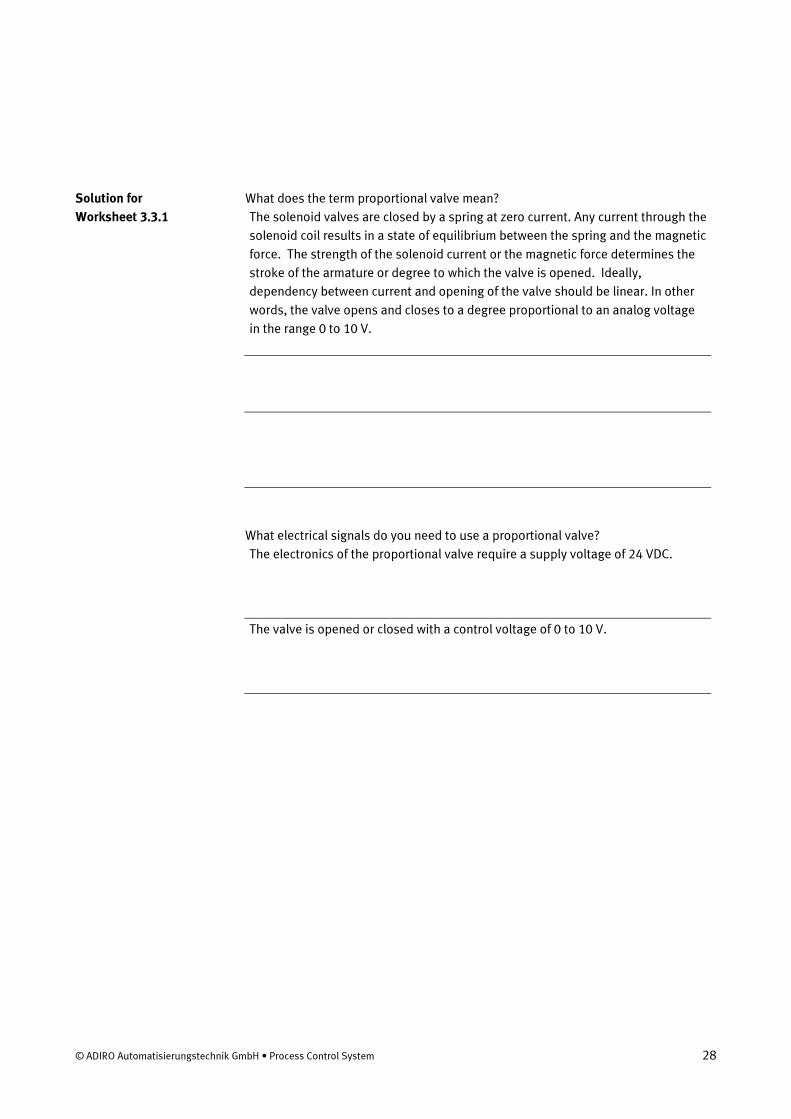
What does the term proportional valve mean?
The solenoid valves are closed by a spring at zero current. Any current through the
solenoid coil results in a state of equilibrium between the spring and the magnetic
force. The strength of the solenoid current or the magnetic force determines the
stroke of the armature or degree to which the valve is opened. Ideally,
dependency between current and opening of the valve should be linear. In other
words, the valve opens and closes to a degree proportional to an analog voltage
in the range 0 to 10 V.
What electrical signals do you need to use a proportional valve?
The electronics of the proportional valve require a supply voltage of 24 VDC.
The valve is opened or closed with a control voltage of 0 to 10 V.
Solution for
Worksheet 3.3.1
Solutions for process and control engineering
© Festo Didactic GmbH & Co. • PCS 29
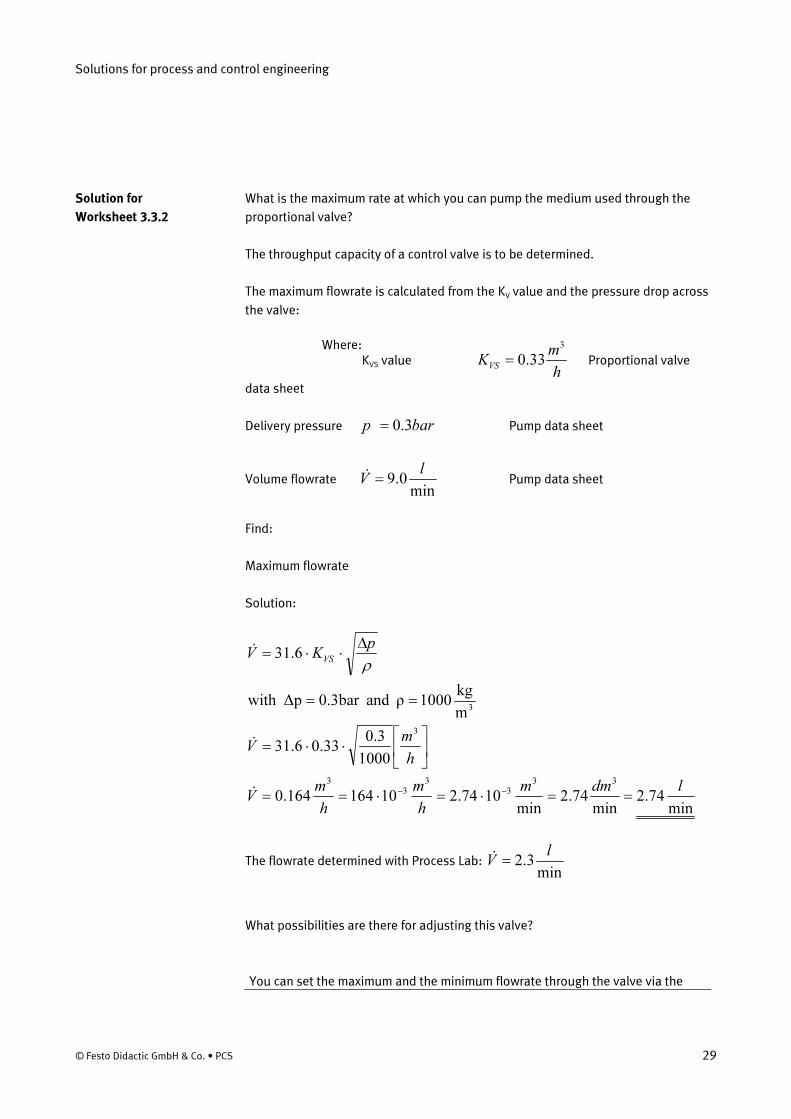
What is the maximum rate at which you can pump the medium used through the
proportional valve?
The throughput capacity of a control valve is to be determined.
The maximum flowrate is calculated from the KV value and the pressure drop across
the valve:
KVS value h
mK
VS
3
33.0= Proportional valve
data sheet
Delivery pressure barp 3.0= Pump data sheet
Volume flowrate min
0.9l
V =& Pump data sheet
Find:
Maximum flowrate
Solution:
min74.2
min74.2
min1074.210164164.0
1000
3.033.06.31
m
kg1000ρ and0.3bar ∆pwith
6.31
33
3
3
3
3
3
3
ldmm
h
m
h
mV
h
mV
pKV
VS
==⋅=⋅==
⎥⎦
⎤⎢⎣
⎡⋅⋅=
==
∆⋅⋅=
−−
&
&
&
ρ
The flowrate determined with Process Lab: min
3.2l
V =&
What possibilities are there for adjusting this valve?
You can set the maximum and the minimum flowrate through the valve via the
Solution for
Worksheet 3.3.2
Where:

Solutions for process and control engineering
30 © ADIRO Automatisierungstechnik GmbH • Process Control System
electronics with the aid of potentiometers R1 and R2.
© ADIRO Automatisierungstechnik GmbH • Process Control System 31
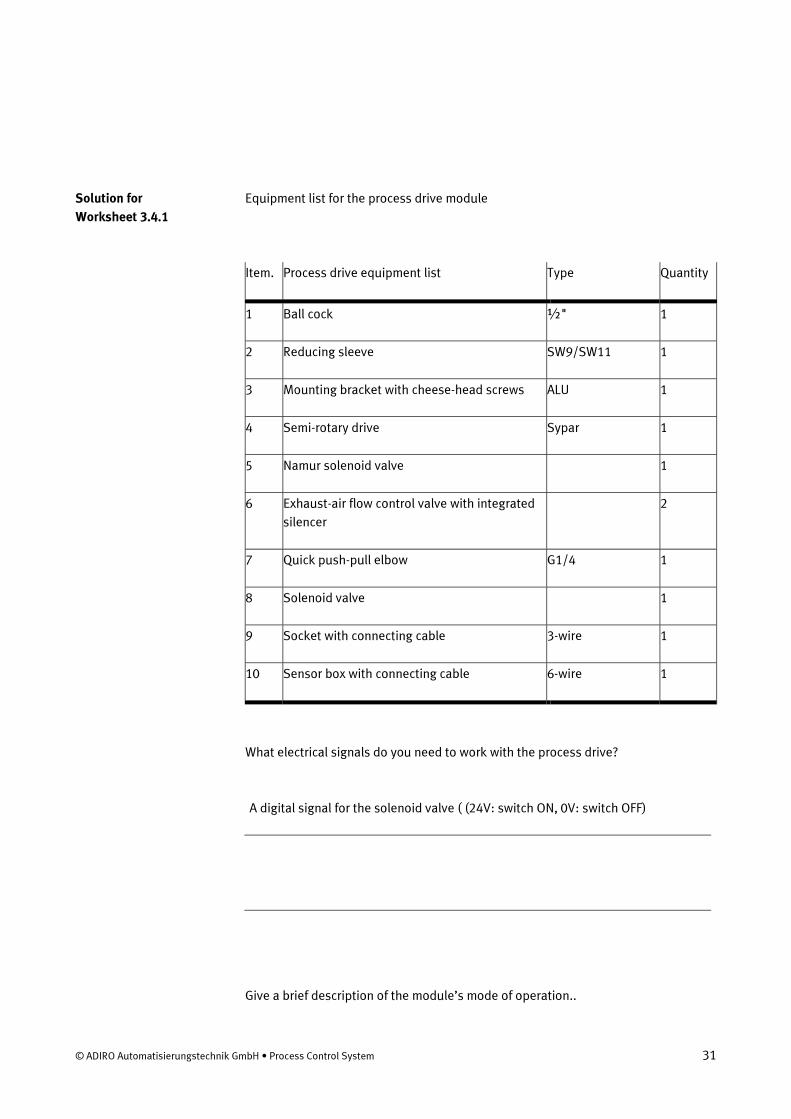
Equipment list for the process drive module
Item. Process drive equipment list Type Quantity
1 Ball cock ½" 1
2 Reducing sleeve SW9/SW11 1
3 Mounting bracket with cheese-head screws ALU 1
4 Semi-rotary drive Sypar 1
5 Namur solenoid valve 1
6 Exhaust-air flow control valve with integrated
silencer
2
7 Quick push-pull elbow G1/4 1
8 Solenoid valve 1
9 Socket with connecting cable 3-wire 1
10 Sensor box with connecting cable 6-wire 1
What electrical signals do you need to work with the process drive?
A digital signal for the solenoid valve ( (24V: switch ON, 0V: switch OFF)
Give a brief description of the module’s mode of operation..
Solution for
Worksheet 3.4.1
Solutions for process and control engineering
32 © ADIRO Automatisierungstechnik GmbH • Process Control System
A coil is energized by an electrical signal. This operates the Namur valve
magnetically. The semi-rotary drive moves through 90° as the result of the
compressed air switched by the valve. This opens or closes the ball cock.
Solutions for process and control engineering
© Festo Didactic GmbH & Co. • PCS 33
What function does the sensor box fulfill? Name the signals you receive from the
sensor box and, where appropriate, how you can record these signals.
The sensor box delivers three signals
1) a visual signal, red and yellow. Red means “Ball clock closed” and yellow
means “Ball cock open”.
2) A digital signal to I5 (digital input of the I/O terminal) “High” means “Ball cock
closed”.
3) A second digital signal to I6 (digital input of the I/O terminal): “High” means
“Ball cock open”.
Solution for
Worksheet 3.4.2
Solutions for process and control engineering
34 © ADIRO Automatisierungstechnik GmbH • Process Control System
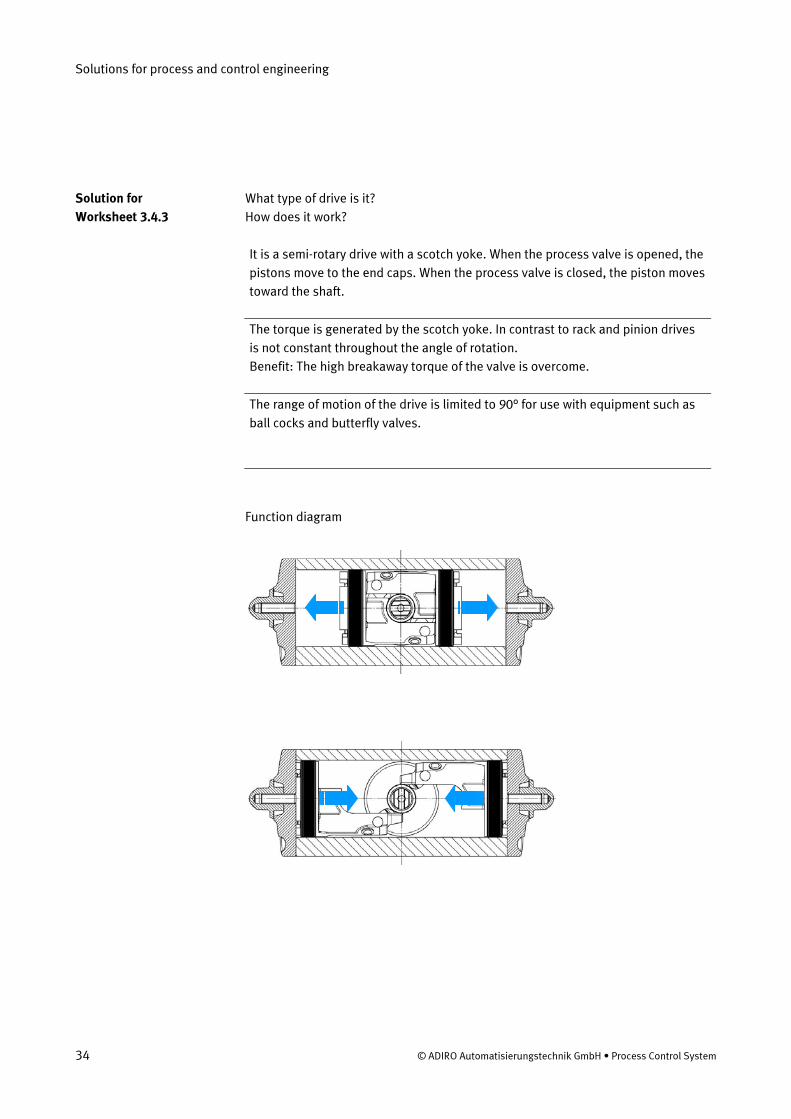
What type of drive is it?
How does it work?
It is a semi-rotary drive with a scotch yoke. When the process valve is opened, the
pistons move to the end caps. When the process valve is closed, the piston moves
toward the shaft.
The torque is generated by the scotch yoke. In contrast to rack and pinion drives
is not constant throughout the angle of rotation.
Benefit: The high breakaway torque of the valve is overcome.
The range of motion of the drive is limited to 90° for use with equipment such as
ball cocks and butterfly valves.
Function diagram
Solution for
Worksheet 3.4.3
Solutions for process and control engineering
© Festo Didactic GmbH & Co. • PCS 35
What are all the things you have to take into account when using the heating
element??
The heating element may only be switched on if it is entirely immersed in fluid.
The heating element is hot!
Calculate the rated current of the heating element.
The following values are to be taken from the data sheet:
Rated voltage: V230
Heat output at rated voltage: W1000
Rated current of the heating element.
AV
W
uPi 35.4
230
1000≈==
Solution for
Worksheet 3.5.1
Caution!
Where:
Find:
Solution:
Solutions for process and control engineering
36 © ADIRO Automatisierungstechnik GmbH • Process Control System
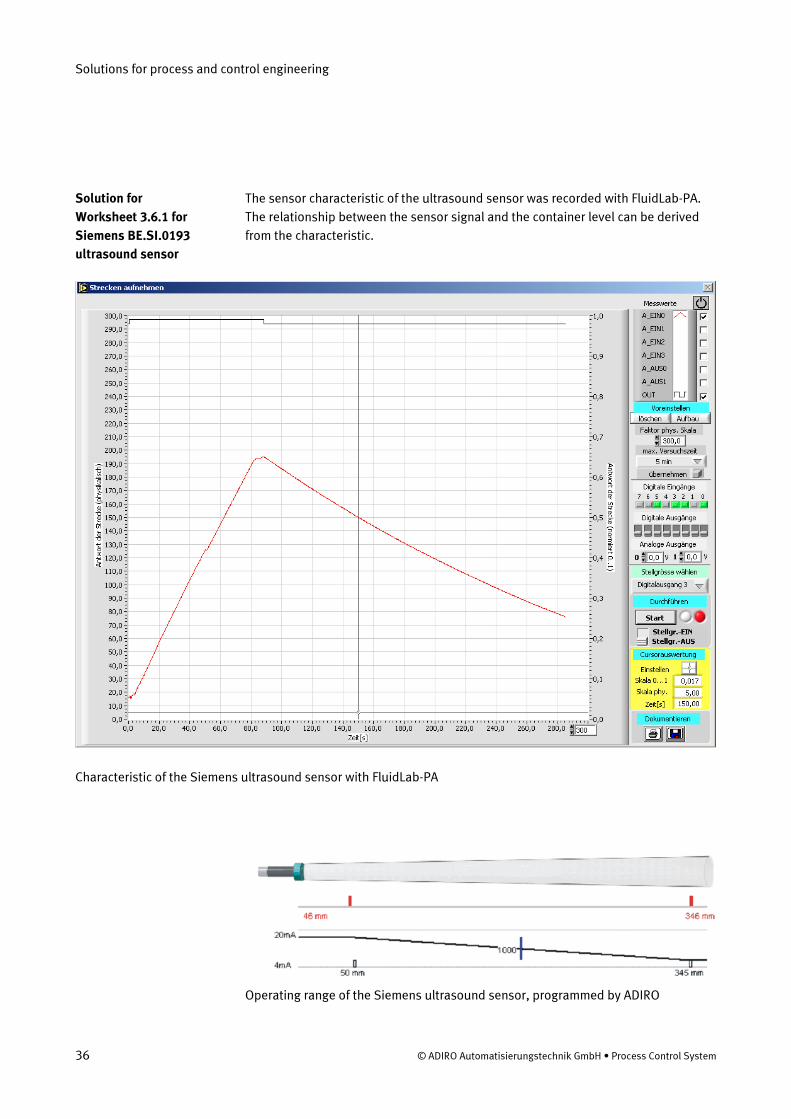
The sensor characteristic of the ultrasound sensor was recorded with FluidLab-PA.
The relationship between the sensor signal and the container level can be derived
from the characteristic.
Characteristic of the Siemens ultrasound sensor with FluidLab-PA
Operating range of the Siemens ultrasound sensor, programmed by ADIRO
Solution for
Worksheet 3.6.1 for
Siemens BE.SI.0193
ultrasound sensor
Solutions for process and control engineering
© Festo Didactic GmbH & Co. • PCS 37
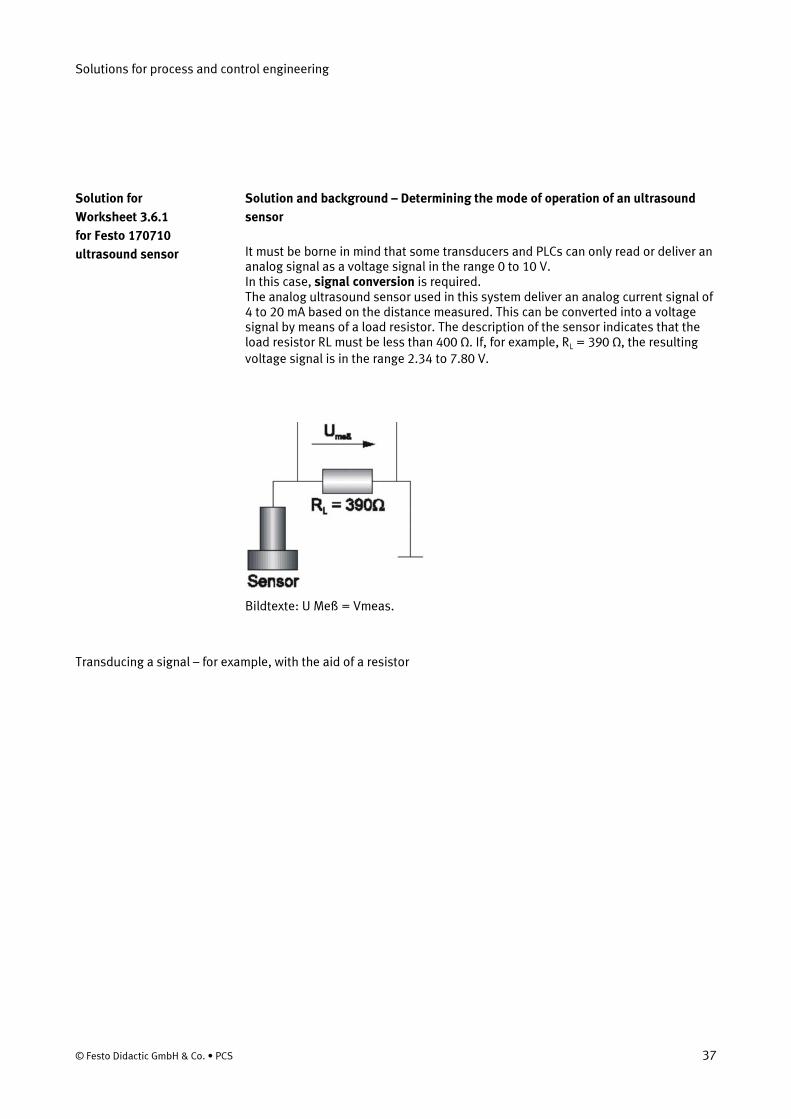
Solution and background – Determining the mode of operation of an ultrasound
sensor
It must be borne in mind that some transducers and PLCs can only read or deliver an analog signal as a voltage signal in the range 0 to 10 V. In this case, signal conversion is required. The analog ultrasound sensor used in this system deliver an analog current signal of 4 to 20 mA based on the distance measured. This can be converted into a voltage signal by means of a load resistor. The description of the sensor indicates that the load resistor RL must be less than 400 Ω. If, for example, RL = 390 Ω, the resulting
voltage signal is in the range 2.34 to 7.80 V.
Bildtexte: U Meß = Vmeas.
Transducing a signal – for example, with the aid of a resistor
Solution for
Worksheet 3.6.1
for Festo 170710
ultrasound sensor
Solutions for process and control engineering
38 © ADIRO Automatisierungstechnik GmbH • Process Control System
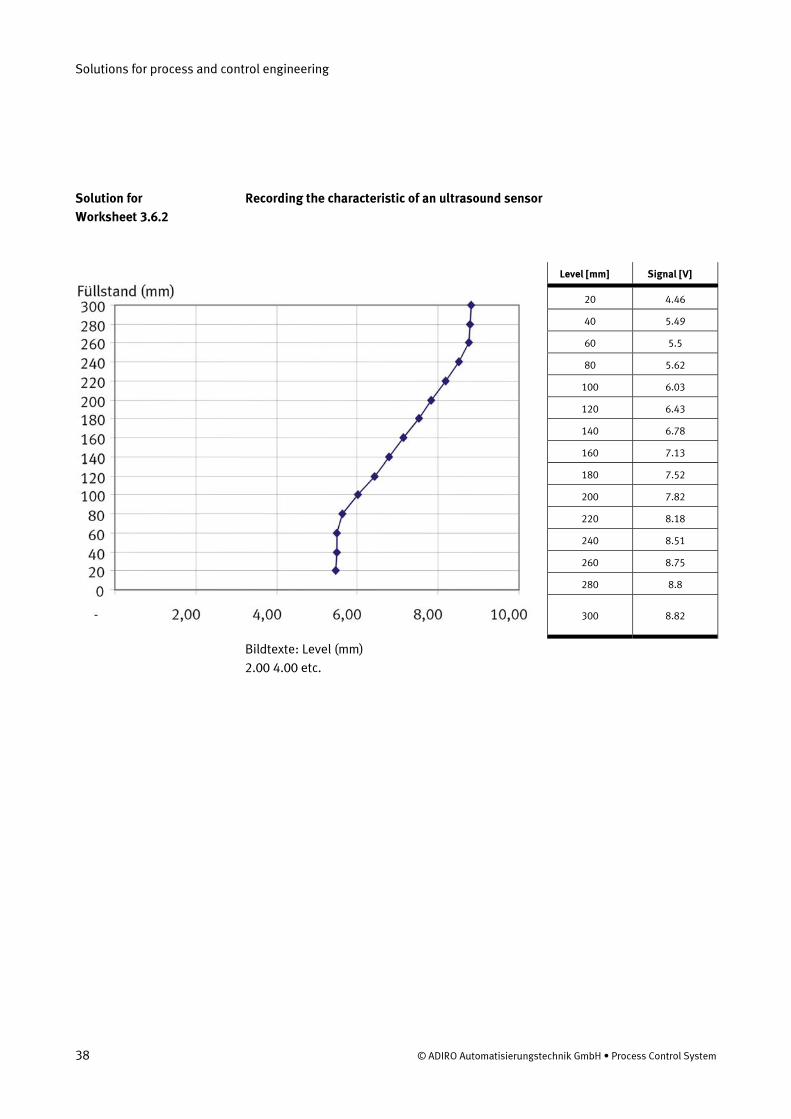
Recording the characteristic of an ultrasound sensor
Level [mm] Signal [V]
20 4.46
40 5.49
60 5.5
80 5.62
100 6.03
120 6.43
140 6.78
160 7.13
180 7.52
200 7.82
220 8.18
240 8.51
260 8.75
280 8.8
300 8.82
Bildtexte: Level (mm)
2.00 4.00 etc.
Solution for
Worksheet 3.6.2
Solutions for process and control engineering
© Festo Didactic GmbH & Co. • PCS 39
Background to the exercise
The technical description of analog sensors normally gives the sensor’s characteristic (graphically, or as an equation with tolerances).
If the characteristic is not given, it must be established experimentally. This may
also be necessary when operating conditions have an impact on the characteristic.
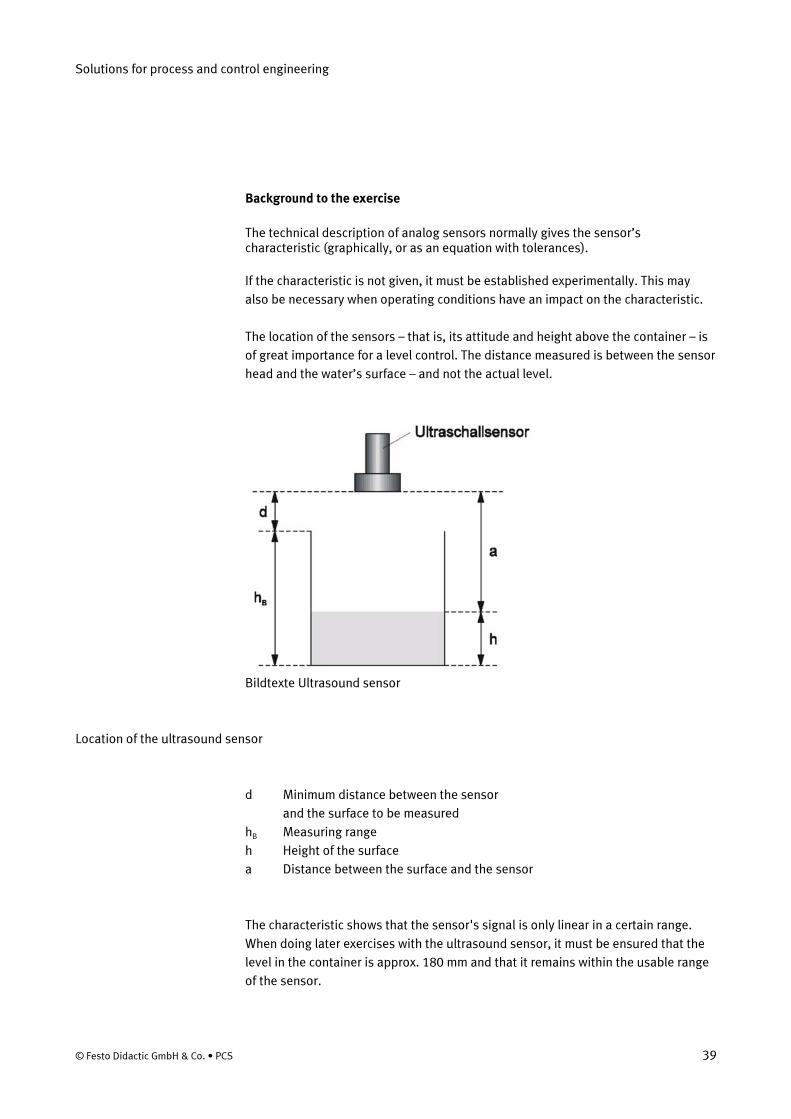
The location of the sensors – that is, its attitude and height above the container – is
of great importance for a level control. The distance measured is between the sensor
head and the water’s surface – and not the actual level.
Bildtexte Ultrasound sensor
Location of the ultrasound sensor
d Minimum distance between the sensor
and the surface to be measured
hB Measuring range
h Height of the surface
a Distance between the surface and the sensor
The characteristic shows that the sensor's signal is only linear in a certain range.
When doing later exercises with the ultrasound sensor, it must be ensured that the
level in the container is approx. 180 mm and that it remains within the usable range
of the sensor.
Solutions for process and control engineering
40 © ADIRO Automatisierungstechnik GmbH • Process Control System
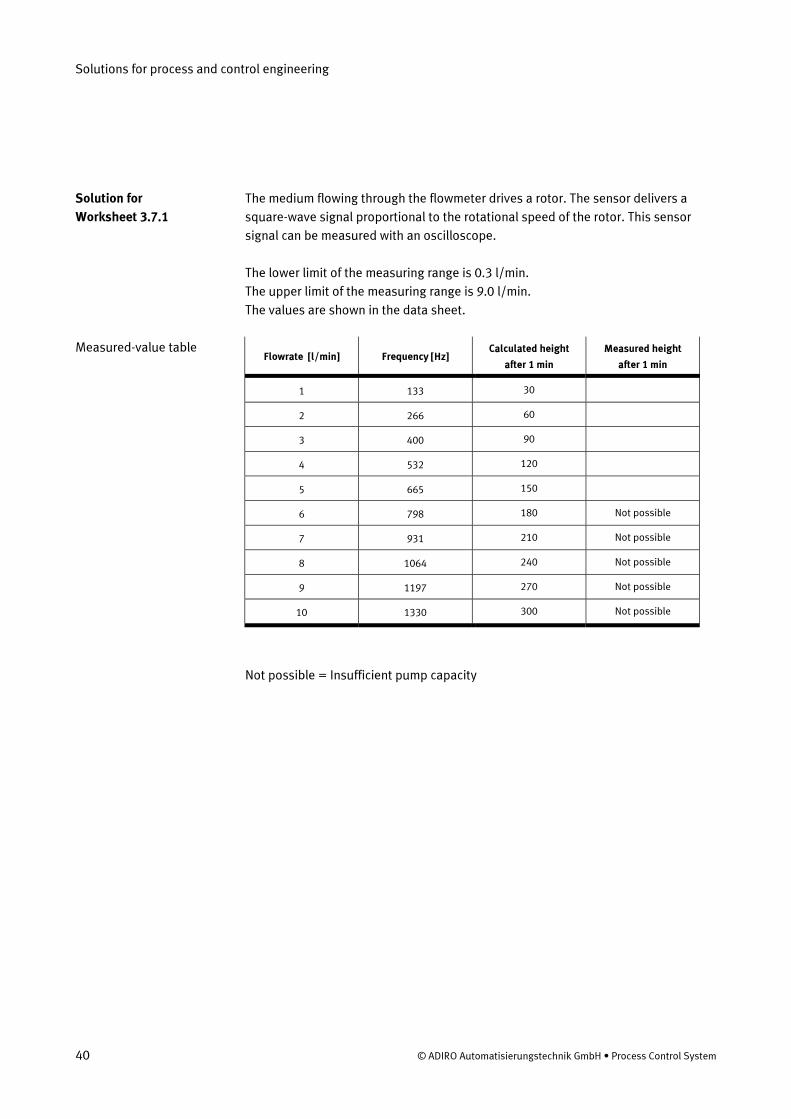
The medium flowing through the flowmeter drives a rotor. The sensor delivers a
square-wave signal proportional to the rotational speed of the rotor. This sensor
signal can be measured with an oscilloscope.
The lower limit of the measuring range is 0.3 l/min.
The upper limit of the measuring range is 9.0 l/min.
The values are shown in the data sheet.
Flowrate [l/min] Frequency [Hz] Calculated height
after 1 min
Measured height
after 1 min
1 133 30
2 266 60
3 400 90
4 532 120
5 665 150
6 798 180 Not possible
7 931 210 Not possible
8 1064 240 Not possible
9 1197 270 Not possible
10 1330 300 Not possible
Not possible = Insufficient pump capacity
Solution for
Worksheet 3.7.1
Measured-value table
Solutions for process and control engineering
© Festo Didactic GmbH & Co. • PCS 41
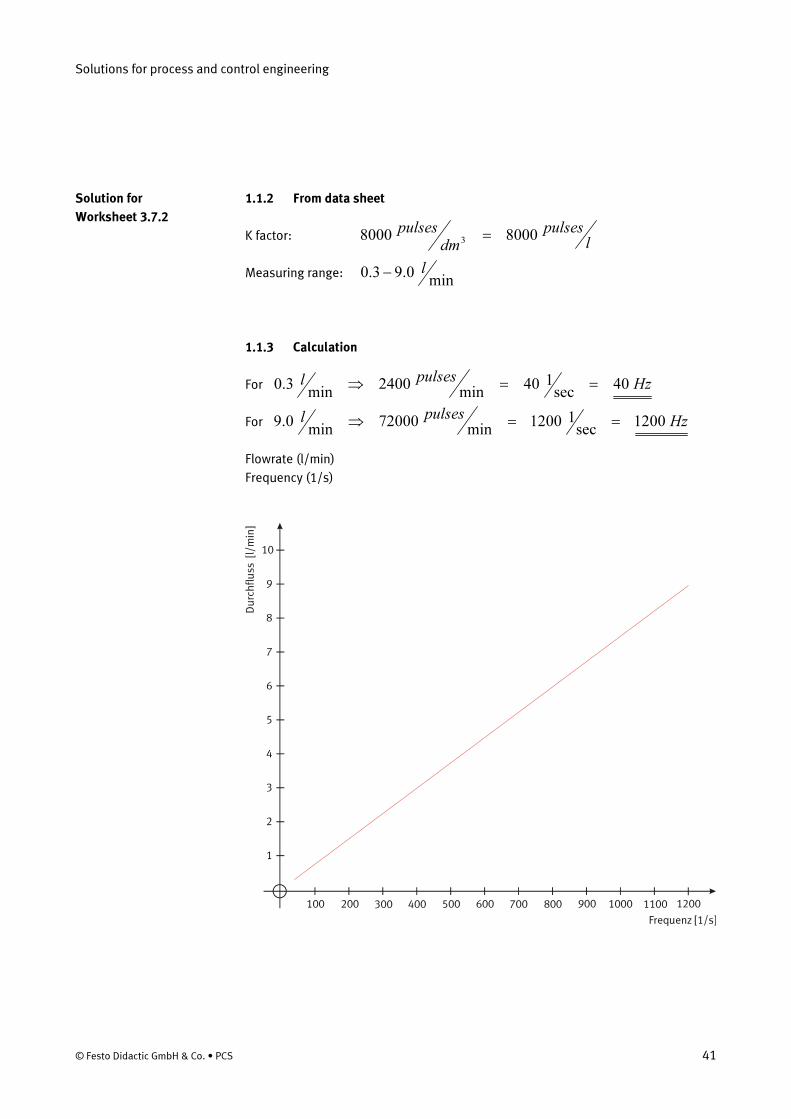
1.1.2 From data sheet
K factor: l
pulsesdm
pulses80008000 3 =
Measuring range: min
0.93.0 l−
1.1.3 Calculation
For Hzpulsesl 40
sec140
min2400
min3.0 ==⇒
For Hzpulsesl 1200
sec11200
min72000
min0.9 ==⇒
Flowrate (l/min)
Frequency (1/s)
100 200 300 400 500 600 700 800 900 1000 1100 1200
1
2
3
4
5
6
7
8
9
10
Du
rch
flu
ss [
l/m
in]
Frequenz [1/s]
Solution for
Worksheet 3.7.2
Solutions for process and control engineering
42 © ADIRO Automatisierungstechnik GmbH • Process Control System
The analog pressure sensor is a piezoresistive relative pressure sensor with integrated amplifier and built-in temperature compensation in an aluminum housing. The pressure to be measured acts on the piezoresistive element. The resulting signal change is emitted via an integrated amplifier as a voltage at the connector. The maximum output voltage is 10V DC. The output signal can be measured with a voltmeter. The temperature of the medium to be measured must be within a certain range, namely between –25°C und 100°C. The measuring range is between 0 and 100 mbar or 0 and 400 mbar, depending on the sensor type (see data sheets).
Solution for
Worksheet 3.8.1
Solutions for process and control engineering
© Festo Didactic GmbH & Co. • PCS 43
0
2
4
6
V
10
U
P
-1 0 20 40 60 mbar 100
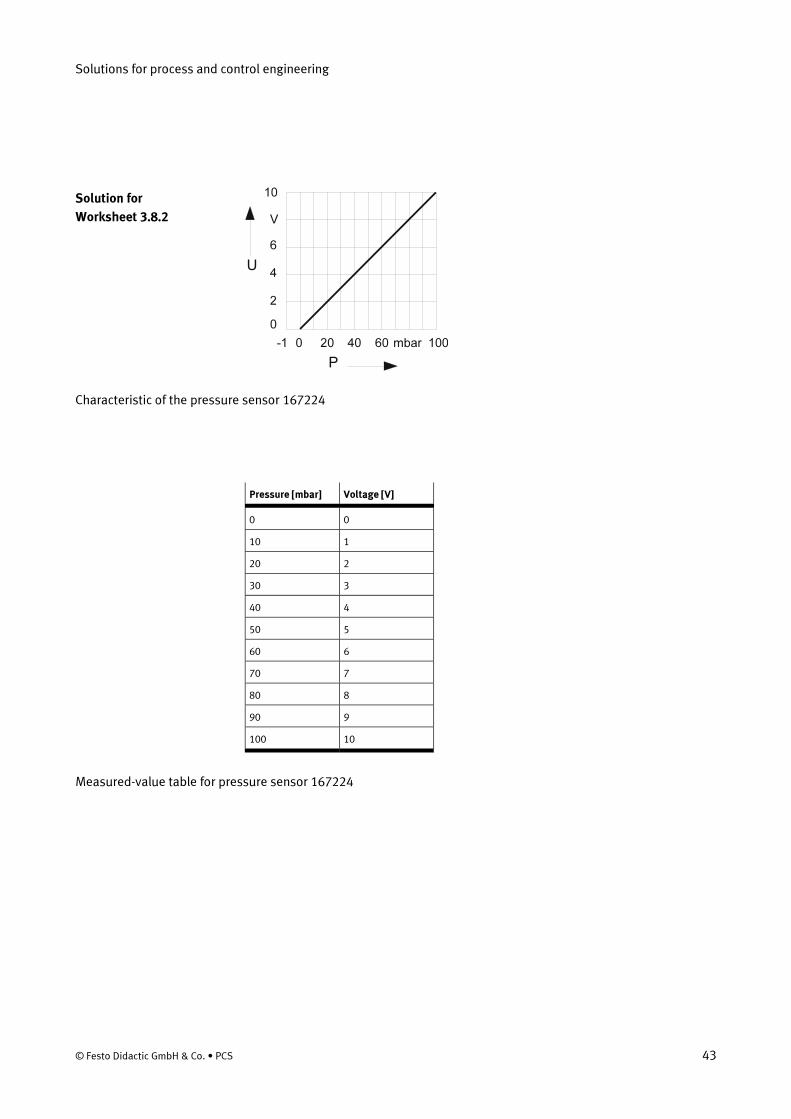
Characteristic of the pressure sensor 167224
Pressure [mbar] Voltage [V]
0 0
10 1
20 2
30 3
40 4
50 5
60 6
70 7
80 8
90 9
100 10
Measured-value table for pressure sensor 167224
Solution for
Worksheet 3.8.2
Solutions for process and control engineering
44 © ADIRO Automatisierungstechnik GmbH • Process Control System
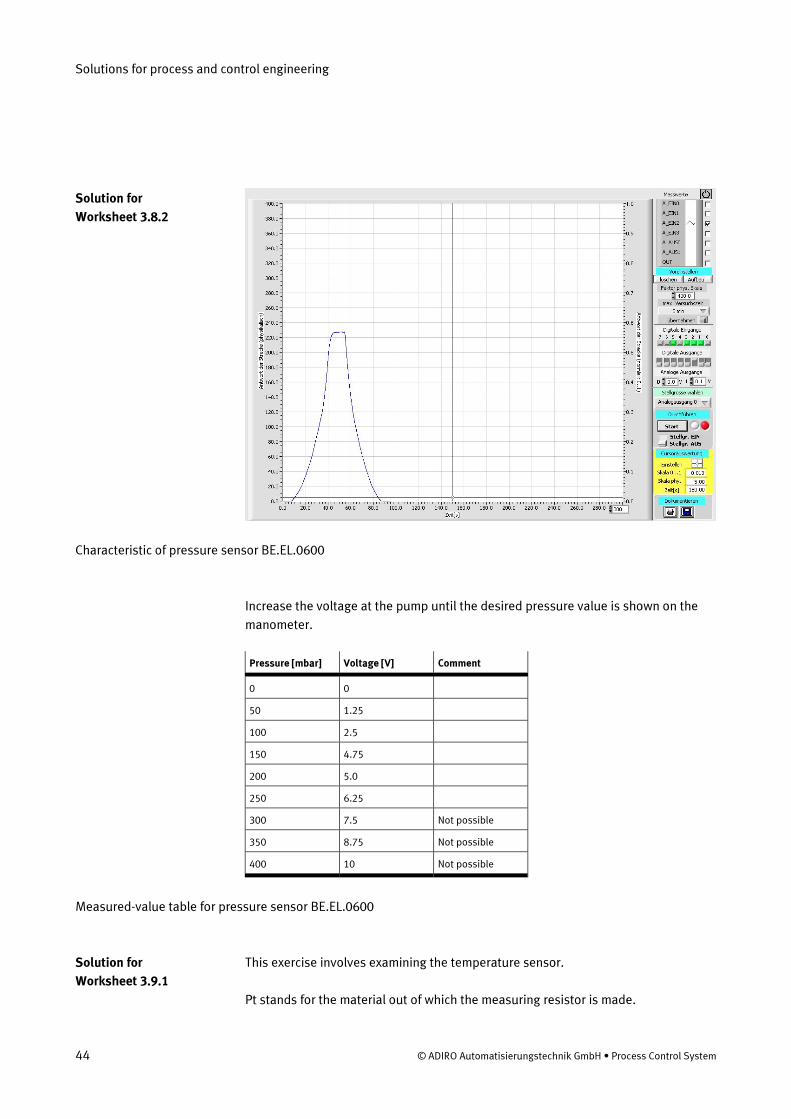
Characteristic of pressure sensor BE.EL.0600
Increase the voltage at the pump until the desired pressure value is shown on the
manometer.
Pressure [mbar] Voltage [V] Comment
0 0
50 1.25
100 2.5
150 4.75
200 5.0
250 6.25
300 7.5 Not possible
350 8.75 Not possible
400 10 Not possible
Measured-value table for pressure sensor BE.EL.0600
This exercise involves examining the temperature sensor.
Pt stands for the material out of which the measuring resistor is made.
Solution for
Worksheet 3.8.2
Solution for
Worksheet 3.9.1
Solutions for process and control engineering
© Festo Didactic GmbH & Co. • PCS 45
• Pt: Platinum,
• Ni: Nickel.
100 stands for the resistance in Ohms, when the measuring resistor has a
temperature of 0°C.
There are also Pt1000 Sensors. Logically, these have a resistance of 1000 Ohm at a
reference temperature of 0°C.
The temperature coefficient of the sensors is uniform at 3850 ppm/K. That means
the internal resistance of the sensor changes by 0.385% for each degree change in
temperature.
Based on these values, the resistance of the Pt100 at 100°C can be calculated as
follows:
Temperature change from
%5.38%385.0100 100100t0 =⋅⇒=°°K
K K C o C
Ω=Ω+Ω=∆+=⇒Ω=∆⇒°°
5.1385.381005.381000100100 KCCK
RRRR
The measuring resistor can be measured with an ohmmeter.
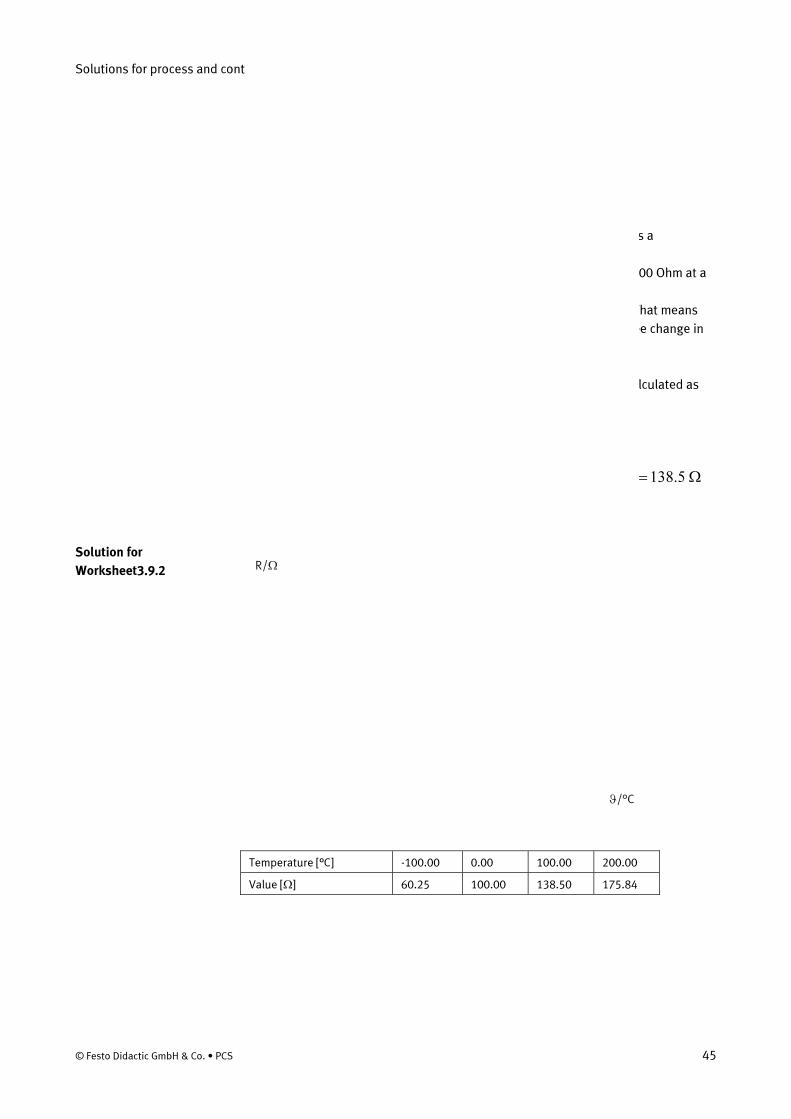
ϑ/°C
R/Ω
Temperature [°C] -100.00 0.00 100.00 200.00
Value [Ω] 60.25 100.00 138.50 175.84
Solution for
Worksheet3.9.2
Solutions for process and control engineering
46 © ADIRO Automatisierungstechnik GmbH • Process Control System
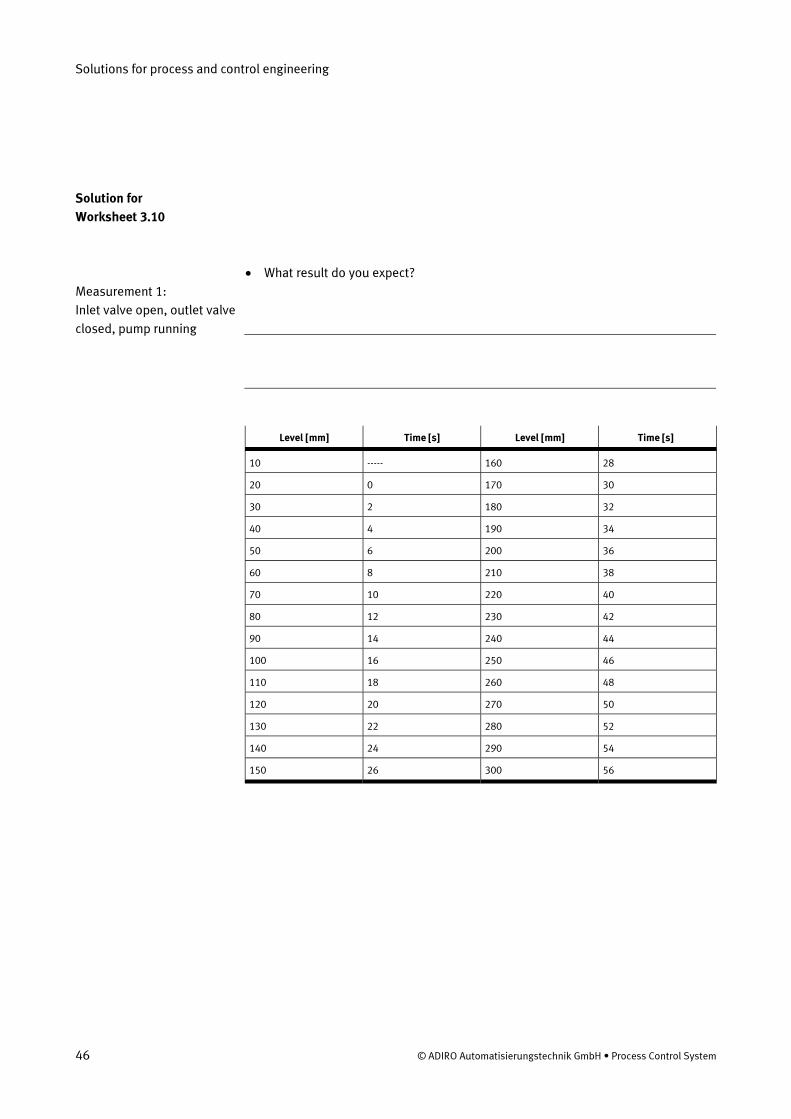
• What result do you expect?
Level [mm] Time [s] Level [mm] Time [s]
10 ----- 160 28
20 0 170 30
30 2 180 32
40 4 190 34
50 6 200 36
60 8 210 38
70 10 220 40
80 12 230 42
90 14 240 44
100 16 250 46
110 18 260 48
120 20 270 50
130 22 280 52
140 24 290 54
150 26 300 56
Solution for
Worksheet 3.10
Measurement 1:
Inlet valve open, outlet valve
closed, pump running

Solutions for process and control engineering
© Festo Didactic GmbH & Co. • PCS 47
Inflow characteristic with FluidLab-PA - Inlet valve open, outlet valve closed
Solutions for process and control engineering
48 © ADIRO Automatisierungstechnik GmbH • Process Control System
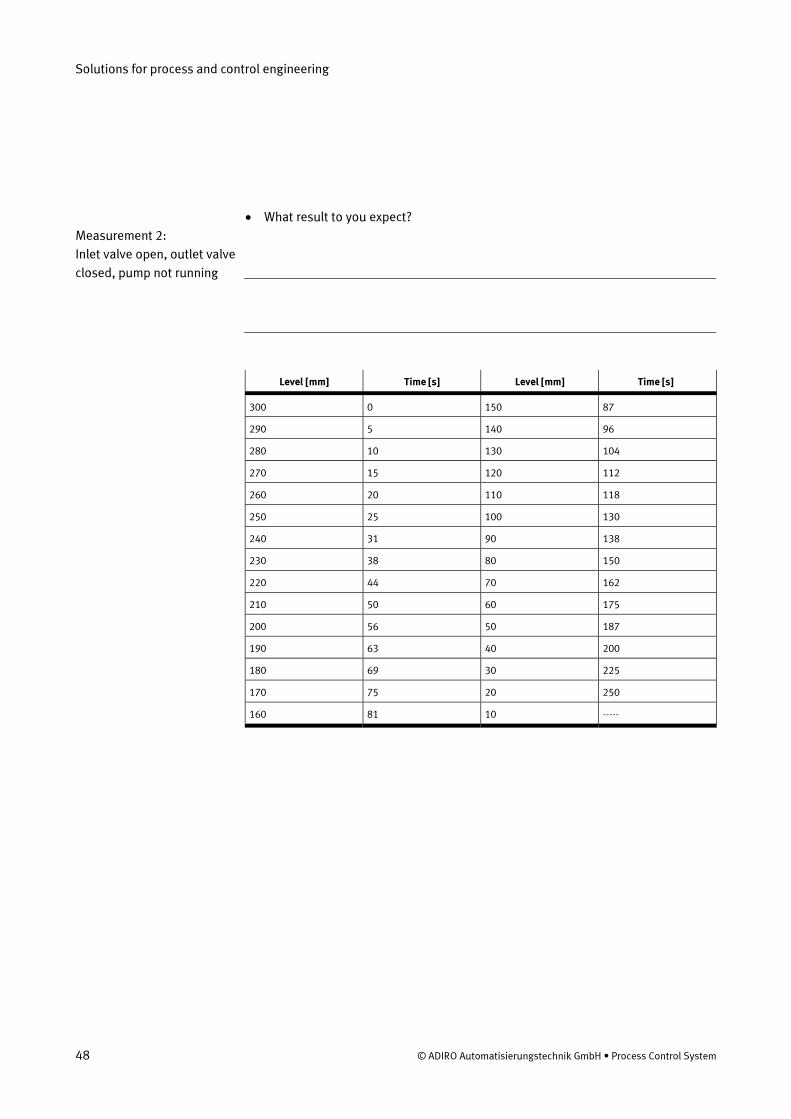
• What result to you expect?
Level [mm] Time [s] Level [mm] Time [s]
300 0 150 87
290 5 140 96
280 10 130 104
270 15 120 112
260 20 110 118
250 25 100 130
240 31 90 138
230 38 80 150
220 44 70 162
210 50 60 175
200 56 50 187
190 63 40 200
180 69 30 225
170 75 20 250
160 81 10 -----
Measurement 2:
Inlet valve open, outlet valve
closed, pump not running
Solutions for process and control engineering
© Festo Didactic GmbH & Co. • PCS 49
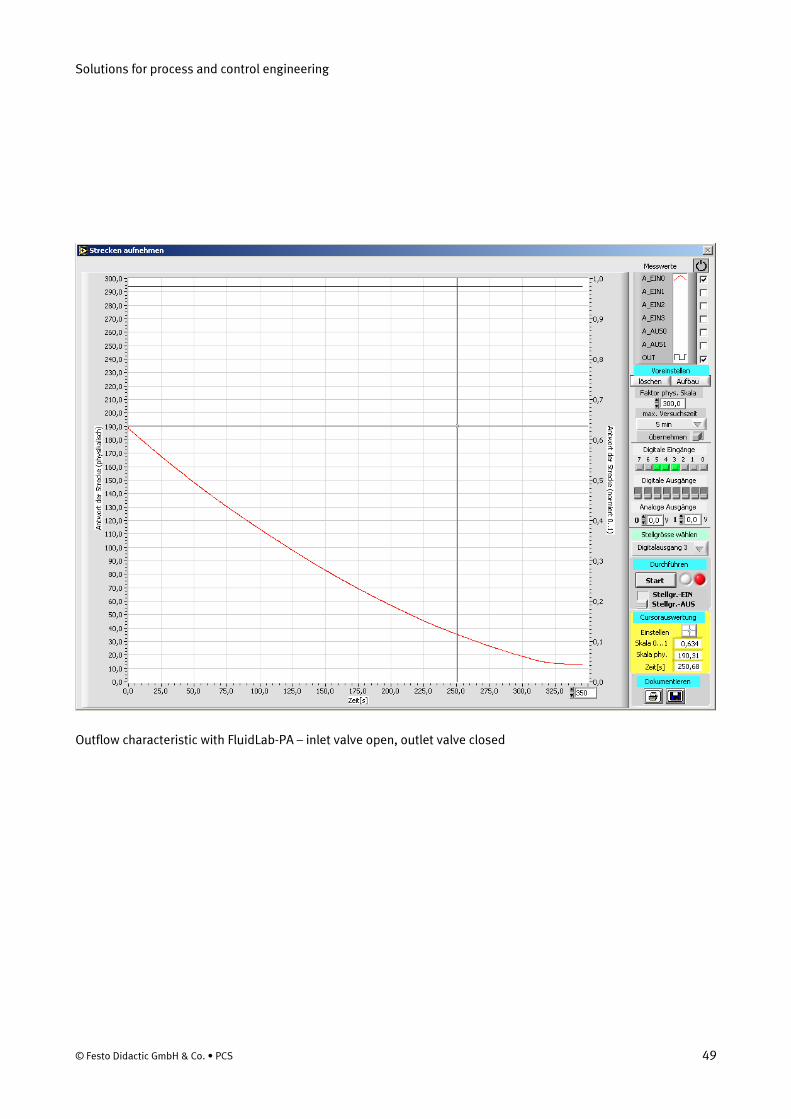
Outflow characteristic with FluidLab-PA – inlet valve open, outlet valve closed
Solutions for process and control engineering
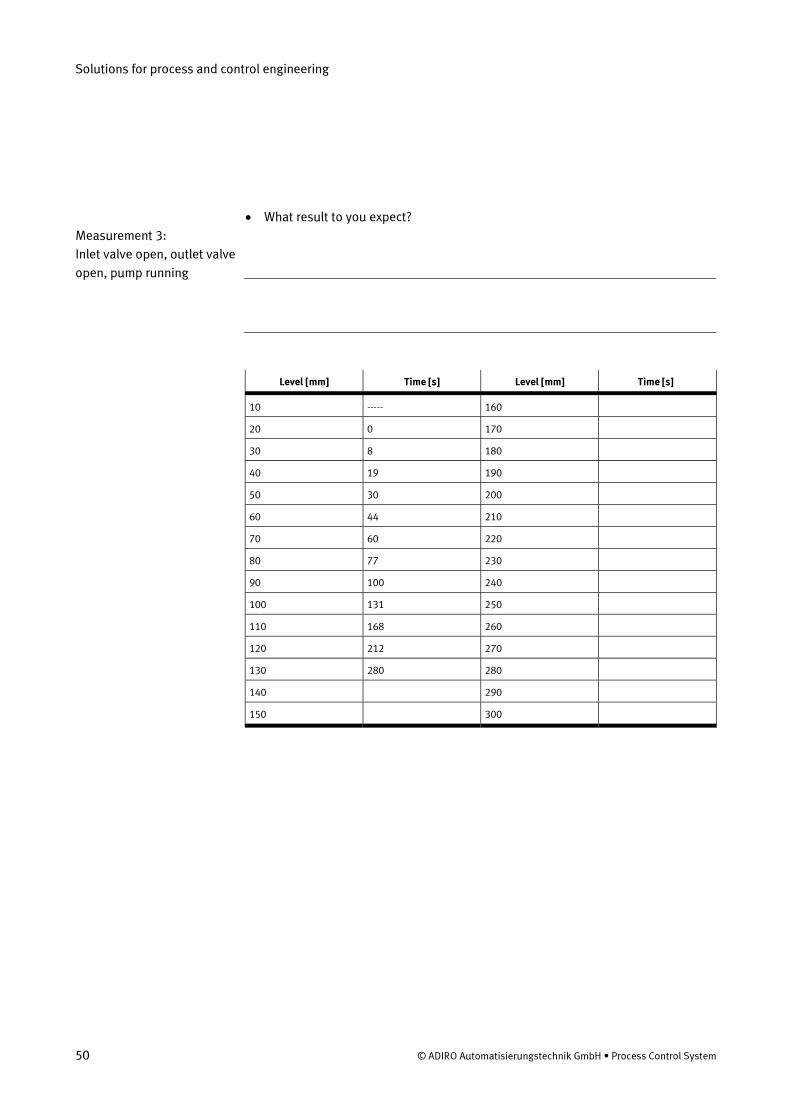
50 © ADIRO Automatisierungstechnik GmbH • Process Control System
• What result to you expect?
Level [mm] Time [s] Level [mm] Time [s]
10 ----- 160
20 0 170
30 8 180
40 19 190
50 30 200
60 44 210
70 60 220
80 77 230
90 100 240
100 131 250
110 168 260
120 212 270
130 280 280
140 290
150 300
Measurement 3:
Inlet valve open, outlet valve
open, pump running
Solutions for process and control engineering
© Festo Didactic GmbH & Co. • PCS 51
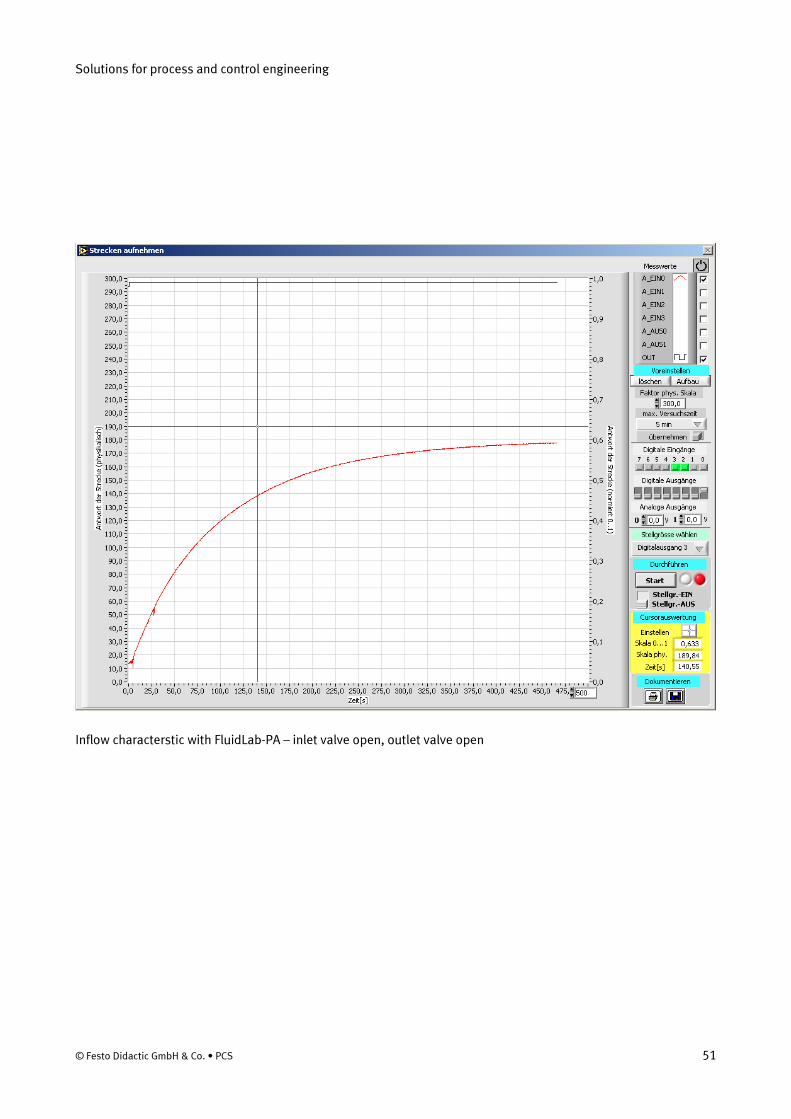
Inflow characterstic with FluidLab-PA – inlet valve open, outlet valve open
Solutions for process and control engineering
52 © ADIRO Automatisierungstechnik GmbH • Process Control System
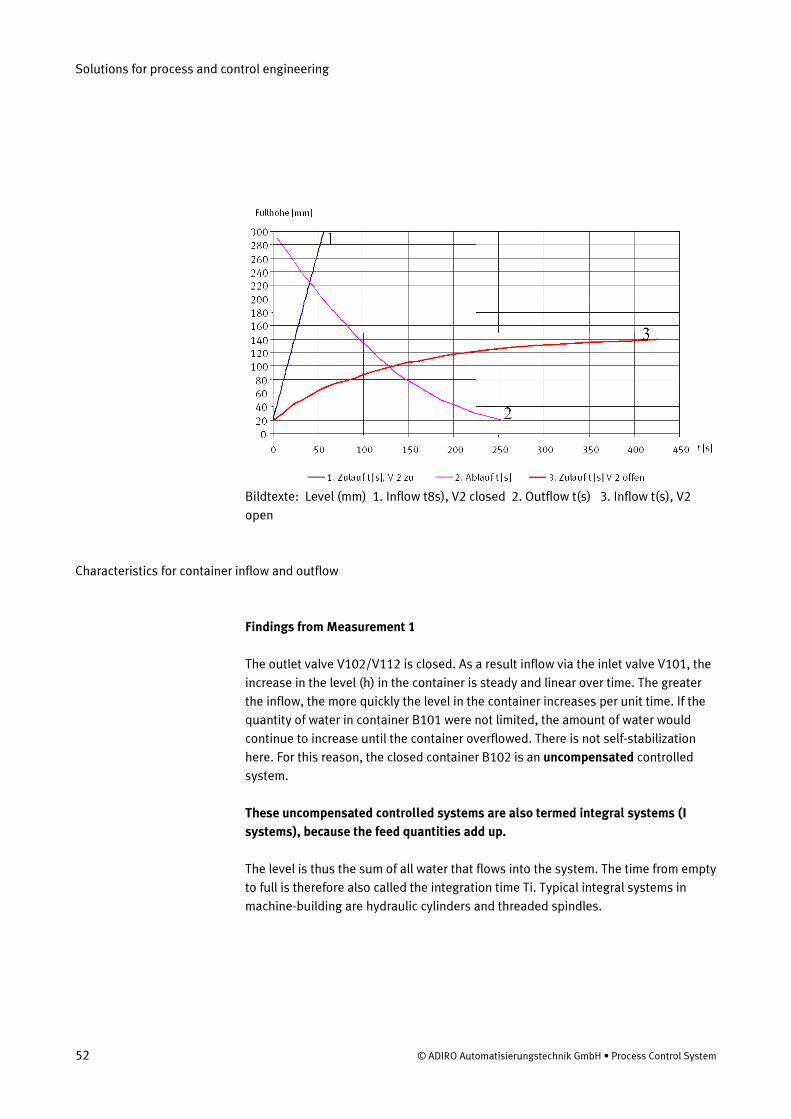
Bildtexte: Level (mm) 1. Inflow t8s), V2 closed 2. Outflow t(s) 3. Inflow t(s), V2
open
Characteristics for container inflow and outflow
Findings from Measurement 1
The outlet valve V102/V112 is closed. As a result inflow via the inlet valve V101, the
increase in the level (h) in the container is steady and linear over time. The greater
the inflow, the more quickly the level in the container increases per unit time. If the
quantity of water in container B101 were not limited, the amount of water would
continue to increase until the container overflowed. There is not self-stabilization
here. For this reason, the closed container B102 is an uncompensated controlled
system.
These uncompensated controlled systems are also termed integral systems (I
systems), because the feed quantities add up.
The level is thus the sum of all water that flows into the system. The time from empty
to full is therefore also called the integration time Ti. Typical integral systems in
machine-building are hydraulic cylinders and threaded spindles.
Solutions for process and control engineering
© Festo Didactic GmbH & Co. • PCS 53
Findings from Measurement 2
The hydrostatic pressure in the water column ensures a reduction of flowrate at the
outlet. The lower the water column, the lower the hydrostatic pressure and thus the
lower the amount of water outflow. This results in a non-linear characteristic.
Example: Electrical engineering: discharge of a capacitor
Finding from Measurement 3
Controlled systems with compensation are controlled systems whose characteristic
reaches equilibrium after a time.
In level-controlled systems, the compensation takes the following physical form.
When filling with a constant flowrate (inflow), the pressure of the water column at
the bottom of the container is proportional to the level.
The pressure at the bottom increases with level. This results in an increase in
outflow until equilibrium with the inflow is reached. This results in a constant level -
that is, it no longer increases. This is called a steady-state end value.
Outflow flowrate of water = inflow flowrate
Controlled systems with equilibrium are also called PT controlled systems:
P – because the steady-state value is proportional to the input vale
T – because the steady-state value is only reached after time T
If only container (controlled system) is present, the controlled system is called a PT1
= 1st order controlled system. A controlled system of the 0th order would be a pure
P system, for example, a lever: the force is transmitted immediately without any
delay.
Solutions for process and control engineering
54 © ADIRO Automatisierungstechnik GmbH • Process Control System
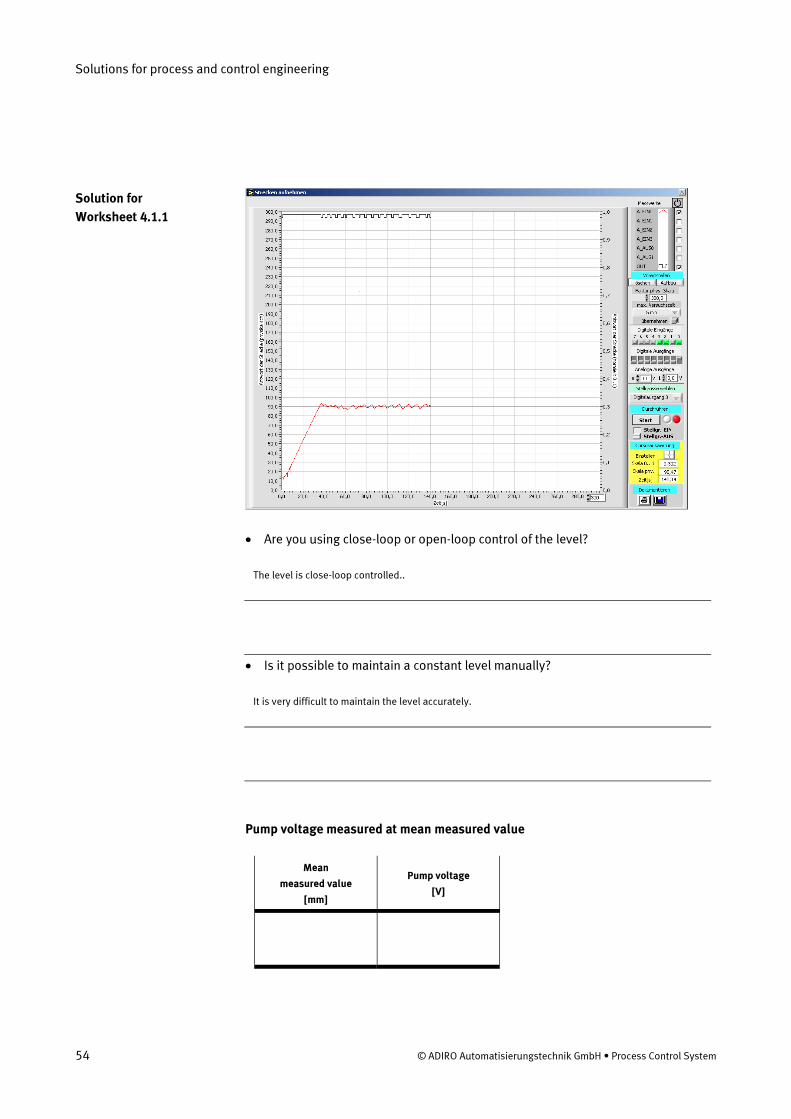
• Are you using close-loop or open-loop control of the level?
The level is close-loop controlled..
• Is it possible to maintain a constant level manually?
It is very difficult to maintain the level accurately.
Pump voltage measured at mean measured value
Mean
measured value
[mm]
Pump voltage
[V]
Solution for
Worksheet 4.1.1
Solutions for process and control engineering
© Festo Didactic GmbH & Co. • PCS 55
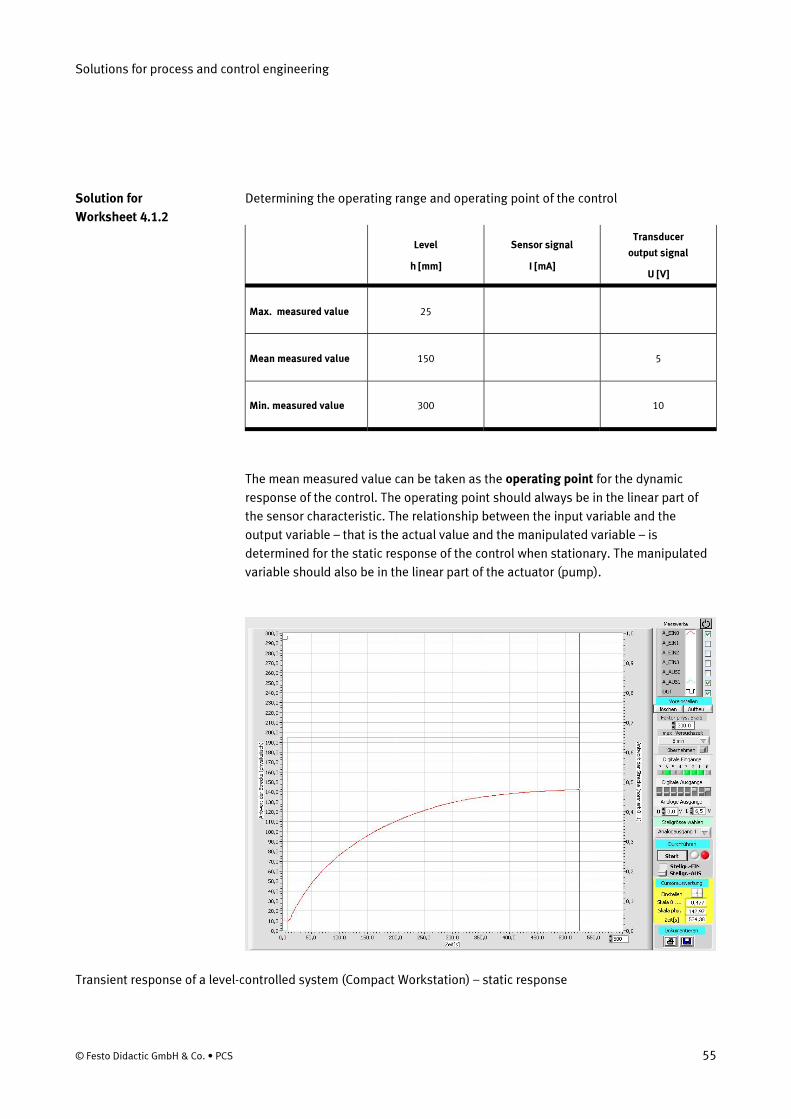
Determining the operating range and operating point of the control
Level
h [mm]
Sensor signal
I [mA]
Transducer
output signal
U [V]
Max. measured value 25
Mean measured value 150 5
Min. measured value 300 10
The mean measured value can be taken as the operating point for the dynamic
response of the control. The operating point should always be in the linear part of
the sensor characteristic. The relationship between the input variable and the
output variable – that is the actual value and the manipulated variable – is
determined for the static response of the control when stationary. The manipulated
variable should also be in the linear part of the actuator (pump).
Transient response of a level-controlled system (Compact Workstation) – static response
Solution for
Worksheet 4.1.2
Solutions for process and control engineering
56 © ADIRO Automatisierungstechnik GmbH • Process Control System
A functioning control always comprises at least two elements: a controller and a
controlled system. For control tasks it is essential to know which variable in the
system is to be controlled.
In a level-controlled system, the controlled variable is the level – its current status
(actual value) is interrogated by a sensor.
How does the system respond with the outlet valve closed?
The level (actual value) slowly approaches the setpoint.
Once the setpoint is reached, the controller ensures that the speed of the pump is
reduced as required to maintain the desired level.
How does the system respond with the outlet valve open?
Opening the outlet valve acts as a disturbance variable. Water is suddenly removed
from the container. The level of the container is maintained, however. The pump
runs faster (higher RPM) than with the outlet valve closed.
Background
The controller has the task of controlling the system in such a way that the
controlled variable (that is, the level), remains as constant as possible. In the event
of a disturbance (sudden removal of water), the controller increases the speed of the
pump to pump more water into the container and thus compensate the loss.
The controller is informed of a change in level by the signal from the sensor. This
signal is termed the actual value.
Solution for
Worksheet 4.1.3
Solutions for process and control engineering
© Festo Didactic GmbH & Co. • PCS 57
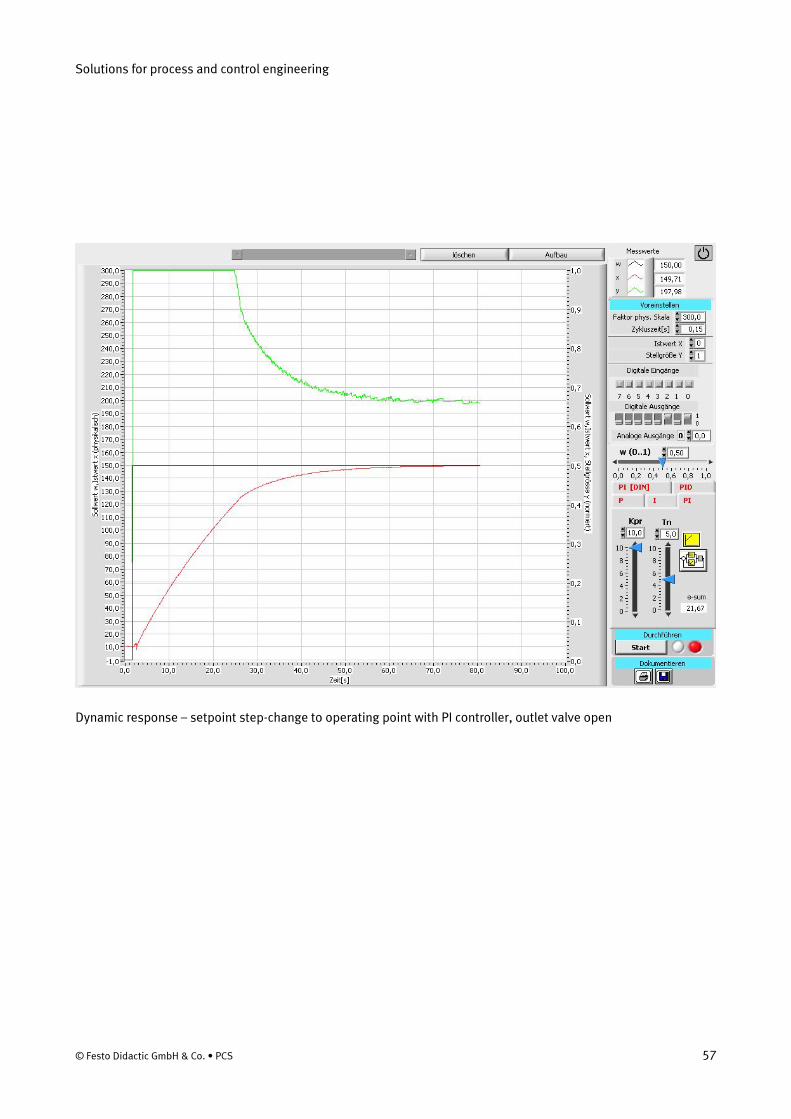
Dynamic response – setpoint step-change to operating point with PI controller, outlet valve open
Solutions for process and control engineering
58 © ADIRO Automatisierungstechnik GmbH • Process Control System
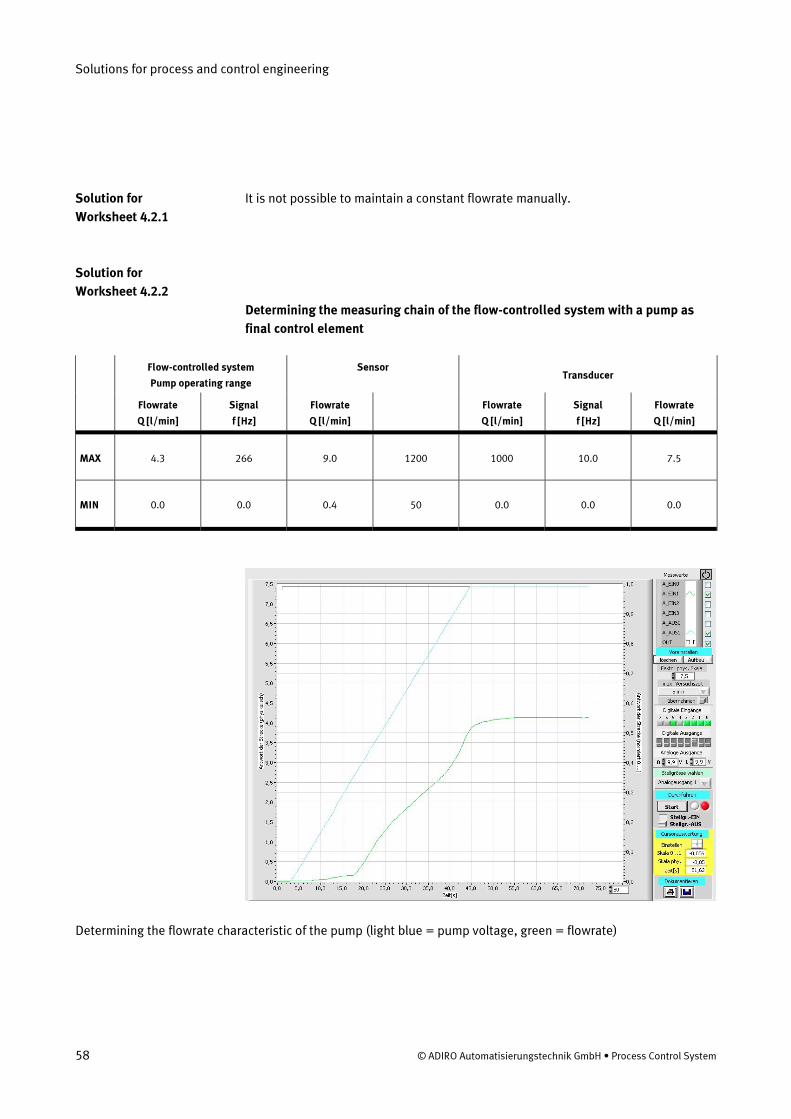
It is not possible to maintain a constant flowrate manually.
Determining the measuring chain of the flow-controlled system with a pump as
final control element
Flow-controlled system
Pump operating range
Sensor Transducer
Flowrate
Q [l/min]
Signal
f [Hz]
Flowrate
Q [l/min]
Flowrate
Q [l/min]
Signal
f [Hz]
Flowrate
Q [l/min]
MAX 4.3 266 9.0 1200 1000 10.0 7.5
MIN 0.0 0.0 0.4 50 0.0 0.0 0.0
Determining the flowrate characteristic of the pump (light blue = pump voltage, green = flowrate)
Solution for
Worksheet 4.2.1
Solution for
Worksheet 4.2.2
Solutions for process and control engineering
© Festo Didactic GmbH & Co. • PCS 59
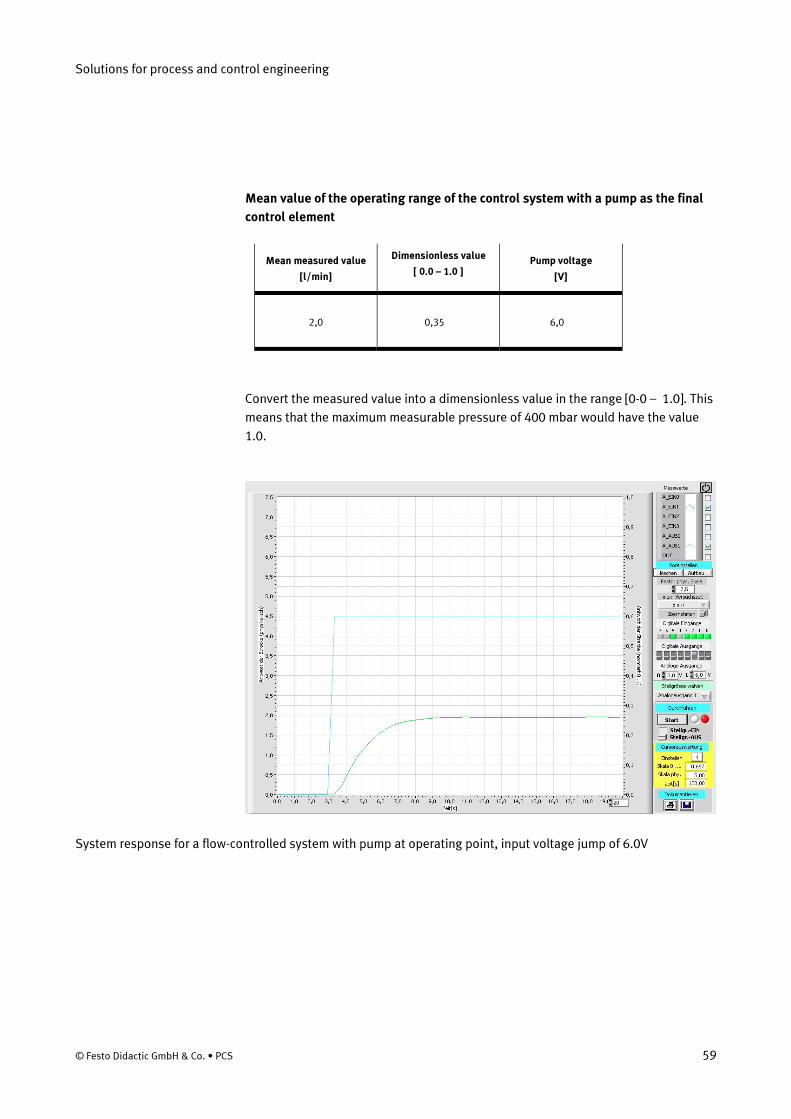
Mean value of the operating range of the control system with a pump as the final
control element
Mean measured value
[l/min]
Dimensionless value
[ 0.0 – 1.0 ] Pump voltage
[V]
2,0 0,35 6,0
Convert the measured value into a dimensionless value in the range [0-0 – 1.0]. This
means that the maximum measurable pressure of 400 mbar would have the value
1.0.
System response for a flow-controlled system with pump at operating point, input voltage jump of 6.0V
Solutions for process and control engineering
60 © ADIRO Automatisierungstechnik GmbH • Process Control System
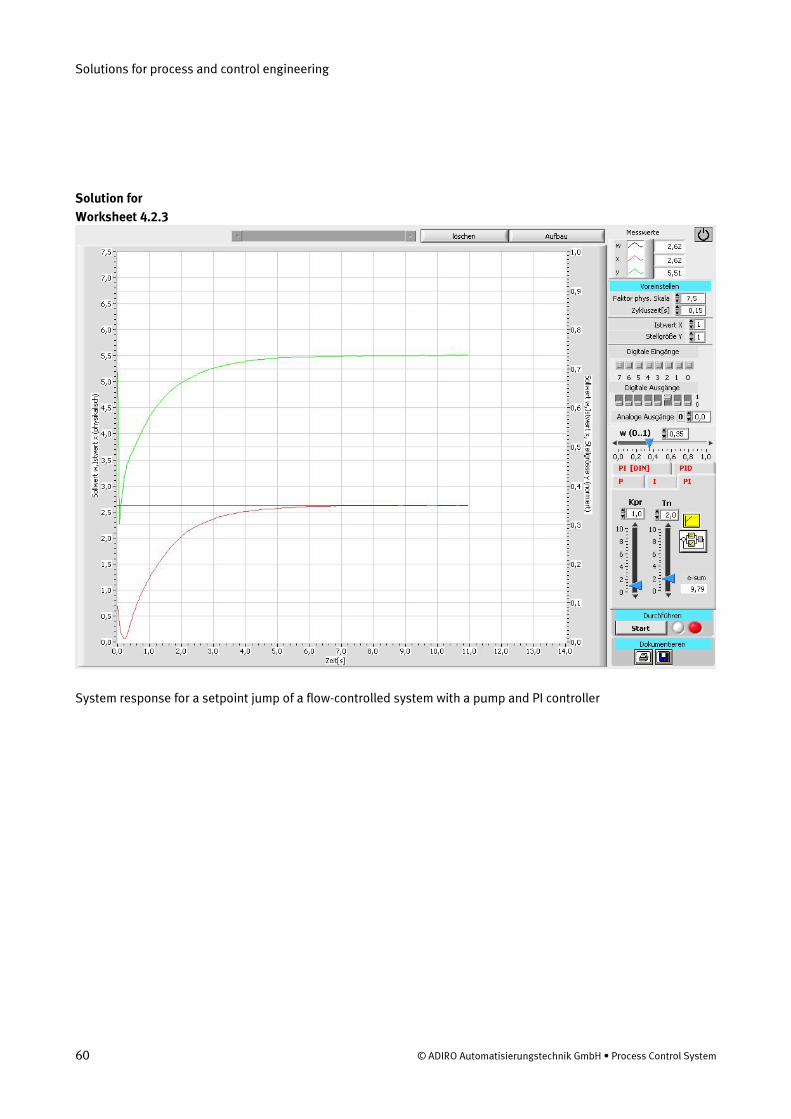
System response for a setpoint jump of a flow-controlled system with a pump and PI controller
Solution for
Worksheet 4.2.3
Solutions for process and control engineering
© Festo Didactic GmbH & Co. • PCS 61
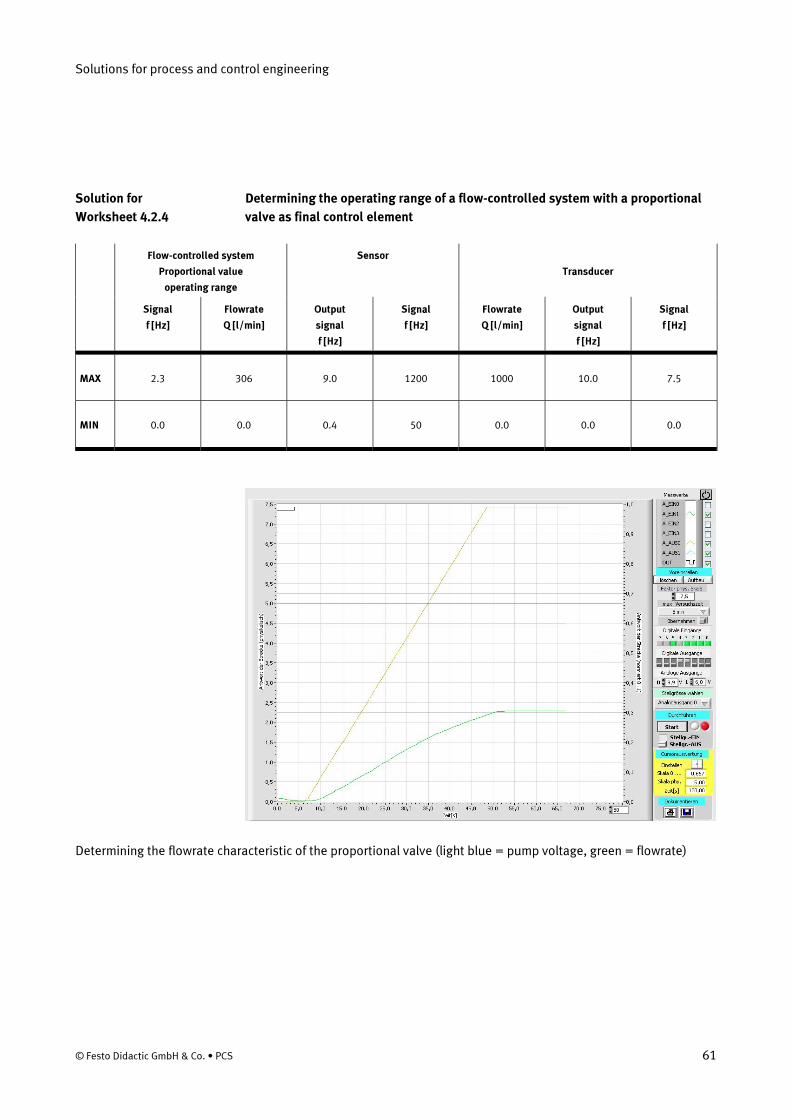
Determining the operating range of a flow-controlled system with a proportional
valve as final control element
Flow-controlled system
Proportional value
operating range
Sensor
Transducer
Signal
f [Hz]
Flowrate
Q [l/min]
Output
signal
f [Hz]
Signal
f [Hz]
Flowrate
Q [l/min]
Output
signal
f [Hz]
Signal
f [Hz]
MAX 2.3 306 9.0 1200 1000 10.0 7.5
MIN 0.0 0.0 0.4 50 0.0 0.0 0.0
Determining the flowrate characteristic of the proportional valve (light blue = pump voltage, green = flowrate)
Solution for
Worksheet 4.2.4
Solutions for process and control engineering
62 © ADIRO Automatisierungstechnik GmbH • Process Control System
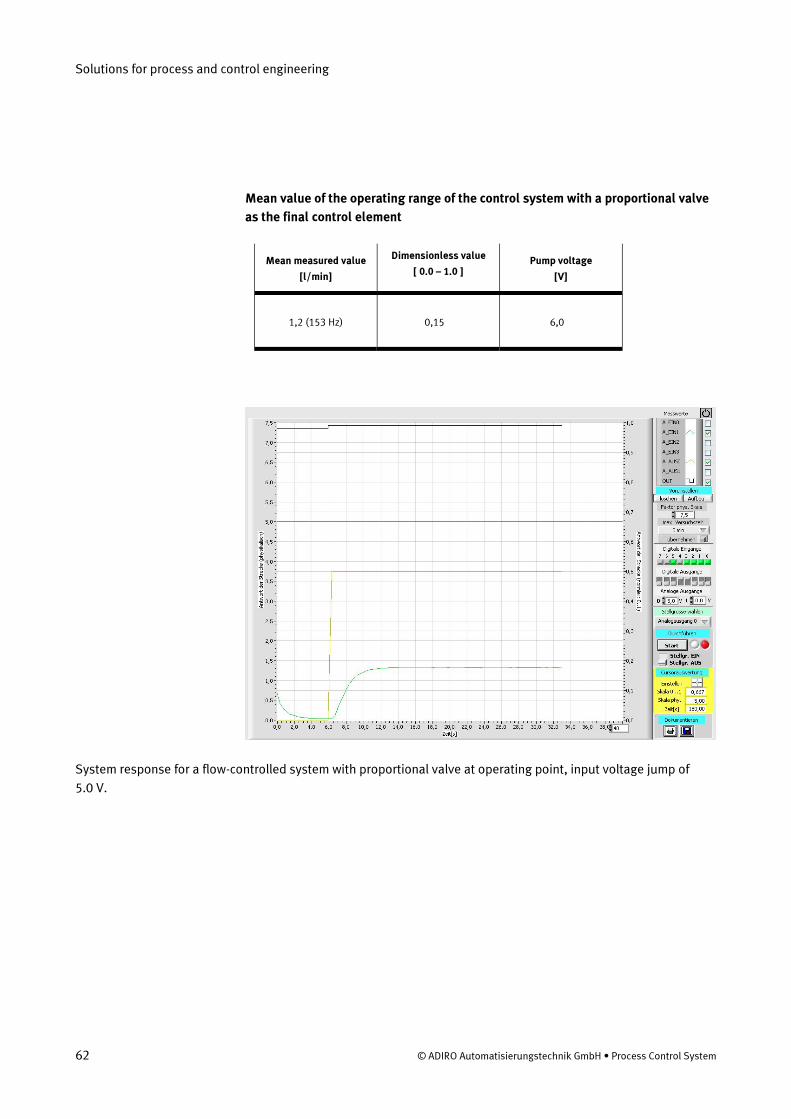
Mean value of the operating range of the control system with a proportional valve
as the final control element
Mean measured value
[l/min]
Dimensionless value
[ 0.0 – 1.0 ] Pump voltage
[V]
1,2 (153 Hz) 0,15 6,0
System response for a flow-controlled system with proportional valve at operating point, input voltage jump of
5.0 V.
Solutions for process and control engineering
© Festo Didactic GmbH & Co. • PCS 63
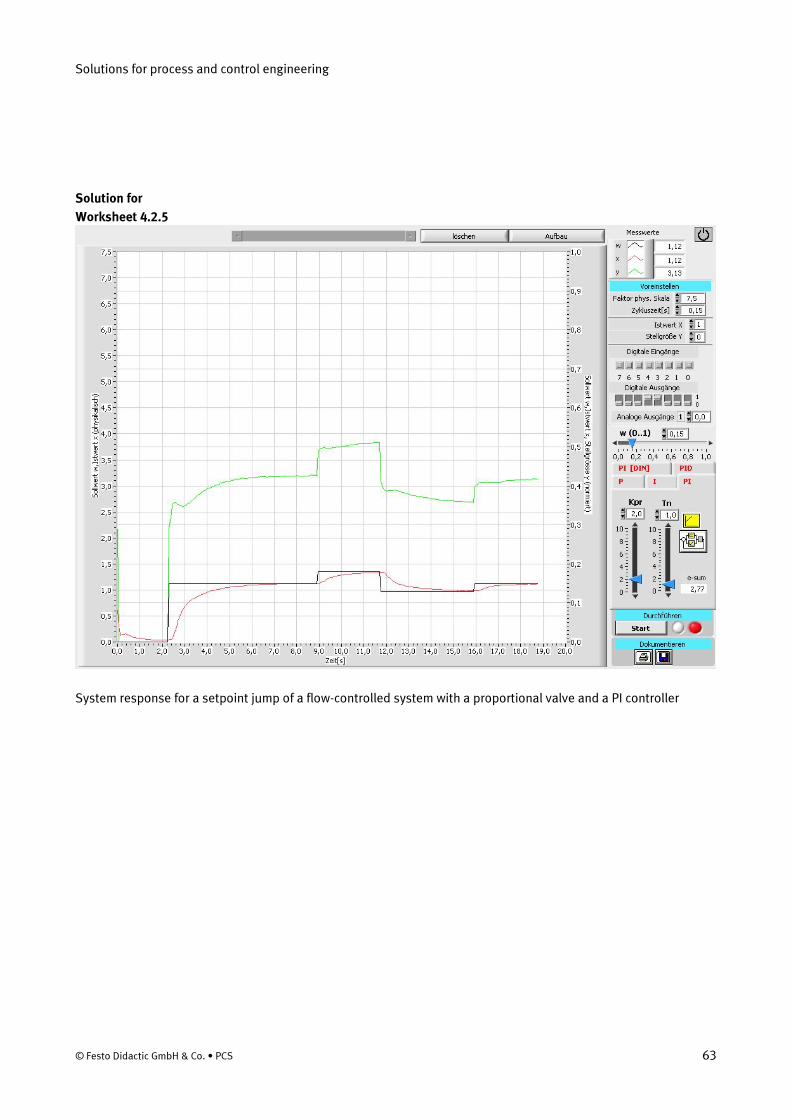
System response for a setpoint jump of a flow-controlled system with a proportional valve and a PI controller
Solution for
Worksheet 4.2.5
Solutions for process and control engineering
64 © ADIRO Automatisierungstechnik GmbH • Process Control System
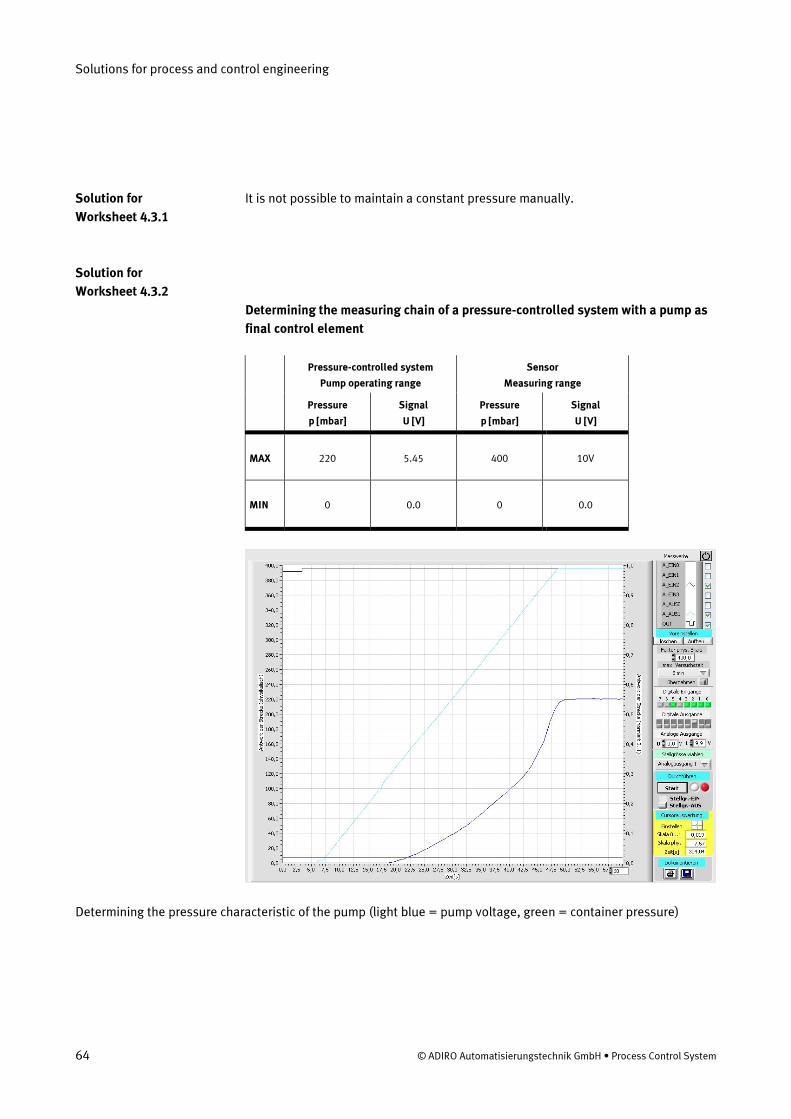
It is not possible to maintain a constant pressure manually.
Determining the measuring chain of a pressure-controlled system with a pump as
final control element
Pressure-controlled system
Pump operating range
Sensor
Measuring range
Pressure
p [mbar]
Signal
U [V]
Pressure
p [mbar]
Signal
U [V]
MAX 220 5.45 400 10V
MIN 0 0.0 0 0.0
Determining the pressure characteristic of the pump (light blue = pump voltage, green = container pressure)
Solution for
Worksheet 4.3.1
Solution for
Worksheet 4.3.2
Solutions for process and control engineering
© Festo Didactic GmbH & Co. • PCS 65
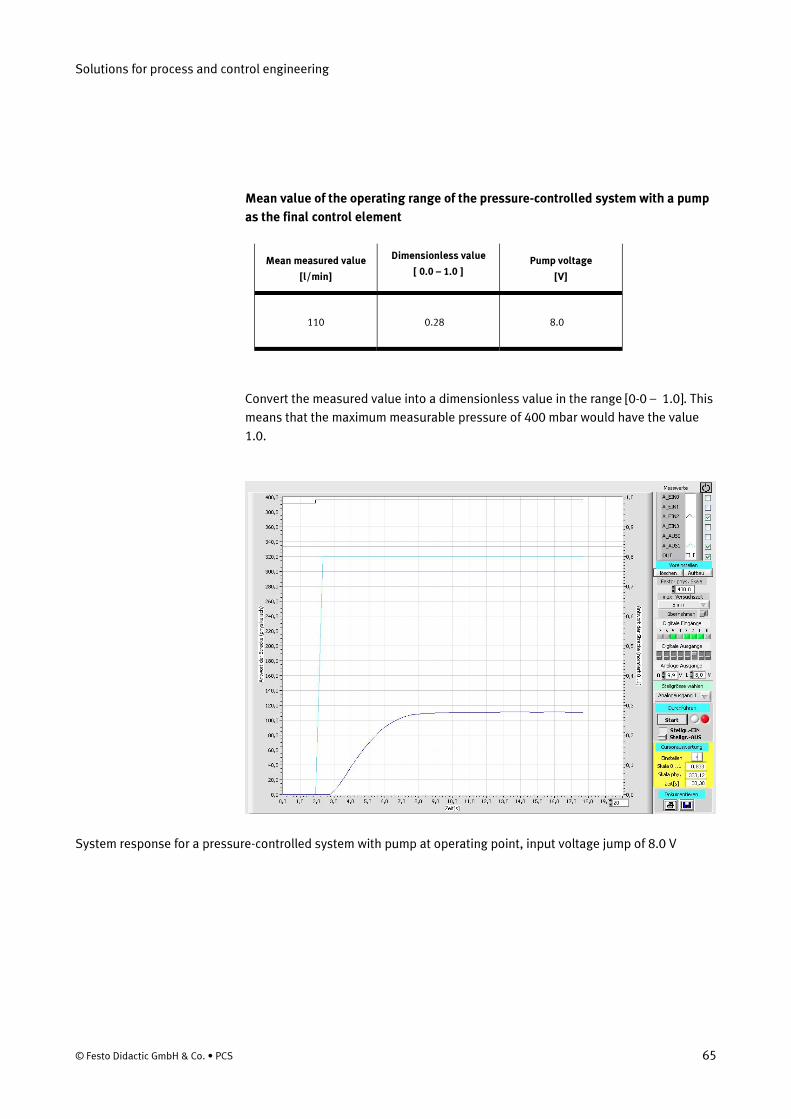
Mean value of the operating range of the pressure-controlled system with a pump
as the final control element
Mean measured value
[l/min]
Dimensionless value
[ 0.0 – 1.0 ] Pump voltage
[V]
110 0.28 8.0
Convert the measured value into a dimensionless value in the range [0-0 – 1.0]. This
means that the maximum measurable pressure of 400 mbar would have the value
1.0.
System response for a pressure-controlled system with pump at operating point, input voltage jump of 8.0 V
Solutions for process and control engineering
66 © ADIRO Automatisierungstechnik GmbH • Process Control System
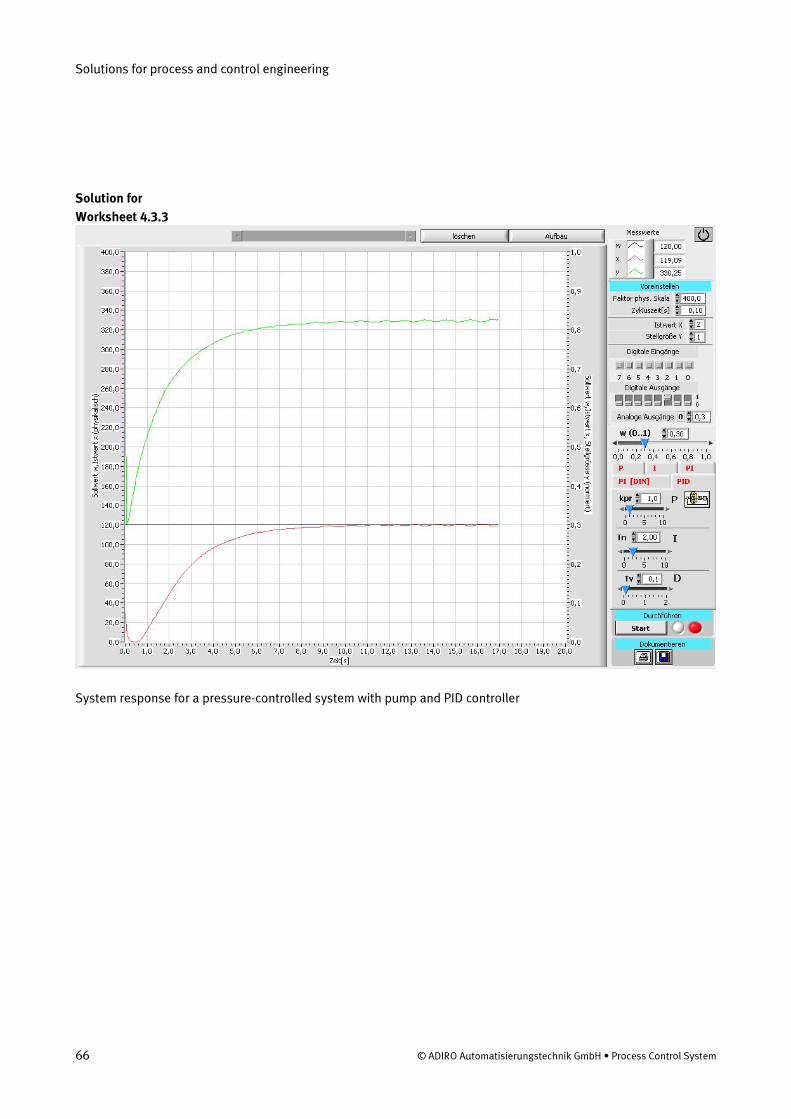
System response for a pressure-controlled system with pump and PID controller
Solution for
Worksheet 4.3.3
Solutions for process and control engineering
© Festo Didactic GmbH & Co. • PCS 67
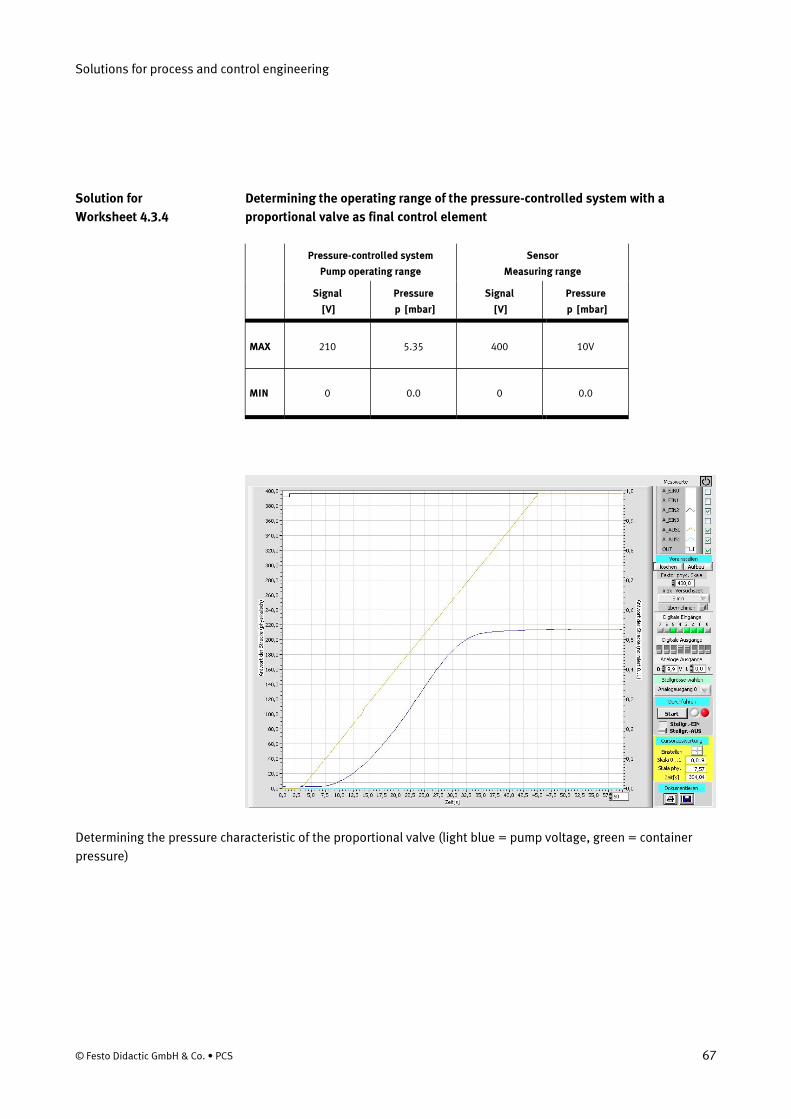
Determining the operating range of the pressure-controlled system with a
proportional valve as final control element
Pressure-controlled system
Pump operating range
Sensor
Measuring range
Signal
[V]
Pressure
p [mbar]
Signal
[V]
Pressure
p [mbar]
MAX 210 5.35 400 10V
MIN 0 0.0 0 0.0
Determining the pressure characteristic of the proportional valve (light blue = pump voltage, green = container
pressure)
Solution for
Worksheet 4.3.4
Solutions for process and control engineering
68 © ADIRO Automatisierungstechnik GmbH • Process Control System
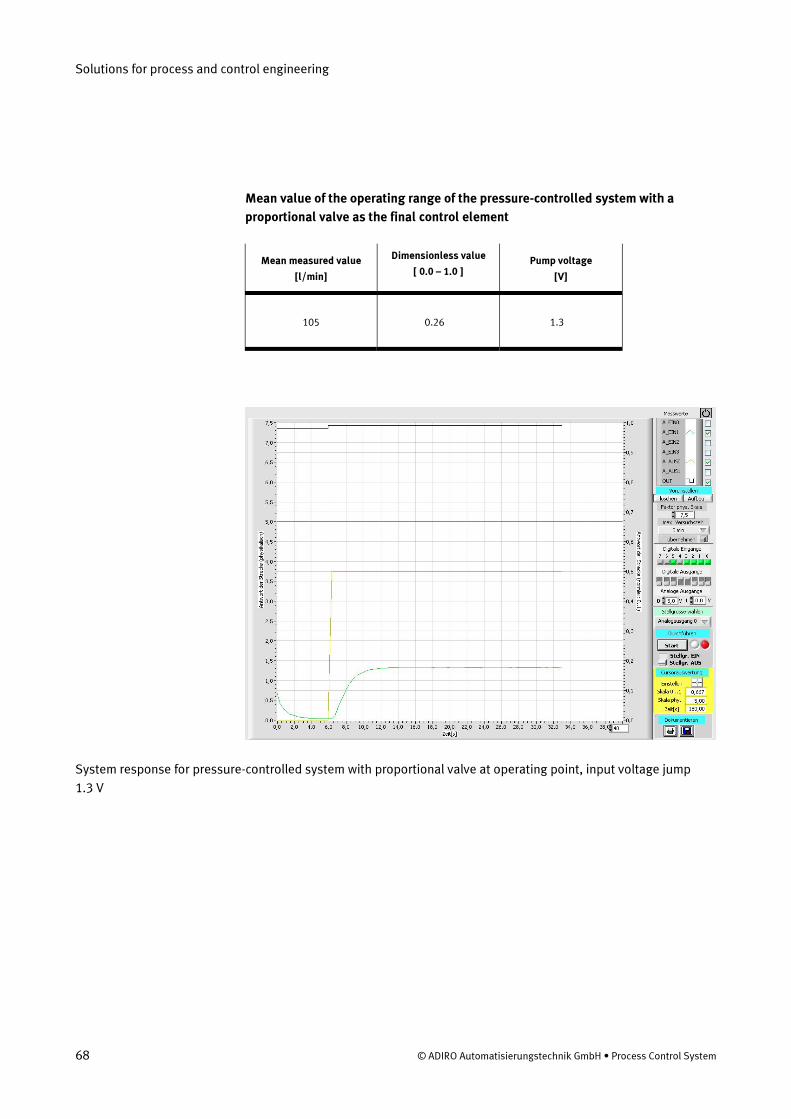
Mean value of the operating range of the pressure-controlled system with a
proportional valve as the final control element
Mean measured value
[l/min]
Dimensionless value
[ 0.0 – 1.0 ] Pump voltage
[V]
105 0.26 1.3
System response for pressure-controlled system with proportional valve at operating point, input voltage jump
1.3 V
Solutions for process and control engineering
© Festo Didactic GmbH & Co. • PCS 69
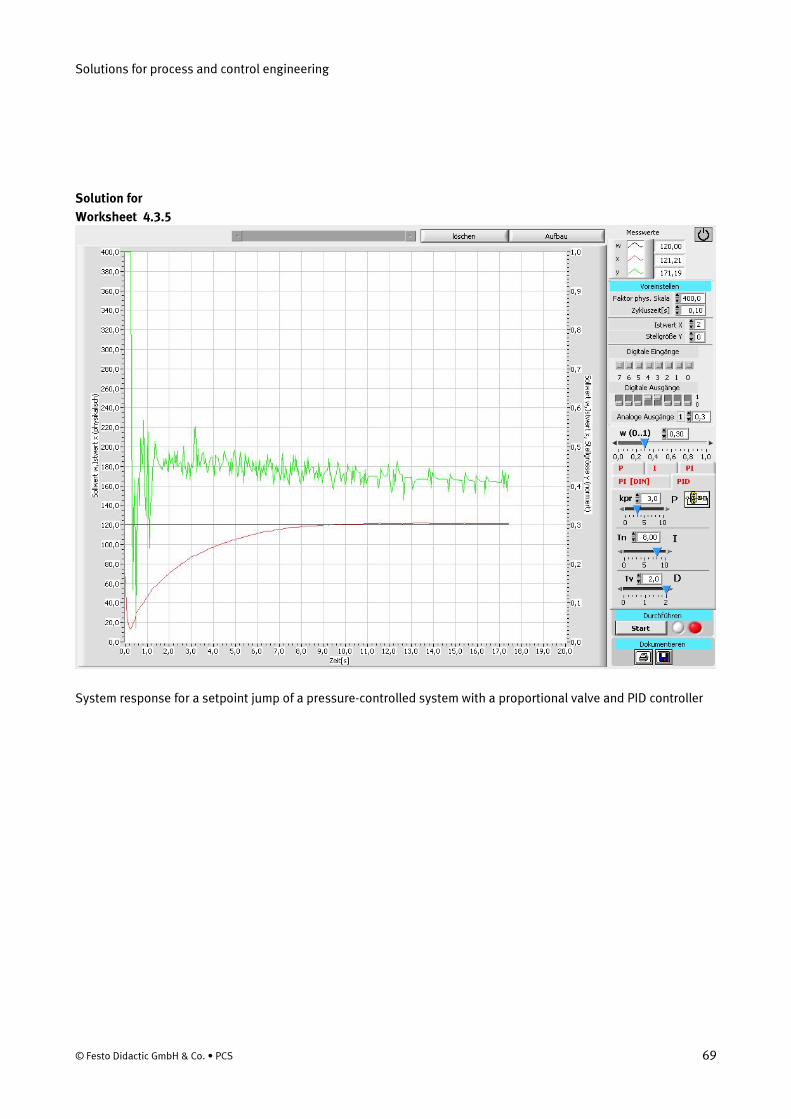
System response for a setpoint jump of a pressure-controlled system with a proportional valve and PID controller
Solution for
Worksheet 4.3.5
Solutions for process and control engineering
70 © ADIRO Automatisierungstechnik GmbH • Process Control System
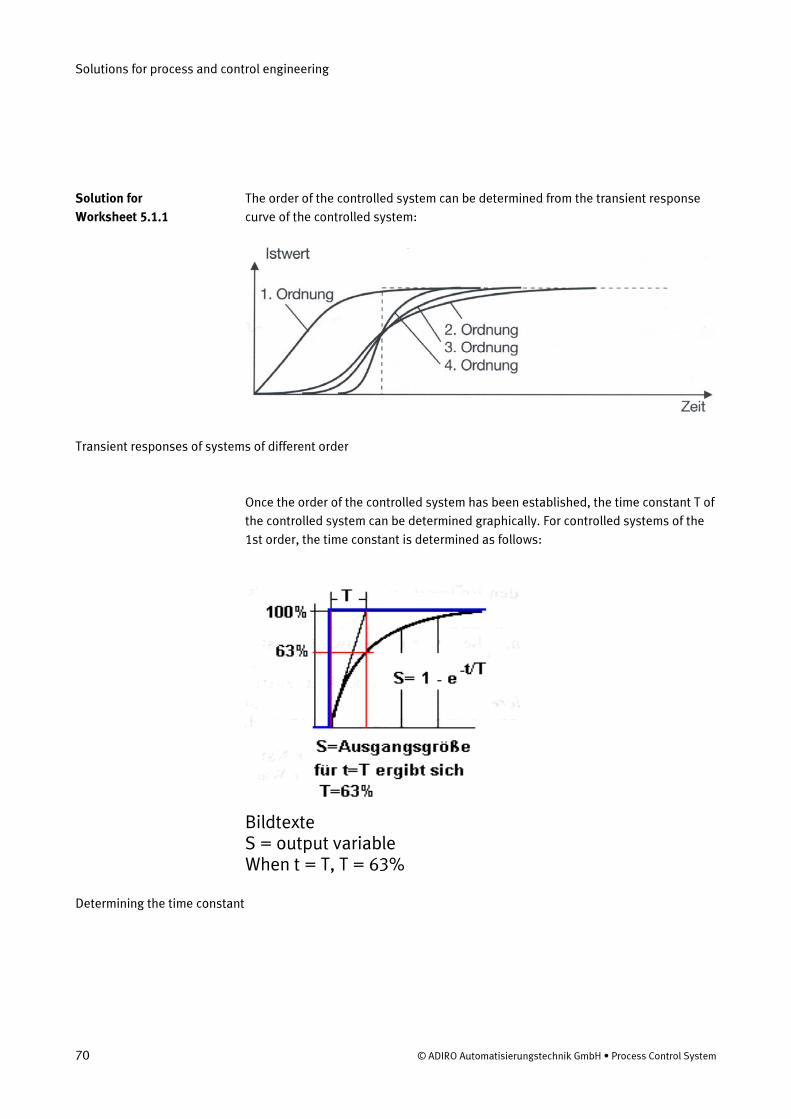
The order of the controlled system can be determined from the transient response
curve of the controlled system:
Transient responses of systems of different order
Once the order of the controlled system has been established, the time constant T of
the controlled system can be determined graphically. For controlled systems of the
1st order, the time constant is determined as follows:
Bildtexte S = output variable When t = T, T = 63%
Determining the time constant
Solution for
Worksheet 5.1.1
Solutions for process and control engineering
© Festo Didactic GmbH & Co. • PCS 71
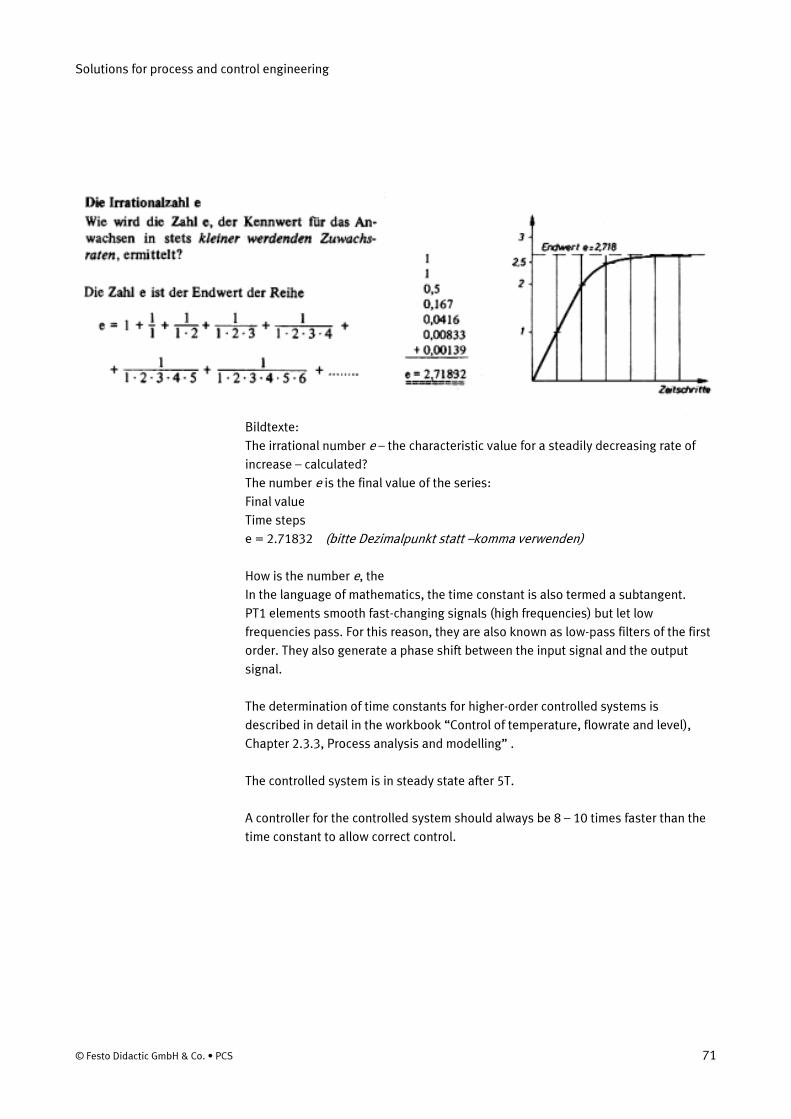
Bildtexte:
The irrational number e – the characteristic value for a steadily decreasing rate of
increase – calculated?
The number e is the final value of the series:
Final value
Time steps
e = 2.71832 (bitte Dezimalpunkt statt –komma verwenden)
How is the number e, the
In the language of mathematics, the time constant is also termed a subtangent.
PT1 elements smooth fast-changing signals (high frequencies) but let low
frequencies pass. For this reason, they are also known as low-pass filters of the first
order. They also generate a phase shift between the input signal and the output
signal.
The determination of time constants for higher-order controlled systems is
described in detail in the workbook “Control of temperature, flowrate and level),
Chapter 2.3.3, Process analysis and modelling” .
The controlled system is in steady state after 5T.
A controller for the controlled system should always be 8 – 10 times faster than the
time constant to allow correct control.
Solutions for process and control engineering
72 © ADIRO Automatisierungstechnik GmbH • Process Control System
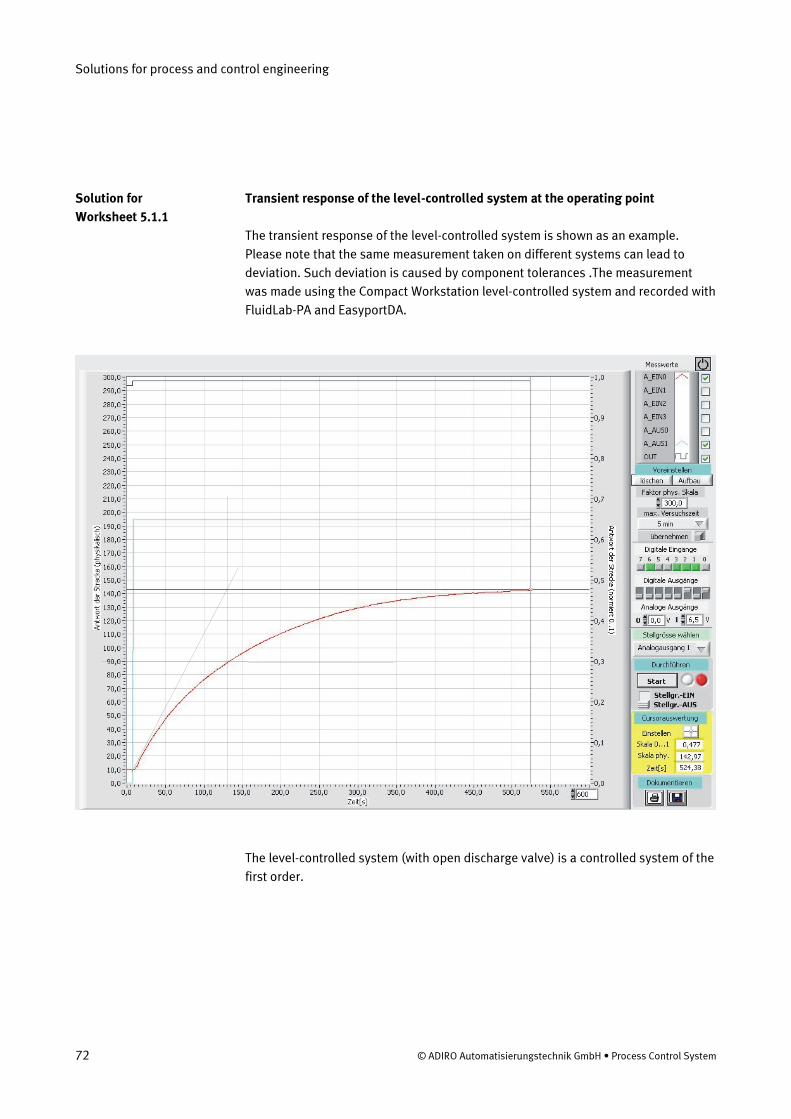
Transient response of the level-controlled system at the operating point
The transient response of the level-controlled system is shown as an example.
Please note that the same measurement taken on different systems can lead to
deviation. Such deviation is caused by component tolerances .The measurement
was made using the Compact Workstation level-controlled system and recorded with
FluidLab-PA and EasyportDA.
The level-controlled system (with open discharge valve) is a controlled system of the
first order.
Solution for
Worksheet 5.1.1

Solutions for process and control engineering
© Festo Didactic GmbH & Co. • PCS 73
Transient response of the flow-controlled system at the operating point
The transient response of the flow-controlled system with a pump as final control
element is shown as an example. Please note that the same measurement taken on
different systems can lead to deviation. Such deviation is caused by component
tolerances. The measurement was made using the Compact Workstation level-
controlled system and recorded with FluidLab-PA and EasyportDA.
The flow-controlled system is a controlled system of the first order.
Solution for
Worksheet5.1.1
Solutions for process and control engineering
74 © ADIRO Automatisierungstechnik GmbH • Process Control System
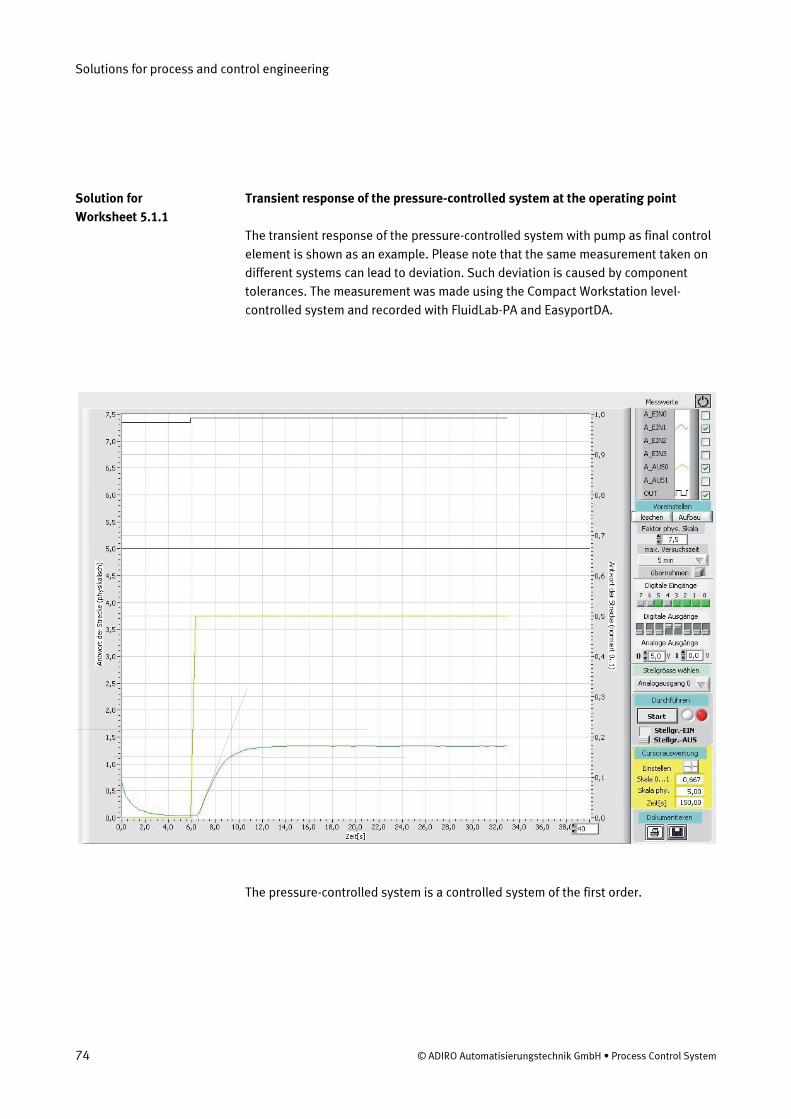
Transient response of the pressure-controlled system at the operating point
The transient response of the pressure-controlled system with pump as final control
element is shown as an example. Please note that the same measurement taken on
different systems can lead to deviation. Such deviation is caused by component
tolerances. The measurement was made using the Compact Workstation level-
controlled system and recorded with FluidLab-PA and EasyportDA.
The pressure-controlled system is a controlled system of the first order.
Solution for
Worksheet 5.1.1
Solutions for process and control engineering
© Festo Didactic GmbH & Co. • PCS 75
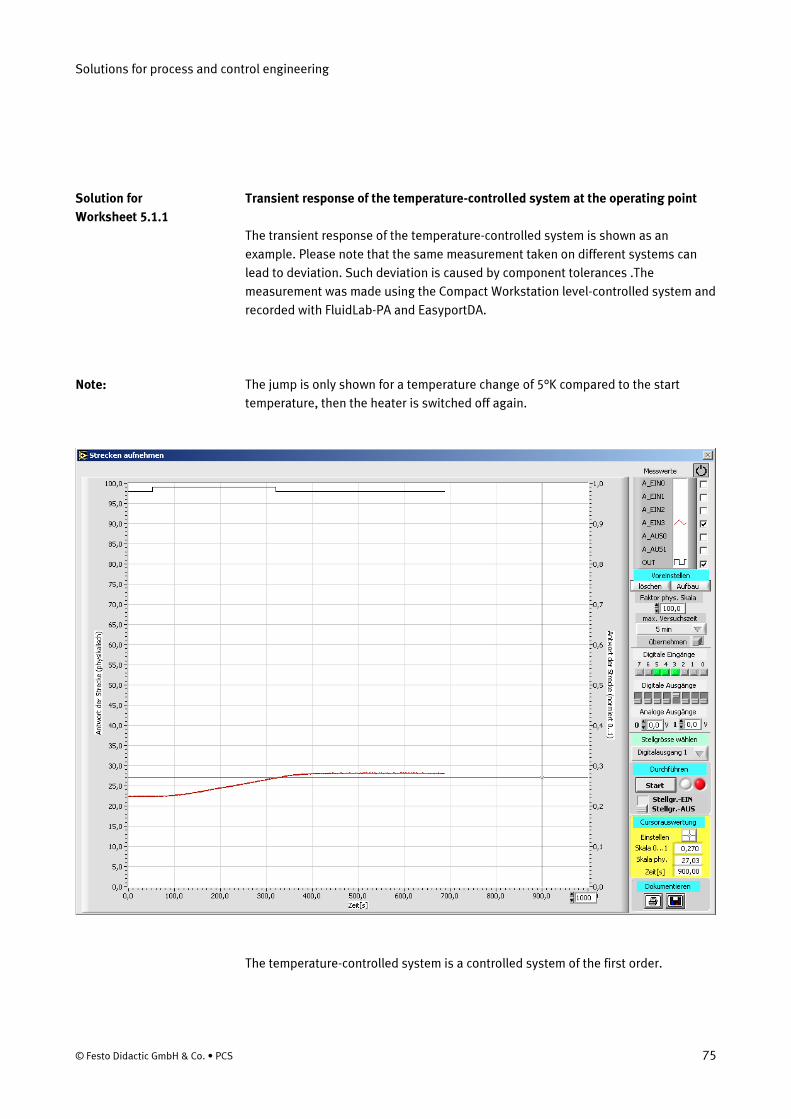
Transient response of the temperature-controlled system at the operating point
The transient response of the temperature-controlled system is shown as an
example. Please note that the same measurement taken on different systems can
lead to deviation. Such deviation is caused by component tolerances .The
measurement was made using the Compact Workstation level-controlled system and
recorded with FluidLab-PA and EasyportDA.
The jump is only shown for a temperature change of 5°K compared to the start
temperature, then the heater is switched off again.
The temperature-controlled system is a controlled system of the first order.
Solution for
Worksheet 5.1.1
Note:
Solutions for process and control engineering
76 © ADIRO Automatisierungstechnik GmbH • Process Control System
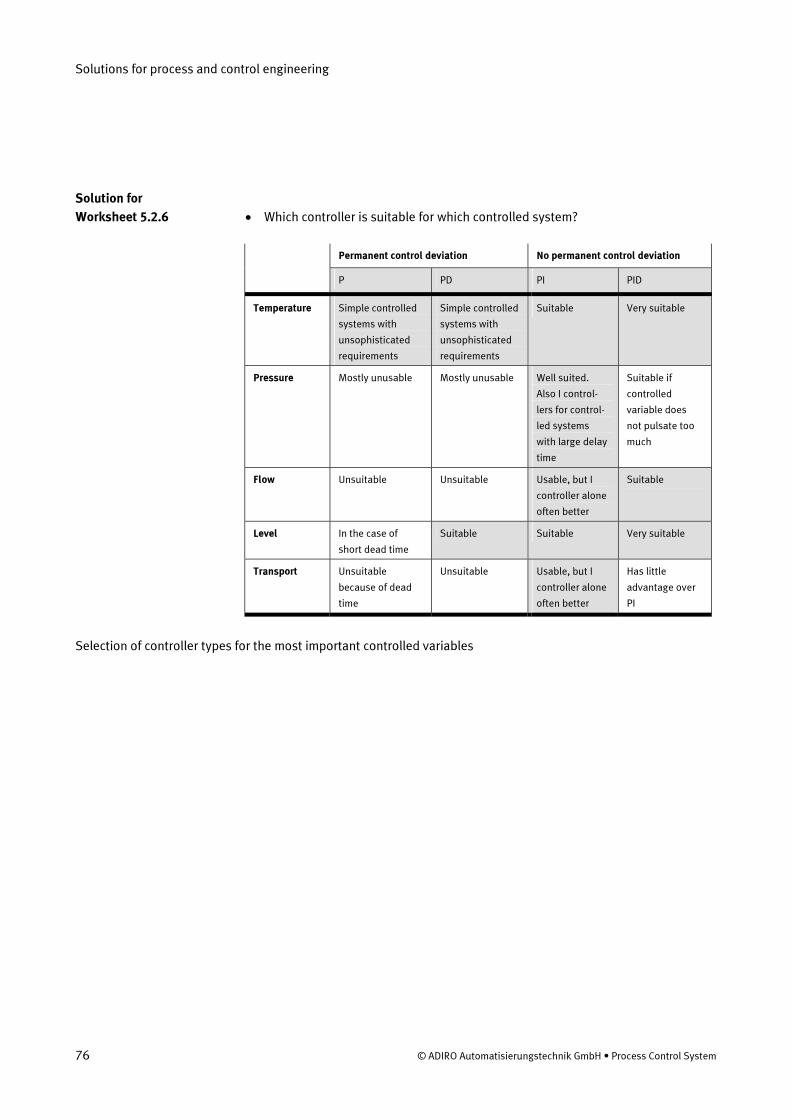
• Which controller is suitable for which controlled system?
Permanent control deviation No permanent control deviation
P PD PI PID
Temperature Simple controlled
systems with
unsophisticated
requirements
Simple controlled
systems with
unsophisticated
requirements
Suitable Very suitable
Pressure Mostly unusable Mostly unusable Well suited.
Also I control-
lers for control-
led systems
with large delay
time
Suitable if
controlled
variable does
not pulsate too
much
Flow Unsuitable Unsuitable Usable, but I
controller alone
often better
Suitable
Level In the case of
short dead time
Suitable Suitable Very suitable
Transport Unsuitable
because of dead
time
Unsuitable Usable, but I
controller alone
often better
Has little
advantage over
PI
Selection of controller types for the most important controlled variables
Solution for
Worksheet 5.2.6
Solutions for process and control engineering
© Festo Didactic GmbH & Co. • PCS 77
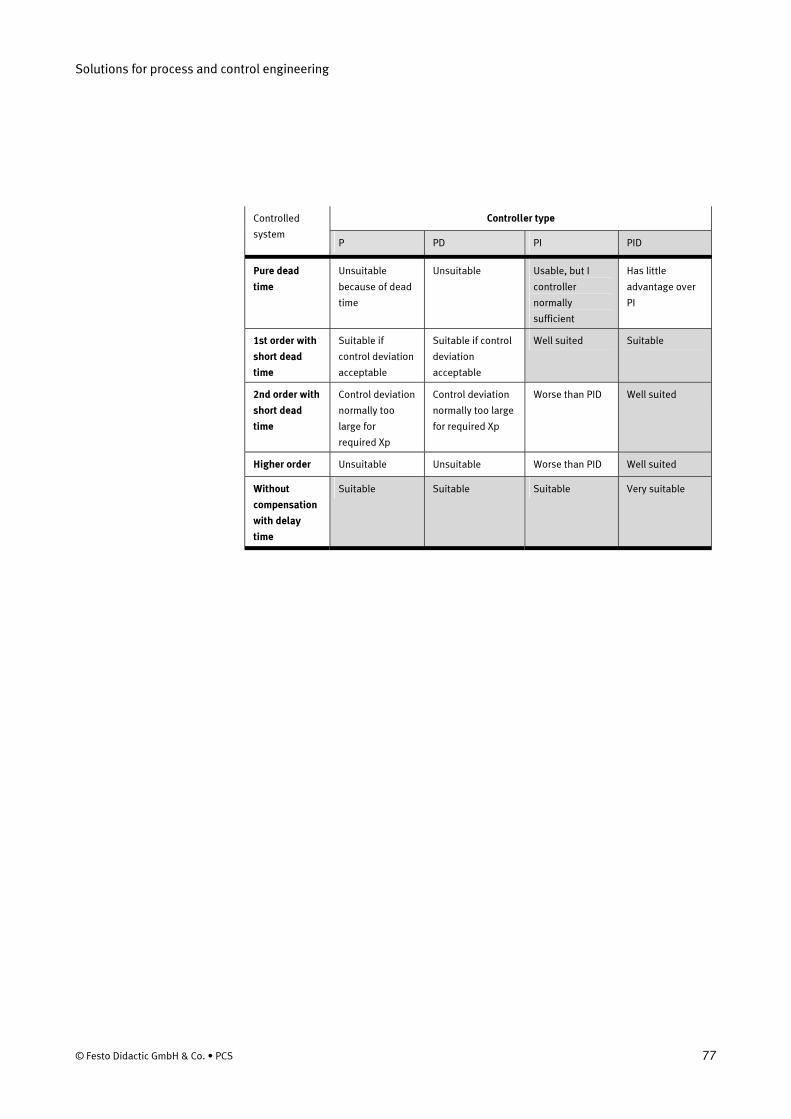
Controller type Controlled
system P PD PI PID
Pure dead
time
Unsuitable
because of dead
time
Unsuitable Usable, but I
controller
normally
sufficient
Has little
advantage over
PI
1st order with
short dead
time
Suitable if
control deviation
acceptable
Suitable if control
deviation
acceptable
Well suited Suitable
2nd order with
short dead
time
Control deviation
normally too
large for
required Xp
Control deviation
normally too large
for required Xp
Worse than PID Well suited
Higher order Unsuitable Unsuitable Worse than PID Well suited
Without
compensation
with delay
time
Suitable Suitable Suitable Very suitable
Solutions for process and control engineering
78 © ADIRO Automatisierungstechnik GmbH • Process Control System
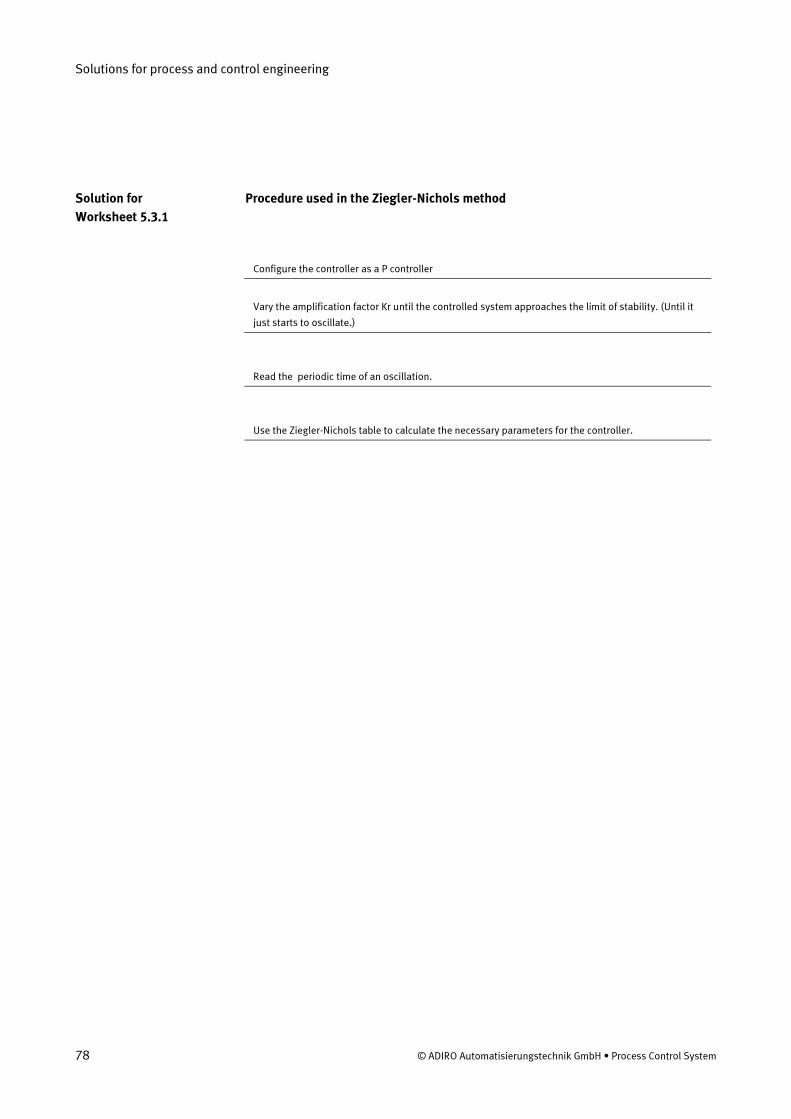
Procedure used in the Ziegler-Nichols method
Configure the controller as a P controller
Vary the amplification factor Kr until the controlled system approaches the limit of stability. (Until it
just starts to oscillate.)
Read the periodic time of an oscillation.
Use the Ziegler-Nichols table to calculate the necessary parameters for the controller.
Solution for
Worksheet 5.3.1


![EMCS [en] Instruction manual](https://img.pdfslide.net/doc/110x75/61bd4bce61276e740b1162d8/emcs-en-instruction-manual.jpg)