Embed Size (px)
Citation preview

Emergency Obstetric Complications; a risk of
maternal health outcomes in India
Author’s Name
Miss. Komal Sureshrao Gajbhiye
Research Scholar
Department of Population Policy & Programmes
International Institute for Population Sciences
Mumbai, India
Abstract: Background: Emergency Obstetric complications (EmOC) become a significant health problem resulting in poor maternal and
neonatal health outcomes. The significant deaths due to direct obstetric complications are convulsions, prolonged labor, excessive
bleeding, massive vaginal bleeding, and very high fever. In this study, we examine the socioeconomic differentials in the
prevalence of EmOC and examine the determinants of the EmOC during pregnancy, at delivery, and post-delivery.
Methods: This study used data from the National Family Household Survey (2014-15) for empirical assessment. The study used
Univariate, bivariate, and multilevel logistic regression analyses were applied to examine the determinants of EmOC and the
association between during pregnancy, at delivery, and post-delivery of mothers aged 15-45yrs.
Results: The result revealed that there is 42.3% mother who experienced prolonged labor. The mother who did a full ANC
experienced fewer pregnancy complications reported 21% (OR: 0.79; 95% CI: 0.70-0.89) than no ANC. The women who assisted
delivery by skilled (doctor/nurse/midwife) reported 43% (OR: 0.57; 95% CI: 0.50-0.66) less likely to experience complications at
delivery than unskilled health providers. The mother who experienced complications during pregnancy reported 1.99 times (OR:
1.99; 95% CI: 1.90-2.07) more likely to experience a high risk of complications at delivery.
Conclusion: Women below 20 years of age have experienced high complications during pregnancy and delivery. Illiterate women
have a high risk of EmOC complications. We should focus more on the protective factors for the pregnancy complications such as
full ANC, PNC, skilled ANC provider, and making our women healthier to enter in pregnancy without anemia and with normal
BMI. We should do more to strengthen the public hospitals to reduced complications and by available and accessible emergency
obstetric care.
Keywords: Emergency Obstetric Complications, pregnancy, delivery, and post-delivery complications, Reproductive health care
utilizations
Background:
Obstetric complications have become a significant health
problem resulting in poor maternal and perinatal outcomes.
The major causes of maternal deaths due to direct obstetric
complications are hemorrhage, sepsis, prolonged and
obstructed labor, hypertensive disorders, and abortion
complications. Globally, about 800 women die every day
due to pregnancy and childbirth-related preventable causes,
where India accounts for 20%, and 44,000 deaths are
estimated annually in the country. MMR of 174 (2015) and
130/lakh live births in (2016) was below the MDG target for
India (Dakhode & Gaidhane, 2020). 19% of global
pregnancy-related deaths occur in India, making it the first
most unsafe country to deliver babies (Banke-Thomas,
Maua, & Madaj, 2020). The Sustainable Development Goal
target is MMR below 70 by 2030. Since the 1990s, WHO,
UNICEF, and UNFPA have recognized that Emergency
Obstetric Care (EmOC) is a cost-effective strategy for
reducing maternal death? India accounts for a fifth of annual
global maternal deaths (56,000), and the Maternal Mortality
Ratio (MMR) is estimated to be 167/100,000 live births
(SRS-2011-13) (Singh, Doyle, & Campbell, 2013). In India,
EmOC services were started under the RCH-II program to
reduce MMR to less than 100 and increase institutional
deliveries to at least 80% by 2010. The implemented
strategy was to enhance the availability of facilities and
increase access to EmOC.
The study revealed that age showed a U-shaped association
with maternal mortality (Horwood & Opondo, 2020). The
analysis shows that the women age groups 35-44 and aged
45 and older were likely to experience obstetric
complications compared to women less than 35 and a higher
risk of deaths (Grotegut & Chisholm, 2014). In contrast, the
analysis shows that as the age increases, the prevalence of
any obstetric health complication decreases a bit (Mousumi,
2015).
The study found that almost all the variables such as age,
education, occupation, parity, type of family, socioeconomic
status (SES) had a significant association with awareness
about ANC, and variables such as education and SES had a
significant association with practices about ANC (Jain &
Upadhyay, 2019). The socioeconomic status and rural
residence were not associated with maternal mortality when
available and accessible health care facilities (Horwood &
Opondo, 2020). The mother not having a health scheme and
belongs to a scheduled caste and scheduled tribe group were
significant factors for maternal death (Horwood & Opondo,
2020). The studies show that variables such as parental
education, child's gender, sibling effects, birth-spacing,
economic characteristics, religion, and caste are essential in
influencing child mortality outcomes (Rommohan, 2013).
According to the maternal education status, the mother who
is highly educated reported fewer health complications than
not educated and medium-class educated mother, While the
household standard of living has also shown a positive
attitude towards reporting health complications as women
belong to higher wealth quintile reported having fewer
obstetric health complications (pregnancy, delivery, and
after delivery) as compared to women that belong to a poor
wealth quintile (Mousumi, 2015). The study explained a
significant association between mothers receiving ANC 4-9
visits had experienced a lower risk of neonatal mortality.
Mothers who received antenatal care visits from the first
trimester experienced minor pregnancy outcomes and
neonatal deaths (Gupta R. , 2003). Qualitative studies
suggested that most women experienced direct benefit from
ANC in various pregnancy complications. Neither urban nor
rural women were sure about the benefits of ANC for their
health or their unborn child in Zimbabwe (Mathole, 2004).
Similarly, ANC was not seen as essential unless there was
physical discomfort during pregnancy and complications in
a previous pregnancy or childbirth (Chaudhari AMR., 2003).
The study found that birth order and interval were
significantly associated with ANC visits (Magadi, Madise,
& Rodrigues, 2000). Results also show that women with less
education, belonging to lower wealth quintiles, were more
vulnerable to health complications because of lack of use of
services or lack of knowledge regarding complications
(Mousumi, 2015). Our results show that national programs
can be implemented in low-income countries without
significant external funding and that they can rapidly
improve the coverage of obstetric services and significantly
reduce the risk of death associated with obstetric
complications (Pierre & Alexandre, 2008). Complications of
pregnancy and medical comorbidities were the most
substantial risk factors for maternal death (Horwood &
Opondo, 2020). The study found that live pregnancies with
the first trimester bleeding and the subchorionic hematoma
was associated with a similar risk of miscarriage and
antepartum hemorrhage while an increased risk of
preeclampsia, fetal growth restrictions, preterm birth, non-
reassuring fetal heart pattern, cesarean delivery, and low
birth weight baby when compared to patients with the first
trimester bleeding without subchorionic hematoma
(Agarwal, Ritu, & Singh, 2020). Women's perceptions of the
risk factors associated with adverse obstetric outcomes were
significantly related to the probability of seeking ANC.
Women who had a prior fetal loss or neonatal death are
more likely to receive ANC (Bhatia & Cleland, 1995). It is
clear from the studies that there is no strong positive
correlation between pregnancy complications and delivery
complications (Mousumi, 2015). During delivery, access to
emergency obstetric care and postnatal care (PNC) are cost-
effective and lifesaving investments for mothers. This is
clear from the study that women face many complications
during their reproductive period, leading to future
complications and maternal mortality. In general, maternal
and reproductive morbidity is an outcome of not just
biological factors but also women's poverty, powerlessness,
and lack of control over resources. The use of maternal
health care services may reduce the probability of
developing many complications during pregnancy, delivery,
and after delivery.
Figure No. 1 shows, 16.5% of the total women reported
experiencing a convulsion, not from fever. When it comes to

delivery complications, 12.7% of the total mothers reported
a breech presentation, 42.3% of the mother’s experienced
prolonged labor, and 33.9% had excessive bleeding. With
regards to the post-delivery complications, it was found that
19.7% of the mothers reported experiencing massive vaginal
bleeding, and 15.2% reported very high fever.
Figure 1: Magnitude of various pregnancy-related
complications among women's age between 15-49 years in
India
Figure 1: Magnitude of various pregnancy-related
complications among women’s age between 15-49 years
in India
Methods:
Data source: The analysis has been done by using the
Individual data of the fourth round of NFHS-4, which was
conducted during 2015-2016 under the stewardship of the
Ministry of Health and Family Welfare (MoHFW),
Government of India, and coordinated by the International
Institute of Population Sciences (IIPS), Mumbai. National
Family Health Survey is a large-scale multi-round survey
conducted in a nationally representative sample of
households. The survey provided national and state-level
data for India on Emergency Obstetric Complications,
reproductive health, maternal and child health, nutrition,
anemia, and family planning services. The NFHS 4 collected
information from the nationally representative sample of
601,509 households from which 699,686 women aged 15-
49- and 1, 12,122 -men aged 15-54 were surveyed (IIPS,
2017). I have worked on a sample of 1 90,898 who were
asked questions about complications during pregnancy,
delivery, and post-delivery of their recent birth. Unit of
analysis - a mother who experienced Emergency Obstetric
Complications at the time of pregnancy, delivery, and post-
delivery.
Statistical analysis:
All analyses of this study were done using STATA-14
software. Frequencies and percentages were used to describe
socioeconomic and demographic characteristics. Bivariate
analysis has been carried out to investigate the relationship
between dependent and independent variables. A Chi-square
test is done for each pair to find out the p-value which is
statistically significant or not. Prevalence showing by Map
at the state level by using Arc-GIs.
A brief description of the study is given below; this section
includes the definition of terms used for the study, variables
used for the study, and various techniques used for analysis.
Bivariate analysis: To see the impact of the independent
variable on the dependent variable (Cross tabulation)
Multivariate analysis: To see the impact of an independent
variable on the dependent variable (Binary Logistic
Regression analysis) Chi-square test: It is a common
bivariate statistic used to test whether the distribution in the
categorical variables is statistically different in two or more
groups. The chi-square test gives the Yes/No answer P-value
less than Level of Significance means there are statistically
significant differences between the two groups.
Variable description:
For Objective 1: Response Variables: Pregnancy
Complication- We have included convulsions from fever as
the complications arising before delivery. Delivery
Complication- We have included Breech Presentation,
Prolonged Labour, and Excessive bleeding as the
complications arising during delivery. Post-Delivery
Complication- We have included very high fever after
delivery and massive vaginal bleeding as the complications
arising after delivery Exposure Variables: Socioeconomic
variables such as Place of residence, age, Wealth index,
religion, caste, and education of mothers were used.
Univariate analysis was carried out to estimate the
magnitude of pregnancy-related complications. In
comparison, bivariate analysis (Chi-Square test) has been
performed to find an association between the responses as
mentioned above variables with the socioeconomic
variables.
For Objective 2: Response Variables: Pregnancy
Complication- We have included convulsions from fever as
the complications arising before delivery. Delivery
Complication- We have included Breech Presentation,
Prolonged Labour, and Excessive bleeding as the
complications arising during delivery. Post-Delivery
Complication- We have included very high fever after
delivery and massive vaginal bleeding as the complications
arising after delivery Exposure variables: Socioeconomic
variables such as age, education, parity, wealth, and
residence. Antenatal care variables include full ANC, ANC
provider, Place of ANC, body mass index, Anaemia. Natal
care variables are a place of delivery, performed C-section
delivery, who assisted delivery. Postnatal care variables are
PNC check-ups after delivery and PNC provider.
Results:
Prevalence of emergency obstetric complications: Indian
states
During pregnancy: States of India
The prevalence of emergency obstetric complications for the
states and UTs of India ranges from (0.41-29.06) percent,
with a wide range of EmOC in various states of India
(Figure No. 2). According to the reporting, the exceptionally
high prevalence of pregnancy complications is in the Uttar
Pradesh state and Bihar and Madhya Pradesh. In contrast,
16
.48
12
.68
42
.32
33
.88
19
.68
15
.21
P R E G N A N C Y - R E L A T E D C O M P L I C A T I O N S

the lowest is in the Dadra & Nagar Haveli, Mizoram,
Andhra Pradesh, Chandigarh, and West Bengal. Other states
have approximately average prevalence, such as Sikkim,
Chhattisgarh, Nagaland, Delhi, Rajasthan, etc.
At the time of delivery: States of India
The level of prevalence of EmOC in the states of India
which are in ranges from during the time of delivery 0.19
percent to 33.56 percent, which has a wide range for the
emergency obstetric complications in various geographically
in states of India (Figure No. 3), from that very high
prevalence states are Pondicherry, Tamil Nadu, Meghalaya
and Goa whereas the lowest prevalence pattern showing in
Mizoram, Daman & Diu, Lakshadweep, Dadar & Nagar
Haveli, Manipur and Kerala which has most of Union
Territories region of India.
During the time of post-delivery: States of India
Prevalence of emergency obstetric complications in India
has less occurred after delivery than pregnancy and delivery
complications (Figure No. 4). The high prevalence is in the
Punjab state and followed by Pondicherry, Chandigarh,
Bihar states of India, whereas the lowest prevalence is in the
states of Mizoram, Lakshadweep, Manipur, Kerala, and
Tripura.
Figure 2: State-wise prevalence of emergency obstetric
complications during the time of pregnancy
Figure 3: State-wise prevalence of emergency obstetric
complications during the time of delivery
Figure 4: State-wise prevalence of emergency obstetric
complications during the time of post-delivery
Presents socio-demographic characteristics of a mother.
The pregnancy complication is the convulsion, not from
fever. So we categories them into any complications and no
complications. At the same time, the delivery complications
are breech presentation, prolonged labor, and excessive
bleeding. So based on the literature, we divided it into life-
threatening complications and non-life-threatening
complications. The life-threatening complications are
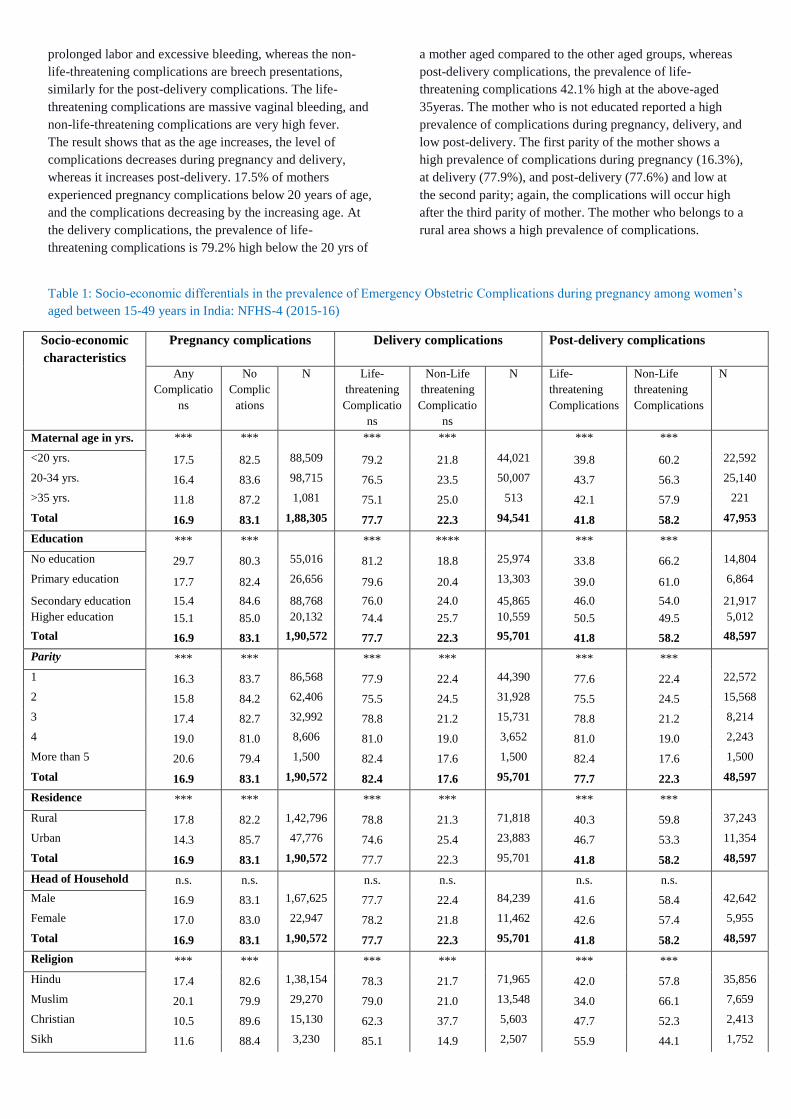
prolonged labor and excessive bleeding, whereas the non-
life-threatening complications are breech presentations,
similarly for the post-delivery complications. The life-
threatening complications are massive vaginal bleeding, and
non-life-threatening complications are very high fever.
The result shows that as the age increases, the level of
complications decreases during pregnancy and delivery,
whereas it increases post-delivery. 17.5% of mothers
experienced pregnancy complications below 20 years of age,
and the complications decreasing by the increasing age. At
the delivery complications, the prevalence of life-
threatening complications is 79.2% high below the 20 yrs of
a mother aged compared to the other aged groups, whereas
post-delivery complications, the prevalence of life-
threatening complications 42.1% high at the above-aged
35yeras. The mother who is not educated reported a high
prevalence of complications during pregnancy, delivery, and
low post-delivery. The first parity of the mother shows a
high prevalence of complications during pregnancy (16.3%),
at delivery (77.9%), and post-delivery (77.6%) and low at
the second parity; again, the complications will occur high
after the third parity of mother. The mother who belongs to a
rural area shows a high prevalence of complications.
Table 1: Socio-economic differentials in the prevalence of Emergency Obstetric Complications during pregnancy among women’s
aged between 15-49 years in India: NFHS-4 (2015-16)
Socio-economic
characteristics
Pregnancy complications Delivery complications Post-delivery complications
Any
Complicatio
ns
No
Complic
ations
N Life-
threatening
Complicatio
ns
Non-Life
threatening
Complicatio
ns
N Life-
threatening
Complications
Non-Life
threatening
Complications
N
Maternal age in yrs. *** *** *** *** *** ***
<20 yrs. 17.5 82.5 88,509 79.2 21.8 44,021 39.8 60.2 22,592
20-34 yrs. 16.4 83.6 98,715 76.5 23.5 50,007 43.7 56.3 25,140
>35 yrs. 11.8 87.2 1,081 75.1 25.0 513 42.1 57.9 221
Total 16.9 83.1 1,88,305 77.7 22.3 94,541 41.8 58.2 47,953
Education *** *** *** **** *** ***
No education 29.7 80.3 55,016 81.2 18.8 25,974 33.8 66.2 14,804
Primary education 17.7 82.4 26,656 79.6 20.4 13,303 39.0 61.0 6,864
Secondary education 15.4 84.6 88,768 76.0 24.0 45,865 46.0 54.0 21,917
Higher education 15.1 85.0 20,132 74.4 25.7 10,559 50.5 49.5 5,012
Total 16.9 83.1 1,90,572 77.7 22.3 95,701 41.8 58.2 48,597
Parity *** *** *** *** *** ***
1 16.3 83.7 86,568 77.9 22.4 44,390 77.6 22.4 22,572
2 15.8 84.2 62,406 75.5 24.5 31,928 75.5 24.5 15,568
3 17.4 82.7 32,992 78.8 21.2 15,731 78.8 21.2 8,214
4 19.0 81.0 8,606 81.0 19.0 3,652 81.0 19.0 2,243
More than 5 20.6 79.4 1,500 82.4 17.6 1,500 82.4 17.6 1,500
Total 16.9 83.1 1,90,572 82.4 17.6 95,701 77.7 22.3 48,597
Residence *** *** *** *** *** ***
Rural 17.8 82.2 1,42,796 78.8 21.3 71,818 40.3 59.8 37,243
Urban 14.3 85.7 47,776 74.6 25.4 23,883 46.7 53.3 11,354
Total 16.9 83.1 1,90,572 77.7 22.3 95,701 41.8 58.2 48,597
Head of Household n.s. n.s. n.s. n.s. n.s. n.s.
Male 16.9 83.1 1,67,625 77.7 22.4 84,239 41.6 58.4 42,642
Female 17.0 83.0 22,947 78.2 21.8 11,462 42.6 57.4 5,955
Total 16.9 83.1 1,90,572 77.7 22.3 95,701 41.8 58.2 48,597
Religion *** *** *** *** *** ***
Hindu 17.4 82.6 1,38,154 78.3 21.7 71,965 42.0 57.8 35,856
Muslim 20.1 79.9 29,270 79.0 21.0 13,548 34.0 66.1 7,659
Christian 10.5 89.6 15,130 62.3 37.7 5,603 47.7 52.3 2,413
Sikh 11.6 88.4 3,230 85.1 14.9 2,507 55.9 44.1 1,752

Buddhist 8.0 92.0 2,089 80.4 19.6 950 50.1 49.9 411
other 10.6 89.4 2,699 82.4 17.6 1,128 47.0 53.0 506
Total 16.9 83.1 1,90,572 77.7 22.3 95,701 41.8 58.2 48,597
Caste *** *** *** *** *** ***
SC 18.3 81.7 35,126 77.7 22.3 19,236 42.2 57.8 10,062
ST 13.5 86.5 37,753 75.4 24.6 16,505 42.0 58.1 7,872
OBC 18.9 81.1 73,979 77.3 22.7 38,455 40.1 59.9 19,565
other 15.9 84.1 167 82.3 17.7 18,269 41.1 59.0 9,428
Total 17.1 82.9 1,82,693 78.2 21.9 92,465 41.3 58.7 46,927
Wealth Index *** *** *** *** *** ***
Low 19.2 80.8 90,323 81.1 18.9 43,988 36.1 63.9 23,758
Middle 15.7 84.3 38,331 74.3 25.7 19,530 44.4 55.6 9,351
High 14.4 85.6 61,918 75.2 24.8 32,183 48.9 51.1 15,488
Total 16.9 83.1 1,90,572 77.7 22.3 95,701 41.8 58.2 48,597
Determinants of Emergency Obstetric Complications
during pregnancy, at delivery, and post-delivery:
Table 2 shows logistic regression models that were used to
examine the determinants of EmOC during pregnancy.
Model 1 showed the association of EmOC and community-
level characteristics. Model 2 examines the determinants of
EmOC during pregnancy from Individual-level
characteristics and complications. Model 3 showed the
determinants of EmOC between reproductive and child
health service and complications during pregnancy.
In Model 1, community-level characteristics were
considered; in Model 2, individual-level characteristics were
added; in Model 3, RCH services were added; In Model 4,
two sets of variables are considered, and in Model 5, three
sets of variables are considered. The results indicated a
statistically significant association between community-level
characteristics and pregnancy complications. The results
revealed that the mother belongs to an urban region reported
18% (OR: 0.82; 95% CI: 0.79-0.85) less likely to experience
pregnancy complications than rural region mothers. The
mother who has high wealth reported 25% (OR: 0.75; 95%
CI: 0.73-0.78) less likely to experience pregnancy
complications than low wealth.
In Model 2, individual-level characteristics were included.
In this model, the mother's age is above 35 years reported
38% (OR: 0.62; 95% CI: 0.50-0.77) less likely to experience
pregnancy complications. As the level of education
increases, the level of complications decreases. The BMI of
the mother is the average reported 7% (OR: 0.93; 95%
C.I.:0.90-0.96) less likely to experience complications than
underweight mother. In Model 3, RCH services were
included. This model found that the mother who did a full
ANC reported 33% (OR: 0.67; 95% CI: 0.61-0.73) less
likely to experience pregnancy complications than no ANC.
The mother went to the private health facility for antenatal
check-up reported 1.10 times (OR: 1.10; 95% CI: 1.03-1.19)
more likely to experience than a public health facility. The
antenatal check-up from a skilled provider reported 1.26
times (OR: 1.26; 95% C.I.:1.17-1.35) more likely to
experience pregnancy complications than the unskilled
providers. In model 4, Individual characteristics and RCH
services were considered. It was found that maternal age,
education, BMI, ANC services, Place of ANC, and type of
ANC provider are the same as those in Model 2 and Model
3. In Model 5, community-level characteristics, individual-
level characteristics s, and RCH services were considered. It
was found that the religion, caste, residence, wealth index,
maternal age, education, BMI, ANC services, Place of ANC,
and type of ANC provider are the same significance as those
in Model 1, Model 2, and Model 3.
Results of multivariate logistic regression were applied
to understand the adjusted effect of all selected variables
at the time of delivery complications. In Table 3, in Model
1, community-level characteristics were included. It was
found that religion, caste, residence e, and wealth index are
all variables that are statistically significant determinants.
Moreover, the wealth index with middle and high were 1.37
and 1.40 times, respectively, more likely to experience
delivery complications than the low wealth index. In Model
2, individual characteristics were included. It is found that
all variables are statistically significant determinants of
delivery complications. Moreover, the mother education
with primary, secondary, and higher education was reported
1.11, 1.32, and 1.18 times respectively, more likely to
experience delivery complications. The mother with normal
and obese BMI reported 1.10 and 1.16 times more likely to
experience delivery complications than underweight. In
Model 3, RCH services were included. The mother delivered
at the private hospital reported 16% (OR: 0.84; 95% CI:
0.72-0.86) less likely to experience delivery complications
than a public health facility. The mother who had C-section
delivery reported 13% less likely to experience delivery
complications than normal delivery. In Model 4, individual
characteristics and RCH services were considered. The only
Place of delivery, type of delivery, and type of assisted
delivery were statistically significant as those same in Model
2 and 3. In model 5, community characteristics, individual
characteristics, and RCH services were considered. It was
found that religion, caste, Place of delivery, type of delivery,

and type of assisted delivery were statistically significant as
those same in Model 1, Model 2, and Model 3.
Results of multivariate logistic regression were applied
to understand the adjusted effect of all selected variables
at post-delivery complications. In Table 4, Model 1,
community-level characteristics were adjusted. It is found
that all the factors statistically significant determinants of
postnatal complications. The Sikh religion reported 3.05
times (OR: 3.05; 95% CI: 2.77-3.36) more likely to
experience postnatal complications among others religion.
As the wealth index increases, fewer complications are
experienced during the postnatal period. In Model 2,
maternal education found that as the level of education
increases, the complications decrease. The mother who’s
primary, secondary, and higher educated reported 10%,
20%, and 25% less likely to experience postnatal
complications than not educated mothers. The mother whose
BMI is obese and not anaemic shows less experienced
complication in the postnatal period. In Model 3, it is found
that the mother who delivered at a private hospital reported
26% (OR: 0.74; 95% C.I.:0.69-0.79) less likely to
experience postnatal complications than public hospitals.
The mother who performed C-section delivery reported 1.30
times (OR: 1.30; 95% CI: 1.21-1.40) more likely to
experience postnatal complications than normal delivery.
The mother who check-up within two days after delivery
reported 10% less likely to experience postnatal
complications than no PNC after delivery. In Model 4,
individual characteristics and RCH services were
considered. The factors are all statistically significant same
as in Models l 2 & 3. In Model 5, Model 1, 2 & 3 were
considered. It was found that religion, residence, wealth
index, education, Place of delivery, type of delivery, type of
assisted delivery, PNC services, and type of PNC provider
were statistically significant as those same in Model 1,
Model 2, and Model 3.
Table 2: Results of Multilevel logistic regression showing the likelihood of determinates of emergency obstetric
complication during pregnancy. Results from Logistic Regression Analysis, 2015-16 India.

Background Variables Model 1 Model 2 Model 3 Model 4 Model 5
OR 95% CI OR 95% CI OR 95% CI OR 95% CI OR 95% CI
Community-level Characteristics
Religion
Hindu® 1.40*** (1.35 1.45) - - - - - - 1.46*** (1.29 1.64)
Muslim 0.69*** (0.65 0.73) - - - - - - 0.60*** (0.49 0.72)
Christian 0.73*** (0.65 0.81) - - - - - - 0.89 (0.68 1.17)
Sikh 0.48*** (0.41 0.56) - - - - - - 0.64 (0.42 0.98)
Buddhist 0.64*** (0.57 0.73) - - - - - - 0.50*** (0.31 0.81)
Other 1.40*** (1.35 1.45) - - - - - - 1.46*** (1.29 1.64)
Caste
Schedule caste®
Schedule tribe 0.77*** (0.73 0.80) - - - - - - 0.78*** (0.68 0.91)
OBC 1.01 (0.97 1.04) - - - - - - 1.00 (0.89 1.12)
don't know 0.86*** (0.82 0.89) - - - - - - 0.89* (0.78 1.02)
Residence
Rural®
Urban 0.82 *** (0.79 0.85) - - - - - - 0.89** (0.81 0.98)
Wealth Index
Low ®
Middle 0.80*** (0.78 0.83) - - - - - - 0.87** (0.77 0.98)
High 0.75*** (0.73 0.78) - - - - - - 0.90* (0.80 1.02)
Individual-level characteristics
Maternal Age in years
<20 yrs. ®
20-34 yrs. - - 0.96*** (0.93 0.99) - - 0.96 (0.88 1.05) 0.99 (0.91 1.08)
>35 yrs. - - 0.62*** (0.50 0.77) - - 0.59** (0.37 0.96) 0.68* (0.42 1.11)
Maternal Education
No education®
Primary education - - 0.89*** (0.93 0.83) - - 0.86** (0.74 1.00) 0.92** (0.79 1.08)
Secondary education - - 0.80*** (0.77 0.83) - - 0.77*** (0.69 0.87) 0.86* (0.76 0.98)
Higher education - - 0.81*** (0.77 0.86) - - 0.85** (0.73 0.99) 0.98** (0.83 1.16)
Maternal parity
1®
2 - - 0.93*** (0.90 0.97) - - 0.98 (0.90 1.08) 0.97 (0.88 1.06)
3 - - 1.00 (0.96 1.04) - - 1.01 (0.89 1.14) 1.02 (0.90 1.16)
4 - - 1.06** (1.00 1.11) - - 0.98 (0.82 1.18) 0.98 (0.81 1.19)
5 and more - - 1.14*** (1.08 1.20) - - 0.91 (0.73 1.13) 0.95 (0.75 1.19)
Body Mass Index
Underweight®
Normal - - 0.93*** (0.90 0.96) - - 0.87*** (0.79 0.97) 0.90** (0.81 1.00)
Obese - - 0.88*** (0.84 0.92) - - 0.91 (0.80 1.03) 0.95 (0.83 1.08)
Anaemia
Severe®
Moderate - - 1.01 (0.91 1.12) - - 0.93 (0.68 1.29) 0.92 (0.66 1.27)
Mild - - 0.86 (0.78 0.95) - - 0.86 (0.63 1.19) 0.85 (0.61 1.18)
Not anemic - - 0.84 (0.75 0.93) - - 0.78 (0.57 1.08) 0.79 (0.57 1.10)

Reproductive and child health services
ANC services
No ANC®
Full ANC - - - - 0.67*** (0.61 0.73) 0.76*** (0.67 0.85) 0.79*** (0.70 0.89)
Place of ANC
Public health facility®
Private health facility - - - - 1.10*** (1.03 1.19) 1.15*** (1.05 1.25) 1.08** (0.99 1.19)
Other - - - - 1.52* (0.95 2.42) 1.74** (1.03 2.93) 1.57 (0.93 2.66)
Type of ANC provider
Unskilled®
Skilled - - - - 1.26*** (1.17 1.35) 1.23*** (1.13 1.33) 1.23*** (1.13 1.34)
Other - - - - 4.92*** (2.58 9.39) 4.94*** (2.41 10.12) 5.42*** (2.60 11.30)
Table 3: Results of Multilevel logistic regression showing the likelihood of determinates of emergency obstetric complication at the time of delivery. Results from Logistic
Regression Analysis, 2015-16 India.
Background Variables Model 1 Model 2 Model 3 Model 4 Model 5
OR 95% CI OR 95% CI OR 95% CI OR 95% CI OR 95% CI
Community-level characteristics
Religion
Hindu®
Muslim 0.93*** (0.87 0.99) - - - - - - 0.97 (0.84 1.12)
Christian 1.30*** (1.20 1.40) - - - - - - 1.36*** (1.14 1.63)
Sikh 1.30*** (1.14 1.47) - - - - - - 1.17 (0.92 1.51)
Buddhist 0.86 (0.71 1.04) - - - - - - 0.58** (0.37 0.91)
other 0.77*** (0.64 0.93) - - - - - - 0.69 (0.42 1.13)
Caste
Schedule caste®
Schedule tribe 0.88*** (0.82 0.94) - - - - - - 0.60*** (0.51 0.70)
OBC 0.91*** (0.86 0.95) - - - - - - 0.97 (0.86 1.09)
don't know 0.72*** (0.68 0.77) - - - - - - 0.63 (0.55 0.73)
Residence
Rural®
Urban 0.94** (0.90 0.99) - - - - - - 0.94 (0.85 1.04)
Wealth Index
Low ®
Middle 1.37*** (1.30 1.44) - - - - - - 1.05 (0.92 1.19)
High 1.40*** (1.34 1.48) - - - - - - 1.02 (0.89 1.16)
Individual-level characteristics
Maternal Age in years
<20 yrs. ®
20-34 yrs. - - 1.08*** (1.03 1.13) - - 0.95 (0.87 1.04) 0.96 (0.87 1.05)
>35 yrs. - - 0.93 (0.69 1.24) - - 0.64 (0.37 1.11) 0.69 (0.40 1.18)

Maternal Education
No education®
Primary education - - 1.11*** (1.03 1.20) - - 0.95 (0.80 1.12) 0.93 (0.78 1.10)
Secondary education - - 1.32*** (1.24 1.39) - - 1.06 (0.93 1.20) 1.03 (0.90 1.18)
Higher education - - 1.18*** (1.09 1.28) - - 0.88 (0.74 1.04) 0.87 (0.72 1.05)
Maternal parity
1®
2 - - 1.02 (0.97 1.07) - - 1.08 (0.98 1.19) 1.06 (0.96 1.17)
3 - - 0.85*** (0.80 0.91) - - 1.01 (0.88 1.15) 0.98 (0.86 1.13)
4 - - 0.74*** (0.67 0.81) - - 0.83* (0.67 1.03) 0.80** (0.65 1.00)
5 and more - - 0.67*** (0.60 0.74) - - 0.92 (0.72 1.17) 0.93 (0.72 1.19)
Body Mass Index
Underweight®
Normal - - 1.10*** (1.05 1.16) - - 1.05 (0.94 1.17) 1.05 (0.94 1.18)
Obese - - 1.16*** (1.08 1.25) - - 0.96 (0.83 1.11) 0.97 (0.83 1.12)
Anaemia
Severe®
Moderate - - 1.27*** (1.06 1.53) - - 1.2 (0.82 1.76) 1.25 (0.84 1.85)
Mild - - 1.24** (1.03 1.49) - - 1.2 (0.82 1.75) 1.24 (0.83 1.83)
Not anemic - - 1.1 (0.92 1.32) - - 0.98 (0.67 1.44) 1.02 (0.69 1.51)
Reproductive and child health services
ANC services
No ANC®
Full ANC - - - - 0.95 (0.86 1.05) 0.94 (0.84 1.06) 0.97 (0.86 1.10)
Place of delivery
Public health facility®
Private health facility 0.79*** (0.72 0.86) 0.82*** (0.74 0.91) 0.79*** (0.71 0.88)
Other - - - - 0.84** (0.71 0.99) 0.82** (0.68 0.99) 0.88 (0.73 1.06)
Type of delivery - - - -
Normal®
Caesarean - - - - 0.87*** (0.79 0.95) 0.88** (0.79 0.99) 0.88** (0.79 0.98)
Type of assisted at delivery
Unskilled®
Skilled - - - - 0.59*** (0.52 0.67) 0.57*** (0.50 0.66) 0.57*** (0.50 0.66)
Other - - - - 0.54*** (0.35 0.81) 0.54** (0.33 0.87) 0.55** (0.34 0.89)

Table 4: Results of Multilevel logistic regression showing the likelihood of determinates of emergency obstetric complication at post-delivery. Results from Logistic Regression
Analysis, 2015-16 India.
Background Variables Model 1 Model 2 Model 3 Model 4 Model 5
OR 95% CI OR 95% CI OR 95% CI OR 95% CI OR 95% CI
Community-level characteristics
Religion
Hindu®
Muslim 1.16*** (1.10 1.22) - - - - - - 1.05 (0.95 1.17)
Christian 0.51*** (0.46 0.56) - - - - - - 0.45*** (0.36 0.55)
Sikh 3.05*** (2.77 3.36) - - - - - - 2.82*** (2.44 3.26)
Buddhist 0.69*** (0.56 0.84) - - - - - - 0.8 (0.56 1.14)
other 0.57*** (0.47 0.69) - - - - - - 0.70* (0.49 1.00)
Caste
Schedule caste®
Schedule tribe 0.87*** (0.82 0.93) - - - - - - 0.83*** (0.74 0.92)
OBC 0.96* (0.92 1.01) - - - - - - 0.96 (0.88 1.04)
don't know 0.89*** (0.84 0.95) - - - - - - 0.94 (0.85 1.04)
Residence
Rural®
Urban 0.85*** (0.81 0.90) - - - - - - 0.89*** (0.82 0.97)
Wealth Index
Low ®
Middle 0.83*** (0.79 0.87) - - - - - - 0.90** (0.83 0.99)
High 0.79*** (0.76 0.83) - - - - - - 0.87*** (0.79 0.96)
Individual-level characteristics
Maternal Age in years
<20 yrs. ®
20-34 yrs. - - 0.99 (0.95 1.03) - - 0.95* (0.89 1.01) 0.94* (0.88 1.00)
>35 yrs. - - 0.78* (0.58 1.05) - - 0.84 (0.54 1.32) 0.88 (0.55 1.40)
Maternal Education
No education®
Primary education - - 0.90*** (0.85 0.96) - - 0.91** (0.82 1.00) 0.93 (0.98 1.14)
Secondary education - - 0.80*** (0.76 0.84) - - 0.81*** (0.74 0.87) 0.86*** (0.79 0.94)
Higher education - - 0.75*** (0.69 0.81) - - 0.79*** (0.70 0.90) 0.89* (0.78 1.02)
Maternal parity
1®
2 - - 0.99 (0.95 1.04) - - 1.07* (1.00 1.16) 1.05 (0.98 1.14)
3 - - 0.97 (0.91 1.03) - - 1 (0.91 1.10) 1 (0.90 1.10)
4 - - 0.95 (0.88 1.03) - - 1.01 (0.89 1.15) 1.01 (0.89 1.15)
5 and more - - 0.90*** (0.83 0.97) - - 0.87* (0.76 1.00) 0.89 (0.77 1.03)
Body Mass Index
Underweight®
Normal - - 0.99 (0.94 1.04) - - 1.08* (1.00 1.16) 1.08** (1.00 1.17)
Obese - - 0.91*** (0.85 0.97) - - 0.91* (0.82 1.01) 0.92 (0.83 1.03)
Anaemia
Severe®

Moderate - - 1 (0.86 1.16) - - 1.11 (0.87 1.42) 1.13 (0.87 1.45)
Mild - - 0.91 (0.78 1.05) - - 1.04 (0.81 1.33) 1.06 (0.82 1.36)
Not anemic - - 0.88* (0.76 1.02) - - 1.07 (0.83 1.36) 1.11 (0.86 1.43)
Reproductive and child health services
Place of delivery
Public health facility®
Private health facility - - - - 0.74*** (0.69 0.79) 0.80*** (0.74 0.87) 0.80*** (0.73 0.87)
Other - - - - 0.90** (0.82 1.00) 0.88** (0.79 0.98) 0.92 (0.82 1.03)
Type of delivery
Normal®
C-section - - - - 1.30*** (1.21 1.40) 1.38*** (1.27 1.50) 1.38*** (1.27 1.51)
Type of assisted delivery
Unskilled®
Skilled - - - - 1.06 (0.98 1.15) 1.06 (0.98 1.16) 1.08** (0.99 1.18)
Other - - - - 0.99 (0.81 1.22) 1.02 (0.81 1.27) 1.02 (0.81 1.29)
PNC services - - - -
No check-up®
Within 2 days 0.90** (0.84 0.98) 0.91** (0.83 0.99) 0.88*** (0.80 0.96)
Type of PNC provider
Unskilled®
Skilled - - - - 0.99 (0.92 1.07) 0.98 (0.90 1.06) 0.95 (0.87 1.03)
Other - - - - 0.81 (0.51 1.30) 0.79 (0.47 1.32) 0.77 (0.46 1.29)

Association between pregnancy complications, delivery
complications, and post-delivery complications
Results show that if the mother who has experienced
complications during pregnancy reported 99% (OR 1.99, CI
1.90-2.07) more likely to experience a high risk of
complications at the time of delivery. That mother who has
complications at the time of delivery reported 3.92 times
(OR 3.92, 95% CI 3.78-4.06) more likely to experience a
high risk of complications occurring after delivery. The
mother who has complications during pregnancy reported
4.28 times (OR 4.28, 95% CI 4.08-4.48) more likely to
experience a high risk of complications after the delivery.
Based on the results of all the complications are statistically
highly significant to each other.
Table 5: Association between Pregnancy complications, delivery complications, and post-delivery complications
Association between pregnancy complication and delivery complications
OR 95% C. I.
Pregnancy complications Delivery Complications
No®
Yes 1.99*** (1.90 2.07)
Association between pregnancy complication and post-delivery complications
Pregnancy complications Post-delivery complications
No®
Yes 3.92*** (3.78 4.06)
Association between delivery complications and post-delivery complications
Delivery Complications Post-delivery complications
No®
Yes 4.28*** (4.08 4.48)
Discussion:
This study analysed the prevalence of emergency obstetric
complications in India and its determinants during
pregnancy, delivery, and post-delivery. The socioeconomic
variables like maternal age, education, parity, residence,
religion, and caste are important in influencing maternal
mortality and morbidity health outcomes. In this study, the
age group of mothers below 20 years and 20-34 years
experienced a high risk of complications than the 35-45
years of age group. In contrast, the study analysed that the
mother's age groups 35-45 yrs. Furthermore, older
experienced obstetric complications compared to the less
than 35 and a higher risk of death (Grotegut et al., 2014). As
the level of education increases, the complication level is
decreasing.
Similarly, the findings of (Mousumi G et al., 2015). The first
parity of the mother experiencing high risk of complications
than the second parity bit as the parity increases means four
and more than four the level of complications is also
increases during pregnancy, at delivery, and post-delivery.
The sex of the household is not significant for emergency
obstetric complications. Muslim religion reported high
prevalence of complications than the other religion, whereas
the Sikh reported high risk of complications at post-delivery,
and Buddhists show a low risk of complications. In our
findings, the scheduled tribes reported less risk of
complication, but in contrast, the literature shows that
scheduled caste or scheduled tribe groups were significant
risk factors for maternal deaths (Horwood G et ., Al., 2020).
The mother who are poor shows a high prevalence of
emergency obstetric complications than the rich mother.
Similarly, the findings from the literature standard of living
have also shown a positive attitude towards reporting health
complications as women belong to higher wealth quintile
reported having fewer obstetric health complications
(pregnancy, delivery, and after delivery) as compared to
women that belong to a poor wealth quintile (Mousumi, G.,
2015).
The various factors are affected to the emergency obstetric
complications such as Antenatal care visits or not, natal care
and postnatal care; the Place of delivery, who assisted the
delivery, is the factors that play a main role in the
pregnancy, delivery, and post-delivery complications. The
mother who had done the full antenatal and postnatal care
reported fewer complications, and similarly, the finding
shows form (Rishabh G et al. 2017). The skilled attendance
during delivery and post-delivery are highly statistically
significant, and the literature is also said that skilled
attendance during delivery, access to emergency obstetric
care, and postnatal care (PNC) are cost-effective lifesaving
investments for mothers. In our results, the pregnancy
complications are highly associated with the delivery and
post-delivery complication, but in contrast, the literature
shows no strong positive correlation between pregnancy
complications and delivery complications (Mousumi G et
al., 2015).
Conclusion:
There is a need to focus more on the protective factors for
the pregnancy complications such as full ANC, PNC, skilled
ANC provider, and making our women healthier to enter

pregnancy without anemia and with normal BMI. Public
hospitals should be strengthened by enabling easy
availability and accessibility of emergency obstetric care to
reduced complications.
Policy Implications:
Based on the findings of this study, some policy
implications which help to reduce adverse maternal and
neonatal health outcomes are as follows:
1. The states like Uttar Pradesh, Bihar, and Madhya
Pradesh reported a high prevalence of pregnancy
complications compared to the national level
(India), and the rate of consumption of Iron folic
tablets is also low in that states. In such states, the
government should form policies and implement
awareness about antennal care services.
2. To more strengthen the equipment for the
emergency obstetric care on the sub-canter,
primary center, community level, and district level
hospitals. To more strengthen the referral services.
References:
1. AMR, C., & A, M. (2003). Emoc. Scidirect, 46-48.
2. Agarwal, K., Ritu, & Singh, A. (2020). , Obstetrical
outcome of pregnancy complicated with first trimester
bleeding and subchorionic hematoma. IJRCOG.
3. Antonio, F., & Oliveira, N. (2009). Factors associated
with maternal death in women admitted to an intensive
care unit with severe maternal morbidity. International
journal of gynecology.
4. Banke-Thomas, A., Maua, J., & Madaj, B. (2020).
Perspectives of stakeholders on emergency obstetric care
training in Kenya: a qualitative study. International
Health.
5. Bhatia, J., & Cleland, J. (1995). Determinants of
maternal care in a region of South India. Health
Transition.
6. Chaudhari AMR., M. A. (2003). Skilled attendance at
delivery in Bangladesh: an ethnographic study. . BARC.
7. Dakhode, S., & Gaidhane, A. (2020). Accessibility and
utilization of emergency obstetric care in rural settings of
Wardha district. Evolution Med. Dent. Sci.
8. Desari, P. (2015). Maternal mortality and its relationship
to emergency obstetric care (EmOC) in a tertiary care
hospital in South India. Obstetric Medicine.
9. Fadel, S., & Ram, U. (2015). Facility delivery, postnatal
care and neonatal deaths in India: nationally-
representative case-control studies. PloS one.
10. Grotegut, & Chisholm. (2014). Medical and obstetric
complications among pregnant women aged 45 and
older. PLoS One.
11. Gupta, R. (2003). Impact of Frequency and Timing of
Antenatal Care Visits on Neonatal mortality in EAG
states. IUSSP.
12. Gupta, R. T. (2017). Frequency and timing of antenatal
care visits and its impact on neonatal mortality in EAG
states of India. Journal of Neonatal Biology.
13. Horwood, & Opondo. (2020). Risk factors for maternal
mortality among 1.9 million women in nine empowered
action group states in India: secondary analysis of
Annual Health Survey data. BMJ.
14. Jain, R., & Upadhyay, C. (2019). A study on knowledge
and practices of antenatal care among pregnant.
International journal of reproduction.
15. Magadi, M., Madise, N., & Rodrigues, R. (2000).
Frequency and timing of antenatal care in Kenya:
explaining the variations between women of different
communities. Social science.
16. Mathole, T. L. (2004). health or their urban child in
Zimbabwe.
17. Mousumi, G. (2015). Pregnancy complications and birth
outcome: do health care services make a difference. Int
Res J Soc Sci.
18. Mousumi, G. (2015). Pregnancy complications and birth
outcome: do health care services make a difference. Int
Res J Soc Sci.
19. Mousumi, G. (2015). Pregnancy complications and birth
outcome: do health care services make a difference. soc
sci.
20. Murthy, B., Murthy, M., & Prabhu, P. (2013). Maternal
mortality in a tertiary care hospital: a 10-year review.
International journal of prevalence medicine.
21. Myer, L., & Harrison, A. (2003). Why do women seek
antenatal care late? Perspectives from rural South Africa.
Journal of midwifery.
22. Nisar, F., & White, F. (2003). Factors affecting
utilization of antenatal care among reproductive age
group women (15-49 years) in an urban squatter
settlement of Karachi. journal of Pakistan association.
23. Onoja-Alexander, M., & Idris, S. (2017). Onoja-
Alexander, M. O. A., Idris, S. H., Igboanusi, C. J. C.,
Onoja, A. D., Istifanus, A. J., & Olawepo, O. A. (2017).
Assessment of the availability and accessibility of
emergency obstetric care services in Murtala Mohammed
Specialist Hospital, Kano, Nig. JOURNAL OF
community and medicine.
24. Pierre, F., & Alexandre, D. (2008). ). Adolescent ecstasy
and other drug use in the National Survey of Parents and
Youth: The role of sensation-seeking, parental
monitoring, and peer's drug use. Addictive behaviors.
25. Rommohan, A. I. (2013). Reducing neonatal mortality in
India: critical role of access to emergency obstetric care.
PloS one.

26. Singh, S., Doyle, P., & Campbell, O. (2013). Referrals
between public sector health institutions for women with
obstetric high risk, complications, or emergencies in
India–A systematic review. PLoS One.
27. Singh, S., Doyle, P., & Campbell, O. (2016). Referrals
between Public Sector Health Institutions for Women
with Obstetric High Risk, Complications, or
Emergencies in India – A Systematic Review. PlosOne.